DEWFORA - HEPEX Project Report WP5 – D5.3 ii ... The Coordinated Regional Downscaling Experiment...
121
IMPROVED DROUGHT EARLY WARNING AND FORECASTING TO STRENGTHEN PREPAREDNESS AND ADAPTATION TO DROUGHTS IN AFRICA DEWFORA A 7 th Framework Programme Collaborative Research Project Coordinator: Deltares, The Netherlands Project website: www.dewfora.net FP7 Call ENV-2010-1.3.3.1 Contract no. 265454 Framework for drought warning and mitigation from national to local scale WP5 – D5.3 October 2013
Transcript of DEWFORA - HEPEX Project Report WP5 – D5.3 ii ... The Coordinated Regional Downscaling Experiment...

IMPROVED DROUGHT EARLY WARNING AND FORECASTING TO STRENGTHEN
PREPAREDNESS AND ADAPTATION TO DROUGHTS IN AFRICA
DEWFORA
A 7th Framework Programme Collaborative Research Project
Coordinator: Deltares, The Netherlands
Project website: www.dewfora.net
FP7 Call ENV-2010-1.3.3.1
Contract no. 265454
Framework for drought warning and mitigation from national to
local scale
WP5 – D5.3
October 2013

DEWFORA Project Report WP5 – D5.3
DOCUMENT INFORMATION
Title Framework for drought warning and mitigation from national to local scale
Lead Author Ana Iglesias, Washington Nyabeze
Contributors Luis Garrote
Distribution CO: Confidential, only for members of the consortium (including the Commission Services)
Reference WP5 – D5.3
DOCUMENT HISTORY
Date Revision Prepared by Organisation Approved by Notes
25/04/2013 Ana Iglesias, Luis Garrote
UPM
7/05/2013 Washington Nyabeze
WRNA
20/06/2013 Ana Iglesias UPM
10/10/2013 Washington Nyabeze
WRNA
21/10/2013 Washington Nyabeze
WRNA
ACKNOWLEDGEMENT
The research leading to these results has received funding from the European Union's Seventh Framework Programme (FP7/2007-2013) under grant agreement N°265454

DEWFORA Project Report WP5 – D5.3
i
SUMMARY
The main objective of this document to provide a guideline for a framework to downscale and
package drought forecasts and produce early warning information suitable for application in
defining implementable drought mitigation actions. The framework considers scientific
advances in monitoring and forecasting at global, national and local levels. It also includes
mechanisms to improve flow of this information to the local level from national to local scale
to meet user preferences and provide actionable tasks/responses.
The framework for drought forecasting, early warning and mitigation in Africa proposed here
will assist in establishing policy priorities based on scientific evidence that also strengthen
existing institutions. Overall, a science-based approach is a useful guideline, but it faces a
number of challenges some of which are explored in this document through evidence is
dawn from selected river basins in Africa as case studies namely; the Oum-er-Rbia River
Basin, (Morocco), Eastern Nile Basin (Burundi, Egypt, Ethiopia, Kenya, Rwanda, Sudan,
Tanzania and Uganda), Limpopo Basin (Botswana, Mozambique, South Africa and
Zimbabwe) and Niger Basin (Algeria, Benin, Burkina-Faso, Guinea, Ivory Coast, Mali, Niger
and Nigeria). Lessons are also drawn from Global systems, networks/ institutions (See
Annex A).
Drought Identification and monitoring:
The main diagnostic indicators being applied to detect if a drought threat or hazard exists in
Africa (Deliverable 2.1 (D2.1)) can be summarised as follows:
Standardised Precipitation Index (SPI), Palmer Drought Severity Index
(PDSI); deviation analysis, decile rainfall, surface water supply index
(SWSI); drought hazard and drought vulnerability assessment and
mapping, vegetation condition index (VCI), water satisfaction index
(WSI), Normalised Difference Vegetation Index (NDVI), drought
operating rules and storage forecast trajectories, flow deviation,
agricultural drought threshold, veld/forest production and insect
production.

DEWFORA Project Report WP5 – D5.3
ii
A growing number of datasets is becoming available which will is applied can improve the
performance of drought monitoring systems. WP4 identified the following data:
Drought Forecasting:
Seasonal forecasting provides a statistical summary of the weather events occurring in a
given time period. The principal aim of seasonal forecasting is to predict the range of values
which is most likely to occur during the next season. National meteorological
agencies/departments (MET) provide weather forecasts as well as seasonal climate
outlooks. Regional agencies also provide seasonal climate outlooks.
The ECMWF maintains two currently operational ensemble forecasting systems through its
Variable resolution Ensemble Prediction System (VarEPS): (i) weather forecasts out to 32
days and (ii) seasonal forecasting produces forecasts out to 7 months. The forecasts are
available at the ECMWF data finder in the GRIB format. The CSIR’s CCAM is configured to
generate a 28-year set of hindcasts as a result of forcing the CCAM with predicted, as
opposed to persisted, SST anomalies.The operational forecasts and verification statistics are
presented on the website of the South African Risk and Vulnerability Atlas
(http://rava.qsens.net/). CAMSOPI is a merged dataset produced by the NOAA Climate
Prediction Centre (CPC). Local knowledge drought forecasting (LKDF) systems apply local
knowledge to detect the onset of drought and the progression of the season.
a) Countries - Global Administrative Areas database version 2.0 (GADM,
http://www.gadm.org/) and the CIA World Data Bank II
(http://www.evl.uic.edu/pape/data/WDB/).
b) DEM produced from the Hydro1k Africa (USGS EROS Data Center 2006) and
up-scaled to the model resolution of 0.05˚
c) Catchment boundaries and rivers - HydroSHEDS data set
(http://hydrosheds.cr.usgs.gov/).
d) the European Centre for Medium/Range Weather Forecasts (ECMWF) ERA-
Interim (ERAI) reanalysis and long-range weather forecasts
e) the Council for Scientific and Industrial Research (CSIR) in South Africa
conformal-cubic atmospheric model (CCAM) seasonal forecasting system
f)

DEWFORA Project Report WP5 – D5.3
iii
Two hydrological models were tested on the Limpopo and Niger case study basins namely
PC Raster Global Water Balance Model (PCR-GLOBWB) and the Soil and Water Integrated
Model (SWIM).
For seasonal forecasts, forecasting precision decreases when the spatial focus is narrowed
from global, to regional, to national, to local levels. There are also challenges in simplifying,
downscaling and packaging information as warnings to address user preferences. For this
reason, while seasonal forecasting tools utilizing atmospheric science may provide more
useful information for regional droughts their applicability for at catchment scale, the main
unit for water management is limited because they are not accurate enough for the
requirements at this of scale. At catchment and local scales, local knowledge systems seem
to perform better however more studies are required on these systems to create confidence
in the scientific community.
Drought Early Warning:
Drought early systems based on local knowledge identified in D2.3 provide information on
on-set of drought with varied lead times and overall period of seasonal outlook. Evidence of
consistent issuing of climate based drought warnings and use of warnings is poor because of
lack of documentation and this has limited the scientific advancement especially for
knowledge systems. Stochastically generated forecast trajectories (flow and storage),
historical statistics (rainfall, flow and storage) and cyclical behaviour (rainfall and flow) for
drought early warning are the preferred options by water managers in Africa as they offer
improved confidence through learning from historical patterns. There is an appreciation that
future patterns may be different hence the need for new methods that incorporate climate
based seasonal forecasts (D2.3).
Drought Response:
Drought response consists on actions that are activated whenever a warning threshold is
overcome. Drought prevention concerns those measures aimed at preventing drought
causing damage. Drought preparedness concerns those measures which enable societies to
respond rapidly to drought. The most common drought response actions are food aid,
drought relief programs, growing of drought tolerate crops, saving livestock, improved water
use efficiency and installation of boreholes, wells and small dams (D2.2). Communities in
Africa are engaged in activities to be able to survive future droughts and climate change,
depending on duration and magnitude of deficit. This is being done through changes in
processes, practices, and structures to moderate potential impacts of future drought. The
most common actions being water harvesting, construction of water infrastructure,

DEWFORA Project Report WP5 – D5.3
iv
traditional/cultural practices and technologies, water conservation, crop monitoring and crop
diversification (D2.2).
Drought and Climate Change
The impact of climate change on frequency of occurrence and severity of droughts in Africa
was analyzed using a variable-resolution coupled global climate model (CGCM) model, the
conformal-cubic atmospheric model (CCAM). It was applied for both seasonal forecasting
and the projection of future climate change. The Coordinated Regional Downscaling
Experiment (CORDEX) ensemble of high-resolution projections of future climate change over
Africa, uses different regional climate models, downscaling the output of the CGCM
projections with simulations at about 50 km resolution. However the spatial resolution of
CGCMs is inadequate for studying regional impacts of future climate change. Statistical
downscaling requires long time-series of observed records of sufficient quality, for the
empirical relationships to be established a severe limitation for most of Africa. Reliability of
climate change projections can only be verified after several decades but successful
replication of hind-cast trends can also increase confidence in forecasts
Drought Monitoring
Monitoring systems in African countries are inadequate considering the variability of
precipitation and flow, sizes of catchments/aquifers and variability of geophysical conditions.
In addition, historical data is not readily available to users. There is a decline on the
meteorological stations due to high maintenance costs. Meteorological and hydrological data
networks are inadequate in terms of the density of stations for all major climate and water
supply parameters. Data quality is also problematic because of missing data or a short length
of record. Locally collected data is also useful for regional, continental and global forecasting
and early warning systems, but data sharing is inadequate between government agencies
and research institutions. High costs limits application of data in drought monitoring,
preparedness, mitigation and response. The current approach to financing data collection is
not appropriate. There is limited collaboration with agencies such as NASA, NOAA, USGS,
WMO,UN etc
Communication and application of drought warnings:
Effective communication and public participation will increase the quality and acceptance of
the DEWS, since this: (a) ensures acceptance of or trust in the science that feeds into the
planning; and (b) provides essential information and insights about drought preparedness,
since the relevant wisdom is not limited to scientific specialists and public officials.

DEWFORA Project Report WP5 – D5.3
v
Participatory methods, such as interactive approaches, or structured dialogues, are
recommended.
User requirements for drought warnings:
The main requirements for drought monitoring and forecasting systems in Africa can be
summarised as follows:
Seasonal forecasts which means forecasts with a lead time of 2 to 5 months
depending on length of season;
Reliable data for each system, level or resource, which should be preferably from a
single source;
Evidence of success rate of forecasts based on history to improve confidence of
users should be included in forecasts;
Predictions should be available at local scale (forecasts should zoom to areas which
users can relate to);
Users have experience with occurrence of rainfall, therefore the spatial scale for
predictions should consider variability of rainfall;
Easy to understand information (communicate risks of forecast clearly to enable
users incorporate this information into their own risk management frameworks);
Drought forecasts should include recommendations on how users should respond;
A tool that translates forecasts into information on the availability of water in rivers
and dams.
In Africa, the number of users of “state of the art” outputs is very small. The main challenges
for drought forecasting and early warning systems in Africa are as follows:
Early warning information where it exists is delivered on an occasion basis. End users
do not get information in suitable format at the time they need it. Systems for
disseminating or delivery or exchange of information in a timely manner are not well
developed or inexistent, limiting their usefulness for decision support;
Early warning information is often too technical, limiting its use by decision makers
and farmers. End users are not involved in product verification. There are no
customer’s/users networks to ensure product verification and service feedback;
Early warning information is often unreliable on the seasonal timescale and lacks
specificity, reducing their usefulness for agriculture and other sectors;
Drought impact assessment methodologies are not standardized or widely available,
which limits the formulation of regionally appropriate mitigation and response
programs;

DEWFORA Project Report WP5 – D5.3
vi
Drought indices are generally inadequate even for detecting the onset and end of
drought;
Integration of information into government structures is poor and focuses on
emergency response rather than long-term planning;
Users are not aware of the range of early warning products that they can use.
Lack of knowledge on how to manage the risks associated with the uncertainty of
forecasts.
The probability of a conditions/range of values is not easily understood at the
application level of the forecast information as well as the implications. This leads to
failure to interpret the information and convert it into actionable tasks/responses.
Early warning on food security to inform emergency food relief is important in Africa. Famine
early warning systems and networks across Africa are coordinated by FEWSNET. These
networks include regional, national and local vulnerability assessment committees.
FEWSNET publishes a monthly bulletin on food security. Remote sensing and ground
truthing techniques are applied in generating food security forecasts.
The potential of globally available drought forecasts and early warning data/information as
well as knowledge of mitigation and adaptation measures as “state of the art” remains largely
untapped.
Institutional Capacity
A clear institutional framework is important for assigning responsibilities for tasks to address
the issues raised in this document. The institutional framework includes policies and
guidelines that make it possible for people to intervene in an organised manner. An
institutional framework is required to undertake the following tasks:
a) Collect monitoring information from the local level and provide it to the forecasters at
national/global level;
b) To obtain and update user requirements;
c) To downscale and package forecast and early warning information to suit user
requirements;
d) To monitor performance of forecast and mitigation information, obtain user feedback,
and recommend updating of the information;
e) Facilitate the flow of information between the national and local level

DEWFORA Project Report WP5 – D5.3
vii
Institutions are trying to collaborate to combine skills available to improving the quality of the
product. Effort has been made on water resources assessment in Africa and as well as
hydrological modelling, data acquisition and compatibility for the use with various models.
In Africa the infrastructure for drought analysis is generally inadequate (equipment,
computers, software, etc.) although a few organisations such as the CSIR is South Africa are
better equipped the deployment of adequate human resources remains problematic. In
addition financial resources are very limited. The consequence is that forecasting and early
warning systems available in Africa are not adequately maintained and the products are not
available on time.
There is limited availability of skilled scientists, technicians and support staff to operate
drought early warning systems. So far, capacity building efforts have proven inadequate.
Capacity is required at all levels (researchers, meteorologists, technology transfer, farmers,
policy makers, communities, etc) for effective interpretation and usage of forecasting and
early warning products.
The limited involvement of scientist/specialists in Africa in designing and developing early
warning and forecasting systems means that local knowledge is not incorporated in “state of
the art”, which results in unreliable product downscaling to regional and local levels. There is
limited climate based monitoring, scientific analysis and research Funding for research
programmes especially on water resources assessment, hydrological modelling, water
accounting and data compatibility is inadequate.
There is a disconnection between available resources and responsibilities. “State of the art”
suggests that improved distribution of responsibilities as follows:
• Level 1: Institutions involved in monitoring but some also provide forecast information;
• Level 2: Institutions responsible for resources management, public services or Earth
observation;
• Level 3: Institutions that process data and provide information to the public.
Institutions that collate data and maintain databases also fall into this category;
• Level 4: Institutions that develop monitoring and forecasting methods and tools.
The existing institutional arrangements for drought mitigation in Africa offer following
opportunities:
The framework for mobilization of government agencies exists and substantial
resources can be brought together

DEWFORA Project Report WP5 – D5.3
viii
Institutional structures for implementation of drought mitigation and adaptation
interventions exist
The need for strategies to mitigate drought is generally appreciated and the need for
drought early warning systems is also appreciated
Communities are already engaged in activities to be able to survive future droughts
and climate change
A financial and legal framework is required to:
a) Manage uncertainties associated with forecast information when applied at the local
level
b) Mobilize finances to support implementation of mitigation measures
c) Manage the legal consequences of lack of action or transfer of risks
It includes mechanisms to raise and distribute funds or materials (or food) and the laws and
by-laws to enforce certain human behaviour in order to obtain the desired outcomes or
prevent undesirable ones.
Policy Actions
This scientific research has generated the following messages which should be taken up by
policy makers in the European context:
- Improvement/strengthening of the skill of forecasting products
- Transfer of knowledge from Europe to Africa and from Africa to Europe
- Support evolution of an institutional framework that allows for further improvement
and application of drought forecasting products, sharing of data, technology and
expertise
- More funding for research on certain emerging/promising topics for example
forecasting products
- Improvement of data networks
The following are the main targets:
- European Commission; DG RTD, DG ENV, DG DEVCO and DG CLIMA
- European parliament (eventually STOA)

DEWFORA Project Report WP5 – D5.3
ix
- UN; WMO in particular
The main messages from this research which needs to be taken up by policy makers in the
African context consider improvements on the following:
- Institutional networks
- Data networks
- Early warning and mitigation actions
- Cooperation within Africa
- Understanding and mapping of vulnerability/risks is indispensable to a better
preparedness
- Spatial resolution of early warning systems and updating intervals e.g. seasonal
climate outlooks and monthly updates
- Integration of scientific and local knowledge based drought forecasting and
monitoring systems
- Performance evaluation and institution capacitation at regional, national and local
levels
- Improvement of link between relief efforts and development programmes
- Participation of stakeholders and water users
- Effective transfer of information to policy-and decision-makers
- Training and public awareness campaigns especially in situations where the country
is approaching a drought season
The following are the main targets:
- At continental level the main targets are; AU, AMCOW, AMCEN
- At the regional level at the level of technical groups the main targets are; RBO’s,
Economic zones (SADC, ECOWAS, IGAD, etc), NELSAP (Nile Equatorial Lakes
Subsidiary Action Program)
- National level; government ministries, department and agencies
DEWFORA Project Report WP5 – D5.3
x
- NGOs
Priorities may be established based in on such concerns as feasibility, effectiveness, cost,
and equity. In choosing the appropriate actions, it might be helpful to ask some of the
following questions:
What are the cost/benefit ratios for the actions identified?
Which actions does the general public deem feasible and appropriate?
Which actions are sensitive to the local environment (i.e., sustainable practices)?
Are your actions addressing the right combination of causes to adequately reduce the
relevant impact?
Are your actions addressing short-term and long-term solutions?
Which actions would fairly represent the needs of affected individuals and groups?
A tool to rapidly assess the cost and benefits of mitigation actions should be implemented to
help give effect to the vulnerability assessments.
The following aspects may be considered on the implementation process:
Assess the availability of skilled human resources needed for drought preparedness
planning
Educate policy makers and the public on the need for improved drought
preparedness as an integral part of water resources management
Support creation of regional drought preparedness networks to enhance regional
capacity in sharing lessons learned
Enhance regional and international collaboration
Recognize the role of WMO, ISDR, NMHSs, and regional/national institutions in
drought early warning and preparedness

DEWFORA Project Report WP5 – D5.3
xi
TABLE OF CONTENTS
1 INTRODUCTION ...................................................................................................................... 1
1.1 OBJECTIVE ................................................................................................................... 2
2 IMPORTANT DEFINITIONS .................................................................................................... 3
3 AN EVIDENCE-BASED FRAMEWORK FOR DROUGHT EARLY WARNING SYSTEMS ... 4
4 WHAT IS THE SCIENCE AVAILABLE? ................................................................................. 6
4.1 DROUGHT IDENTIFICATION AND MONITORING ...................................................... 7
4.1.1 Example 1 – Oum er Rbia basin .......................................................... 8
4.1.2 Example 2 – Limpopo River basin ....................................................... 9
4.1.3 Example 3 – Eastern Nile River basin ................................................ 11
4.1.4 Further evidence from DEWFORA ..................................................... 12
4.1.5 Availability of data .............................................................................. 12
4.1.6 Information and knowledge management systems ............................ 16
4.1.7 Where are the gaps? .......................................................................... 17
4.2 DROUGHT FORECASTING ........................................................................................ 17
4.2.1 Example 1 – Limpopo River basin ..................................................... 17
4.2.2 Meteorological forecasting ................................................................. 18
4.2.3 Performance of forecasts on the Oum-er-rbia, Blue Nile, Upper Niger,
Congo and Limpopo River Basins ...................................................... 20
4.3 DROUGHT EARLY WARNING .................................................................................... 27
4.3.1 Example 1 – Oum er Rbia basin ........................................................ 27
4.3.2 Example 2 – Niger River basin ........................................................... 30
4.3.3 Example 3 – Limpopo River basin ..................................................... 30
4.3.4 Example 4 – Eastern Nile River basin ................................................ 30
4.3.5 Drought early warning framework ...................................................... 31
4.3.6 Packaging of forecasts for use as early warning information............. 34
4.4 DROUGHT RESPONSE .............................................................................................. 35
4.4.1 Formulation of actions ........................................................................ 36
4.4.2 Prioritisation of actions ....................................................................... 36
4.4.3 Drought Response ............................................................................. 38
5 WHAT ARE THE SOCIETAL CAPACITIES AND CHALLENGES? .................................... 39
5.1 CURRENT SOCIETAL CAPACITIES .......................................................................... 42
5.1.1 Data and forecasting systems ............................................................ 42
5.1.2 Institutional analysis ........................................................................... 45

DEWFORA Project Report WP5 – D5.3
xii
5.2 FINANCIAL AND LEGAL CAPACITIES ...................................................................... 48
5.3 INSTITUTIONAL CAPACITIES .................................................................................... 49
5.4 WHERE ARE IMPROVEMENTS REQUIRED? ........................................................... 49
6 HOW CAN SCIENCE BE TRANSLATED INTO POLICY? ................................................... 53
6.1 POLICY BRIEFS IN THE EUROPEAN CONTEXT ..................................................... 54
6.2 POLICY BRIEFS IN THE AFRICAN CONTEXT .......................................................... 55
7 HOW CAN SOCIETY BENEFIT FROM IMPROVED FORECASTS? ................................... 56
7.1 PRIORITISING POTENTIAL ACTIONS ...................................................................... 56
7.2 PROCESS TO IMPLEMENT THE ACTIONS .............................................................. 58
7.3 COMMUNICATION ...................................................................................................... 58
7.4 REVIEW PROCESS .................................................................................................... 58
8 CONCLUSIONS ..................................................................................................................... 58
ANNEX A............................................................................................................................................ 1
1 EVIDENCE FROM CASE STUDIES ........................................................................................ 1
1.1 INTRODUCTION............................................................................................................ 2
2 CURRENT DROUGHT MONITORING AND FORECASTING CAPACITIES (WP2).............. 2
2.1 DROUGHT MONITORING AND FORECASTING SYSTEMS IN AFRICA ................... 2
2.2 INSTITUTIONAL FRAMEWORKS ................................................................................. 4
2.3 EXPERIENCES IN EARLY WARNING ......................................................................... 4
2.4 GAPS IN THE MONITORING AND FORECASTING SYSTEMS .................................. 5
2.5 GAPS IN THE INSTITUTIONAL STRUCTURE ............................................................. 6
3 DROUGHT VULNERABILITY (WP3) ...................................................................................... 7
3.1 CONCEPTUAL FRAMEWORK ...................................................................................... 7
3.2 MAPPING VULNERABILITY ......................................................................................... 8
3.2.1 Drought vulnerability index ................................................................... 9
3.3 DOWN SCALLING GLOBAL MODELS ....................................................................... 10
3.3.1 Current achievements include: ........................................................... 10
3.3.2 The investigation in progress include: ................................................ 12
4 FORECASTING (WP4) .......................................................................................................... 12
4.1 METEOROLOGICAL DROUGHT ................................................................................ 12
4.2 SKILL OF THE FORECASTING SYSTEM .................................................................. 15
4.3 POTENTIAL IMPROVEMENTS TO EARLY WARNING SYSTEMS ........................... 17
DEWFORA Project Report WP5 – D5.3
xiii
4.4 HYDROLOGICAL MODELS AVAILABLE .................................................................... 21
4.5 STATISTICAL ANALYSIS OF NATURAL CLIMATIC VARIABILITY AND
HYDROLOGICAL PARAMETERS............................................................................... 26
4.5.1 Data sources ...................................................................................... 26
4.5.2 Validation of SPEI with NDVI ............................................................. 26
4.5.3 Variability of spatial drought patterns ................................................. 27
4.5.4 SPI analysis ........................................................................................ 28
4.5.5 Standardized runoff index time series. ............................................... 28
4.5.6 Wavelet coherency analysis. .............................................................. 28
4.5.7 Conclusions ........................................................................................ 29
4.6 DOWNSCALED AND TAILOR MADE HYDROLOGICAL MODELS FOR THE LIMPOPO
AND NIGER CASE STUDY BASINS ........................................................................... 30
4.6.1 Limpopo River Basin data sources .................................................... 30
4.6.2 Limpopo River Basin Methodology .................................................... 31
4.6.3 Limpopo River Basin Results ............................................................. 32
4.6.4 Niger River Basin Data ....................................................................... 32
4.6.5 Niger River Basin Methodology .......................................................... 33
4.6.6 Niger River Basin Results .................................................................. 34
4.7 LOCAL SCALE AGRICULTURAL MODELS ............................................................... 34
4.7.1 Limpopo Basin Data ........................................................................... 34
4.7.2 Oum-er-Rbia Basin data..................................................................... 34
4.7.3 Limpopo Results ................................................................................. 36
4.7.4 Oum-er-Rbia Results .......................................................................... 36
4.7.5 Overall ................................................................................................ 37
5 IMPLEMENTATION OF IMPROVED METHODOLOGIES IN THE CASE STUDIES (WP6) 37
5.1 THE CASE STUDY CONTEXT .................................................................................... 37
5.1.1 Nile River Basin .................................................................................. 37
5.1.2 Limpopo River Basin .......................................................................... 37
5.1.3 Oum Er Rbia River Basin, .................................................................. 38
5.2 THE PAN-AFRICAN MAP SERVER ............................................................................ 39
6 CONCLUSIONS ..................................................................................................................... 39

DEWFORA Project Report WP5 – D5.3
xiv
LIST OF FIGURES
Figure 1-1 Contribution of WP2, 3, 4 and 6 to the framework for and guidelines for effective drought
early warning and response in Africa ......................................................................................... 1
Figure 3-1: Critical questions to guide the development of an evidence-based framework for drought
early warning systems ................................................................................................................ 4
Figure 4-2: Location of case study basins-......................................................................................... 5
Figure 4-1 An illustration of the forecasting decision chain. ............................................................... 6
Figure 4-3: Forecast versus observed rainfall January to March 1998 ............................................ 17
Figure 4-4 An illustration of activation of drought warning thresholds. ............................................ 32
Figure 4-5: Potential actions that may be included in a DEWS........................................................ 35
Figure 5-1: Comparative analysis of monitoring and early warning systems – Framework diagram.42
Figure 6-1 Example for definitions of thresholds to trigger drought alert ......................................... 53
Figure 6-2 Example of probability distribution functions of crop damage during drought ................ 54
Figure 7-1 Potential actions that may be included in a DEWS......................................................... 57
Figure 1-1 Contribution of WP2, 3, 4 and 6 to the framework for and guidelines for effective drought
early warning and response in Africa ......................................................................................... 2

DEWFORA Project Report WP5 – D5.3
xv
LIST OF TABLES
Table 1 Main drought monitoring and forecasting systems in Africa ............................................... 43
Table 2 Summary of the major issues identified in the analysis of institutional arrangements ........ 48

DEWFORA Project Report WP5 – D5.3
xvi
LIST OF ABBREVIATIONS
AGRHYMET Regional Training Centre for Agro-meteorology and Operational
Hydrology
CAMELIS Capacity Added by Mending Early and Livelihoods Information
Systems
CARE Cooperative for Assistance and Relief Everywhere
CFMSAMS Crop and Food Supply Assessment Missions
CFSAMs Crop and Food Supply Assessment Missions
CFU Commercial Farmers Union
CGMS Crop Growth Monitoring System
CICs Community Information Centres
CILSS Inter-State Committee for the Fight against Drought in the Sahel
CRTS The Royal Center of Remote Sensing
DESA Drought Emergency in Southern Africa
DESA Drought Emergency in Southern Africa
DGH General directorate of Hydraulics
DHA Department of Humanitarian Affairs
DMC Drought Monitoring Centre
DMN National Directorate of Meteorology
DPA Regional Directorates of Agriculture
DPPA Disaster Prevention and Preparedness Agency
EAC East African Community
EMOP Emergency Operation
ENSO El Niño – Southern Oscillation
EWRD Early Warning and Response Directorate
EWWG Early Warning Working Group
FAO Food and Agricultural Organisation
FAO United Nations, Food and Agricultural Organization
FEWSNET Famine Early Warning Systems Network
FSAU Food Security Analysis Unit
GIEWS Global Information and Early Warning System on Food and
Agriculture
GOR Government of Rwanda
GTZ German Agency for Technical Cooperation
HEA Household Economy Approach
IFSHPC Integrated Food Security and Humanitarian Phase Classification

DEWFORA Project Report WP5 – D5.3
xvii
IGEBU Geographic Institute of Burundi
ILRI International Livestock Research Institute
KWAMP Kirehe Community-based Watershed Management Project
LEWS Livestock Early Warning System
LIU Livelihoods Integration Unit
LPCI Livelihood Protection Cost Index
MAMF Ministry of Agriculture and Maritime Fisheries
MINAGRI Ministry of Agriculture
MINATTE Ministère de l' Amenagement du Territoire, du Tourisme et de
l'Environnement
MINITRANSCO Ministrere des Transports et des Communications
MOH Ministry of Health
NBCBN Nile Basin Capacity Building Network
NC EW National Committee for Early Warning
NCHS National Center for Health Statistics
NEWU National Early Warning Unit
NGOs Non-Governmental Organizations
NISR National Institute of Statistics of Rwanda
NMHS National Meteorological and Hydrological Service
NUR National University of Rwanda
OMS World Health Organization
PAPSTA
Support Project to the Strategic Plan for the Agriculture
Transformation
PARIMA Pastoralist Risk Management Project
PLI Pastoralist Livelihoods Initiatives
PRESAO Seasonal rainfall forecasting in West Africa
RAB Rwanda Agriculture Board
REMA Rwanda Environmental Management Authority
REWU Regional Early warning Unit
RMS Rwanda Meteorological Service
RNRA Rwanda Natural Resources Authority
ROA Regional Offices of Agriculture
RRC Relief and Rehabilitation Commission
RRSP Regional Remote Sensing Project
SADC Southern Africa Development Community
SADC Southern Africa development community
SAP Early Warning System

DEWFORA Project Report WP5 – D5.3
xviii
SARCOF Southern Africa Regional Climate Outlook Forum
SAWS South Africa Weather Services
SC-UK Save the Children– United Kingdom
SPI Standard Precipitation Indices
SPIAC Prediction System of Information and Early Warning on floods in
the Inner Niger
SPSS Statistical Package for Social Sciences
SSD Secretariat for the Drought Disaster
UN United Nation
UNDP United Nations, Development Programme
USAID United States agency for International Development
USAID United States of Agency International Development
VAC Vulnerability Assessment Committees
VAM Vulnerability Analysis Mapping
WB World Bank

DEWFORA Project Report WP5 – D5.3
1
1 INTRODUCTION
This document fulfils the final aim of DEWFORA which is to put forward a framework for
improving drought early warning, with more effective drought mitigation measures that
strengthens preparedness, increasing resilience, and enhancing adaptation to drought in
Africa through consolidating the findings from the different work packages (WPs) carried out
on study. The linkages between these WPs are illustrated in Figure1.
Figure 1-1 Contribution of WP2, 3, 4 and 6 to the framework for and guidelines for effective
drought early warning and response in Africa
In Deliverable 5.1 (D5.1) the basic framework for improved drought warning and mitigation in
Africa was established, outlining the main elements to be considered to get to a situation with
improved drought warning and mitigation. This is followed by D5.2 which provides
organizational charts to describe the institutional responsibilities, and communication lines for
drought responses from national to local levels, derived from case study experiences. D5.3 is
a guideline report, presenting the consolidated framework for drought forecasting, warning
and mitigation from national to local scale. It includes the forecasting and the institutional
frameworks. D5.4 will present recommendations for enhancing drought preparedness at the
local, national and trans-boundary basin scales and coping with drought under a changing
climate.
This document makes up deliverable D5.3. It provides a framework for drought warning and
mitigation from national to local scale. This framework can be used as a guideline to supports
drought early warning and more effective response in Africa by taking advantage of

DEWFORA Project Report WP5 – D5.3
2
advances in science and lessons from other parts of the world on technical and social
organization. It is meant to support existing drought monitoring and warning institutions and
agencies in the operation of drought early warning systems (DEWS).
1.1 OBJECTIVE
The main objective of this document to provide a guideline for a framework to downscale and
package drought forecasts and produce early warning information suitable for application in
defining implementable drought mitigation actions. The framework considers scientific
advances in monitoring and forecasting at global, national and local levels. It also includes
mechanism(s) to improve flow of this information to the local level from national to local scale
to meet user preferences and provide actionable tasks/responses at the local level.

DEWFORA Project Report WP5 – D5.3
3
2 IMPORTANT DEFINITIONS
The following definitions apply to this document:
Drought – a condition that originates from a deficiency of precipitation over an
extended period of time, resulting in a water shortage for some activity, group, or
environmental sector
Meteorological drought – occurs when annual precipitation is between 70% and
85% of the long-term annual mean precipitation.
Hydrological drought - a deficit in runoff in rivers, surface reservoirs and ground
water
Agricultural drought - a situation of inadequate soil moisture for rain-fed crops
Socio-economical - a drought which results in social stress and economic hardships
Drought mitigation – the reduction in the classification of a drought in terms of
frequency and magnitude of risks and resulting from reduction of the potential impact
of a drought
Drought adaptation – a process of being able to survive in a drought condition. It
refers to changes in processes, practices, and structures to moderate potential
impacts of future drought.
Desertification - a process of land degradation in arid, semi-arid and dry sub-humid
areas, resulting from various factors, including climatic variation and human activities.
Land degradation manifests itself through soil erosion, water scarcity, reduced
agricultural productivity, loss of vegetation cover and biodiversity, drought and
poverty.

DEWFORA Project Report WP5 – D5.3
4
3 AN EVIDENCE-BASED FRAMEWORK FOR DROUGHT EARLY WARNING
SYSTEMS
Early warning systems can make a substantial contribution to overall drought damage
reduction objectives by enabling institutions and vulnerable groups to take timely action to
mitigate loss and damage in advance of an impending hazard event. Existing early warning
systems have limitations in the science and institutional, social and legal aspects which affect
their application (D2.4, D2.5). An evidence based framework can be used to identify these
limitations and formulate possible solutions as policies, procedures and guidelines. The
following critical questions were applied in this document to extract evidence from WP2, WP3
and WP4 as input to defining the framework for early warning systems:
These four critical questions are illustrated in Figure 3-1.
What is the
science
available?
What are the
societal
capacities?
How can science
be translated into
policy?
How can society
benefit from the
forecast?
Figure 3-1: Critical questions to guide the development of an evidence-based framework for
drought early warning systems
What is the science available? Evaluating the detection of the signs of impending
drought. Definition of risk levels and analysing the signs of drought in an
integrated vulnerability approach
What are the societal capacities? Evaluating the institutional framework that
enables policy development.
How can science be translated into policy? Linking science indicators into the
actions/interventions that society needs to implement. Evaluation of policy
implementation and giving effect to early warning
How can society benefit from the forecast? Evaluating the provision of
information to potentially affected groups.
DEWFORA Project Report WP5 – D5.3
5
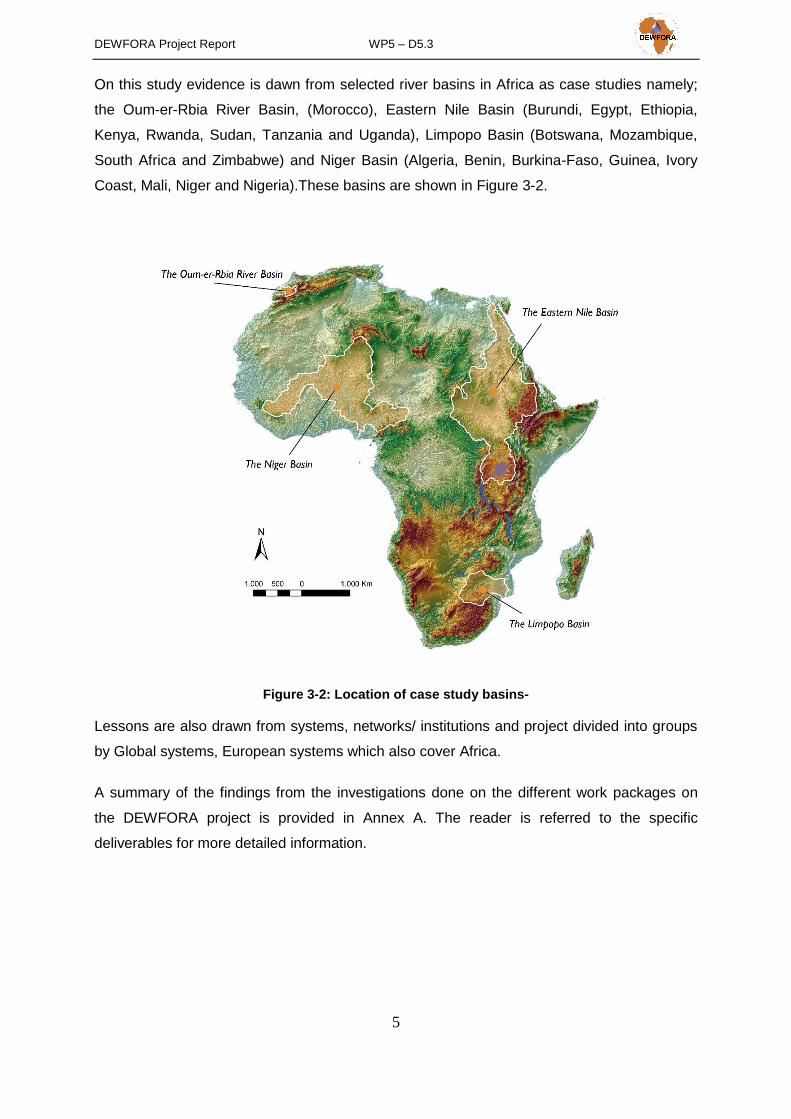
On this study evidence is dawn from selected river basins in Africa as case studies namely;
the Oum-er-Rbia River Basin, (Morocco), Eastern Nile Basin (Burundi, Egypt, Ethiopia,
Kenya, Rwanda, Sudan, Tanzania and Uganda), Limpopo Basin (Botswana, Mozambique,
South Africa and Zimbabwe) and Niger Basin (Algeria, Benin, Burkina-Faso, Guinea, Ivory
Coast, Mali, Niger and Nigeria).These basins are shown in Figure 3-2.
Figure 3-2: Location of case study basins-
Lessons are also drawn from systems, networks/ institutions and project divided into groups
by Global systems, European systems which also cover Africa.
A summary of the findings from the investigations done on the different work packages on
the DEWFORA project is provided in Annex A. The reader is referred to the specific
deliverables for more detailed information.

DEWFORA Project Report WP5 – D5.3
6
4 WHAT IS THE SCIENCE AVAILABLE?
The analysis considers the well-established scientific processes for DEWS namely (i)
identification and monitoring (ii) forecasting, (iii) warning and (iv) response (see Figure 2).
The DEWS detects and evaluates the signs of impending drought, its magnitude, timing and
duration and assigns risk levels. A drought early warning system should include measures to
improve the societal response and thus reduce drought damage. For a locality or system “P”
affected by drought, if unattended, a drought hazard can result in damage (drought damage).
However the relationship between drought hazard and is potential drought damage can be
changed by acting on the societal response. In order for these response actions to be
effective they should consider the scientific information on the drought hazard coming from
the DEWS processes.
Figure 4-1 An illustration of the forecasting decision chain.
To improve the response process it is important to have means of measuring the drought
hazard, potential and actual damage. It follows from the definition of drought in Chapter 2 of
this document that the danger or threat of a drought (drought hazard) originates from a
deficiency of precipitation over an extended period of time, resulting in a water shortage for
some activity, group, or environmental sector. Taking from D3.1, nature-based determinants
namely meteorological, hydrological and agro-ecosystems can be used as drought hazard
indicators. Drought identification and monitoring requires diagnostic indicators while drought

DEWFORA Project Report WP5 – D5.3
7
early warning requires predictive indicators. The later may include information relative to the
recent past.
On potential and actual drought damage more emphasis is placed on a system’s capability to
reduce the potential drought damage. This is referred to as vulnerability. It includes the set
of parameters that describe the characteristics of a system to modify potential damage. It is a
function of susceptibility and coping capacity and captures the societal response.
Vulnerability assessment seeks to identify characteristics of the systems that modify the level
of risk derived from inadequate structures, management, and technology, or by economic,
environmental, and social factors. The inadequacies are addressed through response
actions.
In the following sections the scientific processes for DEWS namely (i) identification and
monitoring (ii) forecasting, (iii) warning and (iv) response are subjected to the four critical
questions listed in Chapter 3 of this document, to extract evidence from WP2, WP3 and WP4
as input to defining the framework for early warning systems. We also pay special attention
of scientific results obtained within the DEWFORA project.
4.1 DROUGHT IDENTIFICATION AND MONITORING
The identification and monitoring of drought monitoring using drought diagnostic parameters
is a fundamental component of any DEWS. Diagnostic indicators already being applied to
detect if a drought threat or hazard exists in Africa are described in Deliverable 2.1 (D2.1).
The main ones can be summarised as follows:
Of these parameters D2.1 also shows that SPI is a more common indicator.
Time series of a drought index data are decomposed into frequency components and the
wave-like oscillations are analysed to understand the temporal variability of drought. This is
referred to as wavelet analysis. The aggregation periods of 3, 6 and 12 months can be
applied to detect drought as follows:
Standardised Precipitation Index (SPI), Palmer Drought Severity Index (PDSI);
deviation analysis, decile rainfall, surface water supply index (SWSI); drought hazard
and drought vulnerability assessment and mapping, vegetation condition index (VCI),
water satisfaction index (WSI), Normalised Difference Vegetation Index (NDVI), drought
operating rules and storage forecast trajectories, flow deviation, agricultural drought
threshold, veld/forest production and insect production

DEWFORA Project Report WP5 – D5.3
8
NDVI is affected by many ecological factors and water availability. NDVI response is
expected when the water deficit reaches a certain minimum threshold, depending on
vegetation type, time of the season etc. Analysing the relation of vegetation status and water
deficit locally can improve drought warning systems by providing information on how drought
indexes can be interpreted locally.
4.1.1 Example 1 – Oum er Rbia basin
(a) 6 month SPI
The following diagram shows the meteorological drought in Tadla region (Oum er Rbia basin)
characterized using the 6month SPI (SPI-6) over the period 1934-2003 (ref D2.2).
3-month SPI is associated with short- and medium-term moisture conditions
associated with seasonal estimations of precipitation. However, a relatively
normal 3-month period (or even wet) can occur during a long drought spell.
6-month SPI is associated with medium-term precipitation anomalies and is
usually associated with anomalous stream flows and reservoir levels.
12-month SPI reflects long-term precipitation patterns that are associated with
changes to large reservoirs and groundwater.
Reference: Deliverable 4.6
• •

DEWFORA Project Report WP5 – D5.3
9
These data show that the most severe drought episodes for the Tadla region (Oum Er Rbia
basin) over the last seventy years are the 1940-45, 1957-1958, 1980-85,1992-93, 1994-95
and 1998-2002 periods (Ouassou et al. 2007).
4.1.2 Example 2 – Limpopo River basin
(b) Standard Precipitation Index
(c) Standardized Precipitation Evapotranspiration Index (SPEI)
o 13 SPEI principal components (PCs) explained 91 % of the total variation. The
first 6 PCs sum up to 78 % of total variance. PC 1 shows a drought pattern with
a strong south-western gradient. PC 2 shows an orthogonal north-western
gradient but also has negative values along the coastline in the East. PC1 and
PC2 account for 53 % of the total variation. PCs 3 to 5 contribute 8 %, 7% and 5
% to the total explained variation and exhibit more complex patterns. All three
show patterns that divide the region in three. PC 5 had the highest correlation
with all the climate anomaly indexes
Reference: Deliverable 4.6
o
o With higher aggregation order, the SPI time series show less power (on the
wavelet power spectrum) in shorter periods. For example,
o SPI1 time series has events within 4 to 16 months periodicity, but some of
these were not present in the 18 month aggregation SPI.
o SPI1 and SPI18 have power in the higher period range of 32 to 64 months but
longer periodicity is visible in the SPI18, but not in the SPI1.
o Wavelet coherence analysis shows that SPI3 shares signal properties with
ENSO of periods between 2 and 4 years but these frequency coherencies are
out of phase for the two time series. The power of frequency coherencies is
not stable and changes over time and from one event to another. For 1987,
ENSO and SPI3 time series show coherence power over a period range from
0.5 to 4 years. The 1992 drought shows a special wavelet coherence pattern
with a distinct band of 4 years
Reference: Deliverable 4.6
o

DEWFORA Project Report WP5 – D5.3
10
(d) Standardised Runoff Index (SRI)
The following is a summary of the results obtained on the Limpopo River Basin. Calculations
of Standardized Runoff Index (SRI) were done using observed runoff data.
These results support the following conclusions
The dominating spatial patterns cannot be linked to specific climate anomalies. Every
drought event very likely is a unique combination of many factors of influence.
Promising regions of SST were identified, which are potential predictors, as they
exhibit lead times for the Limpopo region precipitation.
Frequencies present in the signals had only little consistency in time and space. The
period 1985 to 1995 is marked by strong changes in precipitation total and signal
properties.
o There was strong decrease in runoff in the Crocodile River between 1985
and 1995 and there was also a change in frequency of SRI with high power
in the 16 to 32 month band.
o Low power was observed during the 80s and early 90s except for
Mogalakwena River which retained power in the 32 month band. This could
be connected to a change in the atmospheric systems’ dynamic.
o During the 1985 to 1995 period the coherence or SRI with the Oceanic Nino
Index (ONI) is broken for the Pienaars and Crocodile Rivers. Several events
on the Pienaars River in the late 70 and late 90 show coherence with ONI in
shorter periods of 4 years. The Crocodile River shows the same property in
the late 90s with coherence power over a wide range of periods. The
Mogalakwena River shows power on a longer period and high power in late
90s and it also has coherence power in lower periods during the early 80s
o Consistent bands of frequency coherence with ONI were often interrupted
during the period 1985 to 1995.
o SRI for the Chokwe station exhibits high power in the 70s for periods
between 2 and 5 years but in the period between 1985 and 1995 the
coherence band is changed and narrowed.
Reference: Deliverable 4.6

DEWFORA Project Report WP5 – D5.3
11
Some flow stations seemed to be disconnected of the ENSO during this period and
signal properties strongly differed between runoff stations, which indicates that every
sub-catchment has local factors that affect rainfall anomaly and some regions can be
affected more by an anomaly and others less.
Prediction models have to able to deal with nonlinear and interacting relationships
with climate anomalies. Neither could certain anomalies be associated with spatial
patterns nor could certain anomalies be isolated. It is very likely that every drought
event is caused by a unique combination of different atmospheric anomalies
Correlation and wavelet analysis were important methods but correlations between
variables do not imply a causal link. Rather, causally linked variables are likely to be
correlated. Hence, correlation can only serve as an indication of a potential causal
and above all linear link. The same is valid for wavelet coherence analysis. Wavelet
coherence does not imply a causally linked relationship, nor single event wise
coherences, they only highlight signal similarities in frequency space. This can only
be taken as an indicator for relationships between variables.
Methods applied such as Wavelet analysis algorithms require complete records and
cannot deal with missing data.
4.1.3 Example 3 – Eastern Nile River basin
The following rainfall anomalies for the period 1971 until 2008 were calculated for Kigali
synoptic station, Rwanda:
Source: Rwanda Meteorological Service

DEWFORA Project Report WP5 – D5.3
12
4.1.4 Further evidence from DEWFORA
What are the most useful diagnostic indicators for drought hazard? There is no simple
answer as indicators are sector/system/location specific. Indicators should useful for
application in defining actions to reduce vulnerability. For example, comparison of rainfall
deficits for different areas to compare exposure to drought can be misleading as seen in
Southern Africa where regions have very different climatology and ecology. SPI and the
SPEI are better drought indicators for these conditions but how well do they represent the
drought impact on vegetation? For them to be useful indicators should be calibrated with
observed impacts, risk level, and targets related to the most appropriate actions. The use of
multiple indicators is encouraged to count for spatial and temporal variability and loss of
sensitivity or power.
An evaluation of drought indices in Africa performed in Deliverable 4.6 obtained the following
conclusions:
4.1.5 Availability of data
The availability of diagnostic data is one of the major challenges for drought forecasting in
Africa. The timely diagnosis of a drought requires near-real time monitoring tools and these
have to be carefully selected depending on region. Relevant hydro-meteorological
parameters monitored include rainfall, temperature, flow, storage and evaporation.
Most of the severe droughts in Southern Africa are associated with El Nino
(Rouault, 2005).
There are strong differences of the correlation of SPEI3 and NDVI throughout
the Limpopo basin. High correlations are found in south eastern transect
whereas the correlation in the north east and in the southwest are lower. Low
correlations can be caused by intense irrigation within a grid cell, and/or
vegetation types.
In the Limpopo River Basin, below a value of SPEI <-1 vegetation is affected by
drought and this can be used as drought threshold in drought early warning.
However further research is required to develop a framework which
incorporates such relationships to identify potential thresholds

DEWFORA Project Report WP5 – D5.3
13
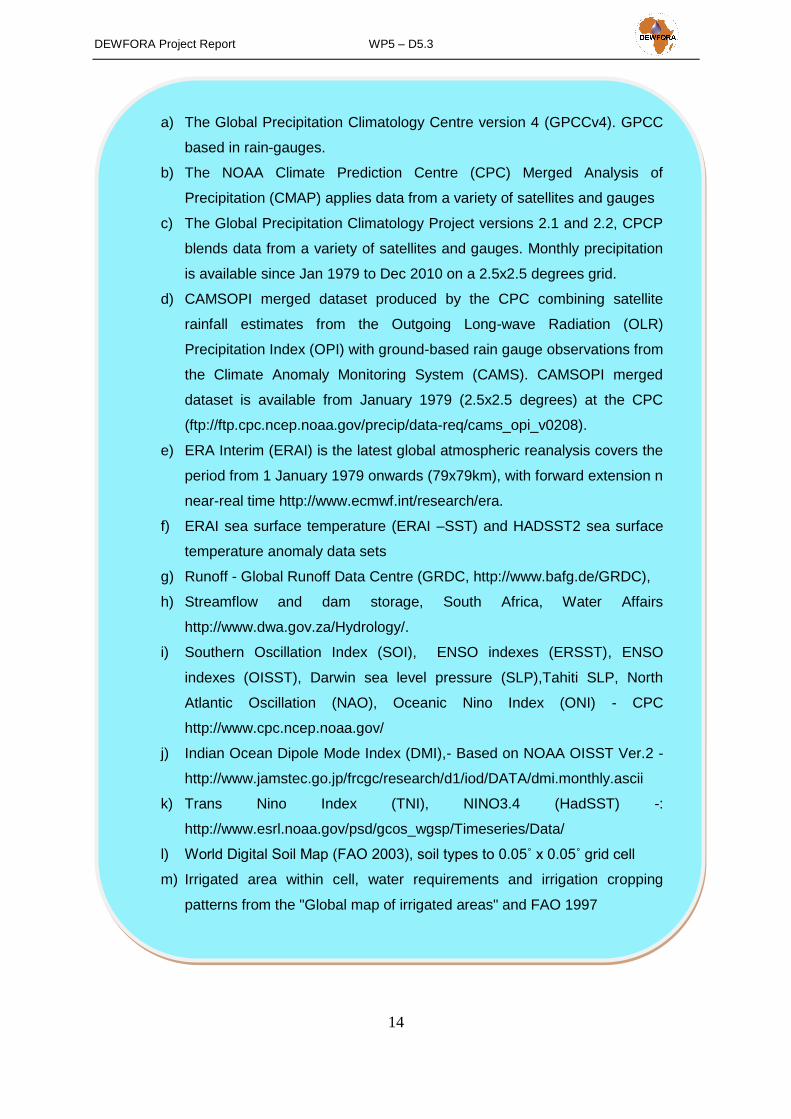
In the recent years, a growing number of datasets is becoming available to improve the
performance of drought monitoring systems. WP4 identified the following data on
administrative areas and catchment boundaries and rivers:
The following datasets have been identified in WP4 for drought monitoring and estimation of
drought indicators:
g) Countries - Global Administrative Areas database version 2.0 (GADM,
http://www.gadm.org/) and the CIA World Data Bank II
(http://www.evl.uic.edu/pape/data/WDB/).
h) DEM produced from the Hydro1k Africa (USGS EROS Data Center 2006) and
up-scaled to the model resolution of 0.05˚
i) Catchment boundaries and rivers - HydroSHEDS data set
(http://hydrosheds.cr.usgs.gov/).
DEWFORA Project Report WP5 – D5.3
14
a) The Global Precipitation Climatology Centre version 4 (GPCCv4). GPCC
based in rain-gauges.
b) The NOAA Climate Prediction Centre (CPC) Merged Analysis of
Precipitation (CMAP) applies data from a variety of satellites and gauges
c) The Global Precipitation Climatology Project versions 2.1 and 2.2, CPCP
blends data from a variety of satellites and gauges. Monthly precipitation
is available since Jan 1979 to Dec 2010 on a 2.5x2.5 degrees grid.
d) CAMSOPI merged dataset produced by the CPC combining satellite
rainfall estimates from the Outgoing Long-wave Radiation (OLR)
Precipitation Index (OPI) with ground-based rain gauge observations from
the Climate Anomaly Monitoring System (CAMS). CAMSOPI merged
dataset is available from January 1979 (2.5x2.5 degrees) at the CPC
(ftp://ftp.cpc.ncep.noaa.gov/precip/data-req/cams_opi_v0208).
e) ERA Interim (ERAI) is the latest global atmospheric reanalysis covers the
period from 1 January 1979 onwards (79x79km), with forward extension n
near-real time http://www.ecmwf.int/research/era.
f) ERAI sea surface temperature (ERAI –SST) and HADSST2 sea surface
temperature anomaly data sets
g) Runoff - Global Runoff Data Centre (GRDC, http://www.bafg.de/GRDC),
h) Streamflow and dam storage, South Africa, Water Affairs
http://www.dwa.gov.za/Hydrology/.
i) Southern Oscillation Index (SOI), ENSO indexes (ERSST), ENSO
indexes (OISST), Darwin sea level pressure (SLP),Tahiti SLP, North
Atlantic Oscillation (NAO), Oceanic Nino Index (ONI) - CPC
http://www.cpc.ncep.noaa.gov/
j) Indian Ocean Dipole Mode Index (DMI),- Based on NOAA OISST Ver.2 -
http://www.jamstec.go.jp/frcgc/research/d1/iod/DATA/dmi.monthly.ascii
k) Trans Nino Index (TNI), NINO3.4 (HadSST) -:
http://www.esrl.noaa.gov/psd/gcos_wgsp/Timeseries/Data/
l) World Digital Soil Map (FAO 2003), soil types to 0.05˚ x 0.05˚ grid cell
m) Irrigated area within cell, water requirements and irrigation cropping
patterns from the "Global map of irrigated areas" and FAO 1997

DEWFORA Project Report WP5 – D5.3
15
The meteorological data used in DEWFORA project includes: (i) the European Centre for
Medium/Range Weather Forecasts (ECMWF) ERA-Interim (ERAI) reanalysis and long-range
weather forecasts, and (ii) the Council for Scientific and Industrial Research (CSIR) in South
Africa conformal-cubic atmospheric model (CCAM) seasonal forecasting system. The
following datasets are available from ECMWF from ERAI global atmospheric reanalysis and
long range forecasts:
Atmosphere global forecasts
o Forecast to ten days from 00 and 12 UTC at 16 km resolution and 91 levels (in
2011/12: ~137 levels).
Ocean wave forecasts
o Global forecast to ten days from 00 and 12 UTC at 28 km resolution
o European waters forecast to five days from 00 and 12 UTC at 11 km
resolution.
51-member ensemble prediction system
o To day 15 from 00 and 12 UTC (to day 32 on Thursdays at 00 UTC, in 2011:
also on Mondays + 46d on the 15th of each month )
o 32 km resolution up to day 10, then 65 km, and 62 vertical levels (in 2011: ~95
levels);
o 12 UTC with persisted SST up to day 15, 00 UTC with persisted SST up to
day 10 and then coupled ocean model (in 2011 coupled both at 00 and 12
UTC);
o Coupled ocean has horizontally varying resolution (⅓ to 1°), 29 vertical levels
(in 2011 new ocean model NEMO and NEMOVAR DA);
o Coupled wave mode.
Seasonal forecasts: Atmosphere-ocean coupled model
o 41-member global forecasts to seven months (in 2011: System 4);
atmosphere: 120 km resolution, 62 levels (80km, 91 levels); ocean:
horizontally-varying resolution (⅓° to 1°), 29 levels (NEMO and NEMOVAR)
o e-forecast suite: 11 members x 25 years (15 members x 30 years, 1981-2005)
Reanalysis:
o Since January 1979 to present (near real time update);
o Atmosphere: 80 km horizontal resolution with 62 vertical levels;
o 6 hourly analysis, 12 hour 4D-Var assimilation;
o 10 days forecasts (at 00 and 12 UTC).
In D4.2 and D4.3, the quality and availability of precipitation datasets for drought monitoring
in Africa was analyzed. The following conclusions were drawn:

DEWFORA Project Report WP5 – D5.3
16
There are four global precipitation datasets over Africa and ECMWF reanalysis
highlights uncertainty associated with accurate estimates of precipitation for verifying
purposes.
A robust evaluation of seasonal forecasts is strongly dependent on the verification
dataset. There is a high uncertainty of precipitation estimates over Africa.
ERAI precipitation has limitations for drought applications, especially over the tropical
rainforest, because of drifts in the model climate. However, in the other regions, it
compares reasonably well with the remaining datasets and has the potential to be
used as a monitoring tool because of its near real time update (in contrast with the
other datasets). Furthermore, a robust evaluation of seasonal forecasts is dependent
on the verification dataset. Since there is no clear information on which dataset is
more reliable, the seasonal forecasts of precipitation were verified against GPCPv2.2.
The ERAI configuration has a spectral T255 horizontal resolution (about 0.7°x0.7° in
the grid-point space) with 60 model levels. For comparison purposes the previous
ECWMF ERA40 reanalysis (Uppala et al. 2005) (1.125°x1.125°) was also included. A
k-mean clustering algorithm to GPCPv2.1 in order to identify regions with
homogeneous precipitation climatologies. The GCPC and CMAP datasets are
available in a 2.5°x2.5° latitude/longitude grid while the other datasets have higher
resolutions. There is a tendency of the reanalysis products (both ERAI and ERA40) to
overestimate precipitation in the tropical rainforests.
ERAI and GPCP precipitation datasets show good agreement in the mid-latitudes and
poor correlation over the tropical regions in terms of precipitation estimates and
spatial extent
Drought monitoring relies on near real time observation of surface variables such as
precipitation. Observations can either be derived through the merging of ground
observations and remote sensing information or by using re-analysis tools.
In-situ observations and suitable forecasting models are required for most of Africa
4.1.6 Information and knowledge management systems
Modelling and knowledge systems applied to provide drought early warning information or
indices in Africa include global modelling systems, national modelling systems and local
knowledge systems.

DEWFORA Project Report WP5 – D5.3
17
4.1.7 Where are the gaps?
As observed in WP2, monitoring of hydro-meteorological parameters is being undertaken by
national institutions (meteorological, agricultural, and research institutions). For various
reasons, including logistical, technical and financial, the spatial coverage of the monitoring
network varies among the case study basins. The representativeness of the monitoring
framework can be improved by encouraging local institutions, especially in populated areas,
to monitor hydro-meteorological parameters and provide the information to national
institutions. These local institutions could be schools/colleges/universities, hospitals/clinics,
private enterprises, local government departments etc. Observations can also merge ground
observations and remote sensing information or by using re-analysis tools. In-situ
observations and suitable forecasting models are required for most of Africa. It is important to
take advantage of available Global datasets.
4.2 DROUGHT FORECASTING
The main problem for developing effective early warning systems is the lack of means to
predict climate conditions with sufficient skill and lead- time. Nevertheless, there has been
remarkable progress in the science of climate and climate prediction in the last few decades
that permits to mainstream the climate variable into the development planning. This requires
an understanding of how climate variability impacts on society in a country, region, or
community.
4.2.1 Example 1 – Limpopo River basin
A system to forecast crops has been in existence before 1980.
Figure 4-2: Forecast versus observed rainfall January to March 1998

DEWFORA Project Report WP5 – D5.3
18
4.2.2 Meteorological forecasting
The ECMWF maintains two currently operational ensemble forecasting systems through its
Variable resolution Ensemble Prediction System (VarEPS): (i) weather forecasts out to 32
days and (ii) seasonal forecasting produces forecasts out to 7 months.
The time scale for medium-range (up to day 15) and monthly (up to 7months) weather
forecasting is too short for variations in the ocean significantly to affect the atmospheric
circulation, hence it is essentially an atmospheric initial state problem. The ECMWF medium-
range weather forecasting system is based on atmospheric-only integrations. The monthly
forecasting system comprised the medium-range VArEPS in ocean-atmospheric coupled
mode after day 10. The real-time VarEPS/monthly forecasting system is a 51-member
ensemble of 32-day integrations. The first 10 days are performed at 0.28x0.28 degrees
resolution forced by persisted SST anomalies (updated every 24 hours). After 10 days the
model is coupled to the ocean model and has a resolution of 0.56x0.56 degrees. Drift is
removed from the model solution during the post-processing. The probability distribution
function (pdf) of the model climatology is evaluated to detect any significant difference
between the ensemble distribution of the real-time forecast and climatology. The climatology
is a 5-member ensemble of 32-day VarEPS/monthly integrations, starting on the same day
and month as the real time forecast for each of the past 18 years.
Seasonal forecasting is less problematic that monthly forecasting because of the long
predictability of the oceanic circulation (of the order of several months) and by the fact that
the variability in tropical SSTs has a significant global impact on the atmospheric circulation.
Since the oceanic circulation is a major source of predictability in the seasonal scale, the
ECMWF seasonal forecasting system is based on coupled ocean-atmosphere integrations.
Seasonal forecasting is also an initial value problem, but with much of the information
contained in the initial state of the ocean. The principal aim of seasonal forecasting is to
predict the range of values which is most likely to occur during the next season. The
atmospheric component of the coupled model is the ECMWF IFS (Integrated Forecast
System) model version 31r1. The horizontal resolution used for seasonal forecasts is
1.125x1.125 degrees. The seasonal forecasts consist of a 41 member ensemble. The
ensemble is constructed by combining the 5-member ensemble ocean analysis with SST
perturbations and the activation of stochastic physics. The forecasts run for 7 months. A set
of re-forecasts (otherwise known as hindcasts or back integrations or just referred as
climatology) are made starting on the 1st of every month for the years 1981-2005. The
forecasts are available at the ECMWF data finder. Data are delivered in the GRIB format.
DEWFORA Project Report WP5 – D5.3
19
The application GRIB API3 can be used to read, write and manipulate that data format under
an Apache Licence.
The Council for Scientific and Industrial Research (CSIR) in South Africa runs operationally a
seasonal forecasting system based on the conformal-cubic atmospheric model (CCAM).
CCAM is configured to generate a 28-year set of hindcasts as a result of forcing the CCAM
with predicted, as opposed to persisted, SST anomalies. The ECHAM4.5-MOM3-DC2 (12
ensemble members; 74.25°S to 65.25°N) and ECHAM4.5-GML-CFSSST (12 ensemble
members; 46°S to 46°N) forecasts data sets are available from January 1982 to present. The
model data are obtained from the data library of the International Research Institute for
Climate and Society. The observed SST data sets used are the 1°x1° resolution data of
NOAA's OI.v2, and the 2°x2° resolution data of NOAA's NCDC ERSST version3b. A
statistical model (canonical correlation analysis – CCA) which uses the most recent 3-month
mean antecedent global ERSST field as predictor and the OI.v2 global SST as predicted
from the two CGCMs. The three models produce a 28-year set of retro-active SST forecasts
from 1982/83 to 2009/10 for lead-times up to 6 months. The retro-active forecasts average
the three global forecasts to produce an equal weights set of multi-model forecasts. The
same procedure is followed to produce forecasts operationally every month. The operational
forecasts and verification statistics are presented on the website of the South African Risk
and Vulnerability Atlas (http://rava.qsens.net/)
Seasonal forecasting provides a statistical summary of the weather events occurring in a
given time period. Most of the precipitation over the African continent is controlled by the
south to north and back displacement of the Inter Tropical Convergency Zone (ITCZ), the
intensity of the low level Tropical Easterly Jet (TEJ) and the flow disturbances in the high
level African Easterly Jet (AEJ). The rainfall field over West Africa is characterised by a zone
of maximum precipitation that migrates north and south throughout the course of the year.
This zone lies to the south of the ITCZ. For drought applications the timing of the rainy
seasons, amount of precipitation and its interannual variability are important.
As an example, the case study of the integration of monitoring and forecasting for the recent
2010-11 drought in the Horn of Africa is presented. The 2010-11 drought in the Horn of Africa
resulted from a precipitation deficit in both the Oct-Dec 2010 and Mar-May 2011 rainy
seasons, and this was captured by ERAI. Soil moisture anomalies of ERAI also identified the
onset of the drought condition early in Oct 2010 with a persistent drought still present in Sep
2011. The precipitation deficit in Oct-Dec 2010 was associated with a strong La Niña event.
The ECMWF seasonal forecasts of NINO3.4 predicted the La Niña event from June 2010
onwards, and also a dry precipitation anomaly for the region from July 2010 onwards. On the

DEWFORA Project Report WP5 – D5.3
20
other hand, the seasonal forecasts for the Mar-May 2011 season did not predict the anomaly
in advance, except for the forecasts in March 2011.
4.2.3 Performance of forecasts on the Oum-er-rbia, Blue Nile, Upper Niger, Congo and
Limpopo River Basins
Performance of forecasting products was assessed in the following basins: Oum-er-rbia
(OR), Blue Nile (NB), Upper Niger (NG) Congo (CG) and Limpopo (LP). The results are
summarized below:
(a) Precipitation forecasts
Seasonal forecasting in the South and North West of Africa shows good agreement for all
data sets, while there is a low agreement in Central Africa (between the +/- 20° parallels).
Seasonal forecasting in the BN, LP and NG show higher reliability and skill in comparison
with the Congo and Oum er-rbia
ECMWF seasonal forecasts have higher predictive skill than climatology for most regions.
CAMSOPI is a merged dataset produced by the NOAA Climate Prediction Centre (CPC)
combining satellite rainfall estimates from the Outgoing Longwave Radiation (OLR)
Precipitation Index (OPI) with ground-based rain gauge observations from the Climate
Anomaly Monitoring System (CAMS). In the BN ERAI shows a significant overestimation and
CAMSOPI is in good agreement with GPCP annual cycle of precipitation.
S4 forecasts overestimate precipitation in both BN and NG basins in the first forecast month
with a reduction of the peak rainfall with lead time, showing the impact of model drift.
In the CG basin, ERAI, CAMSOPI and S4 show an early peak rainfall in March (GPCP in
April) and a latter peak in November (GPCP in October). ERAI generally overestimates
precipitation in CG, while S4 overestimates its amplitude. From the mean annual cycle
analysis, CG basins appear as the most problematic with timing errors in the rainy season,
and amplitude problems in S4
In the LP and OR basins all datasets show a reasonable agreement, with an underestimation
of the rainy season in OR, and S4 has a reduced drift on both basins.
In the BN and NG, the ERAI overestimation of precipitation is also reflected in higher inter-
annual variability, while in the CG and LP there is a good agreement between ERAI,
CAMSOPI and GPCP. The underestimation of precipitation during winter in OR by all

DEWFORA Project Report WP5 – D5.3
21
datasets is also associated with lower inter-annual variability. The changes in variability with
lead time in S4 are smaller than what was found for the mean annual cycle of precipitation.
In the BN and NG the temporal correlation of both ERAI and CAMSOPI compared with
GPCP decays with increasing SPI time-scale. In all basins, except OR, GPCP has lower
decay time scales and higher variance of white noise while ERAI has the higher time scales
and lower white noise variance.
In the NG, both ERAI and CAMSOPI show an opposite trend to GPCP, with a wet period
until 2000 and severe and long term drought in the last decade.
S4 precipitation forecasts in terms of the anomaly correlation coefficient (ACC) for the
ensemble mean in the BN, LP and NG basins have skill up to 3 months lead time for the
rainy seasons, while in the CG and OR basins S4 does not have skill.
S4 outperforms the climatological forecasts in the basins where the original seasonal
forecasts of precipitation have skill, namely BN, LP and NG. In CG and OR, S4 has a similar
skill to climatological forecasts CLM.
(b) SPI forecasts
There is good agreement between the GPCP derived SPI at time-scales higher than 5-6
months, for all calendar months except July, when compared with river discharge anomalies.
SPI derived from ERAI and CAMSOPI compared with stream-flow shows much lower or no-
existent the correlations. This reflects the poor intra-seasonal to inter-annual variability of
precipitation of the ERAI and CAMSOPI datasets in the NG region
Taking moderate to severe droughts with an SPI below -0.8, for the SPI-6 the ROC of CLM is
close to 0.5 (no information), while with S4 the ROC is higher close to 0.7 in the BN, LP and
NG, 0.6 in CG and 0.54 in OR. For the SPI-12 the ROC of climatology is always above 0.5,
since the climatological forecast inherits 6 months of monitoring. In this case, it is difficult to
beat the climate forecast, but S4 outperforms climatology in the BN, LP and NG river basins
(as documented before).
There is a significant drop in the ACC, especially in the BN, CG and NG river basins.
CAMSOPI has problems in representing the intra-seasonal to inter-annual variability of
precipitation. These problems are present during the monitoring periods and are extended to
the forecast period. The quality of monitoring products is very important as they control the
skill of the SPI forecasts for accumulation time scales.

DEWFORA Project Report WP5 – D5.3
22
Seasonal forecasts of the 1991/92 drought in the LP basin with different initial forecast dates
starting August 1991 to July 1992, comparing the SPI-12 from GPCP (verification),
CAMSOPI (monitoring) and the S4 and CLM forecast show that skill improves around Nov –
Dec for and CLM performs better from Dec onwards.
(c) Hydrological forecasting
Hydrological forecasting usually requires a hydrological model to transform the
meteorological forecast into hydrological predictions. The selection of a suitable hydrological
model, or a combination of models, for the objective of drought forecasting in Africa was
carried out by assessing various models using the following set of criteria.
Represented processes and fluxes: interception, evaporation, snow, soil,
groundwater, runoff, reservoirs, lakes, routing, water use, energy balance and
calibration parameters
Model applicability to African climatic conditions and physiographic settings:
Applicability of the model in semi-arid regions
Data requirements and resolution of the model (spatial and temporal resolution)
meteorological, spatial, temporary. A fixed grid size and fixed basin sizes can limit
model applicability. Model should be scalable
Capability of the model to be downscaled to a river basin scale
Continuous, operational models for drought early warning system at large scales
Open source and well documented models are preferred
Two types of models were considered: Global Land Surface Models (GLSMs), that describe
the vertical exchange of heat and water and Global Hydrological Models (GHMs) that
describe water resources and lateral transfer of water. In total six GLSMs and eleven GHMs
were evaluated. Emphasis was put on assessment of models on status of documentation on
models, available data vs data requirements, ability to provide useful output for specific
hydrological drought conditions and specific characteristics of focus areas, development
status of model, open source vs proprietary software. In Africa there are many regions with a
lack of good precipitation observations, and this is a limiting factor to application of data
intensive models Most models did not succeed in representing the water balance
components in arid and semi-arid basins where there was the largest coefficient of variation
(CV) of the global evaporation and runoff. Evapotranspiration, soil moisture changes,
groundwater flow and surface water-groundwater interactions including wetlands are
important for most catchments in Africa. The existing models are dominated by different
processes and therefore show significant differences in their water-balance components and
response to events.

DEWFORA Project Report WP5 – D5.3
23
The result of the analysis was that PCR-GLOBWB, SWIM, GWAVA, HTESSEL, LISFLOOD
and SWAT show higher potential and suitability for hydrological drought forecasting in Africa,
although the differences in results suggest the need to use multiple hydrological models.
Two hydrological models were selected to test their application to Limpopo and Niger case
study basins namely PC Raster Global Water Balance Model (PCR-GLOBWB) and the Soil
and Water Integrated Model (SWIM). These results are presented in the following section.
i) Limpopo basin
The PC Raster Global Water Balance Model (PCR-GLOBWB) was applied to the Limpopo
basin. Model parameters were assumed to be correct based on the best available input data.
The difference that different ensembles of meteorological forecasts may bring in hydrological
model results can be expected to dominate any gains that may be achieved by calibrating
the model with one set of historic data.
New development includes an irrigation scheme to account for the highly modified hydrology
in the Limpopo river basin. The model is set up for a spatial resolution of 0.05 x 0.05 degrees
downscaled from 0.5 x 0.5 degrees and simulation is carried out for a 32 year-period on a
daily time step. Part of groundwater drained by surface water is computed by assuming a
linear relationship between the storage and outflow. Groundwater residence time depends on
the saturated hydraulic conductivity of the aquifer the drainage porosity, the aquifer depth,
and the drainage length. River routing is based on the kinematic wave approximation of the
Saint-Venant Equation. Floodplains and through-flow wetlands are treated as regular river
stretches except that flooding spans through the entire floodplain normally with higher
resistance, which is defined in terms of Manning’s n separately for the river bed and
floodplain. Areas of lakes and floodplains are kept constant while routing. Irrigation water
requirement for a cell is supplied through the storage of freshwater in the cell and
groundwater extraction for irrigation is not considered but is feasible if information is available
Model output included actual evaporation; soil moisture; surface and subsurface runoff, river
discharge, root stress, water storage in the three layers etc. Standardized Runoff Index (SRI)
could not be computed for gauge stations in the Limpopo River Basin because the runoff
data was not continuous during the required period of at least 30 years. Missing data
reduces continuous measured data in general to about 10 years. The Streamflow Drought
Index (SDI) applies estimates of natural logarithms of cumulative streamflow with mean and
standard deviation. The index ranges from 0.0 (no drought) to -2.0 (extreme drought). The
SDI allows the computation even if there are missing values. Similar SDI and SRI were
obtained for 6 and 12 months, most flow occurs in the first 6 wet months of the hydrological

DEWFORA Project Report WP5 – D5.3
24
year. In both cases the major droughts appear to be identified reasonably well (1982-83,
1991-92) with SDI and SRI values smaller than -1.5. Extremely wet year of 2000 is very
visible with SDI and SRI higher than 2.0.
ii) Niger River basin
The Soil and Water Integrated Model (SWIM) was set-up on the Intermediate Niger Basin
and calibrated to represent region specific processes, stocks and fluxes by using regional
ground-truth and remote sensing data. Further developments include reservoir management,
wetlands and inundation plain dynamics. In the INB interaction between wetlands and lakes
and inundation are important. The reservoir module allows for release for minimum flows,
managed releases and energy releases.
Hydrological response units have same properties (soil and land use/cover) regarding bio-
physical processes. The model is connected to meteorological, land-use, soil, vegetation and
agricultural management input data. Simulations consider water balance for four control
volumes: the soil surface, the root zone, the shallow aquifer, and the deep aquifer. The
percolation from the soil profile is assumed to recharge the shallow aquifer. Return flow from
the shallow aquifer contributes to the streamflow. Shallow aquifer water balance includes
ground water recharge, capillary rise, lateral flow, and deep percolation. The inundation
module simulates release and flooding, the flooded surface area, inundation depths, and
duration, evapotranspiration and percolation.
Model calibration and validation was performed with PEST (Model-Independent Parameter
Estimation and Uncertainty Analysis) for period 1971-1980 and 1982-2000. The model
performed well on estimation of runoff and flow frequency. An overestimation of the annual
peak and over-estimation of low flows was obtained. The model is currently being extended
to model drought conditions.
(d) Downscaling forecasts
Global institutions are better resourced to generate forecast and early warning at a broad
scale. The simulated forecasts from the Global institutions are passed onto national
institutions for further downscaling and packaging to meet local preferences.
The downscaling would include increasing spatial resolution to provide forecast information
at lower levels such provinces, municipalities, districts, agricultural regions etc.

DEWFORA Project Report WP5 – D5.3
25
(e) Local indigenous knowledge forecasting systems
”Scientific” drought forecasting (SDF) methods apply Global Circulation Models (GCMs) but
downscaling to local level has proved to be a huge challenge mainly because of inadequate
calibration data, failure to accommodate local climate circulation systems and variations in
geophysical conditions. Local knowledge drought forecasting (LKDF) systems accommodate
these aspects but they are poorly documented, lack scientific validation and their applicability
over large areas have not been tested. LKDF system forecasts compared well with what the
season turned out to be.
Traditional indicators of drought in the Mzingwane sub-basin based on trees and plants are
as follows:
Traditional indicators of drought in the Mzingwane sub-basin based on insects, birds and
animals

DEWFORA Project Report WP5 – D5.3
26
Traditional indicators of drought in the Mzingwane sub-basin based on the sun, moon and
wind are as follows:
The hind-cast comparison applied seasonal rainfall, wind, NDVI and temperature data for
2011/12 and 2012/13 because lack of historical data for LKDF systems. LKDF system
forecasts were compared with downscaled GCM forecasts as seasonal and monthly outlook
forecasts provided by SARCOF, the SADC Climate Services Department and the Zimbabwe
Meteorological Services Department. Results show a strong correlation between traditional

DEWFORA Project Report WP5 – D5.3
27
plant and tree indicators with resulting conditions captured as NDVI and indices based on
observed rainfall, wind and temperature. Traditional forecasts performed better than
downscaled GCM forecasts at local level for the 2012/13 season. The challenge is to isolate,
enumerate and then verify LKDF parameters which were mainly based on personal opinions
of the forecasters.
(f) Accuracy and reliability of forecasts
D4.2 acknowledges that while uncertainty in all the forcing data (mainly rainfall forecasts and
perhaps temperature forecasts as well) can be minimised with the ensemble approach,
hydrological models compound it by their inability to represent hydrological fluxes and the
lack of good precipitation observations hydrological droughts. Thus further scientific
advances on hydrological models that can use the seasonal forecasts to generate
information for water management strategies in Africa.
Drought early systems based on local knowledge identified in D2.3 provide early warning on
on-set of drought with varied lead times and overall period of seasonal outlook. Historical
forecasts have not communicated the duration, magnitude and chance of occurrence of the
drought. Evidence of consistent issuing of warnings is poor because of lack of documentation
and this has limited the scientific advancement of these knowledge systems.
While the application of stochastically generated forecast trajectories (flow and storage),
historical statistics (rainfall, flow and storage) and cyclical behaviour (rainfall and flow) for
drought early warning are the preferred options by water managers in Africa as they offer
improved confidence through learning from historical patterns there is an appreciation that
future patterns may be different hence the need for new methods that incorporate seasonal
forecasts (D2.3).
4.3 DROUGHT EARLY WARNING
Early warning information is derived from forecasting products. Examples of early warning
systems in each of the case study basins are given in this section.
4.3.1 Example 1 – Oum er Rbia basin
In Morocco the institutions which provide early warnings were as follows:
The Royal Centre for Remote Sensing which provided monthly maps

DEWFORA Project Report WP5 – D5.3
28
The Secretariat of State in charge of Water and the Environment provided estimates
of water resources for the forthcoming hydrological year (starting in September).
Water was allocated according to availability at the end of the raining season
The National Directorate of Meteorology, Seasonal provided long-term forecast of
precipitation using large scale climate patterns such as the SST, NAO and ENSO.
The Ministry of Agriculture and Maritime Fisheries provided an overview of the rainfall
situation by comparison to the normal year
Morocco the indigenous or local knowledge drought early warning includes local
observations communicated using adages or proverbs. The following are applied from mid-
September to mid-March.
The following warnings are applied from mid-March to mid-September.

DEWFORA Project Report WP5 – D5.3
29
The following proverbs applied used as drought early warning.

DEWFORA Project Report WP5 – D5.3
30
4.3.2 Example 2 – Niger River basin
In West Africa for the Niger Basin in Mali the following institutions provided early warning:
AGRHYMET, National Directorate of Hydrology, National Directorate of Meteorology,
National Directorate of Agricultural Engineering, National Department of Agriculture, Institute
of Geography of Mali, National Directorate of Environment and NGOs.
4.3.3 Example 3 – Limpopo River basin
In the Southern Africa, since 1997 the Southern Africa Regional Climate Outlook Forum has
been bringing together national, regional, and international weather experts to build a
consensus seasonal forecast for the region. The outlook has been provided as maps of
expectation of above normal, normal and below normal rainfall.
The lead time for the precipitation forecasts has varied from a few days to a month in most
study areas and in Southern Africa a lead of 5months has been applied by the South Africa
Weather Services while the Southern Africa Regional Climate Outlook Forum (SARCOF)
issues a 6months ahead forecast.
4.3.4 Example 4 – Eastern Nile River basin
In the Nile Basin-Equatorial Lakes Region national meteorological services provided weather
forecasts and outlooks, including pre-season climate outlooks. In the Ethiopian Plateau non-
governmental organisations (NGOs) were responsible at the national level for early warning

DEWFORA Project Report WP5 – D5.3
31
activities. In the East Africa Nile basin the RIBASIM-Nile was applied in the Nile Forecasting
System to assess impacts of upstream developments along the Nile River. The Sudan
Meteorological Authority produced rainfall forecasts for two to three month before the rainy
season.
4.3.5 Drought early warning framework
The analysis of drought warning thresholds requires the simultaneous consideration of
drought hazards and impacts. The following steps should be addressed: (i) define hazard
(meteorological or hydrological etc); (ii) define the impacts in agriculture, water, ecosystems,
health, etc; (iii) define exposure (number of people affected); and (iv) define coping capacity
or adaptive capacity.
In order to define warning thresholds, research needs to focus on analyzing how
socioeconomic systems respond to drought conditions. Figure 3 shows an illustrative
example. We assume that response of the system under analysis can be characterized in
probabilistic terms through an indicative variable (for instance, probability distribution of crop
productivity) as a function of different drought states (for instance, wet, normal and dry
conditions). The "coping range" of society may be described as the maximum perturbation
form mean conditions that can be accepted without significant damages. In normal
conditions, there is a coping range for the system that marks the acceptable values of the
indicative variable (between LTb and UTb). If a drought forecast is available, the estimation of
the probability distribution of the indicative variable gets shifted to a drier state, and the
probability of being exposed to impacts increases with respect to the normal condition. The
drought warning decision should be based on whether that probability increase is high
enough to adopt a response action to mitigate the expected damages.
The problem can be addressed through classical cost-benefit analysis, but forecast
uncertainty and skill introduce additional complexities that need to be carefully analyzed.

DEWFORA Project Report WP5 – D5.3
32
Probabilityof drought
damage
Probabilitydistribution
Indicator
Averageclimate
Copingrange
Droughtforecast
mmf UTbLTb
Figure 4-3 An illustration of activation of drought warning thresholds.
The applicability of this framework was tested in the case studies and the results were
incorporated in this early warning protocol. The indicative variables suggested for case study
areas are the following:
Oum-er- Rbia Basin: Stream flow, crop, yield, rainfall, adaptive capacity, exposure
Niger River Basin: Precipitation, stream flow, reservoir operation, state of
ecosystems, adaptive capacity, exposure
Limpopo River Basin: Precipitation, stream flow, crop, yields, management, rules,
institutional, response, adaptive capacity, exposure
Eastern Nile Basin: Hydrological indicators, adaptive capacity, exposure
Pan- African Level Extreme forecast indices, precipitation, SPI
For the Limpopo basin case study, available data consisted on yellow and white maize yield
data obtained from the South African National Department of Agriculture, Directorate:
Statistics and Economic Analysis. Data are available from 1981 to 2011. The analysis was
focused on Witbank and Middelburg agricultural districts and the Rustenburg agricultural
district. Forecasts were taken from ECMWF System 4 data.
For the Oum-er-Rbia basin case study, available data consisted on durum wheat crop yield:
2 stations in the coastal region, 4 stations in plains and 3 stations in the mountains. Data are
available form 1979-80 through 2007-2008. Sowing dates in the region are: October-

DEWFORA Project Report WP5 – D5.3
33
November, November-December or February. Harvest dates are: May, May-June or August.
Forecasts were taken from ECMWF System 4 data.
The crops of both basins considered here are strongly rain-fed, so the assumption is made
that if a global model is able to predict seasonal rainfall over an area of interest, then the
same global model’s output can also be used in a statistical forecast system to predict a rain-
fed commodity such as crops. A downscaling modelling system to predict seasonal crop
yields over the Limpopo (southern Africa) and Oum-er-Rbia (Morocco) river basins was
developed. ECMWF System 4 data were transformed from GRIB into the format required by
the statistical software package used in the analysis. Ensemble mean data and 3-month
averaged sea-level pressure (SLP) and 850 hPa geopotential height data are the predictors
considered. ECMWF S4 low-level circulation data for the three-month season prior to the
period of harvesting is transformed into normal distributions then post-processed into to crop
using the model output statistics (MOS). MOS equations are developed by using the principal
component regression (PCR;) option of the Climate Predictability Tool (CPT) of the
International Research Institute for Climate and Society (IRI; http://iri.columbia.edu)
The low-level circulation fields of the ECMWF System 4 (S4) are used as predictors in a
principal components regression (PCR) approach to test the predictability of seasonal crop
yields over the two basins. The models are tested over a 26-year period to determine their
deterministic skill levels, as well as over a 16-year retro-active forecast period to test their
probabilistic skill capabilities. The three-month season prior to the period of harvesting is
selected based on the assumption that the seasonal averaged low-level circulation during
that three-month period is associated with the rainfall over the region of interest and hence
related to the production of dry land crops. Limpopo DJF hindcast are used throughout, and
for Oum-er-Rbia, both FMA (for coastal and plains) and MJJ (for mountains) hindcasts are
used. The hindcast fields used in the MOS equations are restricted over a domain that
covers an area between the equator and 45°S and from 20°W to 60°E for the Limpopo
downscaling, and from 40°N to 30°S and from 150°E to 20°W for Oum-er-Rbia downscaling
Deterministic skill is determined over a 26-year period for the harvest years of 1983 to 2008.
Cross-validation is performed with a large 5-year-out design to minimise the artificial inflation
of skill. Retro-active forecasting is applied over the 16-year period from 1993 to 2008 to
produce a set of probabilistic downscaled hindcasts. The Relative Operating Characteristic
(ROC) was used to test for systematic discrimination and as a verification measure, and the
reliability diagram was used determine if the confidence communicated in the hindcasts is
appropriate. If the area below ROC curves is ≤ 0.5, the model discriminates correctly only for

DEWFORA Project Report WP5 – D5.3
34
less than half the time. For a maximum ROC score of 1.0, perfect discrimination has been
obtained.
The main results for the Limpopo basin are:
Significant forecast skill was mainly restricted to the Rustenburg agricultural district.
Agricultural district yield indices (normalised values)
Discrimination was achieved, especially for the Rustenburg agricultural district, but
the ability to predict for high yields for this district is restricted to lead-times up to two
months. useful skill for Rustenburg can be seen for both high and low yields at short
lead times.
Good reliability for the prediction for low yields (a consequence of drought) can be
seen for Rustenburg (middle panel), but over-confidence is found in predicting high
yields for all three districts.
The main results of the Oum-er-Rbia case study are:
Skill may be found for the mountains and coastal areas, but very low predictability is
seen over the plains of the basin.
Probabilistic skill suggests potential for making yield predictions over the mountains
and over the coastal areas. Poor skill was found over the plains
Good discrimination was found in mountain areas and for high yields. At a 2-month
lead-time, high and low yields are well discriminated for both the coastal and
mountain areas, and so we will present a reliability analysis of the forecast system at
this lead time only. There was good reliability for predicting low yields over the
mountain and coastal areas, but the prediction of high yields has been found to be
over-confident
The study carried out presents a baseline that needs to be outscored by such sophisticated
approaches. Examples of these approaches include the use of physical crop models that
assimilate output from global climate models on temporal and spatial scales reconcilable with
their requirements.
4.3.6 Packaging of forecasts for use as early warning information
Seasonal forecasting provides a statistical summary of the weather events occurring in a
given time period. The principal aim of seasonal forecasting is to predict the range of values
which is most likely to occur during the next season.

DEWFORA Project Report WP5 – D5.3
35
Forecast information should include the following:
a) Onset of rainfall
b) Seasonal distribution/pattern of rainfall
c) Streamflow, dam levels etc.
d) Crop harvests
e) Fodder/forage availability
The probability of a conditions/range of values being achieved should be easily understood
at the application level of the forecast information as well as the implications.
The probabilistic Relative Operating Characteristics (ROC) score calculated using the hit rate
(HR) and false alarm rate (FAR) for forecasts is a useful tool for drought detection/early
warning. For drought applications the timing of the rainy seasons, amount of precipitation
and its inter-annual variability are important
4.4 DROUGHT RESPONSE
An adequate drought response consists on actions that are activated whenever a warning
threshold is overcome. Potential actions have two components (Figure 4-4Figure 7-1): (1)
drought prevention, which concerns those measures aimed at preventing drought causing
damage; and (2) drought preparedness, which concerns those measures which enable
societies to respond rapidly to drought.
Figure 4-4: Potential actions that may be included in a DEWS

DEWFORA Project Report WP5 – D5.3
36
Methods for defining drought vulnerability across Africa identified in Work Package 3
(WP3), deliverables D3.1 and D3.2 include the following:
D3.2 identified 28 global publicly available datasets with variables related to drought
vulnerability.
4.4.1 Formulation of actions
The development of a drought mitigation plan should be informed by a clear assessment of
the drought in terms of onset, deficit and duration. Mitigation actions reduce the impact of the
deficit at onset and throughout the drought period. Other mitigation actions such as relief
actions deal with the post-drought situation. This the objectives of the drought mitigation plan
and should be clearly stated.
Drought mitigation actions may range from increasing the security of water supplies through
water storage schemes (such as dams or micro-level water harvesting schemes), increasing
the proportion of food production which is irrigated, increasing the efficiency with which
available water sources are utilised, introducing or ensuring the retention of crop varieties
which are drought-resistant, encouraging the greater use of adaptive strategies by farmers,
to diversifying the sources of employment and income in an area into activities which are less
vulnerable to the effects of drought.
4.4.2 Prioritisation of actions
Priorities may be established based in on such concerns as feasibility, effectiveness, cost,
and equity. In choosing the appropriate actions, it might be helpful to ask some of the
following questions:
What are the cost/benefit ratios for the actions identified?
Thresholds of drought indices defined by comparing time-series of indices with
drought impacts. They include the following:
o ENSO, Precipitation, Percentage of Normal Precipitation, SPI, PDSI,
o Streamflow, state of reservoirs,
o SWSI, crop yield
o State of ecosystems, adaptive capacity, exposure, coping capacity,
social response and adaptive capacity
Drought characteristics captured as duration, frequency, intensity, timing of
onset, extend and predictability.

DEWFORA Project Report WP5 – D5.3
37
Which actions does the general public deem feasible and appropriate?
Which actions are sensitive to the local environment (i.e., sustainable practices)?
Are your actions addressing the right combination of causes to adequately reduce the
relevant impact?
Are your actions addressing short-term and long-term solutions?
Which actions would fairly represent the needs of affected individuals and groups?
A tool to rapidly assess the cost and benefits of mitigation actions should be implemented to
help give effect to the vulnerability assessments. Vulnerability assessment seeks to identify
characteristics of the systems that modify the level of risk derived from inadequate
structures, management, and technology, or by economic, environmental, and social factors.
At the framework level, drought risk analysis can relate hazard to vulnerability. Low hazard
and low vulnerability = no risk, high vulnerability and high hazard=high risk
When a forecast shows societal impacts then the early warning connects to vulnerability
assessment. Translation of forecasted variables into a potential economic or societal impacts
becomes important. Impacts can be expressed as damages. When the expected value of
damages exceeds a given threshold, some management actions/interventions may be
required to reduce the risk.
D3.2 focused on the study of drought vulnerability. Patterns of drought vulnerability can be
mapped using the following drought-related indicators at a suitable spatial scale: Indicators of
adaptive capacity o conversely vulnerability include cultivated area, % of total country area
cultivated, Arable land, Area covered by permanent crops, Irrigation potential, Irrigation
potential as % of arable land, Population,% Rural Population, % Urban Population,
Population Density, % Total economically active population, % Total economically active
population in agriculture, Human Development Index, Agriculture Value added to GDP%,
access to water % of total population, access to water % population, urban and rural
population %, access to sanitation as % of population, urban and rural population %, Number
of dams, Total dam capacity, average annual precipitation, renewable water resources total
and internal, per capita renewable water resources, agricultural water use % of total, total
renewable/natural groundwater, infrastructure vulnerability index, storage as % of annul
renewable fresh water resources, storage drought index, vulnerability of the renewable
natural capital, vulnerability of the economic capital, vulnerability of civic and human
resources, vulnerability of infrastructure and technology, Drought vulnerability index

DEWFORA Project Report WP5 – D5.3
38
To ensure that the DEWFORA research brings the state-of-the-art in drought related
research to the operational domain and provides viable and effective solutions with direct
applicability in Africa the following vulnerability indices were tested in the case studies and
the results are applied in early warning protocol in WP5:
Oum-er- Rbia Basin: Streamflow, crop, yield, rainfall, adaptive capacity, exposure,
SPI, NAO, vulnerability
Niger River Basin: Precipitation, streamflow, reservoir operation, state of ecosystems,
adaptive capacity, exposure, Predictive indicator, Coping capacity
Limpopo River Basin: Precipitation, streamflow, crop, yields, management, rules,
institutional, response, adaptive capacity, exposure, social response
Eastern Nile Basin: Hydrological indicators, adaptive capacity, exposure, SWSI and
ENSO, social response
Stakeholders are engaged directly in the evaluation of vulnerability using a guideline
developed on this D3.2 (Table 5) to rank vulnerability and D3.2 (Table 6) to evaluate
potential impacts and causes of drought (see D6.2L, D6.2OR, D6.2NB, D6.2N)
4.4.3 Drought Response
The most common drought response actions practiced in Africa are as follows (D2.2):
Communities in Africa are engaged in the following activities to be able to survive future
droughts and climate change, depending on duration and magnitude of deficit (D2.2):
a) water harvesting, construction of water infrastructure,
b) traditional/cultural practices and technologies,
c) water conservation,
d) crop monitoring and crop diversification
a) Food aid, drought relief programs,
b) growing of drought tolerate crops,
c) saving livestock,
d) improved water use efficiency and installation of boreholes, wells and small
dams

DEWFORA Project Report WP5 – D5.3
39
5 WHAT ARE THE SOCIETAL CAPACITIES AND CHALLENGES?
In this component, the societal capacities and challenges (impediments and weaknesses)
that stand against drought preparedness are evaluated. This activity was addressed in
DEWFORA in Work Package 2, that reviews the existing capacities in Africa for monitoring,
forecasting and early warning of drought at local, regional and continental scales, as well as
mitigation practices and adaptation strategies. Following the analysis, recommendations are
made as to what specific institutional or organisational changes would be needed to improve
the existing preparedness plans.
The current situation in Africa reveals a large number of institutions are involved in drought
monitoring and forecasting systems/ networks/ institutions and projects identified of which
global (18), Europe plus the African continent(2),Europe plus Northern Africa(4) , Africa
Continental (3), regional (8) and national (104)
At the global level and in USA and Australia there is the Global Drought Monitor,
WATCH, the National Drought Mitigation Centre (NDMC), the US Drought Monitor, the
North American Drought Monitor (NADM), the Drought Impact Reporter, the Seasonal
Drought Outlook, the National Integrated Drought Information System (NIDIS) and the
CSIRO
Those covering Europe and Africa Continental include the European Drought
Observatory and the EARS Energy and Water Balance Monitoring System (EEWBMS)
Those covering Europe and Northern Africa comprise EEWBMS , XEROCHORE,
AQUASTRESS, CIRCE and MEDROPLAN
Those covering the whole continent of Africa include TIGER, the African Water Cycle
Coordination Initiative and the Experimental African Drought Monitor
In Africa at regional level, in Tunisia covering the SAHEL- Observatory of Sahara and
Sahel (OSS) and the Observatory Network for Long Term Ecological Monitoring Écouter
Lire phonétiquement (ROSELT). In Kenya- IGAD, the Climate Prediction and
Applications Centre (ICPAC), the USAID Famine Early Warning Systems Network
(FEWS NET). In Botswana – the Southern Africa Regional Climate Outlook Forum
(SARCOF), the USAID FEWS NET and the SADC Climate Services Centre. In South
Africa the USAID FEWS NET. In Burkina Faso the USAID FEWS NET
Barriers to the use of forecast information noted in WP2, include the following:

DEWFORA Project Report WP5 – D5.3
40
Forecasts are not frequently used in actual decision making. Practitioners in water resources
management, agriculture, health, finance and other key sectors often encounter barriers in
utilising the science-based forecasting and early warning information for decision making at
the local level. They increasingly worry about drought risks but remain largely at a loss as
what to do in the pre-drought period. The potential of globally available drought forecasts and
early warning data/information as well as knowledge of mitigation and adaptation measures
as “state of the art” remains largely untapped.
The impact of climate change on frequency of occurrence and severity of droughts in Africa
was analyzed using a variable-resolution coupled global climate model (CGCM) model, the
conformal-cubic atmospheric model (CCAM). It was applied for both seasonal forecasting
and the projection of future climate change. The Coordinated Regional Downscaling
Experiment (CORDEX) ensemble of high-resolution projections of future climate change over
Africa, uses different regional climate models, downscaling the output of the CGCM
projections with simulations at about 50 km resolution. However the spatial resolution of
CGCMs is inadequate for studying regional impacts of future climate change. Statistical
downscaling requires long time-series of observed records of sufficient quality, for the
empirical relationships to be established a severe limitation for most of Africa. Reliability of
climate change projections can only be verified after several decades but successful
replication of hind-cast trends can also increase confidence in forecasts.
a) User difficulties in accessing the forecast and early warning information;
b) Lack of understanding of the format in which the forecast information is
presented;
c) User difficulties in evaluating and trusting the forecasts;
d) Failure to interpret the information and convert it into actionable
tasks/responses and
e) Lack of knowledge on how to manage the risks associated with the uncertainty
of forecasts.

DEWFORA Project Report WP5 – D5.3
41
The following were the main findings on future climate change projections.
WP4 investigates advances in early warning capabilities as well as the limitations in the
science.
Accurate or reliable drought forecasts and early warning information coupled with timely
mitigation measures can reduce the impacts of droughts in Africa and at the same time
create conditions for drought adaptation. Recent scientific improvements in meteorological
and hydrological forecasting are providing more reliable information for decisions on drought
management. However, there is still room for further improvements which require capacities
at different levels.
Figure 5-1 illustrates the different elements in a framework to address user requirements for
drought monitoring and early warning. The framework recognizes that users require
different types of information but this has to be usable and timely. This imposes certain
conditions on the frequency and reliability of outputs from the monitoring and early warning
systems. This information is generated through application of models or tools on input data,
which has to be adequate, accurate and timely. Resources required to support this
framework include funding, policies, procedures, methods, people, and infrastructure. The
focus of the analysis in this document is on the outputs, inputs and resources of the systems
in Africa in order to understand the gape that exists between them and with ‘state of the art”.
a) CCAM ensemble-average projected change in annual temperature for 2071-
2100 versus 1961-1990 suggests significant change in 75 percentile and 50
percentile temperature may be experienced over most of Africa
b) CCAM ensemble-average projected change in very hot days for 2071-2100
versus 1961-1990 suggests significant change in 75 percentile and 50
percentile very hot days may be experienced over most of Africa
c) CCAM ensemble-average projected change in annual rainfall for 2071-2100
versus 1961-1990 suggests significant change in 75 percentile and 50
percentile annual rainfall may be experienced over most of Africa

DEWFORA Project Report WP5 – D5.3
42
Figure 5-1: Comparative analysis of monitoring and early warning systems – Framework
diagram.
This document provides a framework for downscaling of drought warning and mitigation from
national to local scale to address the barriers ad gaps identified in WP2 and consider the
findings in WP3 and WP4.
5.1 CURRENT SOCIETAL CAPACITIES
The method applied for evaluating institutional capacity includes mapping the organizations
and institutions relevant to DEWS (defined in WP2) and evaluating the process of DEWS
development according to a mental model that includes the analysis of data and forecasting
systems available, linkages among relevant institutions, organizations and stakeholders and
summary of the proactive and reactive plans and actions.
5.1.1 Data and forecasting systems
In D2.1, an inventory of existing drought monitoring and forecasting systems was made. A
total of 138 drought monitoring and forecasting systems, networks, institutions and projects
were identified. The 138 are spread as follows: 18 are of global scope, 2 correspond to
Europe plus the African continent, 4 cover Europe plus Northern Africa, 3 are centred in
Continental Africa, 8 are of regional scope and 104 are of national scope. Table 1 presents a
summary of identified systems.

DEWFORA Project Report WP5 – D5.3
43
Table 1 Main drought monitoring and forecasting systems in Africa
Scope Example of drought monitoring systems/projects
Global
Global Drought Monitor WATCH National Drought Mitigation Centre (NDMC) US Drought Monitor North American Drought Monitor (NADM) Drought Impact Reporter Seasonal Drought Outlook National Integrated Drought Information System (NIDIS) CSIRO
Europe and Africa European Drought Observatory EARS Energy and Water Balance Monitoring System (EEWBMS)
Europe and Northern
Africa
EEWBMS XEROCHORE AQUASTRESS CIRCE MEDROPLAN
Africa TIGER African Water Cycle Coordination Initiative Experimental African Drought Monitor
Regional- Tunisia and Sahel
Observatory of Sahara and Sahel (OSS) Observatory Network for Long Term Ecological Monitoring ROSELT).
Regional- Kenia IGAD, the Climate Prediction and Applications Centre (ICPAC) USAID Famine Early Warning Systems Network (FEWS NET).
Regional- Tunisia and Sahel
Observatory of Sahara and Sahel (OSS) Observatory Network for Long Term Ecological Monitoring ROSELT).
Regional- Botswana Southern Africa Regional Climate Outlook Forum (SARCOF) USAID FEWS NET SADC Climate Services Centre.
Regional- South Africa IGAD, the Climate Prediction and Applications Centre (ICPAC) USAID Famine Early Warning Systems Network (FEWS NET).
From the analysis of existing DEWS in Africa, the following conclusions can be drawn.
Monitoring systems in African countries are inadequate considering the variability of
precipitation and flow, sizes of catchments/aquifers and variability of geophysical conditions.
In addition, historical data is not readily available to users. There is a decline on the
meteorological stations due to high maintenance costs. Meteorological and hydrological data
networks are inadequate in terms of the density of stations for all major climate and water
supply parameters. Data quality is also problematic because of missing data or a short length
of record. Locally collected data is also useful for regional, continental and global forecasting
and early warning systems, but data sharing is inadequate between government agencies
and research institutions. High costs limits application of data in drought monitoring,
preparedness, mitigation and response. Rainfall, temperature data and the derived
parameters are costly, as the national meteorology agencies, which are public institutions,
charge high fees even if the data is required by education and research institutions. The

DEWFORA Project Report WP5 – D5.3
44
current approach to financing data collection is not appropriate. There is limited collaboration
with agencies such as NASA, NOAA, USGS, WMO,UN etc
The resources managed and the technology applied by drought monitoring and forecasting
systems are very diverse. Modelling and local knowledge systems applied to provide drought
early warning in Africa include global modelling systems, national modelling systems, local
knowledge systems and indices. There is experience in the application of temperature, SPI,
NDVI, land use/cover, solar radiation and other indices. NOAA forecasts and model
predictions from ECMWF, the UK Met Office and the ECHAM3 dynamical model are being
applied supported by radar and rain gauge measurements. There are challenges in
simplifying, downscaling and packaging information to address user preferences, the use of
language and media accessible to users. Hydrological drought forecasts are generated from
models which use historical inflow or statistical methods. These are set up for local
conditions. Other information used included consumption requirements for the main water
users, rainy versus dry days, vegetation health, groundwater levels and volumes of water
stored in reservoirs. Local knowledge systems are used widely as drought predictors. There
is limited use of atmospheric forcings, socio-economic parameters related to assessment of
drought impact, elevation or soil information.
Institutions are trying to collaborate to combine skills available to improving the quality of the
product. Effort has been made on water resources assessment in Africa and as well as
hydrological modelling, data acquisition and compatibility for the use with various models.
Spatial extent of drought is well documented at national and administrative scales. This is
informed by the need to map of drought impacts in terms of food shortage and people
affected. Mapping of drought at catchment scale, the unit used in water management is not
well documented. Seasonal forecasting tools which utilize atmospheric science may provide
more useful information for regional droughts than for catchments the unit used in water
management because they are not accurate enough for the requirements at this of scale. At
catchment and local scales, local knowledge systems seem to perform better however more
studies are required on this systems to create confidence in the scientific community.
In Africa the infrastructure is generally inadequate (equipment, computers, software, etc.)
although a few organisations such as the CSIR is South Africa are well equipped. In addition
financial resources are very limited. It is very difficult to recover costs for forecasting products
as they are generally free to those who want to take them up. The consequence is that
forecasting and early warning systems available in Africa are not adequately maintained;
recalibration and troubleshooting are inadequate.

DEWFORA Project Report WP5 – D5.3
45
The analysis of human resources showed limited availability of skilled scientists, technicians
and support staff to operate drought early warning systemsMore skilled people are needed in
Africa and this can be done through research programmes on analysis and interpretation of
information and development of usable products. So far, capacity building efforts have
proven inadequate. Capacity is required at all levels (researchers, meteorologists,
technology transfer, farmers, policy makers, communities, etc) for effective interpretation and
usage of forecasting and early warning products. The following levels not well represented
for monitoring and use of information:
Basin Authority
Headquarters
Regional support centres
River forecast centres
National centres
Climate centres
Workforce/extension officers
The limited involvement of scientist/specialists in Africa in designing and developing early
warning and forecasting systems means that local knowledge is not incorporated in “state of
the art”, which results in unreliable product downscaling to regional and local levels. There is
limited climate based monitoring, scientific analysis and research Funding for research
programmes especially on water resources assessment, hydrological modelling, water
accounting and data compatibility is inadequate.
5.1.2 Institutional analysis
Institutional analysis is important to understand the concept, to identify the institutions and
map them to ensure the relevance of subsequent drought management analysis. The
analysis aims to provide insights to the following key questions:
Are all stakeholders included into the network?
Do the organisations and institutions interact within a formal or an informal network?
Are there networks to provide communication and hierarchical flows of command?
What is the degree of influence and dependence of the stakeholders’ decisions on
the institutions’ core themes?
Many different institutional arrangements exist for drought mitigation and adaptation in Africa
and these are mainly at regional to national and local levels. The effort for effective drought
warning and mitigation involves all organizations and institutions related with the

DEWFORA Project Report WP5 – D5.3
46
management of water resources. The institutions are classified into policy-level institutions,
executive-level institutions, user-level institutions and the NGO’s institutions, at national,
regional, district and local levels. D2.2 identified the different types (distinguished by role) of
institutions involved in drought mitigation. The most common actions being agriculture
extension services, food aid, policy, advocacy and water supply. However the most common
institutions in the formal institutional frameworks for drought mitigation are agriculture
extension services, food aid, policy and funding; advocacy and water supply are excluded.
The most common drought mitigation actions include: food aid and drought relief programs,
growing of drought tolerant crops, saving livestock, improved water use efficiency, installation
of boreholes, wells and construction of small dams. In some cases, actions are activated by
triggers which are typically certain thresholds of drought indices.
The main direct users of drought early warning information in Africa include the following
(D2.3):
Hydrological Services
Research Agencies
Catchment Management Agencies/Water Authorities
Departments of Water – Water Resources Operation and Planning
Departments of Agriculture – directorates responsible for communicating drought
forecasts to users
Disaster Management Organisations
Municipalities/District councils – directorates responsible for communicating drought
forecasts to users
UN Agencies
Large irrigation water users
NGOs involved in drought monitoring and forecasting
USAID FEWSNET
In many occasions, agencies mandated to manage water, weather services and agriculture
interpret formal/scientific warnings for users. Drought monitoring and early warning
information is used for preparing and providing relief, lobbying for relief fund, estimation of
relief funds and for carrying out vulnerability assessment. NGOs often take over
responsibilities for drought mitigation but they have strong limitations. The sustainability of
NGO interventions is not guaranteed. NGOs often cover a very wide range of activities to
sustain themselves and they have limited personnel for extended programs. Their activities
are specific for a given project and area and funds rely on good will donations. As a result,
the NGO approach has engendered a culture of dependency from relief efforts.

DEWFORA Project Report WP5 – D5.3
47
There is generally a lack of urgency in responding to drought early warnings where they have
been issued. Users generally attribute this to the fact that the warnings do come with
information on what actions users should take. At the local level, poverty, lack of education,
lack of funds and political influence also have had negative impacts while at the national level
delays in decision making have been experienced.
It is evident from this study that early warning on food security to inform emergency food
relief is important in Africa. Famine early warning systems and networks across Africa are
coordinated by FEWSNET. These networks include regional, national and local vulnerability
assessment committees. FEWSNET publishes a monthly bulletin on food security. Remote
sensing and ground truthing techniques are applied in generating food security forecasts.
National MET provide weather forecasts as well as seasonal climate outlooks. Unfortunately
on drought early warning the application of seasonal and long range climate forecasts for
drought early warning still has a limited number of users. Most of the communication involves
forecast precipitation versus long term historical precipitation, as an indicator, SPI is not
widely applied. Forecasting precision decreases when the spatial focus is narrowed from
global, to regional, to national, to local levels.
In contrast to this, indigenous knowledge systems are applied widely. In most cases the lead
time for indigenous knowledge systems is very short. They typically detect the onset of
drought or whether a drought is being experienced already. However drought early warnings
from both formal and local knowledge systems do not provide adequate information on
duration, magnitude of drought as well as the spatial extent. Information from formal
knowledge system is too coarse for local application. The user response to early warning
from local knowledge systems is fine-tuned through historical experiences and in most parts
of Africa the history is quite long. As a result warnings and responses find expressions in
local language and customs. The forecasting precision of local knowledge system decreases
when the spatial focus is increased even at local levels.
The need to link formal systems to local knowledge systems is quite evident from this study
coupled with methods which allow learning and adaptation.
The description of models and data that are used to derive the drought early warning
information is very weak. This could be attributed to the limited time available for this study
which constrained data gathering to small samples for questionnaire surveys and a few
interviews. However, the low level of technical and scientific personnel in most of the
organisations issuing early warning products suggests limitations in application of methods,
tools and data. The scientific knowledge on drought forecasts obtained from atmospheric and

DEWFORA Project Report WP5 – D5.3
48
hydrological conditions and potential impacts needs to be considered in drought
management plans. This knowledge should be based on monitoring and prediction. The
information should be presented to stakeholders as an "integrated monitoring and early
warning" product and request their evaluation as an element of adaptation strategies. For
example, an ideal integrated monitoring and early warning product for agriculture should
incorporate information about climate, soil, water supply, and potential agricultural yields.
Ideally, information should be in the public domain and it should be sufficient to gauge the
level of risk and make informed decisions about the future
Table 2 shows an evaluation of the institutions strengths and weaknesses for implementing
or developing drought preparedness and management plans which include concrete
mitigation actions.
Table 2 Summary of the major issues identified in the analysis of institutional arrangements
Topic Relevant issues
Data and Information
Data networks are inadequate in terms of the density of stations. Worsening trend due to high maintenance costs. Limited availability and high cost of historical data Problematic data quality Current approach to financing data collection is not appropriate. Limited collaboration with international agencies (NASA, WMO, UN, etc)
Institutional Organization
Lack of structures for managing drought at the local level. Responsibilities divided among too many institutions. Lack of coordination and integration amongst institutions. Inadequate infrastructure: forecasting systems, models and software Lack of equipment and technology to generate reliable information
Institutional Performance
No clear drought management policies and drought mitigation plans Reactive drought management actions. Little activity on vulnerability assessment and management Inadequate spatial resolution of drought impact assessment Lack of technical capacity Insufficient human resources and inadequate training Inadequate financial resources. Funds rely on good will donations
User involvement
Many user types involved Public agencies interpret formal/scientific warnings for users Apart from NGO's, the involvement of the private sector is very weak NGO activities are specific for a given project and area Distribution networks are non-existent, they rely on government and other NGOs to implement programs
5.2 FINANCIAL AND LEGAL CAPACITIES
A financial and legal framework is required to:
d) Manage uncertainties associated with forecast information when applied at the local
level
e) Mobilize finances to support implementation of mitigation measures

DEWFORA Project Report WP5 – D5.3
49
f) Manage the legal consequences of lack of action or transfer of risks
It includes mechanisms to raise and distribute funds or materials (or food) and the laws and
by-laws to enforce certain human behaviour in order to obtain the desired outcomes or
prevent undesirable ones.
5.3 INSTITUTIONAL CAPACITIES
A clear institutional framework is important for assigning responsibilities for tasks to be
undertaken. The institutional framework includes policies and guidelines that make it possible
for people to intervene in an organised manner. An institutional framework is required to
undertake the following tasks:
f) Collect monitoring information from the local level and provide it to the forecasters at
national/global level;
g) To obtain user requirements;
h) To downscale and package forecast and early warning information to suit user
requirements;
i) To monitor performance of forecast and mitigation information, obtain user feedback,
and recommend updating of the information;
j) Facilitate the flow of information between the national and local level
A focus on vulnerability may prove to be very effective since it includes the evaluation of the
capacity to anticipate and compensate the adverse effects of drought.
5.4 WHERE ARE IMPROVEMENTS REQUIRED?
In D.2.4, an extensive analysis of gaps in existing drought monitoring and forecasting
systems in Africa was carried out. The analysis demonstrates that there is a disconnection
between the institutional responsibilities for drought monitoring, forecasting and early
warning in Africa and the end user requirements. There is also a disconnection between
available resources and responsibilities. “State of the art” suggests that improved distribution
of responsibilities as follows:
• Level 1: Institutions involved in monitoring but some also provide forecast information;
• Level 2: Institutions responsible for resources management, public services or Earth
observation;
• Level 3: Institutions that process data and provide information to the public.
Institutions that collate data and maintain databases also fall into this category;
• Level 4: Institutions that develop monitoring and forecasting methods and tools.

DEWFORA Project Report WP5 – D5.3
50
•
The institutional framework allows data to be passed to different institutions for value
addition. A framework to address user requirements for drought monitoring and early warning
was developed in D2.4. This framework recognizes that users require different types of
information but this has to be usable and timely. This imposes certain conditions on the
frequency and reliability of outputs from the monitoring and early warning systems. This
information is generated through application of models or tools on input data, which has to
be adequate, accurate and timely. Resources required to support this framework include
funding, policies, procedures, methods, people and infrastructure. The analysis is done by
focusing on the outputs, inputs and resources in order to understand the gap that exists
between different systems in Africa and with ‘state of the art” systems. The main
requirements of users of drought monitoring and forecasting systems in Africa based on
review of available literature and limited interviews can be summarised as follows:
Seasonal forecasts which means forecasts with a lead time of 2 to 5 months
depending on length of season;
Reliable data for each system, level or resource, which should be preferably from a
single source;
Evidence of success rate of forecasts based on history to improve confidence of
users should be included in forecasts;
Predictions should be available at local scale (forecasts should zoom to areas which
users can relate to);
De
cre
asin
g N
o. o
f in
stitu
tio
ns

DEWFORA Project Report WP5 – D5.3
51
Users have experience with occurrence of rainfall, therefore the spatial scale for
predictions should consider variability of rainfall;
Easy to understand information (communicate risks of forecast clearly to enable
users incorporate this information into their own risk management frameworks);
Drought forecasts should include recommendations on how users should respond;
A tool that translates forecasts into information on the availability of water in rivers
and dams.
In Africa, the number of users of “state of the art” outputs is very small. The main challenges
for drought forecasting and early warning systems in Africa are as follows:
Early warning information where it exists is delivered on an occasion basis. End users
do not get information in suitable format at the time they need it. Systems for
disseminating or delivery or exchange of information in a timely manner are not well
developed or inexistent, limiting their usefulness for decision support;
Early warning information is often too technical, limiting its use by decision makers
and farmers. End users are not involved in product verification. There are no
customer’s/users networks to ensure product verification and service feedback;
Early warning information is often unreliable on the seasonal timescale and lacks
specificity, reducing their usefulness for agriculture and other sectors;
Drought impact assessment methodologies are not standardized or widely available,
which limits the formulation of regionally appropriate mitigation and response
programs;
Drought indices are generally inadequate even for detecting the onset and end of
drought;
Integration of information into government structures is poor and focuses on
emergency response rather than long-term planning;
Users are not aware of the range of early warning products that they can use.
To improve drought mitigation and adaptation, attention is required on:
Training and public awareness campaigns especially in situations where the country
is approaching a drought season
Participation of stakeholders and water users
Spatial resolution of early warning systems and updating intervals e.g. seasonal
climate outlooks and monthly updates

DEWFORA Project Report WP5 – D5.3
52
Integration of scientific and local knowledge based drought forecasting and
monitoring systems
Effective transfer of information to policy-and decision-makers
Performance evaluation and institution capacitation at regional, national and local
levels
Improvement of link between relief efforts and development programmes
The existing institutional arrangements for drought mitigation in Africa offer following
opportunities:
The framework for mobilization of government agencies exists and substantial
resources can be brought together
Institutional structures for implementation of drought mitigation and adaptation
interventions exist
The need for strategies to mitigate drought is generally appreciated and the need for
drought early warning systems is also appreciated
Communities are engaged in activities to be able to survive future droughts and
climate change, depending on duration and magnitude of deficit. This is being done
through changes in processes, practices, and structures to moderate potential
impacts of future drought and
More institutions identified are not on the formal framework. This can be addressed in
the short term to improve integration.

DEWFORA Project Report WP5 – D5.3
53
6 HOW CAN SCIENCE BE TRANSLATED INTO POLICY?
A science-based approach for preparedness and early warning is the key for later
operational management and determines the success of the overall DEWS. The following
aspects need to be considered:
1. Definition of the actions to reduce social vulnerability (permanent measures).
2. Identification of the alert mechanisms/signals based on thresholds of indicators that
allow raking of risk levels in agriculture, ecosystems and water supply systems
We propose a science-based approach to identify alert mechanisms. For example, when
probability of drought damage exceeds a minimum threshold, mitigation actions are taken
and implemented (Figure 6-1).
Figure 6-1 Example for definitions of thresholds to trigger drought alert
Communicating probabilities is a difficult task. From the academic point of view, the
probability distribution functions (see example in Figure 6-2). Nevertheless, this is not
effective for communication with some stakeholders groups and the work in WP2 and WP6
need to provide insights on how to communicate probabilities in the various levels of
stakeholders involved in DEWS. The historical experiences of drought in D2.2 provide a
good benchmark for communicating impacts of future droughts. An effective way of

DEWFORA Project Report WP5 – D5.3
54
presenting the drought early warning is by a combination of maps, graphs, diagrams, tables
and animations.
Figure 6-2 Example of probability distribution functions of crop damage during drought
The challenge is to ensure that complex models are transparent and provide insight to users.
This will have to be analysed in the case studies.
Policy briefs developed in WP8 contain information on target groups, suggestions on most
suitable moment to communicate with them, form of brief (document, presentation and one
liners).
6.1 POLICY BRIEFS IN THE EUROPEAN CONTEXT
The main messages include out of scientific research which needs to be taken up by policy
makers such as:
- Improvement/strengthening of the skill of forecasting products, illustrated with
examples or with analogies
- Transfer of knowledge from Europe to Africa and from Africa to Europe
- More funding for research on certain emerging/promising topics for example
forecasting products
The following are the main targets:
1. European Commission; DG RTD, DG ENV, DG DEVCO and DG CLIMA 2. European parliament (eventually STOA) 3. UN; WMO in particular

DEWFORA Project Report WP5 – D5.3
55
6.2 POLICY BRIEFS IN THE AFRICAN CONTEXT
The main messages include out of scientific research which needs to be taken up by policy
makers such as:
- Institutional networks should be improved
- Data networks should be improved
- Early warning should be improved as well as mitigation actions
- Cooperation within Africa is essential
- Understanding and mapping of vulnerability/risks is indispensable to a better
preparedness
The following are the main targets:
- At continental level the main targets are; AU, AMCOW, AMCEN
- At the regional level at the level of technical groups the main targets are; RBO’s,
Economic zones (SADC, ECOWAS, IGAD, etc), NELSAP (Nile Equatorial Lakes
Subsidiary Action Program)
- National level; government ministries, department and agencies
- NGOs
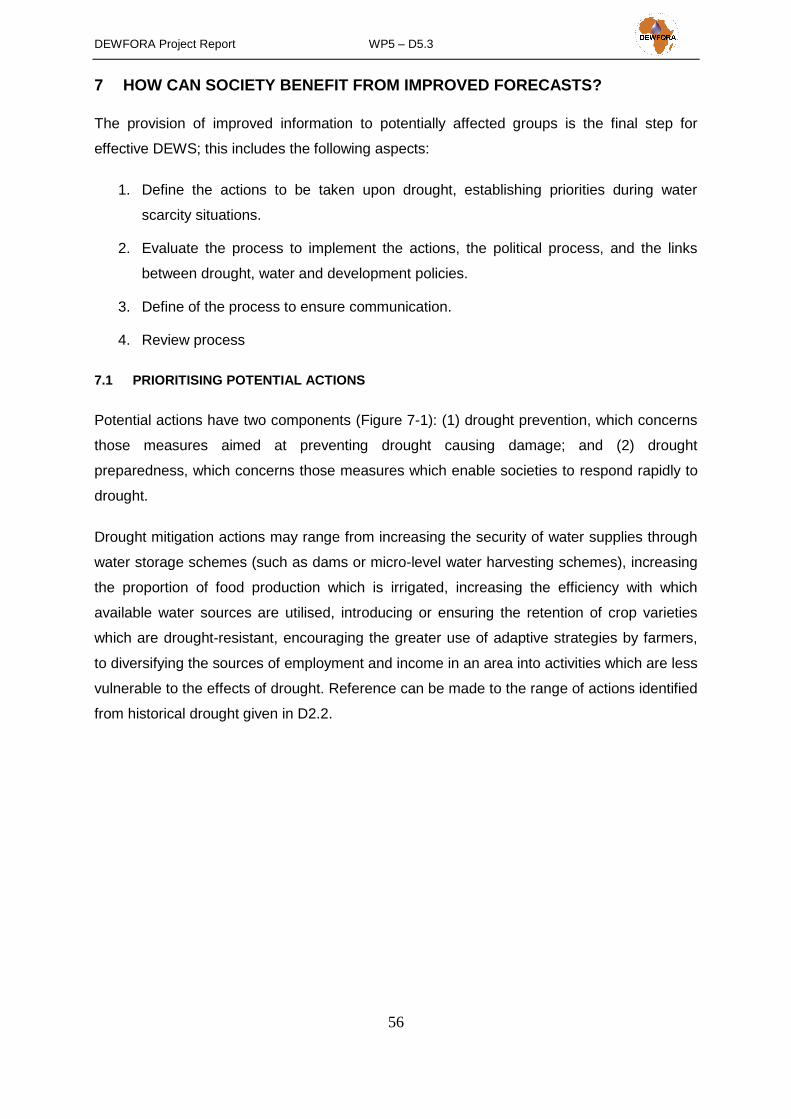
DEWFORA Project Report WP5 – D5.3
56
7 HOW CAN SOCIETY BENEFIT FROM IMPROVED FORECASTS?
The provision of improved information to potentially affected groups is the final step for
effective DEWS; this includes the following aspects:
1. Define the actions to be taken upon drought, establishing priorities during water
scarcity situations.
2. Evaluate the process to implement the actions, the political process, and the links
between drought, water and development policies.
3. Define of the process to ensure communication.
4. Review process
7.1 PRIORITISING POTENTIAL ACTIONS
Potential actions have two components (Figure 7-1): (1) drought prevention, which concerns
those measures aimed at preventing drought causing damage; and (2) drought
preparedness, which concerns those measures which enable societies to respond rapidly to
drought.
Drought mitigation actions may range from increasing the security of water supplies through
water storage schemes (such as dams or micro-level water harvesting schemes), increasing
the proportion of food production which is irrigated, increasing the efficiency with which
available water sources are utilised, introducing or ensuring the retention of crop varieties
which are drought-resistant, encouraging the greater use of adaptive strategies by farmers,
to diversifying the sources of employment and income in an area into activities which are less
vulnerable to the effects of drought. Reference can be made to the range of actions identified
from historical drought given in D2.2.

DEWFORA Project Report WP5 – D5.3
57
Figure 7-1 Potential actions that may be included in a DEWS
Priorities may be established based in on such concerns as feasibility, effectiveness, cost,
and equity. In choosing the appropriate actions, it might be helpful to ask some of the
following questions:
1. What are the cost/benefit ratios for the actions identified?
2. Which actions does the general public deem feasible and appropriate?
3. Which actions are sensitive to the local environment (i.e., sustainable practices)?
4. Are your actions addressing the right combination of causes to adequately reduce the
relevant impact?
5. Are your actions addressing short-term and long-term solutions?
6. Which actions would fairly represent the needs of affected individuals and groups?
A tool to rapidly assess the cost and benefits of mitigation actions should be implemented to
help give effect to the vulnerability assessments.

DEWFORA Project Report WP5 – D5.3
58
7.2 PROCESS TO IMPLEMENT THE ACTIONS
The following aspects may be considered on the implementation process:
1. Assess the availability of skilled human resources needed for drought preparedness
planning
2. Educate policy makers and the public on the need for improved drought
preparedness as an integral part of water resources management
3. Support creation of regional drought preparedness networks to enhance regional
capacity in sharing lessons learned
4. Enhance regional and international collaboration
5. Recognize the role of WMO, ISDR, NMHSs, and regional/national institutions in
drought early warning and preparedness
The implementation of drought mitigation actions should be embedded within existing
institutions.
7.3 COMMUNICATION
Effective communication and public participation will increase the quality and acceptance of
the DEWS, since this: (a) ensures acceptance of or trust in the science that feeds into the
planning; and (b) provides essential information and insights about drought preparedness,
since the relevant wisdom is not limited to scientific specialists and public officials.
Participatory methods, such as interactive approaches, or structured dialogues, are
recommended.
7.4 REVIEW PROCESS
Developing an effective framework for drought forecast, early warning which leads to timely
implementation of mitigation actions is not and end-to-end process, but needs to be revised
and reviewed in light of new science and evolving institutions and societies as well as
drought.
8 CONCLUSIONS
The framework for drought forecasting, early warning and mitigation in Africa proposed here
will assist in establishing policy priorities based on scientific evidence that also strengthen
existing institutions. Overall, a science-based approach is a useful guideline, but a number of
challenges are recognized. Risk-based approaches to preparing for drought are focused on

DEWFORA Project Report WP5 – D5.3
59
acquiring accurate probabilistic information about the events themselves. When this is not
possible, the strategy fails. In contrast, understanding and reducing vulnerability does not
demand accurate predictions of the incidence of extreme drought. Nevertheless, if may be
politically difficult to justify drought vulnerability reduction on economic grounds.

DEWFORA Project Report WP5 – D5.3
60
REFERENCES
1. Improved Drought Early Warning and FORecasting to strengthen preparedness and
Adaptation to droughts in Africa (DEWFORA), 2012, Deliverable 2.1 - Inventory of
Drought Monitoring and Forecasting Systems in Africa
2. Improved Drought Early Warning and FORecasting to strengthen preparedness and
Adaptation to droughts in Africa (DEWFORA), 2012, Deliverable 2.1: Inventory of
Drought Monitoring and Forecasting Systems in Africa
3. Improved Drought Early Warning and FORecasting to strengthen preparedness and
Adaptation to droughts in Africa (DEWFORA), 2012, Deliverable 2.2: Inventory of
Institutional Frameworks and Drought Mitigation and Adaptation Practices in Africa
4. Improved Drought Early Warning and FORecasting to strengthen preparedness and
Adaptation to droughts in Africa (DEWFORA), 2012, Deliverable 2.3: Drought Warning
and Response Experiences
5. Improved Drought Early Warning and FORecasting to strengthen preparedness and
Adaptation to droughts in Africa (DEWFORA), 2012, Deliverable 2.4: Gap Analysis -
Drought Monitoring and Forecasting Systems in Africa
6. Improved Drought Early Warning and FORecasting to strengthen preparedness and
Adaptation to droughts in Africa (DEWFORA), 2012, Deliverable 2.5: Gap analysis-
Drought Mitigation and Adaptation Practices and Organisational Structures for Drought
Management in Africa
7. Improved Drought Early Warning and FORecasting to strengthen preparedness and
Adaptation to droughts in Africa (DEWFORA), 2012, Deliverable D3.1: Conceptual
framework for definition of drought vulnerability across Africa
8. Improved Drought Early Warning and FORecasting to strengthen preparedness and
Adaptation to droughts in Africa (DEWFORA), 2012, Deliverable D3.2: Methods for
mapping drought vulnerability at different spatial scales
9. Improved Drought Early Warning and FORecasting to strengthen preparedness and
Adaptation to droughts in Africa (DEWFORA), 2012, Deliverable 3.3: Statistical and
dynamic downscaling of global climate model projections over Africa
10. Improved Drought Early Warning and FORecasting to strengthen preparedness and
Adaptation to droughts in Africa (DEWFORA), 2012, Deliverable 4.1: Meteorological
drought forecasting (monthly to seasonal forecasting) at regional and continental scale
ECMWF and CCAM meteorological data description
11. Improved Drought Early Warning and FORecasting to strengthen preparedness and
Adaptation to droughts in Africa (DEWFORA), 2012, Deliverable 4.2: Skill of the multi-
model forecasting system in predicting variables and drought indicators

DEWFORA Project Report WP5 – D5.3
61
12. Improved Drought Early Warning and FORecasting to strengthen preparedness and
Adaptation to droughts in Africa (DEWFORA), 2012, Deliverable 4.3: Potential to
supplementing drought early warning systems with new meteorological information
13. Improved Drought Early Warning and FORecasting to strengthen preparedness and
Adaptation to droughts in Africa (DEWFORA), 2012, Deliverable 4.4: Available
continental scale hydrological models and their suitability for Africa
14. Improved Drought Early Warning and FORecasting to strengthen preparedness and
Adaptation to droughts in Africa (DEWFORA), 2012, Deliverable 4.6: Statistical
analysis of natural climatic variability and hydrological parameters
15. Improved Drought Early Warning and FORecasting to strengthen preparedness and
Adaptation to droughts in Africa (DEWFORA), 2012, Deliverable 4.7: Downscaled and
tailor made hydrological models for the Limpopo and Niger case study basins
16. Improved Drought Early Warning and FORecasting to strengthen preparedness and
Adaptation to droughts in Africa (DEWFORA), 2012, Deliverable 4.10: Local scale
agricultural models for Limpopo and Oum-er-Rbia river basins
17. Improved Drought Early Warning and FORecasting to strengthen preparedness and
Adaptation to droughts in Africa (DEWFORA), 2012, Deliverable 6.2L: Limpopo River
Basin Case Study
18. Improved Drought Early Warning and FORecasting to strengthen preparedness and
Adaptation to droughts in Africa (DEWFORA), 2012, Deliverable 6.2OR: Oum Er Rbia
River Basin Case Study
19. Improved Drought Early Warning and FORecasting to strengthen preparedness and
Adaptation to droughts in Africa (DEWFORA), 2012, Deliverable 6.2NB Nile River
Basin Case Study
20. Improved Drought Early Warning and FORecasting to strengthen preparedness and
Adaptation to droughts in Africa (DEWFORA), 2012, Deliverable 6.2N Niger River
Basin Case Study
21. Improved Drought Early Warning and FORecasting to strengthen preparedness and
Adaptation to droughts in Africa (DEWFORA), 2012, Deliverable 6.5: Integration of
drought forecasting tools for Africa into the pan-African map server

DEWFORA Project Report WP5 – D5.3
1
ANNEX A
1 EVIDENCE FROM CASE STUDIES
Lead Author W R Nyabeze and Associates
Editing Author Ana Iglesias, UPM
Contributing Authors
J P Pêgo FEUP, University of Porto
R Maia FEUP, University of Porto
O Lahlou Institut Agronomique et Vétérinaire Hassan II
S. B. Alaoui Institut Agronomique et Vétérinaire Hassan II
Y Imani Institut Agronomique et Vétérinaire Hassan II
C Ndayisaba Institute of Scientific and Technological Research (Rwanda)
K Mahmoud Attia Nile Research Institute, Egypt
MWRI-NFC-NBCBN
UNESCO-IHE
W Nyabeze WR Nyabeze and Associates

DEWFORA Project Report WP5 – D5.3
2
1.1 INTRODUCTION
This Annex provides a summary of the main findings from the work carried out in WP2, WP3
and WP4 and consolidated on the case study basins in WP6 in order to provide the context
to apply the framework and guidelines for effective drought early warning and response in
Africa.
Figure 1-1 Contribution of WP2, 3, 4 and 6 to the framework for and guidelines for effective
drought early warning and response in Africa
2 CURRENT DROUGHT MONITORING AND FORECASTING CAPACITIES
(WP2)
2.1 DROUGHT MONITORING AND FORECASTING SYSTEMS IN AFRICA
The DEWFORA teams identified 138 drought monitoring and forecasting systems/ networks/
institutions and projects identified, 55 factsheets and 54 detailed descriptions completed. The
138 are spread as flows: global (18), Europe plus the African continent (2), Europe plus
Northern Africa(4) , Africa Continental (3), regional (8) and national (104).
At the global level and in USA and Australia there is the Global Drought Monitor, WATCH,
the National Drought Mitigation Centre (NDMC), the US Drought Monitor, the North American
Drought Monitor (NADM), the Drought Impact Reporter, the Seasonal Drought Outlook, the
National Integrated Drought Information System (NIDIS) and the CSIRO.

DEWFORA Project Report WP5 – D5.3
3
Those monitoring systems covering Europe and Africa Continental include the European
Drought Observatory and the EARS Energy and Water Balance Monitoring System
(EEWBMS). Those covering Europe and Northern Africa comprise EEWBMS,
XEROCHORE, AQUASTRESS, CIRCE and MEDROPLAN. Those covering the whole
continent of Africa include TIGER, the African Water Cycle Coordination Initiative and the
Experimental African Drought Monitor.
In Africa at regional level, in Tunisia covering the SAHEL- Observatory of Sahara and Sahel
(OSS) and the Observatory Network for Long Term Ecological Monitoring Écouter Lire
phonétiquement (ROSELT). In Kenya- IGAD, the Climate Prediction and Applications Centre
(ICPAC), the USAID Famine Early Warning Systems Network (FEWS NET). In Botswana –
the Southern Africa Regional Climate Outlook Forum (SARCOF), the USAID FEWS NET and
the SADC Climate Services Centre. In South Africa the USAID FEWS NET. In Burkina Faso
the USAID FEWS NET.
In Africa at national level there are Departments of Meteorological Services/Weather
Services , Hydrological Services, National Research Agencies, River Basin Forecasting
Agencies, Catchment Management Agencies/Water Authorities, Department of Water –
Water Resources Operation and Planning, Departments of Agriculture – directorates
responsible for communicating drought forecasts to users, Remote Sensing Organisations,
Disaster Management Organisations, Municipalities/District councils – directorates
responsible for communicating drought forecasts to users, UN Agencies ,NGOs involved in
drought monitoring and forecasting, USAID FEWSNET.
Modelling and local knowledge systems applied to provide drought early warning in Africa
include global modelling systems, national modelling systems, local knowledge systems and
indices. In Italy the Windisp is applied, Netherlands - RIBASIM - River basin modelling,
Europe - Agri4cast - Agricultural modelling, USA-Cropsyst - Agricultural modelling; SWAT ;
IHACRES - River system modelling; HEC-HMS - River system modelling, NOAA operational
environmental satellites, AVHRR-derived indices, Spain- AquaTool DMA, Algeria -Agro-
ecological Information system (SGIIAR), Morocco- SMAPS - Drought Early warning system
for Maghreb region; RAN, SPI,PDSI; Deviation analysis, decile analysis, surface water
supply index; Spatial assessment of drought hazard, drought vulnerability assessment and
mapping, Decision support system for agriculture (SAADA); Algeria, Morocco, Tunisia- SPI,
RA (Precipitation deviation/normal); actual water stress, VCI, TCI; SWSI, SWI; South Africa -
Long- lead forecasts, Decile rainfall, Water Satisfaction Index (WSI), NOAA NDVI, SPI, ZA
Model, SPATSIM - River basin information system and modelling, Water Resources Yield
Model (WRYM), Water Resources Planning Model (WRPM), PUTU Veld Production,

DEWFORA Project Report WP5 – D5.3
4
Hydrological Drought Assessment Model (HDAM) - Drought operating rules and forecast
trajectories, Flow deviation, Agricultural drought threshold, Southern Africa - Veld/Forest
Production, Insect Production
2.2 INSTITUTIONAL FRAMEWORKS
The experience of drought in Africa dates back many centuries but this study identified
specific drought years from around 1920s from readily available literature. Hit count of
drought reported somewhere for 1921/22 to 1950/51, up 10 successive seasons; 1951/52 to
1980/81-up to 10 successive seasons, 1981/82 to 2008/09 - up to 7 successive seasons
(Limpopo River Basin and Maghreb Region only).
Most common drought mitigation actions include food aid and drought relief programs,
growing of drought tolerate crops, saving livestock, improved water use efficiency, installation
of boreholes, wells and construction of small dams.
Many different institutional arrangements exist for drought mitigation and adaptation in Africa
and these are mainly at regional to national and local levels. Some frameworks are activated
by triggers which are typically certain thresholds of drought indices.
The main drought mitigations actions carried out are agriculture extension services, food aid,
policy formulation and provision of direction, advocacy and water supply.
Existing institutional frameworks for drought mitigation mostly involve institutions which
provide agriculture extension services, food aid, policy direction and funding. Water
Infrastructure Development and Management, Forecasting and Early Warning are missing.
Four different type of drought adaptation actions take place namely water infrastructure
development, water infrastructure development, agriculture extension services and policy.
Four different types (distinguished by role) of institutions are involved in drought adaptation
namely water infrastructure development, water infrastructure management, agriculture
extension services and policy.
2.3 EXPERIENCES IN EARLY WARNING
In general, local knowledge systems are used widely as drought predictors. Users of drought
early warnings include communities, government departments (main ones are water,
agriculture, fisheries and disaster management), Local government, Research agencies,
NGOs, UN agencies international cooperating partners. Agencies mandated to manage
water, weather services and agriculture interpret formal/scientific warnings for users.
DEWFORA Project Report WP5 – D5.3
5
Drought monitoring and early warning information is used for preparing and providing relief,
lobbying for relief fund, estimation of relief funds and for carrying out vulnerability
assessment.
Spatial extent of drought is well documented at national and administrative scales. This is
informed by the need to map of drought impacts in terms of food shortage and people
affected. Mapping of drought at catchment scale, the unit used in water management is not
well documented.
Seasonal forecasting tools which utilize atmospheric science may provide more useful
information for regional droughts than for catchments the unit used in water management
because they are not accurate enough for the requirements at this of scale.
At catchment and local scales, local knowledge systems seem to perform better however
more studies are required on this systems to create confidence in the scientific community.
2.4 GAPS IN THE MONITORING AND FORECASTING SYSTEMS
There is experience in the application of temperature, SPI, NDVI, land use/cover, solar
radiation and other indices. Other information used included consumption requirements for
the main water users, rainy versus dry days, vegetation health, groundwater levels and
volumes of water stored in reservoirs. There is limited use of atmospheric forcings, socio-
economic parameters related to assessment of drought impact, elevation, soil information,
satellite data including AVHRR, MODIS, GRACE, SRTM, AATSR and routing networks.
The main gaps arising from the current situation included:
- Limited skills scientists, technicians and support staff is a reality in many cases. At
the same time, the capacity building efforts are inadequate.
- Meteorological and hydrological data networks are inadequate in terms of the density
of stations for all major climate and water supply parameters. Data quality is also
problematic because of missing data or a short length of record.
- Data sharing is inadequate between government agencies and research institutions.
- High costs limits application of data in drought monitoring, preparedness, mitigation
and response. Rainfall, temperature data and the derived parameters are costly, as
the national meteorology agencies, which are public institutions, charge high fees
even if the data is required by education and research institutions.

DEWFORA Project Report WP5 – D5.3
6
- The forecasting and early warning systems available in Africa are not adequately
maintained; recalibration and troubleshooting are inadequate.
- The limited involvement of scientist/specialists in Africa in designing and developing
early warning and forecasting systems means that local knowledge is not
incorporated in “state of the art”, which results in unreliable products downs-calling to
regional and local levels.
- Locally collected data is also useful for regional, continental and global forecasting
and early warning systems. The current approach to financing data collection is not
appropriate. There is limited collaboration with agencies such as NASA, NOAA,
USGS, WMO,UN etc.
- Funding for research programmes especially on water resources assessment,
hydrological modelling, water accounting and data compatibility is inadequate.
- Limited climate based monitoring, scientific analysis and research.
- Capacity is required at all levels (researchers, meteorologists, technology transfer,
farmers, policy makers, communities, etc) for effective interpretation and usage of
forecasting and early warning products. The following levels not well represented for
monitoring and use of information: Basin Authority, Headquarters, Regional support
centres, River forecast centres, National centres, Climate centres, and
Workforce/extension officers.
2.5 GAPS IN THE INSTITUTIONAL STRUCTURE
The organizational structures in Africa are characterized by:
- LACK OF A DEPARTMENT THAT DEALS SPECIFICALLY WITH DROUGHT related issues and
lack of structures for managing drought at the local level. Responsibilities divided
among too many institutions with very little capacity. Lack of coordination and
integration amongst institutions involved in drought management resulting in
duplication of effort and conflict. The involvement of the private sector is very weak.
Inadequate infrastructure including drought forecasting systems, advanced models
and software and lack of equipment and technology to generate usable/credibility of
information. There is no clear drought management policies and drought mitigation
plans; Poor support for uptake of science at policy level. Finally, there is inadequate
financial resources , lack of technical capacity, insufficient human resources and
inadequate training and

DEWFORA Project Report WP5 – D5.3
7
- NGOS OFTEN TAKE OVER RESPONSIBILITIES FOR DROUGHT MITIGATION but they have the
following limitations. The activities are project area is specific and funds rely on good
will donations. NGOs often cover a very wide range of activities to sustain themselves
and they have limited personnel for extended programs. The sustainability of NGO
interventions is not guaranteed. The distribution networks and non-existent, they rely
on government and other NGOs to implement programs. There is inadequate spatial
resolution of drought impact assessment and sampling/selection methodologies are
generally weak and finally, the NGO approach has engendered a culture of
dependency from relief efforts.
- THE EXISTING INSTITUTIONAL ARRANGEMENTS FOR DROUGHT MITIGATION IN AFRICA
OFFER FOLLOWING OPPORTUNITIES: (a) The framework for mobilization of government
agencies exists and substantial resources can be brought together, (b) Institutional
structures for implementation of drought mitigation and adaptation interventions exist,
(c) The need for strategies to mitigate drought is generally appreciated and the need
for drought early warning systems is also appreciated, (d) Communities are engaged
in activities to be able to survive future droughts and climate change, depending on
duration and magnitude of deficit. This is being done through changes in processes,
practices, and structures to moderate potential impacts of future drought and (e) More
institutions identified are not on the formal framework. This can be addressed in the
short term to improve integration.
- TO IMPROVE DROUGHT MITIGATION AND ADAPTATION, attention is required on: (a)
Training and public awareness campaigns especially in situations where the country
is approaching a drought season, (b) Participation of stakeholders and water users,
(c) Spatial resolution of early warning systems and updating intervals e.g. seasonal
climate outlooks and monthly updates, (d) Integrating scientific and local knowledge
based drought forecasting and monitoring systems, (f) Effective transfer of
information to policy-and decision-makers, (g) Performance evaluation and
capacitation the institutions at regional, national and local levels, and (h) Improve link
between relief efforts and development programmes.
3 DROUGHT VULNERABILITY (WP3)
3.1 CONCEPTUAL FRAMEWORK
The methods for defining drought vulnerability across Africa on the DEWFORA study include
the following:

DEWFORA Project Report WP5 – D5.3
8
Most common indicators of drought hazard are Percentage of Normal Precipitation, SPI,
PDSI and, SWSI. Specific criterion is required for regional and local drought analysis. The
period of analysis depends on the characteristics of the system and the processes involved.
- Thresholds of indices are defined by comparing time-series of indices with drought
impacts.
- Drought characterisation requires information on duration, frequency, intensity, timing
of onset, extend and predictability.
- On evaluating vulnerability consider the following steps: (i) define hazard
(meteorological or hydrological etc); (ii) define the impacts in agriculture, water,
ecosystems, health, etc; (iii) define exposure (number of people affected); and (iv)
define coping capacity or adaptive capacity).
The applicability of these definitions is tested in the case studies and the results are applied
in early warning protocol in WP5. Indicators suggested for Case study areas:
- Oum-er- Rbia Basin: Streamflow, crop, yield, rainfall, adaptive capacity, exposure
- Niger River Basin: Precipitation, streamflow, reservoir operation, state of ecosystems,
adaptive capacity, exposure
- Limpopo River Basin: Precipitation, streamflow, crop, yields, management, rules,
institutional, response, adaptive capacity, exposure
- Eastern Nile Basin: Hydrological indicators, adaptive capacity, exposure
- Pan- African Level Extreme forecast indices, precipitation, SPI
3.2 MAPPING VULNERABILITY
Vulnerability assessment seeks to identify characteristics of the systems that modify the level
of risk derived from inadequate structures, management, and technology, or by economic,
environmental, and social factors.
At the framework level, drought risk analysis can relate hazard to vulnerability. Low hazard
and low vulnerability = no risk, high vulnerability and high hazard=high risk
When a forecast shows societal impacts then the early warning connects to vulnerability
assessment. Translation of forecasted variables into potential economic or societal impacts
becomes important. Impacts can be expressed as damages

DEWFORA Project Report WP5 – D5.3
9
The "coping range" of society may be described as the maximum perturbation form mean
conditions that can be accepted without significant damages.
When the expected value of damages exceeds a given threshold, some management
actions/interventions may be required to reduce the risk.
Patterns of drought vulnerability can be mapped using the following drought-related
indicators at a suitable spatial scale.
Indicators of adaptive capacity o conversely vulnerability include cultivated area, % of total
country area cultivated, Arable land, Area covered by permanent crops, Irrigation potential,
Irrigation potential as % of arable land, Population,% Rural Population, % Urban Population,
Population Density, % Total economically active population, % Total economically active
population in agriculture, Human Development Index, Agriculture Value added to GDP%,
access to water % of total population, access to water % population, urban and rural
population %, access to sanitation as % of population, urban and rural population %, Number
of dams, Total dam capacity, average annual precipitation, renewable water resources total
and internal, per capita renewable water resources, agricultural water use % of total, total
renewable/natural groundwater, infrastructure vulnerability index, storage as % of annul
renewable fresh water resources, storage drought index, vulnerability of the renewable
natural capital, vulnerability of the economic capital, vulnerability of civic and human
resources, vulnerability of infrastructure and technology.
3.2.1 Drought vulnerability index
- There are 28 global publicly available datasets with variables related to drought
vulnerability.
- To ensure that the DEWFORA research brings the state-of-the-art in drought related
research to the operational domain and provides viable and effective solutions with
direct applicability in Africa the following vulnerability indices are tested in the case
studies and the results are applied in early warning protocol in WP5:
- Oum-er- Rbia Basin: Streamflow, crop, yield, rainfall, adaptive capacity, exposure,
SPI, NAO? vulnerability
- Niger River Basin: Precipitation, streamflow, reservoir operation, state of ecosystems,
adaptive capacity, exposure, Predictive indicator? Coping capacity

DEWFORA Project Report WP5 – D5.3
10
- Limpopo River Basin: Precipitation, streamflow, crop, yields, management, rules,
institutional, response, adaptive capacity, exposure, social response
- Eastern Nile Basin: Hydrological indicators, adaptive capacity, exposure, SWSI and
ENSO, social response
- It is proposed that representative stakeholders be engaged in evaluating vulnerability
within the DEWFORA case studies. The stakeholders in each case study may be
engaged directly in the evaluation of vulnerability using a guideline developed on this
deliverable D3.2 (Table 5) to rank vulnerability and Table 6 to evaluate potential
impacts and causes of drought.
3.3 DOWN SCALLING GLOBAL MODELS
3.3.1 Current achievements include:
Coupled global climate models (CGCMs) have become the primary tools for the projection of
future climate change. Dynamic and statistical downscaling may be used to obtain more
detailed projections of future climate change for an area.
CGCM projections, such as those described in the Assessment Report Four (AR4) of the
IPCC, are currently the main source of information regarding plausible scenarios of future
climate change over southern Africa.
The Coordinated Regional Downscaling Experiment (CORDEX) is generating a large
ensemble of high-resolution projections of future climate change over Africa, using different
regional climate models from different institutions, downscaling the output of the CGCM
projections contributing to the Coupled Model Inter-comparison Project (CMIP5) and AR5.
Simulations are performed at a resolution of about 50 km.
Spatial resolution of CGCMs are of inadequate for studying regional impacts of future climate
change. Application of hydrological models over the Niger, Limpopo and Eastern Nile river
basins require resolutions as high as 8 km to provide adequate descriptions of the intensity
and spatial resolution of rainfall events for the forcing of hydrological models. dynamic
regional climate models (RCMs) applied over the area of interest include limited-area
models, which have fixed lateral boundaries, and variable-resolution global models.
With statistical down-scaling present-day relationships between large-scale circulation
patterns and near-surface variables such as rainfall remain stationary in time which may not
be valid, under conditions of enhanced anthropogenic forcing. Statistical downscaling

DEWFORA Project Report WP5 – D5.3
11
requires long time-series of observed records of sufficient quality, for the empirical
relationships to be established a severe limitation for most of Africa.
Although reliability of climate change projections can only be verified after several decades
confidence in the projections can be enhanced through the application and verification of
climate models at verifiable time scales for example inter-annul changes can be verified by
projections at seasonal time-scales. Successful replication of hind-cast trends can also
increase confidence in forecasts.
Traditional limited-area RCMs cannot be used as global models, whilst the majority of global
models cannot be applied as regional climate models (except for the computationally
expensive case of high-resolution global runs). Variable-resolution global models provide the
best framework for performing simulations across a range of spatial and time scales.
On DEWFORA a variable-resolution global atmospheric model, the conformal-cubic
atmospheric model (CCAM), is applied for both seasonal forecasting and the projection of
future climate change.
Downscaling of CGCMs using CCAM Multiple nudging: CCAM first integrated globally at 2
degree resolution, followed by 0.5 degree resolution simulations over Africa domain.
CRUTEMP3v linear temperature trend 1961-2010 - Strong warming has occurred over the
western and central parts of Southern Africa. Warming more moderate along the coastal
areas. Simulated annual temperature anomalies (1961 to 2100) relative to the 1961-1990
climatological average suggest more pronounced trends towards warming after 2013.
CCAM ens-ave projected change in annual temperature for 2071-2100 vs 1961-1990
suggests significant change in 75 percentile and 50 percentile temperature may be
experienced over most of Africa.
CCAM ens-ave projected change in very hot days for 2071-2100 vs 1961-1990 suggests
significant change in 75 percentile and 50 percentile very hot days may be experienced over
most of Africa
CCAM ens-ave projected change in annual rainfall for 2071-2100 vs 1961-1990 suggests
significant change in 75 percentile and 50 percentile annual rainfall may be experienced over
most of Africa
Malherbe et al. (2012) projected change in tropical cyclone and tropical low frequencies over
the South Western Indian Ocean and southern Africa, for 2071-2100 relative to 1961-1990
suggests weakening cyclones? General drying is projected over north-eastern South Africa

DEWFORA Project Report WP5 – D5.3
12
and the Limpopo River Basin during summer and autumn partially the result of the northward
displacement of tropical low and cyclone tracks over the southwestern Indian Ocean.
Rainfall anomalies over the Ethiopian Highlands vs SST anomalies in Nino 3.4 over the
pacific show a negative correlation.
3.3.2 The investigation in progress include:
Impact of enhanced anthropogenic forcing on the occurrence of meteorological and
hydrological drought over the Niger and Blue Nile river basins – very high-resolution
simulations (8 km in the horizontal).
Impact of ENSO on rainfall over the Eastern Nile basin, under both present-day and future
forcing.
4 FORECASTING (WP4)
4.1 METEOROLOGICAL DROUGHT
- DATASETS FOR ESTIMATION OF DROUGHT INDICATORS. The meteorological data
includes: (i) the European Centre for Medium/Range Weather Forecasts (ECMWF)
ERA-Interim (ERAI) reanalysis and long-range weather forecasts, and (ii) the Council
for Scientific and Industrial Research (CSIR) in South Africa conformal-cubic
atmospheric model (CCAM) seasonal forecasting system.
- DATASETS AVAILABLE. The following datasets are available from ECMWF from ERAI
global atmospheric reanalysis and long range forecasts:
- Atmosphere global forecasts. Forecast to ten days from 00 and 12 UTC at 16 km
resolution and 91 levels (in 2011/12: ~137 levels).
- Ocean wave forecasts. Global forecast to ten days from 00 and 12 UTC at 28 km
resolution.
- European waters forecast to five days from 00 and 12 UTC at 11 km resolution. 51-
member ensemble prediction system. To day 15 from 00 and 12 UTC (to day 32 on
Thursdays at 00 UTC, in 2011: also on Mondays + 46d on the 15th of each month );
32 km resolution up to day 10, then 65 km, and 62 vertical levels (in 2011: ~95
levels); 12 UTC with persisted SST up to day 15, 00 UTC with persisted SST up to
day 10 and then coupled ocean model (in 2011 coupled both at 00 and 12 UTC);

DEWFORA Project Report WP5 – D5.3
13
Coupled ocean has horizontally varying resolution (⅓ to 1°), 29 vertical levels (in
2011 new ocean model NEMO and NEMOVAR DA); Coupled wave model.
- Seasonal forecasts: Atmosphere-ocean coupled model. 41-member global forecasts
to seven months (in 2011: System 4); atmosphere: 120 km resolution, 62 levels
(80km, 91 levels); ocean: horizontally-varying resolution (⅓° to 1°), 29 levels (NEMO
and NEMOVAR); re-forecast suite: 11 members x 25 years (15 members x 30 years,
1981-2005).
- Reanalysis: Since January 1979 to present (near real time update); Atmosphere: 80
km horizontal resolution with 62 vertical levels; 6 hourly analysis, 12 hour 4D-Var
assimilation; 10 days forecasts (at 00 and 12 UTC).
- Two ensemble forecasting systems are currently operational at ECMWF: Variable
resolution ensemble prediction system (VarEPS) produces (i) weather forecasts out
to 32 days and (ii) seasonal forecasting produces forecasts out to 7 months.
- MEDIUM-RANGE. The time scale for medium-RANGE (up to day 15) and monthly (up to
7months) weather forecasting is too short for variations in the ocean significantly to
affect the atmospheric circulation, hence it is essentially an atmospheric initial state
problem, the ECMWF medium-range weather forecasting system is based on
atmospheric-only integrations. SSTs are persisted.
- SEASONAL FORECASTING are less problematic because of the long predictability of the
oceanic circulation (of the order of several months) and by the fact that the variability
in tropical SSTs has a significant global impact on the atmospheric circulation. Since
the oceanic circulation is a major source of predictability in the seasonal scale, the
ECMWF seasonal forecasting system is based on coupled ocean-atmosphere
integrations. Seasonal forecasting is also an initial value problem, but with much of
the information contained in the initial state of the ocean.
- MONTHLY FORECASTING SYSTEM: the system includes the following: The monthly
forecasting system comprised the medium-range VArEPS in ocean-atmospheric
coupled mode after day 10. The real-time VarEPS/monthly forecasting system is a
51-member ensemble of 32-day integrations. The first 10 days are performed at
0.28x0.28 degrees resolution forced by persisted SST anomalies (updated every 24
hours). After 10 days the model is coupled to the ocean model and has a resolution of
0.56x0.56 degrees. Drift is removed from the model solution during the post-
processing. The probability distribution function (pdf) of the model climatology is

DEWFORA Project Report WP5 – D5.3
14
evaluated to detect any significant difference between the ensemble distribution of
the real-time forecast and climatology. The climatology is a 5-member ensemble of
32-day VarEPS/monthly integrations, starting on the same day and month as the real
time forecast for each of the past 18 years.
- SEASONAL FORECASTING SYSTEM: The system includes the following. The principal aim
of seasonal forecasting is to predict the range of values which is most likely to occur
during the next season. The atmospheric component of the coupled model is the
ECMWF IFS (Integrated Forecast System) model version 31r1. The horizontal
resolution used for seasonal forecasts is 1.125x1.125 degrees. The seasonal
forecasts consist of a 41 member ensemble. The ensemble is constructed by
combining the 5-member ensemble ocean analysis with SST perturbations and the
activation of stochastic physics. The forecasts run for 7 months. A set of re-forecasts
(otherwise known as hindcasts or back integrations or just referred as climatology)
are made starting on the 1st of every month for the years 1981-2005. Use the
ECMWF data finder http://www.ecmwf.int/products/data/archive/finder.html to specify
data requests (without using the order function). Data are delivered in the GRIB
forma, use GRIB API3 to read, write and manipulate that data format under an
Apache Licence.
- The conformal-cubic atmospheric model (CCAM) is currently being run operationally
as seasonal forecasting system at the Council for Scientific and Industrial Research
(CSIR) in South Africa.
- CCAM is configured to generate a 28-year set of hindcasts as a result of forcing the
CCAM with predicted, as opposed to persisted, SST anomalies
- The ECHAM4.5-MOM3-DC2 (12 ensemble members; 74.25°S to 65.25°N) and
ECHAM4.5-GML-CFSSST (12 ensemble members; 46°S to 46°N) forecasts data sets
are available from January 1982 to present. The model data are obtained from the
data library of the International Research Institute for Climate and Society. The
observed SST data sets used are the 1°x1° resolution data of NOAA's OI.v2, and the
2°x2° resolution data of NOAA's NCDC ERSST version3b. A statistical model
(canonical correlation analysis – CCA) which uses the most recent 3-month mean
antecedent global ERSST field as predictor and the OI.v2 global SST as predicted
from the two CGCMs. The three models produce a 28-year set of retro-active SST
forecasts from 1982/83 to 2009/10 for lead-times up to 6 months. The retro-active
forecasts average the three global forecasts to produce an equal weights set of multi-

DEWFORA Project Report WP5 – D5.3
15
model forecasts. The same procedure is followed to produce forecasts operationally
every month. The operational forecasts and verification statistics are presented on
the website of the South African Risk and Vulnerability Atlas (http://rava.qsens.net/)
- The following drought indexes can be estimated using forecasts and reanalysis data:
SPI, PDSI, Standardized Evapotranspiration index, Standardized runoff index , Soil
Moisture index
- ERAI and GPCP precipitation datasets show good agreement in the mid-latitudes and
poor correlation over the tropical regions in terms of precipitation estimates and
spatial extent
4.2 SKILL OF THE FORECASTING SYSTEM
The application of seasonal prediction using coupled dynamical models to drought forecasts
is still in the early stages.
Observation-based precipitation datasets include: i) the Global Precipitation Climatology
Centre version 4 (GPCCv4); ii) the Climate Prediction Center (CPC) Merged Analysis of
Precipitation (CMAP); iii) the Global Precipitation Climatology Project versions 2.1 and 2.2
(GPCPv2.1/2) and; GPCC is only based in rain-gauges, while GPCP and CMAP blend data
from a variety of satellites and gauges.
- Quality and availability of precipitation datasets for drought monitoring in Africa;
- ERAI precipitation has limitations for drought applications, especially over the tropical
rainforest, because of drifts in the model climate. However, in the other regions, it
compares reasonable well with the remaining datasets and has the potential to be
used as a monitoring tool because of its near real time update (in contrast with the
other datasets). Furthermore, a robust evaluation of seasonal forecasts is dependent
on the verification dataset. Since there is no clear information on which dataset is
more reliable, the seasonal forecasts of precipitation were verified against GPCPv2.2.
- The ERAI configuration has a spectral T255 horizontal resolution (about 0.7°x0.7° in
the grid-point space) with 60 model levels. For comparison purposes the previous
ECWMF ERA40 reanalysis (Uppala et al. 2005) (1.125°x1.125°) was also included. A
k-mean clustering algorithm to GPCPv2.1 in order to identify regions with
homogeneous precipitation climatologies. The GCPC and CMAP datasets are
available in a 2.5°x2.5° latitude/longitude grid while the other datasets have higher

DEWFORA Project Report WP5 – D5.3
16
resolutions. There is a tendency of the reanalysis products (both ERAI and ERA40) to
overestimate precipitation in the tropical rainforests.
- Four global precipitation datasets over Africa and ECMWF reanalysis highlight the
uncertainty associated with accurate estimates of precipitation for verifying purposes.
- There is a high uncertainty of precipitation estimates over Africa. A robust evaluation
of seasonal forecasts is strongly dependent on the verification dataset.
CURRENT SKILL OF SEASONAL FORECASTS of precipitation in Africa has the following
characteristics:
- multi-model ensemble (MME) forecasts do not consistently outperform any particular
model. S4 is the only viable seasonal forecast system, produced by ECMWF, which
can be used in DEWFORA.
- It is not possible to predict the daily weather variations at a specific location months in
advance because of the chaotic nature of the atmospheric circulation. It is not even
possible to predict exactly the average weather, such as the average temperature for
a given month. Seasonal forecasts provide a range of possible climate changes that
are likely to occur in the season ahead. Seasonal forecast systems were taken from
the EUROpean Seasonal to Inter-annual Prediction (EUROSIP) archive at ECMWF.
- EUROSIP consists of 3 seasonal forecasting systems from ECMWF, Met Office and
Météo-France (see Vitart et al.(2007) for further details) namely S3, ECMWF S3-(11
ensemble members, hindcast 1981-2010, 1.125x 1.125 degrees, ECMWF S4-(15
ensemble members, hindcast 1981-2010, 0.7x0.7 degrees), and Météo-France MF--
(11 ensemble members, hindcast 1981-2010, 2.8x2.8 degrees), UK MET Office
System 3-(15 ensemble members, hindcast 1987-2008, 2.5x3.78 degrees), Multi-
model MM-(44 ensemble members, hindcast 1987-2008),
- Skill score calculation the reference forecast is taken from GPCPv2.2 as a random
sample of different years to produce a climatological forecast with the same
ensemble size has the system that is verified.
- The multi-model composite (MM) created by combining forecasts from several
different models tends to follow the best performing system in terms of the anomaly
correlation coefficient (ACC) and the continuous rank probability skill score (CRPSS).

DEWFORA Project Report WP5 – D5.3
17
- Forecasts perform better during El Nino and La Nina season than during neutral
years.
A case study of the integration of monitoring and forecasting for the recent 2010-11 drought
in the Horn of Africa. This includes the following characteristics: The 2010-11 drought in the
Horn of Africa resulted from a precipitation deficit in both the Oct-Dec 2010 and Mar-May
2011 rainy seasons, and this was captured by ERAI. Soil moisture anomalies of ERAI also
indentified the onset of the drought condition early in Oct 2010 with a persistent drought still
present in Sep 2011. The precipitation deficit in Oct-Dec 2010 was associated with a strong
La Niña event. The ECMWF seasonal forecasts of NINO3.4 predicted the La Niña event from
June 2010 onwards, and also a dry precipitation anomaly for the region from July 2010
onwards. On the other hand, the seasonal forecasts for the Mar-May 2011 season did not
predict the anomaly in advance, except for the forecasts in March 2011.
4.3 POTENTIAL IMPROVEMENTS TO EARLY WARNING SYSTEMS
- DATA. Drought monitoring relies on near real time observation of surface variables
such as precipitation. Observations can either be derived through the merging of
ground observations and remote sensing information or by using re-analysis tools. In-
situ observations and suitable forecasting models are required for most of Africa.
ERA Interim (ERAI) is the latest global atmospheric reanalysis covers the period from
1 January 1979 onwards (79x79km), and continues to be extended forward in near-
real time http://www.ecmwf.int/research/era. CAMSOPI is a merged dataset produced
by the NOAA Climate Prediction Centre (CPC) combining satellite rainfall estimates
from the Outgoing Longwave Radiation (OLR) Precipitation Index (OPI) with ground-
based rain gauge observations from the Climate Anomaly Monitoring System
(CAMS). CAMSOPI merged dataset is available from January 1979 (2.5x2.5 degrees)
at the CPC ftp site (ftp://ftp.cpc.ncep.noaa.gov/precip/data-req/cams_opi_v0208).
Global Precipitation Climatology Project (GPCP) version 2.2 monthly precipitation is
available since Jan 1979 to Dec 2010 on a 2.5x2.5 degrees grid. Is GPCP is
discontinued?
- METHODS. Integrated monitoring and forecasting system based SPI which uses
multiple globally available precipitation products (ERAI and CAMSOPI) and the
ECMWF Seasonal Forecasting System 4. The ERAI reanalysis is produced with a
sequential data assimilation scheme, advancing forward in time using 12-hourly
analysis cycles. In each cycle, available observations are combined with prior
information from a forecast model to estimate the evolving state of the global
atmosphere and its underlying surface. The basic upper-air atmospheric fields

DEWFORA Project Report WP5 – D5.3
18
(temperature, wind, humidity, ozone, surface pressure) are computed, followed by
separate analyses of near-surface parameters (2m-temperature and 2m-humidity),
soil moisture and soil temperature, snow, and ocean waves. The analyses are then
used to initialise a short-range model forecast, which provides the prior state
estimates needed for the next analysis cycle. ERAI archive http://data-
portal.ecmwf.int/data/d/interim_full_daily. 3-month SPI is associated with short- and
medium-term moisture conditions associated with seasonal estimations of
precipitation. However, a relatively normal 3-month period (or even wet) can occur
during a long drought spell. 6-month SPI is associated with medium-term
precipitation anomalies and is usually associated with anomalous stream flows and
reservoir levels. 12-month SPI reflects long-term precipitation patterns, that are
associated with changes to large reservoirs and groundwater. Drought monitoring in
Africa with ERAI is mainly possible outside the ITCZ. To be useful, near-real time
monitoring tools have to be carefully selected depending on region. It would be best
to use real rain gauge observations.
- SEASONAL FORECASTS. Seasonal forecasting provides a statistical summary of the
weather events occurring in a given time period. The principal aim of seasonal
forecasting is to predict the range of values which is most likely to occur during the
next season. The probabilistic Relative Operating Characteristics (ROC) score
calculated using the hit rate (HR) and false alarm rate (FAR) for forecasts is a useful
tool for drought detection/early warning. Most of the precipitation over the African
continent is controlled by the south to north and back displacement of the Inter
Tropical Convergency Zone (ITCZ), the intensity of the low level Tropical Easterly Jet
(TEJ) and the flow disturbances in the high level African Easterly Jet (AEJ). Rainfall
field over West Africa is characterised by a zone of maximum precipitation that
migrates north and south throughout the course of the year (Figure 2). This zone lies
to the south of the ITCZ. The variance spectra for rainfall in the LP shows the same
peaks found in the Southern Oscillation. Rainfall tends to be organized into
mesoscale convective systems. For drought applications the timing of the rainy
seasons, amount of precipitation and its interannual variability are important. In
figures 5 and 6 the critical part of the graph is the period October to April, begin the
graph in September/October to assist in the visual interpretation.(OR and LP).
- RESULTS FROM MERGING MONITORING AND SEASONAL FORECASTS. Precipitation
forecasts include:

DEWFORA Project Report WP5 – D5.3
19
- Seasonal forecasting in the South and North West of Africa shows good agreement
for all data sets, while there is a low agreement in Central Africa (between the +/- 20°
parallels).
- Seasonal forecasting in the Blue Nile, Limpopo and Upper Niger shows a higher
reliability and skill in comparison with the Congo and Oum er-rbia
- ECMWF seasonal forecasts (System 4) which became available in November 2011
has predictive skill which is higher than using climatology for most regions. The
seasonal forecast generates 51 ensemble members in real-time, with 30 years (1981-
2010, 15 ensemble members) of back integrations (hind-casts). The lead time is 7
months, including the month of issue..
- In the BN ERAI shows a significant overestimation and CAMSOPI is in good
agreement with GPCP annual cycle of precipitation.
- S4 forecasts overestimate precipitation in both BN and NG basins in the first forecast
month with a reduction of the peak rainfall with lead time, showing the impact of
model drift.
- In the CG basin, ERAI, CAMSOPI and S4 show an early peak rainfall in March
(GPCP in April) and a latter peak in November (GPCP in October). ERAI generally
overestimates precipitation in CG, while S4 overestimates its amplitude. From the
mean annual cycle analysis, CG basins appear as the most problematic with timing
errors in the rainy season, and amplitude problems in S4
- In the LP and OR basins all datasets show a reasonable agreement, with an
underestimation of the rainy season in OR, and S4 has a reduced drift on both
basins.
- In the BN and NG, the ERAI overestimation of precipitation is also reflected in higher
inter-annual variability, while in the CG and LP there is a good agreement between
ERAI, CAMSOPI and GPCP. The underestimation of precipitation during winter in OR
by all datasets is also associated with lower inter-annual variability. The changes in
variability with lead time in S4 are smaller than what was found for the mean annual
cycle of precipitation.
- In the BN and NG the temporal correlation of both ERAI and CAMSOPI compared
with GPCP decays with increasing SPI time-scale. In all basins, except OR, GPCP

DEWFORA Project Report WP5 – D5.3
20
has lower decay time scales and higher variance of white noise while ERAI has the
higher time scales and lower white noise variance.
- In the NG, both ERAI and CAMSOPI show an opposite trend to GPCP, with a wet
period until 2000 and severe and long term drought in the last decade.
- S4 precipitation forecasts in terms of the anomaly correlation coefficient (ACC) for the
ensemble mean in the BN, LP and NG basins have skill up to 3 months lead time for
the rainy seasons, while in the CG and OR basins S4 does not have skill.
- S4 outperforms the climatological forecasts (CLM) in the basins where the original
seasonal forecasts of precipitation have skill (Figure 15 lower panel). Namely BN, LP
and NG. In CG and OR, S4 has a similar skill to CLM.
- SPI FORECASTS, include:
- There is good agreement between the GPCP derived SPI at time-scales higher than
5/6 months, for all calendar months except July, when compared with river discharge
anomalies.
- SPI derived from ERAI and CAMSOPI compared with stream-flow shows much lower
or no-existent the correlations. This reflects the poor intra-seasonal to inter-annual
variability of precipitation of the ERAI and CAMSOPI datasets in the NG region
- Taking moderate to severe droughts with an SPI below -0.8, for the SPI-6 the ROC of
CLM is close to 0.5 (no information), while with S4 the ROC is higher close to 0.7 in
the BN, LP and NG, 0.6 in CG and 0.54 in OR. For the SPI-12 the ROC of CLM is
always above 0.5, since the climatological forecast inherits 6 months of monitoring. In
this case, it is difficult to beat the climate forecast, but S4 outperforms CLM in the BN,
LP and NG basins (as documented before).
- There is a significant drop in the ACC, especially in the BN, CG and NG basins,
CAMSOPI has problems in representing the intra-seasonal to inter-annual variability
of precipitation. These problems are present during the monitoring periods and are
extended to the forecast period. The quality of monitoring products is very important
as they control the skill of the SPI forecasts for accumulation time scales.
- Seasonal forecasts of the 1991/92 drought in the LP basin with different initial
forecast dates starting August 1991 to July 1992, comparing the SPI-12 from GPCP

DEWFORA Project Report WP5 – D5.3
21
(verification), CAMSOPI (monitoring) and the S4 and CLM forecast show that skill
improves around Nov –Dec for and CLM performs better from Dec onwards.
- The system 4 seasonal forecast has predictive skill which is higher than using
climatology for most regions (is this conclusion true?)
- In regions where no reliable near real-time data is available it is better to use just the
first month of the season to predict droughts
4.4 HYDROLOGICAL MODELS AVAILABLE
- SELECTION OF A SUITABLE HYDROLOGICAL MODEL, or a combination of models, for a
given objective (e.g. drought forecasting in Africa) should be carried out by assessing
various models using a set of criteria
- Global Land Surface Models (GLSMs) describe the vertical exchange of heat and
water
- Global Hydrological Models (GHMs describe water resources and lateral transfer of
water
- EU-WATCH1 project compared the simulation results of six GLSMs and five GHMs.
Runs for a baseline of 30 years and for two contrasting forecasted scenarios. The
models do not succeed in representing the water balance components in arid and
semi-arid basins where there was the largest coefficient of variation (CV) of the global
evaporation and runoff
- 5 GLSMs: (i) Variable Infiltration Capacity (VIC), (ii) Minimal Advanced Treatments of
Surface Interaction and Runoff (MATSIRO), (iii) Land Dynamics Model (LaD), (iv)
ORCHIDEE and (v) Hydrology Tiled ECMWF Scheme for Surface Exchanges over
Land (HTESSEL);
- The VIC model runs at a daily time step and is a gridded model with a spatial
resolution from 2x 2 degrees up to 1/16 x 1/16degrees but generally applied at a 0.5 x
0.5degrees resolution in the global scale, and it allows for subdivision of the grid cells
into a number of elevation bands permitting sub-grid variability in both precipitation
and temperature. The model has been applied for identifying regional-scale droughts
and associated severity, aerial and temporal extent under historic and projected
future climate in Illinois and Indiana, USA. A real time drought monitoring and
forecasting system for the Canadian Prairies, Lin (2010) uses the VIC model to

DEWFORA Project Report WP5 – D5.3
22
simulate daily soil moisture values starting from 1 January 1950 and is continually
running through present with a forecast lead time up to 35 days.
- MATSIRO runs at a daily time step and has a spatial resolution from a fraction of a
degree to several degrees latitude by longitude but is generally applied at a 1 x
1degree resolution when applied globally. The forcing data includes wind velocity,
temperature, humidity, pressure, incoming radiation and precipitation in a 6 hourly
time step. It uses a simplified TOPMODEL to calculate runoff…where has this model
been applied?
- LaD is a large-scale land continental water and energy balances model which may be
run either in stand-alone mode or coupled to an atmospheric model. It is generally
applied at a 1° x 1degrees resolution grid globally (but it can be applied at smaller
resolutions). The energy, soil water, and snowpack equations are solved in an hourly
time step and the groundwater equation in a daily time step. LaD was calibrated on
nine basins in the north-eastern United States and the Niger River basin in the Sahel
region.
- ORCHIDEE solves both the energy balance (on a 1x 1 degrees grid boxes, which is
the scale of the forcing used) and the hydrological balance (on a smaller scale) in a
time step of 30 min. River flows are computed through basins defined at a 0.5 x 0.5
degree scale. In the semi-humid basins, ORCHIDEE overestimates river discharges
by 20-50%, in intermediate basins it underestimates it by 30-60% and semi-arid
basins ORCHIDEE overestimates river discharges.. …where was this model applied?
- HTESSEL has a flexible spatial resolution, depending on the input resolution, and it
has been applied globally with a resolution of 0.5°. The model runs with a time step of
one hour forced with sub-daily (6 hourly or less) near surface meteorology and
surface fluxes. HTESSEL is part of the integrated forecast system at ECMWF with
operational applications ranging from the short-range to monthly and seasonal
weather forecasts. …where has this model been applied?
- 11 GHMs: (i) WaterGAP, (ii) PCR-GLOBWB (iii) Macro-scale-Probability-Distributed
Moisture Model (Mac-PDM), (iv) Water Balance Model (WBM, (v) Lund-Postdam-
Jena model (LPJ), (vi) Soil and Water Assessment tool (SWAT), (vii) SWIM, (viii) HBV
(ix) Global Water Availability Assessment method (GWAVA) (x) WASMOD-M and (xi)
LISFLOOD

DEWFORA Project Report WP5 – D5.3
23
- WaterGAP comprises two main components: a Global Hydrology Model and a Global
Water Use Model.It has a spatial resolution of 0.5 x 0.5 degrees and covers the
global land area. Calculations are performed with a temporal resolution of one day for
which synthetic daily values are generated. WGHM has been tuned for 724 drainage
basins worldwide, but resulting discharges where overestimated in some basins.
These are often located in arid and semiarid areas. WaterGAP demonstrated a
reasonable performance in simulating timing and magnitude of average monthly and
low flow values in Europe
- PCR-GLOBWB is a grid-based model of global terrestrial hydrology. It is essentially a
leaky bucket type of model applied on a cell-by-cell basis. The model calculates for
each grid cell (0.5 x 0.5 degrees) for a daily time step. PCRGLOBWB was used to
simulate the discharge with a GCM ensemble mean as forcing data. The resulting
discharges were compared with the Global Runoff Data Center (GRDC) discharge
data.
- Mac-PDM is usually run at 0.5 x 0.5 degrees spatial resolution, but it has been run at
resolutions ranging from 10 x10 min to 2 x 2 degrees. It extends the basin-scale PDM
(Probability Distributed Moisture Model) and can be forced with daily or monthly input
data
- The WBM simulates grid cell (0.5 x 0.5 degrees) level hydrology associated with long-
term climate. The model is deterministic and employs a monthly time step The WBM
is insensitive to precipitation in arid regions and it performs most poorly in extremely
dry regions where rapid rain events may have the ability to produce substantial runoff.
- LPJ is a dynamic global vegetation model that simulates the coupled terrestrial
carbon and water cycle. The simulations are driven by gridded monthly fields (in
general a 0.5x0.5 degrees resolution. Results compare favourably with WBM, Macro-
PDM and WaterGAP. Overestimations occur in semi-arid and arid regions,
particularly in northern Africa, parts of South America and India. LPJ as well as the
three hydrological models overestimate year round runoff in Africa.
- SWAT is a continuous time model and operates at a daily time step but the output
can be aggregated and printed at a daily, monthly, or annual time scale. The
modelled area can be divided into multiple sub-basins It has been applied for the
whole Africa with monthly resolution, and calibrated and validated it at 207 discharge
stations across the continent.

DEWFORA Project Report WP5 – D5.3
24
- SWIM is a GIS-based tool for hydrological and water quality modelling in mesoscale
watersheds (from 100 to 10,000 km2) which was based on two previously developed
tools: SWAT and MATSALU. The model operates on a daily time step.
- HBV is a conceptual hydrological model extensively used in operational hydrological
forecasting and water balance studies. The model has been applied in a wide range
of scales without modification of it structure. Climatic inputs are on a daily time step,
and daily or monthly estimates of potential evaporation. Basins are separated into a
number of sub-basins. The HBV was developed for humid temperate conditions, it
has also been used successfully in semi-arid and arid countries such as Australia,
Iran and Zimbabwe with modifications to include interception which is important for
semi-arid basins.
- GWAVA typically operates on 0.5 x 0.5 or 0.1 x 0.1degree grid and is driven by
monthly climate data. Model outputs include simulated monthly flows and a cell-by-
cell comparison of water availability. It has been applied to Eastern and Southern
Africa, West Africa, the Caspian Sea basin, South America, and the Ganges-
Brahmaputra basin, and is currently being applied to Europe. On the PROMISE
project, GWAVA was set for the West African region, including 22 countries and a
wide range of hydrological regimes and climates. A reasonable degree of calibration
against observed flows was attained.
- WASMOD-M model is a distributed version of the monthly catchment model
WASMOD and is driven by time series of monthly climatic data on a 0.5 x 0.5
degrees grid. It generally runs on a monthly or annual time step, and there is a daily
version of WASMOD- M.
- LISFLOOD is a GIS-based hydrological rainfall-runoff-routing model (implemented in
the PCRaster Environmental Modelling language, wrapped in a Python based
interface) which is capable of simulating the hydrological processes that occur in a
catchment. LISFLOOD is grid-based, and applications so far have employed grid
cells of as small as 100 metres for medium sized catchments, up to 5000 metres for
modelling the whole of Europe.
- ASSESSMENT OF MODELS, include:
- Evapotranspiration, soil moisture changes, groundwater flow and surface water-
groundwater interactions including wetlands are important for most catchments in

DEWFORA Project Report WP5 – D5.3
25
Africa. The existing models are dominated by different processes and therefore show
significant differences in their water-balance components and response to events.
- Differences in results suggest the need to use multiple hydrological models
- In Africa there are many regions with a lack of good precipitation observations, and
this is a limiting factor to application of data intensive models..
- MODEL SELECTION QUALITATIVE CRITERIA using available literature.
- Represented processes and fluxes: Interception , Evaporation, Snow, Soil ,
Groundwater, Runoff, Reservoirs, Lakes, Routing, Water use, Energy balance and
Calibration parameters
- Model applicability to African climatic conditions and physiographic settings:
Applicability of the model in semi-arid regions
- Data requirements and resolution of the model (spatial and temporal resolution)
Meteorological, Spatial Temporary. A fixed grid size and fixed basin sizes can limit
model applicability. Model should be scalable
- Capability of the model to be downscaled to a river basin scale
- Operational model for drought early warning system at large scales
- Open source model is preferred
- Models should be continuous in time i.e. not event models
- Models should be well documented
- More rigor is required on assessment of models on status of documentation on
models, available data vs data requirements, ability to provide useful output for
specific hydrological drought conditions and specific characteristics of focus areas,
development status of model, open source vs proprietary software
- PCR-GLOBWB, GWAVA, HTESSEL, LISFLOOD and SWAT show higher potential
and suitability for hydrological drought forecasting in Africa

DEWFORA Project Report WP5 – D5.3
26
4.5 STATISTICAL ANALYSIS OF NATURAL CLIMATIC VARIABILITY AND HYDROLOGICAL
PARAMETERS
4.5.1 Data sources
- Runoff - Global Runoff Data Centre (GRDC, http://www.bafg.de/GRDC), ARA-SUL -
Mozambique and South Africa - the Department of Water Affairs
(http://www.dwaf.gov.za/Hydrology/).
- What are the flow station names for priorities 1, 2 and 3 and the attitude and
longitude attributes?
- Catchment boundaries and rivers - HydroSHEDS data set
(http://hydrosheds.cr.usgs.gov/).
- Countries - Global Administrative Areas database version 2.0 (GADM,
http://www.gadm.org/) and the CIA World Data Bank II
(http://www.evl.uic.edu/pape/data/WDB/).
- ERAI sea surface temperature (ERAI –SST) and HADSST2 sea surface temperature
anomaly data sets
- Southern Oscillation Index (SOI), ENSO indexes (ERSST), ENSO indexes (OISST),
Darwin sea level pressure (SLP),Tahiti SLP, North Atlantic Oscillation (NAO),
Oceanic Nino Index (ONI) - Climate Prediction Center of NOAA
http://www.cpc.ncep.noaa.gov/
- Indian Ocean Dipole Mode Index (DMI),- Based on NOAA OISST Ver.2 -
http://www.jamstec.go.jp/frcgc/research/d1/iod/DATA/dmi.monthly.ascii
- Trans Nino Index (TNI), NINO3.4 (HadSST) -:
http://www.esrl.noaa.gov/psd/gcos_wgsp/Timeseries/Data/
- Statistical programming performed with R
4.5.2 Validation of SPEI with NDVI
- In Southern Africa, most of the severe droughts are associated with El Nino (Rouault,
2005).The area has regions of very different climatology and ecology, it can be
misleading to compare rainfall deficit as a measure of drought.(SPI and the
Standardized Precipitation Evapotranspiration Index (SPEI) are better drought
indicators How well does SPEI represent the drought impact on vegetation?

DEWFORA Project Report WP5 – D5.3
27
- NDVI is affected by many ecological factors including water availability. NDVI
response is expected when the water deficit reaches a certain minimum threshold,
depending on vegetation type, time of the season etc. Analysing the relation of
vegetation status and water deficit locally can improve drought warning systems by
providing information on how drought indexes can be interpreted locally.
- There are strong differences of the correlation of SPEI3 and NDVI throughout the
Limpopo basin. High correlations are found in south eastern transect whereas the
correlation in the north east and in the southwest are lower. Low correlations can be
caused by intense irrigation within a grid cell, and/or vegetation types.
- In the Limpopo River Basin, below a value of SPEI < -1 vegetation is affected by
drought and this can be used as drought threshold in drought early warning.
However further research is required to develop a framework which incorporates such
relationships to identify potential thresholds.
4.5.3 Variability of spatial drought patterns
- Spatial variability of meteorological drought within the Limpopo basin was analysed
using principal component analysis on SPI3 and SPEI3
- Of 334 PCs on SPEI3, 13 explained 91 % of the total variation. Of these only the first
6 PCs sum up to 78 % of total variance.
- PC 1 shows a drought pattern with a strong south-western gradient. PC 2 shows an
orthogonal north-western gradient but also has negative values along the coastline in
the East. PC1 and PC2 account for 53 % of the total variation.
- PCs 3 to 5 contribute 8 %, 7% and 5 % to the total explained variation and exhibit
more complex patterns. All three show patterns that divide the region in three.
- PC 5 had the highest correlation with all the climate anomaly indexes.
- SPI calculated for the Limpopo basin shows low correlation with atmospheric
anomalies
- Two important aspects of teleconnections not considered in the analysis (i) sea
surface temperature and (ii) time lag these need further investigation

DEWFORA Project Report WP5 – D5.3
28
- To identify teleconnected regions, the loadings were correlated with sea surface
temperature. The ERAI -SST and the HADSST2 sea surface temperature anomaly
data set were applied.
- These results support two conclusions: (i) the dominating spatial patterns cannot be
linked to specific climate anomalies. Every drought event very likely is a unique
combination of many factors of influence.(ii), promising regions of SST were
identified, which are potential predictors, as they exhibit lead times for the Limpopo
region precipitation.
TEMPORAL VARIABILITY. wavelet analysis decomposes a time series data into its frequency
components
4.5.4 SPI analysis
- SPI was considered as SPEI requires estimates of evapotranspiration (ETp) which
were not available.
- With higher aggregation order, the SPI time series show less power (on the wavelet
power spectrum) in shorter periods. For example, the SPI1 time series has events
within the low 4 to 16 months periodicity range, which are no longer present in the 18
month aggregation SPI. SPI aggregation has an effect similar to a moving average.
- SPI1 and SPI18 have power in the higher period range of 32 to 64 months. The
longer periodicity is visible in the SPI18, but not in the SPI1
4.5.5 Standardized runoff index time series.
- Runoff stations with complete and long records and minimum catchment >=4000 km²
in the Limpopo River Basin were applied.
- In Crocodile River the decrease in runoff was also very strong between 1985 and
1995
- There was also a change in frequency during these periods. Periods with high power
in the 16 to 32 month band were observed. Low power was observed during the 80s
and early 90s except for Mogalakwena River which retained power in the 32 month
band. This could be connected to a change in the atmospheric systems’ dynamic
4.5.6 Wavelet coherency analysis.
- The analysis shows the frequencies that two time series have in common over time

DEWFORA Project Report WP5 – D5.3
29
- South Africa experienced severe drought during the years 1983, 1987, 1992 and
1998. These drought events also coincided with El-Nino phases. Wavelet coherence
analysis shows that SPI3 shares signal properties with ENSO of periods between 2
and 4 years. Furthermore, these frequency coherencies are out of phase for the two
time series.
- The power of frequency coherencies is not stable and changes over time and from
one event to another. For 1987, ENSO and SPI3 time series show coherence power
over a period range from 0.5 to 4 years. The 1992 drought shows a special wavelet
coherence pattern with a distinct band of 4 years
- Oceanic Nino Index (ONI) has no power earlier than 1995 and later than 1995 this
gap is narrowing. Consistent bands of frequency coherence with ONI – if present at
all – are often interrupted during the period of 1985 to 1995. NINO 1.2 has power in
the 4 to 5 years band earlier than 1995, which disappears thereafter. This suggests
that different sea surface regions can complement each other.
- It is common to most wavelet coherence power spectra of runoff and climate anomaly
indexes to have more segregated patterns than reanalysis precipitation. The Pienaars
and Crocodile Rivers runoff has strong power on a band of approx. 8 years with the
ONI index. During the 1985 to 1995 period the coherence is broken. Several events
in the late 70 and late 90 show coherence with ONI in shorter periods of 4 years. The
Crocodile River shows the same property in the late 90ies with coherence power over
a wide range of periods. The Mogalakwena River shows power on a longer period
and high power in late 90s and it also has coherence power in lower periods during
the early 80s
- The Chokwe station in Mozambique SRI has high power on the 16 years band.
During the 70s it also exhibits high power over a wide range of periods between 2
and 5 years but in the period between 1985 and 1995 the coherence band is changed
and narrowed
- Atmospheric anomalies are known to cause drought they are at the heart of various
statistical methods of rainfall prediction. This work serves as preliminary analysis to
assess the complexity of drought variability.
4.5.7 Conclusions
- The following conclusions emerge from this work:

DEWFORA Project Report WP5 – D5.3
30
- The signals available for temporal variability of runoff and precipitation showed
inconsistent properties.
- Frequencies present in the signals had only little consistency in time and space. The
period 1985 to 1995 is marked by strong changes in precipitation total and signal
properties.
- Some flow stations seemed to be disconnected of the ENSO during this period and
signal properties strongly differed between runoff stations, which indicates that every
sub-catchment has local factors that affect rainfall anomaly and some regions can be
affected more by an anomaly and others less.
- Prediction models have to able to deal with nonlinear and interacting relationships
with climate anomalies. Neither could certain anomalies be associated with spatial
patterns nor could certain anomalies be isolated. It is very likely that every drought
event is caused by a unique combination of different atmospheric anomalies
- Correlation and wavelet analysis were important methods but correlations between
variables do not imply a causal link. Rather, causally linked variables are likely to be
correlated. Hence, correlation can only serve as an indication of a potential causal
and above all linear link. The same is valid for wavelet coherence analysis. Wavelet
coherence does not imply a causally linked relationship, nor single event wise
coherences, they only highlight signal similarities in frequency space. This can only
be taken as an indicator for relationships between variables.
- Methods applied such as Wavelet analysis algorithms require complete records and
cannot deal with missing data
4.6 DOWNSCALED AND TAILOR MADE HYDROLOGICAL MODELS FOR THE LIMPOPO AND
NIGER CASE STUDY BASINS
4.6.1 Limpopo River Basin data sources
- Digital Soil Map of the World (FAO 2003), soil types extrapolated to 0.05˚ x 0.05˚ grid
cell
- Vegetation types from GLCC version 2 (USGS EROS Data Center 2002) divided into
three categories: natural vegetation, rainfed crops and irrigated crops, where each
category was subdivided into tall and short vegetation.

DEWFORA Project Report WP5 – D5.3
31
- A climatology of crop factors for the different land surfaces come with PCR-GLOBWB.
Leaf Area Index (LAI) per type for dormancy and growing season obtained from
Hagemann et al. (1999). An empirical relation by Allen et al. (1998) was used to
convert the LAI to crop factors.
- Irrigated area within each cell, water requirements and irrigation cropping patterns
extracted from the "Global map of irrigated areas" and FAO 1997
- DEM produced from the Hydro1k Africa (USGS EROS Data Center 2006) and
upscaled to the model resolution of 0.05˚
- ERA-Interim precipitation data corrected with GPCP v2.1
- The reference potential evaporation was computed form the recalibrated form of the
Hargreaves equation Sperna Weiland et al. (2012).
- SRI computed using the software SPI SL6 developed by the National Drought
Mitigation Center (NDMC) at the University of Nebraska-Lincoln, US
(http://drought.unl.edu/MonitoringTools/DownloadableSPIProgram.aspx).
4.6.2 Limpopo River Basin Methodology
- PC Raster Global Water Balance Model (PCR-GLOBWB) is applied.-model
parameters are assumed to be correct based on the best available input data. The
difference that different ensembles of meteorological forecasts may bring in
hydrological model results can be expected to dominate any gains that may be
achieved by calibrating the model with one set of historic data.
- New development includes an irrigation scheme to account for the highly modified
hydrology in the Limpopo river basin. The model is set up for a spatial resolution of
0.05 x 0.05 degrees downscaled from 0.5 x 0.5 degrees and simulation is carried out
for a 32 year-period on a daily time step
- Part of groundwater drained by surface water, is computed by assuming a linear
relationship between the storage and outflow. Groundwater residence time depends
on the saturated hydraulic conductivity of the aquifer the drainage porosity, the
aquifer depth, and the drainage length.
- River routing is based on the kinematic wave approximation of the Saint-Venant
Equation.

DEWFORA Project Report WP5 – D5.3
32
- Floodplains and through-flow wetlands are treated as regular river stretches except
that flooding spans through the entire floodplain normally with higher resistance,
which is defined in terms of Manning’s n separately for the river bed and floodplain.
- Areas of lakes and floodplains are kept constant while routing.
- Irrigation water requirement for a cell is supplied through the storage of freshwater in
the cell and groundwater extraction for irrigation is not considered but is feasible if
information is available
4.6.3 Limpopo River Basin Results
- Output included actual evaporation; soil moisture; surface and subsurface runoff, river
discharge, root stress, water storage in the three layers etc.
- Standardized Runoff Index (SRI) was impossible for gauge stations in the Limpopo
River Basin to compute SRI because the runoff data was not continuous the required
period of at least 30 years. Missing data reduces continuous measured data in
general to about 10 years.
- Streamflow Drought Index (SDI) applies estimates of natural logarithms of cumulative
streamflow with mean and standard deviation. Indices ranging from 0.0 (no drought)
to -2.0 (extreme drought). The SDI allows the computation even if there are missing
values.
- Similar SDI and SRI were obtained for 6 and 12 months, most flow occurs in the first
6 wet months of the hydrological year. In both cases the major droughts appear to be
identified reasonably well (1982-83, 1991-92) with SDI and SRI values smaller than -
1.5. Extremely wet year of 2000 is very visible with SDI and SRI higher than 2.0.
- Check cumulative runoff to complement Figures 2-14 to 2-18. Check fit for deferent
flow percentiles separately (<=10%MAP, 10%MAP-25%MAP, 25%MAP-MAP, >MAP)
–Fig 2-19 to 2-23. Check fit for deferent flow percentiles separately (<=10%MAR,
10%MAR-25%MAR, 25%MAR-MAR, >MAR)
4.6.4 Niger River Basin Data
- Digital elevation model of adequate resolution

DEWFORA Project Report WP5 – D5.3
33
- WATCH is a global sub-daily meteorological forcing dataset as derived from the ERA-
40 reanalysis for period mid-1957 to 2001. ECMWF and CCAM weather forecast
products
- CRU TS2.1 Climate Research Unit gridded flow station observations
- Digital Soil Map of the World (FAO et al., 2009)
http://www.fao.org/geonetwork/srv/en/metadata.show?id=14116&currTab=distribution
- Harmonized World Soil Data Base v1.1http://www.iiasa.ac.at/Research/LUC/External-
World-soildatabase/HTML/index.html
- GPCC product v4monthly precipitation observations
- 88 rainfall stations from the DNM (Direction Nationale de la Météorologie Malienne)
- Global land cover http://bioval.jrc.ec.europa.eu/products/glc2000/glc2000.php
- Shuttle Radar Topography Mission (SRTM) data -
http://bioval.jrc.ec.europa.eu/products/glc2000/glc2000.php
4.6.5 Niger River Basin Methodology
- Soil and Water Integrated Model (SWIM) was set-up on the Intermediate Niger Basin
and calibrated to represent region specific processes, stocks and fluxes by using
regional ground-truth and remote sensing data. Further developments include
reservoir management, wetlands and inundation plain dynamics. In the INB
interaction between wetlands and lakes and inundation are important. The reservoir
module allows for release for minimum flows, managed releases and energy
releases.
- Hydrological response units have same properties (soil and land use/cover) regarding
bio-physical processes. The model is connected to meteorological, land-use, soil,
vegetation and agricultural management input data. Simulations consider water
balance for four control volumes: the soil surface, the root zone, the shallow aquifer,
and the deep aquifer. The percolation from the soil profile is assumed to recharge the
shallow aquifer. Return flow from the shallow aquifer contributes to the streamflow.
Shallow aquifer water balance includes ground water recharge, capillary rise, lateral
flow, and deep percolation

DEWFORA Project Report WP5 – D5.3
34
- Inundation module simulates release and flooding, the flooded surface area,
inundation depths, and duration, evapotranspiration and percolation
- Calibration and validation with PEST (Model-Independent Parameter Estimation and
Uncertainty Analysis): http://www.pesthomepage.org/) for period 1971-1980 and
1982-2000
4.6.6 Niger River Basin Results
- Model performed well on estimation of runoff, flow frequency, overestimation of the
annual peak and over-estimation of low flows
- The model is being extended to model drought conditions
4.7 LOCAL SCALE AGRICULTURAL MODELS
4.7.1 Limpopo Basin Data
- Yellow and white maize yield data obtained from the South African National
Department of Agriculture, Directorate: Statistics and Economic Analysis. Data are
available from 1981 to 2011.
- Focus on Witbank and Middelburg agricultural districts and the Rustenburg
agricultural district
- ECMWF System 4 data
4.7.2 Oum-er-Rbia Basin data
- Durum wheat data obtained 2stations in the coastal region, 4 stations in plains (and 3
stations in the mountains. Data are available form 1979-80 through 2007-2008.
- Sowing dates: October-November November-December February Harvest dates:
May May-June August
- ECMWF System 4 data
- Method
- The crops of both basins considered here are strongly rain-fed, so the assumption is
made that if a global model is able to predict seasonal rainfall over an area of interest,
then the same global model’s output can also be used in a statistical forecast system
to predict a rain-fed commodity such as crops. An assumption is made that if a global

DEWFORA Project Report WP5 – D5.3
35
model is able to predict seasonal rainfall over an area of interest, then the same
global model’s output can also be used in a statistical forecast system to predict a
rain-fed commodity such as crops.
- A downscaling modelling system to predict seasonal crop yields over the Limpopo
(southern Africa) and Oum-er-Rbia (Morocco) river basins.
- ECMWF System 4 data transformed from GRIB into the format required by the
statistical software package used in the analysis. Ensemble mean data and 3-month
averaged sea-level pressure (SLP) and 850 hPa geopotential height data are the
predictors considered.
- ECMWF S4 low-level circulation data for the three-month season prior to the period
of harvesting is transformed into normal distributions then post-processed into to crop
using the model output statistics (MOS). MOS equations are developed by using the
principal component regression (PCR;) option of the Climate Predictability Tool (CPT)
of the International Research Institute for Climate and Society (IRI;
http://iri.columbia.edu)
- The low-level circulation fields of the ECMWF System 4 (S4) are used as predictors in
a principal components regression (PCR) approach to test the predictability of
seasonal crop yields over the two basins. The models are tested over a 26-year
period to determine their deterministic skill levels, as well as over a 16-year retro-
active forecast period to test their probabilistic skill capabilities.
- The three-month season prior to the period of harvesting is selected based on the
assumption that the seasonal averaged low-level circulation during that three-month
period is associated with the rainfall over the region of interest and hence related to
the production of dry land crops. Limpopo DJF hindcast are used throughout, and for
Oum-er-Rbia, both FMA (for coastal and plains) and MJJ (for mountains) hindcasts
are used.
- The hindcast fields used in the MOS equations are restricted over a domain that
covers an area between the equator and 45°S and from 20°W to 60°E for the
Limpopo downscaling, and from 40°N to 30°S and from 150°E to 20°W for Oum-er-
Rbia downscaling
- Deterministic skill is determined over a 26-year period for the harvest years of 1983 to
2008

DEWFORA Project Report WP5 – D5.3
36
- Cross-validation is performed with a large 5-year-out design to minimise the artificial
inflation of skill. Retro-active forecasting is applied over the 16-year period from 1993
to 2008 to produce a set of probabilistic downscaled hindcasts
- o The relative operating characteristic (ROC) was used to test for systematic
discrimination and as a verification measure, and the reliability diagram was used
determine if the confidence communicated in the hindcasts is appropriate. If the area
below ROC curves is ≤ 0.5, the model discriminates correctly only for less than half
the time. For a maximum ROC score of 1.0, perfect discrimination has been obtained.
4.7.3 Limpopo Results
- Significant forecast skill was mainly restricted to the Rustenburg agricultural district.
Agricultural district yield indices (normalised values)
- Discrimination was achieved, especially for the Rustenburg agricultural district, but
the ability to predict for high yields for this district is restricted to lead-times up to two
months. useful skill for Rustenburg can be seen for both high and low yields at short
lead times.
- Good reliability for the prediction for low yields (a consequence of drought) can be
seen for Rustenburg (middle panel), but over-confidence is found in predicting high
yields for all three districts.
4.7.4 Oum-er-Rbia Results
- Skill may be found for the mountains and coastal areas, but very low predictability is
seen over the plains of the basin.
- Probabilistic skill suggests potential for making yield predictions over the mountains
and over the coastal areas. Poor skill was found over the plains
- Good discrimination was found in mountain areas and for high yields. At a 2-month
lead-time, high and low yields are well discriminated for both the coastal and
mountain areas, and so we will present a reliability analysis of the forecast system at
this lead time only. There was good reliability for predicting low yields over the
mountain and coastal areas, but the prediction of high yields has been found to be
over-confident

DEWFORA Project Report WP5 – D5.3
37
4.7.5 Overall
- This study presents a baseline that needs to be outscored by such sophisticated
approaches. Examples of these approaches include the use of physical crop models
that assimilate output from global climate models on temporal and spatial scales
reconcilable with their requirements.
5 IMPLEMENTATION OF IMPROVED METHODOLOGIES IN THE CASE
STUDIES (WP6)
5.1 THE CASE STUDY CONTEXT
5.1.1 Nile River Basin
- On the Nile, the main models used in this case study are the Regional Climate Model
(PRECIS) and the Nile Forecasting System (NFS). PPRECIS implements dynamic
downscaling based on the HADCM output while the NFS involves real-time hydro
meteorological monitoring, forecasting, and simulation system for the Nile River
basin: Compare SPI in both ERA40 and CRU data. Climate change scenarios output
are used in SPI calculations. Results of NFS for Blue Nile and Atbara basins with CC
scenarios output are analysed.
- Results from the CC scenarios are compared with CRU and ERA40
5.1.2 Limpopo River Basin
- Regional drought SPI distribution for the Limpopo basin and Severity Areas
Frequency curves from SPI3 and SPI9 for the Limpopo basin.
- Seasonal statistical forecasting of runoff for selected stations
- Evaluation of ERA-Interim drought indices with NDVI (Modis)
- Evaluation of indigenous knowledge and formal forecasting methodologies (working
with communities and MET Departments). Validation stage for the Mzingwane
catchment based on the identified indigenous parameters.
- SPI-NDVI methodology (working with SAWS and CSIR and ARC) in Luvuvhu Water
Management Area to assess the use of remotely sensed data (NDVI and VCI)
together with topographical attributes ( Aspect, slope and Altitude) to improve
applicability of SPI.

DEWFORA Project Report WP5 – D5.3
38
- Detailed implications of drought of vegetation, crop yield, hydrology
- Refining forecasting and tailored forecast products (Livestocks and crops)
- Institutional flow of information at regional and national level, options for improvement
5.1.3 Oum Er Rbia River Basin,
- There are no early warning systems,
- Constraints for the establishment of an early warning system:
- Data exist, but are non available (accession problems).
- Measurement networks exists, but have to be densified and modernised.
- As for the data treatment, the existing structures need a scientific-technical
partnership.
- The dissemination of information is localised and restricted, and a lot of information is
not public
- The preliminary analysis of the results shows:
- The forecasts are not able to detect rainy days 15 days ahead. Indeed, among all the
rainy days analysed, none of the forecasts was able to predict either the occurrence
of rain or the amount of rain (whatever it was a small, moderate or important rainfall
amount).
- Forecasts seem good to predict dry periods, as shown by the fairly good concordance
between the observed rainfall and the 50 percentiles.
- Concerning rainy days, the results show that globally, they are not detected from 10
to 15 days ahead. In the best cases, the occurrence of rain starts to be forecasted
around 6 days ahead. However, this is not verified for all the forecasts. Then, even
when the rainy episodes are forecasted, the amount of rainfall is very often
underestimated, especially for important rainfalls.
-

DEWFORA Project Report WP5 – D5.3
39
5.2 THE PAN-AFRICAN MAP SERVER
- Temporal correlation of between TRMM and ERAI for SPI3, SPEI3, SMA and PET
shows varied performance, with PET performing poorly. Correlation between TRMM
and GPC for SPI3 and SPEI3 also showed varied performance. Best performing
areas had correlation coefficients of 0.5 to 0.6 and these comprised the Zambezi
River Basin , Great Lakes region and Eastern Nile and North Africa around the
Mediterranean coast of Morocco, Algeria and Tunisia. The rest of Africa performed
poorly.
- Monthly anomalies in SPI-3 (ERAI, GPCP, TRMM), SPEI-3 (ERAI, GPCP), SRI3
(ERAI) and SMA (ERAI) for January 2008 do not show the same picture for most
parts of Africa with SRI3-ERA showing the greatest difference from the other
anomalies .
- Fractional area of each region under SPI-3 bellow -1.0 (drought conditions) from 1998
to 2010 from ERAI, GPCC, GPCP, TRMM is in general agreement with observed
conditions in WP2, D2.2 for the extremely dry years but less dry years show poor
results.
- Inter-comparison of a set of hydro-meteorological indicators in order to set up a Pan-
African map server. Between the indicators analysed are included the Standardized
Precipitation index (SPI), Standardized Precipitation-Evaporation Index (SPEI),
Standardized Run-off index (SRI), and Soil Moisture Anomalies (SMA).
- Vulnerability and risk analysis were performed at continental and regional level, these
scales are very coarse better products are available from FEWSNET-regional and
local vulnerability assessments.
- Pan-African Map Server presents drought relevant information for entire African
continent based on data processed and analysed at JRC. Drought products could
include monthly updated Standardized Precipitation Index (SPI), daily updated
modeled soil moisture anomalies, remote sensing observations on the state of the
vegetation cover (i.e. anomaly of the fraction of Absorbed Photosynthetically Active
Radiation (fAPAR), Normalized Difference Water Index (NDWI)).
6 CONCLUSIONS
The framework for drought warning and mitigation in Africa proposed can assist in
establishing policy priorities based on scientific evidence that also strengthen existing

DEWFORA Project Report WP5 – D5.3
40
institutions. Overall, a science-based approach is a useful guideline, but a number of
challenges are recognized. Risk-based approaches to preparing for drought are focused on
acquiring accurate probabilistic information about the events themselves. When this is not
possible, the strategy fails. In contrast, understanding and reducing vulnerability does not
demand accurate predictions of the incidence of extreme drought. Nevertheless, if may be
politically difficult to justify drought vulnerability reduction on economic grounds.