DevOpsCon - Listen to your infrastructure
35
Listen to your infrastructure Gianluca Arbezzano Software Engineer @CurrencyFair
-
Upload
gianluca-arbezzano -
Category
Software
-
view
410 -
download
0
Transcript of DevOpsCon - Listen to your infrastructure

Listen to your infrastructure
GianlucaArbezzanoSoftware Engineer @CurrencyFair

I am an open source developer
I am involved as speaker, maintain, contributor in different projects and community.
https://twitter.com/gianarb
https://github.com/gianarb
http://gianarb.it

Drive your boat like a Captain
This ebook drives you to manage Docker in production.
http://scaledocker.com

MONITORINGbecause we need to trust someone

1.To understand what is happening

2.To predict the future

Because we are not John

Badoo migrated to PHP 7

@dgryski tested for 10 mins a service in Golang(previously it was in Perl)

Sometimes you just need to compare

tail -f /var/log/nginx/live.access.log
WIDESPREAD MONITORING TOOL

2016/04/15 15:42:46 [warn] 2330#0: *167 using uninitialized variable, client: 10.0.1.1, server: localhost.dev, request: "POST /auth HTTP/1.1", host: "localhost"
2016/04/15 15:44:44 [error] 2330#0: *171 FastCGI sent in stderr: " PHP message: PHP Fatal error: Uncaught exception 'RuntimeException' with message 'All broken)[500]' in /var/www/my/project.php:237
Stack trace:#0 /var/www/index.php:45 ObjectService->flush()#1 [internal function] ->save()

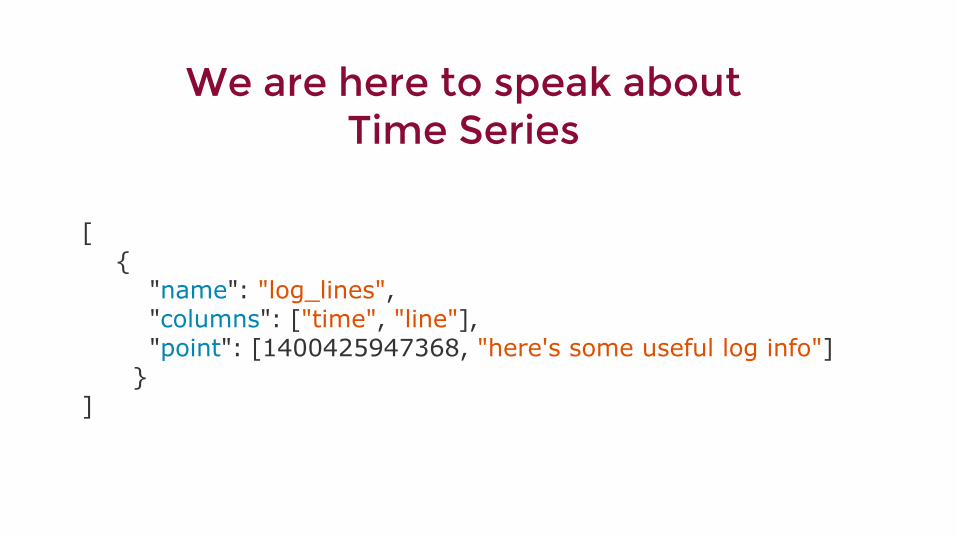
We are here to speak about Time Series
[ { "name": "log_lines", "columns": ["time", "line"], "point": [1400425947368, "here's some useful log info"] }]

EASY! EASY! EASY!
{ "name": "cpu_percent_use", "columns": ["value"], "point": 40}

Time is a perfect sharding key
It means that Time Series scale really well

InfluxDB
▸ Optimized to work with time series data
▸ Open source▸ Big community and huge ecosystem

Easy
wget https://dl.influxdata.com/influxdb/releases/influxdb_1.0.0_amd64.deb
sudo dpkg -i influxdb_1.0.0_amd64.debInfluxd -config /usr/local/etc/influxdb.conf

Easy
▸ HTTP server▸ UDP server▸ Admin Panel

20
[key] [fields] [timestamp]temperature,machine=unit internal=3,external=10 1434055562000000035
Inline Protocol thinked to be smart and slim

SQL Like
SELECT value
FROM cpu_load_short
WHERE
region='us-west'
22
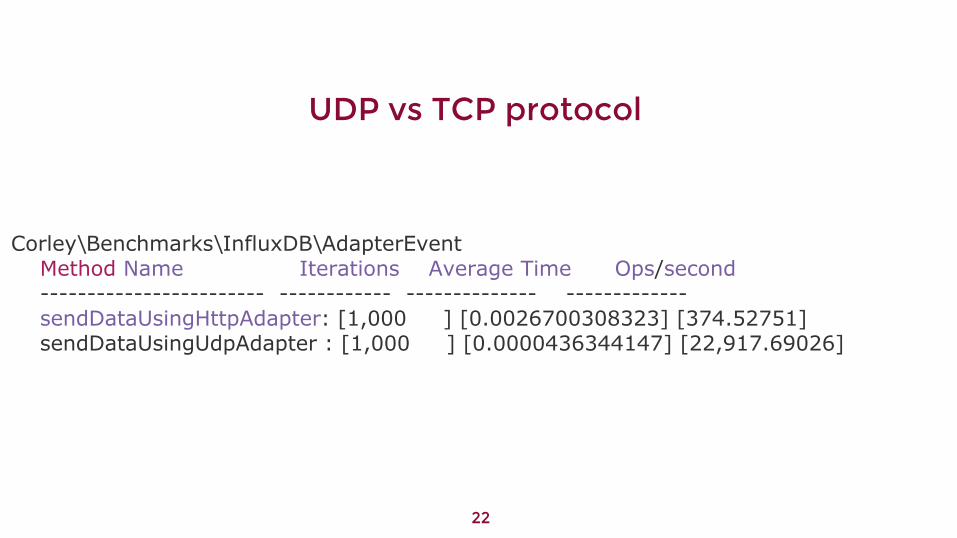
Corley\Benchmarks\InfluxDB\AdapterEvent Method Name Iterations Average Time Ops/second ------------------------ ------------ -------------- ------------- sendDataUsingHttpAdapter: [1,000 ] [0.0026700308323] [374.52751] sendDataUsingUdpAdapter : [1,000 ] [0.0000436344147] [22,917.69026]
UDP vs TCP protocol

23
CREATE CONTINUOUS QUERY minnie ON world BEGIN SELECT min(mouse) INTO min_mouse FROM zoo GROUP BY time(30m) END
Continuous Query

T-shirts time!

25

26
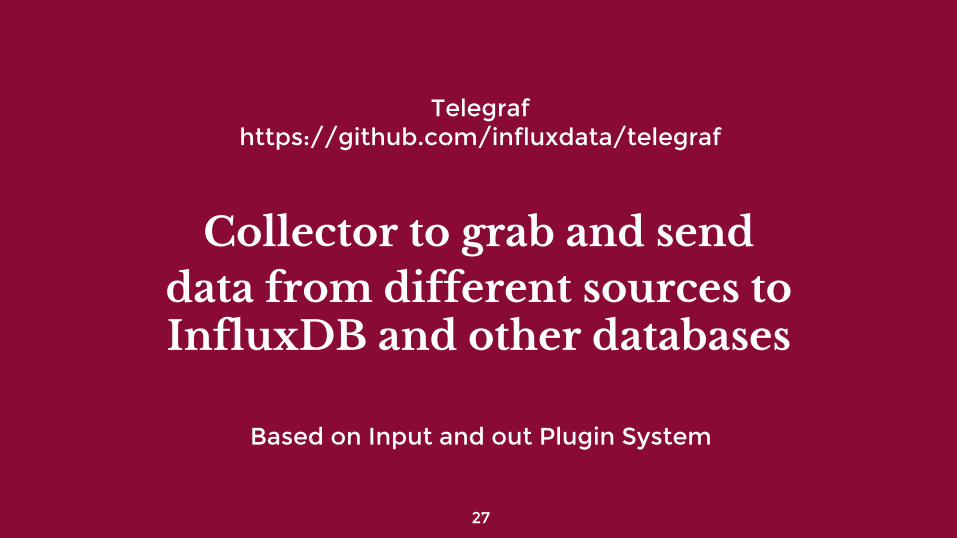
Telegrafhttps://github.com/influxdata/telegraf
Collector to grab and send data from different sources to InfluxDB and other databases
27
Based on Input and out Plugin System
28
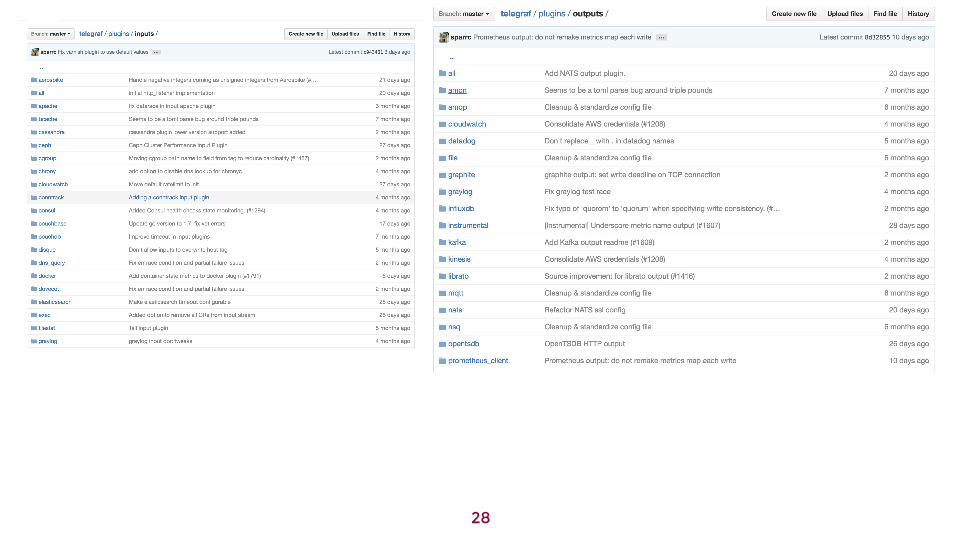
Telegraf Plugins

Kapacitorhttps://github.com/influxdata/kapacitor
Trigger notifications and make action in case of specific
behaviors
29
framework for processing, monitoring, and alerting on time series data

30
Kapacitor high CPU alertstream
|from()
.measurement('cpu_usage_idle')
.groupBy('host')
|window()
.period(1m)
.every(1m)
|mean('value')
|eval(lambda: 100.0 - "mean").as('used')
|alert()
.message('{{ .Level}}: {{ .Name }}/{{ index .Tags "host" }} has high cpu: {{ index .Fields "used" }}')
.warn(lambda: "used" > 70.0)
.crit(lambda: "used" > 85.0)
// Send alert to hander of choice.
// Slack
.slack()
.channel('#alerts')
// PagerDuty
.pagerDuty()

31
Demohttps://github.com/gianarb/tick-php

32
When you start to work with "micro"services understand the topology of your connections is really important Time series can help you

33
Why InfluxDB and not something else?https://www.influxdata.com/influxdb-is-27x-faster-vs-mongodb-for-time-series-workloads/
27x greater write throughput
84x less disk space

34
That’s it!
A series of great tools to monitor your applications and your infrastructure
A monitoring system isn’t for all