DevOps Metrics - Lies, Damned Lies and Statistics
59
DevOps Metrics lies, damned lies and statistics Gaetano Mazzanti @mgaewsj agile42
-
Upload
gaetano-mazzanti -
Category
Data & Analytics
-
view
1.606 -
download
3
Transcript of DevOps Metrics - Lies, Damned Lies and Statistics
DevOps Metrics���lies, damned lies and statistics
Gaetano Mazzanti@mgaewsj
agile42

why do we need metrics?
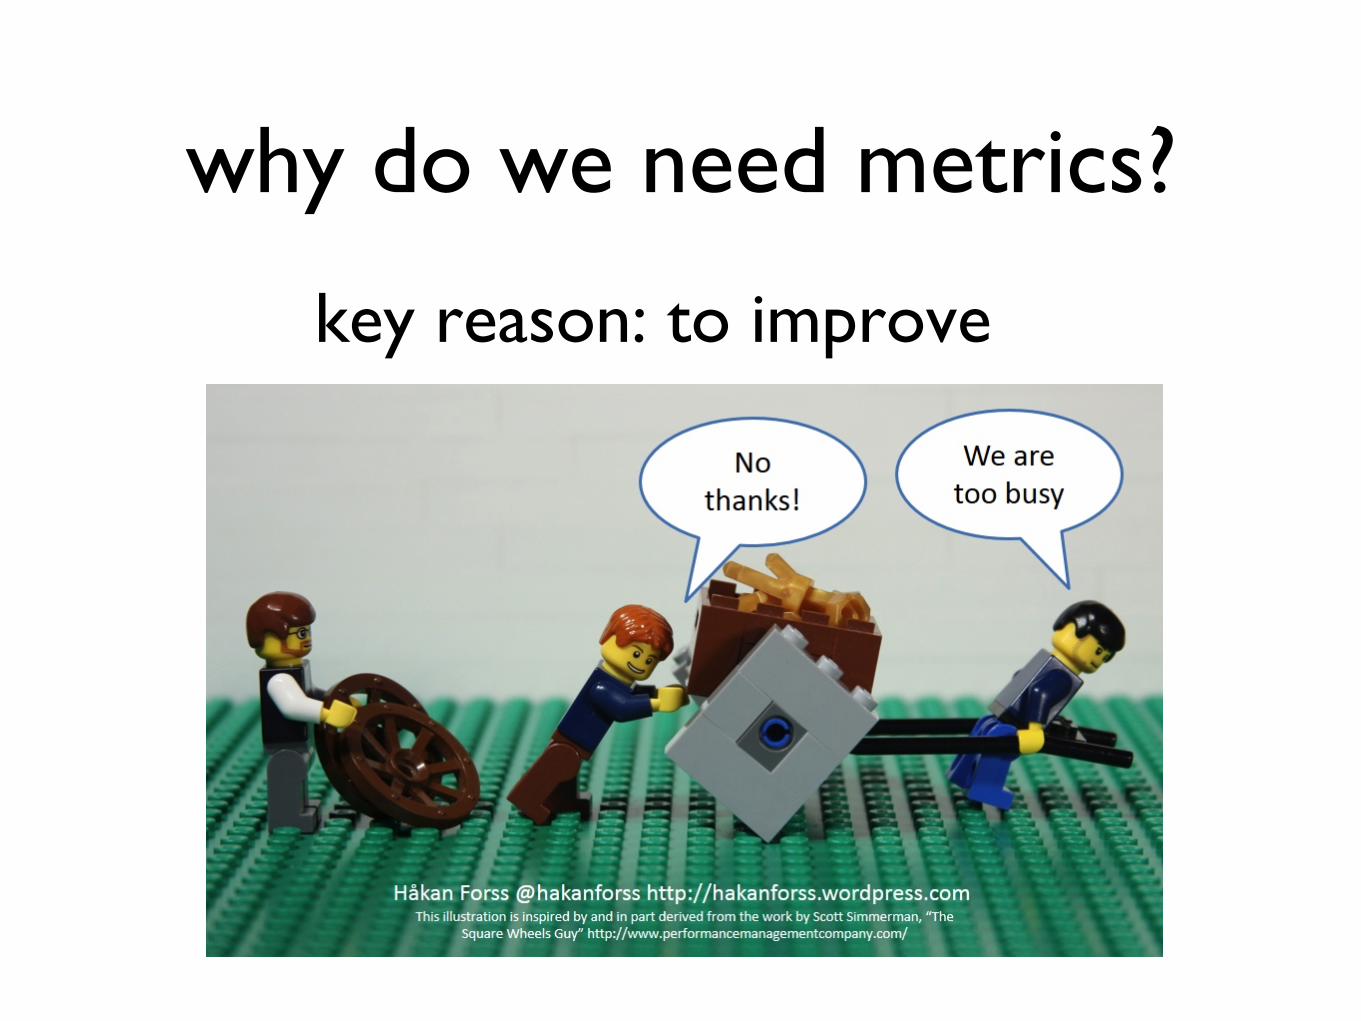
why do we need metrics?
key reason: to improve

why do we need metrics?
decisions

why do we need metrics?
predictability

beware of
cheating
averages
fallacies

beware
metrics can be gamed
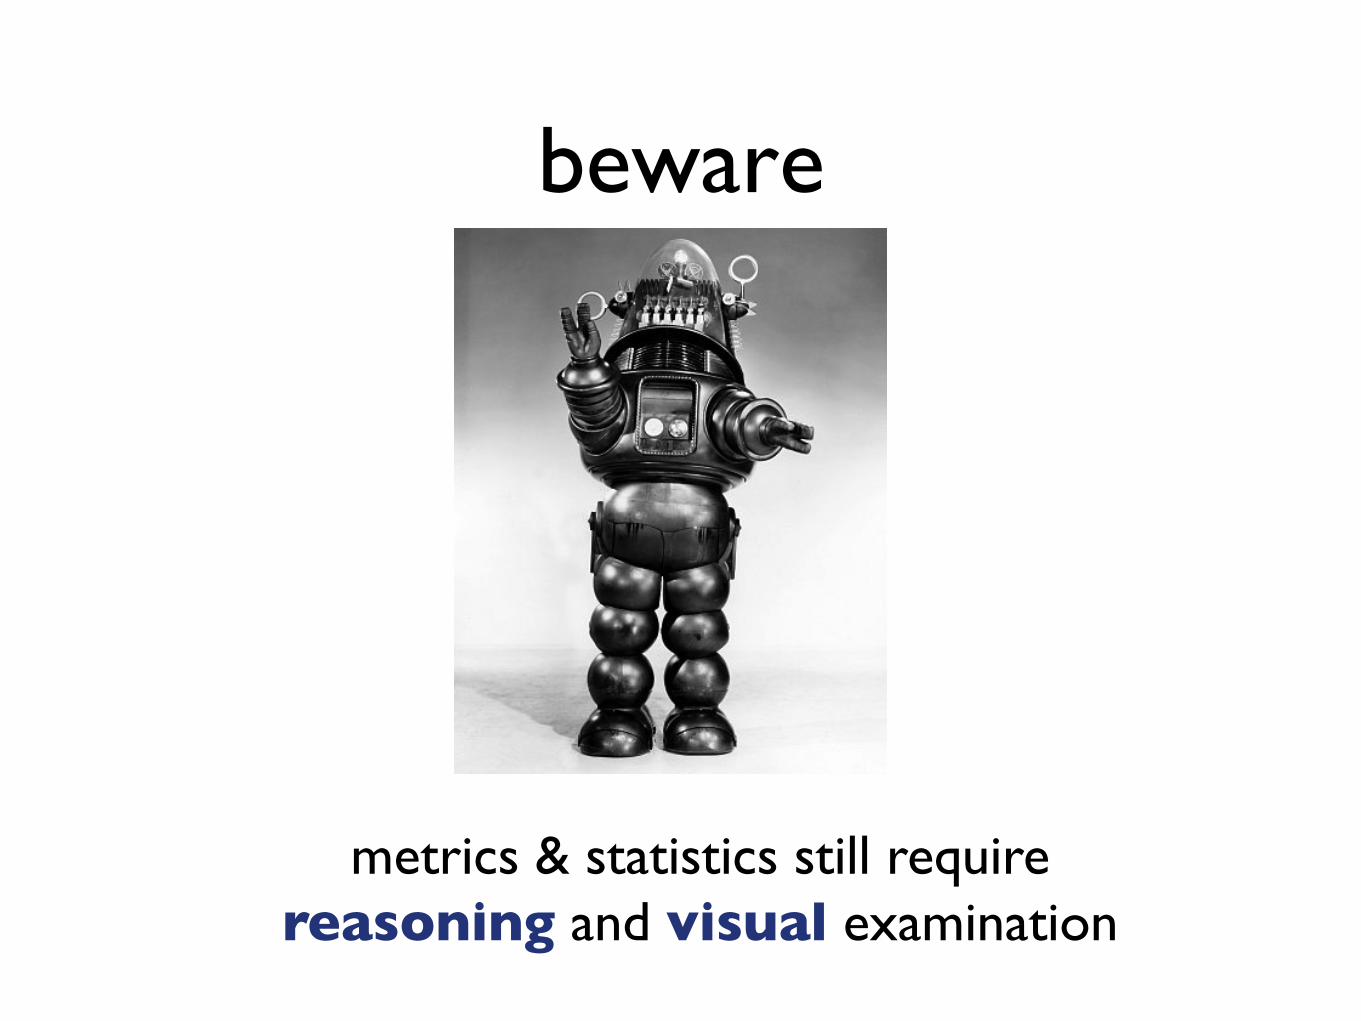
metrics & statistics still require���reasoning and visual examination
beware

same mean, variance & correlation���(7.50 3.75 0.816)
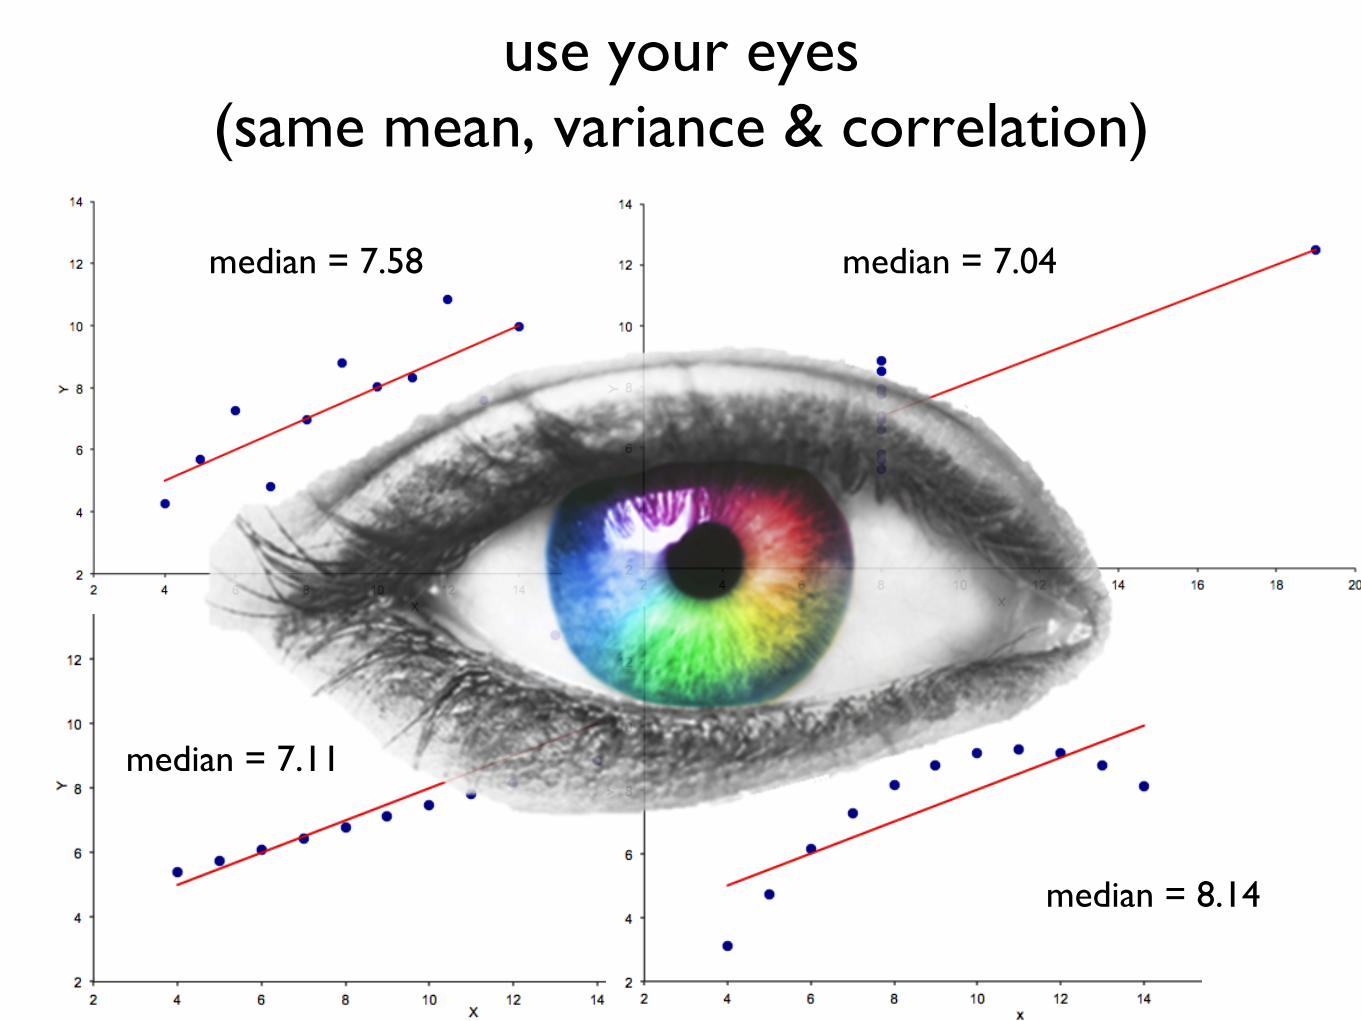
use your eyes���(same mean, variance & correlation)
median = 7.58
median = 8.14
median = 7.11
median = 7.04
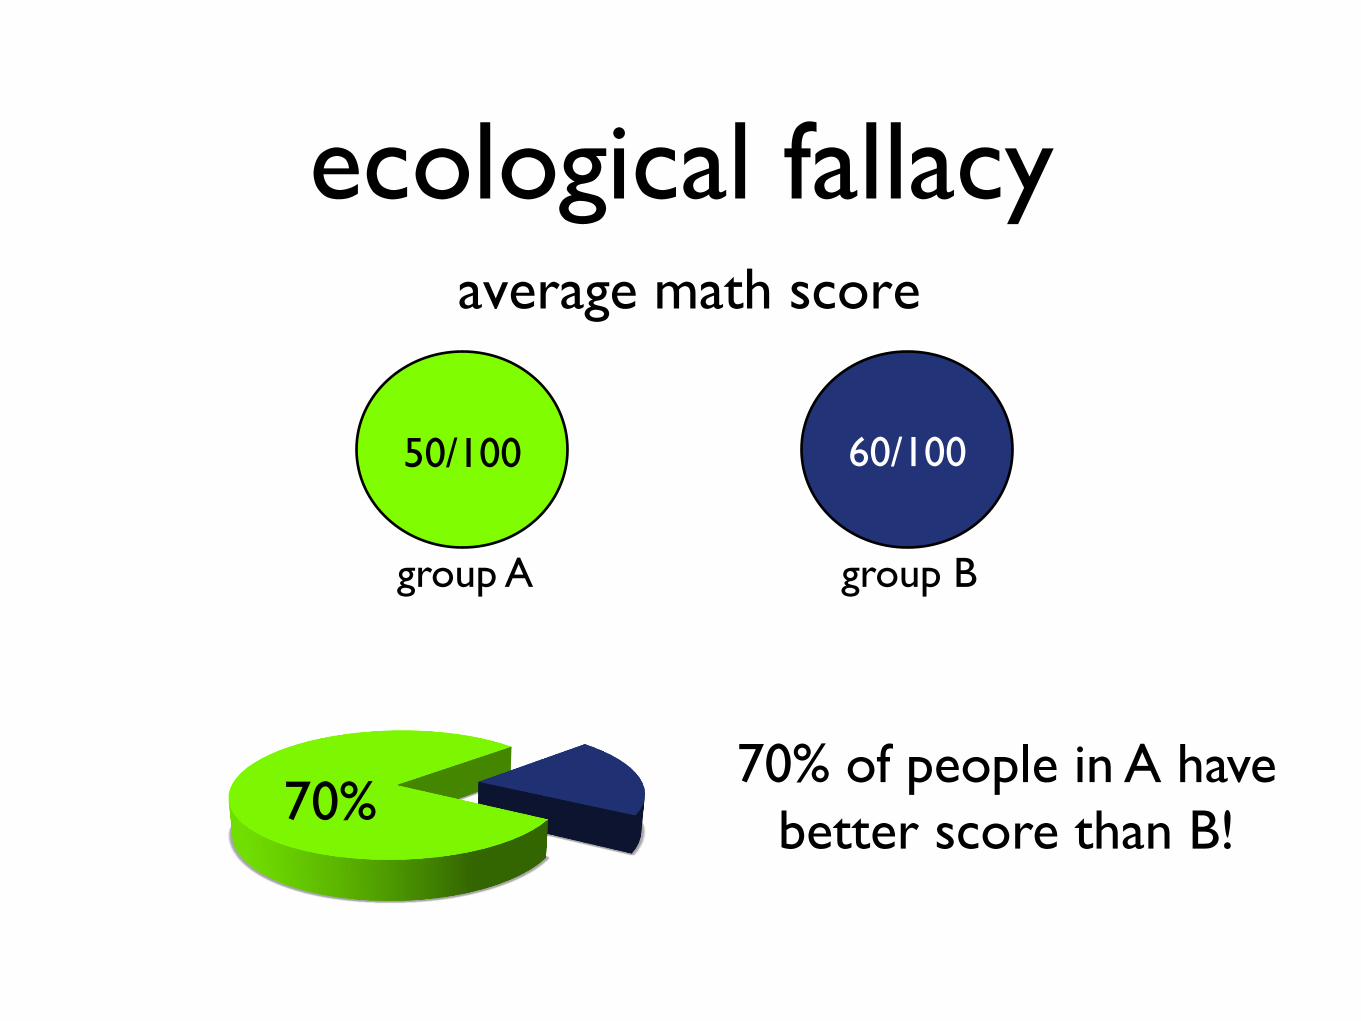
ecological fallacyaverage math score
50/100 60/100
group A
70% of people in A have better score than B!
group B
70%

ecological fallacy
50/100 60/100
70%Group A Group B
# score # score50 45 70 43 50 55 30 100
group A group B
average math score

exception fallacy

Simpson’s paradoxGlobal Natural Treat
Live 108 153
Die 123 120
Natural 47% liveTreat 56% live
Women Natural Treat
Live 57 32
Die 100 57
Natural 36,3% liveTreat 36,0% live
Men Natural Treat
Live 51 121
Die 23 63
Natural 69% liveTreat 45% live

Simpson’s paradoxGlobal Natural Treat
Live 108 153
Die 123 120
Natural 47% liveTreat 56% live
Women Natural Treat
Live 57 32
Die 100 57
Natural 36,3% liveTreat 36,0% live
Men Natural Treat
Live 51 121
Die 23 63
Natural 69% liveTreat 45% live

which metrics?

deployment frequency
lead time for changes
mean time to recover
change fail rate
how IT performance was measured
!?!?!?
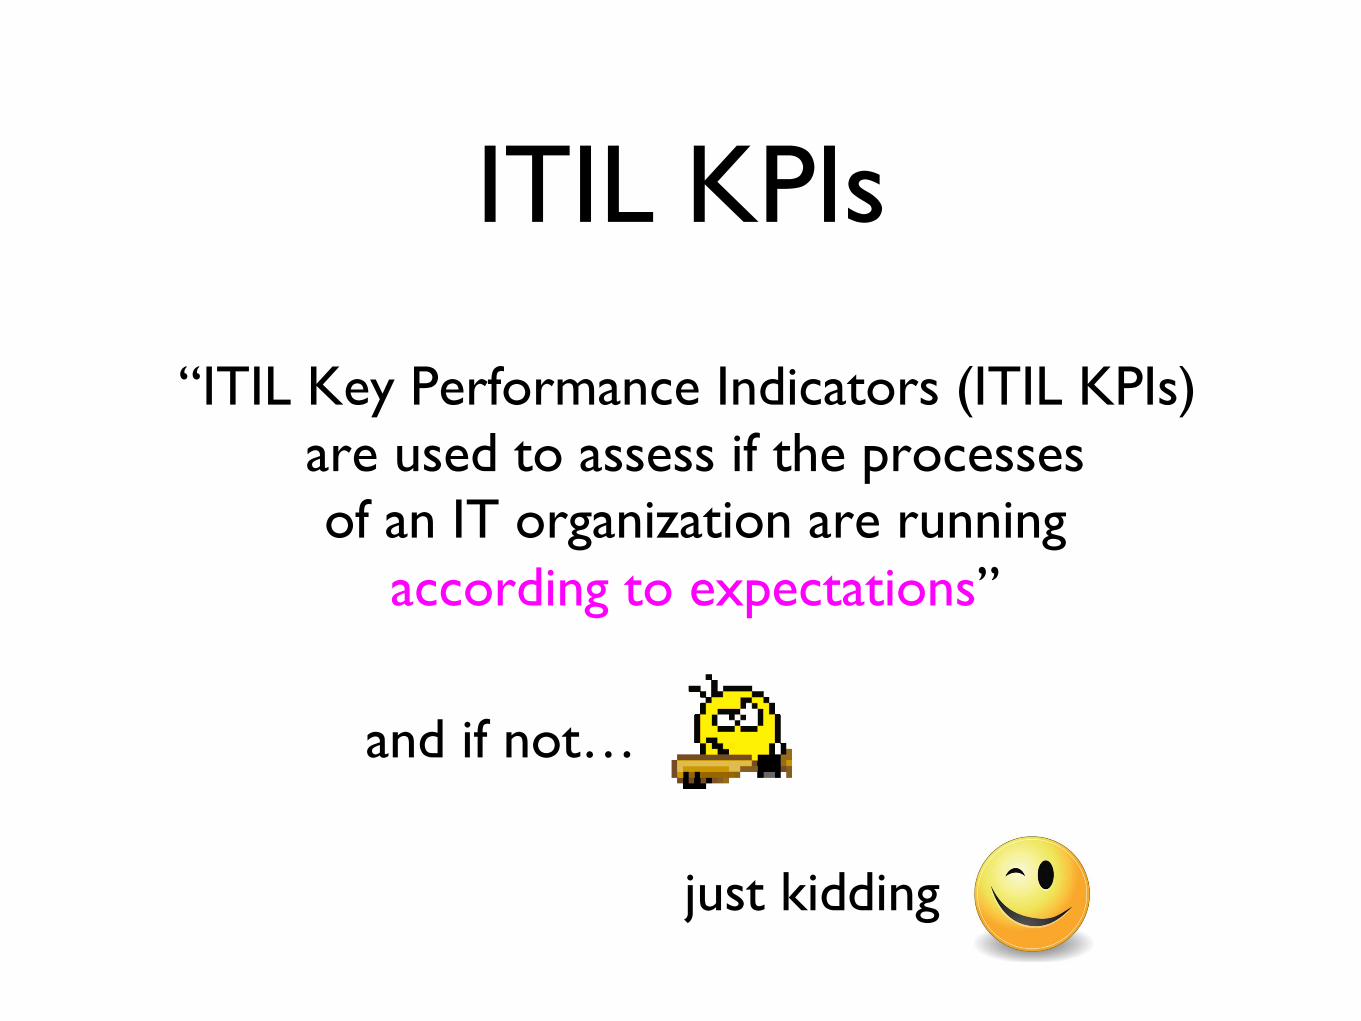
ITIL KPIs
“ITIL Key Performance Indicators (ITIL KPIs) are used to assess if the processes���of an IT organization are running���
according to expectations”
and if not…
just kidding

a few ITIL KPIs… example (1/2)

a few ITIL KPIs… example (2/2)

it’s easy to get lost���
in a maze of (not relevant) data

why?
key question about your metrics

what do you want���to learn?
key question about your metrics

loops

improvement loops
build/change
measure learn
experiment
actionable metric
hypothesis

which metrics
matter to customersno yes
end-to-end(global)
functional(local)
typical
ideal

service oriented mindsetDevOps as a service provided���
to deliver value to the business

pizza delivery
fast delivery
accuracy and quality
predictability
what mattersto customers

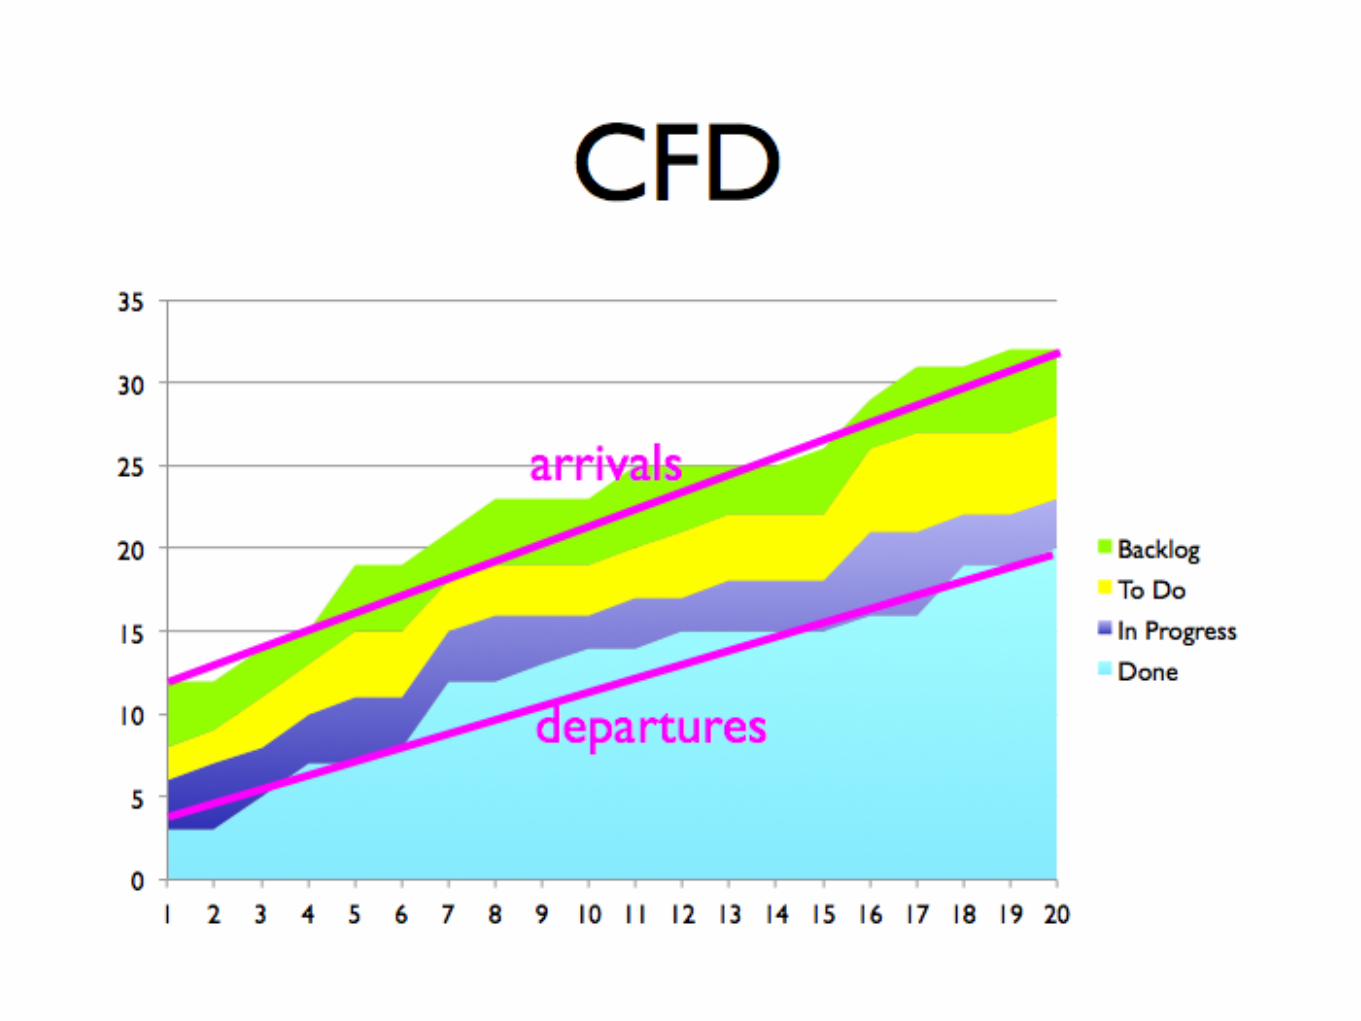
let work flow
flow is the movement and deliveryof customer value through a process

derive from poor flowslow deliverylow quality
unpredictability

poor flow => queues

just 3 metrics?
Work In ProgressCycle Time
Throughput
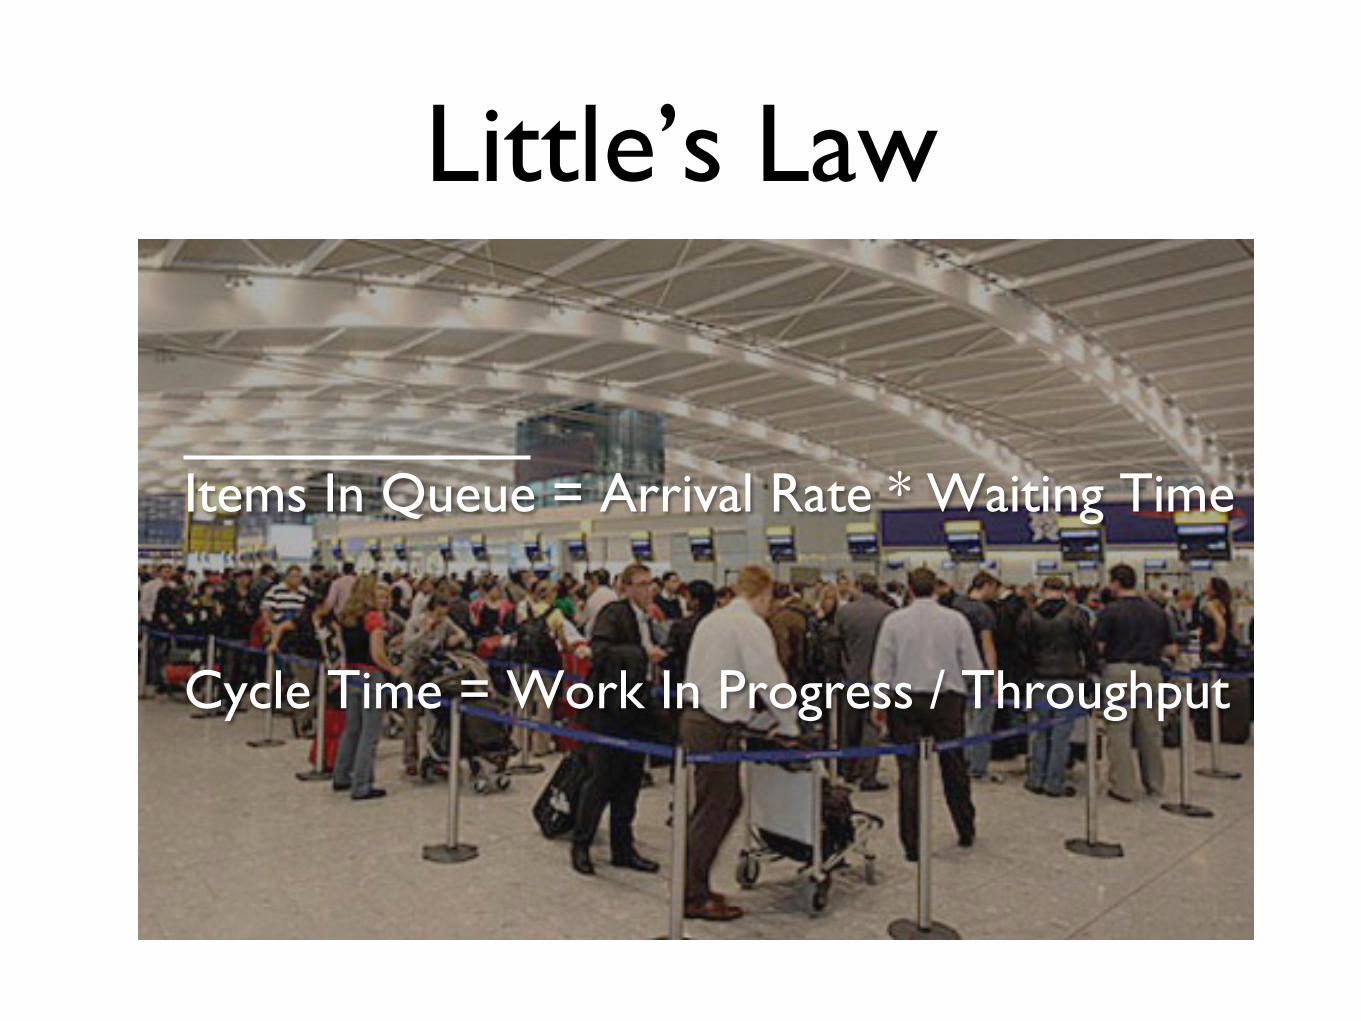
Little’s Law
Items In Queue = Arrival Rate * Waiting Time
Cycle Time = Work In Progress / Throughput

focus on cycle time

0
1
2
3
4
5
6
7
8
1-Feb 3-Feb 5-Feb 7-Feb 9-Feb 11-Feb 13-Feb 15-Feb 17-Feb 19-Feb 21-Feb
scatterplot
54%
71%
88%
96%
cycle time (days) average

scatterplot
source ActionableMetrics book
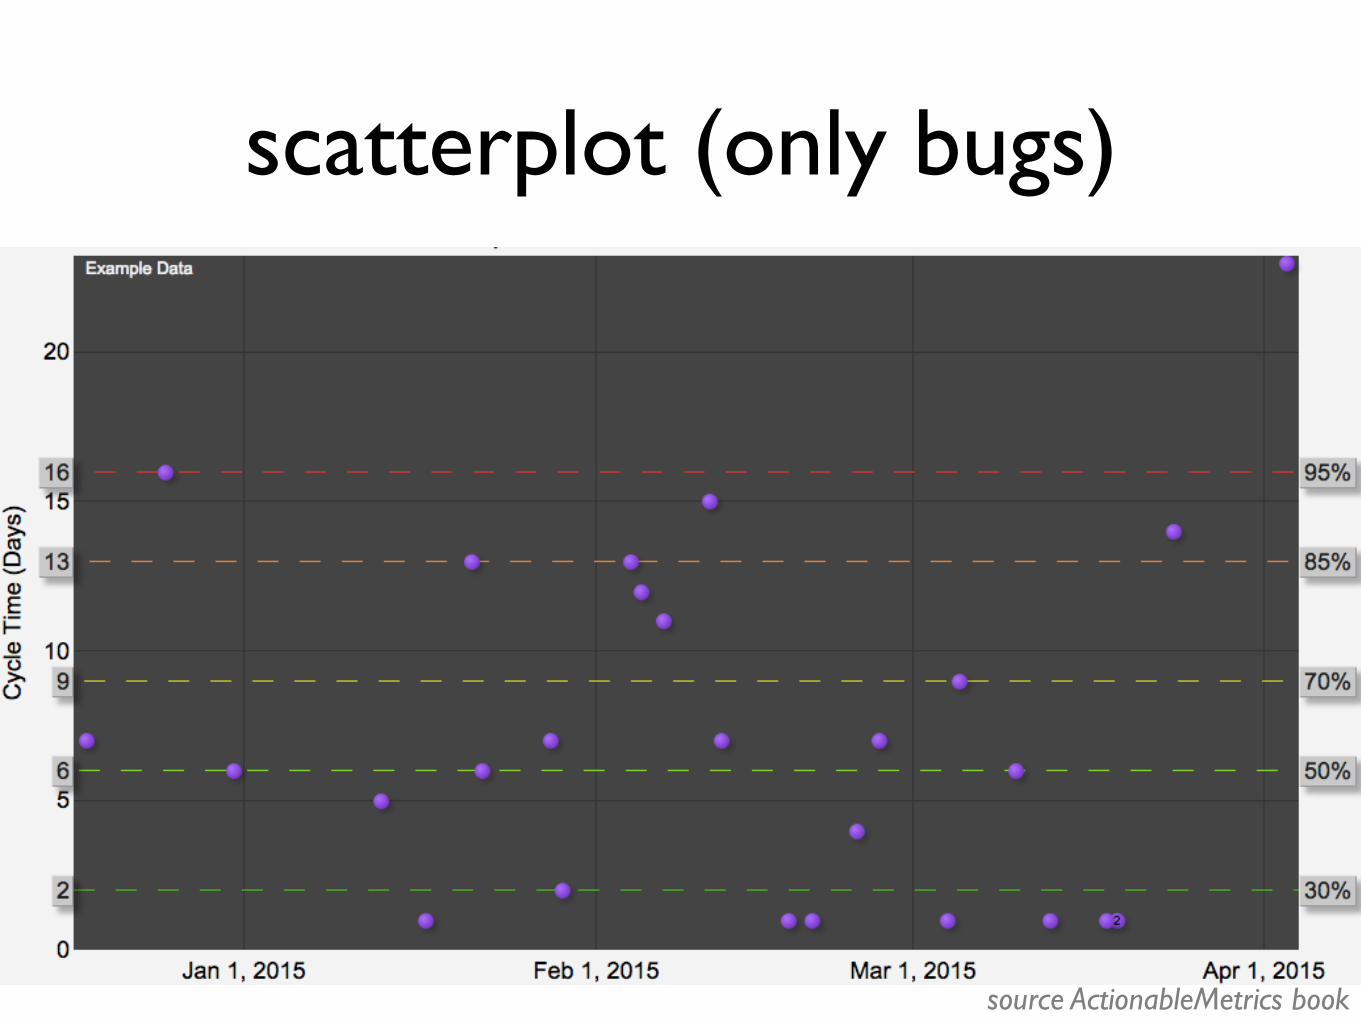
scatterplot (only bugs)
source ActionableMetrics book

frequency distribution
source ActionableMetrics book
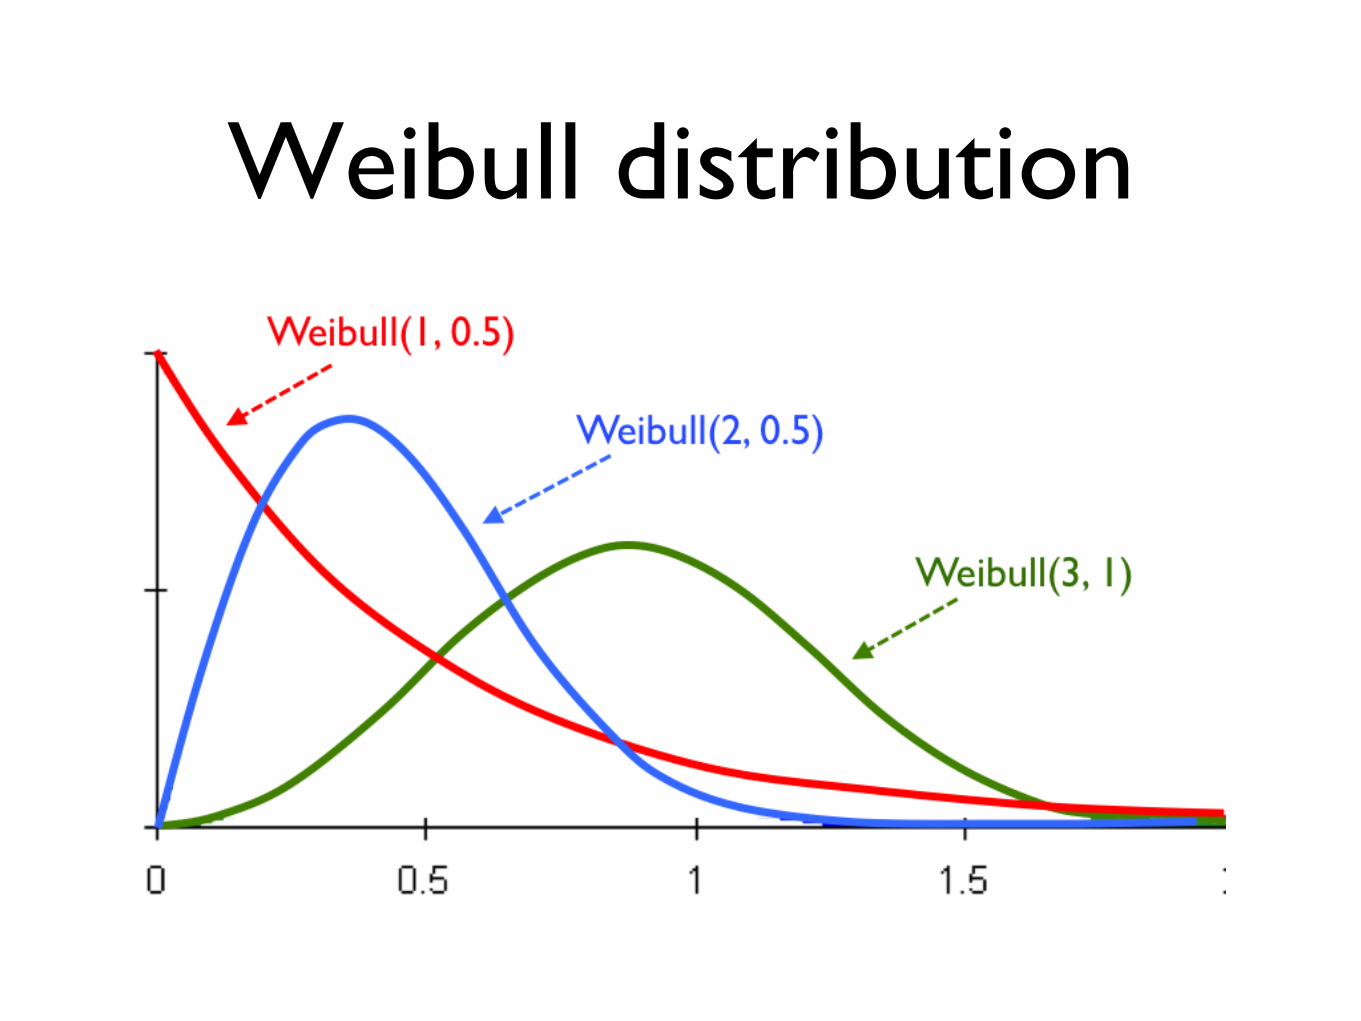
Weibull distribution
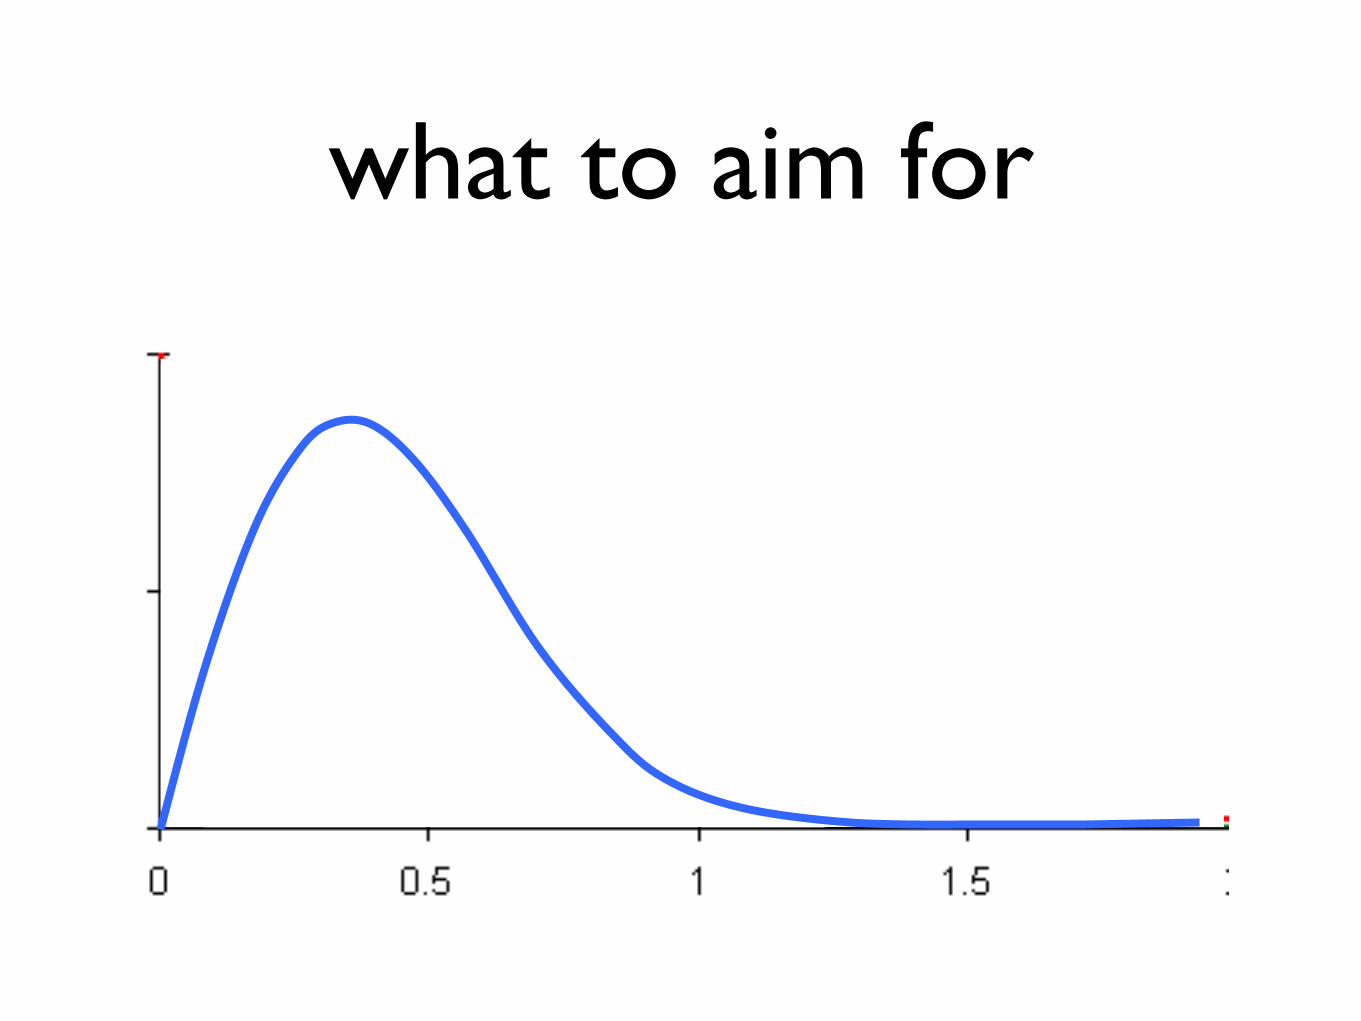
what to aim for

aging
source ActionableMetrics book

___
efficiency
process efficiency =total time
active time________
205 = 25%
!1!!2!!3!!4!!5!!6!!7!!8!!9!10!11!12!13!14!15!16!17!18!19!20!
elaborate do validate deliver
waitingactive

SLAs���Service Level Agreements
agreementexpectationa SLA is a contract
between a service provider and the user/customer that defines the level of service
expected from the service provider
i.e. we expect an item to flow through the process and exit in 5 days or less with an 85% probability of success

SLAs – some hints
do not set a SLA without analyzing Cycle Time data
do not allow a SLA to be set by someone external to your group
do not set a SLA without collaborating with customers and/or other stakeholders
use different SLAs for different Work Item Types

SLA

slack – avoid full utilizationabsorb variations
% capacityutilization
queu
e si
ze
queue sizegrows
exponentiallyat high capacity0
5
10
15
20
25
0 10 20 30 40 50 60 70 80 90 100

your policies shape your data
your data shape your policies


where to start from?
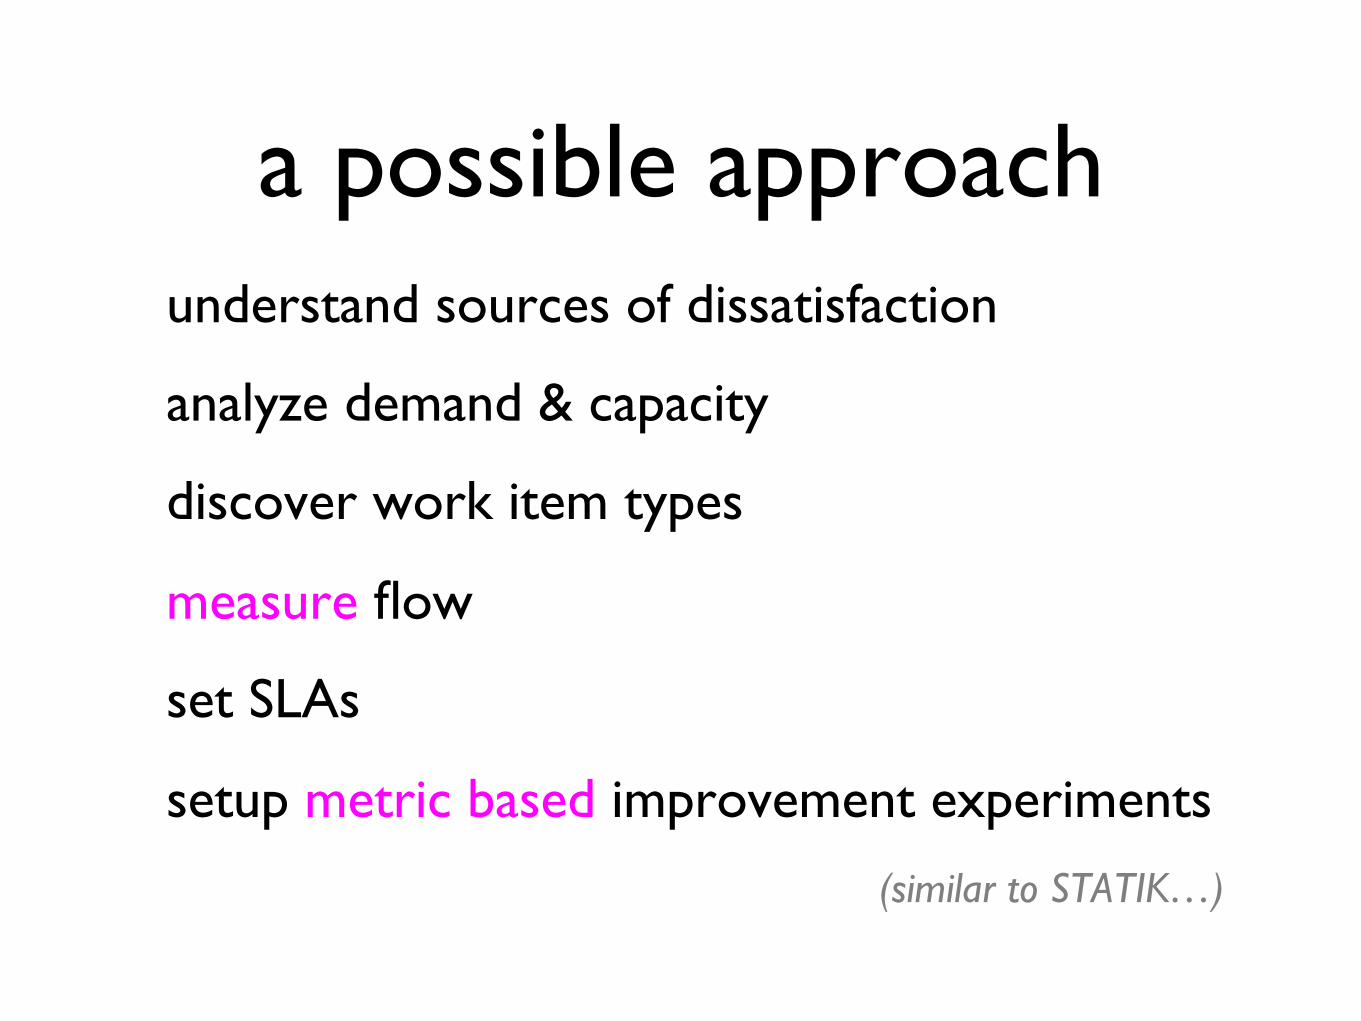
a possible approachunderstand sources of dissatisfaction
analyze demand & capacity
discover work item types
measure flow
set SLAs
setup metric based improvement experiments
(similar to STATIK…)
obsessions you should have
improve process continuously
remove problems/impediments asap
get help from metrics