:Developments in tlte Poultrg !ndustrg
38
MAGR GOVS MN }V 2000 M ISC-1954 r., June 1954 I I :Developments in tlte Poultrg !ndustrg United States -- Minnesota HANDBOOK AND DIGEST For Agricultural Extension Workers and Other Leaders in the Poultry Industry 611 W. Jl. :Dauiers 8KfCHSiDH 8CIJHIJJHiS/ - )ttariefiHg A UNIVERSITY M INN A'qA.i.t:,ultuA.L U. S. D E P A R T M E NT 0 I= A G R C U L T U I E -- -- -- .... ------ ------- *i M-21 - 1H - 7-s• brought to you by CORE View metadata, citation and similar papers at core.ac.uk provided by University of Minnesota Digital Conservancy
Transcript of :Developments in tlte Poultrg !ndustrg
MAGR GOVS ~ MN }V 2000 M ISC-1954 r.,
June 1954 ~
I
I
:Developments in tlte Poultrg !ndustrg United States - - Minnesota
HANDBOOK AND DIGEST
For Agricultural Extension Workers and Other Leaders in the Poultry Industry
611 W. Jl. :Dauiers
8KfCHSiDH 8CIJHIJJHiS/ - )ttariefiHg
A UNIVERSITY 0~ M INN ..OTA ~ A'qA.i.t:,ultuA.L &x:t~um.. ~I!AIIit:.e,_ c<._~ U. S. D E P A R T M E NT 0 I= A G R C U L T U I E
-- -- -- .... ------ ------- *i
M-21 - 1H - 7-s•
brought to you by COREView metadata, citation and similar papers at core.ac.uk
provided by University of Minnesota Digital Conservancy

Develo~ments in the Egg and Poultry Industry W. H. Dankers*
Extension Economist in Marketing
Introduction
Minnesota was fourth in the United States in the number of farm chickens raised in 1953, and also fourth in the number of chickens on farms January 1, 1954. In both of these, Iowa was first, Pennsylvania second and California third.
Minnesota was third in the total number of eggs produced in 1953. Iowa was first and Pennsylvania second.
Minnesota was second in the number of turkeys raised in 1953 and was exceeded only by California. Virginia was in third place, Iowa in fourth, and Texas dropped to fifth place.
There has been almost continuous expansion in all phases of the Minnesota poultry industry during the last twenty years. Egg production in 1953 was about 2.4 times as high as in the prewar years of 1935-39. The number of turkeys raised each year nearly tripled during this period. There was practically no commercial broiler production in Minnesota before 1940. This enterprise is still not especially significant in terms of the contribution to total cash farm receipts, but significant forward strides have been made~
The production of poultry and poultry products ranges from a minor sideline enterprise on some Minnesota farms» to a major enterprise on other farms, and to a highly commercialized business on still other farms. There is a trend toward specialization within the poultry industry.
1. E~~ production and farm chicken meat. Egg production is supplemented by poultry meat production from male birds purchased along with female birds for flock replacement, and from fowl that have been in the laying flock and are being replaced. This egg and farm poultry enterprise is becoming more specialized t.oward egg production because the percente.ge of 11 sexed 11 chicks purchased from hatcheries is constantly increasing. In 1953 the cash income from eggs provided 9.7 percent of the total cash farm receipts in Minnesota, and chicken meat (not including commerci~l broilers) provided 1.2, or a total for this enter~rise of 10.9 percent.
2. Commercial broiler production. In 1953 commercial broiler production provided .3 percent of total Minnesota cash farm receipts. As indicated by the term 11 commercial 11
broiler production, this enterprise is usually highly specialized and commercialized.
3. Turkey production. In 1953 Minnesota turkey production and turkey sales provided 2.3 percent of total cash farm receipts. This highly specialized and commercialized enterprise has in recent years divided itself into two enterprises, namely the production of Bronze and other large turkeys, and the production of Beltsville and other small turkeys which are sold largely as turkey fryers anQ broilers. Some producers are active in both enterprises, while others have preferred to specialize in one or the other.
All together the poultry enterprises in Minnesota provided 13.5 percent of total cash farm receipts in 1953. This was higher than in other recent years, when income from poultry and poultry products provided from 10 to 11 percent of total cash farm receipts.
An example of increased efficiency in Minnesota's poultry industry is the increase in egg production per hen from an annual average of less than 90 eggs in the late twenties and early thirties to 165 eggs in 1953 (based on the January 1 enventory of hens and pullets). Egg production per hen in Minnesota is now considerably above the United States average.
Nearly 70 percent of the eggs produced in Minnesota are sold outside of the state. Chicago is an important market, but a large proportion of Minnesota eggs move to the more distant markets of the East, West, and South, so that Minnesota producers, handlers and others have a national interest in the poultry industry.

~o assist in the analysis and study of the developments in the egg and poultry industry, this handbook, and the poultry statistics included are presented as reference material. An index precedes the statistical tables so that any section may be easily located. In the 11notes 11 which follo111 the different tables, attention is called to the "highlights", and to important items that can be observed from the tablese
The statistical information was obtained and calculated from egg and poultry reports published by the various Divisions of th~ Agricultural Marketing Service in the United States Department of Agriculture 8 the Minnesota Federal-State Crop and Livestock Reporting Service and the Department of Agricultural Economics. University of Minnesota.
* Alyce Piepho, Senior Clerk and Dolores Giese, Assistant Clerk~ Agricultural Extension Marketing, assisted in the preparation of the material for this report.
~ X.
IL III. IV. 'v. VL
VII. VIII.
IX. x.
XIo XII.,
Poultrr XIII.
XIV. XV.
XVI. XVII.
XVIII~ XIX.
XX. XXI.
xxn. XXIII.,
XXIV.
Turkers nv.
XXVI. XXVII.
X.XVIIIo xxrx.
XXX. XXXI.
Index
Egg Production - U. S. • .. • • • • • o o o o o • • • • o • • • o • o • p.'fe
Egg P:r.oduction - Minnesota • o •• o • o • • • • • • • • • ••••••• 2 Monthly Egg Production and Percentage of Yearly Total - U. So •• 0 •••• 3-4 Monthly Egg Production and Percentage of Yearly Total - Minnesota. • • • • • 5 Price Per Dozen Received for Eggs by Farmers - U. S. 0 ••••• o • • • 6 Price Per Dozen Received for Eggs by Farmers - Minnesota • • 0 • • • • • • • 7 Averag~ Annual Farm Prices Received for Eggs and Percent of Parity- u. S •• 8 Margins Between Minnesota Farm Prices and Minneapolis R~tail Prices of Eggs. 9 Form in Which Eggs Were Used- Shell 9 Frozen and Dried- U. S. • •••• 10 Monthly Production of Liquid Egg- U0 s. • • • • • • •.. • ••••••• 11 Monthly Utili~ation' of Liquid Egg - Uo S. o •• o • • • • • o • o •• 12 Liquid Egg Products - U. So •••••••••••• o • • • • • .1)
Breeds of Chickens - U. S. • o o • • 0 • • • • • • • • • • • • .14 Chicks Hatched by Commercial Hatcheries - u. s. • •• 0 • • ,15 Chicks Hatched by Commercial Hatcheries - Minnesota. • • • ••••••• 16 Chicks Hatched for Laying Flock Replacements - u. S •••• o • o •••••• 17 D~ath Loss of IJayers ••• o •••• o • • • • • • • • • • • ••••• 17 Chicken Meat Sold 9 Live Weight of Birds and Prices Received - U. S. • • o .18 Approximate Average Weights and Processing Shrinkages in Poultry •••••• 19 Mtd-Month Farm Prices Received for Chickens - U. S. • • • • • o • • • .20 Mid-MOnth Farm Prices Received for Chickens - Minnesota ••••••••• c21 Red Meat and Poultry Meat Production- U. s •....... o • • •••• 22-23 Per Capita Consumption of Red Meat~ Poultry Meat and Eggs - U, S. • •••• 24-25 Cash Receipts from Poultry, and Percent of Total Cash Farm Receipts ••••• 26
Turkeys .Raised on ·Farms. • • • • o • • • • • • • • • • • • • • • • • • • 27 Death Losij of Turkeys ••••••••••• o • 0 • • o ••••••••• 28 Shift to ~ltaville White and Other Smaller Turkeys, and Source of Turkey Hatching Eggs - Minnesota. • • • • • • • • • • • • • o o • • • • •• o ••• 29 Average Live Weight of Turkeys Sold. • • • • • • • • • • • ••••• 30 Seasonality in Marketing Turkeys •• o • • • • • • • • • • • • • •••• 31 Farm Prices Received for Turk~ys - U. S. • ••••••••••••••• 32 Farm Prices Received for Turkeys - Minnesota •••• o ••••••••••• • 33

I. EGG PRODUCTION - U. S~
----------------------------------------------------------------------------------------------------------------------------------------------------- --------------------- -------------------- ------------------- -------------------
1925-29 1930-34 1935-39 1940-44 1945-49
1950 1951 1952 1953 1954
Total Eggs Produced on Farms {a)
Index 1935-39 :;? 100
(~~~~~~~)----~---------1
37.485 36,768 36,381 48,659 55!1724
sa. 734 59,265 6o ,985 61,704
I I I I I I I I
103 101 100 134 153
161 163 168 170
Hens and Pullets Index on Farms (b) 1935-39 January 1 = 100 -------------r-------(mnuon) 1
408 397 364 443 439
424 410 420 404
I I I I I I I I I I
111 108 100 121 120
414 I I I
115 112 114 110 113
Average Number of Layers on Farms Index during 1935-39 the year = 100 ----------1--------(million)
320 303 283 344 347
342 331 342 340
113 107 100 121 123
121 117 121 120
Eggs Index per 1935-39 Laye~ (c) = 100 ----------t---------
93 93
100 110 127
139 144 145 153
93 93
100 110 127
139 144 145 153
Eggs Index per 1935-39 Layer (d) = 100 _________ , ________ _
117 121 128 141 161
172 175 178 182
I I I 91
94 100 110 126
134 137 139 142
--~--------------------------------------------------------------------------------------------------------------------------------------------------------------------------------------------------------------------------------------(a) Non-farm egg production (from small flocks not actually on farms) is about 10 percent of farm production.
(b) This includes the pullets which are laying, and those not laying, but which are kept for egg production.
(c) Based on the number of hens and pullets on farms January 1.
(d) Based on the average number of layers on farms during the year.
Note: 1. There has been a large increase in the total production of eggs. The percentage increase in total egg production has been more than three times the percentage increase in human population since the pre-war years of 1935-39.
2. There has been a continuous increase in the number of eggs per hen. In 1953 there were 70 percent more eggs produced than the average annual production for 1935-39, with only 20 percent more laying hens.
- 1 -
- 2 -
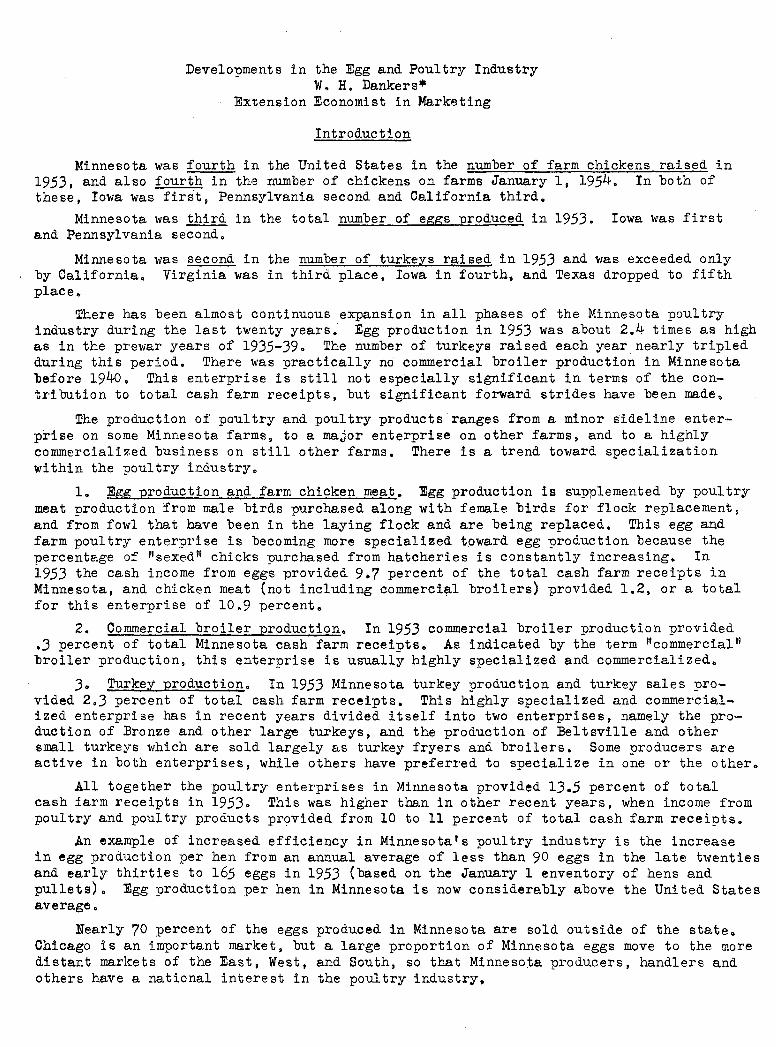
II. EGG PRODUCTION - Minnesota
-------------- ==============~====== ======================== =====================================;======================== Average Number
Total Hens and of Layers Eggs Index Pullets Index on Farms Index Eggs Index Eggs Index Produced 1935-39 on Farms (a) 1935-39 during 1935-39 per 1935-39 per 1935-39 on Farms == 100 January 1 - 100 the year - 100 Layer (b) = 100 Layer (c) = 100
------- --------------------- ----------------------- -------------------- -------------------- --------------------(million) (million) (million)
1925-29 1,424 89 16.2 98 12.9 99 87 91 110 89 19:30-34 1,457 91 16.9 102 12.9 99 86 90 113 92 1935-39 1,599 100 16.6 100 13.0 100 96 100 123 100 1940-44 2,864 179 24.1 145 19.4 149 138 144 148 120 1945-49 3,764 236 27.0 163 21.9 168 139 148 172 140
1950 3,820 239 25.2 152 20.9 161 151 157 183 149 1951 3,842 240 24.5 147 20.7 159 157 163 186 151 1952 3.731 233 23.6 142 19.8 152 158 165 189 154 1953 _ 3,813 I 239 23.1 I 139 19.6 I 151 165 : 172 195 I 158 1954 I 23 3 I 140 I
==================b==============;======='======================J==================l.====================;====== (a) This includes the pullets which are laying and those not laying but which are kept for egg production.
(b) Eased on the number of hens and pullets on farms January 1.
(c) Eased on the average number of layers on farms during the year.
Note: 1. There has been a great expansion in the egg enterprise in Minnesota since the pre-war years of 1935-39. In the last several years, total egg production was more than 2 1/3 times as large as the average annual production for 1935-39. This was due to an increase of over 50 percent in egg production per hen 9 and an increase in numbers of hens and pullets. The increase in numbers of hens and pullets came before 1945. Since then there has been a considerable decrease.
2. To what extent the egg enterprise in Minnesota can remain on an expanded basis will depend on production handling, and distribution costs compared with costs in other states and areas. Most areas of Minnesota are in a favorable situation for low cost production because feeds are in surplus and co~aratively cheap. Much will depend on flock management and marketing methods.
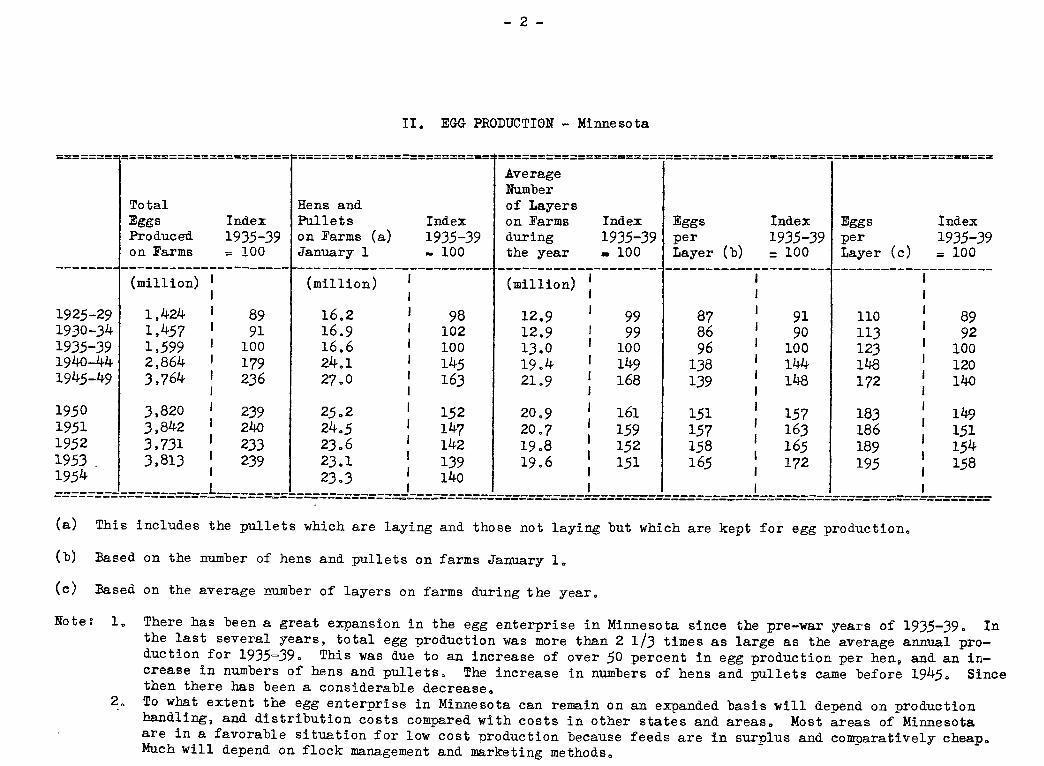
III. MONTHLY EGG PRODUC·riON AI\1D PERCENTAGE OF YH'_ARLY TOTAL - U. S.
Monthly Year Jan Feb.._ Mar Aur Ma:v June Jul:v Au,g, Seut .. Oct Nov Dec. Total Averaf!,e
Millions I:Gii-1 1925-29 1874 2775 4744 5371 5099 411.5 3517 2988 2401 1863 1427 37484 3124 1930-34 2213 3051 4656 .5122 4884 3866 3226 2739 226.5 1817 1 1392 I 1536 36768 3064 193.5-39 2239 2790 4375 4896 46.53 3755 3192 271.5 2270 1951 I 1637 1 1907 36380 3032 194o-44 3442 4070 .56.57 6012 5808 4751 4074 3527 3048 2784 2.523 2963 486.59 405.5 1945-49 4477 4902 6345 6361 6029 5050 4403 3820 3443 3450 ~~4~9J 4011 55719 4643
----1950 5238 .5203 6242 6110 .5901 4997 4.500 4123 I 3847 I 4o47 4062 4464 .58734 4894 1951 5070 5173 6156 604o 5881 .5060 4543 4112 1 3943 I 424o 4345 4793 593.56 4946 1952 5362 5668 6386 6164 5938 4991 4431 4125 I 4081 1 4371 4480 5037 61016 5085 1953 .5416 5304 6272 6068 5872 .5051 4642 4346 1_4:o~J 4614 4803 5267 61861 51.5.5 1954 5448 5476 660.5 6271 6071 52.51
Percent Monthly Production Was of the Total Egg Production for the Year
192.5-29 5.0 7.4 12.6 14.3 13.6 11.0 9.4 8.0 6.4 .s.o 3 • .5 3.8 100.0 1930-34 6.0 8.3 12.7 13.9 13.3 10.5 8.8 7.4 6.2 4.9 3.8 4.2 100.0 193.5-39 6.2 7.7 12.0 13.4 12.8 10.3 8.8 7.5 6.2 .5.4 4~.5 5.2 100.0 194o-44 7.1 8.4 11.6 12.3 11.9 9.8 8.4 7.2 6.3 5.7 .5.2 6.1 100.0 194.5-49 8.0 8.8 11.4 ll.4 10.8 9.1 7.9 6.9 6.2 6.2 6.1 7.2 100.0
1950 8.9 8.9 10.6 10.4 10.0 8.5 7-7 7.0 6.5 6.9 6.9 ?.? 100.0 1951 8.6 8.7 10.4 10.2 9.9 8.5 7.7 6.9 6.6 7.1 7.3 8.1 100.0 1952 8.8 9.3 10.4 10.2 9.7 8.1 7.3 6.8 6.7 7.2 7-3 8.2 100.0 1953 8.8 8 .. 6 10.1 9.8 9 • .5 8.2 ? • .5 7.0 6.8 ?.4 7.8 8.5 100.0 1954
Continued on Page 4
- 3 -
- 4 -
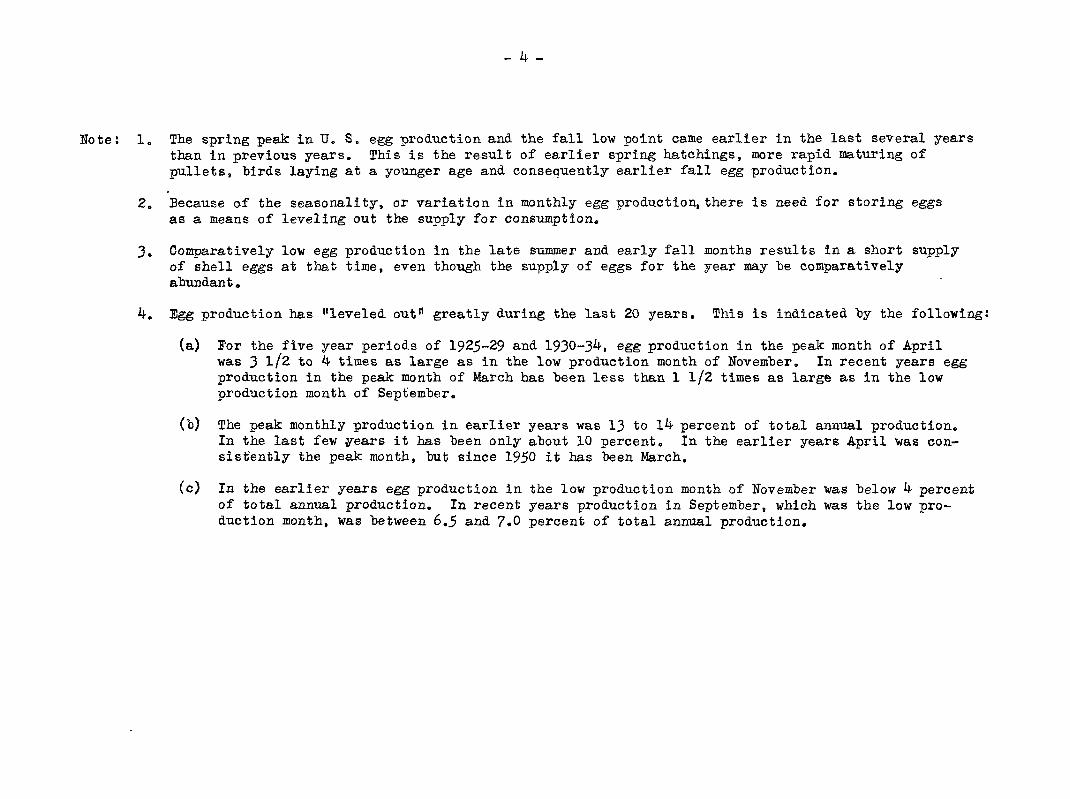
Note: 1. The spring peak in U. S. egg production and the fall low point came earlier in the last several years than in previous years. This is the re~ult of earlier spring hatchings, more rapid maturing of pullets, birds laying at a younger age and consequently earlier fall egg production.
2. Because of the seasonality. or variation in monthly egg productio~there is need for storing eggs as a means of leveling out the supply for consumptiono
3. Comparatively low egg production in the late summer and early fall months results in a short supply of shell eggs at that time, even though the supply of eggs for the year may be comparatively abundant.
4. Egg production has ''leveled out" greatly during the last 20 years. This is indicated by the following:
(a) For the five year periods of 1925-29 and 1930-34, egg production in the peak month of April was 3 1/2 to 4 times as large as in the low production month of November. In recent years egg production in the peak month of March has been less than 1 1/2 times as large as in the low production month of September.
(b) The peak monthly production in earlier years was 13 to 14 percent of total annual production. In the last few ¥ears it has been only about 10 percent. In the earlier years April was consistently the peak month, but since 1950 it has been March.
(c) In the earlier years egg production in the low production month of November was below 4 percent of total annual production. In recent years production in September, which was the low production month, was between 6.5 and 7.0 percent of total annual production.
-
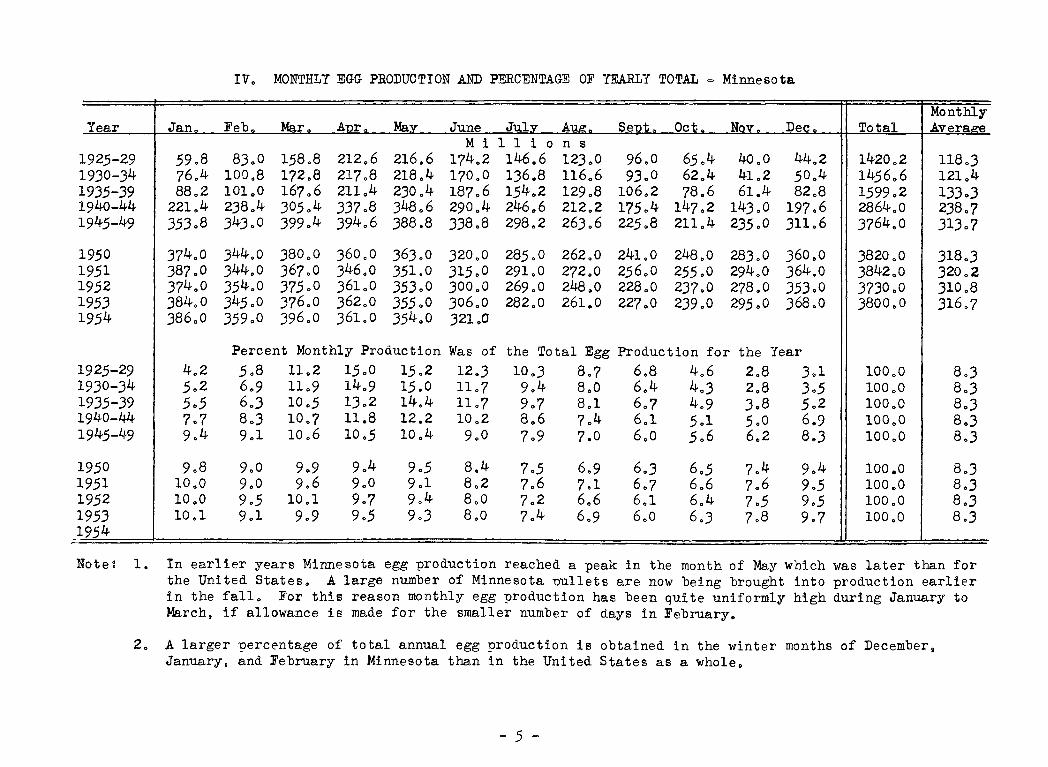
IV. MONTHLY EGG PRODUCTION AND PERCENTAGE OF LW~Y TOTAL - Minnesota
Monthly Year Jan. Feb. Mar. Anr Ma.v June Julv Aue.. Sent Oct Nnv Dec Total Averaee
M i 1 1 i o n s 1925-29 59.8 83.0 1.58.8 212.6 216.6 174.2 146.6 123.0 96.0 6.5 .4 40.0 44.2 1420.2 118.3 1930-34 76.4 100.8 172.8 217.8 218.4 170.0 136.8 116.6 93.0 62.4 41.2 .50.4 14.56. 6 121.4 1935-39 88.2 101.0 167.6 211.4 230.4 187.6 1.54.2 129.8 106.2 78.6 6L4 82.8 1599.2 133.3 1940-44 221.4 238.4 30.5 .4 337.8 348.6 290.4 246.6 212.2 17.5 .4 147.2 143.0 197.6 2864.0 238.7 194.5-49 353.8 343.0 399.4 394.6 388.8 338.8 298.2 263.6 22.5.8 211.4 23.5.0 311.6 3764.0 313.7
1950 374.0 344.0 380.0 360.0 363.0 320.0 28.5. 0 262.0 241.0 248.0 283.0 360.0 3820.0 318.3 1951 387.0 344.0 367.0 346.0 351.0 31.5.0 291.0 272.0 2.56.0 2.5.5 .o 294.0 364.0 3842.0 320.2 1952 374.0 3.54.0 37.5.0 361.0 3.53.0 300.0 269.0 248.0 228.0 237.0 278.0 3.53.0 3730.0 310.8 1953 384.0 345.0 376.0 362.0 3.55.0 306.0 282.0 261.0 227.0 239.0 29.5 .o 368.0 3800.0 316.7 19.54 386.0 3.59.0 396.0 361.0 3.54.0 321 .o
Percent Monthly Production Was of the Total Egg Production for the Year 1925-29 4.2 5.8 11.2 15.0 15.2 12.3 10.3 8.7 6.8 4.6 2.8 3.1 100.0 8.3 1930-34 5.2 6.9 11.9 14.9 1.5.0 11.7 9.4 8.0 6.4 4.3 2.8 3 • .5 100.0 8.3 1935-39 5.5 6.3 10.5 13.2 14.4 11.7 9.7 8.1 6.7 4.9 3.8 .5.2 100.0 8.3 1940-44 7.7 8.3 10.7 11.8 12.2 10.2 8.6 7.4 6.1 .5.1 .5.0 6.9 100.0 8.3 1945-49 9.4 9.1 10.6 10.5 10.4 9.0 7.9 7.0 6.0 5.6 6.2 8.3 100.0 8.3
19.50 9.8 9.0 9.9 9.4 9.5 8.4 7.5 6.9 6.3 6.5 7.4 9.4 100.0 8.3 1951 10.0 9.0 9.6 9.0 9.1 8.2 7.6 7.1 6.7 6.6 7.6 9.5 100.0 8.3 1952 10.0 9.5 10.1 9.7 9.4 8.0 7.2 6.6 6.1 6.4 7.5 9.5 100.0 8.3 1953 10.1 9.1 9.9 9.5 9.3 8.0 7.4 6.9 6.0 6.3 7.8 9.7 100.0 8.3 19.54
Note: 1. In earlier years Minnesota egg ~reduction reached a peak in the month of May which was later than for the United States. A large number of Minnesota uullets are now being brought into production earlier in the fall. For this reason monthly egg production has been quite uniformly high during January to March, if allowance is made for the smaller number of days in February.
2. A larger percentage of total annual egg production is obtained in the winter months of December, January, and February in Minnesota than in the United States as a whole.
- .5 -

~ 6 =
Vo PRICE PER DOZEN RECEIVED BY FARMERS = U. S. Mid-Month Prices
Year Jan. Feb. Maro Apr. May J une J 1 UlY A mgo s t ep· • 0 t c 0
(Cents per Dozen) 1 925-29 38.6 30o9 24o0 2Jo0 2?.7 23o9 25)+ 27o4 3L5 36o? 1930-34 2J.3 17ol 14o6 14o3 13.7 13o3 14.6 16.6 20.0 23.2 1935~39 22o) 20.5 1?.6 17.7 18o0 18o1 19.5 20o8 23.9 26ol 94D=44 28.6 26.1 24.3 24.2 2406 25.7 2?o8 29o6 32o6 35o4
1945=49 43.8 38.7 37o8 38o0 38o4 39o6 42o4 46ol 4806 5L1 1
1950 3L2 29.6 31.6 30.9 29.6 30.1 34.3 38.0 40.4 43o2 1951 42,6 41.4 43.7 4J,2 45.2 44.7 46.6 49.6 55.0 55.6 1952 4Do5 34.7 34.0 35o2 34.2 35;7 43.3 48.2 48.7 50.3 1 953 45.8 4200 44.7 45.5 45.9 45.7 47.7 50.2 51.4 53.3 1954 46.3 45 .? 38.7 35.0 33.1 32.9
Index of Monthly Prices = Simple Annual Average ~ 100 1925-29 123 98 76 73 88 76 Ro 87 100 117
N ov.
43o4 27o4 29.1 38o2 50.7
45.6 56.5 51.9 49.7
138
D c e •
45.5 25.8 26o? 38o0 49.4
57.7 51.1 46.6 48 .. 5
144
Simple Annual Av rage e
31.5 18o? 21.7 29o6 43.7
36.9 47.9 41.9 47o5
100 1930-34 125 92 78 77 74 71 78 89 107 124 147 138 100 1935=39 103 94 82 82 83 83 90 96 110 120 134 123 100 194o-44 97 88 82 82 83 87 94 100 110 120 129 128 100 1945-49 100 89 86 87 88 91 97 105 111 117 116 113 100
1950 85 80 86 84 80 82 93 103 110 117 124 156 100 1951 89 86 91 90 94 93 97 104 115 116 118 107 100 1952 96 83 81 84 82 85 103 115 116 120 124 111 100 1953 96 88 94 96 97 96 100 106 108 112 105 102 100 1954 Note~ 1. The degree of "seasonality" in egg prices has been less than in egg production. =Compare with Table III.
2. The lowest mid-month prices for eggs occured from about February or March through June~ when monthly production of eggs was at or near the yearly peak. = Compare with Table III.
3. The highest mid-month prices for eggs occurred in the fall months when monthly production of eggs was at or near the yearly low point. = Compare with Table II!.
4" Producers are getting flocks into production earlier in the fall than they used to. Because more eggs were produced in the fall and winter months, egg prices in recent years already declined in late fall and rose again earlier the next summerp compared with earlier periods.
5. Producers who bring their flocks into production in late gummer and early fall have a decided advantage 9
and can "cash in" on higher egg prices.
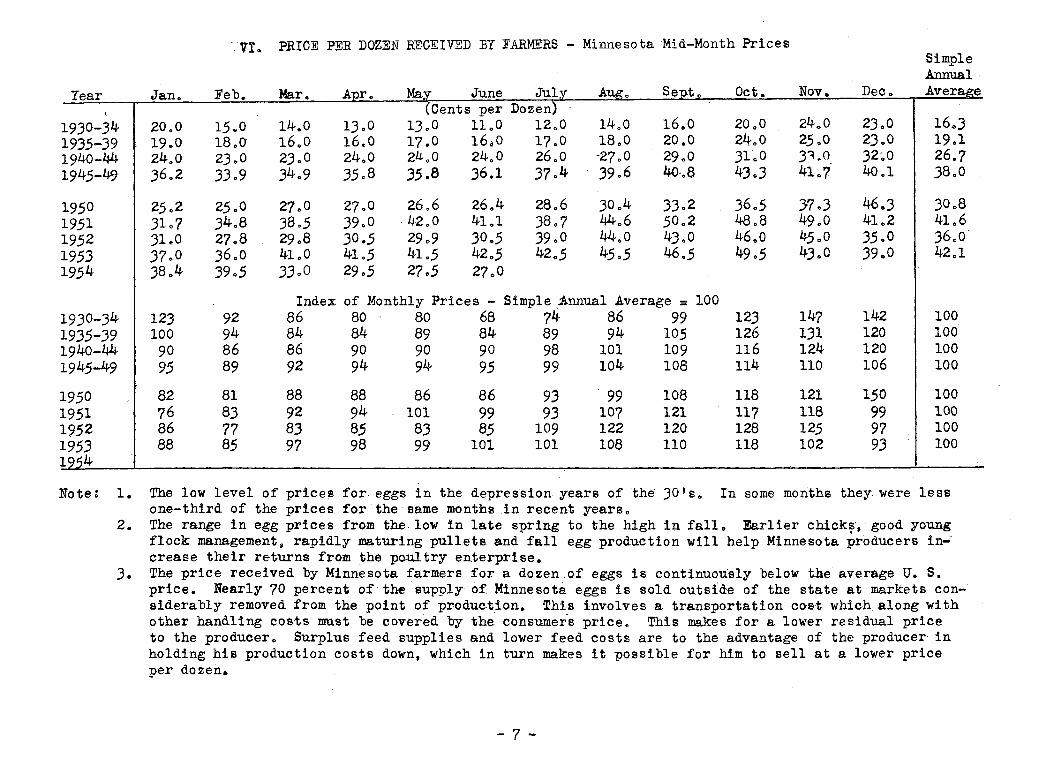
·.VI. PRICE PER DOZEN RECEIVED B7 FARMERS - Minnesota Mid-Month Prices
7ear Jan. Feb. Mar. Ap"J'. May June July~ Aw;. s 0 ep.t. ct. (Cents per Dozen) -
\
1930-34 20.0 1.5.0 14.0 13.0 13.0 11.0 12.0 14.0 16.0 20.0 193.5-39 19.0 18.0 16.0 16.0 17.0 16.;0 17.0 18.0 20.0 24.0 1940-~ 24.0 23.0 23.0 24.0 2LI..o 24.0 26.0 -27 .o 29.0 3LO 194.5-49 36.2 33.9 34.9 3.5.8 35.8 36.1 37.4 39.6 40-.8 43.3
19.50 2.5 .2 25.0 27.0 27.0 26.6 26.4 28.6 30.4 33.2 36.5 19.51 31.7 34.8 38 • .5 39.0 . 42.0 41.1 38.7 44.6 .50.2 48.8 19.52 31.0 27.8 29.8 30 • .5 29.9 30 • .5 39.0 4L.~. 0 4).0 46.0 19.53 37.0 36.0 . 41.0 41.5 41..5 42 • .5 42.5 4.5 • .5 46 • .5 49.5 19.54 )8.4 39.5 33.0 29.5 27.5 27o0
Index of Monthly Prices - Simple ~nnua1 Average = 100 19.30-34 123 92 86 80 80 68 74· 86 99 12.3 19.3.5-39 100 94 84 84 89 84 89 94 10.5 126 1940-44 90 86 86 90 90 90 98 101 109 116 194.5-49 9.5 89 92 94 94 9.5 99 104 108 114
19.50 82 81 88 88 86 86 9.3 . 99 108 118 19.51 76 83 92 94 101 99 9.3 107 121 117 1952 86 77 8.3 85 83 85 109 122 120 128 19.5.3 88 85 97 98 99 101 101 108 110 118 19.54
N ov.
24 .. 0 2.5 .o 31.0 4l.i
}7 .3 49.0 4.5 .o 43.0
147 131 124 110
121 118 12.5 102
D ec.
23.0 23.0 32-.o 4o.l
46.3 41.2 3.5.0 39.0
142 120 120 106
1.50 99 97 93
Simple Annual· A :verage
16 .. 3 19.1 26.7 38.0
30.8 41.6 36.o· 42.1
100 100 100 100
100 100 100 100
Note: 1. The low level of price)!! for. eggs in the depression years of the 30's. In some months- they were less one-third of the prices for the same months in recent years.
2. The range in egg prices from the. low in late spring to the high in fall. Earlier chick~,· good young flock management, rapidly maturing pullets and fall egg production will help Minnesota producers in-· crease their returns from the poultry enterprise.
J. The price received by Minnesota farmers for a dozen.of eggs is continuously below the average U. S. price. Nearly 70 percent of the supply of Minnesota eggs is sold outside of the state at markets considerably removed from the point of production. Thi-s involves a transportation cost which along with other handling costs must be covered by the. consumer·s price. This makes for a lower residual price to the producer. Surplus feed supplies and lower feed costs are to the advantage of the producer in holding his production costs down, which in turn makes it possible for him to sell at a lower price per dozen.
- 7 -
Year
1930-34 1935-39 1940-44 1945-49
1950 19.51 1952 1953 1954
Note:
- 8 -
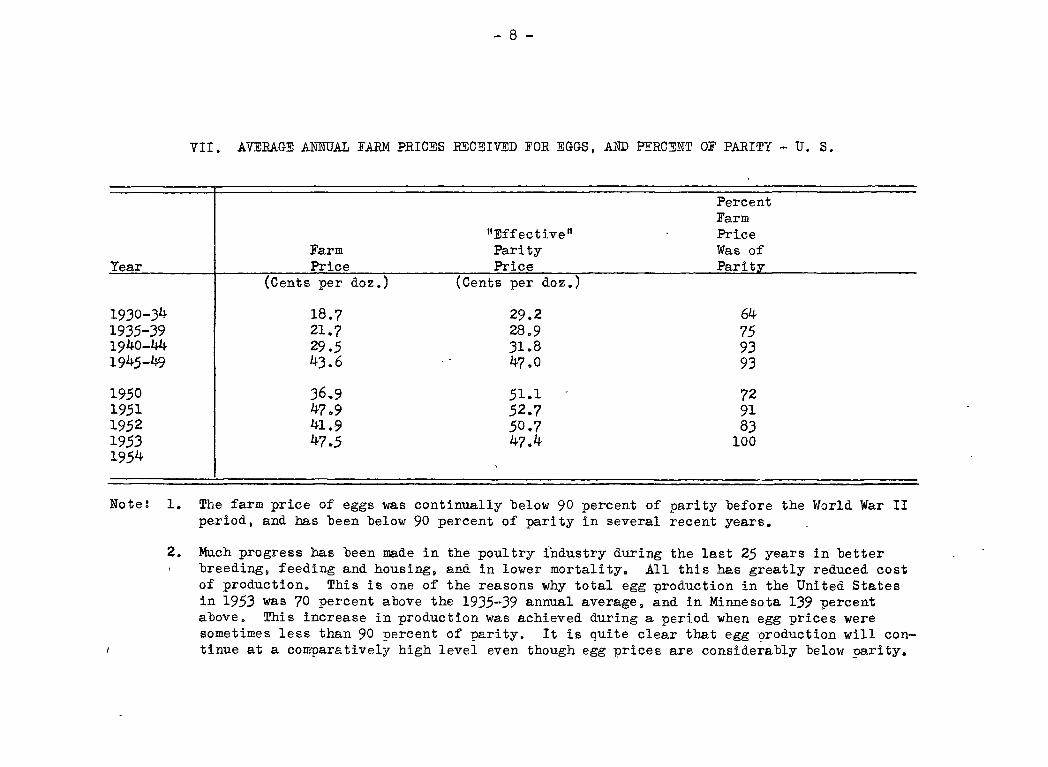
VII. AVERAGE ANNUAL FARM PRICES RECEIVED FOR EGGS p AND P!:RCENT OF PARITY - U. S.
Percent Farm
"Effective" Price Farm Parity Was of Price Price Parit
(Cents per doz.) {Cents per doz.)
18.? 29.2 64 21.? 28.9 ?5 29.5 31.8 93 43.6 4? .o 93
36.9 51.1 72 4?.9 52.? 91 41.-9 50.? 83 4?.5 47.4 100
1. The farm price of eggs was continually below 90 percent of parity before the \forld War II period, and has been below 90 percent of parity in several recent years.
2. Much progress has been made in the poultry industry during the last 25 years in better breeding. feeding and housing, and in lower mortality. All this has greatly reduced cost of production. This is one of the reasons why total egg ~reduction in the United States in 1953 was ?0 percent above the 1935-39 annual average, and in Minnesota 139 percent above. This increase in production was achieved during a period when egg prices were sometimes less than 90 ~ercent of parity. It is quite clear that egg ~reduction will continue at a comparatively high level even though egg ~rices are considerably below ~rity.
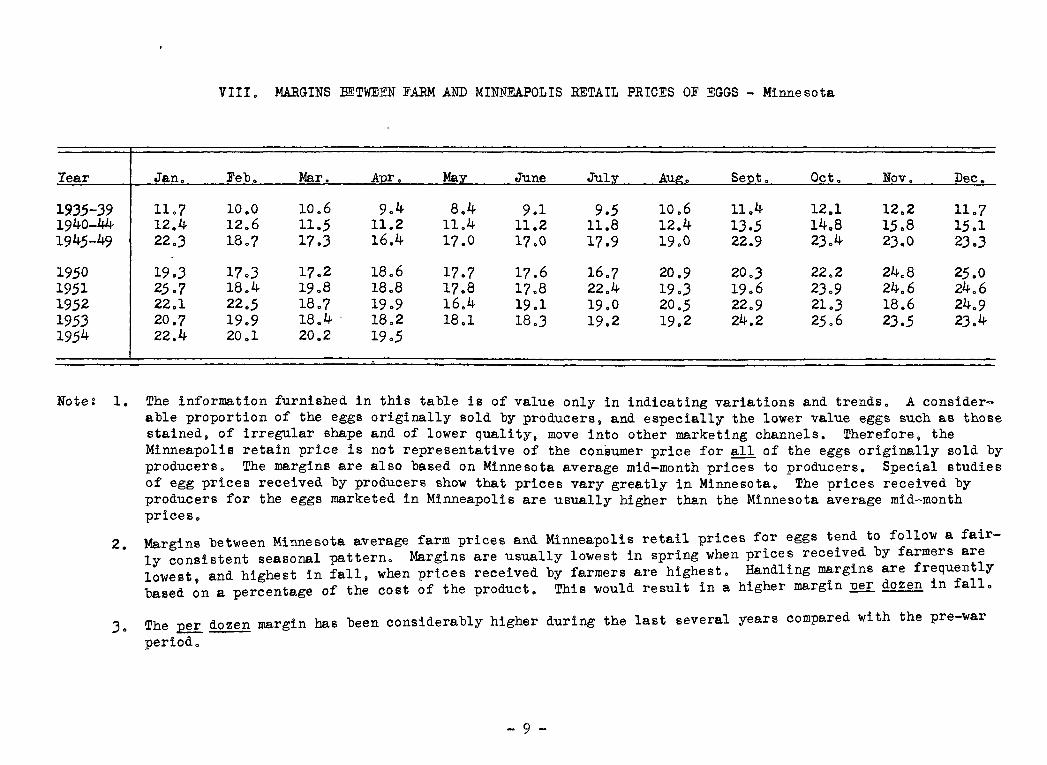
VIII. MARGINS BETWEEN FARM AND MINNW~OLIS RETAIL PRICES OF ~GGS - Minnesota
Year Jan. Feb. Mar. .A r. Ma June Jul Oct. Nov. Dec •
19.35-.39 11.7 10.0 10.6 9.4 8.4 9.1 9.5 10.6 11.4 12.1 12.2 11.7 1940-44 12.4 12.6 11.5 11.2 11.4 11.2 11.8 12.4 1.3.5 14.8 15.8 15.1 1945-49 22.3 18.7 17.3 16.4 17.0 17.0 17.9 19.0 22.9 2,3.4 23.0 2.3 • .3
1950 19 • .3 17 • .3 17.2 18.6 17.7 17.6 16.7 20.9 20 • .3 22.2 24.8 25.0 1951 25.7 18.4 19.8 18.8 17.8 17.8 22.4 19 • .3 19.6 23.9 24.6 24.6 1952 22.1 22.5 18.7 19.9 16.4 19.1 19.0 20.5 22.9 2L3 18.6 24.9 195.3 20.7 19.9 18.4 - 18.2 18.1 18.3 19.2 19.2 24.2 25.6 2.3.5 2.3.4 1954 22.4 20.1 20.2 19.5
Note: 1. The information furnished in this table is of value only in indicating variations and trends. A considerable proportion of the eggs originally sold by producersp and especially the lower value eggs such as those stained, of irregular shape and of lower qualityt move into other marketing channels. Therefore, the Minneapolis retain price is not representative of the consumer price for all of the eggs originally sold by producers. The margins are also based on Minnesota average mid-month prices to producers. Special studies of egg prices received by producers show that prices vary greatly in Minnesota. The prices received by producers for the eggs marketed in Minneapolis are usually higher than the Minnesota average mid-month prices.
2.
3.
Margins between Minnesota average farm prices and Minneapolis retail prices for eggs tend to follow a fairly consistent seasonal pattern. Margins are usually lowest in spring when prices received by farmers are lowest, and highest in fall, when prices received by farmers are highest. Handling margins are frequently based on a percentage of the cost of the product. This would result in a higher margin ~er dozen in fall.
The per dozen margin bas been considerably higher during the last several years compared with the pre-war
period.
- 9 -
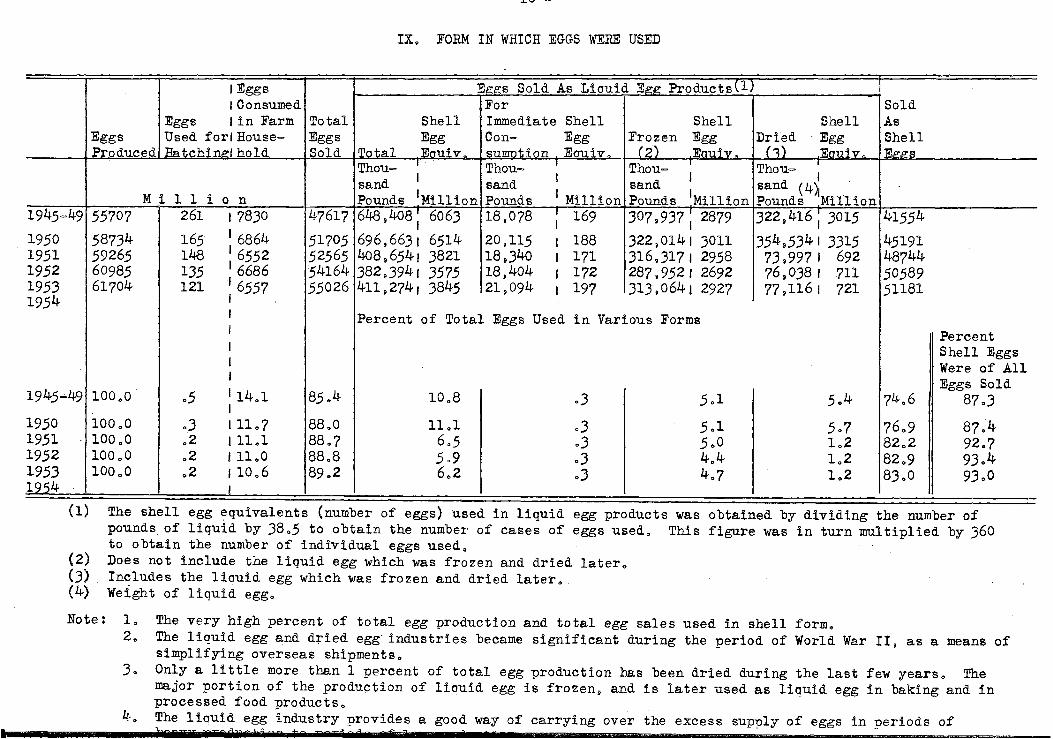
IX. FORM IN WHICH EGGS WH'JiE USED
I Eggs Eggs Sold As Liauid Eee Products\1) I Consumed For Sold
Eggs I in Farm Total Shell Immediate Shell Shell Shell As Eggs Used foriHouse- Eggs Egg Con- Egg Frozen Egg Dried Egg Shell Produced Batchinel hold Sold I Total Enuiv sumntion Eouiv 1_2) Eouiv, (1) Eouiv~ IEee,s
Thou-I ..
Thou- I Thou- Thou= I
I I sand l I sand sand sand (4~ . Pounds 1Million 1 Million Pounds I M i 1 1 i o n Pounds Million Pounds Mill ion
1945=49 55707 261 I 7830 47617 648,408; 6063 18,078 I 169 307,937; 2879 322,416 I 3015 41554 I 1950 58734 165 I 6864 51705 696,663 I 6514 20,ll5 I 188 322,0141 3011 354,534 I 3315 45191 1951 59265 148 I 6552 52565 408, 654 I 3821 18 .34o I 171 316.3171 2958 73,997 I 692 48744 1952 60985 135 I 6686 54164 382,3941 3575 18,404 I 172 287, 952 I 2692 76,038 I 711 50589 1953 61704 121 I 6557 55026 411,2741 3845 21,094 I 197 313,064! 2927 77,116 I 721 51181 1954 I
I Percent of Total Eggs Used in Various Forms I Percent I Shell Eggs I Were of All I
1945.-.49 100.0 .5 114.1 85.4 10.8 Eggs Sold
.3 5.1 5.4 74.6 87.3
1950 1951 1952 1953 19S4
I 100.0 .3 I 11.7 88.0 11.1 .3 5.1 5.7 76.9 87~4 100.0 .2 I 11.1 88.7 6.5 .3 5.0 1.2 82.2 92.7 100.0 .2 111.0 88.8 5.9 .3 4.4 1.2 82.9 93.4 100.0 .2 I 10.6 89.2 6.2 .3 4.7 1.2 83.0 93.0
I
(1) The shell egg equivalents (number of eggs) used in liquid egg products was obtained by dividing the number of pounds of liquid by 38.5 to obtain the number of cases of eggs used. This figure was in turn multiplied by 360 to obtain the number of individual eggs used.
(2) Does not include the liquid egg which was frozen and dried later. (3) Includes the liouid egg which was frozen and dried later. (4) Weight of liquid egg.
Note: 1. The very high percent of total egg production and total egg sales used in shell form. 2. The liquid egg and dried egg industries became significant during the period of World War II, as a means of
simplifying overseas shipments. 3. Only a little more than 1 percent of total egg production has been dried during the last few years. The
major portion of the production of liouid egg is frozen, and is later used as liquid egg in baking and in processed food products.
4. The liouid egg industry provides a good way of carrying over the excess sup~ly of eggs in neriods of
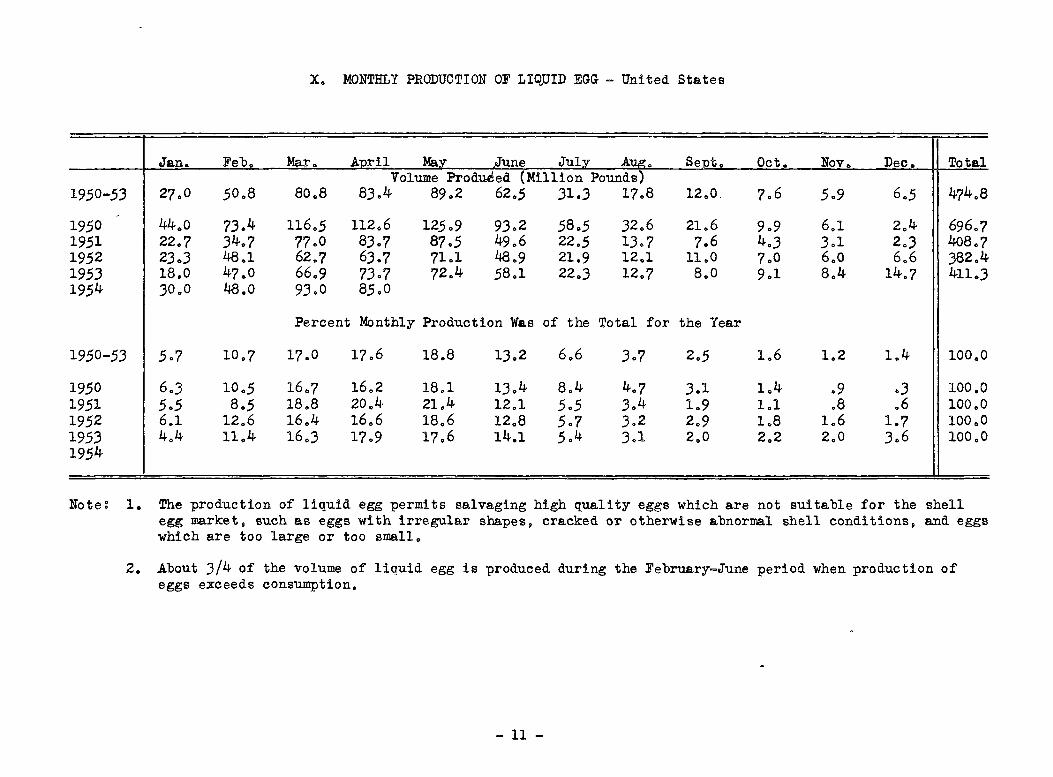
X. MONTHLY PRODUCTION OF LI~UID EGG - United States
Jan. Feb. Mar. April Ma.y June July Aug. Sept. Oct. Nov. Dec. Total Volume Produeed (Million Pounds)
19.50-.53 27.0 .50 .8 80.8 83.4 89.2 62 • .5 31.3 17.8 12.0. 7.6 .5.9 6 • .5 474.8
19.50 44,.0 73.4 116 • .5 112.6 12.5 .9 93.2 .58 • .5 32.6 21.6 9.9 6.1 2.4 696.7 19.51 22.7 34.7 77.0 83.7 87 • .5 49.6 22 • .5 13.7 7.6 4.3 3.1 2.3 408.7 19.52 23 .. 3 48.1 62.7 63.7 71.1 48.9 21.9 12.1 11.0 7.0 6.0 6.6 382.4 19.53 18.0 47 .. 0 66.9 73.7 72.4 .58.1 22.3 12.7 8.o 9.1 8.4 14.7 411 .. 3 19.54 30.0 48.0 93.0 8.5.0
Percent Monthly Production Was of the Total for the Year
19.50-.53 .5.7 10.7 17.0 17.6 18.8 13.2 6.6 3.7 2 • .5 1.6 L2 1.4 100.0
19.50 6.3 10 • .5 16.7 16.2 18.1 13.4 8.4 4.7 3.1 1.4 .9 .3 100.0 19.51 .5 • .5 8 • .5 18.8 20.4 21.4 12.1 .5 • .5 3.4 1.9 1.1 .8 .6 100.0 19.52 6.1 12.6 16.4 16.6 18.6 12.8 .5.? 3.2 2.9 1.8 L6 1.7 100.0 19.53 4.4 11.4 16.3 17.9 17.6 14.1 .5.4 3.1 2.0 2.2 2.0 3.6 100.0 19.54
Note: 1. The production of liquid egg permits salvaging high quality eggs which are not suitable for the shell egg markett such as eggs with irregular shapest cracked or otherwise abnormal shell conditionst and eggs which are too large or too small.
2. About 3/4 of the volume of liquid egg is produced during the February-June period when production of eggs exceeds consumption.
- 11 -

- 12 -
XI. MONTHLY UTILIZATION OF LIQUID EGG -United States
(Percent of Total Production) ' -
Jan. Feb. Mar. Anril Ma:v June July Aue. Sent. Oct. Nov. Dec. Total T 1250-5~
Frozen 72'.9 74.2 79.3 76.9 72.1 64.3 56.6 61.0 63.5 62.5 61.4 73.1 71.-5 For Drying 20.1 19.6 17.8 19.7 25.2 32.5 40.0 30.3 32-.3 26.1 31.3 20.6 24.4 For Immediate -
Consumptio-n 7.0 6.2 2.9 ).4 2.7 3.2 3.4 8.7 4.2 11.4 7.3 6.~ 4.1
12.22. -Frozen 67.7 64.0 66.9 57.1 46.0 31.5 30.4 41.2 39.0 45.8 39.3 57.3 50.8 For Drying 26.4 30.9 31.6 40.1 52.4 67.1 67.4 53.0 58.2 45.4 52.1 30.0 46.3 For Immediate Consumption 5.9 5.1 L5 2.8 1.6 1.4 2.2 - 5.8 2.8 8.8 8.6 .12. 7 - 2.9
-
!2.51. Frozen 68.2 -,3.7 87.1 87.0 85.5 80.0 -86.6 79.6 84.1 73.7 83.1 68.6 83.1 For Drying 23.4 18.8 10.4 9.6 12.1 16.2 8.2 8.5 9.0 5.3 3.7 11.6 12.4 For Immediate Consumption 8.4 7.5 2.5 3.4 2.4 3.8 5.2 11.9 6.9 21.0 13.2 19.8 4.-5
ill£ Frozen 76.9 79.1 87.2 86.4 88.4 86.4 75.7 77.1 85.2 69.2 74.5 7:5.8 83.8 For Drying 16.8 15.0 9.7 9.2 7.8 9.3 19.4 11.9 10.8 17.1 19.5 18.0 11.4 For Immediate Consumption 6.3 5.9 3.1 4.4 3.8 4.3 4.9 11.0 4.0 13.7 6.0 6.2 4.8
1ill Frozen 86.2 85.4 84.3 87.5 85.1 85.0 76.1 76.3 80.5 70.3 59.8 75.2 83.4 For Drying 4.7 7.3 9.9 9.3 10.8 10.4 20.2 1J.4 13.8 21.8 35.0 21.0 11.5 For Immediate Consumption 9.1 7.3 5.8 J.2 -4.1 4.6 3.7 10.3 5.7 7.9 5.2 J.2 5.1
Note: 1. Because a large percentage of the volume of liquid egg is produced during the seagon when egg production exceeds consumption only a small percentage of it is used for "immediate consumption". A lar-ge percentage of the volume produced during the surplus production season is frozen and stored and is used during the season of short supply.
2. The volume of liquid egg dried is usually quite low. It rises considerably in a year like 1950 when production is high in relation to the prevailing demand. and egg prices are comparatively low.
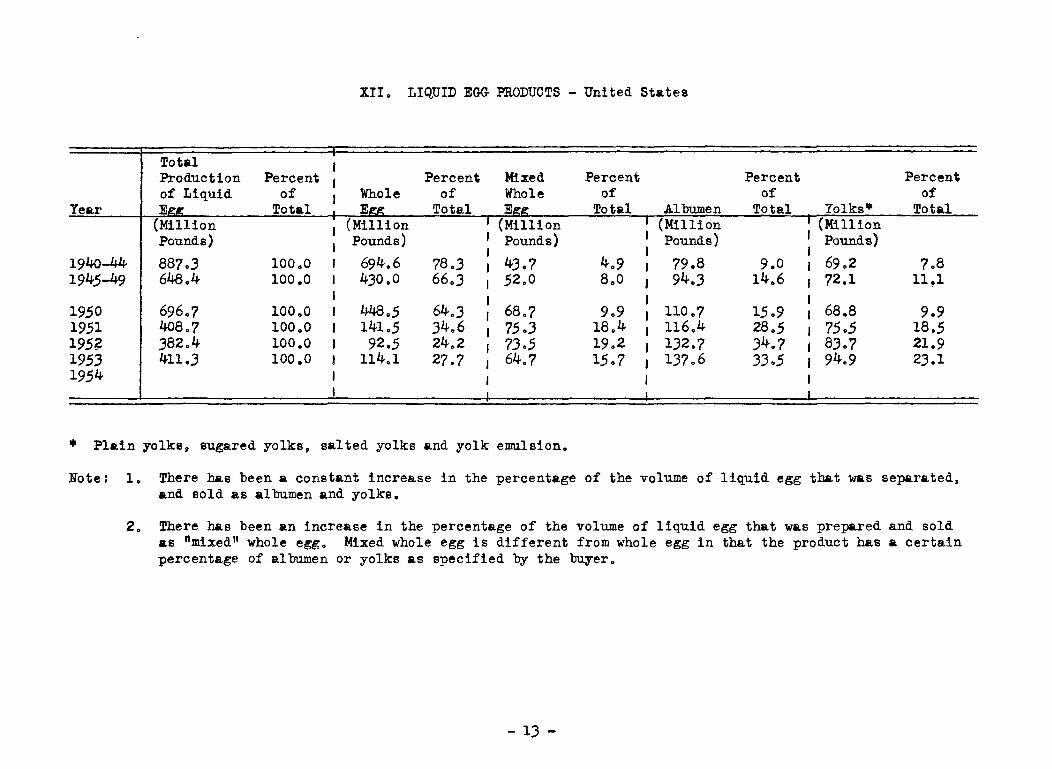
XII. LIQUID EGG PRODUCTS - United States
Total Production Percent Percent Percent Percent Percent of Liquid of of of of of
Year E Total Total Total Albumen Total Yolks* Total (Million (Million (Million Pounds) Pounds) 1 Pounds)
I 194o-44 887.3 100.0 78.3 4.9 79.8 9.0 I 69.2 7.8 1945-49 648.4 100.0 66.3 8.0 94 .. 3 14.6 72.1 11!1
1950 696.7 100.0 448.5 64.3 68.7 9.9 110.7 15.9 68.8 9.9 1951 4o8.7 100.0 141.5 34.6 75.3 18.4 116.4 28.5 75.5 18.5 195? 382.4 100.0 92.5 24.2 73.5 19.2 132.7 34.7 83.7 21.9 1953 411.3 100.0 114.1 27.7 64.7 15.7 137.6 33.5 94.9 23.1 1954
* Plain yolks, sugared yolks, salted yolks and yolk emulsion.
Note: 1. There has been a constant increase in the percentage of the volume of liquid egg that was separated. and sold as albumen and yolks.
2. There has been an increase in the percentage of the volume of liquid egg that was prepared and sold as 11mixed 11 whole egg. Mixed whole egg is different from whole egg in that the product has a certain percentage of albumen or yolks as specified by the buyer.
- 13-
- 14·~
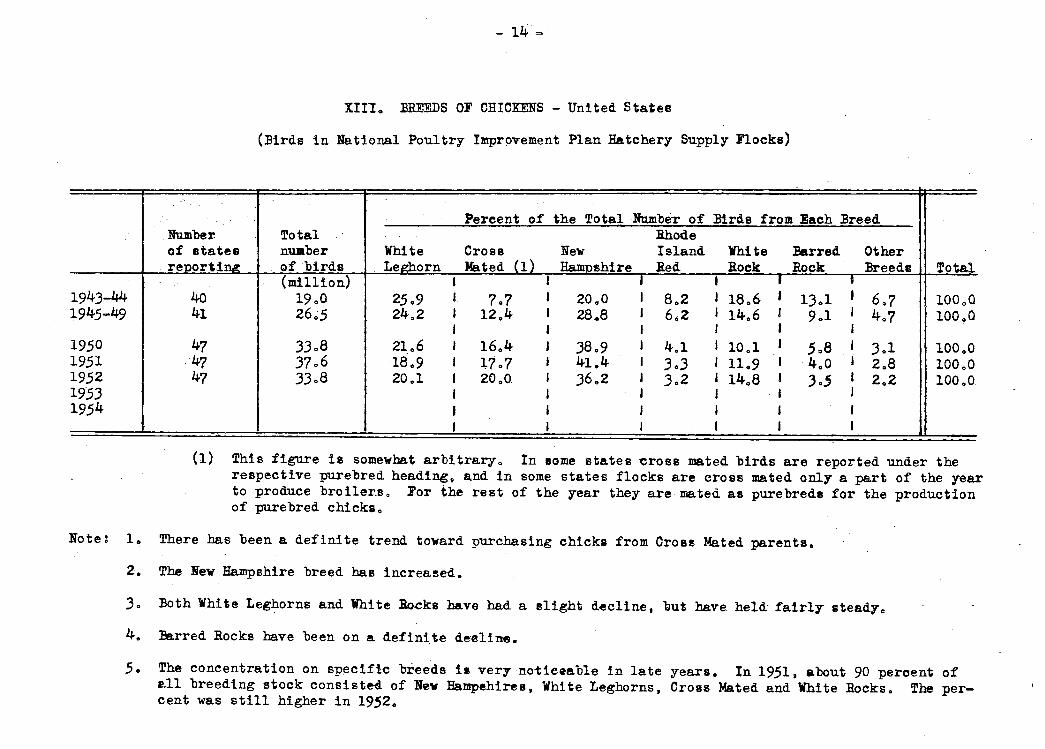
XIIIo BREEDS OF CHICKENS - United States
(Birds in National Poultry Improvement Plan Hatchery Supply Flocks)
-
Percent of the Total NumbeT of Birds from Each Breed Number Total · Rhode of states nlllllber White Cross New Island White l!arred Other re1>ortinz of birds Leehorn Mated (1) Hamnshire Red Rock Rock :Breeds Total
(million) I I I I J I
1943-44 4o 19.0 25.9 I 7.7 I 20.,0 I 8.2 I 18.6 I 13.1 I 6.7 100.0 1945-49 41 26.5 24.2 I 12.4 I 28.8 I 6.2 I 14.6 I 9.1 I 4.7 100.0
1950 1951. 1952 1953 1954
I I I I I I 47 33.8 21.6 I 16.4 I 38.9 I 4.1 I 10.1 I 5.a I 3.1 100.0 47 37.6 18.9 I 11.7 I 41.4 I 3.3 I 11.9 I 4.0 I 2.8 100.0 47 33.8 20.1 I 20.0 I 36.2 I 3.2 I 14.8 I J.S l 2.2 100.0
I I I I I I
I I I I I I I I I I I I
{1) This figure is somewhat arbitrary. In some states cross mated birds are reported under the respective purebred heading, and in some states flocks are cross mated only a part of the year to produce broiler.s. For the rest of the year they are mated as purebrede for the production of purebred chicks.
Note: 1. There bas been a definite trend toward purchasing chicks from Cross Mated parents.
2. The New Hampshire breed has increased.
3. Both White Leghorns and White Rocks have had a slight d~cline, but have held· fairly- steadyc
4. :Barred Rocks have been on a definite de-eline.
5. The concentration on specific breeds ie very noticeable in late years. In 1951, about 90 percent of e.ll breeding stock consisteG. of Nev Hampehirea, White Leghorns, Cross Mated and White Rocks. The percent was still higher in 1952.
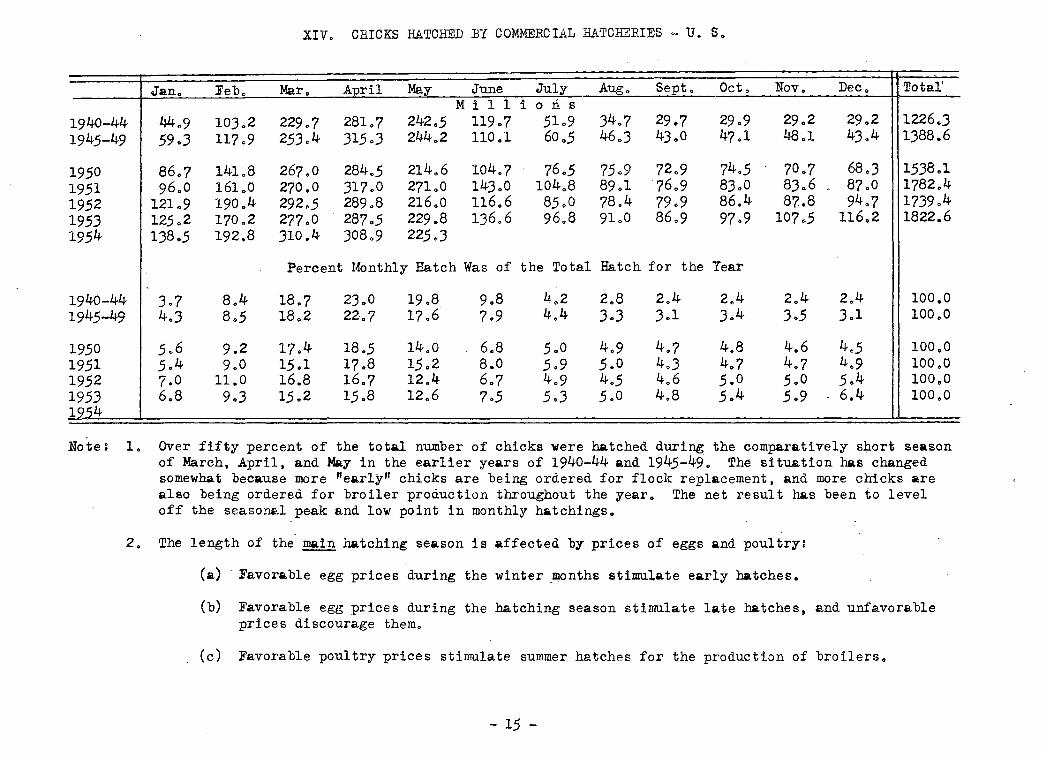
XIV. CRICKS HATCHED :BY COMMERCIAL HATCHERIES - U. S.
Jan. Feb. Mar. April May June July Aug. Sept. Oct. Nov. Dec. Total' M i 1 1 i 0 ri s
1940-44 44.9 103.2 229.? 281.? 242 • .5 119.? .51.9 34.? 29.7 29.9 29.2 29.2 1226.3 194.5-49 .59.3 11? .9 2.53 .4 31.5.3 244.2 110.1 60 • .5 46.3 43.0 47.1 48.1 43.4 1388.6
19.50 86.? 141~8 26?.0 284 • .5 214.6 104.? ?6 • .5 7.5.9 ?2.9 ?4 • .5 70.7 68.3 1.538.1 19.51 96.0 161.0 2?0 .o 31?.0 2?LO 143.0 104.8 89.1 76.9 83.0 83.6 . 8?.0 1?82.4 19.52 121.9 190.4 292 • .5 289.8 216.0 116.6 8.5.0 ?8.4 ?9.9 86.4 87.8 94.7 1?39.4 19.53 12.5 .2 1?0.2 2??.0 28? • .5 229.8 136.6 96.8 91.0 86.9 97.9 10?6.5 116.2 1822.6 19.54 138 • .5 192.8 310.4 308.9 22.5 .3
Percent Monthly Hatch Was of the Total Hatch for the Year
1940-44 3.? 8.4 18.7 23.0 19.8 9.8 4.2 2.8 2.4 2.4 2.4 2.4 100.0 194.5-49 4.3 8 • .5 18.2 22-.? 1?.6 ?.9 4.4 3.3 3.1 3.4 3 • .5 3.1 100.0
19.50 _5.6 9.2 1?.4 18 • .5 14.0 6.8 .5.0 4.9 4.? 4.8 4.6 4 • .5 100.0 19.51 _5.4 9.0 1.5.1 1?.8 1.5.2 8.0 .5.9 .5.0 4.3 4.7 4.? 4.9 100.0 19.52 ?.0 11.0 16.8 16.? 12.4 6.? 4.9 4 • .5 4.6 .5.0 _5.0 .5.4 100.0 19.53 6.8 9 .. 3 1.5.2 1.5.8 12.6 ? • .5 .5.3 .5.0 4.8 .5.4 .5.9 6.4 100.0 1954
Note: 1. Over fifty percent of the total number of chicks were hatched during the comparatively short season of March, April, and May in the earlier years of 1940-44 and 194.5-49. The situation has changed somewhat because more "early" chicks are being ordered for flock replacement, and m6re chicks are also being ordered for broiler production throughout the year. The net result has been to level off the seaso~l peak and low point in monthly hatchings.
2. The length of the main hatching season is affected by prices of eggs and poultry:
(a) ·Favorable egg prices during the winter months stimulate early batches.
(b) Favorable egg prices during the hatching season stimulate late hatches, and unfavorable prices discourage them.
(c) Favorable poultry prices stimulate summer hatches for the production of broilers.
- 1.5 -
- 16-
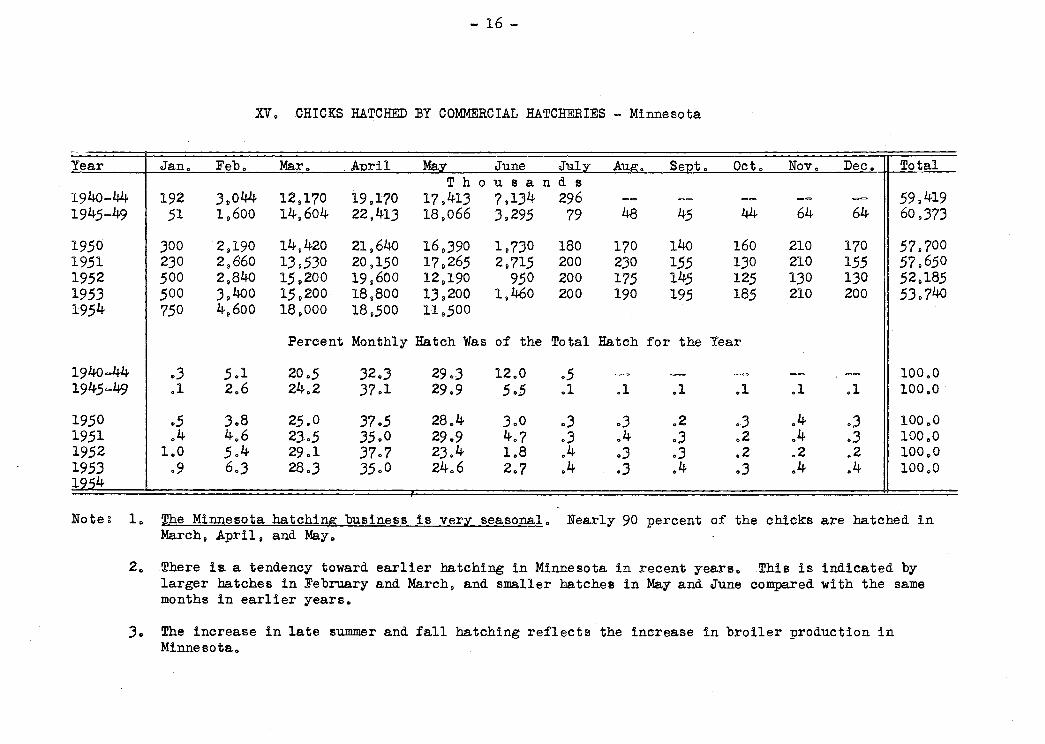
XV. CHICKS HATCHED :BY COMMERCIAL HATCHERIES - Minnesota
Year Jan. Feb. Mar. . April May June July Aug. Sept. Oct. Nov. Dec. Total T h o u s a n d s
1940-44 192 39044 12.170 19.170 17.413 7.134 296 -- -- -- -- -- 59.419 1945-49 51 19600 14,604 22,413 18.066 3.295 79 48 4.5 44 64 64 60,373
1950 300 2,190 14,420 21.640 16,390 1.730 180 170 140 160 210 170 57.700 1951 230 2.660 13,530 20.150 17,26.5 2.71.5 200 230 155 1.30 210 155 57,650 19.52 500 2,840 1.5,200 19.600 12.190 950 200 175 14.5 125 130 130 52.185 1953 sao 3,400 1.5,200 18.800 13,200 1,460 200 190 19.5 18.5 210 200 53.740 1954 750 4.600 18,000 18,500 11.500
Percent Monthly Hatch Was of the Total Hatch for the Year
1940-44 .3 5.1 20.5 32.3 29.3 12.0 .5 -= -- -- -- == 100.0 1945-49 .1 2.6 24.2 37.1 29.9 5.5 .1 .1 .1 .1 .1 .1 100.0
1950 .5 3.8 25.0 37.5 28.4 3.0 .3 .3 .2 .3 .4 .J 100.0 1951 .4 4.6 2)..5 35.0 29.9 4. 7 .3 .4 .3 .2 .4 • .3 100.0 1952 1.0 5.4 29.1 37.7 23.4 1.8 .4 .J .3 .z .2 .2 100.0 1953 .9 6.3 28.3 35.0 24.6 2.7 .4 .J .4 .3 .4 .4 100.0 1954
Noteg 1. The Minnesota hatching business is very seasonal. Nearly 90 percent of the chicks are hatched in March. April 9 and May.
2. There ia a tendency toward earlier hatching in Minnesota in recent years. This is indicated by larger batches in February and March, and smaller batches in May and June compared with the same months in earlier years.
3. The increase in late summer and fall hatching reflects the increase in broiler production in Minnesota.
Year
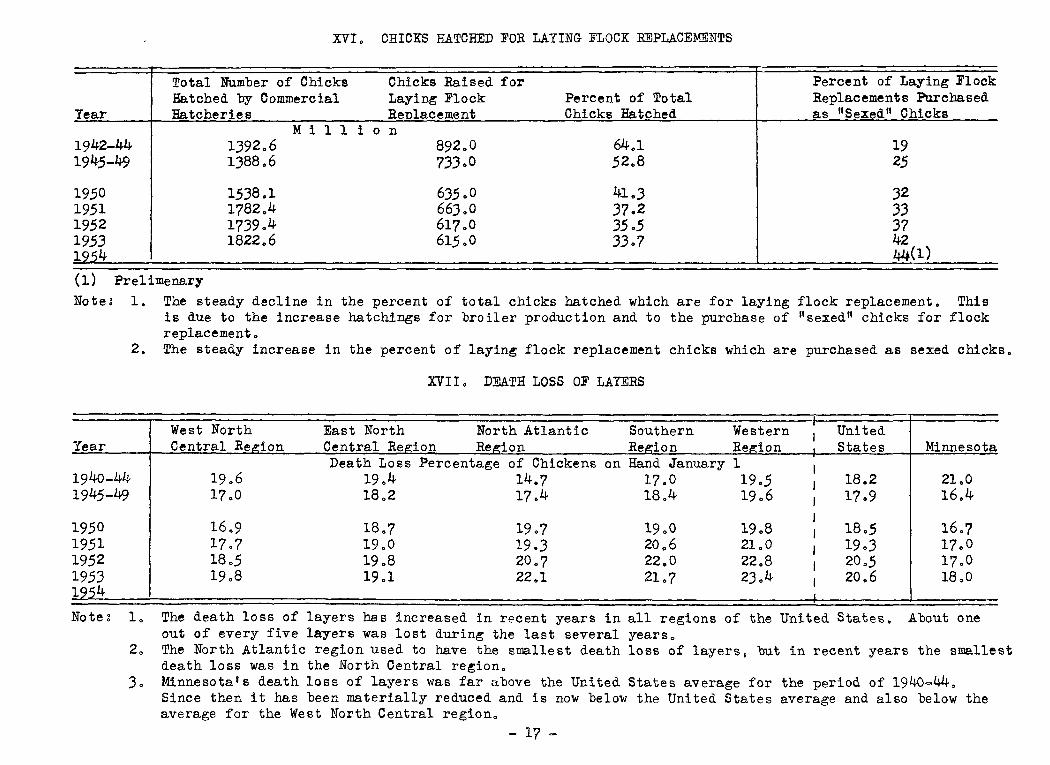
XVI o CHICKS HATCHED FOR LAYING FLOCK REPLACEMENTS
Total Number of Chicks Hatched by Commercial Hatcheries
Chicks Raised for Laying Flock Renlacement
Million
Percent of Total Chicks Hatched
Percent of Laying Flock Replacements Purchased as "Sexed" Chicks
1942-44 194.5-49
1.392.6 1,388o6
19 2.5
19.50 19.51 19.52 19.5.3 1954
1.5.38.1 1782.4 17.39.4 1822.6
6.3.5. 0 66.3 .o 617.0 61,5.0
41 • .3 .37.2 .3.5 • .5 .3.3-7
.32
.3.3
.37 42 44(1)
(1) Prelimenary Note: 1. The steady decline in the percent of total chicks hatched which are for laying flock replacement. This
is due to the increase hatchings for broiler production and to the purchase of 11 sexed 11 chicks for flock replacement.
2. The steady increase in the percent of laying flock replacement chicks which are purchased as sexed chicks.
XVI I o DEATH LOSS OF LAYERS
West North East North North Atlantic Southern Western I United Year Central Re.!:ion Central Redon Rel!;ion Region Rel-'!':ion States Minnesota
Death Loss Percentage of Chickens on Hand January 1 194o-44 19.6 19.4 14.7 17.0
I 19 • .5 I 18.2 21.0
194.5-49 17.0 18.2 17.4 18.4 19.6 I 17.9 16.4
19.50 16.9 18.7 I
16.7 19.7 19.0 19.8 I 18 • .5 1951 17o7 19.0 19 • .3 20.6 21.0 I 19 • .3 17.0 19.52 18 • .5 19.8 20.7 22.0 22.8 I 20 • .5 17.0 195.3 19.8 19.1 22.1 21.7 2.3 .4 I 20.6 18.0 1954
Note: 1. The death loss of layers has increased in recent years in all regions of the United States. About one out of every five layers was lost during the last several years.
2. The North Atlantic region used to have the smallest death loss of layers, but in recent years the smallest death loss was in the North Central region.
,3. Minnesota's death loss of layers was far above the United States average for the period of 1940~44. Since then it has been materially reduced and is now below the United States average and also below the average for the West North Central region.
- 1? -
- 18 -
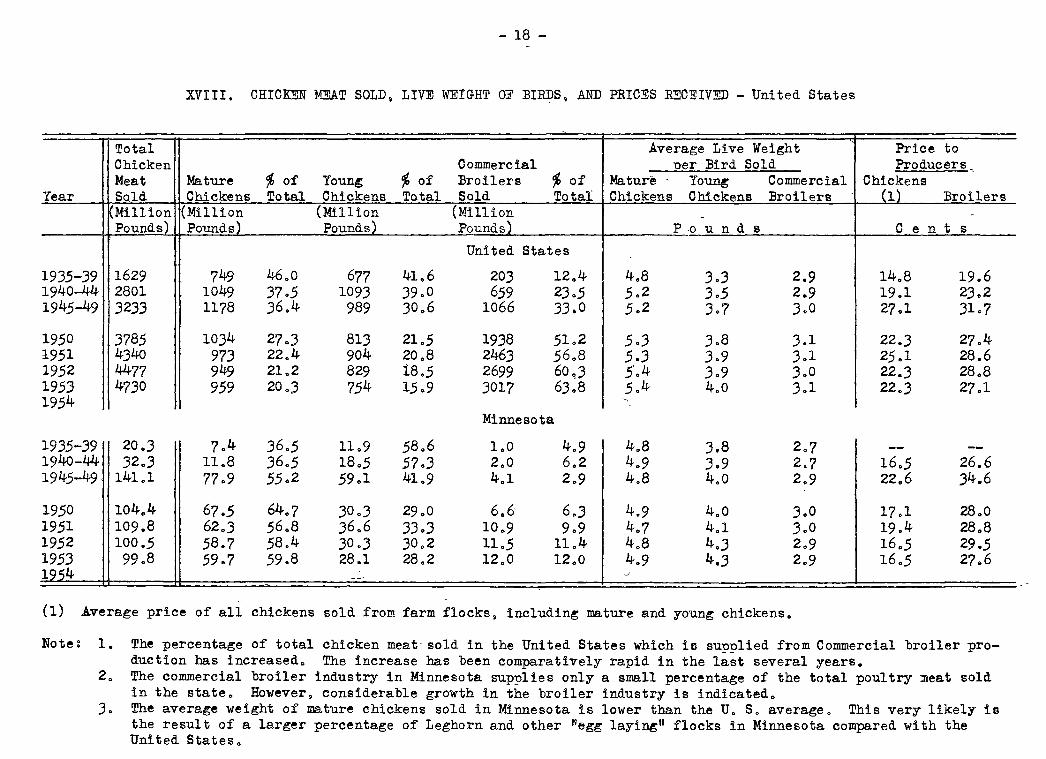
XVIII. CHICKEN MEAT SOLD, LIVE WEIGHT 0~ BI~S. AND PRIC~S ~CEIV~ - United States
Total Average Live Weight Price to Chicken Commercial ner Bird Sold Producers-. Meat Mature % o£ Youn~ % of Broilers % of Mature - Yo~ Commercial Chickens
Year SQld Chickens Total Chickens Total Sold Total Chickens Chickens Broilers (1) Broilers Million (Million (Million (Million - -Pounds) Pounds) Pounds) Pounds) P-ounds c e n t s
United States
1935-39 1629 749 46.0 677 41.6 203 12.4 4.8 3.3 2.9 14.8 19.6 1940-44 2801 1049 37.5 1093 39.0 659 23.5 5.2 3.5 2.9 19.1 23.2 1945-49 323.3 1178 36.4 989 30.6 1066 33.0 5.2 3.7 .3.0 27.1 31.7
1950 .3785 1034 27 .. 3 813 21.5 1938 51.2 5 • .3 .3.8 .3.1 22 • .3 27.4 1951 4.34o 97.3 22.4 904 20.8 246.3 56.8 5 • .3 .3.9 .3.1 25.1 28.6 1952 4477 949 21.2 829 18.5 2699 60~.3 5'.4 .3.9 ,3.0 22 • .3 28.8 195.3 47.30 959 20.3 754 15.9 .3017 6,3.8 5.4 4.0 .J.l 22 • .3 27.1 1954 ..._
~
Minnesota
19.35-.39 20 • .3 ?.4 .36.5 11.9 58.6 1.0 4.9 4.8 .3.8 2.7 -- --1940-44 .32 • .3 11.8 .36.5 18.5 57 • .3 2.0 6.2 4.9 3.9 2.7 16.5 26.6 1945-49 141.1 77.9 55.2 59.1 41.9 4.1 2.9 4.8 4.0 2.9 22.6 .34.6
1950 104.4 6?.5 64.? .30 • .3 29.0 6.6- 6.3 4.9 4.0 .3.0 17.1 28.0 1951 109.8 62 • .3 56.8 ,36.6 .3.3 • .3 10.9 9.9 4.7 4.1 .J.O 19.4 28.8 1952 100.5 58.? 58.4 .JO.J .30.2 11.5 11.4 4.8 4 • .3 2.9 16.5 29.5 195.3 99.8 59.7 59.8 28.1 28.2 12.0 12.0 4.9 4 • .3 2.9 16.5 27.6 1954 -- _,)
(1) Average price of all chickens sold from farm flocks. includin~ mature and young chickens.
Note: 1. The percentage of total chicken meat· sold in the United States which is supplied from Commercial broiler production has increased.. The increase has been comparatively rapid in the last several years.
2. The commercial broiler industry in Minnesota supplies only a small percentage of the total poultry ~eat sold in the state. However. considerable growth in the broiler industry is indicated •
.3. The average weight o£ mature chickens sold in Minnesota is lower than the U. S. average. This very likely is the result of a larger percentage of Leghorn and other "egg layi~" flocks in Minnesota compared with the United States.,

Kind and Class
Chickens: Hens Roasters Broilers, Fryers
All Chickens
Turkeys: Hens and. Toms Hens and Toms Hens and Toms Fryers
All Turkeys
Ducks
Geese
XIX. APPROXIMATE AVERAGE WEIGHTS A.t'ID PROCESSING SHRINKAG!!S IN POULTRY (l)
A~~roximate Average Weights A~uroximate Shrinkages Ready to Live to Live to Dressed to
Live Dressed (2) Cook (3) Dressed Ready to Cook Ready to Cook Pounds P e r c e n.t
5.5 4.9 )o7 10.5 )2.5 25.0 ,?cO 4~5 ).4 10.5 JJ.O 25.0 J.O 2.6 1.9 11.5 )6.0 28.0
4.0 ).6 2.6 n.o 35.0 27.0
11.0 9.8 8.2 11.0 25.5 16.5 18.0 16.2 13.9 10.0 23.0 14.5 27.0 24.6 21.2 9.0 21.5 13.5 7.0 6.2 5.0 12.0 28.0 18.0
18.5 16.6 13.9 10.0 25 .o 16.5
6.0 5.3 4.2 11.0 )0.5 22.0
14.@ 12.4 10.2 11.5 27.5 1820
(1) Eased on data from various sources, includin~ large-volume commercial operations and studies made under laboratory conditions.
(2) Dressed poultry has had only the blood and feathers removed. (3) Ready to cook poultry has had the blood~ feathers, head and feet removed and has been drawn (eviscerated).
Ready to cook weights include abdominal fat, if any, and neck and giblets.
Note: 1. There is a substantially larger shrinkage in young birds than in mature birds. This is indicated for both turkeys and chickens.
2. Chickens have a much larger shrinkage than turkeys, and also a larger shrinkage than geese and ducks. 3. Turkey fryers (broilers) have a considerably lower shrinkage than chicken broilers and fryers.
- 19 -

- 20 -
XX. MID-MONTH FARM PRICES RECEIVED FOR CHICKENS - United States
- Simple Annual
Year Jan. Feb. Mar. Anril May June J.ul;r_ Au~. Sent. Oct. Nov. Dec. - Avera.J!,_e
Farm Chicken~• - Cents Per Pound
19.30-.34 1.3.5 1.3 • .5 13.8 14 • .3 1.3.9 13.5 1.3.4 13 • .3 1.3.5 -12.7- 12.2 llo7 1.3.4 19.35-.39 14.6 14.8 1.5.1 1.5 .6 15.4 15.2 14.8 lli-. 6 1.5.1 14.7 14.4 14.1 15.1 1940-44 17.7 18.0 18.5 19.1 19 • .5 19.4 19.4 19.7 19.8 19.8 19.4 19.3 19.3 1945-49 27.0 26.8 27.8 28.2 27.7 27.6 £8.0 27.6 27.3 26.6 25.2 26.1 27.2
1950 21.5 21..5 2.3 • .3 22.5 21.8 21.0 22 • .3 24.1 ~2.9 21..3 22.0 22.6 22.2 1951 24.9 27.1 28.7 29.0 29 • .3 27.0 26.4 24.6 23.9 2.3.0 22.6 2.3 • .3 2.5.8 1952 25.0 24.9 24.9 24.0 22 • .5 21.7 2L8 22.4 21.9 20.6 21.6 22.2 22.8 195.3 2.3.2 24.0 25.2 24.9 24.8 22.9 2.3.0 22.7 21.6 20.2 20.8 2LO 22.9 1954 21.6 21.7 22.4 21.0
-Commercial Broilers - Cents Per Pound
19.52 28.8 29 • .3 28.1 27.1 2.5 • .3 Z6.8 29 • .3 .31.0 .31..3 29.1 .31.6 -29.7 29.0 195.3 27.9 27.7 28.1 28.0 2-7.2 26.2 28 • .3 27.9 27.1 26.7 28.0 2.3.2 27.2 1954 24.6 22.6 ~4 24.5
* Does not include commercial broilers.
Note: 1. The mid-month price for chickens does not vary ~reatly from month to month. This is quite different from the lar~e variation in monthly e~ prices.
2. The average mid-month prices for chickens durin~ the period of 194.5-49 and in later Tears were about _ double what they were in the ten year period of 19.30-39 •
.3. Although chicken prices have been considerably below parity durin~ the last several-Tears, production of poultry meat bas continued at a comparatively high level. This is the resul-t of increased efficiency and -lower production costs compared with earlier years. ,
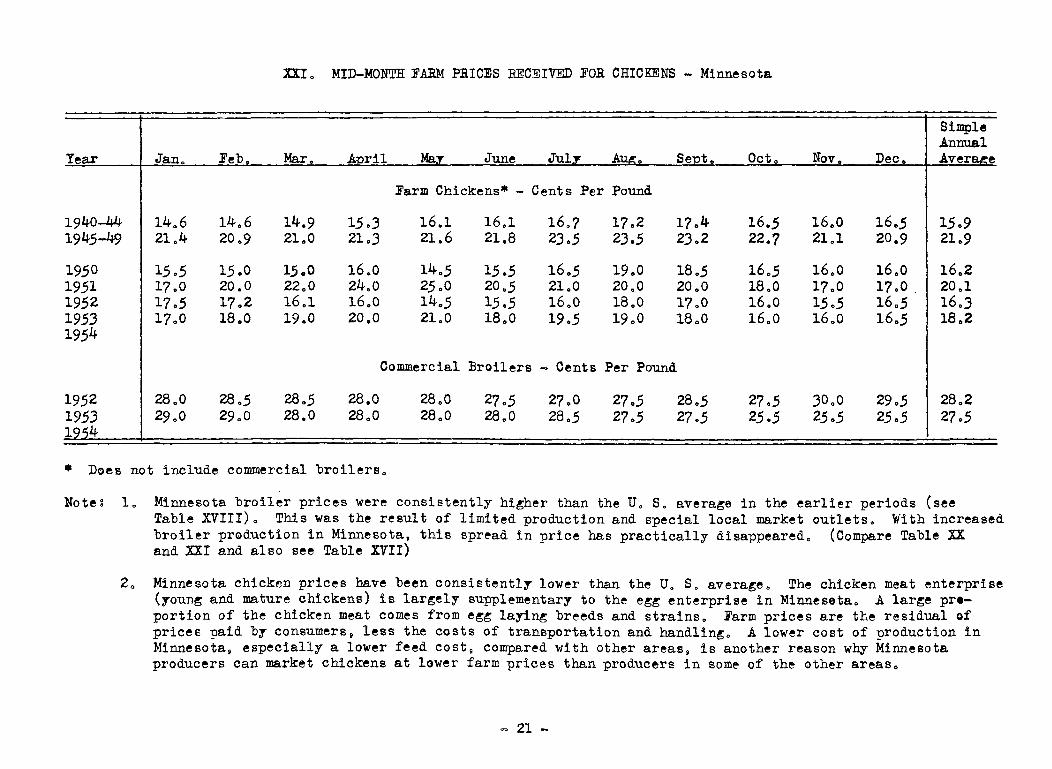
XXI. MID-MONTH FARM PRICES RECEIVW~ FOR CHICKENS - Minnesota
Simple Annual
Year Jan. Feb. Mar. April May June July AU$.. Sent. Oct~ Nov. Dec. Avera~e
Farm Chickens* - Cents Per Pound
1940-44 14.6 14.6 14.9 15.3 16.1 16.1 16.? 1?.2 1?.4 16.5 16.0 16.5 15.9 1945-49 21.4 20.9 21.0 21.3 21.6 21.8 23.5 23.5 23.2 22.? 21.1 20.9 21.9
1950 15.5 15.0 1.5.0 16.0 14.5 15.5 16.5 19.0 18.5 16.5 16.0 16.0 16.2 1951 1?.0 20.0 22.0 24.0 25 .o 20.5 21.0 20.0 20.0 18.0 1?.0 1?.0. 20.1 1952 17.5 1?.2 16.1 16.0 14.5 15.5 16.0 18.0 1?.0 16.0 15.5 16.5 16.3 1953 1?.0 18.0 19.0 20.0 21.0 18.0 19.5 19.0 18.0 16.0 16.0 16.5 18.2 1954
Commercial Broilers - Cents Per Pound
19.52 28.0 28.5 28.5 28.0 28.0 2?.5 27.0 27.5 28.5 27.5 30.0 29.5 28.2 19.53 29.0 29.0 28.0 28.0 28.0 28.0 28.5 2?.5 27.5 25.5 25.5 25.5 2?.5 19'14
* Does not include commercial broilers.
Note: 1. Minnesota broiler prices were consistently hi~her than the U. S. avera~e in the earlier periods (see Table XVIII). This was the result of limited production and special local market outlets. 1tii th increased broiler pr0duction in Minnesota, this spread in price has practically disappeared. and XXI and also see Table XVII)
(Compare Table XX
2. Minnesota chicken prices have been consistently lower than the U. s. avera~e. The chicken meat enterprise (youn~ and mature chickens) is lar~ely supplementary to the e~~ enterprise in Minneseta. A lar~e preportion of the chicken meat comes from e~~ layi~ breeds and strains. Farm prices are the residual of prices ~aid by consumers9 less the costs of transportation and handlin~. A lower cost of ~reduction in Minnesota 9 especially a lower feed costs compared with other areas 9 is anether reason why Minnesota producers can market chickens at lower farm prices than producers in some of the other areas.
- 21 -
- 22 ~
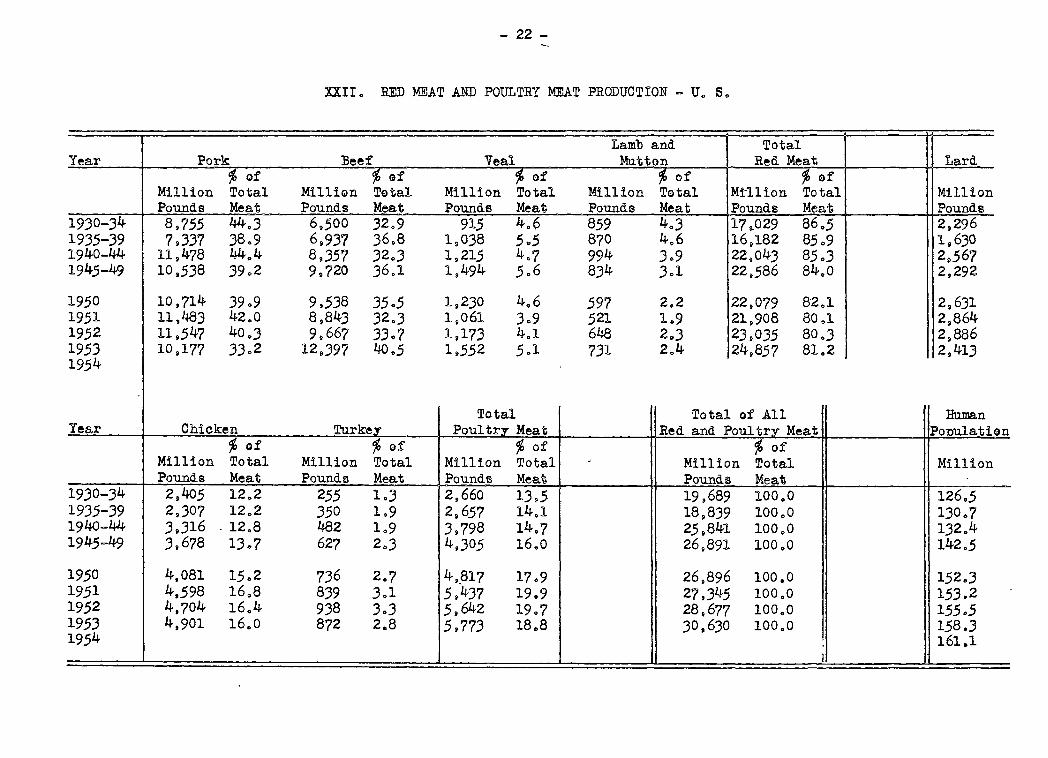
XXII. RED MEAT AND POULTRY MEAT PRODUCTION ~ U., S.
Lamb and Total Year Pork :Beef Veal Mutton Red Meat Lard
%of % ef % of % of % af Million Total Milli~m Total Million Total Million Tetal Mtllion Total Million Pounds Meat Pounds Meat Pounds Meat Pounds Meat Pounds Meat Pounds
1930-34 8.755 44.3 6,)00 32.9 915 4.6 859 4.3 17 9-029 86 .. 5 2,296 1935-39 7.337 38.9 6,937 36.8 19038 5 .. .5 870 4.6 16,182 85.9 1,630 1940-44 11,478 44.4 8.357 32.3 1,215 4.7 994 3.9 22.043 85.3 2,567 1945-49 10.538 39.2 9.720 36.1 1.494 5.6 834 3.1 22,586 84.0 2,292
1950 10.714 39.9 9.538 35.5 1,230 4.6 597 2.2 22,079 82.1 2,631 1951 11,483 42.0 8,843 32.3 1,061 3.9 .521 1.9 21,908 80.1 2,864 1952 lls.547 40.3 9,667 33.7 1,173 4.1 648 2.3 23,035 80.3 2.886 1953 10,177 3J.2 12.397 40.5 1,552 5.1 731 2.4 24,857 81.2 2,413 1954
Total Total of All Hwnan Year Chicken Turkey Poultry Meat Red and Poultry Meat Ponulaticm
%of % of % of % of Million Total Million Total Million Total . Million Total Million Pounds Meat Pounds Meat Pounds Meat Pounds Meat -
1930-34 2,405 12.2 255 1.3 2,660 13.5 19.689 100.0 126.5 1935-39 2,307 12.2 350 1.9 2,657 14.1 18.839 100.0 130.7 1940-44 3.316 - 12.8 482 l.9 3.798 14.7 25,841 100.0 132.4 1945-49 3.678 13.7 627 2.3 4,305 16.0 26,891 100.0 142.5
1950 4,081 15.2 736 2.7 4,_817 17.9 26,896 100.0 152.3 1951 4,598 16.8 839 3.1 5.437 19.9 27,345 100.0 153.2 1952 4,704 16.4 938 3.3 5,642 19.7 28,677 100.0 155.5 1953 4,901 16.0 872 2.8 5.773 18.8 30,630 100.0 158.3 1954 161.1
I I

Index of Red Meat and Poultry Meat Production - U. Se
Lamb Total and Red
Year Pork Beef Veal Mutton Meat Lard
193f>-34 119 94 88 99 105 141 1935-39 100 100 100 100 100 100 1940-44 156 120 117 114 136 157 1945-49 144 140 144 96 140 141
1950 146 137 118 69 136 161 1951 157 127 102 60 135 176 1952 157 139 113 74 142 177 1953 139 179 150 84 154 148 1954
Total Tetal Red and Index of Poultry Poultry Human
Year Chicken Turkey Meat Meat Population
1930-34 107 73 103 105 97 1935-39 100 100 100 100 100 1940-44 143 139 142 137 101 1945-49 158 179 161 143 109
1950 175 210 179 143 117 1951 198 240 203 145 117 1952 202 264 210 152 119 1953 212 249 217 163 121 1954 123
Note: 1. Total meat production was at a low level during the 1935-39 period. This period included two drouth years. There was less feed available for livestock and less meat produced.
2. There has been a substantial increase in total meat production since 1935-39. Meat production has increased at a more rapid rate than human populations
3. The largest percentage increase in meat production since 1935-39 was in poultry and especially turkey. 4. The production of lamb and mutton has declined since the 1935-39 period.
= 23-
- 24 -
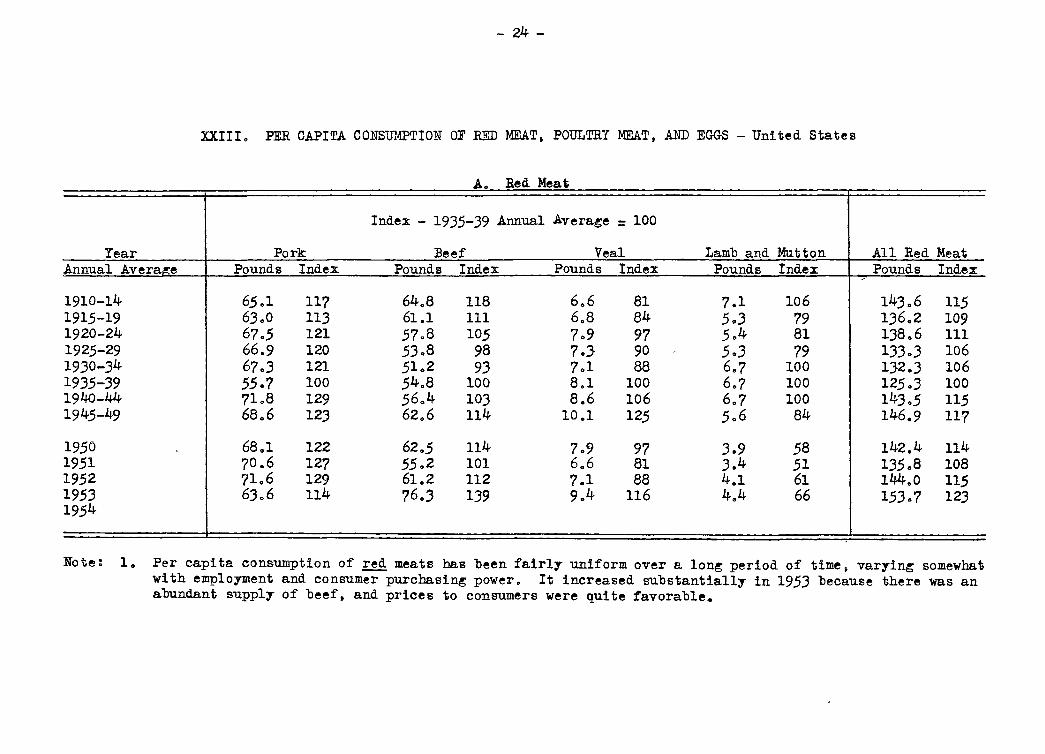
XXIII. PER CAPITA CONSUMPTION OF RED MEAT, POULTRY MEAT, AND EGGS -United States
A Red Meat 0
Index - 1935-39 Annual Avera~e = 100
Year Pork Beef Veal Lamb and Mutton All Red Meat Annual Avera~e Pounds Index Pounds Index Pounds Index Pounds Index Pounds Index -1910-14 65.1 117 64.8 118 6.6 81 7.1 106 143.6 115 191.5-19 63.0 113 61.1 111 6.8 84 5.3 79 136.2 109 1920-24 6?.5 121 57.8 10.5 ?.9 97 .5.4 81 138.6 111 1925-29 66.9 120 .53.8 98 7.3 90 .5.3 79 133.3 106 1930-34 67.3 121 .51.2 93 7.1 88 6.7 100 1}2.3 106 193.5-39 5.5.7 100 54.8 100 8.1 100 6.7 100 125.3 100 1940-44 7L8 129 56.4 103 8.6 106 6.7 100 143 • .5 11.5 194.5-49 68.6 123 62.6 114 10.1 125 5.6 84 146.9 11-'7
1950 68.1 122 62.5 114 7.9 97 3.9 58 142.4 114 1951 70.6 127 55.2 101 6.6 81 3.4 51 13.5.8 108 1952 71.6 129 61.2 112 7.1 88 4.1 61 144.0 11.5 19.53 63.6 114 76.3 139 9.4 116 4.4 66 153.7 123 1954
Note: 1. Per capita consumption of red meats bas been fairly uniform over a lon~ period of time, varyin~ somewhat with employment and consumer purchasin~ power. It increased substantially in 1953 because there was an abundant supply of beef, and prices to consumers were quite favorable.
B . Poultry M eat AllM E eat and ~.!:.!:S
All meat -Red Meat and
Year Chicken Turkey All Poultry Meat PoultrY Mea 1i E.!:.!:S Annual Avera.!:e Pounds Index Pounds- Index Pounds Index Pounds Index Number Index
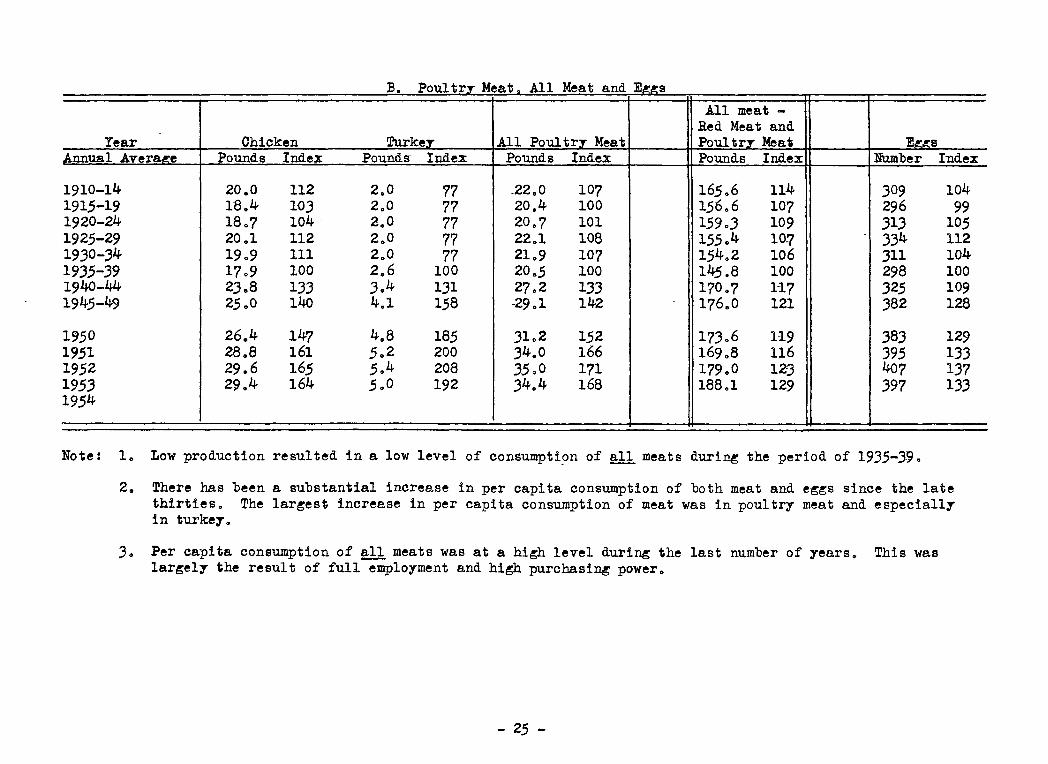
1910-14 20.0 112 2.0 77 _22.0 107 165.6 114 309 104 1915-19 18.4 103 2.0 77 20.4 100 156.6 107 296 99 1920-24 18.7 104- 2.0 77 20.7 101 ],59 .3 109 .313 105 1925-29 20.1 112 2.0 77 22 .. 1 108 155 .. 4 10-7 334 112 1930-34 19.9 111 2.0 77 21.9 107 154 .. 2 106 311 104 1935-39 17.9 100 2.6 100 20.5 100 14.5 .8 100 298 100 1940-44 23.8 133 3.4 131 27.2 133 1{0.7 1-17 325 109 194.5-49 25.,0 140 4.1 158 -29.1 142 176.0 121 382 128
1950 26.4 147 4.8 185 31.2 152 173.6 119 383 129 1951 28.8 161 5.2 200 34.0 166 169.8 116 395 133 1952 29.6 165 5.4 208 35.0 171 179.0 12:3 407 137 1953 29.4 164 5.0 192 34.4 168 188.1 129 397 133 1954
Note: 1. Low production resulted in a low level of consumpti?n of all meats duri~ the period of 1935-}9.
2. There has been a substantial increase in per capita consumption of both meat and e~~s since the late thirties. The lar~est increase in per capita consumption of meat was in poultry meat and especially in turkey.
3. Per capita consumption of all meats was at a hi~ level duri~ the last number of years. This was lar~ely the result of full employment and hi~ purchasin~ power.
- 25 -
- 26 =
XXIV. CASH RECEIPTS FROM POULTRY AND PERCENT OF TOTAL FARM MARKETINGS
I Total Cash Commercial I Receipts from
Year Eo!:o!:S Chickens :Broilers (1) Turkers I All Poultry (2) Farm Marketi~ Million % of Million % of Million ~ of Million % of I Million % of Million % of -Dollars Total Dollars Total Dollars Total Dollars Total I Dollars Total Dollars Total
United States I '
19.3.5-.39 48.5 6.2 21.3 2.7 .39 • .5 6.3 .8 I 812 10.2 7. 9.54 100.0 1940-44 992 6.6 4.31 2.9 161 1.1 1.3.5 .9 I 1719 11 • .5 14,926 100.0 194.5-49 1716 6.4 .58.5 2.2 .3.5.3 1..3 2.52 1.0 I 2906 10.9 26,761 100.0
I
19.50 1.564 .5 • .5 411 1..5 .5.30 1.9 262 .9 2767 9.8 28,.328 100.0 19.51 209.3 6.4 472 1.4 70.3 2.1 .341 1.1 .3609 11.0 .32.799 100.0 19.52 1877 .5.8 .396 1.2 778 2.4 .342 1.1 .339.3 10 • .5 .32,.37.3 100.0 19.5.3 218.5 7.1 .381 1.2 817 2.6 .318 1.0 .3701 11.9 .30. 97.5 100.0 19.54
Minnesota
19.3.5~.39 19.0 .5.7 10.1 .3.1 -- -- .5.2 1.6 .34 • .3 10.4 .329 100.0 1940-44 .58.6 9.2 22.9 .3.6 .6 .1 12.0 1.9 94.1 14.8 6.34 100.0 194.5-49 111.9 6.6 .30.8 1.8 1.4 .1 24 • .5 1.:5 168.6 10.0 1,148 100.0
19.50 89.1 7 • .5 16.7 1~4 1.8 .2 2.5 .4 2.1 1.3.3.0 11.2 1,188 100.0 19.51 119.7 6.9 19.2 1.1 .3.1 .2 .30.9 1.8 172.9 10.0 1,276 100.0 19.52 100.8 6.8 14.6 LO .3 • .3 .2 29 • .5 2.0 148.2 10.0 1,27.5 100.0 19.5.3 12.3 .o 9.7 1.5 .4 1.2 .3 • .3 - • .3 28 • .5 2 • .3 170.2 1.3 • .5 1,262 100.0 1954 I
(1) Includes consumption in household of producers, which is less than 1 percent of production. (2) Does not inclu~e ducks. ~eese, and "other poultry" which is about 1 percent of farm receipts for poultry.
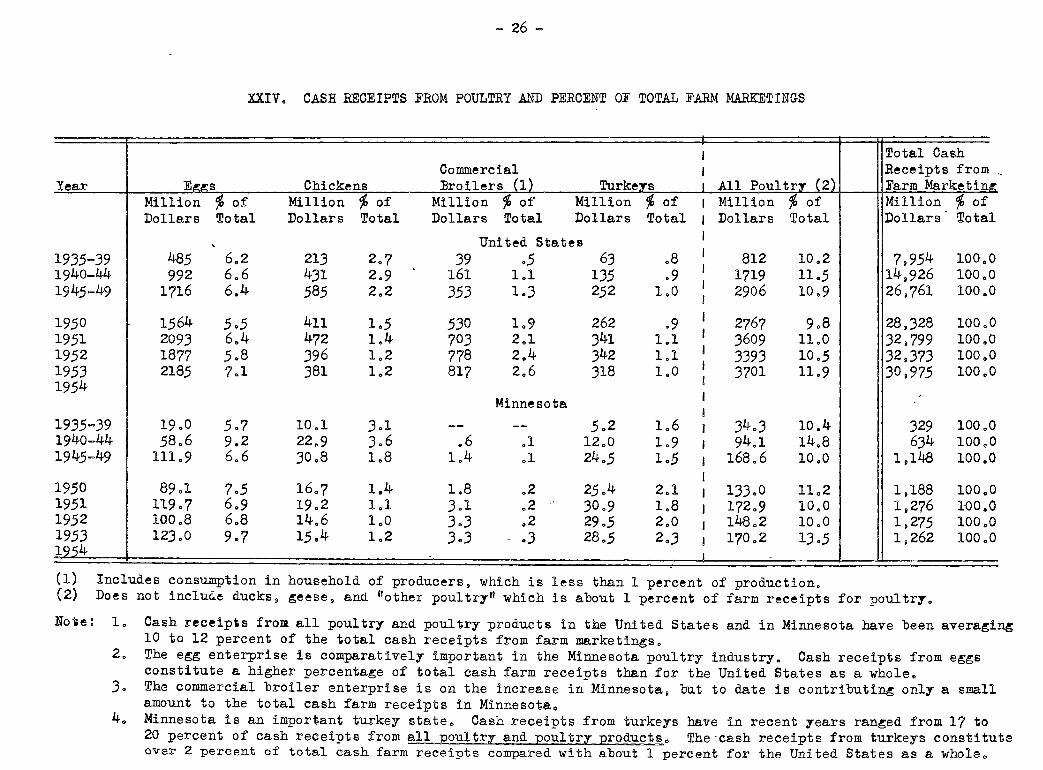
Noie: 1. Cash receipis from all poultry and poultry products in the United States and in Minnesota have been avera~i~ 10 to 12 percent of the total cash receipts from farm marketings.
2. The e~g enterprise is comparatively important in the Minnesota poultry industry. Cash receipts from e~gs constitute a higher percenta~e of total cash farm receipts than for the United States as a whole •
.3. The commercial broiler enterprise is on the increase in Minnesota, but to date is contributin~ only a small amount to the total cash farm receipts in Minnesota.
4. Minnesota is an important turkey state. Cash receipts from turkeys have in recent ;rears ran~ed from 17 to 20 percent of cash receipts from all poultry and poultry products. The·cash receipts from turkeys constitute over 2 percent of total cash farm receipts compared with about 1 percent for the United States as a whole.

XXV. TURKEYS RAISED ON FARMS
West North 1 East North 1 North Atlantic 1 Southern 1 Western I Year Central Re,e:ion 1 Central Re,e:ion 1 Re,e:ion 1 Re,e:ion (1) 1 Re,e:ion 1 United States Minnesota
I I I I I % of West I I I I I % of North Centr
% of I % of I % of I % of I % of I % of u. s. Region Mil Total I Mil. Total I Mil. Total 1 MiL Total 1 Mil. Total 1 Mil. Total Mil. Total Total
al
-I I I I I
1930-34 5.5 26.7· I 1..5 7 .. 3 I .9 4.4 I 8.1 39.3 I 4.6 22.3 I 20.6 100.0 1.7 8.3 30.9 1935-39 8.2 30.4 I 2.2 8.2 I 1.6 5.9 I 8.4 31.1 1 6.6 24.4 I 27.0 100.0 2.2 8.1 26.8 1940-44 10.3 31.0 I 3.0 9.1 I 2.2 6.6 I 8.0 24..,1 1 9.7 29.2 I 33.2 100.0 3.1 9.3 30.1 1945-49 10.2 26.9 I 4.5 1L8 I 3.5 9.2 I 7.9 20 .. 8 1 11.9 31.3 I 38.0 100.0 3.6 9.5 35.3
I I I I I 1950 11.1 25.4 I 5.4 12.3 I 3.9 8.9 1 10.2 23.3 1 13.2 30.1 I 43 .. 8 100.0 4.1 9 .. 4 36.9 1951 12.3 23.4 I 6.1 11.6 I 4.3 8.2 I 13.5 25.7 1 1-6.3 31.1 I 52.5 100.0 4.6 8.8 37.4 1952 12.9 21.2 I 7.1 1L7 I 5.3 8.7 I 17.7 29.11 17.8 29.3 I 60.8 100.0 5.2 8.6 40.3 1953 13.4 23.7 I 7.2 12.8 I 4.7 8.3 1 15.2 26.9 1 16.0 28.3 I 56.5 100.0 5.6 9.9 41.8 1954 I I I I I
I I I I I
(1} Includes South Atlantic and South Central Regions.
Note: 1. The number of turkeys raised in the United States increased steadily up to 1952 ... The increase in production was shared by all regions, however some regions increased more than others.
2. In late years Minnesota has produced about 2/5 of all the turkeys in the West North Central region, and about 9 percent of the total for the United States.
- 27 -

- 28 -
XXVI. DEATH LOSS OF TURKEYS
A. Young Turkeys Lost - Percent of the Total Number Bought and Home Hatched
West North East North North Atlantic Year Central Re ion Central Re ion Re ion United States
194o-44 26.0 22 .. 5 20.5 37 .. 0 21.5 28.1 1945-49 16.4 17.2 16.2 25.0 15.4 18.5
1950 15.0 15.0 12.0 20.0 14.0 15.6 1951 13.0 14.0 11.0 17.0 10.0 12.9 1952 12.0 13.0 10.0 16.0 10.0 12.6 195J 10.0 11.0 9.0 10.0 9.0 9.4 1954
ll. llreeding Stock Lost - Percent of llreeders on Hand Jan. 1
194o-44 11.0 10.0 8.0 12.9 7.3 10.9 1945-49 7.2 8.2 7.0 11.0 5.6 8.1
1950 7.0 8.0 7.0 9.0 7.0 7.9 1951 7.0 8.0 7.0 9.5 6.0 7.5 1952 7.0 6.0 6.0 6.0 5.0 5.7 1953 6.0 6.0 8.0 6.5 5.0 6.1 1954
(1) Includes South Atlantic and South Central Regions.
Note: 1. Great progress has been made in all regions in reducing death losses of turkey breeding stock and young turkeys,
2. ]Oth the Western and North Atlantic regions have had consistently lower death losses of young turkeys than the West North Central region. With only a few exceptions these regions have also had lower death losses of breeding stock.
XXVII. SHIFT TO .BELTSVILLE WHITE AND OTHER SMALLSR TURKEYS AND SOURCE OF TtJRICSY HATCHING EGGS - Minnesota
Year
19.51 19.52 19.53 19.54
Year
19.51 19.52 19.53
Bronze and Other Heavy Breeds
{000)
1.38 171 1.58 14.5
B.
Minnesota Flocks
(000)
6, 736 9,.316 9,3.38
A. Number of Turkey Breeder Hens - January 1
Percent Beltsville Percent of and Other of
Total Li,e:ht Breeds Total (000)
81.1 .32 18.9 77.4 .50 22.6 78.6 4.3 21.4 .58.9 101 41.1
Source of Turkey Eggs for Minnesota Hatcheries
Percent Percent of Other of
Total States Total (000)
64.0 .3, 789 .36.0 69.2 4,143 30.8 7).3 .3 • .39.5 26.7
Total Percent All of
Breeds Total (000)
170 100.0 221 100.0 201 100.0 246 100.0
Percent All of E s Total
(000)
10,.52.5 100.0 13,4.59 100.0 12,733 100.0
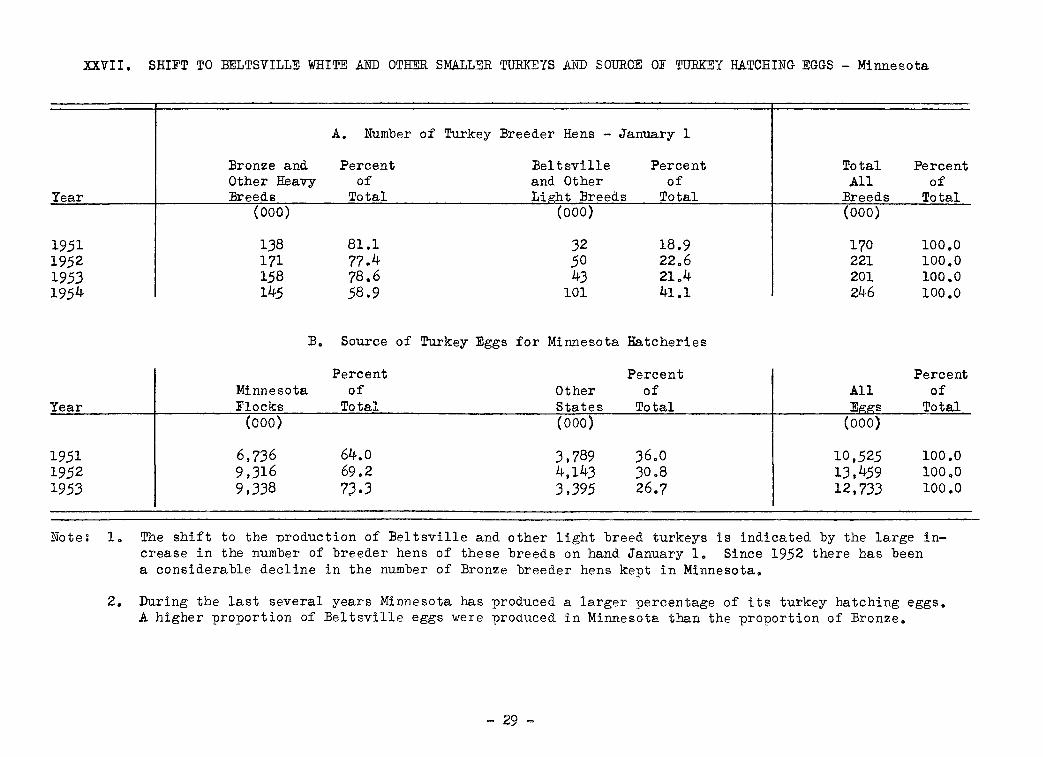
Note: 1. The shift to the nroduction of Beltsville and other light breed turkeys is indicated by the large increase in the number of breeder hens of these breeds on hand January 1. Since 19.52 there has been a considerable decline in the number of Bronze breeder hens kept in Minnesota.
2. During the last several years Minnesota has produced a larger percentage of its turkey hatching eggs. A higher proportion of Beltsville eggs were produced in Minnesota than the proportion of Bronze.
= 29 =
Year
1930-34 1935-39 194o-44 194.5-49
19.50 19.51 19.52 19.53 1~.54
Year
1930-34 1.93.5-39 194o-44 194.5-49
19.50 19.51 19.52 19.5.3 1 4
Hens
12.2 12 .. 9
13.0 12 .. 4 13.9 14.0
- 30 -
XXVIII. AVERAGE LIVE WEIGHT OF TURKEYS SOLD
West North Central Region East North Central Region Hens Toms Fr ers All Hens Toms Fr ers All
Pounds Pounds 1].6 14.,1 14.6 14.8
12 • .5 18.9 1.5.7 12 • .5 18~5 1.5 .. .5 1.3 .. 9 22.6 18.2 13.7 21.4 1?.6
14.2 2].6 18.9 14.2 22.6 18.4 14.0 23 • .5 18.7 14.1 22 • .5 18 .. 3 14.0 24.2 7 .. .3 18.2 14 • .5 23o..5 7 .. 9 17.1 14.2 24.9 7.8 17.2 14.8 24.2 7 .. 8 16~5
Southern Region Western Region United States Toms Fr ers All Hens Toms Fr ers All Hens Toms· ers Pounds Pounds Pounds
13.6 14 • .5 ...-14.3 1.5.7
17.8 1,5.@ 13 • .5 21 • .5 17.6 12.8 19 .. 3 19 .. 9 16.4 14.7 24.8 19.8 13.9 22 .. 4
20.2 16.6 1.5 .. 0 2.5.4 20.2 14.1 23.0 19.1 1.5.8 14.3 24.3 19.3 13.6 22.,2 21..5 7-7 1.5.1 1,5.0 26.,0 7.7 18.,5 14.3 23.7 7.6 2L7 7.5 1.5 .. 4 14 .. 9 26 .. 4 7.9 19.1 14 .. .5 24.3 8.0
North Atlantic Region Hens Toms Fr ers All
P o u n d s 14.0 14.8
12.6 18.9 15.8 13.4 20.6 17.0
13.7 21.1 17.4 13.6 21.1 17.4 14.0 22.0 8 .. 0 14.4 14.,5 2)-.0 8 .. 8 1,5.4
Minnesota All Hens Toms Fr ers All
Pounds 1).8 13.8 14 .. 8 14.6 16.1 12 .. 2 19 .. 2 1.5 .7 18.1 13.8 22.6 18.2
18.6 14.1 23.6 19.0 17 .. 9 13.8 23.4 18.6 16.9 13.6 23.7 7.9 17.1 17.0 14.8 24.2 7.8 16 • .5
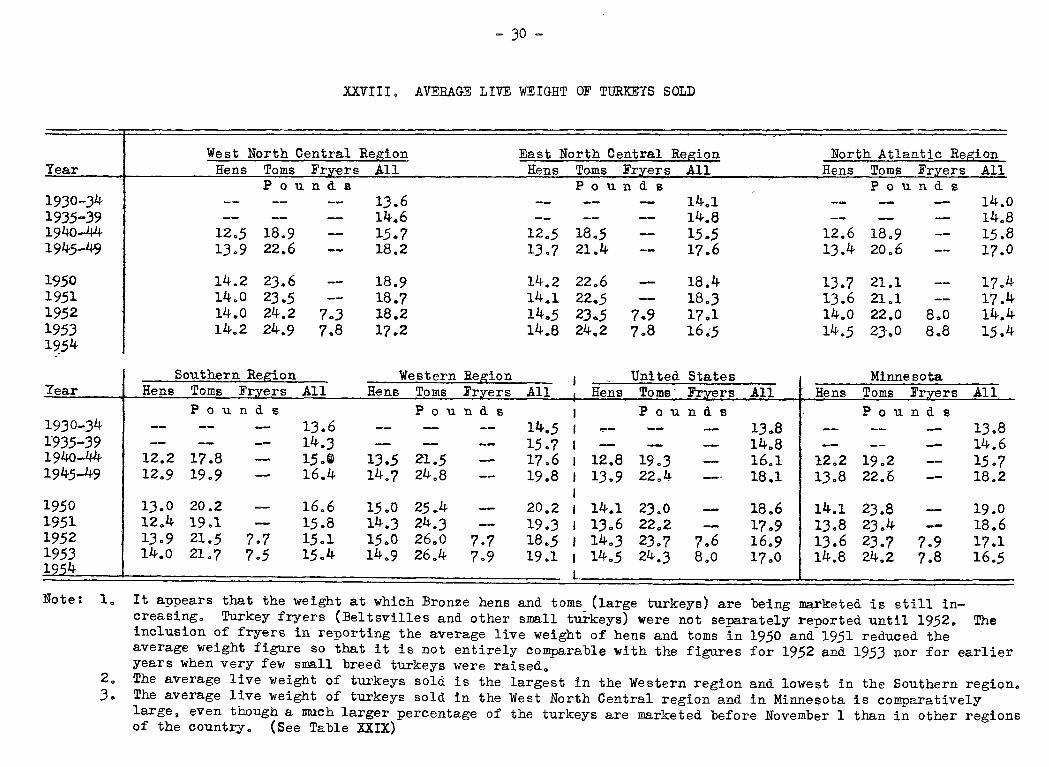
Note: 1. It appears that the weight at which Bronze hens and toms (large turkeys) are being marketed is still increasing. Turkey fryers (Beltsvilles and other small turkeys) were not separately reported until 1952. The inclusion of fryers in reporting the average live weight of hens and toms in 1950 and 1951 reduced the average weight figure so that it is not entirely comparable with the figures for 1952 and 19.53 nor for earlier years when very few small breed turkeys were raised.
2.. The average live weight of turkeys sold is the largest in the Western region and lowest in the Southern region. J. The average live weight of turkeys sold in the West North Central region and in Minnesota is comparatively
large. even though a much larger percentage of the turkeys are marketed before November 1 than in other regions of the country. (See Table XXIX)
Year
194o-44 1945-49
195G 1951 1952 19.5.3 1954
A. Percent
.Before Au st 1
(2) (2)
(2) {2) 8.9 9.0
(1) .Breeders not included.
of
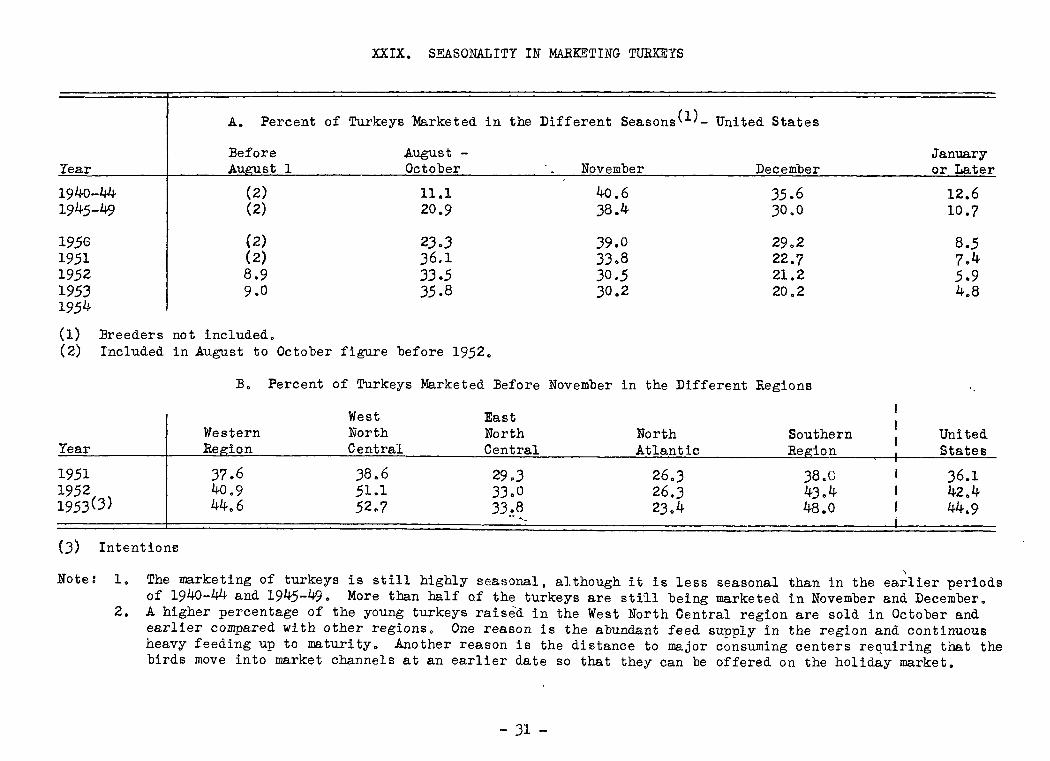
XXIX. SEASONALITY IN MARKETING TURKEYS
Turkeys 'Marketed in the Different Seasons(l)_ United States
August -October November December
11.1 4o.6 35.6 20.9 38a4 30.0
23.3 .39.0 29.2 )6.1 3.3.8 22.7 33.5 )0.5 21.2 35.8 30.2 20.2
(2) Included in August to October figure before 1952 •
.B. Percent of Turkeys ¥arketed .Before November in the Different Regions
West East ~/estern North North North Southern
Year Re ion Central Central Atlantic Re ion
1951 37.6 .38.6 29.3 26.3 38.0 1952 40.9 .51.1 33.0 26.3 43.4 1953(3) 44.6 .52. 7 33.8 23.4 48.0 .. .__
(3) Intentions
January or Later
12.6 10.7
8.5 7.4 5.9 4~8
United States
36.1 42.4 44.9
' Note: 1. The marketing of turkeys is still highly seasonal, although it is less seasonal than in the earlier periods of 1940-44 and 1945-49. More than half o.f the turkeys are still being marketed in November and December.
2. A higher percentage of the young turkeys raised in the West North Central region are sold in October and earlier compared with other regions. One reason is the abundant feed supply in the region and continuous heavy feeding up to maturity. Another reason is the distance to major consuming centers requiring that the birds move into market channels at an earlier date so that they can be offered on the holiday market.
- 31 -
- 32-
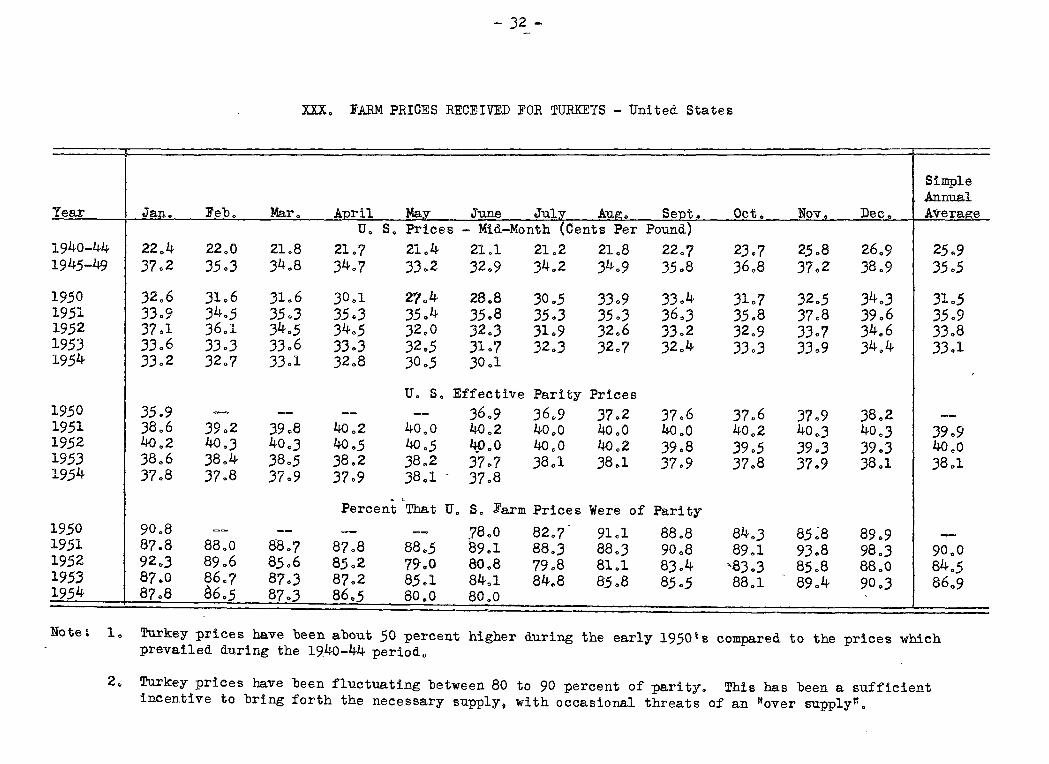
XXX. FARM PRICES RECEIVED FOR TURKEYS -United States
Simple Annual
'Year Jan. Feb. Mar. April May June July Auf!.. Sept. Oct. Nov. Dec. Averae:e u. s. Prices - Mid-Month (Cents Per Pound)
1940-44 22.4 22.0 21.8 21.7 21.4 2Ll 21.2 21.8 22.7 23.7 25.8 26.9 25a9 1945-49 37$2 35.3 34.8 34.7 33.2 32.9 34.2 34.9 35.8 36.8 37~2 38.9 35.5
1950 32.6 31.6 31.6 30.1 2?.4 28.8 30.5 33.9 33.4 31.7 32 .. 5 34.3 31.5 1951 33.9 34.5 35.3 35.3 35.4 35.8 35.3 35.3 36.3 35.8 37.8 39.6 35.9 1952 37.1 36.1 34.5 34.5 32.0 J2.,3 31.9 32.6 33.2 32.9 33 .. ? 34.6 33.8 19.53 33.6 33.3 33.6 33.3 32 • .5 3L7 32.3 32.? 32.4 33.3 33 .. 9 34.4 33.1 19.54 33.2 32.7 33.1 32.8 30.5 30.,1
u. s. Effective Parity Prices 1950 35.9 -- -- -- -- 36.9 36~9 37.2 37.6 37.6 3?.9 38.2 ~
1951 38.6 39o2 39 .. 8 40.2 40.0 40.2 40.0 40.0 40.0 40.2 40.,3 40.3 39 .. 9 19.52 4o.2 40.3 40.3 4o.5 40 • .5 4:0.0 40.0 4o.2 39.8 39 • .5 39.3 39.3 40.0 1953 38.6 38.4 38.5 38.2 38.2 3?.7 38.1 38.1 37.9 37.8 3?.9 38.1 38.1 1954 37.8 37.8 37.9 37.9 38.1 - 37.8
- ~
Percent That U. s. Farm Prices Were of Parity 19.50 90.8 -- -- -- -- _78.0 82.7 91.1 88.8 84.3 85~8 89.9 -19.51 87.8 88.0 88.7 87.8 88.5 89.1 88.3 88.3 90.8 89.1 93.8 98.3 90.0 1952 92.3 89 .. 6 85.6 8.5.2 79-.0 80.8 79.8 81.1 83.4 '-£3.3 85.8 88.0 84.5 19.53 87.0 86.7 87.3 87.2 85.1 84.1 84 .. 8 85.8 85.5 88.1
-89.4 90 .. 3 86 .. 9
1954 8?.8 86.5 87.3 86.5 80.0 80.0 '
Note: 1. Turkey prices have been about 50 percent higher during the early 1950's compared to the prices which prevailed during the 1940-44 period.
2. Turkey prices have been fluctuating between 80 to 90 percent of parity. This has been a sufficient incentive to bring forth the necessary supply, with occasional threats of an "over supply".
Year
1950 1951 1952 1953 1954
1950 1951 1952 1953 1954
Note:
Jan .. Fe be Mar_...
)4.,0 35 .. 0 35 .. 0 36.,0 36.0 39 .. 0 39.,0 36.0 35 .. 0 35.,0 37.0 38.,0 35.,(;)or )2.0 31.,0
Percent That
94.7 93 .. 3 91.,8 98.0 97.0 89 .. 3 86 .. 8 90.,7 96 .. 3 98.7 92 .. 6 84.7 81.,8
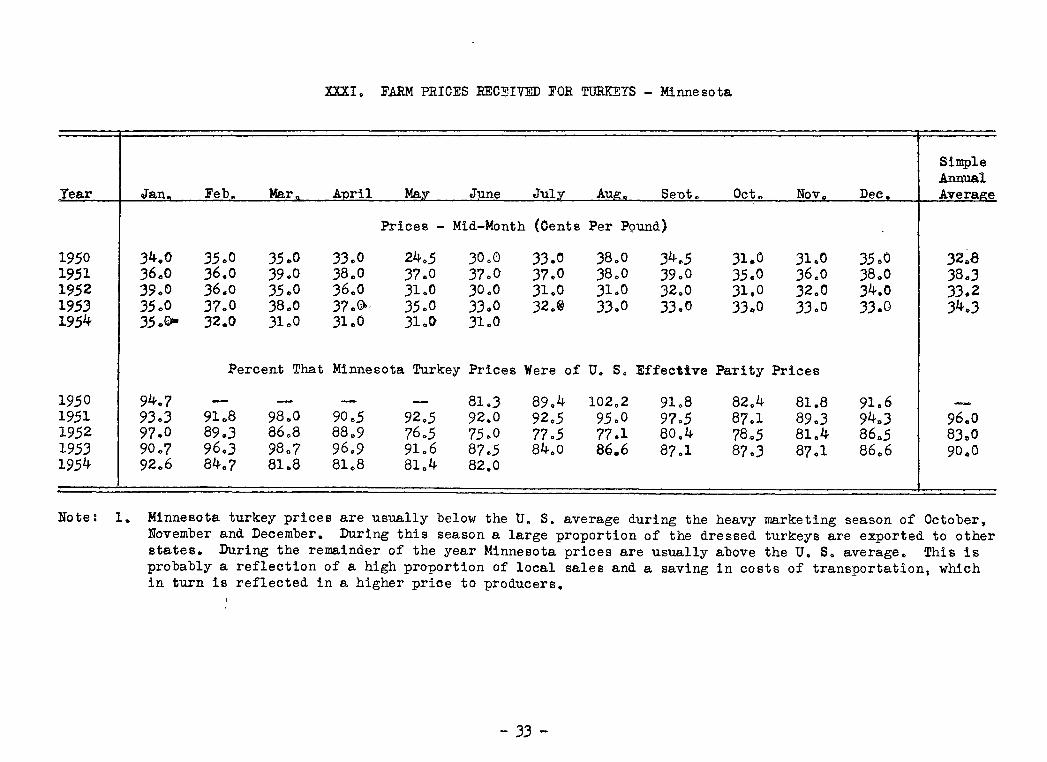
XXXI. FARM PRICES RECEIVED FOR TURKEYS - Minnesota
April May June July A~ Seut., Oct., Nov.,
Prices - Mid-Month (Cents Per Pgund)
33.0 24.5 30.0 33.0 38.0 34.5 31.0 3LO 38 .. 0 37.0 37.0 37.0 38.0 39.0 35 .. 0 36.0 36 .. 0 31.0 30.0 31.0 31.0 32.0 31.0 32.0 37 .. (i)., 35.0 33 .. 0 32.® 3.3 .. 0 33.0 33.,0 33.0 31.,0 31.() 31.0
Minnesota Turkey Prices Were of U. s. Effective Parity Prices
81..3 89.4 102.2 91.8 82.4 81.8 90.,5 92.5 92.0 92.5 95.0 97.5 87.1 89 .. 3 88.9 76.5 75.0 77.5 77.1 80.4 78.5 81.4 96.9 91.6 87.5 84.0 86.,6 87.1 87.3 87.1 81.,8 81.4 82.,0
Dee.
35~0 38.0 34.0 33.0
91.6 94 .. 3 86 .. 5 86.,6
Simple Annual Ave rag~
32.,8 38 .. 3 33.2 34 • .3
96.,0 83.,0 90.0
1. Minnesota turkey prices are usually below the U. S. average during the heavy marketing season of October~ November and December. During this season a large proportion of the dressed turkeys are exported to other states. During the remainder of the year Minnesota prices are usually above the u. s. average. This is probably a reflection of a high proportion of local sales and a saving in costs of transportation, which in turn is reflected in a higher price to producers.
- 33-