Developmental Regulation of Nutrient Transporter …...MOLECULAR, CELLULAR, AND DEVELOPMENTAL...
15
MOLECULAR, CELLULAR, AND DEVELOPMENTAL BIOLOGY Developmental Regulation of Nutrient Transporter and Enzyme mRNA Abundance in the Small Intestine of Broilers 1 E. R. Gilbert,* H. Li,* D. A. Emmerson,† K. E. Webb Jr.,* and E. A. Wong* 2 *Department of Animal and Poultry Sciences, Virginia Polytechnic Institute and State University, Blacksburg 24061; and †Aviagen, Huntsville, AL 35805 ABSTRACT The objective of this study was to investi- gate intestinal nutrient transporter and enzyme mRNA in broilers selected on corn- and soybean-based (line A) or wheat-based (line B) diets. We investigated the peptide transporter PepT1, 10 amino acid transporters (rBAT, b o,+ AT, ATB o,+ , CAT1, CAT2, LAT1, y + LAT1, y + LAT2, B o AT, and EAAT3), 4 sugar transporters (SGLT1, SGLT5, GLUT5, and GLUT2), and a digestive enzyme (aminopep- tidase N). Intestine was collected at embryo d 18 and 20, day of hatch, and d 1, 3, 7, and 14 posthatch. The mRNA abundance of each gene was assayed using real-time PCR and the absolute quantification method. For PepT1, line B had greater quantities of mRNA compared with line A (P = 0.001), suggesting a greater capacity for absorption of amino acids as peptides. Levels of PepT1 mRNA were Key words: amino acid transporter, broiler, monosaccharide transporter, PepT1 2007 Poultry Science 86:1739–1753 INTRODUCTION In the small intestine, the final digestion and absorption of dietary nutrients occurs through digestive enzymes and transporter proteins expressed in the apical mem- brane of enterocytes. Amino acids are transported into the enterocyte as di- or tripeptides by the H + -dependent peptide transporter 1, PepT1 (Leibach and Ganapathy, 1996; Chen et al., 2002), or as free amino acids by a variety of different amino acid transporters that vary in substrate specificity (Kanai and Hediger, 2004; Palacin and Kanai, 2004; Verrey et al., 2004). Reports from our laboratory suggest that, from a nutritional perspective, peptide transport through PepT1 is important in chickens, cows, pigs, and sheep (Matthews et al., 1996; Pan et al., 1997; Chen et al., 1999). Less is known about free amino acid transport in livestock and poultry. Because optimal ©2007 Poultry Science Association Inc. Received January 24, 2007. Accepted April 20, 2007. 1 This project was supported by National Research Initiative Competi- tive Grant no. 2005-35206-15271 from the USDA Cooperative State Re- search, Education, and Extension Service. This research was also funded in part by the John Lee Pratt Animal Nutrition Program at Virginia Tech. 2 Corresponding author: [email protected] 1739 greatest in the duodenum (P < 0.05), whereas the abun- dances of SGLT1, GLUT5, and GLUT2 mRNA were great- est in the jejunum (P < 0.05). Abundances of EAAT3, b o,+ AT, rBAT, B o AT, LAT1, CAT2, SGLT5, and aminopep- tidase N mRNA were greatest in the ileum (P < 0.05). Quantities of PepT1, EAAT3, B o AT, SGLT1, GLUT5, and GLUT2 mRNA increased linearly (P < 0.01), whereas CAT1, CAT2, y + LAT1, and LAT1 mRNA decreased lin- early (P < 0.05) with age. Abundance of y + LAT2 mRNA changed cubically (P = 0.002) with peaks of expression at day of hatch and d 7, and aminopeptidase N and SGLT5 mRNA changed quadratically (P = 0.005) with age. These results provide a comprehensive profile of the temporal and spatial expression of nutrient transporter mRNA in the small intestine of chicks. growth of broilers depends on the amino acid supply, studies of genes involved in the process of protein diges- tion and absorption are important (Gal-garber and Uni, 2000). The process of dietary carbohydrate absorption in the small intestine occurs through the action of facilitated and Na + -dependent transport proteins expressed in the enterocyte (Thorens, 1996). Glucose and galactose are transported into the cell by the Na + -dependent trans- porter SGLT1 (Thorens, 1996; Ferraris, 2001; Wright and Turk, 2004), whereas fructose enters through GLUT5 by facilitated diffusion (Ferraris, 2001; Uldry and Thorens, 2004; Wright and Turk, 2004). The exit of monosaccha- rides from the cell is mediated by GLUT2 through facili- tated diffusion (Ferraris, 2001; Uldry and Thorens, 2004; Wright and Turk, 2004). Absorption of carbohydrates from the intestinal lumen is critical for maintaining en- ergy supplies in animals, and is influenced by luminal digestion, apical membrane digestion, and transport into the enterocyte by SGLT1 (Sklan et al., 2003). Using White Leghorn chickens, Barfull et al. (2002) found that SGLT1 mRNA and protein declined with age after hatch, match- ing the described decline in sugar transport activity, whereas Sklan et al. (2003) observed low mRNA levels of SGLT1 at hatch followed by a slight increase to d 7.
Transcript of Developmental Regulation of Nutrient Transporter …...MOLECULAR, CELLULAR, AND DEVELOPMENTAL...
MOLECULAR, CELLULAR, AND DEVELOPMENTAL BIOLOGY
Developmental Regulation of Nutrient Transporter and Enzyme mRNAAbundance in the Small Intestine of Broilers1
E. R. Gilbert,* H. Li,* D. A. Emmerson,† K. E. Webb Jr.,* and E. A. Wong*2
*Department of Animal and Poultry Sciences, Virginia Polytechnic Institute and State University,Blacksburg 24061; and †Aviagen, Huntsville, AL 35805
ABSTRACT The objective of this study was to investi-gate intestinal nutrient transporter and enzyme mRNAin broilers selected on corn- and soybean-based (line A)or wheat-based (line B) diets. We investigated the peptidetransporter PepT1, 10 amino acid transporters (rBAT,bo,+AT, ATBo,+, CAT1, CAT2, LAT1, y+LAT1, y+LAT2,BoAT, and EAAT3), 4 sugar transporters (SGLT1, SGLT5,GLUT5, and GLUT2), and a digestive enzyme (aminopep-tidase N). Intestine was collected at embryo d 18 and 20,day of hatch, and d 1, 3, 7, and 14 posthatch. The mRNAabundance of each gene was assayed using real-time PCRand the absolute quantification method. For PepT1, lineB had greater quantities of mRNA compared with line A(P = 0.001), suggesting a greater capacity for absorptionof amino acids as peptides. Levels of PepT1 mRNA were
Key words: amino acid transporter, broiler, monosaccharide transporter, PepT1
2007 Poultry Science 86:1739–1753
INTRODUCTION
In the small intestine, the final digestion and absorptionof dietary nutrients occurs through digestive enzymesand transporter proteins expressed in the apical mem-brane of enterocytes. Amino acids are transported intothe enterocyte as di- or tripeptides by the H+-dependentpeptide transporter 1, PepT1 (Leibach and Ganapathy,1996; Chen et al., 2002), or as free amino acids by a varietyof different amino acid transporters that vary in substratespecificity (Kanai and Hediger, 2004; Palacin and Kanai,2004; Verrey et al., 2004). Reports from our laboratorysuggest that, from a nutritional perspective, peptidetransport through PepT1 is important in chickens, cows,pigs, and sheep (Matthews et al., 1996; Pan et al., 1997;Chen et al., 1999). Less is known about free amino acidtransport in livestock and poultry. Because optimal
©2007 Poultry Science Association Inc.Received January 24, 2007.Accepted April 20, 2007.1This project was supported by National Research Initiative Competi-
tive Grant no. 2005-35206-15271 from the USDA Cooperative State Re-search, Education, and Extension Service. This research was also fundedin part by the John Lee Pratt Animal Nutrition Program at Virginia Tech.
2Corresponding author: [email protected]
1739
greatest in the duodenum (P < 0.05), whereas the abun-dances of SGLT1, GLUT5, and GLUT2 mRNA were great-est in the jejunum (P < 0.05). Abundances of EAAT3,bo,+AT, rBAT, BoAT, LAT1, CAT2, SGLT5, and aminopep-tidase N mRNA were greatest in the ileum (P < 0.05).Quantities of PepT1, EAAT3, BoAT, SGLT1, GLUT5, andGLUT2 mRNA increased linearly (P < 0.01), whereasCAT1, CAT2, y+LAT1, and LAT1 mRNA decreased lin-early (P < 0.05) with age. Abundance of y+LAT2 mRNAchanged cubically (P = 0.002) with peaks of expressionat day of hatch and d 7, and aminopeptidase N and SGLT5mRNA changed quadratically (P = 0.005) with age. Theseresults provide a comprehensive profile of the temporaland spatial expression of nutrient transporter mRNA inthe small intestine of chicks.
growth of broilers depends on the amino acid supply,studies of genes involved in the process of protein diges-tion and absorption are important (Gal-garber and Uni,2000).
The process of dietary carbohydrate absorption in thesmall intestine occurs through the action of facilitatedand Na+-dependent transport proteins expressed in theenterocyte (Thorens, 1996). Glucose and galactose aretransported into the cell by the Na+-dependent trans-porter SGLT1 (Thorens, 1996; Ferraris, 2001; Wright andTurk, 2004), whereas fructose enters through GLUT5 byfacilitated diffusion (Ferraris, 2001; Uldry and Thorens,2004; Wright and Turk, 2004). The exit of monosaccha-rides from the cell is mediated by GLUT2 through facili-tated diffusion (Ferraris, 2001; Uldry and Thorens, 2004;Wright and Turk, 2004). Absorption of carbohydratesfrom the intestinal lumen is critical for maintaining en-ergy supplies in animals, and is influenced by luminaldigestion, apical membrane digestion, and transport intothe enterocyte by SGLT1 (Sklan et al., 2003). Using WhiteLeghorn chickens, Barfull et al. (2002) found that SGLT1mRNA and protein declined with age after hatch, match-ing the described decline in sugar transport activity,whereas Sklan et al. (2003) observed low mRNA levelsof SGLT1 at hatch followed by a slight increase to d 7.
GILBERT ET AL.1740
Others demonstrated that uptake of glucose was low rightafter hatch and increased slowly with age, suggesting thattransport may be a limiting factor in glucose assimilationduring the early posthatch period (Sulistiyanto et al.,1999), possibly because of the presence of hydrophobicyolk in the lumen at hatch and low concentrations ofluminal sodium (Noy and Sklan, 1999). Understandingsugar transporter gene regulation is important for theelucidation of mechanisms that facilitate changes in ratesof nutrient uptake (Ferraris, 2001).
Genetics can also influence nutrient requirements inchickens, including Arg requirements in White Leghornchicks (Nesheim and Hutt, 1962) and protein require-ments for egg production in layers (Harms and Wal-droup, 1962). It follows that genetic variation in nutrientrequirements may be attributed to digestive and absorp-tive capacities at the intestinal level and postabsorptiveutilization of nutrients (NRC, 1975), and these differencesmay be most significant during the first few days of life.Uni et al. (1995) observed differences in starch digestionbetween 2 broiler strains between d 4 and 14 posthatch.Starch digestion in the heavy (Arbor Acres) chicks was90 to 95% from d 4 to 14, respectively, whereas in thelight (Lohman) chicks, it increased from 80% on d 4 to93% on d 14. Nutritional conditions in the early posthatchperiod may have the greatest impact on the overall life-time performance of chickens (Lilja, 1983; Geyra et al.,2001) and nutrient deficiencies during the first few daysafter hatch will depress mucosal development (Uni et al.,1998b) and compromise immune function (Casteel et al.,1994). Although intestinal absorption of nutrients may beof minimal significance in ovo, digestive and absorptivefunctions are established before the onset of exogenousfeeding to prepare the chick (Sklan, 2001). In chicks fromembryo d 16 to day of hatch (DOH), there was a 14- to50-fold increase in mRNA levels of PepT1 (Chen et al.,2005). Similarly, Uni et al. (2003) observed that intestinalmRNA expression of aminopeptidase, adenosine triphos-phatase, maltase, and SGLT1 increased 9- to 25-fold fromd 15 of incubation to d 19 in chick embryos. Thus, agreater understanding of the influence of both geneticsand development on expression of nutrient transportersmay facilitate improvements in growth performancethrough dietary manipulation to take advantage of differ-ential gene expression. Additionally, to reduce the costof providing protein in the diet and to reduce excessnitrogen excretion into the environment, a greater under-standing of amino acid absorption in chickens is needed.The objective of this study was to investigate the develop-mental regulation of intestinal peptide, amino acid, andmonosaccharide transporter mRNA in 2 genetically se-lected lines of broiler chicks. This study is the first toreport analysis of mRNA abundance of these genes byabsolute quantification, and is the most comprehensivestudy of chicken nutrient transporter mRNA abundanceto date.
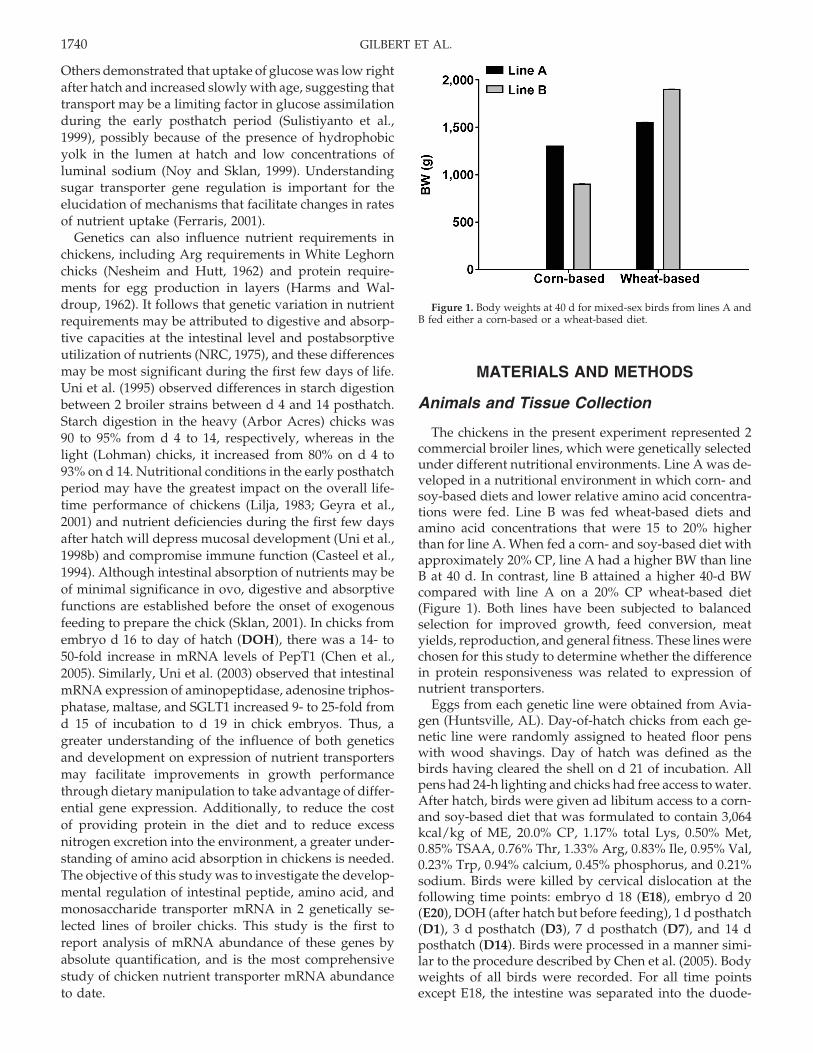
Figure 1. Body weights at 40 d for mixed-sex birds from lines A andB fed either a corn-based or a wheat-based diet.
MATERIALS AND METHODS
Animals and Tissue Collection
The chickens in the present experiment represented 2commercial broiler lines, which were genetically selectedunder different nutritional environments. Line A was de-veloped in a nutritional environment in which corn- andsoy-based diets and lower relative amino acid concentra-tions were fed. Line B was fed wheat-based diets andamino acid concentrations that were 15 to 20% higherthan for line A. When fed a corn- and soy-based diet withapproximately 20% CP, line A had a higher BW than lineB at 40 d. In contrast, line B attained a higher 40-d BWcompared with line A on a 20% CP wheat-based diet(Figure 1). Both lines have been subjected to balancedselection for improved growth, feed conversion, meatyields, reproduction, and general fitness. These lines werechosen for this study to determine whether the differencein protein responsiveness was related to expression ofnutrient transporters.
Eggs from each genetic line were obtained from Avia-gen (Huntsville, AL). Day-of-hatch chicks from each ge-netic line were randomly assigned to heated floor penswith wood shavings. Day of hatch was defined as thebirds having cleared the shell on d 21 of incubation. Allpens had 24-h lighting and chicks had free access to water.After hatch, birds were given ad libitum access to a corn-and soy-based diet that was formulated to contain 3,064kcal/kg of ME, 20.0% CP, 1.17% total Lys, 0.50% Met,0.85% TSAA, 0.76% Thr, 1.33% Arg, 0.83% Ile, 0.95% Val,0.23% Trp, 0.94% calcium, 0.45% phosphorus, and 0.21%sodium. Birds were killed by cervical dislocation at thefollowing time points: embryo d 18 (E18), embryo d 20(E20), DOH (after hatch but before feeding), 1 d posthatch(D1), 3 d posthatch (D3), 7 d posthatch (D7), and 14 dposthatch (D14). Birds were processed in a manner simi-lar to the procedure described by Chen et al. (2005). Bodyweights of all birds were recorded. For all time pointsexcept E18, the intestine was separated into the duode-
NUTRIENT TRANSPORTER MESSENGER RIBONUCLEIC ACID 1741
Tab
le1.
Pri
mer
sus
edfo
rcl
onin
gch
icke
ncD
NA
1an
dre
al-t
ime
PC
R2
Gen
eG
enB
ank
IDD
escr
ipti
onor
gene
func
tion
Clo
ning
cDN
A,s
ense
/an
tise
nse
Rea
l-ti
me
PC
R,s
ense
/an
tise
nse
Pep
T1
NM
_204
365
Olig
opep
tid
etr
ansp
orte
rA
CT
GT
CA
AT
CC
AA
TC
CT
G/
CC
CC
TG
AG
GA
GG
AT
CA
CT
GT
TG
GC
AG
TT
/G
AC
AG
TC
AC
GT
TC
TG
AA
GA
CA
AA
AG
AG
CA
GC
AG
CA
AC
GA
AP
NN
M_2
0486
1A
min
opep
tid
ase
N,d
iges
tive
enzy
me
GA
AT
AC
GC
GC
TC
GA
GA
AA
AC
/A
AT
AC
GC
GC
TC
GA
GA
AA
AC
C/
CT
TG
TT
GC
CA
AT
GG
AG
GA
GT
AG
CG
GG
TA
CG
CC
GT
GT
TrB
AT
XM
_426
125
Hea
vych
ain
corr
espo
ndin
gto
the
bo,+
tran
spor
tsy
stem
CT
CC
CA
AC
AA
CT
GG
GT
GA
GT
/C
CC
GC
CG
TT
CA
AC
AA
GA
G/
TT
CA
CT
TG
TG
GC
TC
AT
CT
CG
AA
TT
AA
AT
CC
AT
CG
AC
TC
CT
TT
GC
bo,+A
TX
M_4
1413
0N
a+-i
ndep
end
ent
cati
onic
and
zwit
erio
nic
amin
oac
idtr
ansp
orte
rA
GG
TT
GT
GA
TC
CA
CC
TC
CA
G/
CA
GT
AG
TG
AA
TT
CT
CT
GA
GT
GT
GA
AG
CT
/T
TT
TG
GG
TT
TT
TC
CT
TG
TG
CG
CA
AT
GA
TT
GC
CA
CA
AC
TA
CC
AE
AA
T3
XM
_424
930
Exc
itat
ory
amin
oac
idtr
ansp
orte
r3,
Na+
,H+,K
+d
epen
den
tG
GA
GT
TG
CT
GC
TT
TG
GA
TT
C/
TG
CT
GC
TT
TG
GA
TT
CC
AG
TG
T/
AG
GC
CT
GG
AC
GA
GA
TT
TT
CT
AG
CA
TG
AC
TG
TA
GT
GC
AG
AA
GT
AA
TA
TA
Ty+
LA
T1
XM
_418
326
Na+
-ind
epen
den
tca
tion
ic&
Na+
-dep
end
ent
neut
ral
amin
oac
idA
AT
GT
GA
AG
TG
GG
GA
AC
TC
G/
CA
GA
AA
AC
CT
CA
GA
GC
TC
CC
TT
T/
CA
CC
CT
GC
GT
AG
GA
GA
AG
AG
TG
AG
TA
CA
GA
GC
CA
GC
GC
AA
Ty+
LA
T2
NM
_001
0058
32N
a+-i
ndep
end
ent
cati
onic
&N
a+-d
epen
den
tne
utra
lam
ino
acid
GA
GA
AT
TC
AC
AG
CC
CT
TC
CA
/G
CC
CT
GT
CA
GT
AA
AT
CA
GA
CA
AG
A/
CA
GG
CT
TA
TC
CC
GT
TT
AG
CA
TT
CA
GT
TG
CA
TT
GT
GT
TT
TG
GT
TG
AP
DH
NM
_204
305
glyc
eral
deh
yde-
3-ph
osph
ate
deh
ydro
gena
seA
GT
CG
GA
GT
CA
AC
GG
AT
TT
G/
GC
CG
TC
CT
CT
CT
GG
CA
AA
G/
AC
AG
TG
CC
CT
TG
AA
GT
GT
CC
TG
TA
AA
CC
AT
GT
AG
TT
CA
LA
T1
CD
2178
21N
a+-i
ndep
end
ent
bran
ched
-cha
inan
dar
omat
icam
ino
acid
tran
spor
ter
TC
AC
GG
CA
GT
GA
AC
TG
CT
AC
/G
AT
TG
CA
AC
GG
GT
GA
TG
TG
A/
CC
AT
CC
TC
CA
TA
GG
CA
AA
AA
CC
CC
AC
AC
CC
AC
TT
TT
GT
TT
AT
B0,
+X
M_4
2626
7N
a+-
and
Cl− -d
epen
den
tne
utra
lan
dca
tion
icam
ino
acid
TG
GG
AA
AC
AG
TC
CA
AC
AT
CA
/G
TG
GA
CT
TG
TT
GC
TT
TG
TC
TT
CA
/T
CC
CA
GG
AC
AG
AG
AA
AA
TG
GG
AG
TT
TG
TT
AC
AC
AA
AA
CA
AA
AA
TA
GC
CA
T1
XM
_417
116
Na+
-ind
epen
den
tca
tion
icam
ino
acid
tran
spor
ter
TC
TC
CT
TG
GC
TC
CA
TG
TT
TC
/C
AA
GA
GG
AA
AA
CT
CC
AG
TA
AT
TG
CA
/C
AG
GA
GG
GT
CC
CA
AT
AG
AC
AA
AG
TC
GA
AG
AG
GA
AG
GC
CA
TA
AC
AT
2X
M_4
2068
5N
a+-i
ndep
end
ent
cati
onic
amin
oac
idtr
ansp
orte
rT
CT
GT
GA
TG
GC
AG
GT
CT
CT
G/
TG
CT
CG
CG
TT
CC
CA
AG
A/
CC
AC
TC
CA
GG
CT
CT
TG
CT
AC
GG
CC
CA
CA
GT
TC
AC
CA
AC
AG
Bo A
TX
M_4
1905
6N
a+-d
epen
den
tne
utra
lam
ino
acid
tran
spor
ter
AA
TG
GG
AC
AA
CA
AG
GC
TC
AG
/G
GG
TT
TT
GT
GT
TG
GC
TT
AG
GA
A/
CA
AG
AT
GA
AG
CA
GG
GG
GA
TA
TC
CA
TG
GC
TC
TG
GC
AG
AG
AT
SGL
T1
XM
_415
247
Na+
-dep
end
ent
gluc
ose
and
gala
ctos
etr
ansp
orte
rC
AT
CT
TC
CG
AG
AT
GC
TG
TC
A/
GC
CA
TG
GC
CA
GG
GC
TT
A/
CA
GG
TA
TC
CG
CA
CA
TC
AC
AC
CA
AT
AA
CC
TG
AT
CT
GT
GC
AC
CA
GT
ASG
LT
5X
M_4
2245
9gl
ucos
etr
ansp
orte
rT
GG
GA
GC
TT
TG
GT
CC
TT
AT
G/
AT
AC
CC
AA
GG
TC
AT
AG
TC
CC
AA
AC
/A
AA
GA
GC
CA
GC
AC
AG
AG
AG
GT
GG
GT
CC
CT
GA
AC
AA
AT
GA
AA
GL
UT
2Z
2293
2N
a+-i
ndep
end
ent
gluc
ose,
gala
ctos
ean
dfr
ucto
setr
ansp
orte
rC
CG
CA
GA
AG
GT
GA
TA
GA
AG
C/
CA
CA
CT
AT
GG
GC
GC
AT
GC
T/
AC
AC
AG
TG
GG
GT
CC
TC
AA
AG
AT
TG
TC
CC
TG
GA
GG
TG
TT
GG
TG
GL
UT
5X
M_4
1759
6N
a+-i
ndep
end
ent
fruc
tose
tran
spor
ter
GT
CC
TT
GG
GA
AG
GA
GA
AT
CC
/T
TG
CT
GG
CT
TT
GG
GT
TG
TG
/T
CC
AA
TA
GC
AT
GT
CC
GA
TG
AG
GA
GG
TT
GA
GG
GC
CA
AA
GT
C
1 Pri
mer
sd
esig
ned
byth
eP
rim
er3
soft
war
epr
ogra
m(h
ttp:
//
frod
o.w
i.mit
.ed
u/cg
i-bi
n/pr
imer
3/pr
imer
3_w
ww
.cgi
).2 P
rim
ers
des
igne
dby
Pri
mer
Exp
ress
soft
war
e(A
pplie
dB
iosy
stem
s,Fo
ster
Cit
y,C
A).
GILBERT ET AL.1742
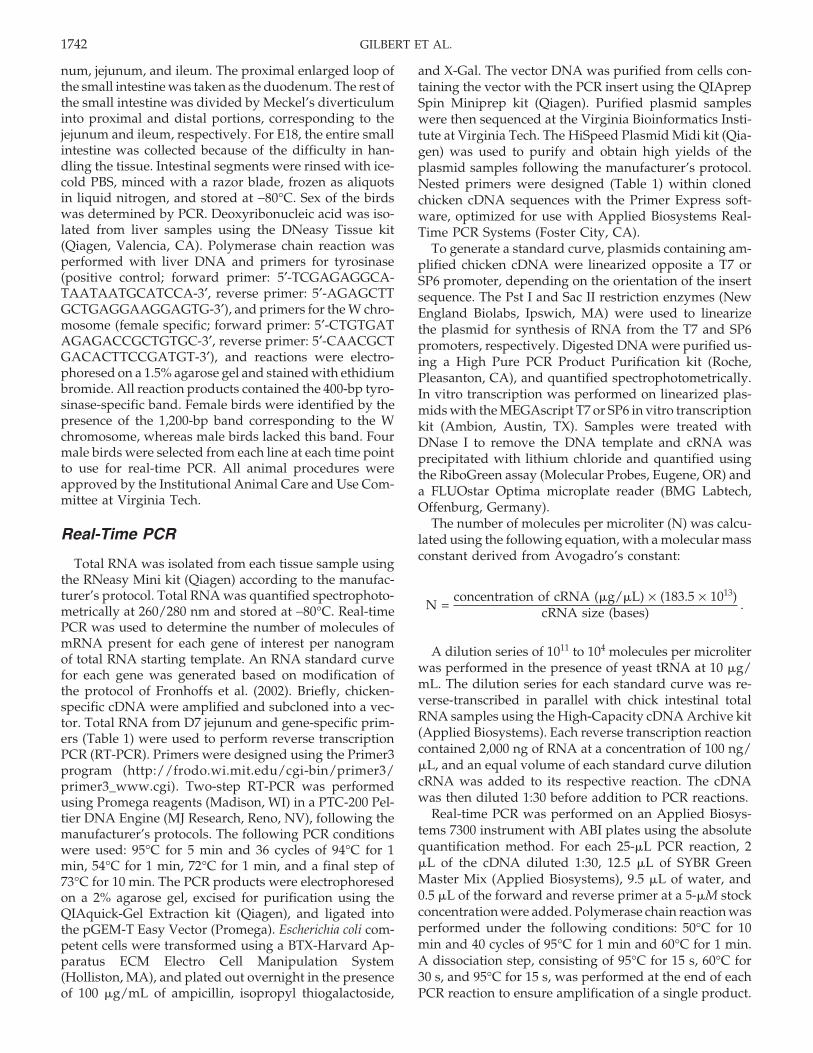
num, jejunum, and ileum. The proximal enlarged loop ofthe small intestine was taken as the duodenum. The rest ofthe small intestine was divided by Meckel’s diverticuluminto proximal and distal portions, corresponding to thejejunum and ileum, respectively. For E18, the entire smallintestine was collected because of the difficulty in han-dling the tissue. Intestinal segments were rinsed with ice-cold PBS, minced with a razor blade, frozen as aliquotsin liquid nitrogen, and stored at −80°C. Sex of the birdswas determined by PCR. Deoxyribonucleic acid was iso-lated from liver samples using the DNeasy Tissue kit(Qiagen, Valencia, CA). Polymerase chain reaction wasperformed with liver DNA and primers for tyrosinase(positive control; forward primer: 5′-TCGAGAGGCA-TAATAATGCATCCA-3′, reverse primer: 5′-AGAGCTTGCTGAGGAAGGAGTG-3′), and primers for the W chro-mosome (female specific; forward primer: 5′-CTGTGATAGAGACCGCTGTGC-3′, reverse primer: 5′-CAACGCTGACACTTCCGATGT-3′), and reactions were electro-phoresed on a 1.5% agarose gel and stained with ethidiumbromide. All reaction products contained the 400-bp tyro-sinase-specific band. Female birds were identified by thepresence of the 1,200-bp band corresponding to the Wchromosome, whereas male birds lacked this band. Fourmale birds were selected from each line at each time pointto use for real-time PCR. All animal procedures wereapproved by the Institutional Animal Care and Use Com-mittee at Virginia Tech.
Real-Time PCR
Total RNA was isolated from each tissue sample usingthe RNeasy Mini kit (Qiagen) according to the manufac-turer’s protocol. Total RNA was quantified spectrophoto-metrically at 260/280 nm and stored at −80°C. Real-timePCR was used to determine the number of molecules ofmRNA present for each gene of interest per nanogramof total RNA starting template. An RNA standard curvefor each gene was generated based on modification ofthe protocol of Fronhoffs et al. (2002). Briefly, chicken-specific cDNA were amplified and subcloned into a vec-tor. Total RNA from D7 jejunum and gene-specific prim-ers (Table 1) were used to perform reverse transcriptionPCR (RT-PCR). Primers were designed using the Primer3program (http://frodo.wi.mit.edu/cgi-bin/primer3/primer3_www.cgi). Two-step RT-PCR was performedusing Promega reagents (Madison, WI) in a PTC-200 Pel-tier DNA Engine (MJ Research, Reno, NV), following themanufacturer’s protocols. The following PCR conditionswere used: 95°C for 5 min and 36 cycles of 94°C for 1min, 54°C for 1 min, 72°C for 1 min, and a final step of73°C for 10 min. The PCR products were electrophoresedon a 2% agarose gel, excised for purification using theQIAquick-Gel Extraction kit (Qiagen), and ligated intothe pGEM-T Easy Vector (Promega). Escherichia coli com-petent cells were transformed using a BTX-Harvard Ap-paratus ECM Electro Cell Manipulation System(Holliston, MA), and plated out overnight in the presenceof 100 �g/mL of ampicillin, isopropyl thiogalactoside,
and X-Gal. The vector DNA was purified from cells con-taining the vector with the PCR insert using the QIAprepSpin Miniprep kit (Qiagen). Purified plasmid sampleswere then sequenced at the Virginia Bioinformatics Insti-tute at Virginia Tech. The HiSpeed Plasmid Midi kit (Qia-gen) was used to purify and obtain high yields of theplasmid samples following the manufacturer’s protocol.Nested primers were designed (Table 1) within clonedchicken cDNA sequences with the Primer Express soft-ware, optimized for use with Applied Biosystems Real-Time PCR Systems (Foster City, CA).
To generate a standard curve, plasmids containing am-plified chicken cDNA were linearized opposite a T7 orSP6 promoter, depending on the orientation of the insertsequence. The Pst I and Sac II restriction enzymes (NewEngland Biolabs, Ipswich, MA) were used to linearizethe plasmid for synthesis of RNA from the T7 and SP6promoters, respectively. Digested DNA were purified us-ing a High Pure PCR Product Purification kit (Roche,Pleasanton, CA), and quantified spectrophotometrically.In vitro transcription was performed on linearized plas-mids with the MEGAscript T7 or SP6 in vitro transcriptionkit (Ambion, Austin, TX). Samples were treated withDNase I to remove the DNA template and cRNA wasprecipitated with lithium chloride and quantified usingthe RiboGreen assay (Molecular Probes, Eugene, OR) anda FLUOstar Optima microplate reader (BMG Labtech,Offenburg, Germany).
The number of molecules per microliter (N) was calcu-lated using the following equation, with a molecular massconstant derived from Avogadro’s constant:
N =concentration of cRNA (�g/�L) × (183.5 × 10¹³)
cRNA size (bases) .
A dilution series of 1011 to 104 molecules per microliterwas performed in the presence of yeast tRNA at 10 �g/mL. The dilution series for each standard curve was re-verse-transcribed in parallel with chick intestinal totalRNA samples using the High-Capacity cDNA Archive kit(Applied Biosystems). Each reverse transcription reactioncontained 2,000 ng of RNA at a concentration of 100 ng/�L, and an equal volume of each standard curve dilutioncRNA was added to its respective reaction. The cDNAwas then diluted 1:30 before addition to PCR reactions.
Real-time PCR was performed on an Applied Biosys-tems 7300 instrument with ABI plates using the absolutequantification method. For each 25-�L PCR reaction, 2�L of the cDNA diluted 1:30, 12.5 �L of SYBR GreenMaster Mix (Applied Biosystems), 9.5 �L of water, and0.5 �L of the forward and reverse primer at a 5-�M stockconcentration were added. Polymerase chain reaction wasperformed under the following conditions: 50°C for 10min and 40 cycles of 95°C for 1 min and 60°C for 1 min.A dissociation step, consisting of 95°C for 15 s, 60°C for30 s, and 95°C for 15 s, was performed at the end of eachPCR reaction to ensure amplification of a single product.

NUTRIENT TRANSPORTER MESSENGER RIBONUCLEIC ACID 1743
Figure 2. Bird BW from day of hatch to d 14 posthatch. Meansrepresent BW (g) ± SEM from 35 mixed-sex birds. Four male birds wererandomly selected for the experiment from both genetic lines at eachtime point. DOH = day of hatch (after hatch but before feeding); D1 =d 1 after hatch; D3 = d 3 after hatch; D7 = d 7 after hatch; D14 = d 14after hatch.
Statistical Analysis
All data were analyzed using SAS PROC MIXED (SASInstitute, Cary, NC). The model included the main effectsof genetic line, intestinal segment, age, and all appropriate2-way interactions. The 3-way interactions were removedfrom the model as they were determined to be nonsignifi-cant (P < 0.05). Differences among segments were evalu-ated by the Tukey test for multiple comparisons. The E18time point was not included in the statistical model. Themain effects of age were further tested for linear, qua-dratic, and cubic responses using orthogonal contrasts inPROC MIXED. The contrast coefficient matrix for unequalspacing was generated using PROC IML.
Figure 3. The number of PepT1 mRNA molecules per nanogram of total RNA in line A (A) and line B (B) chicks was determined by real-timePCR. Quantities represent the means of 4 male birds ± SEM at embryo d 18 (E18) and embryo d 20 (E20), day of hatch (DOH; after hatch butbefore feeding), and d 1 (D1), d 3 (D3), d 7 (D7), and d 14 (D14) after hatch. The statistical model did not include the E18 time point. There wasa main effect of genetic line (P = 0.0007), intestinal segment (P = 0.031), and linear effect (P = 0.0001) with age.
RESULTS
After hatch, birds were given ad libitum access to a20% CP corn- and soy-based diet, because this has beenshown to accentuate differences in BW between the 2 linesover 42 d. Body weights were not significantly differentbetween genetic lines by D14 (P = 0.5; Figure 2), althoughweights of line A and B birds were starting to diverge,with line A weights being greater than line B weights.
The mRNA abundance for a number of amino acid,peptide, and monosaccharide transporters was deter-mined using real-time PCR and the absolute quantifica-tion method. Thus, the results presented herein representmRNA, and it is unknown at this time whether these dataparallel expression and activity of the functional proteins.The functions of all genes evaluated in this study are listedin Table 1. The mRNA expression data are summarized inTables 2 and 3, with separate rows for main effects ofdevelopmental age, intestinal segment, and genetic line,interactions, and orthogonal contrasts across develop-mental age. If no significant differences were observedbetween genetic lines, data for lines A and B were com-bined and displayed as a single graph.
At the brush border membrane, the uptake of aminoacids is mediated by the action of the peptide transporterPepT1 and a number of different amino acid transporters,which transport neutral, cationic, and anionic aminoacids. The number of molecules of peptide transporterPepT1 mRNA per nanogram of total RNA ranged from700 to 12,000 (Figure 3, panels A and B). Abundance ofPepT1 mRNA was greater in line B than in line A (P =0.0007). In line B, PepT1 mRNA rose continuously withage, whereas in line A, mRNA leveled off after d 3. Therewas an approximate 2-fold difference between lines Aand B in concentration of PepT1 mRNA per nanogramof total RNA (3,600 vs. 6,300, respectively). Quantities ofPepT1 mRNA were greatest in the duodenum comparedwith the ileum (P = 0.04), whereas jejunal mRNA was

GILBERT ET AL.1744
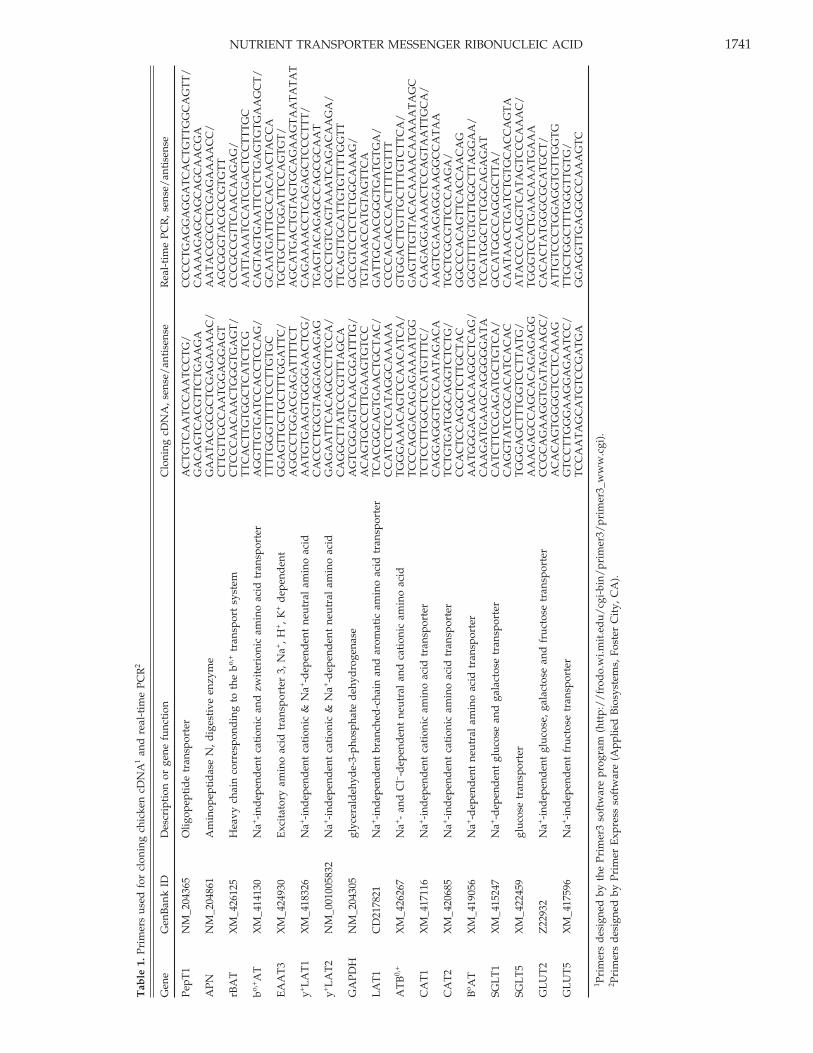
Table 2. Developmental regulation of peptide and amino acid transporter mRNA in the small intestine of broiler chicks1
Gene
Item PepT1 bo,+AT rBAT EAAT3 BoAT LAT1 y+LAT1 y+LAT2
Molecules of mRNA/ng of total RNALine
A 3,600 96,900 29,600 4,000 4,300 193 289 6,500B 6,300 81,800 28,900 4,200 4,800 185 266 6,200SEM 520 7,708 4,036 333 719 24 25 852P-value 0.0007 0.1729 0.8965 0.5940 0.5997 0.8185 0.5216 0.8132
SegmentDuodenum 5,300c 78,700e 26,000h 1,800e 3,700h 166h 271 6,400Jejunum 5,200cd 75,000e 27,600h 3,800f 3,800h 182h 268 6,600Ileum 4,400d 114,400f 34,200i 6,700g 6,200i 220i 294 6,000SEM 424 6,901 3,082 301 601 20 26 662P-value 0.0311 0.0001 0.0002 0.0001 0.0001 0.0073 0.6898 0.4527
AgeE20 1,400 81,600 20,000 2,000 1,300 214 349 5,600DOH 3,600 106,300 36,200 4,300 4,000 229 304 8,500D1 4,900 83,800 31,500 3,500 4,700 101 194 7,800D3 5,800 74,900 24,800 3,600 3,600 229 197 4,600D7 6,400 97,000 31,500 5,000 6,000 171 333 6,500D14 7,500 92,600 31,600 6,200 7,700 192 288 4,900SEM 901 13,350 6,991 578 1,245 42 44 1,475P-value 0.0004 0.6031 0.6317 0.0003 0.0225 0.2646 0.0615 0.3664
Age response P-valueContrast
Linear 0.0001 0.8597 0.1198 0.0012 0.0001 0.0447 0.0028 0.8048Quadratic 0.2050 0.0847 0.0621 0.0382 0.2503 0.0723 0.2611 0.1472Cubic 0.0204 0.3470 0.0993 0.6234 0.6910 0.2465 0.3882 0.0020
Interaction P-valueInteraction2
L × S 0.6008 0.0413 0.0823 0.9388 0.4797 0.7460 0.8658 0.4692L × A 0.0637 0.8374 0.9015 0.3374 0.6380 0.8275 0.7471 0.6629S × A 0.0524 0.0112 0.3793 0.0001 0.0018 0.0390 0.6893 0.4245
c,dWithin a column, means without a common superscript differ (P < 0.05).e–gWithin a column, means without a common superscript differ (P = 0.0001).h,iWithin a column, means without a common superscript differ (P < 0.01).1All means expressed as molecules of mRNA per nanogram of total RNA. Means represent the main effects, interactions, and contrasts for data
displayed in the figures.2For the interactions, L, S, and A represent the main effects of line, segment and age, respectively.
intermediate. Abundance of PepT1 mRNA increased lin-early (P = 0.0001) from E20 to D14.
The rBAT and bo,+AT proteins heterodimerize andserve as Na+-independent amino acid exchangers on theapical membrane, with a high extracellular affinity forcationic amino acids and a high intracellular affinity forneutral amino acids (Palacin and Kanai, 2004). Moleculesof bo,+AT mRNA per nanogram of total RNA ranged from35,000 to 170,000 (Figure 4, panels A and B). Neithergenetic line nor age of bird influenced abundance ofbo,+AT mRNA. The quantities of bo,+AT mRNA weregreater in the ileum compared with the duodenum andjejunum (P = 0.0001). There was a line × intestinal segmentinteraction (P = 0.04), where line A mRNA levels weregreatest in the ileum, lowest in the jejunum, and interme-diate in the duodenum, whereas in line B, mRNA levelswere also greatest in the ileum but lowest in the duode-num and intermediate in the jejunum. There was also anintestinal segment × age interaction (P = 0.01). Quantitiesof mRNA in the ileum increased to D1, whereas mRNAlevels decreased to D1 in the duodenum and jejunum,and quantities of mRNA in the ileum increased most
dramatically after D3 compared with the duodenum andjejunum. The rBAT mRNA quantities ranged from 5,900to 57,000 molecules per nanogram of total RNA (Figure5, panel A). Differences observed between genetic linesand among ages were not significant. Quantities of rBATmRNA were greater in the ileum compared with the duo-denum and jejunum (P < 0.01).
The EAAT3 brush border membrane-bound protein isa Na+-dependent transporter with a high affinity for an-ionic amino acids, including aspartate and glutamate (Ka-nai and Hediger, 2004). Quantities of EAAT3 mRNAmolecules per nanogram of total RNA ranged from 1,000to 12,500 (Figure 5, panel B). There was no effect of geneticline on EAAT3 mRNA quantities. Quantities of EAAT3mRNA were greatest in the ileum, lowest in the duode-num, and intermediate in the jejunum (P = 0.0001). Quan-tities of EAAT3 mRNA increased linearly (P = 0.001) fromE20 to D14. There was an intestinal segment × age interac-tion (P = 0.0001), where EAAT3 mRNA increased mostdramatically after D3 in the ileum compared with theduodenum and jejunum. Molecules of BoAT mRNA pernanogram of total RNA ranged from approximately 300
NUTRIENT TRANSPORTER MESSENGER RIBONUCLEIC ACID 1745
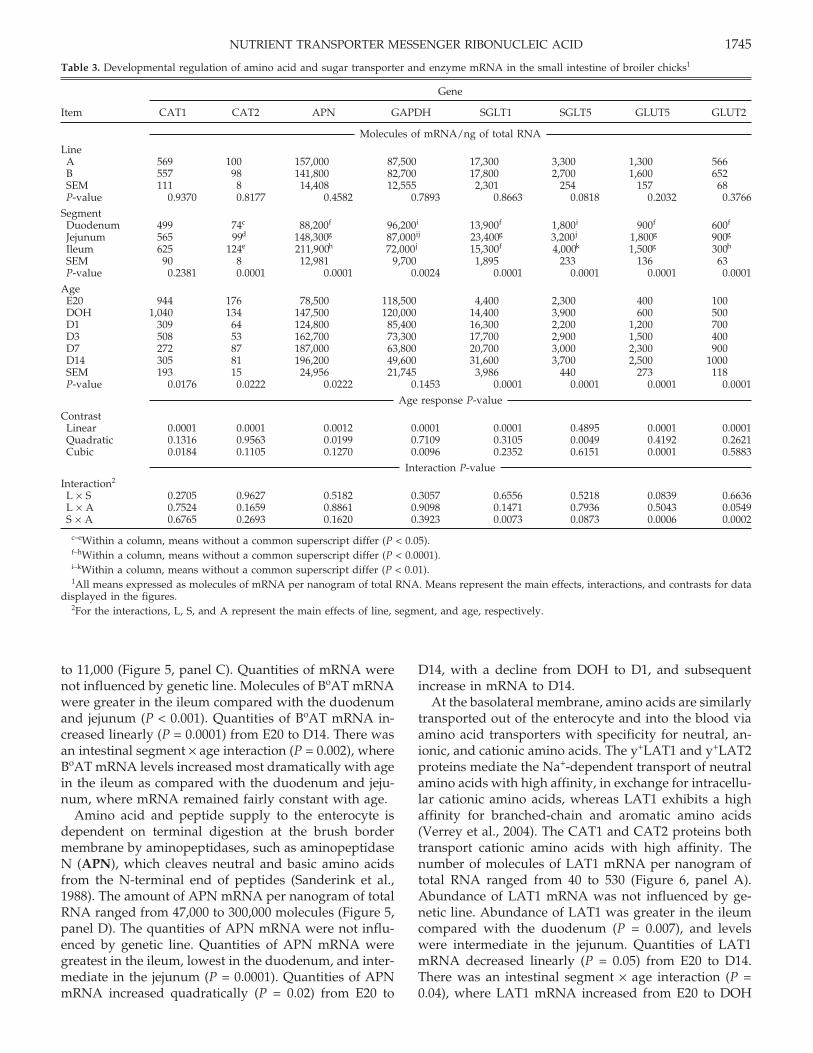
Table 3. Developmental regulation of amino acid and sugar transporter and enzyme mRNA in the small intestine of broiler chicks1
Gene
Item CAT1 CAT2 APN GAPDH SGLT1 SGLT5 GLUT5 GLUT2
Molecules of mRNA/ng of total RNALine
A 569 100 157,000 87,500 17,300 3,300 1,300 566B 557 98 141,800 82,700 17,800 2,700 1,600 652SEM 111 8 14,408 12,555 2,301 254 157 68P-value 0.9370 0.8177 0.4582 0.7893 0.8663 0.0818 0.2032 0.3766
SegmentDuodenum 499 74c 88,200f 96,200i 13,900f 1,800i 900f 600f
Jejunum 565 99d 148,300g 87,000ij 23,400g 3,200j 1,800g 900g
Ileum 625 124e 211,900h 72,000j 15,300f 4,000k 1,500g 300h
SEM 90 8 12,981 9,700 1,895 233 136 63P-value 0.2381 0.0001 0.0001 0.0024 0.0001 0.0001 0.0001 0.0001
AgeE20 944 176 78,500 118,500 4,400 2,300 400 100DOH 1,040 134 147,500 120,000 14,400 3,900 600 500D1 309 64 124,800 85,400 16,300 2,200 1,200 700D3 508 53 162,700 73,300 17,700 2,900 1,500 400D7 272 87 187,000 63,800 20,700 3,000 2,300 900D14 305 81 196,200 49,600 31,600 3,700 2,500 1000SEM 193 15 24,956 21,745 3,986 440 273 118P-value 0.0176 0.0222 0.0222 0.1453 0.0001 0.0001 0.0001 0.0001
Age response P-valueContrast
Linear 0.0001 0.0001 0.0012 0.0001 0.0001 0.4895 0.0001 0.0001Quadratic 0.1316 0.9563 0.0199 0.7109 0.3105 0.0049 0.4192 0.2621Cubic 0.0184 0.1105 0.1270 0.0096 0.2352 0.6151 0.0001 0.5883
Interaction P-valueInteraction2
L × S 0.2705 0.9627 0.5182 0.3057 0.6556 0.5218 0.0839 0.6636L × A 0.7524 0.1659 0.8861 0.9098 0.1471 0.7936 0.5043 0.0549S × A 0.6765 0.2693 0.1620 0.3923 0.0073 0.0873 0.0006 0.0002
c–eWithin a column, means without a common superscript differ (P < 0.05).f–hWithin a column, means without a common superscript differ (P < 0.0001).i–kWithin a column, means without a common superscript differ (P < 0.01).1All means expressed as molecules of mRNA per nanogram of total RNA. Means represent the main effects, interactions, and contrasts for data
displayed in the figures.2For the interactions, L, S, and A represent the main effects of line, segment, and age, respectively.
to 11,000 (Figure 5, panel C). Quantities of mRNA werenot influenced by genetic line. Molecules of BoAT mRNAwere greater in the ileum compared with the duodenumand jejunum (P < 0.001). Quantities of BoAT mRNA in-creased linearly (P = 0.0001) from E20 to D14. There wasan intestinal segment × age interaction (P = 0.002), whereBoAT mRNA levels increased most dramatically with agein the ileum as compared with the duodenum and jeju-num, where mRNA remained fairly constant with age.
Amino acid and peptide supply to the enterocyte isdependent on terminal digestion at the brush bordermembrane by aminopeptidases, such as aminopeptidaseN (APN), which cleaves neutral and basic amino acidsfrom the N-terminal end of peptides (Sanderink et al.,1988). The amount of APN mRNA per nanogram of totalRNA ranged from 47,000 to 300,000 molecules (Figure 5,panel D). The quantities of APN mRNA were not influ-enced by genetic line. Quantities of APN mRNA weregreatest in the ileum, lowest in the duodenum, and inter-mediate in the jejunum (P = 0.0001). Quantities of APNmRNA increased quadratically (P = 0.02) from E20 to
D14, with a decline from DOH to D1, and subsequentincrease in mRNA to D14.
At the basolateral membrane, amino acids are similarlytransported out of the enterocyte and into the blood viaamino acid transporters with specificity for neutral, an-ionic, and cationic amino acids. The y+LAT1 and y+LAT2proteins mediate the Na+-dependent transport of neutralamino acids with high affinity, in exchange for intracellu-lar cationic amino acids, whereas LAT1 exhibits a highaffinity for branched-chain and aromatic amino acids(Verrey et al., 2004). The CAT1 and CAT2 proteins bothtransport cationic amino acids with high affinity. Thenumber of molecules of LAT1 mRNA per nanogram oftotal RNA ranged from 40 to 530 (Figure 6, panel A).Abundance of LAT1 mRNA was not influenced by ge-netic line. Abundance of LAT1 was greater in the ileumcompared with the duodenum (P = 0.007), and levelswere intermediate in the jejunum. Quantities of LAT1mRNA decreased linearly (P = 0.05) from E20 to D14.There was an intestinal segment × age interaction (P =0.04), where LAT1 mRNA increased from E20 to DOH
GILBERT ET AL.1746
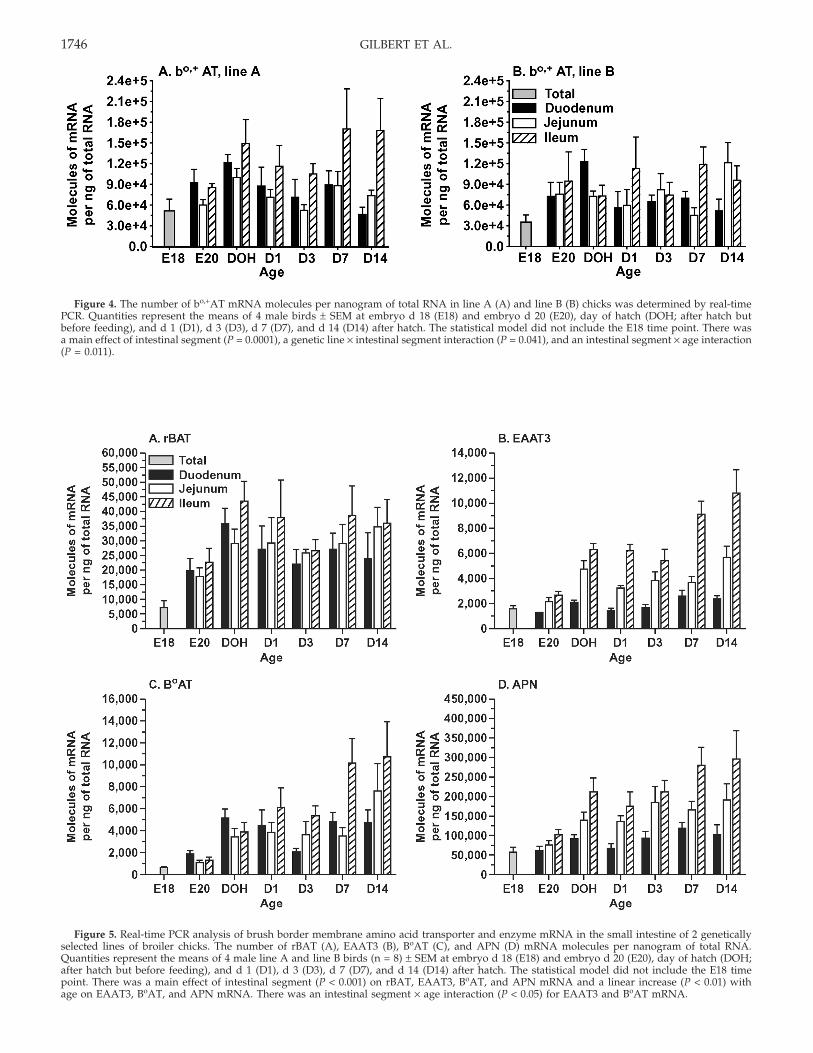
Figure 4. The number of bo,+AT mRNA molecules per nanogram of total RNA in line A (A) and line B (B) chicks was determined by real-timePCR. Quantities represent the means of 4 male birds ± SEM at embryo d 18 (E18) and embryo d 20 (E20), day of hatch (DOH; after hatch butbefore feeding), and d 1 (D1), d 3 (D3), d 7 (D7), and d 14 (D14) after hatch. The statistical model did not include the E18 time point. There wasa main effect of intestinal segment (P = 0.0001), a genetic line × intestinal segment interaction (P = 0.041), and an intestinal segment × age interaction(P = 0.011).
Figure 5. Real-time PCR analysis of brush border membrane amino acid transporter and enzyme mRNA in the small intestine of 2 geneticallyselected lines of broiler chicks. The number of rBAT (A), EAAT3 (B), BoAT (C), and APN (D) mRNA molecules per nanogram of total RNA.Quantities represent the means of 4 male line A and line B birds (n = 8) ± SEM at embryo d 18 (E18) and embryo d 20 (E20), day of hatch (DOH;after hatch but before feeding), and d 1 (D1), d 3 (D3), d 7 (D7), and d 14 (D14) after hatch. The statistical model did not include the E18 timepoint. There was a main effect of intestinal segment (P < 0.001) on rBAT, EAAT3, BoAT, and APN mRNA and a linear increase (P < 0.01) withage on EAAT3, BoAT, and APN mRNA. There was an intestinal segment × age interaction (P < 0.05) for EAAT3 and BoAT mRNA.
NUTRIENT TRANSPORTER MESSENGER RIBONUCLEIC ACID 1747
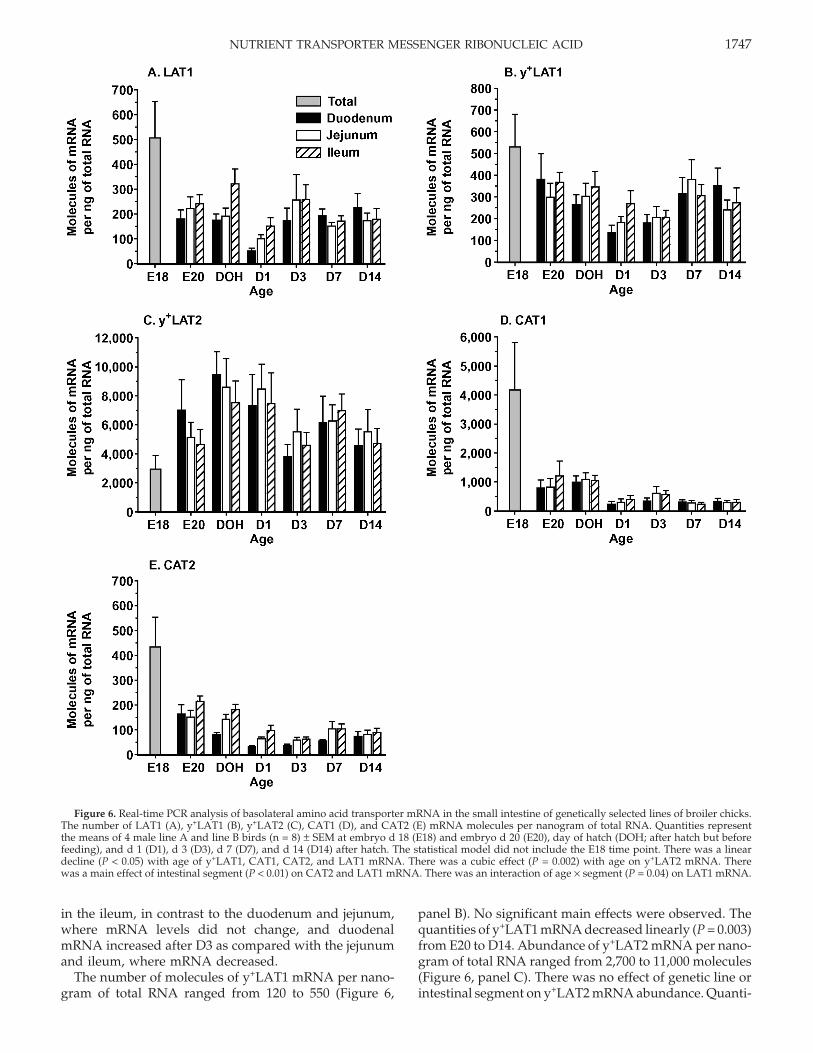
Figure 6. Real-time PCR analysis of basolateral amino acid transporter mRNA in the small intestine of genetically selected lines of broiler chicks.The number of LAT1 (A), y+LAT1 (B), y+LAT2 (C), CAT1 (D), and CAT2 (E) mRNA molecules per nanogram of total RNA. Quantities representthe means of 4 male line A and line B birds (n = 8) ± SEM at embryo d 18 (E18) and embryo d 20 (E20), day of hatch (DOH; after hatch but beforefeeding), and d 1 (D1), d 3 (D3), d 7 (D7), and d 14 (D14) after hatch. The statistical model did not include the E18 time point. There was a lineardecline (P < 0.05) with age of y+LAT1, CAT1, CAT2, and LAT1 mRNA. There was a cubic effect (P = 0.002) with age on y+LAT2 mRNA. Therewas a main effect of intestinal segment (P < 0.01) on CAT2 and LAT1 mRNA. There was an interaction of age × segment (P = 0.04) on LAT1 mRNA.
in the ileum, in contrast to the duodenum and jejunum,where mRNA levels did not change, and duodenalmRNA increased after D3 as compared with the jejunumand ileum, where mRNA decreased.
The number of molecules of y+LAT1 mRNA per nano-gram of total RNA ranged from 120 to 550 (Figure 6,
panel B). No significant main effects were observed. Thequantities of y+LAT1 mRNA decreased linearly (P = 0.003)from E20 to D14. Abundance of y+LAT2 mRNA per nano-gram of total RNA ranged from 2,700 to 11,000 molecules(Figure 6, panel C). There was no effect of genetic line orintestinal segment on y+LAT2 mRNA abundance. Quanti-
GILBERT ET AL.1748
ties of y+LAT2 mRNA changed cubically (P = 0.002) withage, with the greatest mRNA quantities observed at DOHand D7.
The number of molecules of CAT1 mRNA per nano-gram of total RNA ranged from 180 to 4,400 molecules(Figure 6, panel D). The abundance of CAT1 mRNA wasnot influenced by genetic line or intestinal segment. Thequantities of CAT1 mRNA decreased linearly (P = 0.0001)from E20 to D14. Quantities of CAT2 mRNA per nano-gram of total RNA ranged from 30 to 500 (Figure 6, panelE). Quantities of CAT2 mRNA were not influenced bygenetic line. Abundance of CAT2 mRNA was greatest inthe ileum, lowest in the duodenum, and intermediatein the jejunum (P < 0.05). Quantities of CAT2 mRNAdecreased linearly from E20 to D14 (P = 0.0001). The Na+-dependent and Cl−-dependent cationic and neutral aminoacid transporter ATBo,+ was also evaluated in this study;however, there was no amplification of the PCR productduring real-time PCR. Thus, we concluded that it is mostlikely not expressed in the chicken small intestine.
In a manner similar to amino acid assimilation, oligo-saccharides are broken down into monosaccharides,which are then taken up by sugar transporters located onthe brush border membrane. The SGLT1 protein mediatesthe Na+-dependent uptake of glucose and galactose acrossthe brush border membrane (Thorens, 1996) and is consid-ered to be the primary mediator of glucose assimilationin the small intestine (Wright, 1993; Hediger and Rhoads,1994). A search of the chicken genome revealed 2 pre-dicted SGLT genes, with 1 located on chromosome 8 (Gen-Bank accession number XM_422459) and the other onchromosome 15 (GenBank accession numberXM_415247). A multiple-sequence alignment (http://workbench.sdsc.edu) of amino acids from the 2 predictedSGLT genes and all 11 members of the human SLC5 genefamily predicted that SGLT on chromosome 15 was themost similar to human SGLT1, whereas SGLT on chromo-some 8 was the most similar to SGLT5, a kidney glucosetransporter. Thus, in this paper, the SGLT gene on chro-mosome 15 will be referred to as SGLT1 and the SGLTgene on chromosome 8 will be referred to as SGLT5.
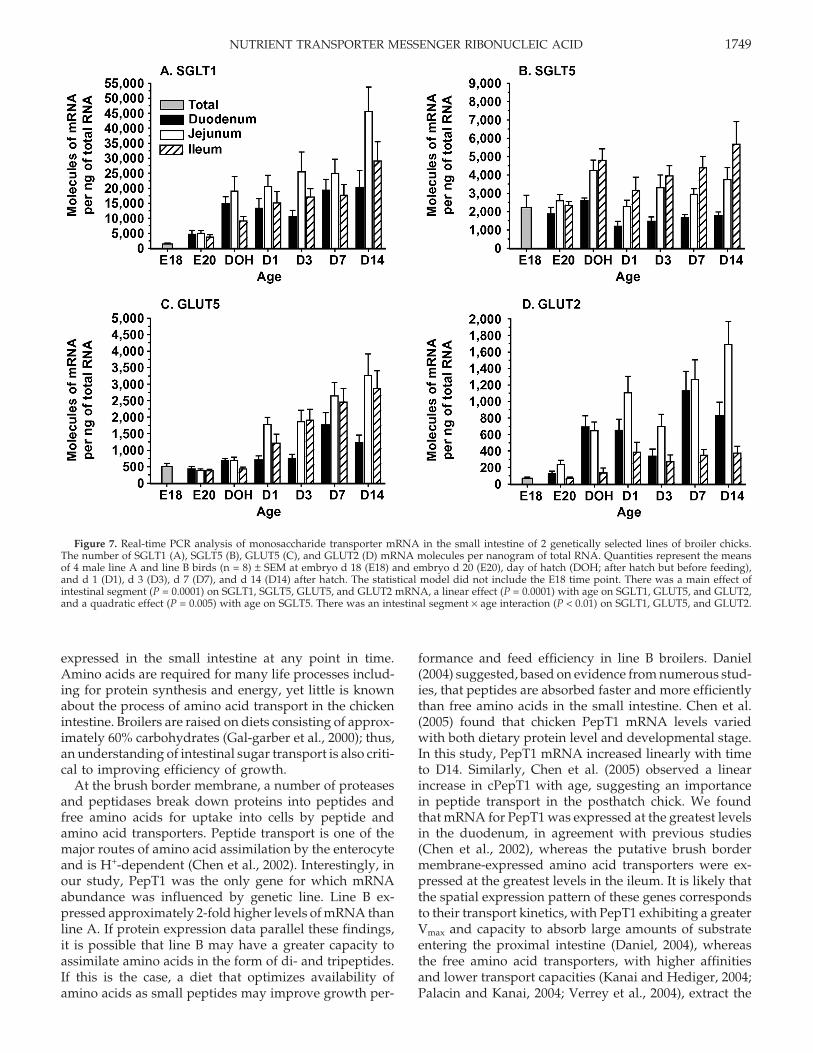
Quantities of SGLT1 mRNA were greatest in compari-son with the other monosaccharide transporters exam-ined in this study, and ranged from 1,200 to 63,300molecules per nanogram of total RNA (Figure 7, panelA). Abundance of SGLT1 mRNA was not influenced bygenetic line. Levels of SGLT1 mRNA increased linearly(P = 0.0001) from E20 to D14. The quantities of SGLT1mRNA were greater in the jejunum compared with theduodenum and ileum (P = 0.0001). There was an intestinalsegment × age interaction (P = 0.007), in which SGLT1mRNA increased most dramatically with age in the jeju-num as compared with the duodenum and ileum.
Abundance of SGLT5 mRNA per nanogram of totalRNA ranged from 1,200 to 7,300 molecules (Figure 7,panel B). Quantities of SGLT5 mRNA changed quadrati-cally (P = 0.005) with time, with mRNA quantities declin-ing to D1 and increasing thereafter. The mRNA was
greatest in the ileum, lowest in the duodenum, and inter-mediate in the jejunum (P < 0.01).
Transport of fructose across the brush border mem-brane is facilitated by GLUT5 (Uldry and Thorens, 2004).Quantities of GLUT5 mRNA ranged from 300 to 4,300molecules per nanogram of total RNA (Figure 7, panelC). Quantities of GLUT5 were greater in the jejunumand ileum compared with the duodenum (P = 0.0001).Abundance of GLUT5 mRNA increased linearly (P =0.0001) from E20 to D14. An intestinal segment × ageinteraction (P = 0.0006) was observed, in that abundanceof GLUT5 mRNA increased more dramatically after DOHin the jejunum and ileum as compared with the du-odenum.
The GLUT2 transporter mediates the facilitated trans-port of glucose, galactose, and fructose across the basolat-eral membrane (Uldry and Thorens, 2004). The numberof molecules of GLUT2 mRNA per nanogram of totalRNA ranged from 60 to 2,300 (Figure 7, panel D). ThemRNA levels of GLUT2 were greatest in the jejunum,lowest in the ileum, and intermediate in the duodenum(P = 0.0001). Abundance of GLUT2 mRNA increased lin-early (P = 0.0001) from E20 to D14. There was an intestinalsegment × age interaction (P = 0.0002), in which GLUT2mRNA increased more dramatically in the jejunum afterD3 compared with the duodenum and ileum.
In addition to nutrient transporters and a digestiveenzyme, mRNA for a housekeeping gene, GAPDH, wasevaluated in this study. The housekeeping gene GAPDHis assumed to be uniformly expressed across cell typesand is commonly used as an internal standard in relativequantification studies to correct for differences in RNAloading amounts (Jain et al., 2006). Our results demon-strated that there was a linear decrease (P = 0.0001) inGAPDH mRNA quantities from E20 to D14. The quantityof GAPDH mRNA per nanogram of total RNA rangedfrom 31,700 to 190,000 (Figure 8). Quantities of GAPDHmRNA were greater in the duodenum than in the ileum(P = 0.002) and levels were intermediate in the jejunum.Abundance of GAPDH mRNA was not influenced bygenetic line.
DISCUSSION
Chicken lifetime performance is greatly influenced bydiet quality and nutrient availability during the earlyposthatch period (Lilja, 1983; Geyra et al., 2001). Thegrowth of chicks is dependent on the ability of the intes-tine to assimilate nutrients efficiently as the bird shiftsfrom the lipid-rich yolk as the sole source of energy to acarbohydrate- and protein-based diet (Sklan, 2001). Be-cause the developmental regulation of nutrient trans-porter mRNA has not been thoroughly evaluated inchickens, in this study we compared developmentalchanges in mRNA abundance in 2 genetically selectedlines of broilers. A greater understanding of the capacityof the intestine to assimilate amino acids and glucose iscritical to formulating diets that best accommodate theprofile of digestive enzymes and nutrient transporters
NUTRIENT TRANSPORTER MESSENGER RIBONUCLEIC ACID 1749
Figure 7. Real-time PCR analysis of monosaccharide transporter mRNA in the small intestine of 2 genetically selected lines of broiler chicks.The number of SGLT1 (A), SGLT5 (B), GLUT5 (C), and GLUT2 (D) mRNA molecules per nanogram of total RNA. Quantities represent the meansof 4 male line A and line B birds (n = 8) ± SEM at embryo d 18 (E18) and embryo d 20 (E20), day of hatch (DOH; after hatch but before feeding),and d 1 (D1), d 3 (D3), d 7 (D7), and d 14 (D14) after hatch. The statistical model did not include the E18 time point. There was a main effect ofintestinal segment (P = 0.0001) on SGLT1, SGLT5, GLUT5, and GLUT2 mRNA, a linear effect (P = 0.0001) with age on SGLT1, GLUT5, and GLUT2,and a quadratic effect (P = 0.005) with age on SGLT5. There was an intestinal segment × age interaction (P < 0.01) on SGLT1, GLUT5, and GLUT2.
expressed in the small intestine at any point in time.Amino acids are required for many life processes includ-ing for protein synthesis and energy, yet little is knownabout the process of amino acid transport in the chickenintestine. Broilers are raised on diets consisting of approx-imately 60% carbohydrates (Gal-garber et al., 2000); thus,an understanding of intestinal sugar transport is also criti-cal to improving efficiency of growth.
At the brush border membrane, a number of proteasesand peptidases break down proteins into peptides andfree amino acids for uptake into cells by peptide andamino acid transporters. Peptide transport is one of themajor routes of amino acid assimilation by the enterocyteand is H+-dependent (Chen et al., 2002). Interestingly, inour study, PepT1 was the only gene for which mRNAabundance was influenced by genetic line. Line B ex-pressed approximately 2-fold higher levels of mRNA thanline A. If protein expression data parallel these findings,it is possible that line B may have a greater capacity toassimilate amino acids in the form of di- and tripeptides.If this is the case, a diet that optimizes availability ofamino acids as small peptides may improve growth per-
formance and feed efficiency in line B broilers. Daniel(2004) suggested, based on evidence from numerous stud-ies, that peptides are absorbed faster and more efficientlythan free amino acids in the small intestine. Chen et al.(2005) found that chicken PepT1 mRNA levels variedwith both dietary protein level and developmental stage.In this study, PepT1 mRNA increased linearly with timeto D14. Similarly, Chen et al. (2005) observed a linearincrease in cPepT1 with age, suggesting an importancein peptide transport in the posthatch chick. We foundthat mRNA for PepT1 was expressed at the greatest levelsin the duodenum, in agreement with previous studies(Chen et al., 2002), whereas the putative brush bordermembrane-expressed amino acid transporters were ex-pressed at the greatest levels in the ileum. It is likely thatthe spatial expression pattern of these genes correspondsto their transport kinetics, with PepT1 exhibiting a greaterVmax and capacity to absorb large amounts of substrateentering the proximal intestine (Daniel, 2004), whereasthe free amino acid transporters, with higher affinitiesand lower transport capacities (Kanai and Hediger, 2004;Palacin and Kanai, 2004; Verrey et al., 2004), extract the

GILBERT ET AL.1750
remaining unabsorbed amino acids from the lumen ofthe distal intestine before they are excreted.
Aminopeptidase N is a digestive enzyme that cleavesamino acids from the N-terminal end of peptides, and isfairly specific for peptides with an N-terminal neutralor basic amino acid (Sanderink et al., 1988), which thengenerates substrate for the amino acid transport systems.Abundance of APN mRNA was greater than all trans-porter genes examined. Maintaining high expression lev-els of APN mRNA throughout the small intestine wouldprovide a constant supply of substrates for the aminoacid transporters.
The BoAT is a Na+-dependent neutral amino acid trans-porter expressed on the apical membrane. This trans-porter was recently cloned in mammals (Broer et al., 2004),and in this study, a search of the chicken genome usinga mammalian consensus sequence revealed a similarityto a predicted sequence given the gene name “X trans-porter 2” (GenBank accession number: XM_419056).Quantities of BoAT mRNA were of a similar magnitude tothe quantities of mRNA observed for EAAT3 and PepT1.Quantities of EAAT3 mRNA increased with age and weregreatest in the ileum of the small intestine. With the rapidrate of intestinal growth as a proportion of total bodymass (Sklan, 2001) and the use of glutamate as an oxida-tive fuel source in the intestine (Wu, 1998; Nissim, 1999),increasing amounts of energy are needed to meet theneeds of the rapidly growing chick. Thus, it is not surpris-ing that mRNA expression of the glutamate transporterEAAT3 increased more than 3-fold from E20 to D14 inour study. Rome et al. (2002) found that levels of EAAT3mRNA increased from rat postnatal d 4 to 21 all alongthe small intestine. The reported cellular distribution ofEAAT3 also supports its role in providing energy to intes-tinal cells and stimulating cellular proliferation, with pro-tein expression localized to the crypts and lower villi anddecreased abundance toward the villus tip (Rome et al.,2002; Iwanaga et al., 2005). Both groups also reported anincreased gradient of expression from proximal to distalintestine, similar to our findings, suggesting increasedcapacity for glutamate absorption in the distal small intes-tine. For 3 of the amino acid transporters, bo,+AT, EAAT3,and BoAT, there was an interaction of age × segment withileal mRNA increasing most dramatically with age incomparison with the duodenum and jejunum, suggestingthat the ileum is an important site for free amino acidassimilation in the growing chick.
Expression of the amino acid transporters on the baso-lateral membrane differed from the amino acid transport-ers on the brush border membrane. CAT1, CAT2, y+LAT1,and LAT1 are basolaterally expressed in mammalian epi-thelial cells (Kizhatil and Albritton, 2003; Dave et al., 2004;Verrey et al., 2004), and in this study mRNA quantitieswere highest at E18 and decreased with age, suggestingan importance for these transporters in the chick embryo.While the chick relies on yolk for nourishment duringembryological development, nutrients are obtained in theintestine through the basolateral surface from the blood-stream until exogenous feeding at hatch. In contrast,
Figure 8. The number of GAPDH mRNA molecules per nanogramof total RNA was determined by real-time PCR. Quantities representthe means of 4 male line A and line B birds (n = 8) ± SEM at embryod 18 (E18) and embryo d 20 (E20), day of hatch (DOH; after hatch butbefore feeding), and d 1 (D1), d 3 (D3), d 7 (D7), and d 14 (D14) afterhatch. The statistical model did not include the E18 time point. Therewas a main effect of intestinal segment (P = 0.002) and a linear effect(P = 0.0001) with age.
mRNA quantities of y+LAT2 were lowest at E18 and in-creased with age, suggesting an important role in theposthatch chick. The Na+-dependent and Cl−-dependentcationic and neutral amino acid transporter ATBo,+ wasalso evaluated in this study; however, we were unableto detect ATBo,+ mRNA and concluded that it is mostlikely not expressed in the chicken small intestine.
Expression of monosaccharide transporters also dif-fered temporally and spatially in the chick small intestine.The mRNA for SGLT1 was expressed from 6- to 29-foldgreater than the other 3 monosaccharide transporters,indicating that SGLT1 is the major pathway for glucoseassimilation in the small intestine. Obst and Diamond(1992) observed a dramatic increase in glucose uptake 14d posthatch, and in our study, we observed an approxi-mate 9-fold increase in SGLT1 mRNA from E18 to DOH,followed by a 2-fold increase to D14, suggesting that thecapacity for glucose uptake increases with age in chick-ens. Uni et al. (1998b) observed that broiler mucosal su-crase and maltase activities were lower in the duodenumthan in the jejunum and ileum, with activities increasingto adult levels from DOH to d 2 posthatch in all segmentsof the small intestine. After d 2, sucrase and maltaseactivities declined to d 4, after which enzyme activitiesgradually rose to d 11 in the jejunum. Activities plateauedafter d 4 in the duodenum and ileum. We observed thatSGLT1 mRNA was greater in the jejunum and ileum ascompared with the duodenum, matching the gradient ofdisaccharidase activity in broiler small intestine, but wealso observed a continual increase in mRNA expressionof SGLT1 from DOH to d 14 posthatch. It may be thatdigestion at the intestinal level is the limiting factor toassimilation of glucose, and not expression of the trans-porter per se.
For GLUT2, GLUT5, and SGLT1, there was an interac-tion of age × intestinal segment, with mRNA levels in-
NUTRIENT TRANSPORTER MESSENGER RIBONUCLEIC ACID 1751
creasing most dramatically with age in the jejunum,suggesting that the jejunum is the primary site of sugarassimilation in the chicken intestine. Garriga et al. (2002)found that apical Na+-dependent D-glucose transport wasreduced in the ileum compared with the duodenum andjejunum, also paralleling protein expression of SGLT1.This is in agreement with our results, in which we ob-served greater mRNA levels of SGLT1 in the jejunum andduodenum. In our study, SGLT5 mRNA was greatest inthe ileum, in contrast to the highest expression in thejejunum observed for the other sugar transporters. It ispossible that SGLT5 may have a higher affinity for sub-strate, and thus serves to transport glucose at the distalintestine, whereas SGLT1 transports the majority of di-etary glucose in the proximal intestine. In addition,whereas expression of SGLT1, GLUT2, and GLUT5mRNA increased linearly from E20 to D14, SGLT5 mRNAchanged quadratically, with the lowest expression at D1and a subsequent increase to D14. To date, SGLT1 is theonly intestinal transporter reported in chickens that isknown to be responsible for the uptake of glucose (Wrightand Turk, 2004). That mRNA for SGLT5, a transporternot yet reported to be present in the intestine, was presentand exhibited a regional pattern of expression differentfrom SGLT1 suggests a unique role for this transporterin the uptake of glucose. Zhao et al. (2005) reported thatbovine SGLT5 mRNA was found predominantly in bo-vine kidney and was undetectable in bovine mammarygland, liver, lung, and small intestine.
Quantities of GLUT5 mRNA increased with age. Thediet offered to chicks lacked fructose; therefore, it is sur-prising that GLUT5 mRNA was up-regulated with agedespite the lack of luminal substrate. In rabbits, fructoseuptake increases during the last week of gestation (Phil-lips et al., 1990), and after birth, fructose transport de-creases and then increases again after weaning with theintroduction of fructose-containing diets, demonstratingsubstrate-dependent induction (Buddington and Dia-mond, 1990). Quantities of GLUT2 mRNA increased withage but represented the lowest quantities compared withthe other sugar transporters.
Expression of nutrient transporters and aminopepti-dase showed different developmental patterns. In gen-eral, brush border membrane transporter mRNAincreased with age, whereas basolateral membrane trans-porter mRNA decreased with age. Transporter expressionchanged dramatically between E18 and DOH. The expres-sion of nutrient transporters and digestive enzymes isinduced before hatch to prepare the chick for exogenousfeeding (Sklan, 2001). We observed an approximate 3-to 5-fold increase in mRNA for APN (56,000 to 147,500molecules), y+LAT2 (3,000 to 8,500 molecules), bo,+AT(43,000 to 106,300), EAAT3 (1,600 to 4,300 molecules),rBAT (7,200 to 36,200 molecules), and PepT1 (750 to 3,600molecules) and a 7- to 9-fold increase in mRNA for GLUT2(70 to 490 molecules), BoAT (500 to 4,000 molecules), andSGLT1 (1,500 to 14,400 molecules) from E18 to DOH.Birds sampled at DOH had not yet received exogenousfeed, suggesting that the rise in mRNA levels was geneti-
cally programmed to prepare the chick for a carbohy-drate- and protein-based diet at hatch, and was notinduced by dietary substrate. Moreno et al. (1996) ob-served uptake of α-methyl-D-glucoside, a nonmetaboliz-able glucose analogue in chick small intestine, 2 d beforehatch and an increase in Vmax to 1 d posthatch, and sug-gested that genotypic programs of development influencechanges in the absorptive capabilities of the intestine be-fore hatch. Uni et al. (2003) observed a 9- to 25-fold in-crease in aminopeptidase, adenosine triphosphatase,maltase, and SGLT1 mRNA abundance from d 15 of incu-bation to d 19 in chick embryos, and a subsequent declineto hatch. Chen et al. (2005) found that PepT1 mRNAincreased 14- to 50-fold from embryo d 16 to DOH inmixed-sex Cobb chicks.
Induction of gene expression of intestinal digestive en-zymes and nutrient transporters prenatally also occurs inmammals. In a review of the regulation of sugar transport,Ferraris (2001) described the appearance of intestinalGLUT5, GLUT2, and SGLT1 mRNA in the developingrat. At early gestation, GLUT2 and SGLT1 mRNA aredetected, whereas GLUT5 is not detected in significantamounts until weaning. Phillips et al. (1990) describeda 3-fold increase in the active transport of glucose andgalactose during the final week of gestation of rabbits.Thus, it is clear that in both avian and mammalian species,mechanisms exist to prepare the developing animal fornutrient uptake posthatch or postnatally. Buddington andDiamond (1990) suggested that in the newborn rabbit,intestinal uptake rates of glucose, galactose, Pro, Leu, Lys,and Met are at levels 2 to 2.5 times higher than maximumadult values, and that levels declined until weaning. Theauthors hypothesized that this may be partially explainedby the occurrence of transport along the entire crypt-villus axis at birth. The suckling of milk induces mucosalhypertrophy and establishment of a well-defined crypt-villus gradient of expression, resulting in a dilution ofmature enterocytes with immature cells, with localizationrestricted to the mid to upper villus. In the chicken smallintestine, in contrast to mammals, cell proliferation is notrestricted to the crypts, but occurs along the entire lengthof the villus during the first few days posthatch (Uni etal., 1998a). Future studies should attempt to correlatechanges in cell proliferation and development of the mu-cosal layer with changes in nutrient transporter mRNAand protein quantities, site-specific localization, andtransport activity in the chicken.
In summary, we used the method of absolute quantifi-cation by real-time PCR to quantify mRNA abundancefor 10 amino acid transporters, a peptide transporter, 4monosaccharide transporters, a digestive enzyme, and ahousekeeping gene. Our study represents a comprehen-sive profile of the mRNA abundance of nutrient trans-porters and an aminopeptidase in the small intestine ofbroilers. Transporter mRNA levels ranged from as lowas 100 molecules per nanogram of total RNA for CAT1to as high as 100,000 molecules for bo,+AT. Of the genesexamined in this study, the mRNA levels for the digestiveenzyme APN were the highest at 200,000 molecules per

GILBERT ET AL.1752
nanogram of total RNA. We evaluated the temporal andspatial distribution of these genes in the small intestineof 2 genetically selected lines of broiler chicks. Develop-mentally, mRNA for PepT1, the brush border membrane-associated amino acid transporters, and the sugar trans-porters increased with age from E18 to D14, whereas thebasolateral amino acid transporters decreased with age.This may be associated with the consumption of feed,reducing the need for basolateral uptake of nutrients fromthe bloodstream. In terms of spatial distribution, PepT1was expressed at the greatest levels in the duodenum, thesugar transporters were expressed at the greatest levelsin the jejunum, and the amino acid transporters wereexpressed at the greatest levels in the ileum. This suggestsdifferences in absorptive capacity along the length of thesmall intestine. Future studies will involve manipulationof the diet to exploit differences in transporter gene ex-pression to better meet the nutritional requirements ofthe growing chick.
REFERENCES
Barfull, A., C. Garriga, M. Mitfans, and J. Planas. 2002. Ontoge-netic expression and regulation of Na+-D-glucose cotrans-porter in jejunum of domestic chicken. Am. J. Physiol.282:G559–G564.
Broer, A., K. Klingel, S. Kowalczuk, J. Rasko, J. Cavanaugh, andS. Broer. 2004. Molecular cloning of mouse AA transportsystem Bo, a neutral AA transporter related to hartnup disor-der. J. Biol. Chem. 279:24467–24476.
Buddington, R., and J. Diamond. 1990. Ontogenetic develop-ment of monosaccharide and amino acid transporters in rab-bit intestine. Am. J. Physiol. 259:G544–G555.
Casteel, E. T., J. L. Wilson, R. J. Buhr, and J. E. Sander. 1994. Theinfluence of extended posthatch holding time and placementdensity on broiler performance. Poult. Sci. 73:1679–1684.
Chen, H., Y.-X. Pan, E. A. Wong, J. R. Bloomquist, and K. E.Webb, Jr. 2002. Molecular cloning and functional expressionof a chicken intestinal peptide transporter (cPepT1) in Xeno-pus oocytes and Chinese hamster ovary cells. J. Nutr.132:387–393.
Chen, H., Y.-X. Pan, E. A. Wong, and K. E. Webb Jr. 2005. Dietaryprotein level and stage of development affect expression of anintestinal peptide transporter (cPepT1) in chickens. J. Nutr.135:193–198.
Chen, H., E. A. Wong, and K. E. Webb, Jr. 1999. Tissue distribu-tion of a peptide transporter mRNA in sheep, dairy cows,pigs, and chickens. J. Anim. Sci. 77:1277–1283.
Daniel, H. 2004. Molecular and integrative physiology of intesti-nal peptide transport. Annu. Rev. Physiol. 66:361–384.
Dave, M., N. Schulz, M. Zecevic, C. Wagner, and F. Verrey.2004. Expression of heteromeric amino acids transportersalong the murine intestine. J. Physiol. 558:597–610.
Ferraris, R. 2001. Dietary and developmental regulation of intes-tinal sugar transport. J. Biochem. (Tokyo) 360:265–276.
Fronhoffs, S., G. Totzke, S. Stier, N. Wernert, M. Rothe, T. Bru-ning, B. Koch, A. Sachinidis, H. Vetter, and Y. Ko. 2002. Amethod for the rapid construction of cRNA standard curvesin quantitative real-time reverse transcription polymerasechain reaction. Mol. Cell. Probes 16:99–110.
Gal-garber, O., S. Mabjeesh, D. Sklan, and Z. Uni. 2000. Partialsequence and expression of the gene for and activity of thesodium glucose transporter in the small intestine of fed,starved and refed chickens. J. Nutr. 130:2174–2179.
Gal-garber, O., and Z. Uni. 2000. Chicken intestinal aminopepti-dase: Partial sequence of the gene, expression and activity.Poult. Sci. 79:41–45.
Garriga, C., C. M. Vazquez, V. Ruiz-Gutierrez, and J. M. Planas.2002. Regional differences in transport, lipid composition,and fluidity of apical membranes of small intestine. Poult.Sci. 81:537–545.
Geyra, A., Z. Uni, and D. Sklan. 2001. The effect of fasting atdifferent ages on growth and tissue dynamics in the smallintestine of the young chick. Br. J. Nutr. 86:53–61.
Harms, P. H., and P. W. Waldroup. 1962. Strain difference in theprotein requirement of laying hens. Poult. Sci. 41:1985–1987.
Hediger, M. A., and D. B. Rhoads. 1994. Molecular physiologyof sodium-glucose cotransporters. Physiol. Rev. 74:993–1026.
Iwanaga, T., M. Goto, and M. Watanabe. 2005. Cellular distribu-tion of glutamate transporters in the gastrointestinal tract ofmice. An immunohistochemical and in situ hybridizationapproach. Biomed. Res. 26:271–278.
Jain, M., A. Nijhawan, A. K. Tyagi, and J. P. Khurana. 2006.Validation of housekeeping genes as internal control forstudying gene expression in rice by quantitative real-timePCR. Biochem. Biophys. Res. Commun. 345:646–651.
Kanai, Y., and M. A. Hediger. 2004. The glutamate/neutralamino acid transporter family SLC1: Molecular, physiologi-cal and pharmacological aspects. Eur. J. Physiol. 447:469–479.
Kizhatil, K., and L. Albritton. 2003. System Y+ localizes to differ-ent membrane subdomains in the basolateral plasma mem-brane of epithelial cells. Am. J. Physiol. 284:C1784–C1794.
Leibach, F. H., and V. Ganapathy. 1996. Peptide transporters inthe intestine and kidney. Annu. Rev. Nutr. 16:99–119.
Lilja, C. 1983. A comparative study of postnatal growth andorgan development in some species of birds. Growth47:317–339.
Matthews, J. C., E. A. Wong, P. K. Bender, J. R. Bloomquist, andK. E. Webb, Jr. 1996. Demonstration and characterization ofdipeptide transport system activity in sheep omasal epithe-lium by expression of mRNA in Xenopus laevis oocytes. J.Anim. Sci. 74:1720–1727.
Moreno, M., M. Otero, J. A. Tur, J. M. Planas, and S. Esteban.1996. Kinetic constants of α-methyl-D-glucoside transport inthe chick small intestine during perinatal development.Mech. Ageing Dev. 92:11–20.
NRC (National Research Council). 1975. The Effect of GeneticVariance on Nutritional Requirements of Animals. Natl.Acad. Press, Washington, DC.
Nesheim, M. C., and F. B. Hutt. 1962. Genetic differences amongwhite leghorn chicks in requirement of arginine. Science37:691–692.
Nissim, I. 1999. Newer aspects of glutamine/glutamate metabo-lism: The role of acute pH changes. Am. J. Physiol.277:F493–F497.
Noy, Y., and D. Sklan. 1999. Energy utilization in newly hatchedchicks. Poult. Sci. 78:1750–1756.
Obst, B. S., and J. M. Diamond. 1992. Ontogenesis of intestinalnutrient transport in domestic chickens (Gallus gallus) andits relation to growth. Auk 109:451–464.
Palacin, M., and Y. Kanai. 2004. The ancillary proteins of HATs:SLC3 family of amino acid transporters. Eur. J. Physiol.447:490–494.
Pan, Y.-X., E. A. Wong, J. R. Bloomquist, and K. E. Webb, Jr.1997. Poly(A)+ RNA from sheep omasal epithelium inducesexpression of a peptide transport protein(s) in Xenopus laevisoocytes. J. Anim. Sci. 75:3323–3330.
Phillips, J., J. Diamond, and E. Fonkalsrud. 1990. Fetal rabbitintestinal absorption: Implications for transamniotic feeding.J. Pediatr. Surg. 25:909–913.
Rome, S., L. Barbot, E. Windsor, N. Kapel, V. Tricottet, J.-F.Huneau, M. Reynes, J.-G. Gobert, and D. Tome. 2002. Theregionalization of PepT1, NBAT, and EAAC1 transportersin the small intestine of rats are unchanged from birth toadulthood. J. Nutr. 132:1009–1011.
Sanderink, G., Y. Artur, and G. Siest. 1988. Human aminopepti-dases: A review of the literature. J. Clin. Chem. Clin. Biochem.26:795–807.
NUTRIENT TRANSPORTER MESSENGER RIBONUCLEIC ACID 1753
Sklan, D. 2001. Development of the digestive tract of poultry.World’s Poult. Sci. J. 67:747–753.
Sklan, D., A. Geyra, E. Tako, O. Gal-Gerber, and Z. Uni. 2003.Ontogeny of brush border carbohydrate digestion and up-take in the chick. Br. J. Nutr. 89:747–753.
Sulistiyanto, B., Y. Akiba, and K. Sato. 1999. Energy utilizationof carbohydrate, fat and protein sources in newly hatchedbroiler chicks. Br. Poult. Sci. 40:653–659.
Thorens, B. 1996. Glucose transporters in the regulation of intes-tinal, renal and liver glucose fluxes. Am. J. Physiol.270:G541–G553.
Uldry, M., and B. Thorens. 2004. The SLC2 family of facilitatedhexose and polyol transporters. Eur. J. Physiol. 447:480–489.
Uni, Z., S. Ganot, and D. Sklan. 1998b. Posthatch developmentof mucosal function in the broiler small intestine. Poult. Sci.77:75–82.
Uni, Z., Y. Noy, and D. Sklan. 1995. Posthatch changes in mor-phology and function of the small intestines in heavy- andlight-strain chicks. Poult. Sci. 74:1622–1629.
Uni, Z., R. Platin, and D. Sklan. 1998a. Cell proliferation inchicken intestinal epithelium occurs both in the crypt andalong the villus. J. Comp. Physiol. B 168:241–247.
Uni, Z., E. Tako, O. Gal-Garber, and D. Sklan. 2003. Morphologi-cal, molecular, and functional changes in the chicken smallintestine of the late-term embryo. Poult. Sci. 82:1747–1754.
Verrey, F., E. Closs, C. Wagner, M. Palacin, H. Endou, and Y.Kanai. 2004. CATs and HATs: The SLC7 family of aminoacid transporters. Eur. J. Physiol. 447:532–542.
Wright, E. M. 1993. The intestinal Na+/glucose cotransporter.Annu. Rev. Physiol. 55:575–589.
Wright, E. M., and E. Turk. 2004. The sodium/glucose cotrans-porter family SLC5. Eur. J. Physiol. 447:510–518.
Wu, G. 1998. Intestinal mucosal amino acid catabolism. J. Nutr.128:1249–1252.
Zhao, F.-Q., Y.-C. Zheng, E. H. Wall, and T. B. McFadden. 2005.Cloning and expression of bovine sodium/glucose cotrans-porters. J. Dairy Sci. 88:182–194.