Developmental changes in IGF-I and MyoG gene expression ... · gene expression and their...
12
©FUNPEC-RP www.funpecrp.com.br Genetics and Molecular Research 13 (2): 2772-2783 (2014) Developmental changes in IGF-I and MyoG gene expression and their association with meat traits in sheep W. Sun 1,2 , R. Su 1 , D. Li 1 , H.H. Musa 3 , Y. Kong 1 , J.T. Ding 1 , Y.H. Ma 2 , L. Chen 4 , Y.F. Zhang 4 and W.Z. Wu 4 1 Animal Science and Technology College, Yangzhou University, Yangzhou, China 2 Institute of Animal Science, Chinese Academy of Agricultural Sciences, Beijing, China 3 Faculty of Medical Laboratory Sciences, University of Khartoum, Khartoum, Sudan 4 Animal Science & Veterinary Medicine Bureau of Suzhou City, Suzhou, China Corresponding author: W. Sun E-mail: [email protected] Genet. Mol. Res. 13 (2): 2772-2783 (2014) Received February 6, 2013 Accepted June 20, 2013 Published April 14, 2014 DOI http://dx.doi.org/10.4238/2014.April.14.6 ABSTRACT. In the present study, real time-polymerase chain reaction was applied to analyze the expression of IGF-I and MyoG genes in Hu sheep longissimus dorsi at different growth stages and their association with meat traits. Expression of the IGF-I gene in Hu sheep differed significantly between males and females at the two day-old (0.01 < P < 0.05), one-month old (0.01 < P < 0.05), and three month-old (P < 0.01) stages. IGF-I gene expression in male longissimus muscles was higher than that of females at all growth stages, except for the three month-old stage. There was no significant difference (P > 0.05) between males and females at any growth stage in expression of the MyoG gene. MyoG gene expression in male longissimus muscles tended to be higher than that of females at all growth stages, except for the six month-
Transcript of Developmental changes in IGF-I and MyoG gene expression ... · gene expression and their...
©FUNPEC-RP www.funpecrp.com.brGenetics and Molecular Research 13 (2): 2772-2783 (2014)
Developmental changes in IGF-I and MyoG gene expression and their association with meat traits in sheep
W. Sun1,2, R. Su1, D. Li1, H.H. Musa3, Y. Kong1, J.T. Ding1, Y.H. Ma2,L. Chen4, Y.F. Zhang4 and W.Z. Wu4
1Animal Science and Technology College, Yangzhou University, Yangzhou, China2Institute of Animal Science, Chinese Academy of Agricultural Sciences,Beijing, China3Faculty of Medical Laboratory Sciences, University of Khartoum,Khartoum, Sudan4Animal Science & Veterinary Medicine Bureau of Suzhou City, Suzhou, China
Corresponding author: W. SunE-mail: [email protected]
Genet. Mol. Res. 13 (2): 2772-2783 (2014)Received February 6, 2013Accepted June 20, 2013Published April 14, 2014DOI http://dx.doi.org/10.4238/2014.April.14.6
ABSTRACT. In the present study, real time-polymerase chain reaction was applied to analyze the expression of IGF-I and MyoG genes in Hu sheep longissimus dorsi at different growth stages and their association with meat traits. Expression of the IGF-I gene in Hu sheep differed significantly between males and females at the two day-old (0.01 < P < 0.05), one-month old (0.01 < P < 0.05), and three month-old (P < 0.01) stages. IGF-I gene expression in male longissimus muscles was higher than that of females at all growth stages, except for the three month-old stage. There was no significant difference (P > 0.05) between males and females at any growth stage in expression of the MyoG gene. MyoG gene expression in male longissimus muscles tended to be higher than that of females at all growth stages, except for the six month-

2773
©FUNPEC-RP www.funpecrp.com.brGenetics and Molecular Research 13 (2): 2772-2783 (2014)
Association of IGF-I and MyoG genes with sheep meat traits
old stage. IGF-I gene expression was significantly and positively correlated with live weight (P < 0.01) and carcass weight (0.01< P < 0.05), and was non-significantly positively correlated with net meat weight (P > 0.05). In contrast, MyoG gene expression was non-significantly and positively correlated with live weight, carcass, and net meat weight (P > 0.05). Carcass traits showed highly significant positive correlations (P < 0.01). Furthermore, expressions of IGF-I and MyoG genes showed highly significant positive correlations (P < 0.01). We conclude that the expressions of IGF-I and MyoG genes are significantly and positively correlated with early muscle traits of Hu sheep.
Key words: Hu sheep; IGF-I; MyoG; Gene expression; Carcass trait
INTRODUCTION
Because the profitability of sheep production for meat depends largely on lamb weight, selection objectives should concentrate on these traits (Tosh and Kemp, 1994). Quantitative traits are often controlled by multiple genes. Localization of quantitative trait loci can be accomplished by linkage disequilibrium analysis or by adopting a candidate gene approach. Candidate genes are those with known biological functions related to the development or physiology of an important trait (Rothschild et al., 1997). The gene encoding insulin-like growth factor 1 (IGF-1) is seen as a promising candidate gene for marker-assisted selection of growth traits (Zhang et al., 2008). IGF-1 is a mediator of many biological effects; for example, it increases the absorption of glucose, stimulates myogenesis, inhibits apoptosis, participates in the activation of cell cycle genes, increases the synthesis of lipids, stimulates the production of progesterone in granular cells, and intervenes in the synthesis of DNA, protein, RNA, and in cell proliferation (Reyna et al., 2010). In humans, pigs, goats, rats, and chickens, the IGF1 nucleotide sequence is approximately 70-90 kb in length (Shimatsu and Rotwein, 1987; Kajimoto and Rotwein, 1991; Rose, 2002). The exon number of this gene differs among species; goats, pigs, and sheep have 1-6 exons (Mikawa et al., 1995), and humans and rats have 1-55 exons (Rot-wein et al., 1986)
The skeletal muscle-specific gene, myogenin (Myog), is a key developmental regulator of skeletal muscle formation, and is one of the best-studied tissue-specific genes. Myog encodes a transcription factor of the basic-helix loop-helix (bHLH) protein family (Meadows et al., 2011). Expression of the Myog gene is restricted to skeletal muscle cells, where the transcriptional activator turns on a gene expression program that permits the transition from proliferating myoblasts to differentiating myotubes (Cao et al., 2010). The strict temporal and spatial regulation on Myog expression in the embryo makes it an ideal gene with which to study the developmental regulation of tissue-specific expression (Faralli and Dilworth, 2012).
Hu sheep from China is one of the few high-fecundity sheep breeds in the world. It is characterized by early sexual maturity, high fecundity, low lean meat percentage, and low growth rate. Therefore, it is considered as one of the protected sheep breeds in China (Zhang, 2003). Several studies related to tissue expression profiles in domestic sheep

2774
©FUNPEC-RP www.funpecrp.com.brGenetics and Molecular Research 13 (2): 2772-2783 (2014)
W. Sun et al.
have been conducted recently, with most focusing on the expression of intramuscular fat content. In the present study, we investigated the effect of sex and different growth stages (two day-old, one month-old, two month-old, three month-old, four month-old, and six month-old) on the expression of IGF-I and MyoG genes in longissimus dorsi tissues of Hu sheep.
MATERIAL AND METHODS
Experimental animals
The 36 Hu sheep used in this study were reared under the same conditions, and their diets contained adequate minerals and vitamins. Animals were slaughtered at six different growth stages (2 days, 1, 2, 3, 4, and 6 months), including six animals per stage with equal numbers of males and females. Samples were collected from longissimus dorsi muscle tissues, and all tissue samples were immediately frozen in liquid nitrogen after collection and stored at -80°C until RNA isolation. Live weight, carcass weight, and net meat weight were measured from all animals.
Real-time polymerase chain reaction (RT-PCR)
Total RNA was extracted from longissimus dorsi muscle tissues according to Trizol Regent Kit instructions (Takara Biotechnology Dalian, Co. Ltd., China). The con-centration of RNA was measured using a Nano Drop ND-1000 Spectrophotometer (Nano Drop Technologies, Wilmington, DE, USA) with a purity (A260/A280) of >1.8, and total RNA was detected by 1.2% agarose gel electrophoresis (Figure 1). Two hundred fifty nanograms total RNA from each sample were transcribed into cDNA using the reverse transcription kit according to manufacturer instructions. Real-time PCR was performed on the FQ-PCR ABI 7900 system for IGF-I, MyoG, and 18S genes, according to standard protocols with the primers indicated in Table 1. The 18S ribosomal RNA gene (eukaryon) was used as a reference gene to analyze the expression of IGF-I and MyoG genes. An-nealing temperatures ranged from 53°-63°C, and primer concentrations were optimized according to the SYBR Green I kit. The optimal reaction used was 10 mL, containing 0.2 mL each primer, 0.2 mL ROX Reference Dye, 3.4 mL H2O, 5 mL SYBR Green Real Time PCR Master Mix, and 1 mL cDNA template. The PCR conditions were 40 cycles of 15 s at 95°C, 5 s at 95°C, and 30 s at 60°C. For the negative control, 1 mL sterile water (instead of template) was used, and three parallel experiments were run for every sample. The fluorescent signal was analyzed with computer software, and signals were transformed into cycle threshold (Ct) values for IGF-I and MyoG genes.
Statistical analysis
SPSS 16.0 was used to calculate Ct values and standard errors among replicated sam-ples. Difference in relative gene expression levels were analyzed using the 2-△△Ct method (Liu, 2007): Cttarget gene - Ctreference gene. For comparisons of Hu sheep of the same age but different gen-der, the DDCt was calculated as: DCtmale - DCtfemale. For comparisons of Hu sheep of the same

2775
©FUNPEC-RP www.funpecrp.com.brGenetics and Molecular Research 13 (2): 2772-2783 (2014)
Association of IGF-I and MyoG genes with sheep meat traits
sex but different ages, the DDCt was calculated as: DCtall other stages - DCt2 day-old stage. The 2-△△Ct val-ue represented differential expression of the target gene between the experimental group and control group. Two-factor analysis of variance (ANOVA) was used to measure the interaction between gender and various developmental stages after birth, and no significant interactions were observed either in MyoG (F = 1.58, P = 0.102) or IGF-I (F = 1.22, P = 0.306). We next focused on the comparison between genders at the same growth stage and different growth stages within the same gender, respectively. The goal of these analyses was to explore the ef-fect of gender and growth stage on expressions of the MyoG and IGF-I genes. Data of sheep of the same age but different genders were compared with the Student’s t-test, whereas data of individuals within the same sex but of different ages were compared by one-way ANOVA. The mRNA transcriptional quantity is represented as means ± standard error. Furthermore, the DCt histogram was used to verify whether DCt was negatively related with transcriptional quantity.
Figure 1. Agarose gel electrophoresis of total RNA.
Gene Reference sequence Primers (forward primer SF, downstream primer SR) Products (bp)
IGF-I M30653 SF: TCCAGTTCGTGTGCGGAGA 126 SR: TCCTCAGATCACAGCTCCGGMyoG AF433651 SF: AATGAAGCCTTCGAGGCCC 101 SR: CGCTCTATGTACTGGATGGCG18S (eukaryon) AY753190 SF: CGGCTACCACATCCAAGGAA 187 SR: GCTGGAATTACCGCGGCT
Table 1. Primer sequence of IGF-I, MyoG, and 18S genes for RT-PCR.
RESULTS
Specificity of the amplified fragment
The dissociation curve of IGF-I, MyoG, and 18s PCR products showed a sharp single

2776
©FUNPEC-RP www.funpecrp.com.brGenetics and Molecular Research 13 (2): 2772-2783 (2014)
W. Sun et al.
peak (Figure 2). The potential for producing primer dimers and non-special products was avoided, since primers were highly specific and the PCR reaction was optimized. The solution temperatures of IGF-I, MyoG, and 18S genes were 86.7°, 87.2°, and 85.0°C, respectively, and no amplification product was generated in the negative control. The efficiencies of IGF-I, MyoG, and 18S gene amplification were 99.7, 99.8, and 99.8%, respectively (Figure 2).
Figure 2. Amplification plot and dissociation curve of IGF-I, MyoG, and 18S.
IGF-I gene expression
The expression of the IGF-I gene in Hu sheep showed a significant or extremely sig-nificant difference between males and females at the two day-old (0.01< P < 0.05), one month-

2777
©FUNPEC-RP www.funpecrp.com.brGenetics and Molecular Research 13 (2): 2772-2783 (2014)
Association of IGF-I and MyoG genes with sheep meat traits
old (0.01 < P < 0.05), and three month-old (P < 0.01) stages (Table 2). The results of multiple comparisons of different age groups within a sex are shown in Table 3. In females, IGF-I expression differed significantly between the six month-old stage and the four, three, two, one month-old, and two day-old stages (P < 0.01). Similarly, expression in four months old females differed significantly with those of three months old and two days old females (0.01 < P < 0.05). In males, IGF-I expression differed significantly between the six month-old stage and the four, three, two month-old, and two day-old stages (P < 0.01). In addition, one month old males showed significant differences when compared with three months old and two days old males (0.01 < P < 0.05). These results suggested that age and sex had significant effects on the expression of the IGF-I gene in sheep muscle tissue.
Gene Gender Two days old One month old Two months old Three months old Four months old Six months old
IGF-1 Female 1m 1m 1m 1M 1m 1m
Male 1.264 ± 0.112n 2.095 ± 0.501n 1.204 ± 0.123m 0.730 ± 0.048N 1.180 ± 0.242m 1.350 ± 0.310m
Table 2. Variance analysis of IGF-I expression between males and females in the same developmental stage (2-△△Ct method).
Serial of M (m) and N(n) shows the results of multiple comparison of the same stage of different sex. Means with the different lower-case within the same column shows that there are significant differences between different rows. Means with the different capital superscripts within the same column shows there are extremely significant differences between different rows.
Gene Gender Two days old One month old Two months old Three months old Four months old Six months old
IGF-1 Female 1Bc 1.383 ± 0.168Bbc 1.669 ± 0.143Bbc 1.983 ± 0.368Bb 2.060 ± 0.295Bb 3.445 ± 0.598Aa
Male 1Bc 2.264 ± 0.541ABab 1.599 ± 0.163Bbc 1.033 ± 0.069Bc 1.787 ± 0.366Bbc 3.403 ± 0.780Aa
Table 3. Variance analysis of IGF-I expression among different developmental stages in the same sex (2-△△Ct method).
Serial of A(a), B(b) and C(c) shows the results of multiple comparison of same sex at different stages; Means with the different lower-case within the same row shows there are significant difference between different columns. Means with the different capital superscripts within the same row shows there are extremely significant differences between different columns.
IGF-I gene expression in male (rams) longissimus muscles tended to be higher than that in females (ewes) at all growth stages except for the three month-old stage (Figure 3). IGF-I gene expression in female longissimus dorsi gradually increased with the development of their growth, whereas changes in IGF-I gene expression in male longissimus dorsi were unstable (Figure 4).
MyoG gene expression
There was no significant difference (P > 0.05) in the expression of the MyoG gene between males and females at any growth stage, although males showed higher MyoG gene expression levels compared to females (Table 4). Multiple comparison analysis of the same sex at different growth stages showed significant differences in the expression of MyoG be-tween females at the six month-old stage with the four, two month-old, and two day-old stages (0.01 < P < 0.05), the three month-old stage with the one month-old stage (0.01< P < 0.05),

2778
©FUNPEC-RP www.funpecrp.com.brGenetics and Molecular Research 13 (2): 2772-2783 (2014)
W. Sun et al.
the four month-old stage with the three month-old and one month-old stages (0.01 < P <0.05), and the two month-old stage with the one month-old and three month-old stages (0.01 < P < 0.05). Similarly, extremely significant differences were found when six months old females were compared to two and four months old females, when four months old females were com-pared to three months old females, and when three months old females were compared to two days old females (P < 0.01). The expression of MyoG in males showed extremely significant differences when comparing six months old individuals to two days old individuals (P < 0.01) (Table 5).
Figure 3. IGF-I gene expression in males and females of Hu sheep at the same age (2-△△Ct method, ewe for the control group).
Figure 4. Changes of IGF-I expression among Hu sheep different developmental stages in the same gender (2-△△Ct method, 2-day for the control group, A = ewe, B = ram).
2779
©FUNPEC-RP www.funpecrp.com.brGenetics and Molecular Research 13 (2): 2772-2783 (2014)
Association of IGF-I and MyoG genes with sheep meat traits
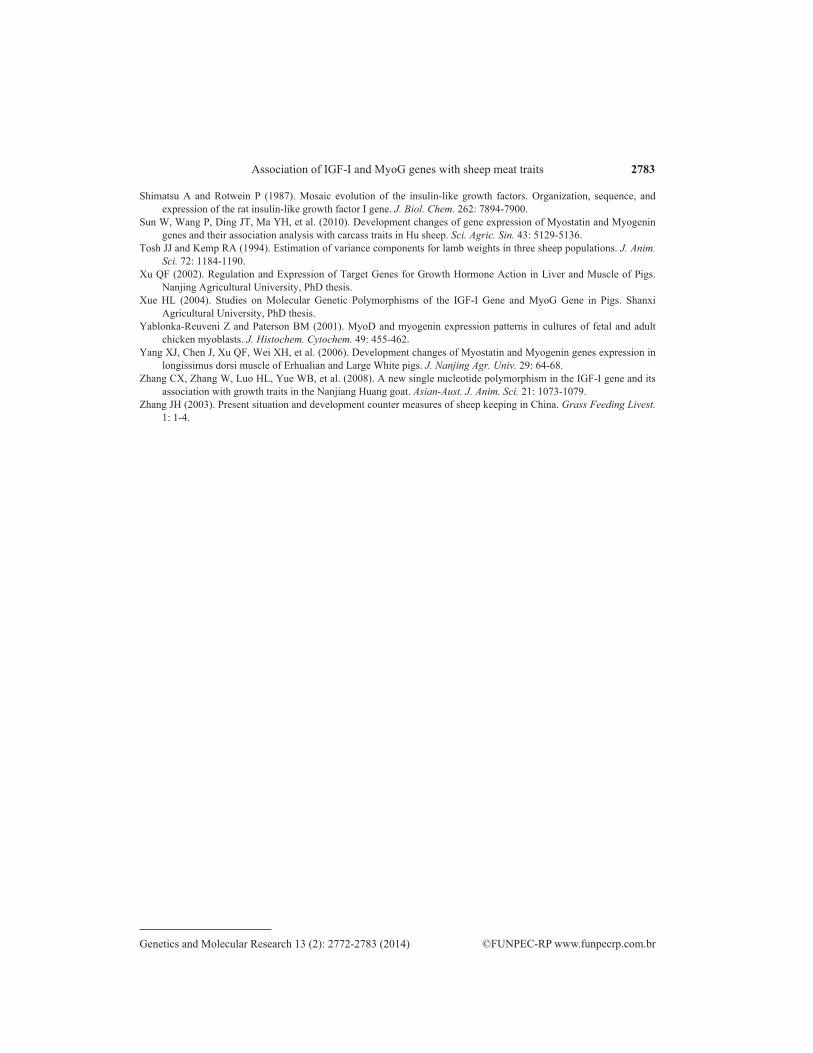
MyoG gene expression levels in male longissimus muscles tended to be higher than those of ewes at all growth stages, except for the six month-old stage (Figure 5). However, the changes in MyoG gene expression in female and male longissimus dorsi were unstable (Figure 6).
Gene Gender Two days old One month old Two months old Three months old Four months old Six months old
MyoG Female 1m 1m 1m 1m 1m 1m
Male 1.437 ± 0.338m 1.096 ± 0.277m 1.235 ± 0.238m 1.075 ± 0.201m 1.536 ± 0.257m 1.013 ± 0.138m
Table 4. Variance analysis of MyoG expression between males and females in the same developmental stage (2-△△Ct method).
Serial of M(m), N(n) shows the results of multiple comparison of same stage of different sex. Means with the different lower-case within the same column shows that there are significant differences between different rows. Means with the different capital superscripts within the same column shows that there are extreme significant differences between different rows.
Gene Gender Two days old One month old Two months old Three months old Four months old Six months old
MyoG Female 1Bc 1.731 ± 0.124ABab 1.381 ± 0.084ABbc 2.053 ± 0.505Aab 0.984 ± 0.129Bc 2.276 ± 0.226Aa
Male 1Bb 1.809 ± 0.457ABab 1.634 ± 0.315ABab 1.380 ± 0.258ABab 1.379 ± 0.231ABab 2.161 ± 0.295Aa
Table 5. Variance analysis of MyoG expression among different developmental stages in the same sex (2-△△Ct method).
Serial of A(a), B(b) and C(c) shows the results of multiple comparison of same sex at different stages; Means with the different lower-case within the same row shows that there are significant difference between different columns. Means with the different capital superscripts within the same row shows that there are extremely significant differences between different columns.
Association of IGF-I and MyoG gene expressions with carcass traits
IGF-I gene expression was significantly and positively correlated with live weight (P < 0.01) and carcass weight (0.01 < P < 0.05), and was non-significantly but positively correlated with net meat weight (P > 0.05). In contrast, MyoG gene expression was non-
Figure 5. MyoG gene expression in males and females of Hu sheep in the same growth stage (2-△△Ct method, ewe for the control group).

2780
©FUNPEC-RP www.funpecrp.com.brGenetics and Molecular Research 13 (2): 2772-2783 (2014)
W. Sun et al.
significantly and positively correlated with live weight, carcass weight, and net meat weight (P >0.05). An extremely significant positive correlation was found among the carcass traits (P < 0.01). Furthermore, there was an extremely significant positive correlation between the expressions of IGF-I and MyoG genes (P < 0.01) (Table 6).
DISCUSSION
IGF-1 is an important regulatory factor for body growth, development, and metabo-lism. IGF-I mRNA expression in longissimus dorsi of pigs showed no significant difference (P > 0.05) between males and females (Xu, 2002). In the present study, with the exception of the three month-old stage, IGF-I was more highly expressed in male longissimus dorsi compared to females at different growth stages after birth. This may indicate that IGF-I has a greater effect on early sheep muscle growth in males than it does in females. Gerrard et al. (1998) demon-
Figure 6. Changes of MyoG expression among Hu sheep different developmental stages in the same gender (2-△△Ct method, 2 days for the control group, A = ewe, B = ram).
Index IGF-I MyoG Live weight Carcass weight Net meat weight
IGF-I 1 0.464** 0.450** 0.409* 0.247MyoG 0.464** 1 0.249 0.246 0.083Live weight 0.450** 0.249 1 0.993** 0.824**Carcass weight 0.409* 0.246 0.993** 1 0.848**Net meat weight 0.247 0.083 0.824** 0.848** 1
Table 6. Association of IGF-I and MyoG genes expression with carcass traits.
*There is significant relationship between two different index (0.01 < P < 0.05). **There is extreme significant relationship between two different index (P < 0.01).

2781
©FUNPEC-RP www.funpecrp.com.brGenetics and Molecular Research 13 (2): 2772-2783 (2014)
Association of IGF-I and MyoG genes with sheep meat traits
strated that IGF-I mRNA expression increased gradually from the 44th day of pregnancy to the late pregnancy stage in pig fetal semitendinosus muscles, further increased after birth, reaching a peak at 21 days old, and then declined in adulthood. Gotz et al. (2001) showed that the ex-pression levels of IGF-I were similar in pig skeletal muscle and in blood from 11 to 22 weeks old. Xu (2002) showed that the expression of IGF-I did not change significantly from birth to one month old in the longissimus dorsi of both Erhualian and Yorkshire pigs, and then signifi-cantly increased from the one month old to the three month-old stage, and remained at a high level. Gu et al. (2009) found that the expression of IGF-I increased gradually after birth in both Landrace and Meishan pigs. Huang and Xie (2009) found that the expression of IGF-I showed large fluctuations in Xinjiang fine-wool sheep; it slightly declined from the two day-old to the one month-old stage, reached a peak at two months-old, and then dropped to the lowest level before increasing again over the subsequent growth stages. In the present study, the expression of the IGF-I gene in ewes’ longissimus dorsi gradually increased with growth development and reached its peak at six months old, confirming results obtained by Gu et al. (2009). In agree-ment with Huang and Xie (2009), the expression of IGF-I in rams increased during the first two stages, dropped to the level of the two days-old stage at three months old, and then gradu-ally increased thereafter in the following stages, reaching its peak at the six months-old stage. IGF-I functions to increase amino acid utilization during protein synthesis and inhibits protein degradation, and thus, accordingly, promotes the proliferation of bone and muscle cells. Much research has been conducted recently regarding the correlation between polymorphisms of the IGF-I gene with carcass traits of poultry and pigs. Although several studies have investigated the expression of IGF-I in sheep muscle, few have evaluated the correlation between this ex-pression with different developmental stages and carcass traits. In the present study, the relative expression of the IGF-I gene showed an extremely significant positive correlation with live weight (P < 0.01) and with carcass weight (0.01< P < 0.05).
Myogenin (MyoG) is an important transcription factor that regulates skeletal muscle development, and is expressed in all skeletal muscle cells in the MyoD family. Genetic varia-tion of MyoG might be related with myogenesis, and it could ultimately lead to variations in meat quality. Yablonka-Reuveni and Paterson (2001) noted that in chicken embryo-type myoblast cultures, MyoG appeared to be terminally differentiated, while in adult-type myo-blast cultures, MyoG was expressed in early myogenic cell lineages. In the present study, the expression of MyoG in rams’ longissimus dorsi was non-significantly (P > 0.05) higher than that in ewes after birth. In contrast, extremely significant (P < 0.01) or significant (0.01 < P < 0.05) differences were observed between males and females at the same growth stage in Erhualian pigs and Hu sheep (Yang et al., 2006; Sun et al., 2010). The reason for these different results might be related to the choice of experimental methods. Yang et al. (2006) and Sun et al. (2010) both used the semi-quantitative gray scale analysis method, while we used the 2-DDCt method to analyze relative expression differences. Shan et al. (2009) inves-tigated MyoG mRNA expression in longissimus dorsi muscles of Jinhua and Landrace pigs, and found that the expression of the MyoG gene increased with age and lean meat percentage of the carcass. In contrast, Hasty et al. (1993) found that the expression of the MyoG gene decreased with age and lean meat percentage of the carcass in Landrace pigs, which were negatively correlated, but did not display breed differences. In the present study, the expres-sion of the MyoG gene was non-significantly (P > 0.05) and positively correlated with live weight, carcass, and net meat weight.

2782
©FUNPEC-RP www.funpecrp.com.brGenetics and Molecular Research 13 (2): 2772-2783 (2014)
W. Sun et al.
During the skeletal muscle growth process, IGF-I regulates the growth of skeletal muscle and stimulates myoblast terminal differentiation by inducing the expression of MyoG (Xue, 2004). In the present study, we found that the expression of IGF-I and MyoG genes were positively correlated, and the expression of these two genes in muscle affected carcass traits. This study could provide a theoretical basis for further research and provides genetic data for Hu sheep carcass trait breeding.
ACKNOWLEDGMENTS
Research supported by the projects of domesticated animals platform of the Ministry of Science and Technology of China, Jiangsu Agricultural Science, and Technology Support Program of China (#BE2012331), the Graduate Education Innovation Project of Jiangsu Province of China (#CXLX13-919), the Project Funded by the Priority Academic Program Development of Jiangsu Higher Education Institutions, the Project Jiangsu Province Engineering Research Center of China (#BM2012308), the Project of Six Peak of Talents in Jiangsu Province, and Yangzhou University Students Innovation Training Plan (#B1261).
REFERENCES
Cao Y, Yao Z, Sarkar D, Lawrence M, et al. (2010). Genome-wide MyoD binding in skeletal muscle cells: a potential for broad cellular reprogramming. Dev. Cell 18: 662-674.
Faralli H and Dilworth FJ (2012). Turning on myogenin in muscle: a paradigm for understanding mechanisms of tissue-specific gene expression. Comp. Funct. Genomics 2012: 836374.
Gerrard DE, Okamura CS, Ranalletta MA and Grant AL (1998). Developmental expression and location of IGF-I and IGF-II mRNA and protein in skeletal muscle. J. Anim. Sci. 76: 1004-1011.
Gotz W, Dittjen O, Wicke M, Biereder S, et al. (2001). Immunohistochemical detection of components of the insulin-like growth factor system during skeletal muscle growth in the pig. Anat. Histol. Embryol. 30: 49-56.
Gu YR, Zhang K, Li MZ, Li XW, et al. (2009). Developmental expression changes of insulin-like growth factors (IGFs) system genes in longissimus dorsi muscle of two pig breeds. Yi. Chuan 31: 837-843.
Hasty P, Bradley A, Morris JH, Edmondson DG, et al. (1993). Muscle deficiency and neonatal death in mice with a targeted mutation in the myogenin gene. Nature 364: 501-506.
Huang ZG and Xie Z (2009). Developmental changes of IGF-I mRNA expression level in sheep muscle. Agr. Sci. Technol. 10: 68-72.
Kajimoto Y and Rotwein P (1991). Structure of the chicken insulin-like growth factor I gene reveals conserved promoter elements. J. Biol. Chem. 266: 9724-9731.
Liu L (2007). Relative quantitative detection of HLA-G mRNA expression in patients with endometriosis by 2-ΔΔCT method. China’s Eugenic Genet. Mag. 15: 25-26.
Meadows E, Flynn JM and Klein WH (2011). Myogenin regulates exercise capacity but is dispensable for skeletal muscle regeneration in adult mdx mice. PLoS One 6: e16184.
Mikawa S, Yoshikawa G, Aoki H, Yamano Y, et al. (1995). Dynamic aspects in the expression of the goat insulin-like growth factor-I (IGF-I) gene: diversity in transcription and post-transcription. Biosci. Biotechnol. Biochem. 59: 87-92.
Reyna XF, Montoya HM, Castrellon VV, Rincon AM, et al. (2010). Polymorphisms in the IGF1 gene and their effect on growth traits in Mexican beef cattle. Genet. Mol. Res. 9: 875-883.
Rose MT (2002). The somatotropic axis of the dairy cow revisited. Anim. Sci. J. 73: 13-19.Rothschild MF, Messer LA and Vincent A (1997). Molecular approaches to improved pig fertility. J. Reprod. Fertil Suppl.
52: 227-236.Rotwein P, Pollock KM, Didier DK and Krivi GG (1986). Organization and sequence of the human insulin-like growth
factor I gene. Alternative RNA processing produces two insulin-like growth factor I precursor peptides. J. Biol. Chem. 261: 4828-4832.
Shan LL, Zhang M, Miao ZG, Wang LJ, et al. (2009). Mogenin mRNA abundance in longissimus dorsi muscle of Jinhua pig and Landrace pig. Chin. J. Vet. Sci. 29: 374-377.
2783
©FUNPEC-RP www.funpecrp.com.brGenetics and Molecular Research 13 (2): 2772-2783 (2014)
Association of IGF-I and MyoG genes with sheep meat traits
Shimatsu A and Rotwein P (1987). Mosaic evolution of the insulin-like growth factors. Organization, sequence, and expression of the rat insulin-like growth factor I gene. J. Biol. Chem. 262: 7894-7900.
Sun W, Wang P, Ding JT, Ma YH, et al. (2010). Development changes of gene expression of Myostatin and Myogenin genes and their association analysis with carcass traits in Hu sheep. Sci. Agric. Sin. 43: 5129-5136.
Tosh JJ and Kemp RA (1994). Estimation of variance components for lamb weights in three sheep populations. J. Anim. Sci. 72: 1184-1190.
Xu QF (2002). Regulation and Expression of Target Genes for Growth Hormone Action in Liver and Muscle of Pigs. Nanjing Agricultural University, PhD thesis.
Xue HL (2004). Studies on Molecular Genetic Polymorphisms of the IGF-I Gene and MyoG Gene in Pigs. Shanxi Agricultural University, PhD thesis.
Yablonka-Reuveni Z and Paterson BM (2001). MyoD and myogenin expression patterns in cultures of fetal and adult chicken myoblasts. J. Histochem. Cytochem. 49: 455-462.
Yang XJ, Chen J, Xu QF, Wei XH, et al. (2006). Development changes of Myostatin and Myogenin genes expression in longissimus dorsi muscle of Erhualian and Large White pigs. J. Nanjing Agr. Univ. 29: 64-68.
Zhang CX, Zhang W, Luo HL, Yue WB, et al. (2008). A new single nucleotide polymorphism in the IGF-I gene and its association with growth traits in the Nanjiang Huang goat. Asian-Aust. J. Anim. Sci. 21: 1073-1079.
Zhang JH (2003). Present situation and development counter measures of sheep keeping in China. Grass Feeding Livest. 1: 1-4.