
DEVELOPMENT SERVICING PLAN FOR YASS VALLEY COUNCIL WATER … · DEVELOPMENT SERVICING PLAN FOR YASS...
35
DEVELOPMENT SERVICING PLAN FOR YASS VALLEY COUNCIL WATER SUPPLY ADOPTED: 22/ 05/2013 EFFECTIVE: 23/ 05/2013 MARCH 2013 This is a development servicing plan which has been prepared in accordance with Section 64 of the Local Government Act, 1993, and Section 306 of the Water Management Act, 2000.
Transcript of DEVELOPMENT SERVICING PLAN FOR YASS VALLEY COUNCIL WATER … · DEVELOPMENT SERVICING PLAN FOR YASS...
DEVELOPMENT SERVICING PLAN
FOR
YASS VALLEY COUNCIL WATER SUPPLY
ADOPTED: 22/ 05/2013 EFFECTIVE: 23/ 05/2013
MARCH 2013
This is a development servicing plan which has been prepared in accordance with Section 64 of the Local Government Act, 1993, and Section 306 of the
Water Management Act, 2000.

DISCLAIMER Any information (numerical or otherwise), representation, statement, opinion or advice expressed or implied in this publication is made in good faith but on the basis that Yass Valley Council, its agents and employees are not liable (whether by reason of negligence, lack of care or otherwise) to any person for any damage or loss whatsoever which has occurred or may occur in relation to that person taking or not taking (as the case may be) action in respect of any information, representation, statement, or advice referred to above.

YASS VALLEY COUNCIL DEVELOPMENT SERVICING PLAN (DSP) - WATER SUPPLY
TABLE OF CONTENTS
Summary i
1. The Introduction 1
1.1 Legislation 1
1.2 Purpose of the DSP 1
1.3 Land to which the DSP Applies 1
1.4 Calculation Guidelines 1
1.5 Date From Which This DSP Comes Into Effect 1
1.6 Relationship Between The DSP and other Existing Policies or Plans 1
1.7 Assets Relevant to the DSP 2
1.7.1 Headworks 2
1.7.2 Distribution Works 2
1.7.2 Reticulation 2
2. Methodology 2
2.1 Calculation Method for Developer Charges 2
2.1.1 General Methodology 2
2.1.2 Detailed Methodology 3
2.2 Tenement and Demand Estimates 3
2.3 Works Covered by This DSP 3
2.4 Cost Estimates 3
3. Works Included and Cost Estimates 4
4. Levels of Service and Design Parameters 5
4.1 Levels of Service 5
4.2 Design Parameters 5
5. Developer Charges 6
5.1 Headworks and Distribution Works 6
5.2 Reticulation 6
5.3 Payment of Developer Charges 6
5.3.1 Timing of Payments 6
5.3.2 Method of Payment 6
5.3.3 Works-in-Kind Contributions 7
5.4 Staged Subdivision/Development 8
5.5 Reviewing and Revising of Developer Charges 8
6. References 9
APPENDIX No. 1 - State Environmental Planning Policies Applying To Yass Valley Council Water Supply 10
APPENDIX No. 2 - Yass Valley Council – Other DSP’s Relevant 11
APPENDIX No. 3 - Plans Of Service Areas 12
APPENDIX No. 4 – Calculations 13

Yass Valley Council Page i Development Servicing Plan for Water Supply
DEVELOPMENT SERVICING PLAN - WATER SUPPLY
Summary
This Development Servicing Plan (DSP) covers water supply Developer Charges (DC) for the Yass Valley Council. This relates to assets such as transfer mains and storage reservoirs.
This DSP has been prepared with consideration to Developer Charges Guidelines for Water Supply, Sewerage and Stormwater (2012) Consultation Draft. These are the latest relevant guidelines, managed by the NSW Office of Water (NOW). The water supply system for which Yass Valley Council seeks to levy DC includes “minor” headworks and distribution works. Reticulation is provided by developers as part of the subdivision/development works.
This DSP aims to:
1. Allow Council to require an equitable monetary contribution for the
provision of water supply infrastructure to meet the demands generated by development.
2. Facilitate the future provision of a water supply to the Yass Valley Council
area which meets the required levels of service with regard to flows, pressure, water quality, water quantity and the frequency of restrictions.
3. Set out the schedule and programme of proposed works to meet increasing
demands for a “town water” supply generated by development.
4. Detail the contribution rates and Yass Valley Council’s payment policies.
To enable this, a future demand estimate of water supply for the Council has been
undertaken. The demand estimate is the basis used for determining the infrastructure required to meet the need generated by future development.
DC are applicable for existing and proposed works which serve future development. Section 3 details the existing works and proposed works schedule for water supply
infrastructure to meet the expected demand. The calculated DC, based on full cost recovery, is tabulated below. Yass Valley Council - Water Developer Charges
Location Developer Charge / ET ($12/13)
Yass Existing and Other* < 500 ET, Bowning and Binalong
$12,199
Hamilton Rise $19,125 Murrumbateman $23,320
*“Other < 500 ET” cover the following service areas: - Black Range Road Industrial Precinct, - Laidlaw St, and
- Wellington Road.
Yass Valley Council Page ii Development Servicing Plan for Water Supply
DC calculations relating to this DSP will be reviewed after a period of five to six years, or when any significant changes occur in proposed works, growth projections or standards. In the period between any reviews, DC will be revised on 1 July each year on the basis of movements in the Consumer Price Index (CPI) for Canberra, in the preceding 12 months to December, excluding the impact of GST. There are a number of payment methods for DC and Works-in-Kind contributions are allowable subject to certain conditions. The developer shall be responsible for the full cost of the design and construction of water supply reticulation works within subdivisions.

Yass Valley Council Page 1 Development Servicing Plan for Water Supply
1. The Introduction
1.1 Legislation Section 64 of the Local Government Act 1993 enables a local government council to levy developer charges for water supply, sewerage and stormwater. This derives from a cross-reference in that Act to Section 306 of the Water Management Act 2000. This DSP has been prepared in accordance with the Developer Charges Guidelines for Water Supply, Sewerage and Stormwater (2012), managed by NOW, pursuant to Section 306 (3) of the Water Management Act 2000.
1.2 Purpose of the DSP The purpose of the DSP is to achieve the following objectives: 1. Allow Yass Valley Council to require an equitable monetary contribution for the
provision of water supply infrastructure to meet the demands generated by new development on headworks and distribution works.
2. Facilitate the provision of a water supply to the Yass Valley Council area which meets the required levels of service with regard to flows, pressure, water quantity and the frequency of restrictions.
3. Identify the existing relevant works and set out a schedule and programme of proposed works to meet increasing demands for a “town water” supply generated by development.
4. Detail the contribution rates and Yass Valley Council’s payment policies. The water supply system for which Yass Valley Council seeks to levy DC includes “minor” headworks and distribution works. Reticulation is provided by developers as part of the subdivision/development works.
1.3 Land to which the DSP Applies This DSP applies to all land in the Yass Valley Council area that is within the water benefit areas and is to be connected to the water supply system as a result of development. This includes connection of land with existing residences and/or non-residential buildings if water DC have not previously been paid; and may be in addition to costs for shared, special extension of system outside the general water benefit area. Maps of the water supply areas can be found in Appendix 3.
1.4 Calculation Guidelines This DSP has been prepared with consideration given to Developer Charges Guidelines for Water Supply, Sewerage and Stormwater (2012). These were the latest relevant guidelines from the NOW, at the time of DC calculation, and are based on recommendations of the Independent Pricing and Regulatory Tribunal (IPART)
1.5 Date From Which This DSP Comes Into Effect This DSP was adopted by Yass Valley Council on 22/05/2013 and came into effect on 23/05/2013. DC will be levied pursuant to this DSP, as a condition of development consent granted on or after the day this DSP came into effect.
1.6 Relationship Between The DSP and other Existing Policies or Plans A number of environmental planning instruments apply to the development of land to which this DSP relates, including State Environmental Planning Policies.
Yass Valley Council Page 2 Development Servicing Plan for Water Supply
A full listing of the State Environmental Planning Policies applying to Yass Valley Council is attached to this DSP as Appendix No. 1. Various other Yass Valley Council Development Servicing Plans are also relevant, as listed in Appendix 2. This DSP supersedes any other requirements related to water supply DC for the area covered by this DSP. This DSP takes precedence over any of Yass Valley Council’s codes or policies where there are any inconsistencies relating to water supply developer charges. (The term “Developer Contributions” may formerly have been used to refer to Developer Charges.)
1.7 Assets Relevant to the DSP
The purpose of the DSP is that new development should pay for assets from which they benefit. Headworks and distribution works are provided by Yass Valley Council and paid for through developer charges. Reticulation works are provided by the developer. Asset categories are defined as follows:
1.7.1 Headworks For the purposes of this DSP, headworks are defined as dams, water treatment plants and major pumping stations.
1.7.2 Distribution Works Distribution works are primarily defined as trunk mains and service reservoirs, and also include minor pump stations.
1.7.2 Reticulation Reticulation generally consists of all the internal distribution pipes within the subdivision or which specifically serve that subdivision. In some instances, Yass Valley Council is the developer. The developer shall be responsible for the full cost of the design and construction of water supply reticulation works within subdivisions. Plans of water supply infrastructure are in Appendix 3.
2. Methodology
2.1 Calculation Method for Developer Charges
2.1.1 General Methodology In its most simplistic description, the calculation determines the equivalent cost of one brand new set of assets to serve development as if those assets could be constructed now. Practically, however, water infrastructure consists of an on-going progression of old and new assets with complex interconnection. Water assets may be constructed many years ahead of full capacity to reflect cost effective and practical staging of works. Only distribution works have been taken into account in the DC calculation. The construction of any reticulation pipework required will be the responsibility of the developer. The methodology used was developed with consideration given to the latest guidelines, managed by NOW, Developer Charges Guidelines for Water Supply, Sewerage and Stormwater (2012) Consultation Draft. The NPV of Annual Charges

Yass Valley Council Page 3 Development Servicing Plan for Water Supply
Method was used and this is based on the following general equation, as recommended by the Independent Pricing and Regulatory Tribunal (IPART).
Developer charge = Capital charge – Reduction amount.
The capital charge is the Present Value (MEERA basis) of all expenditure on assets used to service the development. The reduction amount is the amount by which the capital charge is reduced to arrive at the developer charge. This amount reflects the capital contribution that will be paid by the occupier of a development as part of future annual bills The calculated DC is based on full cost recovery.
2.1.2 Detailed Methodology The methodology and calculation is included in Appendix 4.
2.2 Tenement and Demand Estimates Most types of development will increase the demand on the water supply system. Water supply assets may directly or indirectly benefit a development by allowing increased demand to be met. For residential subdivisions, the increased demand is directly related to the number of additional tenements created. For medium density development each dwelling unit is considered to increase demand by two thirds (2/3) of a tenement. Therefore charges may be multiplied by 0.67 in the case of town houses of less than 3 bedrooms, cluster housing, villa units, medium density, dual occupancy and 1 bedroom flats.
The increased demands generated by other types of development (including non-residential) need to be assessed in terms of additional equivalent tenements. The number of additional equivalent tenements is calculated in accordance with the Public Works Department's Water Supply Investigation Manual, administered by NOW and/or historical data for similar developments respectively. Planned development of the water supply system is based on these long-term growth projections. DC pay for the provision of system capacity to suit new development. New development may be served by a combination of existing and/or new works.
2.3 Works Covered by This DSP The existing and proposed works covered by this DSP are itemised in Section 3. All Yass Valley Council’s headworks and distribution works, subject to DC Guidelines, are shown on these tables.
2.4 Cost Estimates “Current replacement” cost estimates of the existing and proposed works are based on unit rates for construction published in the NSW Reference Rates for Valuation of Existing Water Supply, Sewerage and Stormwater Assets by NSW Department of Land and Water Conservation, managed by NOW. These cost estimates are shown in Section 3.

Yass Valley Council Page 4 Development Servicing Plan for Water Supply
3. Works Included and Cost Estimates
Both existing and proposed works which are relevant for inclusion in this DSP are itemised in Appendix 4. Cost estimates and year of construction information are included.

Yass Valley Council Page 5 Development Servicing Plan for Water Supply
4. Levels of Service and Design Parameters
4.1 Levels of Service System design and operation are based on providing the following key Potable Water Supply Levels of Service to Yass Valley Council: EQUIVALENT TENEMENT • An ET is an average annual water consumption of 250 kL/ET AVAILABILITY • Domestic average annual water consumption of 250 kL/ET • Domestic peak day consumption of 1,500 L/ET PRESSURE • Provide a minimum water pressure of 12 metres (120 kPa) at the property
boundary when delivering 0.2 L/s flow rate INTERRUPTIONS • No unplanned interruptions greater than 4 hours • No programmed interruptions greater than 12 hours • Not more than 5 interruptions per 1,000 connections per year RESPONSE TIME • Respond on site within 2 h in Yass Township and within 8h in villages QUALITY • Treated water to comply with the 2011 Australian Drinking Water Guidelines
(ADWG) 98% of the time • Not more than 4 quality complaints per 1,000 connections per year
These levels of service are targets that Yass Valley Council aims to achieve. They are not intended to form a formal customer contract.
4.2 Design Parameters Investigation and design of water supply system components is based on the Water Supply Investigation Manual (1986). This manual was prepared by NSW Public Works and is administered by NOW. Technical reports relating to the system components in the DSP are included in Section 6, References

Yass Valley Council Page 6 Development Servicing Plan for Water Supply
5. Developer Charges
5.1 Headworks and Distribution Works The calculated DC is tabulated below. This is based on full cost recovery. Yass Valley Council - Water Developer Charges
Location Developer Charge / ET ($12/13)
Yass Existing and Other* < 500 ET, Bowning and Binalong
$12,199
Hamilton Rise $19,125 Murrumbateman $23,320
*“Other < 500 ET” cover the following service areas:
- Black Range Road Industrial Precinct, - Laidlaw St, and
- Wellington Road. Details of the derivation of the calculated DC is included in Appendix 4.
5.2 Reticulation Yass Valley Council does not charge a monetary charge for the construction of reticulation pipework. Developers are responsible for the provision of these works which would generally be handed over to Yass Valley Council upon completion of the development.
5.3 Payment of Developer Charges
5.3.1 Timing of Payments Subject to clauses 5.3.2 and 5.3.3 the timing for payments of DC is as follows:
For complying development Following the issuing of a complying development
certificate and prior to the commencement of work (whether or not the certificate is issued by Council or an accredited certifier).
For other development Prior to the release of the Construction Certificate.
For subdivision Prior to the release of the Linen Plan.
5.3.2 Method of Payment Developer charges must be made in the form of monetary payments to Yass Valley Council. Development consents requiring the payment of a DC will contain a condition specifying the amount payable in monetary terms at the time the consent is issued. A note will be attached to the consent condition which will advise that the Developer Charge will be at the rate which applies at the time of payment. That is, the rate may increase, through indexation or replacement of this DSP with a new one, from the time the condition appears on the notice of development consent until the time the DC is actually paid to Council.
Yass Valley Council Page 7 Development Servicing Plan for Water Supply
The deferral of payment of contributions to the point of sale of each lot is permissible subject to application in writing to Council, and approval by the General Manager. Deferred payment of contributions will be subject to the following requirements: • The maximum time frame granted for deferment is twenty-four (24) months;
• The applicant is to provide Council with an original copy of an unconditional
Bank Guarantee in favour of Council to the total value of contributions payable, plus interest calculated for twenty-four months from the date of deferment;
• Interest will be charged in accordance with Councils Fees and Charges at the
rate applicable for outstanding rates at the time the application for deferred payment is approved;
• Should the contributions not be paid by the completion of the approved period,
Council may exercise its right under the agreement to call in the Bank Guarantee without notice; and
• Council will not permit the payment of contributions in instalments.
5.3.3 Works-in-Kind Contributions Upon written request, Council will consider an offer by the applicant to make a contribution by way of Works in Kind provided that:
• The proposed work satisfies the demands for the kind of public amenities and
facilities for which the contribution is sought; • The proposed work will not prejudice the timing or the manner of the provision
of the amenity or facility for which the contribution was required; • The value of the work is at least equal to the value of the contribution assessed
in accordance with this plan and that this value is adequately documented; • Agreement has been reached as to the standard of work to be undertaken; and • Where the difference of the value of the Work in Kind is less than the
contribution assessed in accordance with this plan, the balance shall be made by way of monetary contribution.
As part of the Council’s decision making process, a request will only be considered provided the applicant was agreeable to all of the following stipulations:
• An agreement between the applicant and Council on the cost of the works (and
value of the Work in Kind) which is to be determined by reference to satisfactory plans, breakdown of costs, review of audited statements and accounts or similar submitted by the applicant. There would be no indexing of the value of the Work in Kind or credits so granted.
• The number of credits for a particular type of contribution will be determined by
dividing the agreed value of the proposed work by the rate applying to that contribution at the time of the agreement. The credits so agreed will be progressively reduced as the development proceeds. The agreed works schedule may specify those works that may be considered as Works in Kind.

Yass Valley Council Page 8 Development Servicing Plan for Water Supply
• An agreed 12 month Defects Liability Period for the cost of the agreed work. • An agreed standard of workmanship. • An agreed timetable for the inspection of the works. • An agreed program for the completion of the works. • Submission of an itemised statement of costs (including all receipts) of the
completed works. Where the final cost of the works is less than the initial agreed cost of works, the balance is to be paid to Council as a monetary contribution. The costs of works are to also include a breakdown of all labour costs.
Please note that Council will not acknowledge any costs incurred associated with the agreement of Works in Kind as part of above itemised statement.
The decision to accept settlement of a contribution by way of Works in Kind is at the sole discretion of Council and will require a Council resolution prior to implementation. It is Council’s preference that ,for broad-acre release areas, Council accepts Works in Kind and that these are to be fully constructed prior to the release of the Linen Plan or at such time as identified in a “written agreement” between Council and the developer. Should Works in Kind that have been agreed to by Council be later withdrawn by the applicant for any reason, then the applicant will be liable for the payment of contributions in accordance with the conditions of development consent or complying development certificate plus any indexations that may have occurred since the approval date.
5.4 Staged Subdivision/Development In the event of a staged subdivision or development, Yass Valley Council will accept the staged payment of DC as specified above, that is, prior to the release of the Linen Plan for each stage of subdivision and prior to the release of any building approval for a particular stage of a development. Deferred payment of DC other than in accordance with Yass Valley Council’s requirements for Staged Subdivision and Development, is not permitted by Yass Valley Council.
5.5 Reviewing and Revising of Developer Charges DC calculations relating to this DSP will be reviewed after a period of five to six years, or when any significant changes occur in proposed works, growth projections or standards. In the period between any reviews, DC will be revised on 1 July each year on the basis of movements in the Consumer Price Index (CPI) for Canberra, in the preceding 12 months to December, excluding the impact of GST.

Yass Valley Council Page 9 Development Servicing Plan for Water Supply
6. References (1) Department of Land and Water Conservation, Guidelines - Developer Charges
for Water Supply, Sewerage and Stormwater (2002) Consultation Draft (2) NSW Public Works Water Supply Investigation Manual (1986)
Yass Valley Council Page 10 Development Servicing Plan for Water Supply
APPENDIX No. 1 - State Environmental Planning Policies Applying To Yass Valley Council Water Supply At the time of preparation of this DSP, there were no State Environmental Planning Policies applicable to the Yass Valley Council water supply. Should policies become applicable during the life of this DSP, these should be listed in this Appendix.

Yass Valley Council Page 11 Development Servicing Plan for Water Supply
APPENDIX No. 2 - Yass Valley Council – Other DSP’s Relevant Yass Section 64 Sewerage Plan Yass Section 94 Plan

Yass Valley Council Page 12 Development Servicing Plan for Water Supply
APPENDIX No. 3 - Plans Of Service Areas
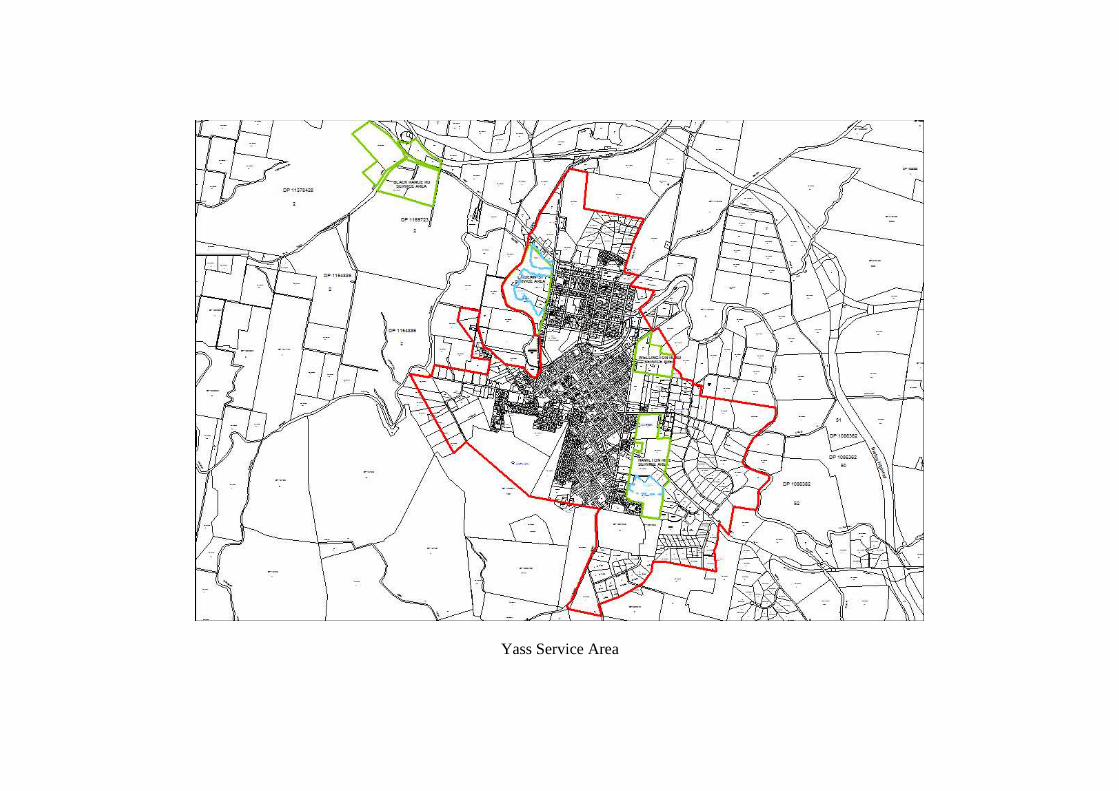
Yass Service Area

Murrumbateman Service Area

Hamilton Rise Service Area

Black Range Road Service Area

Laidlaw St Service Area

Wellington Road Service Area

Yass Valley Council Page 13 Development Servicing Plan for Water Supply
APPENDIX No. 4 – Calculations

Developer Charges for Water Supply and Sewerage + Y=Yass General YL=Yass - Laidlaw StYH=Yass - Hamilton Rise Bi=Binalong
YASS VALLEY COUNCIL WATER SUPPLY ALL AREAS PAY A SHARE YW=Yass - Wellington St Bo=BowningYB= Yass - Bk Range Rd M=Murrumbateman
ComponentCouncil Service Area
Denotations +Year Commissioned
Effective year of commissioing for
ROI 1
Capital Cost*(2012/13$)
PV of Capital Cost (2012/13$)
Capacity (EPs)
occupancy ratio 2
Capacity(ETs)
Cost per ET($ per ET)
Year when Capacity is Taken-Up
Take-up Period(Years)
Return on Investment Factor 4,5
Capital Charge per ET
(2012/13$)
Pre 1996 Works
Dams & ReservoirsClear Water Reservoir 1 - WTP 1.4 ML Y YH YW YB YL BI BO M 1966 1995/96 $914,890.00 $914,890.00 5,950 $153.76 2025 30 1.49 $0.00 $1,068 Pre 30 year oldClear Water Reservoir 2 - WTP 1.4 ML Y YH YW YB YL BI BO M 1966 1995/96 $914,890.00 $914,890.00 5,950 $153.76 2025 30 1.49 $0.00 $1,068 Pre 30 year oldYass Dam Walkway Y YH YW YB YL BI BO M 1987 1995/96 $57,300.00 $57,300.00 5,950 $9.63 2000 5 1.06 $10.00Yass Dam New outlet Y YH YW YB YL BI BO M 1996 1995/96 $1,887,080.00 $1,887,080.00 5,950 $317.16 2000 5 1.06 $336.00
Transfer SystemRising Mains 450 RM Dam-Raw water PS (49) Y YH YW YB YL BI BO M 1966 1995/96 $115,699.00 $115,699.00 5,950 $19.45 2025 30 1.49 $0.00 $44 Pre 30 year oldRising Mains 300 RM Raw water PS-WTP (50-51)Y YH YW YB YL BI BO M 1966 1995/96 $316,744.00 $316,744.00 5,950 $53.23 2025 30 1.49 $0.00 $121 Pre 30 year old
Treatment Works & Pumping StationsDAF Treatment Plant Y YH YW YB YL BI BO M 1989 1995/96 $10,115,240.00 $10,115,240.00 5,950 $1,700.04 2000 28 1.45 $2,463.00Raw water pump station Y YH YW YB YL BI BO M 1989 1995/96 $357,170.00 $357,170.00 5,950 $60.03 2015 20 1.31 $78.00
Post 1996 Works
Dams & ReservoirsYass Dam Upgrade - Raise dam level Y YH YW YB YL BI BO M 2015 2015 $9,000,000.00 $7,346,680.89 5,950 $1,234.74 2015 26 2.05 $2,537.00Yass Dam Catchment improvements Y YH YW YB YL BI BO M 2013 2013 $25,000.00 $23,364.49 5,950 $3.93 2015 28 2.16 $8.00Yass Dam Land acquisition Y YH YW YB YL BI BO M 2013 2013 $785,000.00 $733,644.86 5,950 $123.30 2015 28 2.16 $266.00Yass Dam River flow gauging Y YH YW YB YL BI BO M 2013 2013 $20,000.00 $18,691.59 5,950 $3.14 2015 5 1.14 $4.00Yass Dam Riparian Vegetation works Y YH YW YB YL BI BO M 2013 2013 $150,000.00 $140,186.92 5,950 $23.56 2015 5 1.14 $27.00Yass Dam Upgrade - Raise dam level Y YH YW YB YL BI BO M 2014 2014 $2,200,000.00 $1,921,565.20 5,950 $322.95 2015 26 2.05 $664.00Yass Dam Catchment improvements Y YH YW YB YL BI BO M 2014 2014 $25,000.00 $21,835.97 5,950 $3.67 2015 27 2.11 $8.00Yass Dam River flow gauging Y YH YW YB YL BI BO M 2014 2014 $60,000.00 $52,406.32 5,950 $8.81 2015 4 1.10 $10.00Yass Dam Riparian Vegetation works Y YH YW YB YL BI BO M 2014 2014 $250,000.00 $218,359.68 5,950 $36.70 2015 5 1.14 $42.00Yass Dam Upgrade - Raise dam level Y YH YW YB YL BI BO M 2015 2015 $1,000,000.00 $816,297.88 5,950 $137.19 2040 26 2.05 $282.00Yass Dam Riparian Vegetation works Y YH YW YB YL BI BO M 2015 2015 $200,000.00 $163,259.58 5,950 $27.44 2019 5 1.14 $31.00Yass Dam Prepare Dambreak Study Y YH YW YB YL BI BO M 2015 2015 $50,000.00 $40,814.89 5,950 $6.86 2019 5 1.14 $8.00
Transfer SystemTrunk Main 200 Trunk Main under Yass River - upgradeY YH YW YB YL BI BO M 2014 2014 $500,000.00 $436,719.36 5,950 $73.40 2025 12 1.41 $104.00
Treatment Works & Pumping StationsEmergency bore (Yass) Y YH YW YB YL BI BO M 2004 2004 $490,000.00 $490,000.00 5,950 $82.35 2023 20 1.76 $145.00Water softening upgrade Y YH YW YB YL BI BO M 2007 2007 $1,000,000.00 $1,000,000.00 5,950 $168.07 2023 17 1.63 $273.00New raw water supply to WTP Y YH YW YB YL BI BO M 2008 2008 $14,839,000.00 $14,839,000.00 5,950 $2,493.95 2023 16 1.58 $3,948.00Replace raw water pumps Y YH YW YB YL BI BO M 2008 2008 $100,000.00 $100,000.00 5,950 $16.81 2023 16 1.58 $27.00Water Treatment WTP Improvement Y YH YW YB YL BI BO M 2013 2013 $60,000.00 $56,074.77 5,950 $9.42 2023 16 1.58 $15.00Mount St PS Replace raw water pumps Y YH YW YB YL BI BO M 2017 2017 $250,000.00 $178,246.54 5,950 $29.96 2034 18 1.67 $50.00
Miscellaneous
Management Prepare IWCMP Y YH YW YB YL BI BO M 2004 2004 $150,000.00 $150,000.00 5,950 $25.21 2023 20 1.76 $44.00Management Review & upgrade DSP Y YH YW YB YL BI BO M 2013 2013 $15,000.00 $14,018.69 5,950 $2.36 2018 6 1.18 $3.00Management Review & upgrade SBP Y YH YW YB YL BI BO M 2013 2013 $50,000.00 $46,728.97 5,950 $7.85 2018 6 1.18 $9.00
Total $45,898,013.00 $43,486,909.60 $7,309 $11,392.00
Rate of return (pre 1996) 3%Rate of return (post 1996) 7%Discount Rate 7%Year Now 2012/13
1. For pre-1996 assets, the effective year of commissioning for calculating Return on Investment (ROI) factors is January 1996, ie: 1995/96.4. The ROI factor for pre-1996 works is based on a rate of return (discount rate) of 3% pa real. The ROI factor assumes a uniform annual take-up of lots over the take-up period, commencing in the effective year of commissioning of the asset.5. The ROI factor for post-1996 assets is based on a rate of return (discount rate) of 7% pa real, together with a uniform annual take-up of lots over the take-up period, commencing in the year of commissioning of the asset.* Current Replacement Costs are based on "NSW Reference Rates for Valuation of Water Supply, Sewerage and Stormwater Assets", Ministry of Energy and Utilities, June 2003", adjusted to Year Now dollars
Yass_W_DC_a_data direct_max zone ET_d.xls ALL AREAS 5:43 PM 7/03/2013 Page 1 of 7

Developer Charges for Water Supply and Sewerage + Y=Yass General YL=Yass - Laidlaw StYH=Yass - Hamilton Rise Bi=Binalong
YASS VALLEY COUNCIL WATER SUPPLY YASS EXISTING AND OTHER ZONES < 500 ET YW=Yass - Wellington St Bo=BowningYB= Yass - Bk Range Rd M=Murrumbateman
ComponentCouncil Service Area
Denotations +Year Commissioned
Effective year of commissioing for
ROI 1
Capital Cost*(2012/13$)
PV of Capital Cost (2012/13$)
Capacity (EPs)
occupancy ratio 2
Capacity(ETs)
Cost per ET($ per ET)
Year when Capacity is Taken-
Up
Take-up Period(Years)
Return on Investment Factor 4,5
Capital Charge per ET(2012/13$)
Pre 1996 Works
Dams & Reservoirs
Morton Ave Reservoir 4.5 ML Y YH YW M 1966 1996 2803670 $2,803,670.00 3,878 $722.97 2025 30 1.49 $0.00 $1,018 Pre 30 year oldMorton High Level Reservoir 1.8 ML Y YH YW 1986 1986 777370 $777,370.00 3,878 $200.46 2020 25 1.39 $279.00Shantella Reservoir 1.13 ML Y 1966 1996 815570 $815,570.00 3,878 $210.31 2020 30 1.49 $313.00O Connelltown Reservoir 1.8 ML Y 1988 1996 891970 $891,970.00 3,878 $230.01 2020 25 1.39 $321.00Bowning Reservoir [0.5 ML] Bo 1987 1996 323510 $323,510.00 3,878 $83.42 2045 50 1.89 $157.00Binalong Reservoir [1.8 ML] Bi 1915 1996 621070 $621,070.00 3,878 $160.15 2045 50 1.89 $302.00 $3,906 Pre 30 year oldBinalong HL Reservoir [21 kL] Bi 1992 1996 211060 $211,060.00 3,878 $54.42 2045 50 1.89 $103.00Binalong Balance Tank [100 kL] Bi 1992 1996 129750 $129,750.00 3,878 $33.46 2045 50 1.89 $63.00
Transfer SystemRising Mains 300 RM WTP - Morton Av (48) Y YH YW M 1964 1996 $716,048.00 $716,048.00 3,878 $184.64 2029/30 30 1.49 $0.00 $274 Pre 30 year oldRising Mains 300 RM (698-699) Y YH YW M 1966 1966 $317,006.00 $317,006.00 3,878 $81.74 2029/30 30 1.49 $121.00Rising Mains 250 RM to Morton Ave HL (43) Y YH YW 1988 1996 $135,975.00 $135,975.00 3,878 $35.06 2015 20 1.31 $46.00Rising Mains 250 RM to Shantalla (44-47) Y 1988 1996 $913,929.60 $913,929.60 3,878 $235.67 2025 30 1.49 $350.00Rising Mains 250 RM (Trunk 42) Y 1988 1996 $151,726.00 $151,726.00 3,878 $39.12 2015 20 1.31 $51.00Trunk Mains 200 TM Yass-Bowning Walls Jn Rd (32-33,35) Bo Bi 1988 1996 $229,563.00 $229,563.00 3,878 $59.20 2015 20 1.31 $77.00Trunk Mains 200 TM Yass-Bowning Walls Jn Rd (33) Bo Bi 1988 1996 $32,385.00 $32,385.00 3,878 $8.35 2015 20 1.31 $11.00Trunk Mains 150 TM Yass-Bowning (31) Bo Bi 1988 1996 $1,329.00 $1,329.00 3,878 $0.34 2015 20 1.31 $0.00Rising Mains 150 RM to Bowning Main Sth Rlwy (34,36-37) Bo Bi 1988 1996 $1,134,185.23 $1,134,185.23 3,878 $292.47 2015 20 1.31 $382.00Trunk Mains 150 TM Burley Griffin Way Off Ck Storage (38-39) Bi 1988 1996 $24,382.00 $24,382.00 3,878 $6.29 2045 50 1.89 $12.00Trunk Mains 150 TM Bowning-Binalong (18,24-26) Bi 1990 1996 $249,042.00 $249,042.00 3,878 $64.22 2045 50 1.89 $121.00Trunk Mains 150 TM Binalong LL Res (19-20) Bi 1990 1996 $13,024.00 $13,024.00 3,878 $3.36 2045 50 1.89 $6.00Trunk Mains 100 TM Bowning-Binalong (29) Bi 1990 1996 $711,518.04 $711,518.04 3,878 $183.48 2045 50 1.89 $346.00Trunk Mains 100 TM Hume Hwy Boost Pump Stn (3,22-23) Bi 1990 1996 $5,124.00 $5,124.00 3,878 $1.32 2045 50 1.89 $2.00Trunk Mains 100 TM Hume Hwy (16-17) Bi 1990 1996 $681,885.00 $681,885.00 3,878 $175.83 2045 50 1.89 $332.00Trunk Mains 150 TM Burley Griffin Way Off Ck Storage (5-6) Bi 1990 1996 $23,661.00 $23,661.00 3,878 $6.10 2045 50 1.89 $12.00Trunk Mains 150 TM Hume Hwy (11) Bi
Treatment Works & Pumping Stations
Morton Avenue HL Pump Station Y YH YW 1987 1996 $169,990.00 $169,990.00 3,878 $43.83 2011 16 1.24 $54.00Pumping Stations Shantella Pump Station Y 1987 1996 $189,090.00 $189,090.00 3,878 $189.09 2011 16 1.24 $234.00Bowning-Binalong Pump Station Bo Bi 1991 1996 $121,100.00 $121,100.00 3,878 $189.09 2045 50 1.89 $357.00Bowning Pump Station Bo 1987 1996 $114,180.00 $114,180.00 3,878 $189.09 2045 50 1.89 $357.00Binalong Off Creek Storage Pump Station Bi 1993 1996 $70,930.00 $70,930.00 3,878 $189.09 2045 50 1.89 $357.00Binalong High Level Reservoir Pump Station Bi 1993 1996 $64,010.00 $64,010.00 3,878 $189.09 2045 50 1.89 $357.00
Post 1996 Works
Dams & Reservoirs
Transfer System
Willow Creek Bore No. 1 Y YH YW M 2007 2007 $276,147.00 $276,147.00 3,878 $71.21 2026 20 1.76 $126.00Willow Creek Bore No. 2 Y YH YW M 2007 2007 $278,743.00 $278,743.00 3,878 $71.88 2026 20 1.76 $127.00Rising Mains 150 RM Willow Ck to Morton Av (63-65) Y YH YW M 2007 2007 $119,057.12 $119,057.12 3,878 $30.70 2007 1 1.00 $31.00Rising Mains 100 RM Willow Ck to Morton Av (66) Y YH YW M 2007 2007 $115,636.00 $115,636.00 3,878 $29.82 2007 1 1.00 $30.00Rising Mains 150 RM Willow Ck to Morton Av Bore 2 (52-55) Y YH YW M 2007 2007 $40,699.73 $40,699.73 3,878 $10.50 2007 1 1.00 $10.00Rising Mains 150 RM Willow Ck to Morton Av Bore 1 (56-58) Y YH YW M 2007 2007 $19,259.00 $19,259.00 3,878 $4.97 2007 1 1.00 $5.00Rising Mains 150 RM Willow Ck to Morton Av -Rayner Pl (59-62) Y YH YW M 2007 2007 $78,502.90 $78,502.90 3,878 $20.24 2007 1 1.00 $20.00Rising Mains 100 RM Quarry Bore to O'Connor St (67) Y 2008 2008 $85,970.00 $85,970.00 3,878 $22.17 2008 1 1.00 $22.00Trunk Mains 200 TM Grand Junction Rd YW 2016 2016 $90,000.00 $68,660.57 3,878 $17.71 2031 16 1.58 $28.00Trunk Mains Water Main Replacement Bo Bi 2013 2013 $150,000.00 $140,186.92 3,878 $36.15 2045 33 2.42 $87.00Trunk Mains Water Main Replacement Bo Bi 2014 2014 $150,000.00 $131,015.81 3,878 $33.78 2045 32 2.36 $80.00Trunk Mains 150 TM Hume Hwy (11) Bi 2006 2006 $36,882.00 $36,882.00 3,878 $9.51 2045 40 2.80 $27.00
Treatment Works & Pumping StationsOld Quarry Bore Y 2009 2009 $274,415.00 $274,415.00 3,878 $70.76 2028 20 1.76 $125.00Old Quarry Bore - fencing Y 2013 2013 $125,000.00 $116,822.43 3,878 $30.12 2028 16 1.58 $48.00Pumping Stations Upgrade PS Building Y 2013 2013 $30,000.00 $28,037.38 3,878 $47.67 2032 20 1.76 $84.00Pumping Stations Old Quarry Bore Y 2009 2009 $274,415.00 $274,415.00 3,878 $784.04 2028 20 1.76 $1,383.00Pumping Stations Old Quarry Bore - fencing Y 2013 2013 $125,000.00 $116,822.43 3,878 $357.14 2028 16 1.58 $565.00
MiscellaneousManagement Drinking Water Quality Bo Bi 2013 2013 $100,000.00 $93,457.94 3,878 $24.10 2017 5 1.14 $27.00Management Improve water quality Bo Bi 2015 2015 $50,000.00 $40,814.89 3,878 $10.52 2019 5 1.14 $12.00
Yass_W_DC_a_data direct_max zone ET_d.xls YASS EXIST. & OTHERS <500 ET 5:43 PM 7/03/2013 Page 2 of 7

ComponentCouncil Service Area
Denotations +Year Commissioned
Effective year of commissioing for
ROI 1
Capital Cost*(2012/13$)
PV of Capital Cost (2012/13$)
Capacity (EPs)
occupancy ratio 2
Capacity(ETs)
Cost per ET($ per ET)
Year when Capacity is Taken-
Up
Take-up Period(Years)
Return on Investment Factor 4,5
Capital Charge per ET(2012/13$)
Management Improve water quality Bo Bi 2016 2016 $25,000.00 $19,072.38 3,878 $4.92 2020 5 1.14 $6.00Management Borefield investigation - Illalong Bi 2013 2013 $20,000.00 $18,691.59 3,878 $4.82 2045 33 2.42 $12.00Management Binalong WS - Borefield investigation Bi 2017 2017 $30,000.00 $21,389.59 3,878 $5.52 2045 29 2.21 $12.00
Total $15,138,779.62 $15,038,751.55 $5,760 $7,990.00
ALL AREAS CONTRIBUTION $11,392.00
TOTAL $19,382.00
Rate of return (pre 1996) 3%Rate of return (post 1996) 7%Discount Rate 7%Year Now 2012/13
1. For pre-1996 assets, the effective year of commissioning for calculating Return on Investment (ROI) factors is January 1996, ie: 1995/96.4. The ROI factor for pre-1996 works is based on a rate of return (discount rate) of 3% pa real. The ROI factor assumes a uniform annual take-up of lots over the take-up period, commencing in the effective year of commissioning of the asset.5. The ROI factor for post-1996 assets is based on a rate of return (discount rate) of 7% pa real, together with a uniform annual take-up of lots over the take-up period, commencing in the year of commissioning of the asset.* Current Replacement Costs are based on "NSW Reference Rates for Valuation of Water Supply, Sewerage and Stormwater Assets", Ministry of Energy and Utilities, June 2003", adjusted to Year Now dollars
Yass_W_DC_a_data direct_max zone ET_d.xls YASS EXIST. & OTHERS <500 ET 5:43 PM 7/03/2013 Page 3 of 7
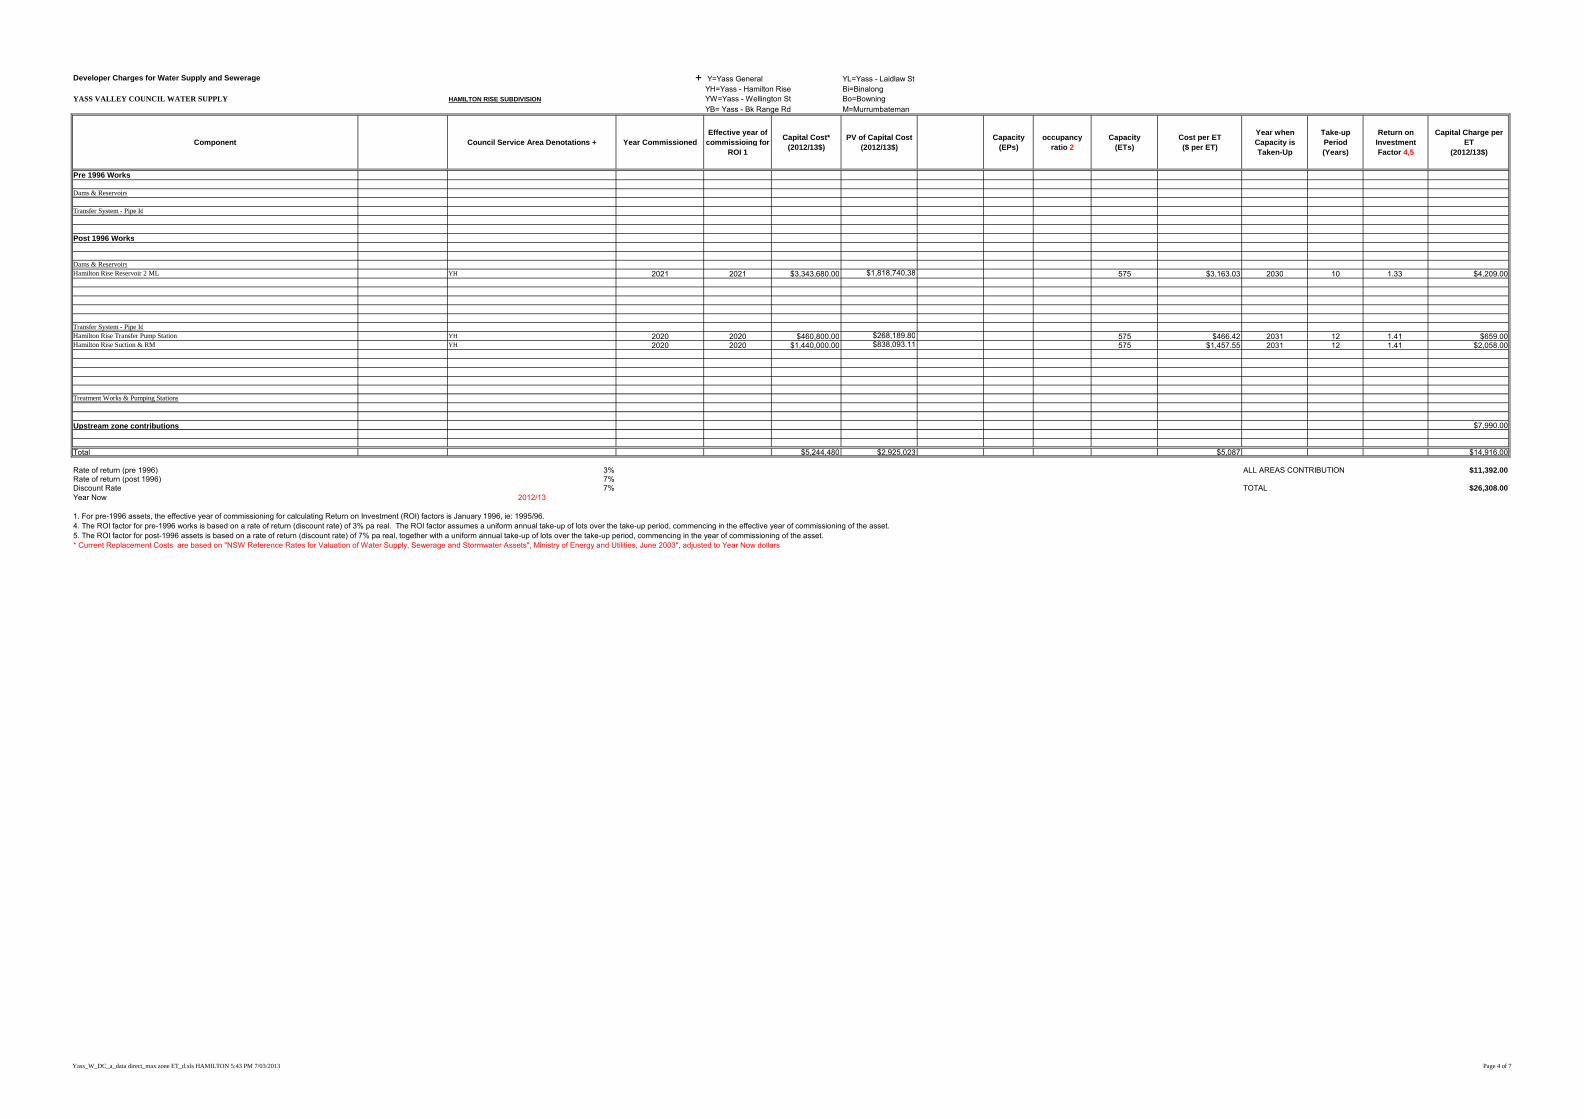
Developer Charges for Water Supply and Sewerage + Y=Yass General YL=Yass - Laidlaw StYH=Yass - Hamilton Rise Bi=Binalong
YASS VALLEY COUNCIL WATER SUPPLY HAMILTON RISE SUBDIVISION YW=Yass - Wellington St Bo=BowningYB= Yass - Bk Range Rd M=Murrumbateman
Component Council Service Area Denotations + Year CommissionedEffective year of
commissioing for ROI 1
Capital Cost*(2012/13$)
PV of Capital Cost (2012/13$)
Capacity (EPs)
occupancy ratio 2
Capacity(ETs)
Cost per ET($ per ET)
Year when Capacity is Taken-Up
Take-up Period(Years)
Return on Investment Factor 4,5
Capital Charge per ET
(2012/13$)
Pre 1996 Works
Dams & Reservoirs
Transfer System - Pipe Id
Post 1996 Works
Dams & ReservoirsHamilton Rise Reservoir 2 ML YH 2021 2021 $3,343,680.00 $1,818,740.38 575 $3,163.03 2030 10 1.33 $4,209.00
Transfer System - Pipe IdHamilton Rise Transfer Pump Station YH 2020 2020 $460,800.00 $268,189.80 575 $466.42 2031 12 1.41 $659.00Hamilton Rise Suction & RM YH 2020 2020 $1,440,000.00 $838,093.11 575 $1,457.55 2031 12 1.41 $2,058.00
Treatment Works & Pumping Stations
Upstream zone contributions $7,990.00
Total $5,244,480 $2,925,023 $5,087 $14,916.00
Rate of return (pre 1996) 3% ALL AREAS CONTRIBUTION $11,392.00Rate of return (post 1996) 7%Discount Rate 7% TOTAL $26,308.00Year Now 2012/13
1. For pre-1996 assets, the effective year of commissioning for calculating Return on Investment (ROI) factors is January 1996, ie: 1995/96.4. The ROI factor for pre-1996 works is based on a rate of return (discount rate) of 3% pa real. The ROI factor assumes a uniform annual take-up of lots over the take-up period, commencing in the effective year of commissioning of the asset.5. The ROI factor for post-1996 assets is based on a rate of return (discount rate) of 7% pa real, together with a uniform annual take-up of lots over the take-up period, commencing in the year of commissioning of the asset.* Current Replacement Costs are based on "NSW Reference Rates for Valuation of Water Supply, Sewerage and Stormwater Assets", Ministry of Energy and Utilities, June 2003", adjusted to Year Now dollars
Yass_W_DC_a_data direct_max zone ET_d.xls HAMILTON 5:43 PM 7/03/2013 Page 4 of 7

Developer Charges for Water Supply and Sewerage + Y=Yass General YL=Yass - Laidlaw StYH=Yass - Hamilton Rise Bi=Binalong
YASS VALLEY COUNCIL WATER SUPPLY MURUMBATEMAN YW=Yass - Wellington St Bo=BowningYB= Yass - Bk Range Rd M=Murrumbateman
ComponentCouncil Service Area
Denotations +Year Commissioned
Effective year of commissioing for
ROI 1
Capital Cost*(2012/13$)
PV of Capital Cost (2012/13$)
Capacity (EPs)
occupancy ratio 2
Capacity(ETs) 3
Cost per ET($ per ET)
Year when Capacity is Taken-Up
Take-up Period(Years)
Return on Investment Factor 4,5
Capital Charge per ET
(2012/13$)
Pre 1996 Works
Dams & Reservoirs
Murrumbatman Tank [0.272 ML] M 1983 1996 $299,290.00 $299,290.00 1,000 $299.29 2009 14 1.20 $360.00Murrumbatman HL Tank [0.09 ML] M 1992 1996 $204,140.00 $204,140.00 1,000 $204.14 2009 14 1.20 $246.00
Transfer SystemRising Mains 150 RM Hercules St (1,12-14,18)M 1984 1996 $71,212.69 $71,212.69 1,000 $71.21 2010 15 1.22 $87.00
Treatment Works & Pumping StationsMurrumbateman Bore 1 Pump Station M 1983 1996 $51,900.00 $51,900.00 1,000 $51.90 2009 14 1.20 $62.00Murrumbateman High Level Pump Station M 1992 1996 $38,060.00 $38,060.00 1,000 $38.06 2009 14 1.20 $46.00
Post 1996 Works
Dams & ReservoirsMurrumbatman Reservoir 2 ML M 2019 2019 $3,745,000.00 $2,332,197.78 1,000 $2,332.20 2045 27 2.31 $5,387.00
Transfer SystemTrunk Main 250 TM HL Reservoir-West St 2015 2015 $265,000.00 $216,318.94 1,000 $216.32 2045 31 2.31 $500.00Rising Mains 200 RM MALL-Murrumbateman 2018 2018 $6,560,000.00 $4,371,204.99 1,000 $4,371.20 2045 28 2.31 $10,097.00
Treatment Works & Pumping StationsMurrumbateman Bore 2 Pump Station 2008 2008 $184,780.00 $184,780.00 1,000 $184.78 2009 2 1.03 $0.00Murrumbateman Transfer Pump Station 2016 2016 $605,000.00 $605,000.00 1,000 $605.00 2045 30 2.26 $1,367.00
MiscellaneousManagement Yass-Murrumbatement WS Finalise Concept Plan 2013 2013 $150,000.00 $140,186.92 1,000 $140.19 2045 33 2.42 $339.00Management Detailed design Murrumbatement WS 2014 2014 $300,000.00 $262,031.62 1,000 $262.03 2045 32 2.36 $620.00
Total $12,474,383 $8,776,323 $8,776 $19,111.00
Rate of return (pre 1996) 3% ALL AREAS CONTRIBUTION $11,392.00Rate of return (post 1996) 7%Discount Rate 7% TOTAL $30,503.00Year Now 2012/13
1. For pre-1996 assets, the effective year of commissioning for calculating Return on Investment (ROI) factors is January 1996, ie: 1995/96.4. The ROI factor for pre-1996 works is based on a rate of return (discount rate) of 3% pa real. The ROI factor assumes a uniform annual take-up of lots over the take-up period, commencing in the effective year of commissioning of the asset.5. The ROI factor for post-1996 assets is based on a rate of return (discount rate) of 7% pa real, together with a uniform annual take-up of lots over the take-up period, commencing in the year of commissioning of the asset.* Current Replacement Costs are based on "NSW Reference Rates for Valuation of Water Supply, Sewerage and Stormwater Assets", Ministry of Energy and Utilities, June 2003", adjusted to Year Now dollars
Yass_W_DC_a_data direct_max zone ET_d.xls MURUMBATEMAN 5:43 PM 7/03/2013 Page 5 of 7

Capital Charge Summary COMPONENT $/ET Conversion of Assessments to ET's
Location ALL AREAS LOCAL
YASS EXIST & OTHER < 500 ET 11392 $7,990 19,382 Assessments factor ET's ET/ Residential Assessment
HAMILTON 11392 $14,916 26,308 Residential Assessments comprised of: 3,611 3,417 0.95
MURUMBATEMAN 11392 $19,111 30,503 Houses (non-pensioner) 2,861 1 2,861
Houses (pensioner) 490 0.87 426
Flats/Units/Town Houses (non-pensioner) 0 0.67 0
Flats/Units/Town Houses (pensioner) 0 0.55 0
Weighted Capital Charge $/ET Vacant Lots 260 0.5 130
(based on design ET)
Location Dev. Charge ET Cap Charge Non-Residential assessments 328
YASS EXIST & OTHER < 500 ET 499 19,382
HAMILTON 575 26,308 Annual Revenue from Rates and Charges
MURUMBATEMAN 745 30,503 ET's ET/ Non-Residential Assessment
Weighted Capital Charge 26,126 11/12 Residential Revenue $2,694 0 1.75
11/12 Non-Residential Revenue $0
11/12 Pensioner Rebate Grant $24
11/12 Total Revenue $3,537
Summary This revenue does not include revenue from Developer Charges
Location Capital Charge Reduction Developer
/ ET / ET Charge/ ET ($12/13)
Yass Existing and Other < 500 ET $19,382 $7,183 $12,199Hamilton $26,308 $7,183 $19,125Murrumbateman $30,503 $7,183 $23,320
Weighted Average $26,126 $7,183 $18,943
Yass_W_DC_a_data direct_max zone ET_d.xlsReduction 7/03/2013

Table X - Calculation of Developer Charges using the NPV of Annual Charges Method Yass Valley Council - Water Supply
Based on Input Reduction Amounts of #### /ET (1st iteration)
YearYear No. 1 2 3 4 5 6 7 8 9 10 11 12 13 14 15 16 17 18 19 20
Year 12/13 13/14 14/15 15/16 16/17 17/18 18/19 19/20 20/21 21/22 22/23 23/24 24/25 25/26 26/27 27/28 28/29 29/30 30/31 31/32
Developer ChargesYear 1 12 /13
Base Year 2012 /13
Average Capital Charges per ET (2012/13$) 29,028 29,028 29,028 29,028 29,028 29,028 29,028 29,028 29,028 29,028 29,028 29,028 29,028 29,028 29,028 29,028 29,028 29,028 29,028 29,028
Inflation from 2012/13 to 12/13 (%) 0.00%
Capital Charges (12/13$) 29,030 29,030 29,030 29,030 29,030 29,030 29,030 29,030 29,030 29,030 29,030 29,030 29,030 29,030 29,030 29,030 29,030 29,030 29,030 29,030
Input Reduction Amounts (12/13$) 4,030 4,030 4,030 4,030 4,030 4,030 4,030 4,030 4,030 4,030 4,030 4,030 4,030 4,030 4,030 4,030 4,030 4,030 4,030 4,030Developer Charge per ET (12/13$)
Developer Charges per assessment - Residential (2012/13$) 0 0 0 0 0 0 0 0 0 0 0 0 0 0 0 0 0 0 0 0
Developer Charges per assessment - Non-Residential (2012/13$) 0 0 0 0 0 0 0 0 0 0 0 0 0 0 0 0 0 0 0 0
Assessments & ETs11/12 12/13 13/14 14/15 15/16 16/17 17/18 18/19 19/20 20/21 21/22 22/23 23/24 24/25 25/26 26/27 27/28 28/29 29/30 30/31 31/32
Residential Assessments at year end 2,873 3,121 3,196 3,273 3,352 3,432 3,514 3,598 3,684 3,772 3,863 3,956 4,051 4,148 4,248 4,350 4,454 4,561 4,670 4,782 4,897
Non Residential Assessments at year end 327 328 331 334 337 340 343 346 349 352 356 360 364 368 372 376 380 384 388 392 396
Backlog Assessments at year end - - - - - - - - - - - - - - - - - - - - -
Total Assessments at year end 3,200 3,449 3,527 3,607 3,689 3,772 3,857 3,944 4,033 4,124 4,219 4,316 4,415 4,516 4,620 4,726 4,834 4,945 5,058 5,174 5,293
ET per Residential Assessment 0.95
ET per Non Residential Assessment 1.75
Total ETs 3,302 3,539 3,615 3,694 3,774 3,855 3,939 4,024 4,111 4,199 4,293 4,388 4,485 4,585 4,687 4,791 4,896 5,005 5,116 5,229 5,345
New ETs per year (excluding backlog) - 237 77 78 80 81 83 85 87 89 93 95 97 99 102 104 106 109 111 113 116
Cumulative New ETs (excluding backlog) - 237 314 392 473 554 637 722 809 898 991 1,087 1,184 1,283 1,385 1,489 1,595 1,703 1,814 1,927 2,044
PV (new ETs excluding backlog) 30 years @ 7% pa - 1,400 1,261 1,284 1,306 1,328 1,350 1,372 1,393 1,414 1,434 1,451 1,467 1,482 1,496 1,508 1,519 1,528 1,535 1,541 1,544
Revenue and ExpenditureRates & Charges Revenue, Trade Waste Charges, Other Sales and Charges, Pensioner Rebate Grant
Revenue ($'000) (2012/13$) 3,594 3,679 3,773 3,861 3,957 4,053 4,148 4,249 4,352 4,459 4,565 4,676 4,791 4,905 5,025 5,146 5,270 5,398 5,527 5,661
OMA Expenditure ($'000) (2012/13$) 2,344 2,299 2,256 2,210 2,168 2,125 2,145 2,229 2,256 2,248 2,351 2,342 2,333 2,324 2,316 2,308 2,303 2,298 2,293 2,290
Revenue less OMA Expenditure ($'000) 1,250 1,380 1,517 1,651 1,789 1,928 2,003 2,020 2,096 2,211 2,214 2,334 2,458 2,581 2,709 2,838 2,967 3,100 3,234 3,371
Revenue less OMA Expenditure for new ETs ($'000) 84 120 161 207 257 312 359 398 448 511 548 616 688 763 842 924 1,010 1,099 1,192 1,289
PV (Revenue less OMA Expenditure for new ETs) 30 years @ 7% pa ($'000) 9,003 8,827 9,328 9,797 10,244 10,663 11,053 11,580 12,288 12,875 13,339 14,196 14,690 15,165 15,633 16,075 16,505 16,924 17,316 17,690
Output (calculated) Reduction Amounts 6,429 7,001 7,267 7,502 7,715 7,898 8,057 8,311 8,689 8,976 9,192 9,677 9,912 10,137 10,367 10,585 10,801 11,024 11,239 11,461Output with first 5 years averaged 7,183 7,183 7,183 7,183 7,183 7,898 8,057 8,311 8,689 8,976 9,192 9,677 9,912 10,137 10,367 10,585 10,801 11,024 11,239 11,461
% Difference Between the Input and Output 78%Difference Greater Than 2%, Go to Next Iteration
General Notes: Specific Notes:1.
Assume zero growth after 20 years
2.
Approximately three iterations of the financial planning model are normally required until the Ouput Reduction Amount for the first 5 years is within 2% of the Input Reduction Amount.
Yass_W_01-Calculator NPV Annual Charges 13 Sept 02.xls, 1st IterationNPV of Annual Charges Calculator Version 1 20/06/01 Page 1
Date printed: 6/02/2013

21 22 23 24 25 26 27 28 29 30 31 32 33 34 35 36 37 38 39 40 41 42 43 44 45 46 47 48 49 50
32/33 33/34 34/35 35/36 36/37 37/38 38/39 39/40 40/41 41/42 42/43 43/44 44/45 45/46 46/47 47/48 48/49 49/50 50/51 51/52 52/53 53/54 54/55 55/56 56/57 57/58 58/59 59/60 60/61 61/62
29,028 29,028 29,028 29,028 29,028 29,028 29,028 29,028 29,028 29,028 29,028 29,028 29,028 29,028 29,028 29,028 29,028 29,028 29,028 29,028 29,028 29,028 29,028 29,028 29,028 29,028 29,028 29,028 29,028 29,028
29,030 29,030 29,030 29,030 29,030 29,030 29,030 29,028 29,028 29,028 29,028 29,028 29,028 29,028 29,028 29,028 29,028 29,028 29,028 29,028 29,028 29,028 29,028 29,028 29,028 29,028 29,028 29,028 29,028 29,028
4,030 4,030 4,030 4,030 4,030 4,030 4,030 4,030 4,030 4,030 4,030 4,030 4,030 4,030 4,030 4,030 4,030 4,030 4,030 4,030 4,030 4,030 4,030 4,030 4,030 4,030 4,030 4,030 4,030 4,030
0 0 0 0 0 0 0 0 0 0 0 0 0 0 0 0 0 0 0 0 0 0 0 0 0 0 0 0 0 0
0 0 0 0 0 0 0 0 0 0 0 0 0 0 0 0 0 0 0 0 0 0 0 0 0 0 0 0 0 0
32/33 33/34 34/35 35/36 36/37 37/38 38/39 39/40 40/41 41/42 42/43 43/44 44/45 45/46 46/47 47/48 48/49 49/50 50/51 51/52 52/53 53/54 54/55 55/56 56/57 57/58 58/59 59/60 60/61 61/625,015 5,135 5,258 5,384 5,513 5,645 5,780 5,919 6,061 6,206 6,355 6,355 6,355 6,355 6,355 6,355 6,355 6,355 6,355 6,355 6,355 6,355 6,355 6,355 6,355 6,355 6,355 6,355 6,355 6,355
400 404 408 412 416 420 424 428 432 436 440 440 440 440 440 440 440 440 440 440 440 440 440 440 440 440 440 440 440 440
- - - - - - - - - - - - - - - - - - - - - - - - - - - - - -
5,415 5,539 5,666 5,796 5,929 6,065 6,204 6,347 6,493 6,642 6,795 6,795 6,795 6,795 6,795 6,795 6,795 6,795 6,795 6,795 6,795 6,795 6,795 6,795 6,795 6,795 6,795 6,795 6,795 6,795
5,345 5,345 5,345 5,345 5,345 5,345 5,345 5,345 5,345 5,345 5,345 5,345 5,345 5,345 5,345 5,345 5,345 5,345 5,345 5,345 5,345 5,345 5,345 5,345 5,345 5,345 5,345 5,345 5,345 5,345
116 116 116 116 116 116 116 116 116 116 116 116 116 116 116 116 116 116 116 116 116 116 116 116 116 116 116 116 116 116
2,160 2,276 2,392 2,509 2,625 2,741 2,857 2,974 3,090 3,206 3,322 3,439 3,555 3,671 3,787 3,904 4,020 4,136 4,252 4,369 4,485 4,601 4,717 4,834 4,950 5,066 5,182 5,299 5,415 5,531
1,544 1,544 1,544 1,544 1,544 1,544 1,544 1,544 1,544 1,544 1,544
5,800 5,937 6,079 6,227 6,376 6,530 6,688 6,848 7,011 7,182 7,182 7,182 7,182 7,182 7,182 7,182 7,182 7,182 7,182 7,182 7,182 7,182 7,182 7,182 7,182 7,182 7,182 7,182 7,182 7,182
2,297 2,327 2,359 2,393 2,424 2,458 2,494 2,537 2,585 2,638 2,638 2,638 2,638 2,638 2,638 2,638 2,638 2,638 2,638 2,638 2,638 2,638 2,638 2,638 2,638 2,638 2,638 2,638 2,638 2,638
3,503 3,610 3,720 3,834 3,952 4,072 4,194 4,311 4,426 4,544 4,544 4,544 4,544 4,544 4,544 4,544 4,544 4,544 4,544 4,544 4,544 4,544 4,544 4,544 4,544 4,544 4,544 4,544 4,544 4,544
1,415 1,537 1,665 1,799 1,941 2,088 2,242 2,398 2,558 2,726 2,824 2,923 3,022 3,121 3,220 3,318 3,417 3,516 3,615 3,714 3,813 3,911 4,010 4,109 4,208 4,307 4,406 4,504 4,603 4,702
18,033 17,972 17,973 17,884 17,690 17,378 16,950 16,395 15,757 15,010 14,104
11,683 11,643 11,644 11,587 11,461 11,259 10,981 10,622 10,208 9,724 9,13811,683 11,643 11,644 11,587 11,461 11,259 10,981 10,622 10,208 9,724 9,138
Yass_W_01-Calculator NPV Annual Charges 13 Sept 02.xls, 1st IterationNPV of Annual Charges Calculator Version 1 20/06/01 Page 2
Date printed: 6/02/2013

Table X - Calculation of Developer Charges using the NPV of Annual Charges Method Yass Valley Council - Water SupplyBased on Input Reduction Amounts of #### /ET (2nd iteration)
YearYear No. 1 2 3 4 5 6 7 8 9 10 11 12 13 14 15 16 17 18 19 20
Year 12/13 13/14 14/15 15/16 16/17 17/18 18/19 19/20 20/21 21/22 22/23 23/24 24/25 25/26 26/27 27/28 28/29 29/30 30/31 31/32
Developer ChargesYear 1 12 /13
Base Year 2012 /13
Average Capital Charges per ET (2012/13$) 29,028 29,028 29,028 29,028 29,028 29,028 29,028 29,028 29,028 29,028 29,028 29,028 29,028 29,028 29,028 29,028 29,028 29,028 29,028 29,028
Inflation from 2012/13 to 12/13 (%) 0.00%
Capital Charge (12/13$) 29,030 29,030 29,030 29,030 29,030 29,030 29,030 29,030 29,030 29,030 29,030 29,030 29,030 29,030 29,030 29,030 29,030 29,030 29,030 29,030
Input Reduction Amounts (12/13$) 7,183 7,183 7,183 7,183 7,183 7,898 8,057 8,311 8,689 8,976 9,192 9,677 9,912 10,137 10,367 10,585 10,801 11,024 11,239 11,461Developer Charge per ET (12/13$) 21,850 21,850 21,850 21,850 21,850 21,130 20,970 20,720 20,340 20,050 19,840 19,350 19,120 18,890 18,660 18,450 18,230 18,010 17,790 17,570
Developer Charges per assessment - Residential (2012/13$) 20,760 20,760 20,760 20,760 20,760 20,070 19,920 19,680 19,320 19,050 18,850 18,380 18,160 17,950 17,730 17,530 17,320 17,110 16,900 16,690
Developer Charges per assessment - Non-Residential (2012/13$) 36,330 36,330 36,330 36,330 36,330 35,123 34,860 34,440 33,810 33,338 32,988 32,165 31,780 31,413 31,028 30,678 30,310 29,943 29,575 29,208
Assessments & ETs11/12 12/13 13/14 14/15 15/16 16/17 17/18 18/19 19/20 20/21 21/22 22/23 23/24 24/25 25/26 26/27 27/28 28/29 29/30 30/31 31/32
Residential Assessments at year end 2,873 3,121 3,196 3,273 3,352 3,432 3,514 3,598 3,684 3,772 3,863 3,956 4,051 4,148 4,248 4,350 4,454 4,561 4,670 4,782 4,897
Non Residential Assessments at year end 327 328 331 334 337 340 343 346 349 352 356 360 364 368 372 376 380 384 388 392 396
Backlog Assessments at year end - - - - - - - - - - - - - - - - - - - - -
Total Assessments at year end 3,200 3,449 3,527 3,607 3,689 3,772 3,857 3,944 4,033 4,124 4,219 4,316 4,415 4,516 4,620 4,726 4,834 4,945 5,058 5,174 5,293
ET per Residential Assessment 0.95
ET per Non Residential Assessment 1.75
Total ETs 3,302 3,539 3,615 3,694 3,774 3,855 3,939 4,024 4,111 4,199 4,293 4,388 4,485 4,585 4,687 4,791 4,896 5,005 5,116 5,229 5,345
New ETs per year (excluding backlog) - 237 77 78 80 81 83 85 87 89 93 95 97 99 102 104 106 109 111 113 116
Cumulative New ETs (excluding backlog) - 237 314 392 473 554 637 722 809 898 991 1,087 1,184 1,283 1,385 1,489 1,595 1,703 1,814 1,927 2,044
PV (new ETs excluding backlog) 30 years @ 7% pa - 1,400 1,261 1,284 1,306 1,328 1,350 1,372 1,393 1,414 1,434 1,451 1,467 1,482 1,496 1,508 1,519 1,528 1,535 1,541 1,544
Revenue and ExpenditureRates & Charges Revenue, Trade Waste Charges, Other Sales and Charges, Pensioner Rebate Grant
Revenue ($'000) (2012/13$) 3,594 3,679 3,773 3,861 3,957 4,053 4,148 4,249 4,352 4,459 4,565 4,676 4,791 4,905 5,025 5,146 5,270 5,398 5,527 5,661
OMA Expenditure ($'000) (2012/13$) 2,344 2,299 2,256 2,210 2,168 2,125 2,145 2,229 2,256 2,248 2,351 2,342 2,333 2,324 2,316 2,308 2,303 2,298 2,293 2,290
Revenue less OMA Expenditure ($'000) 1,250 1,380 1,517 1,651 1,789 1,928 2,003 2,020 2,096 2,211 2,214 2,334 2,458 2,581 2,709 2,838 2,967 3,100 3,234 3,371
Revenue less OMA Expenditure for new ETs ($'000) 84 120 161 207 257 312 359 398 448 511 548 616 688 763 842 924 1,010 1,099 1,192 1,289
PV (Revenue less OMA Expenditure for new ETs) 30 years @ 7% pa ($'000) 9,003 8,827 9,328 9,797 10,244 10,663 11,053 11,580 12,288 12,875 13,339 14,196 14,690 15,165 15,633 16,075 16,505 16,924 17,316 17,690
Output (calculated) Reduction Amounts 6,429 7,001 7,267 7,502 7,715 7,898 8,057 8,311 8,689 8,976 9,192 9,677 9,912 10,137 10,367 10,585 10,801 11,024 11,239 11461Average Calculated Reduction for a 5 yr Period 7,183 7,183 7,183 7,183 7,183 7,898 8,057 8,311 8,689 8,976 9,192 9,677 9,912 10,137 10,367 10,585 10,801 11,024 11,239 11461
% Difference Between the Input and Output 0%Difference Less Than 2%, Calculation Complete
General Notes: Developer Charges for the first 5 years = $21850 in year 12/13 dollars1.
Developer Charge 21,847 21,847 21,847 21,847 21,847 21,132 20,973 20,719 20,341 20,054 19,838 19,353 19,118 18,893 18,663 18,445 18,229 18,006 17,791 17,569
Approximately three iterations of the financial planning model are normally required until the Ouput Reduction Amount for the first 5 years is within 2% of the Input Reduction Amount.
Yass_W_01-Calculator NPV Annual Charges 13 Sept 02.xls, 2nd IterationNPV of Annual Charges Calculator Version 1 20/06/01 Page 3
Date printed: 6/02/2013

21 22 23 24 25 26 27 28 29 30 31 32 33 34 35 36 37 38 39 40 41 42 43 44 45 46 47 48 49 50
32/33 33/34 34/35 35/36 36/37 37/38 38/39 39/40 40/41 41/42 42/43 43/44 44/45 45/46 46/47 47/48 48/49 49/50 50/51 51/52 52/53 53/54 54/55 55/56 56/57 57/58 58/59 59/60 60/61 61/62
29,028 29,028 29,028 29,028 29,028 29,028 29,028 29,028 29,028 29,028 29,028 29,028 29,028 29,028 29,028 29,028 29,028 29,028 29,028 29,028 29,028 29,028 29,028 29,028 29,028 29,028 29,028 29,028 29,028 29,028
29,030 29,030 29,030 29,030 29,030 29,030 29,030 29,028 29,028 29,028 29,028 29,028 29,028 29,028 29,028 29,028 29,028 29,028 29,028 29,028 29,028 29,028 29,028 29,028 29,028 29,028 29,028 29,028 29,028 29,028
11,683 11,643 11,644 11,587 11,461 11,259 10,981 10,622 10,208 9,724 9,138 0 0 0 0 0 0 0 0 0 0 0 0 0 0 0 0 0 0 017,350 17,390 17,390 17,440 17,570 17,770 18,050 18,410 18,820 19,300 19,890 29,030 29,030 29,030 29,030 29,030 29,030 29,030 29,030 29,030 29,030 29,030 29,030 29,030 29,030 29,030 29,030 29,030 29,030 29,030
16,480 16,520 16,520 16,570 16,690 16,880 17,150 17,490 17,880 18,340 18,900 27,580 27,580 27,580 27,580 27,580 27,580 27,580 27,580 27,580 27,580 27,580 27,580 27,580 27,580 27,580 27,580 27,580 27,580 27,580
28,840 28,910 28,910 28,998 29,208 29,540 30,013 30,608 31,290 32,095 33,075 48,265 48,265 48,265 48,265 48,265 48,265 48,265 48,265 48,265 48,265 48,265 48,265 48,265 48,265 48,265 48,265 48,265 48,265 48,265
32/33 33/34 34/35 35/36 36/37 37/38 38/39 39/40 40/41 41/42 42/43 43/44 44/45 45/46 46/47 47/48 48/49 49/50 50/51 51/52 52/53 53/54 54/55 55/56 56/57 57/58 58/59 59/60 60/61 61/625,015 5,135 5,258 5,384 5,513 5,645 5,780 5,919 6,061 6,206 6,355 6,355 6,355 6,355 6,355 6,355 6,355 6,355 6,355 6,355 6,355 6,355 6,355 6,355 6,355 6,355 6,355 6,355 6,355 6,355
400 404 408 412 416 420 424 428 432 436 440 440 440 440 440 440 440 440 440 440 440 440 440 440 440 440 440 440 440 440
- - - - - - - - - - - - - - - - - - - - - - - - - - - - - -
5,415 5,539 5,666 5,796 5,929 6,065 6,204 6,347 6,493 6,642 6,795 6,795 6,795 6,795 6,795 6,795 6,795 6,795 6,795 6,795 6,795 6,795 6,795 6,795 6,795 6,795 6,795 6,795 6,795 6,795
5,345 5,345 5,345 5,345 5,345 5,345 5,345 5,345 5,345 5,345 5,345 5,345 5,345 5,345 5,345 5,345 5,345 5,345 5,345 5,345 5,345 5,345 5,345 5,345 5,345 5,345 5,345 5,345 5,345 5,345
116 116 116 116 116 116 116 116 116 116 116 116 116 116 116 116 116 116 116 116 116 116 116 116 116 116 116 116 116 116
2,160 2,276 2,392 2,509 2,625 2,741 2,857 2,974 3,090 3,206 3,322 3,439 3,555 3,671 3,787 3,904 4,020 4,136 4,252 4,369 4,485 4,601 4,717 4,834 4,950 5,066 5,182 5,299 5,415 5,531
1,544 1,544 1,544 1,544 1,544 1,544 1,544 1,544 1,544 1,544 1,544
5,800 5,937 6,079 6,227 6,376 6,530 6,688 6,848 7,011 7,182 7,182 7,182 7,182 7,182 7,182 7,182 7,182 7,182 7,182 7,182 7,182 7,182 7,182 7,182 7,182 7,182 7,182 7,182 7,182 7,182
2,297 2,327 2,359 2,393 2,424 2,458 2,494 2,537 2,585 2,638 2,638 2,638 2,638 2,638 2,638 2,638 2,638 2,638 2,638 2,638 2,638 2,638 2,638 2,638 2,638 2,638 2,638 2,638 2,638 2,638
3,503 3,610 3,720 3,834 3,952 4,072 4,194 4,311 4,426 4,544 4,544 4,544 4,544 4,544 4,544 4,544 4,544 4,544 4,544 4,544 4,544 4,544 4,544 4,544 4,544 4,544 4,544 4,544 4,544 4,544
1,415 1,537 1,665 1,799 1,941 2,088 2,242 2,398 2,558 2,726 2,824 2,923 3,022 3,121 3,220 3,318 3,417 3,516 3,615 3,714 3,813 3,911 4,010 4,109 4,208 4,307 4,406 4,504 4,603 4,702
18,033 17,972 17,973 17,884 17,690 17,378 16,950 16,395 15,757 15,010 14,104
11,683 11,643 11,644 11,587 11,461 11,259 10,981 10,622 10,208 9,724 9,13811,683 11,643 11,644 11,587 11,461 11,259 10,981 10,622 10,208 9,724 9,138
Yass_W_01-Calculator NPV Annual Charges 13 Sept 02.xls, 2nd IterationNPV of Annual Charges Calculator Version 1 20/06/01 Page 4
Date printed: 6/02/2013
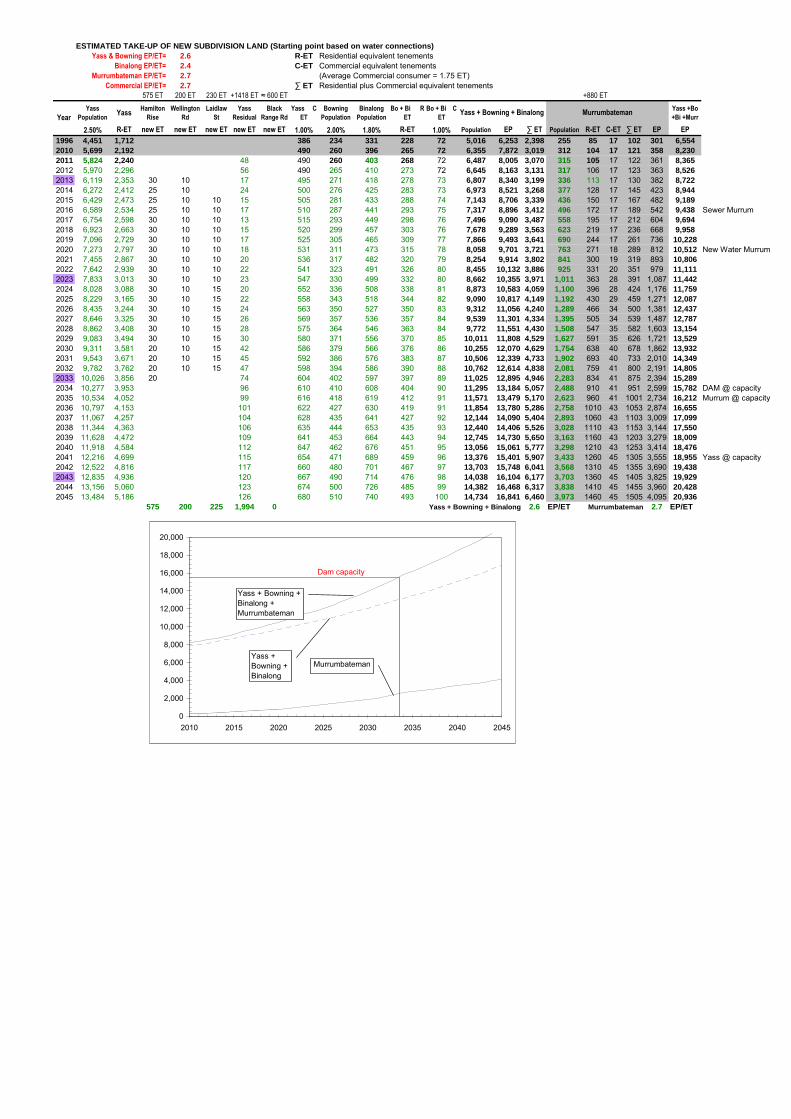
ESTIMATED TAKE-UP OF NEW SUBDIVISION LAND (Starting point based on water connections)Yass & Bowning EP/ET= 2.6 R-ET Residential equivalent tenements
Binalong EP/ET= 2.4 C-ET Commercial equivalent tenementsMurrumbateman EP/ET= 2.7 (Average Commercial consumer = 1.75 ET)
Commercial EP/ET= 2.7 ∑ ET Residential plus Commercial equivalent tenements575 ET 200 ET 230 ET +1418 ET ≈ 600 ET +880 ET
Yass
PopulationYass
Hamilton
Rise
Wellington
Rd
Laidlaw
St
Yass
Residual
Black
Range Rd
Yass C-
ET
Bowning
Population
Binalong
Population
Bo + Bi R-
ET
Bo + Bi C-
ET
Yass +Bo
+Bi +Murr
2.50% R-ET new ET new ET new ET new ET new ET 1.00% 2.00% 1.80% R-ET 1.00% Population EP ∑ ET Population R-ET C-ET ∑ ET EP EP
1996 4,451 1,712 386 234 331 228 72 5,016 6,253 2,398 255 85 17 102 301 6,5542010 5,699 2,192 490 260 396 265 72 6,355 7,872 3,019 312 104 17 121 358 8,2302011 5,824 2,240 48 490 260 403 268 72 6,487 8,005 3,070 315 105 17 122 361 8,3652012 5,970 2,296 56 490 265 410 273 72 6,645 8,163 3,131 317 106 17 123 363 8,5262013 6,119 2,353 30 10 17 495 271 418 278 73 6,807 8,340 3,199 336 113 17 130 382 8,7222014 6,272 2,412 25 10 24 500 276 425 283 73 6,973 8,521 3,268 377 128 17 145 423 8,9442015 6,429 2,473 25 10 10 15 505 281 433 288 74 7,143 8,706 3,339 436 150 17 167 482 9,1892016 6,589 2,534 25 10 10 17 510 287 441 293 75 7,317 8,896 3,412 496 172 17 189 542 9,438 Sewer Murrum2017 6,754 2,598 30 10 10 13 515 293 449 298 76 7,496 9,090 3,487 558 195 17 212 604 9,6942018 6,923 2,663 30 10 10 15 520 299 457 303 76 7,678 9,289 3,563 623 219 17 236 668 9,9582019 7,096 2,729 30 10 10 17 525 305 465 309 77 7,866 9,493 3,641 690 244 17 261 736 10,2282020 7,273 2,797 30 10 10 18 531 311 473 315 78 8,058 9,701 3,721 763 271 18 289 812 10,512 New Water Murrum2021 7,455 2,867 30 10 10 20 536 317 482 320 79 8,254 9,914 3,802 841 300 19 319 893 10,8062022 7,642 2,939 30 10 10 22 541 323 491 326 80 8,455 10,132 3,886 925 331 20 351 979 11,1112023 7,833 3,013 30 10 10 23 547 330 499 332 80 8,662 10,355 3,971 1,011 363 28 391 1,087 11,4422024 8,028 3,088 30 10 15 20 552 336 508 338 81 8,873 10,583 4,059 1,100 396 28 424 1,176 11,7592025 8,229 3,165 30 10 15 22 558 343 518 344 82 9,090 10,817 4,149 1,192 430 29 459 1,271 12,0872026 8,435 3,244 30 10 15 24 563 350 527 350 83 9,312 11,056 4,240 1,289 466 34 500 1,381 12,4372027 8,646 3,325 30 10 15 26 569 357 536 357 84 9,539 11,301 4,334 1,395 505 34 539 1,487 12,7872028 8,862 3,408 30 10 15 28 575 364 546 363 84 9,772 11,551 4,430 1,508 547 35 582 1,603 13,1542029 9,083 3,494 30 10 15 30 580 371 556 370 85 10,011 11,808 4,529 1,627 591 35 626 1,721 13,5292030 9,311 3,581 20 10 15 42 586 379 566 376 86 10,255 12,070 4,629 1,754 638 40 678 1,862 13,9322031 9,543 3,671 20 10 15 45 592 386 576 383 87 10,506 12,339 4,733 1,902 693 40 733 2,010 14,3492032 9,782 3,762 20 10 15 47 598 394 586 390 88 10,762 12,614 4,838 2,081 759 41 800 2,191 14,8052033 10,026 3,856 20 74 604 402 597 397 89 11,025 12,895 4,946 2,283 834 41 875 2,394 15,2892034 10,277 3,953 96 610 410 608 404 90 11,295 13,184 5,057 2,488 910 41 951 2,599 15,782 DAM @ capacity2035 10,534 4,052 99 616 418 619 412 91 11,571 13,479 5,170 2,623 960 41 1001 2,734 16,212 Murrum @ capacity2036 10,797 4,153 101 622 427 630 419 91 11,854 13,780 5,286 2,758 1010 43 1053 2,874 16,6552037 11,067 4,257 104 628 435 641 427 92 12,144 14,090 5,404 2,893 1060 43 1103 3,009 17,0992038 11,344 4,363 106 635 444 653 435 93 12,440 14,406 5,526 3,028 1110 43 1153 3,144 17,5502039 11,628 4,472 109 641 453 664 443 94 12,745 14,730 5,650 3,163 1160 43 1203 3,279 18,0092040 11,918 4,584 112 647 462 676 451 95 13,056 15,061 5,777 3,298 1210 43 1253 3,414 18,4762041 12,216 4,699 115 654 471 689 459 96 13,376 15,401 5,907 3,433 1260 45 1305 3,555 18,955 Yass @ capacity2042 12,522 4,816 117 660 480 701 467 97 13,703 15,748 6,041 3,568 1310 45 1355 3,690 19,4382043 12,835 4,936 120 667 490 714 476 98 14,038 16,104 6,177 3,703 1360 45 1405 3,825 19,9292044 13,156 5,060 123 674 500 726 485 99 14,382 16,468 6,317 3,838 1410 45 1455 3,960 20,4282045 13,484 5,186 126 680 510 740 493 100 14,734 16,841 6,460 3,973 1460 45 1505 4,095 20,936
575 200 225 1,994 0 Yass + Bowning + Binalong 2.6 EP/ET Murrumbateman 2.7 EP/ET
Year Yass + Bowning + Binalong Murrumbateman
0
2,000
4,000
6,000
8,000
10,000
12,000
14,000
16,000
18,000
20,000
2010 2015 2020 2025 2030 2035 2040 2045
Yass + Bowning + Binalong + Murrumbateman
Yass +Bowning + Binalong
Murrumbateman
Dam capacity