!['Polyesters, Unsaturated'. In: Encyclopedia of Polymer ...nguyen.hong.hai.free.fr/EBOOKS/SCIENCE AND...mer that can resist cracking when impacted. Neopentyl glycol [126-30-7] (NPG)](https://static.fdocuments.net/doc/165x107/5e768631fb97e06a265b9d66/polyesters-unsaturated-in-encyclopedia-of-polymer-and-mer-that-can-resist.jpg)
DEVELOPMENT OF UNSATURATED POLYESTERS … of unsaturated polyesters from ... development of...
93
Inês Marques Lopes DEVELOPMENT OF UNSATURATED POLYESTERS FROM RENEWABLE SOURCES Thesis submitted in partial fulfillment of the requirements for the degree of Master of Science in Biomedical Engineering at the Faculty of Sciences and Technology of the University of Coimbra. Supervised by Professor Arménio Coimbra Serra, Professor Jorge Fernando Coelho and Doctor Ana Clotilde Fonseca. September 2013
Transcript of DEVELOPMENT OF UNSATURATED POLYESTERS … of unsaturated polyesters from ... development of...
Inês Marques Lopes
DEVELOPMENT OF UNSATURATED POLYESTERS FROM
RENEWABLE SOURCES
Thesis submitted in partial fulfillment of the requirements for the degree of Master of
Science in Biomedical Engineering at the Faculty of Sciences and Technology of the
University of Coimbra. Supervised by Professor Arménio Coimbra Serra, Professor
Jorge Fernando Coelho and Doctor Ana Clotilde Fonseca.
September 2013
Inês Marques Lopes
DEVELOPMENT OF UNSATURATED POLYESTERS FROM
RENEWABLE SOURCES
Thesis submitted in partial fulfilment of the requirements for the degree of Master of
Science in Biomedical Engineering at the Faculty of Sciences and Technology of the
University of Coimbra. Supervised by Professor Arménio Coimbra Serra, Professor
Jorge Fernando Coelho and Doctor Ana Clotilde Fonseca.
September 2013

iii
Only the one who does not question is safe from making a mistake.
Albert Einstein, 1945

iv
ACKNOWLEDGEMENTS
Firstly, I would like to express my gratitude to Professor Arménio Serra and Professor Jorge Coelho, my
supervisors, for the opportunity to work with them, for their wise guidance and constructive suggestions
during this research project. I am particularly grateful for the assistance given by Doctor Ana Clotilde da
Fonseca. Her unlimited willingness to give her time, understanding and knowledge so generously has
been so deeply appreciated.
I would also like to extend my thanks to the colleagues of the Polymer Research Group of the Chemical
Engineering Department, particularly to Inês Barata, Célia Frias, Bianca Viola, Pedro Cardoso, Filipa Dinis
and Cátia Costa, for their welcome, joy and goodwill to help in so many ways.
Finally, I wish to thank my family and friends, in particular, my parents and sister, for their love and faith in
me; Marta, for her daily support; Miriam and Inês, for their worry and fearless honesty; and all colleagues
from SDDH/AAC group and futsal team, for the moments of inspiration and amusement. Although their
contributions are not directly related to this research project, they were crucial to my performance during
its development.
v
ABSTRACT
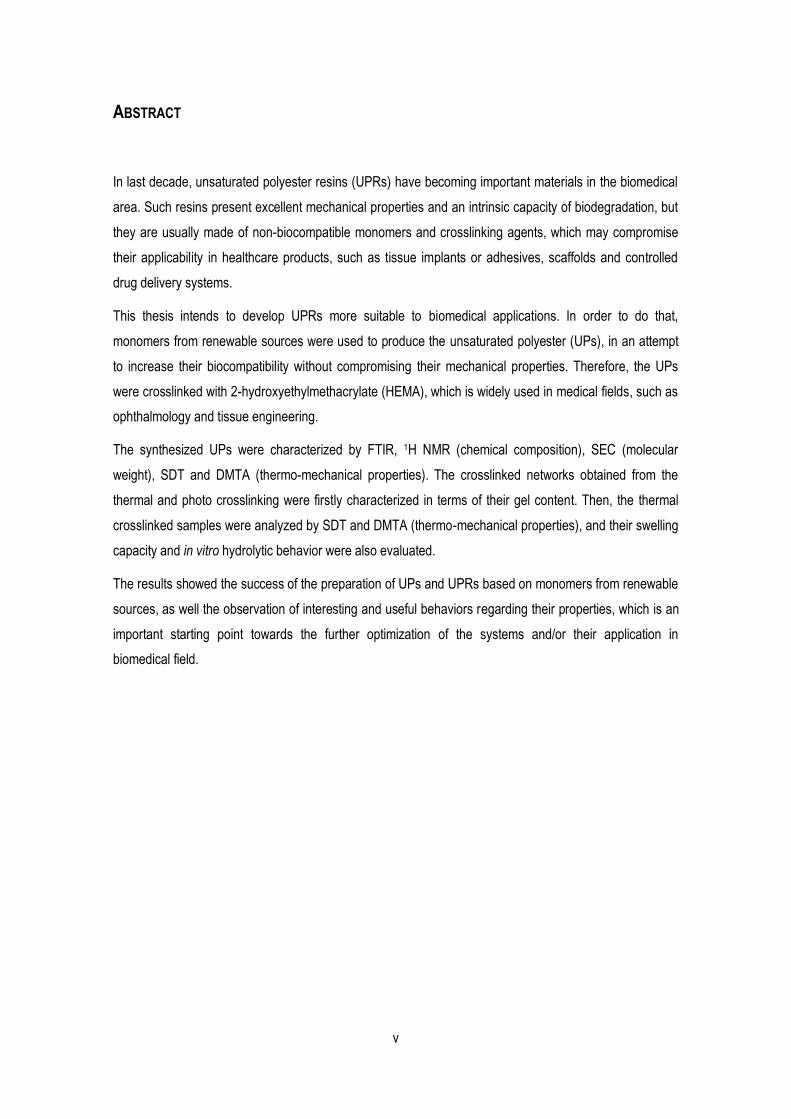
In last decade, unsaturated polyester resins (UPRs) have becoming important materials in the biomedical
area. Such resins present excellent mechanical properties and an intrinsic capacity of biodegradation, but
they are usually made of non-biocompatible monomers and crosslinking agents, which may compromise
their applicability in healthcare products, such as tissue implants or adhesives, scaffolds and controlled
drug delivery systems.
This thesis intends to develop UPRs more suitable to biomedical applications. In order to do that,
monomers from renewable sources were used to produce the unsaturated polyester (UPs), in an attempt
to increase their biocompatibility without compromising their mechanical properties. Therefore, the UPs
were crosslinked with 2-hydroxyethylmethacrylate (HEMA), which is widely used in medical fields, such as
ophthalmology and tissue engineering.
The synthesized UPs were characterized by FTIR, 1H NMR (chemical composition), SEC (molecular
weight), SDT and DMTA (thermo-mechanical properties). The crosslinked networks obtained from the
thermal and photo crosslinking were firstly characterized in terms of their gel content. Then, the thermal
crosslinked samples were analyzed by SDT and DMTA (thermo-mechanical properties), and their swelling
capacity and in vitro hydrolytic behavior were also evaluated.
The results showed the success of the preparation of UPs and UPRs based on monomers from renewable
sources, as well the observation of interesting and useful behaviors regarding their properties, which is an
important starting point towards the further optimization of the systems and/or their application in
biomedical field.

vi
RESUMO
Na última década, as resinas de poliéster insaturado (UPRs) têm vindo a tornar-se um material importante
na área Biomédica. Estas resinas apresentam excelentes propriedades mecânicas e uma capacidade
intrínseca de biodegradação, contudo são constituídas normalmente por monómeros ou agentes de
reticulação/monómeros reativos que não são biocompatíveis, o que pode comprometer a sua
aplicabilidade em produtos da área da Saúde, como implantes e adesivos, scaffolds e sistemas de
libertação controlada de fármacos.
Esta tese pretende desenvolver UPRs mais adequados para aplicações biomédicas. Para isso, são
usados monómeros de origem renovável na produção dos poliésteres insaturados (UPs), na tentativa de
aumentar a sua biocompatibilidade sem comprometer as suas propriedades mecânicas. Para isso, os
UPs foram reticulados com 2-hidroxietil metacrilato (HEMA), pois é bastante usado em áreas médicas,
como a Oftalmologia e a Engenharia de Tecidos.
Os UPs sintetizados foram caracterizados pelas técnicas de FTIR, 1H NMR (composição química), SEC
(peso molecular), SDT e DMTA (propriedades termo-mecânicas). As UPRs obtidas através de reticulação
térmica e fotoreticulação foram primeiramente analisadas relativamente ao seu teor de gel.
Seguidamente, as amostras reticuladas termicamente foram analisadas pelas técnicas SDT e DMTA
(propriedades termo-mecânicas), e as suas capacidades de absorção e degradação hidrolítica in vitro
também foram avaliadas.
Os resultados revelaram sucesso na preparação dos UPs e UPRs compostos por monómeros de fonte
renovável, assim como a observação de efeitos interessantes nas suas propriedades, constituindo pontos
de partida importantes para a futura otimização dos sistemas e respectiva aplicação no campo biomédico.
vii
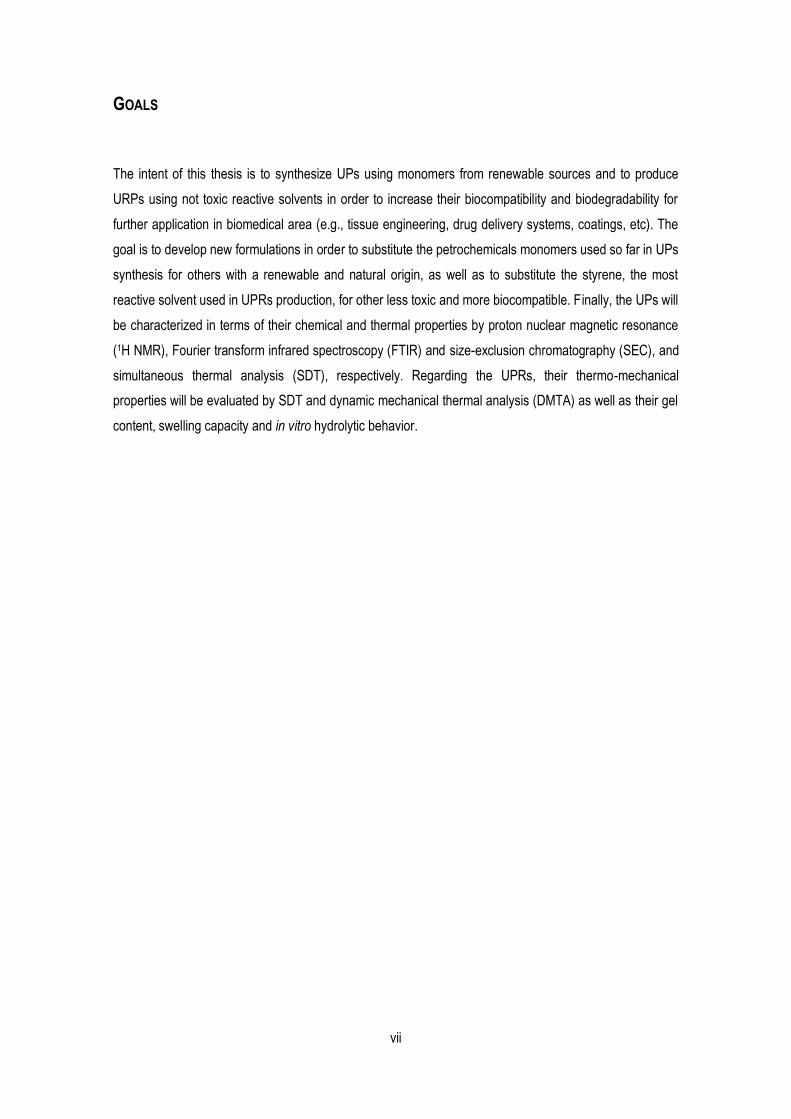
GOALS
The intent of this thesis is to synthesize UPs using monomers from renewable sources and to produce
URPs using not toxic reactive solvents in order to increase their biocompatibility and biodegradability for
further application in biomedical area (e.g., tissue engineering, drug delivery systems, coatings, etc). The
goal is to develop new formulations in order to substitute the petrochemicals monomers used so far in UPs
synthesis for others with a renewable and natural origin, as well as to substitute the styrene, the most
reactive solvent used in UPRs production, for other less toxic and more biocompatible. Finally, the UPs will
be characterized in terms of their chemical and thermal properties by proton nuclear magnetic resonance
(1H NMR), Fourier transform infrared spectroscopy (FTIR) and size-exclusion chromatography (SEC), and
simultaneous thermal analysis (SDT), respectively. Regarding the UPRs, their thermo-mechanical
properties will be evaluated by SDT and dynamic mechanical thermal analysis (DMTA) as well as their gel
content, swelling capacity and in vitro hydrolytic behavior.
viii
NOMENCLATURE
Ton Extrapolated onset temperatures, in Celsius degrees (ºC)
T5% Temperature corresponding to 5% of mass loss, in Celsius degrees (ºC)
T10% Temperature corresponding to 10% of mass loss, in Celsius degrees (ºC)
Tp Peak temperature, in Celsius degrees (ºC)
Tdeg Degradation temperature, in Celsius degrees (ºC)
Tg Glass transition temperature, in Celsius degrees (ºC)
Vs Volume of the sample, in millilitres (mL)
Vb Volume of the blank, in millilitres (mL)
Wo Initial weight of the sample, in grams (g)
We Weight of the sample after being extracted, in grams (g)
Wd Weight of the dry samples before immersion, in grams (g)
Ws Weight of the swollen samples, in grams (g)
Wt Weight of the dry samples after incubation for days, in grams (g)
ix
LIST OF ACRONYMS
AV Acid value
BPO Benzoyl peroxide
C Calculated relative molar percentage of monomer present in each UP
d8-THF Deuterated tetrahydrofuran
DAH Dianhydrohexitol
DG Diethylene glycol
DMTA Dynamic mechanical thermal analysis
DV Differential viscometer
DSC Differential scanning calorimetry
DTGA Derivative of thermogravimetric analysis
EtOH Ethanol
F Relative molar percentage of monomer used in the feed
FA Fumaric acid
FCDA 2,5-furancarboxydialdehyde
FDCA 2,5-furandicarboxylic acid
FTIR Fourier transform infrared spectroscopy
HEMA 2-Hydroxyethylmethacrylate
HQ Hydroquinone
HMF Hydroxymethylfurfural
HPSEC High-performance gel permeation chromatography
1H NMR Proton nuclear magnetic resonance
IA Itaconic acid
IB Isosorbide
Ir-2959 Irgacure 2959
KOH Potassium Hydroxide
LALLS Low-angle laser-light scattering
Ms Mass of the sample
Mn Number average molecular weight
MW Molecular weight
NaN3 Sodium azide
PBS Phosphate buffered saline
PCL Polycaprolactone
PC Polycondensation
PDI Polydispersity index
PDO 1,3 Propanediol
x
PE Polyethylene
PET Polyethylene terephthalate
PG Propylene Glycol
PGA Polyglycolic acid
PHA Polyhydroxyalkanoate
PHB Poly(3-hydroxybutyrate)
PLA Polylactide
PP Polypropylene
PS Polystyrene
PTFE Polytetrafluoroethylene
PVC Polyvinylchloride
RALLS Right-angle laser-light scattering
Rd/d Ratio between diols and diacids
RI Refractive-index
ROP Ring-opening polymerization
RS Reactive solvent
SA Sebacic acid
SEC Size-exclusion chromatography
SDT Simultaneous thermal analysis
THF Tetrahydrofuran
TMS Tetramethylsilane
TGA Thermogravimetric analysis
UP Unsaturated polyester
UPR Unsaturated polyester resin

xi
CONTENTS
ACKNOWLEDGEMENTS ......................................................................................................................... iv
ABSTRACT .............................................................................................................................................. v
RESUMO ............................................................................................................................................... vi
GOALS .................................................................................................................................................. vii
NUMENCLATURE................................................................................................................................. viii
LIST OF ACRONYMS............................................................................................................................... ix
LIST OF FIGURES .................................................................................................................................. xiii
LIST OF TABLES..................................................................................................................................... xv
CHAPTER I. INTRODUCTION ................................................................................................................... 1
1.1. MOTIVATION............................................................................................................................. 1
1.2. STATE OF THE ART ....................................................................................................................... 5
1.2.1. Polyesters ............................................................................................................................. 5
1.2.2. Unsaturated polyesters resins (UPRs) .................................................................................... 9
1.2.3. Polymers and monomers from renewable sources ............................................................... 12
Naturally occurring polyesters ................................................................................................................. 13
Monomers from other renewable resources ........................................................................................... 14
CHAPTER I I. MATERIALS AND METHODS ............................................................................................ 19
2.1. MATERIALS ................................................................................................................................... 19
2.2. METHODS .................................................................................................................................... 19
2.2.1. UPs synthesis ...................................................................................................................... 19
2.2.2. Curing reactions.................................................................................................................. 22
2.2.3. Characterization techniques ................................................................................................ 23
Chemical structure identification............................................................................................................. 23
Molecular weight distribution ................................................................................................................. 23
Thermal and mechanical properties ........................................................................................................ 23
Gel content............................................................................................................................................. 24
Swelling capacity .................................................................................................................................... 24
In vitro hydrolytic degradation ................................................................................................................ 24
CHAPTER I I I. RESULTS AND DISCUSSION ........................................................................................... 25
3.1. UPS SYNTHESIS AND CHARACTERIZATION .............................................................................................. 25
3.1.1. Chemical structure identification ......................................................................................... 27
FTIR ........................................................................................................................................................ 27

xii
1H NMR .................................................................................................................................................. 28
3.1.2. Molecular weight distribution ............................................................................................. 30
SEC ......................................................................................................................................................... 30
3.1.3. Thermal and mechanical properties .................................................................................... 31
SDT ........................................................................................................................................................ 31
DMTA ..................................................................................................................................................... 33
3.2. UPRS PRODUCTION AND CHARACTERIZATION ........................................................................................ 33
3.2.1. Gel content ......................................................................................................................... 34
3.2.2. Thermal and mechanical properties .................................................................................... 36
SDT ........................................................................................................................................................ 36
DMTA ..................................................................................................................................................... 38
3.2.3. Swelling capacity ................................................................................................................ 40
3.2.4. In vitro hydrolytic degradation ............................................................................................ 45
CHAPTER IV. CONCLUSION AND FUTURE WORK ................................................................................. 48
CONCLUSION ....................................................................................................................................... 48
FUTURE WORK ..................................................................................................................................... 49
REFERENCES ......................................................................................................................................... 50
APPENDICES ......................................................................................................................................... 56
A. FTIR ......................................................................................................................................... 56
B. 1H NMR .................................................................................................................................... 60
C. SDT .......................................................................................................................................... 66
D. DMTA ...................................................................................................................................... 71
E. SWELLING CAPACITY ...................................................................................................................... 75
F. IN VITRO HYDROLYTIC DEGRADATION ................................................................................................. 77

xiii
LIST OF FIGURES
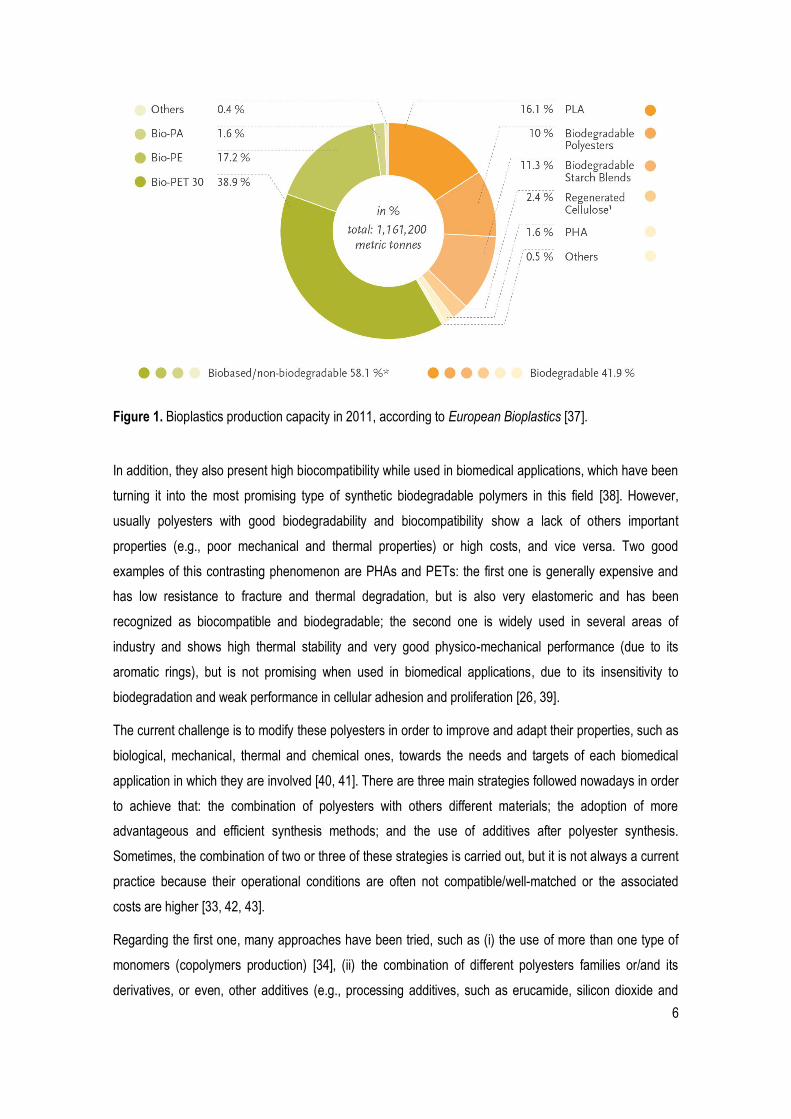
Figure 1. Bioplastics production capacity in 2011, according to European Bioplastics [37]. ......................... 6
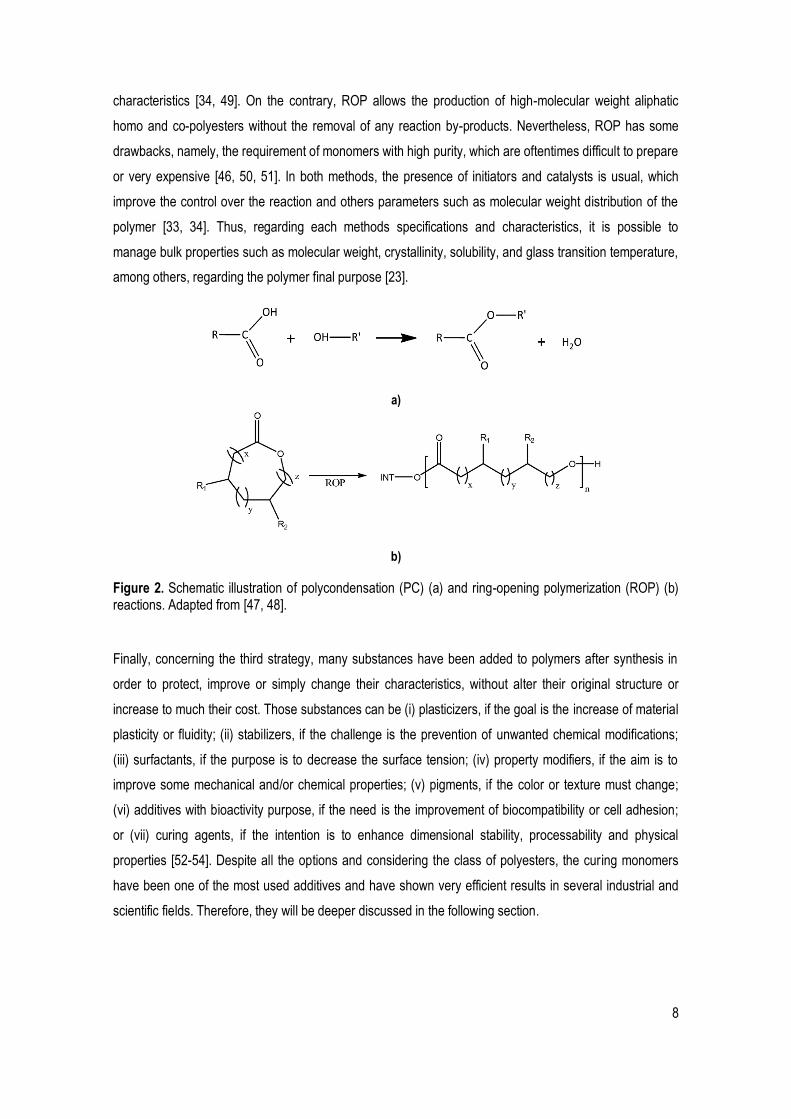
Figure 2. Schematic illustration of polycondensation (PC) (a) and ring-opening polymerization (ROP) (b) reactions. Adapted from [47, 48]. ........................................................................................................................ 8
Figure 3. Schematic illustration of a curing reaction and its steps – from unlinked chains to gel formation. Adapted from [57, 59]. ....................................................................................................................................... 10
Figure 4. Schematic illustration of inter (a.1) and intra (a.2) polymer homopolymerization and solvent monomer homopolymerization (b). Adapted from [47, 59]. ............................................................................. 11
Figure 5. The general formula of poly(hydroxyalkanoates) (a) and a schematic representation of the structure of suberin (b) – natural polyesters [61]. ............................................................................................ 13
Figure 6. Schematic view of the oxypropilation of OH-bearing macromolecular materials [61]. .................. 14
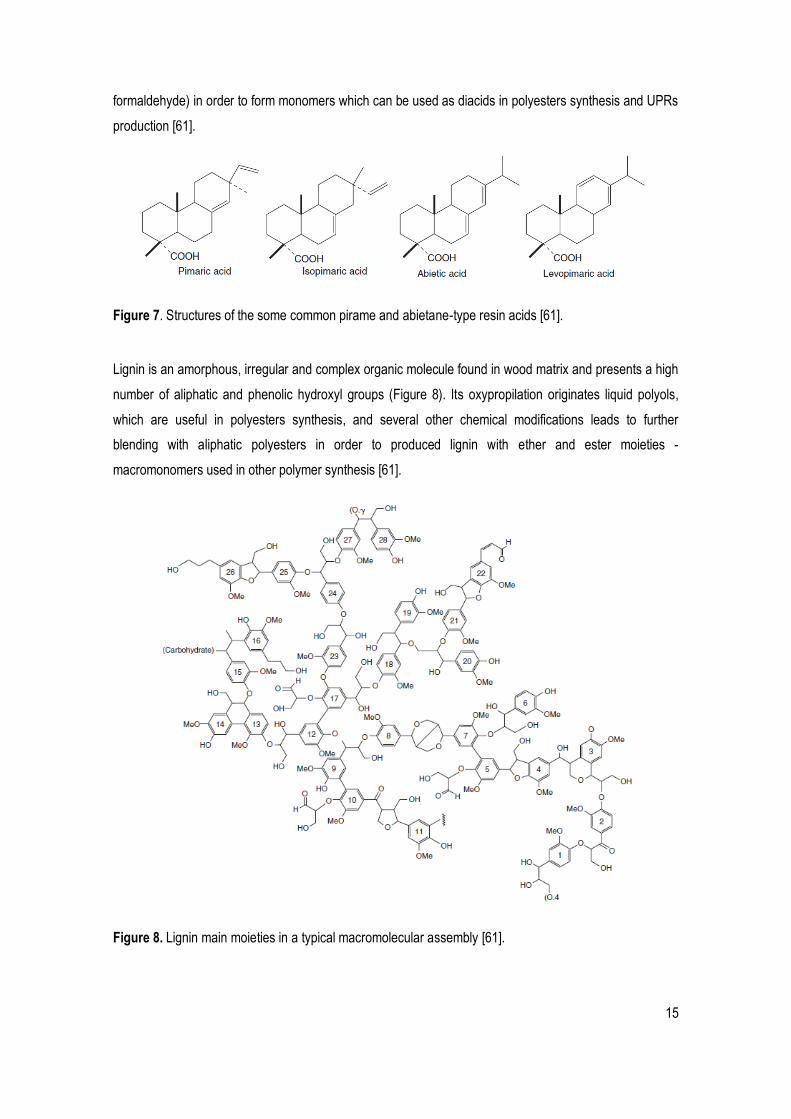
Figure 7. Structures of the some common pirame and abietane-type resin acids [61]. ............................... 15
Figure 8. Lignin main moieties in a typical macromolecular assembly [61]. ................................................. 15
Figure 9. The structures of oleic and linoleic acids. Adapted from [61]. ........................................................ 16
Figure 10. Conversion of starch into sorbitol and isosorbide [56]. ................................................................. 17
Figure 11. The strutures of the three diastereoisomers of dianhydrohexitol [61].......................................... 17
Figure 12. The structures of the hydroxymethylfurfural (a) and 2,5-furandicarboxylic acid (b) [61]. ........... 17
Figure 13. Schematic illustration of the reactor and its apparatus used to synthesize the UPs, kindly provided by Ana Cação. .................................................................................................................................... 20
Figure 14. Schematic illustration of the UPs synthesis reaction occurred inside the reactor. The A represents the diacids and the B the glycols used. ......................................................................................... 20
Figure 15. Chemical structures of IA (a) and FA (b). ...................................................................................... 25
Figure 16. Chemical structures of succinic acid (a), adipic acid (b) and SA (c). ........................................... 25
Figure 17. Chemical structures of IB (a), PDO (b), DG (c) and PG (d). ........................................................ 26
Figure 18. FTIR spectrum of UP 1.1 and the identification of the ester group (a) and the double bonds (b). ............................................................................................................................................................................ 28
Figure 19. The 1H RMN spectrum of UP 1.1 and the identification of the protons present in its chemical structure. ............................................................................................................................................................ 29
Figure 20. 1H RMN spectrum of UP 2.0. The # and * symbols correspond to the unreacted diethylene glycol and itaconic acid, respectively................................................................................................................ 29
Figure 21. Molecular weight distribution of the UPs. ...................................................................................... 31
Figure 22. Simultaneous (DSC and TGA) thermoanalytical curves of UP 1.1. ............................................. 32
xiv
Figure 23. Chemical structures of styrene (a) and HEMA (b). ....................................................................... 34
Figure 24. Chemical structures of BPO (a) and Ir-2959 (b). .......................................................................... 34
Figure 25. Gel content of all UPRs samples. .................................................................................................. 35
Figure 26. Simultaneous (DSC and TGA) thermoanalytical curves of UPR 1 (a) and UPR 2 (b). .............. 37
Figure 27. DMTA traces of UPR 1.0 at different frequency (1 and 10Hz) (a) and DMTA traces of UPR 1 with different amounts of HEMA at 1Hz (b). ..................................................................................................... 39
Figure 28. Swelling capacity of UPRs 1.0, 1.1 and 1.2 (HEMA amount effect). ........................................... 41
Figure 29. Swelling capacity of samples 0 (a), 1 (b) and 2 (c) from UPRs 2, 3 and 5 (IB amount effect). .. 42
Figure 30. Swelling capacity of samples 0 (a), 1 (b) and 2 (c) from UPRs 1, 2 and 5 (diacids effect). ....... 43
Figure 31. Swelling capacity of samples 0 (a), 1 (b) and 2 (c) from UPRs 1, 2 and 5 (diols effect). ........... 44
Figure 32. In vitro hydrolytic degradation analysis of the UPR 1 (HEMA amount effect). ............................ 45
Figure 33. In vitro hydrolytic degradation analysis of samples 0 (a), 1 (b) and 2 (c) from UPRs 1, 2 and 5 (diacids effect). ................................................................................................................................................... 46
Figure 34. In vitro hydrolytic degradation analysis of samples 0 (a), 1 (b) and 2 (c) from UPRs 3, 4 and 7 (diols effect). ....................................................................................................................................................... 47

xv
LIST OF TABLES
Table 1. Examples of different polymeric materials and their biomedical applications. Adapted from [16]. .. 3
Table 2. Some examples of synthetic (a) and natural (b) polymers, including the five most used families of synthetic polymers nowadays - polyethylene (PE), polypropylene (PP), polyvinylchloride (PVC), polystyrene (PS) and polyethylene terephthalate (PET). Adapted from [24, 25]. ............................................ 4
Table 3. The main family of polyesters currently used in industry and scientific research and some of its main properties and applications. Adapted from [34, 35]. ................................................................................. 5
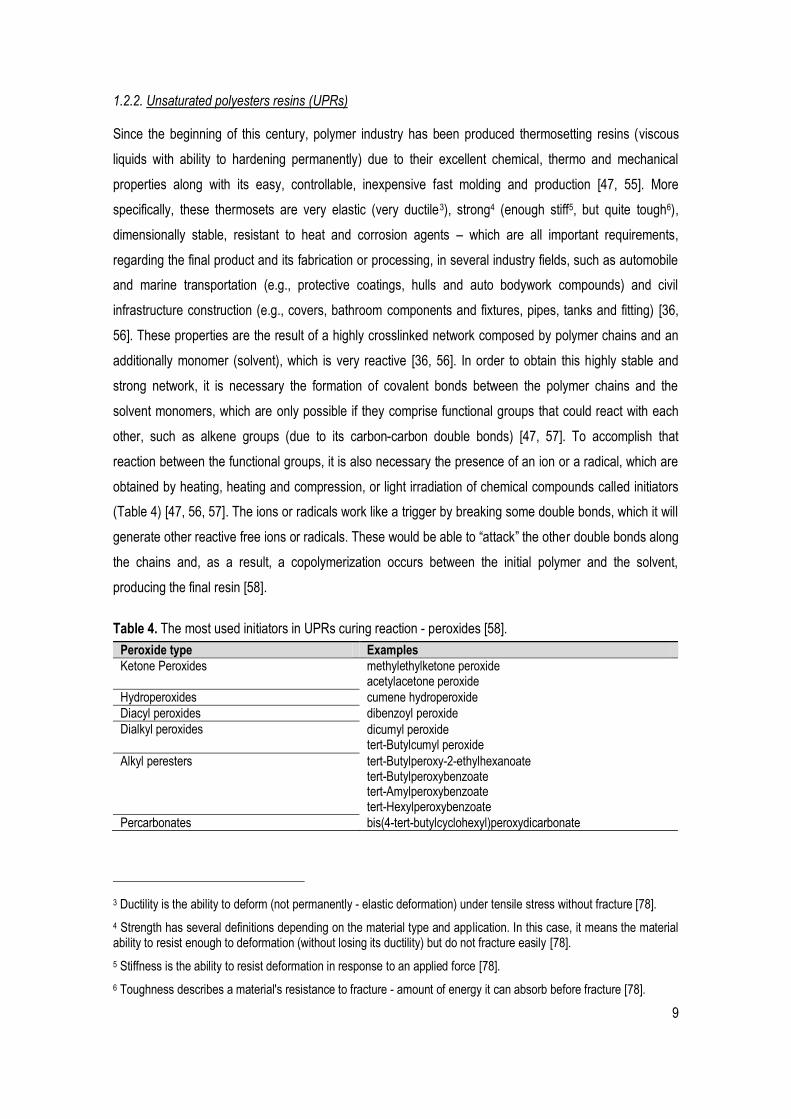
Table 4. The most used initiators in UPRs curing reaction - peroxides [58]. ................................................... 9
Table 5. The main petrochemical-based monomers used in UP synthesis and UPR curing reaction [36, 47, 58]. ................................................................................................................................................................ 11
Table 6. The reagents used in UPs and UPRs production and characterization. ......................................... 19
Table 7. The UPs formulations studied in this thesis. ..................................................................................... 21
Table 8. The compounds (diols and diacids) mass (m) used in each formulation and their reaction conditions (time (t) and temperature (T)). ........................................................................................................ 22
Table 9. The UPRs formulations and the percentage and masses of their compounds. ............................. 22
Table 10. Total time of reaction (t), final temperature (T) and acid value (AV) measured for each formulation.......................................................................................................................................................... 26
Table 11. FTIR wavenumber and structure of the main functional groups present in the monomers and UPs. Adapted from [47, 74]. .............................................................................................................................. 27
Table 12. Relative molar percentage of monomer used in the feed (F), calculated relative molar percentage of monomer present in each UP after synthesis (C) and the respective ratio between diols and diacids (Rd/d). ..................................................................................................................................................... 30
Table 13. Number average molecular weight (Mn) of each UPs and their polydispersity index (PDI), according to conventional calibration. .............................................................................................................. 31
Table 14. Characteristic quantities (average and standard deviation) obtained from TGA, DTGA and DSC data. Ton: extrapolated onset temperatures (TGA); T5%: temperature corresponding to 5% of mass loss; T10%: temperature corresponding to 10% of mass loss; Tp: peak temperature (DTGA); Tdeg: degradation temperature of the UPs (DSC). ......................................................................................................................... 32
Table 15. Glass transition temperature (Tg) of the UPs. ................................................................................. 33
Table 16. Gel content percentages of all thermal (T) and photocrosslinked (P) UPRs. ............................... 34
Table 17. Characteristic quantities (average and standard deviation) obtained from TGA, DTGA and DSC data. Ton: extrapolated onset temperatures (TGA); T5%: temperature corresponding to 5% of mass loss; T10%: temperature corresponding to 10% of mass loss; Tp: peak temperature (DTGA); Tdeg: degradation temperature of the UPRs (DSC). ...................................................................................................................... 38
Table 18. Main values obtained from DMTA data. Tg: glass transition temperature; E'-50ºC: modulus at -50ºC; E'0ºC: modulus at 0ºC; E'37ºC: modulus at 37ºC; E'50ºC: modulus at 50ºC. ............................................... 40
1
CHAPTER I. INTRODUCTION
1.1. Motivation
Over the last century, the exponential progress of technology, the fast and easy widespread of knowledge
and the success of interdisciplinary cooperation have encouraged the establishment of closest
relationships between several areas, such as Engineering and Medicine. The increase of the
interconnection of these two disciplines has led the scientific, industrial and medical communities to break
classic barriers and work together in common problems and challenges. As a result, achievements which
were very unlikely decades ago are now a reality, such as macro, micro and nano electronic devices
incorporated in living tissue/organs [1-3]; complete or partial artificial tissues and/or organs [4, 5]; super
lightweight and sensitive prostheses [5, 6, 7]; very efficient drug delivery systems [8, 9]; real-time
diagnostic imaging and non-imaging techniques [1, 10]; wireless vital signals monitoring
services/software/devices [1, 11]; long-lasting implants and transplants [1, 5, 6]; highly specific biosensors
[12, 13]; and sophisticated and improved surgery equipment [1, 14], among others. However, in this
interface, where the organic and inorganic components have to merge and work together, remains one of
the biggest challenges to fully overcome – an effective biocompatibility in biomedical applications.
According to Williams (2008), biocompatibility should be defined as „the ability of a biomaterial to perform
its desired function with respect to a medical therapy, without eliciting any undesirable local or systemic
effects in the recipient or beneficiary of that therapy, but generating the most appropriate beneficial cellular
or tissue response in that specific situation, and optimizing the clinically relevant performance of that
therapy.‟ [15]. A biocompatible material is no longer only a safe and stable material which does not harm
the living tissue, in other words, which is not toxic, thrombogenic, carcinogenic, irritant or a trigger to
inflammatory responses [15]. Nowadays, its ability to not release toxic substances/by-products
(bioinertness), or to release them, but in harmless concentrations (biotolerance), is not enough [16]. It is
required that “the third generation of biomaterials”, as some call it [17], be bioactive, which means that
they should be capable of performing positives interactions “with differentiation of tissue that leads to a
close adhesion and interconnection along the interface of implant and tissue” [16], and it depends not only
on the material, but on many others variables, such as application specific goals, biological conditions of
operation, kind of target tissue, local of implementation, patient physical condition, etc [15].
Along with this change of the paradigm, the concept of biodegradation has also gained a new value and
relevance in biomaterials due to the establishment of the idea of producing an implantable device or
prosthesis as an integrant part of the body - not only as a temporary substitute. This led to the
development of long-lasting applications or applications that “destroy” themselves when they are no longer
2
needed - thereby avoiding more surgery or invasive proceedings to the patient – particularly, in areas like
as tissue engineering and drug delivery systems [18-20].
It is also important to realize that the degradation/decomposing phenomenon is complex and non-
consensual. Some authors define biodegradable materials as “those that degrade both in vivo and in vitro
into products that are either normal metabolites in the human body or that could be eliminated from the
body with or without further metabolic transformations” [21]. Others consider that there are two different
phenomena with different terminology regarding this matter - the biodegradability and the bioresorbability.
Although they are usually used indistinctly, the first one refers to the materials ability of “decompose in the
living body”, where its degradation products “remain in long-term”, while the second one can be defined as
the materials ability of “degrade after implantation into non-toxic products, which are eliminated from the
body” [18]. However, it is agreeable that the capacity to perform their role and disintegrate in vivo without
harming the body, are two essential properties of biodegradable materials.
Polymers have been proving to be the most promising class of materials regarding these two issues -
biocompatibility and biodegradability - according to clinical experience over the last century [22].
Comparatively to the others classes of materials, polymers do not have the high strength, ductility and
resistance to wear of metals or the high resistance to corrosion, temperature and compression of
ceramics. However, they are much more versatile and overcome the main metals and ceramics
drawbacks, such as high stiffness and density (compared to living tissues), corrosion and low
biocompatibility/the release of toxic ions (metals); and brittleness, high density, low fracture strength, low
mechanical reliability and difficult processing (ceramics), respectively [22]. The ability of polymeric
materials to be easily modified to achieve diverse structures (shape and form) and properties (chemical
composition) that are present in the tissues of the body (Table 1), their large number and variety available
(Table 2), and their capacity to respond to stimulus (e.g., to absorb liquids/to swell, to change shape, to
degrade, etc.) are the main reasons for their widespread use [21, 22].
3
Table 1. Examples of different polymeric materials and their biomedical applications. Adapted from [16].
Polymer Application
Polyethylene Orthopaedic joint implants, syringes Polypropylene Heart valves, sutures, syringes Polydimethylsiloxane Breast implants contact lenses, heart valves, artificial hearts Polyethyleneterephthalate Vascular grafts, sutures, blood vessels Polymethylmethacrylate Bone cements, intraocular contact lenses, dental implants Polyethyleneglycol Pharmaceutical fillers, wound dressings Poly-2-hydroxylethylmethacrylate Contact lenses, urinary bladder catheter Polytetafluoroethylene Vascular grafts, sutures Polylactic-co-glycolic acid Resorbable meshes and sutures Poly-ε-caprolactone Drug delivery devices, sutures Polyvinylchloride Blood bags, blood tubes Polyisoprene Gloves Collagen Orthopedic and nerve repair matrices, tissue engineering matrices Hyaluronic acid Orthopedic repair matrices Glycosaminoglycan Orthopedic repair matrices Elastin Skin repair matrices Fibrin Hemostatic products, tissue sealants Chitosan Wound dressing Alginate Wound dressing
Polymers can be divided into natural and synthetic, depending on their origin (Table 2). Regarding
biocompatibility and biodegradability, natural polymers seem to be the most adequate to bio-applications
due to their chemical structure, which is very similar to the one present in all living organisms (cellular-
based structure), and their inherent capacity to degrade by enzymatic or hydrolytic mechanisms, that are
the most common phenomena of degradation in the body. However, the low versatility in what concerns
their synthesis/production methods (it is only possible to extract them and perform some modifications in
their structure); their associated health risks, as the possibility of carrying viral or bacterial infections and
immune problems; the randomness and instability of their properties, which depends on their extraction
and processing conditions; and, sometimes, the difficulty and high costs related to their
extraction/collection, have led the current research and investment towards synthetic polymers. Besides
the overcome of these drawbacks, polymers synthesized in laboratories also allow the combination of a
large range of formulations and the induction/manipulation of specific and important properties (e.g.,
hydrophobicity/hydrophilicity, crystallinity, solubility, glass transition temperature and melting temperature),
the monitoring and fine-control of the synthesis conditions/parameters, and a reliable reproducibility of
their synthesis process. However, the simultaneous improvement of mechanical properties, effective
biodegradability and long-lasting biocompatibility of several synthetic polymers remains an issue to
overcome [21, 23].
4
Table 2. Some examples of synthetic (a) and natural (b) polymers, including the five most used families of synthetic polymers nowadays - polyethylene (PE), polypropylene (PP), polyvinylchloride (PVC), polystyrene (PS) and polyethylene terephthalate (PET). Adapted from [24, 25].
Origin Type Examples ISO1 Abbreviation
Synthetic
Homopolymers
Polyethylene PE
Polypropylene PP Polystyrene PS
Polybutylene PB
Poly(methyl methacrylate) PMM
Polytetrafluoroethylene PTF
Poly(vinyl fluoride) PVF
Poly(vinylidene fluoride) PVDF
Poly(vinyl chloride) PV
Poly(vinylidene chloride) PVDC
Poly(vinyl acetate) PVAC Poly(vinyl butyral) PVB
Poly(ethylene terephthalate) PET
Polyetheretherketone PEEK
Polyacrylonitrile PAN
Polyethersulphone PESU
Polycarbonate PC
Poly(butylene terephthalate) PBTP
Polyoxymethylene POM
Polyamide PA
Polyacrylamide - Poly(phenylene oxide) PPO
Poly(phenylene sulphide) PPS
Epoxy EP
Polyurethane PUR
Polyisoprene rubber IR
Polychloroprene rubber CR
Silicone polymers SI
Copolymers and Hybrids
Acrylonitrile-butadiene-styrene ABS
Melamine-formaldehyde MF Phenol-formaldehyde PF
Urea-formaldehyde UF
Unsaturated polyester UP
Styrene-acrylonitrile SAN
Natural
Polysaccharides
Cellulose -
Amyloses, amylopectins -
Gums, mucopolysaccharides -
Proteins Gelatin, enzymes, muscle, collagen, silk -
Polynucleotides Deoxyribonucleic acid, ribonucleic acid DNA, RNA
Polyisoprenes Natural rubber, gutta-percha - Polyesters Poly(3-hydroxybutyrate), cork PHB, -
Lignins Cell walls, binder (for cellulose fibers) -
Along with these scientific challenges, society‟s concerns about health care and environmental
sustainability have also increased, claiming their importance in the future and, thereby, beginning to have
a serious effect on industrial and economic fields [26-28]. In Europe, for example, an investment of €220
1 International Organization for Standardization.
5
million is being estimated between 2007 and 2013 in biomedical areas, including “implanted
biomaterials/tissue engineering” [29]. Moreover, there are in motion political programs (such as
Sustainable Process Industry through Resource and Energy Efficiency (SPIRE) or Horizon 2020) and the
creation of association/groups (such as European Renewable Resources and Materials Association
(ERRMA) or Cleantech Group) which supports and promote “the deployment of innovative technologies
and solutions required to reach long term sustainability for Europe and its process industries in terms of
global competitiveness, ecology and employment.” [30-32].
In conclusion, these are the main reasons that compose the motto of this thesis – the improvement of
biocompatibility and biodegradability in biomedical applications by using “green” biomaterials and
innovative technology and thereby following the recent trends of the investment in health care.
1.2. State of the art
1.2.1. Polyesters
Polyesters are the class of polymers most developed over the last two decades, due to their immense
diversity and versatility (Table 3) [23, 33].
Table 3. The main family of polyesters currently used in industry and scientific research and some of its main properties and applications. Adapted from [34, 35].
Polyester family Main chain composition
Origin Current applications
Polylactide (PLA)
aliphatic synthetic (bio/agro-resources)
packaging, agriculture, biomedicine
Polycaprolactone (PCL)
aliphatic synthetic (fossil resources)
modeling, prototyping, biomedicine
Polyhydroxyalkanoate (PHA)
aliphatic naturally produced (microbial production)
food, packaging, pharmaceutics, biomedicine
Polyglycolic acid (PGA)
aliphatic synthetic (bio/agro-resources)
food packaging, biomedicine
Polyethylene terephthalate (PET)
aromatic synthetic (fossil resources)
modeling, prototyping, packaging, electronics
The most used group of polymers to produce biodegradable materials nowadays (in both areas of
medicine and environment) is aliphatic polyesters, because their ester linkages are inherently
biodegradable (Figure 1) [26, 33, 36].
6
Figure 1. Bioplastics production capacity in 2011, according to European Bioplastics [37].
In addition, they also present high biocompatibility while used in biomedical applications, which have been
turning it into the most promising type of synthetic biodegradable polymers in this field [38]. However,
usually polyesters with good biodegradability and biocompatibility show a lack of others important
properties (e.g., poor mechanical and thermal properties) or high costs, and vice versa. Two good
examples of this contrasting phenomenon are PHAs and PETs: the first one is generally expensive and
has low resistance to fracture and thermal degradation, but is also very elastomeric and has been
recognized as biocompatible and biodegradable; the second one is widely used in several areas of
industry and shows high thermal stability and very good physico-mechanical performance (due to its
aromatic rings), but is not promising when used in biomedical applications, due to its insensitivity to
biodegradation and weak performance in cellular adhesion and proliferation [26, 39].
The current challenge is to modify these polyesters in order to improve and adapt their properties, such as
biological, mechanical, thermal and chemical ones, towards the needs and targets of each biomedical
application in which they are involved [40, 41]. There are three main strategies followed nowadays in order
to achieve that: the combination of polyesters with others different materials; the adoption of more
advantageous and efficient synthesis methods; and the use of additives after polyester synthesis.
Sometimes, the combination of two or three of these strategies is carried out, but it is not always a current
practice because their operational conditions are often not compatible/well-matched or the associated
costs are higher [33, 42, 43].
Regarding the first one, many approaches have been tried, such as (i) the use of more than one type of
monomers (copolymers production) [34], (ii) the combination of different polyesters families or/and its
derivatives, or even, other additives (e.g., processing additives, such as erucamide, silicon dioxide and

7
calcium carbonate) [44], (iii) the mixture with others classes of synthetic polymers (e.g., polyurethanes or
polyamides) or natural polymers (e.g., chitosan) [42, 45], (iv) the blend with metallic or ceramic materials
(composites production) [22], and (v) the insertion of nanomaterials in the polyester matrix or the
production of polyester nanomaterials [20, 27]. In all these cases, the idea is to combine the desirable
properties those materials offer with the original polyester, controlling their percentages in the formulation,
according to the attributes required for the final application. For example, it is known that amide groups
have strong hydrogen-bonding interactions between themselves and also that any material can achieve
unique properties (e.g., stiffness, permeability, crystallinity, thermal stability) when produced in nano scale.
Thus, if a weak polymer (as aliphatic polyesters) can be synthesized successfully holding ester and amide
groups (poly(ester amide)) or nano-sized particles/fillers, it will probably present improved thermo-
mechanical properties [27, 42]. Another example is the incorporation of functional groups into polymers
during their synthesis – functionalization. If a polyester/copolyester is prepared as a functional material2,
its properties, such as crystallinity, hydrophilicity and solubility, will be modified. It has been demonstrated
that a decrease in crystallinity and an increase in hydrophilicity and solubility are the key to improve
biological properties such as biodegradation, biocompatibility and/or cell adhesion and proliferation [40,
41]. Moreover, functionalization also seems to enhance the possibility of crosslinking, due to the presence
of more „exposed‟ and reactive chemical groups [40, 46]. Thus, successfully functionalized-polyesters
(e.g., hydroxyl-terminated aliphatic polyesters) could present improved biological and chemical properties,
which have also already been accomplished [40, 41, 46]. It is also important to mention that unsaturated
polyesters (UPs) are the most used polyesters in this approach, among others, due to their carbon-carbon
double bonds [41, 46], as it will be further discussed in the following section.
About the second strategy, polyesters are usually synthesized by (i) a polycondensation reaction (PC)
(reversible step-growth polymerization process), i.e., polyesterification of hydroxyacids or diols and diacids
(or diacid derivatives), in this case; or by a ring-opening polymerization reaction (ROP) (opening cyclic
monomers process) of lactones, glycolides or lactides (Figure 2) [21, 23]. However, according to recently
literature [23, 49], the ROP seems to be the only method which allows the synthesis of polyesters with
high molecular weight, an inherent variable/characteristic which improve thermo-mechanical properties
[34]. Polymers with high molecular weights can only be obtained at very high conversions rates (98–99%)
in polymerization reactions, which is very difficult to achieve in PC due to its side-reactions and deficient
water removal [23, 34]. These two phenomena are difficult to avoid completely and impairs the precise
stoichiometric equilibrium required between the reactants (acid and hydroxyl groups) to achieve a high
degree of polymerization [34]. Furthermore, PC reactions require high temperature (100 to 200ºC), long
reaction times (10 to 20 hours) and an efficient and continuous removal of reaction by-products (to
guarantee that reaction occurs only in the forward orientation) to obtain polymers with useful
2 Monomer with very reactive functional groups - due to their stereochemical locations [69].
8
characteristics [34, 49]. On the contrary, ROP allows the production of high-molecular weight aliphatic
homo and co-polyesters without the removal of any reaction by-products. Nevertheless, ROP has some
drawbacks, namely, the requirement of monomers with high purity, which are oftentimes difficult to prepare
or very expensive [46, 50, 51]. In both methods, the presence of initiators and catalysts is usual, which
improve the control over the reaction and others parameters such as molecular weight distribution of the
polymer [33, 34]. Thus, regarding each methods specifications and characteristics, it is possible to
manage bulk properties such as molecular weight, crystallinity, solubility, and glass transition temperature,
among others, regarding the polymer final purpose [23].
a)
b)
Figure 2. Schematic illustration of polycondensation (PC) (a) and ring-opening polymerization (ROP) (b) reactions. Adapted from [47, 48].
Finally, concerning the third strategy, many substances have been added to polymers after synthesis in
order to protect, improve or simply change their characteristics, without alter their original structure or
increase to much their cost. Those substances can be (i) plasticizers, if the goal is the increase of material
plasticity or fluidity; (ii) stabilizers, if the challenge is the prevention of unwanted chemical modifications;
(iii) surfactants, if the purpose is to decrease the surface tension; (iv) property modifiers, if the aim is to
improve some mechanical and/or chemical properties; (v) pigments, if the color or texture must change;
(vi) additives with bioactivity purpose, if the need is the improvement of biocompatibility or cell adhesion;
or (vii) curing agents, if the intention is to enhance dimensional stability, processability and physical
properties [52-54]. Despite all the options and considering the class of polyesters, the curing monomers
have been one of the most used additives and have shown very efficient results in several industrial and
scientific fields. Therefore, they will be deeper discussed in the following section.
9
1.2.2. Unsaturated polyesters resins (UPRs)
Since the beginning of this century, polymer industry has been produced thermosetting resins (viscous
liquids with ability to hardening permanently) due to their excellent chemical, thermo and mechanical
properties along with its easy, controllable, inexpensive fast molding and production [47, 55]. More
specifically, these thermosets are very elastic (very ductile3), strong4 (enough stiff5, but quite tough6),
dimensionally stable, resistant to heat and corrosion agents – which are all important requirements,
regarding the final product and its fabrication or processing, in several industry fields, such as automobile
and marine transportation (e.g., protective coatings, hulls and auto bodywork compounds) and civil
infrastructure construction (e.g., covers, bathroom components and fixtures, pipes, tanks and fitting) [36,
56]. These properties are the result of a highly crosslinked network composed by polymer chains and an
additionally monomer (solvent), which is very reactive [36, 56]. In order to obtain this highly stable and
strong network, it is necessary the formation of covalent bonds between the polymer chains and the
solvent monomers, which are only possible if they comprise functional groups that could react with each
other, such as alkene groups (due to its carbon-carbon double bonds) [47, 57]. To accomplish that
reaction between the functional groups, it is also necessary the presence of an ion or a radical, which are
obtained by heating, heating and compression, or light irradiation of chemical compounds called initiators
(Table 4) [47, 56, 57]. The ions or radicals work like a trigger by breaking some double bonds, which it will
generate other reactive free ions or radicals. These would be able to “attack” the other double bonds along
the chains and, as a result, a copolymerization occurs between the initial polymer and the solvent,
producing the final resin [58].
Table 4. The most used initiators in UPRs curing reaction - peroxides [58].
Peroxide type Examples
Ketone Peroxides methylethylketone peroxide acetylacetone peroxide
Hydroperoxides cumene hydroperoxide
Diacyl peroxides dibenzoyl peroxide
Dialkyl peroxides dicumyl peroxide tert-Butylcumyl peroxide
Alkyl peresters tert-Butylperoxy-2-ethylhexanoate tert-Butylperoxybenzoate tert-Amylperoxybenzoate tert-Hexylperoxybenzoate
Percarbonates bis(4-tert-butylcyclohexyl)peroxydicarbonate
3 Ductility is the ability to deform (not permanently - elastic deformation) under tensile stress without fracture [78].
4 Strength has several definitions depending on the material type and application. In this case, it means the material ability to resist enough to deformation (without losing its ductility) but do not fracture easily [78].
5 Stiffness is the ability to resist deformation in response to an applied force [78].
6 Toughness describes a material's resistance to fracture - amount of energy it can absorb before fracture [78].

10
This whole process is also known as curing reaction and it is not as simple as it seems. It comprises two
solidification phases – gelation and vitrification – and two more sub-reactions – polymer and solvent
homopolymerization – which are worth to be considered (Figure 3).
Figure 3. Schematic illustration of a curing reaction and its steps – from unlinked chains to gel formation. Adapted from [57, 59].
The gelation consists in a liquid (sol phase7) to rubber (gel phase8) transition controlled by the kinetics of
the reaction, in which the resin molecular weight and viscosity increases considerably. After gelation,
chains begin to lose their mobility (due to the increase of cross-linked network density) and a diffusion-
controlled rubber-glass transition occurs – vitrification. This is an important stage since it determines the
rate and degree of the reaction conversion and enables some modifications on the structure and
properties of final resin [47, 57].
Regarding the sub-reactions, it is also relevant to notice that, besides the copolymerization between the
polymer and the solvent, covalent bonds are also created within polymer chains or between the solvent
monomer (Figure 4). These homopolymerization reactions have different kinetics and affect in different
ways the macro and micro structure of the final crosslinked network [47].
7 The phase in which the material is a fluid solution [79].
8 The phase in which the material is a jelly-like diphasic system or network - with both liquid and solid phases – highly viscous [79].
11
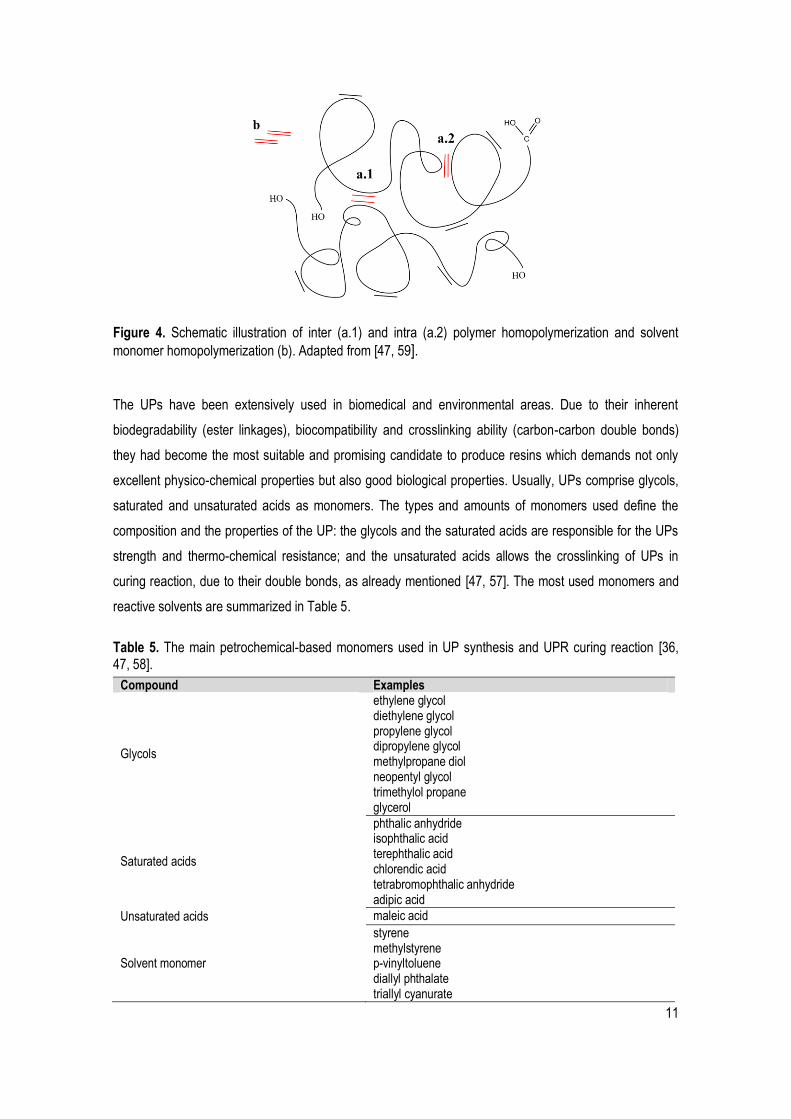
Figure 4. Schematic illustration of inter (a.1) and intra (a.2) polymer homopolymerization and solvent
monomer homopolymerization (b). Adapted from [47, 59].
The UPs have been extensively used in biomedical and environmental areas. Due to their inherent
biodegradability (ester linkages), biocompatibility and crosslinking ability (carbon-carbon double bonds)
they had become the most suitable and promising candidate to produce resins which demands not only
excellent physico-chemical properties but also good biological properties. Usually, UPs comprise glycols,
saturated and unsaturated acids as monomers. The types and amounts of monomers used define the
composition and the properties of the UP: the glycols and the saturated acids are responsible for the UPs
strength and thermo-chemical resistance; and the unsaturated acids allows the crosslinking of UPs in
curing reaction, due to their double bonds, as already mentioned [47, 57]. The most used monomers and
reactive solvents are summarized in Table 5.
Table 5. The main petrochemical-based monomers used in UP synthesis and UPR curing reaction [36, 47, 58].
Compound Examples
Glycols
ethylene glycol diethylene glycol propylene glycol dipropylene glycol methylpropane diol neopentyl glycol trimethylol propane glycerol
Saturated acids
phthalic anhydride isophthalic acid terephthalic acid chlorendic acid tetrabromophthalic anhydride adipic acid
Unsaturated acids maleic acid
Solvent monomer
styrene methylstyrene p-vinyltoluene diallyl phthalate triallyl cyanurate
12
Despite its easy extraction and low cost, the majority of these monomers are toxic or very toxic [47]. At the
beginning, that was an irrelevant fact, since their applications were related to construction and
transportation industries, where biocompatibility and biodegradability were uninteresting properties.
However, in the last years biodegradability started to be a concern due to the social and economical
sustainability and biocompatibility become an essential subject in current medical applications. These
issues encouraged industry community to begin investing and exploring other type of solutions – more
“bio” and “green” ones [60-62].
1.2.3. Polymers and monomers from renewable sources
The current energy crisis has been changing the social and industrial mindset. Since they became aware
of the real unavailability of fossil resources in the near future and its contribution to the perpetuation of
environmental problems (e.g., pollution, contamination, increasing emission of green house gases, etc.),
alternatives solutions (e.g., nuclear, biomass, combustion, aeolian and geothermal sources) have been
explored towards a more sustainable industrial and technological development. The constant increase of
oil prices and the current “green” social trend have been the main triggers to overcome the massive use of
petrochemical products, which lasts since the Second World War [61, 63]. Petrol, natural gas and coal
have been not only the responsible for 90% of fuels produced and used nowadays, but also for the
production of the vast majority of the synthetic polymers and organic chemicals. Despite the vast range of
alternatives solutions and its recent improvements, biomass (i.e., renewable vegetable and animal
counterparts) is the only valid substitute to the production of commodity polymers [61].
According to Belgacem and Gandini (2008), a renewable resource is “any animal or vegetable species
which is exploited without endangering its survival and which is renewed by biological (short term) instead
of geochemical (very long term) activities” and can be divided in three main groups based on its origin:
vegetable, animal and bacterial. Regarding vegetable sources, they comprise (i) wood and its components
(e.g., cellulose, lignin, hemicelluloses, tannins, rosins, and terpenes), and (ii) annual plants (e.g., starch,
vegetable oils, hemicelluloses, mono and disaccharides and algae). They were indeed the renewable
resources used to manufacture the first renewable-based plastics (e.g., natural rubber for tires, cellulose
acetate and nitrate and plant-based dyes) at the beginning of the 20th century and are the most used class
of renewable resource nowadays in sectors such as papermaking, cotton textiles, reinforcing agents, fuel,
food additives, synthetic resins, adhesives, dyes, pharmaceuticals and cosmetics [60, 61]. About animal
resources, chitin/chitosan, proteins and cellulose whiskers from mollusks are the most explored
compounds and have been largely used in biomaterial and biomedical areas. Concerning bacterial
sources, PHAs and bacterial cellulose have begun to be more exploited in the last years in polymer
science and industry in order to be applied in almost every biotechnology area due its excellent biological
13
properties [61]. Although the drawbacks of natural polymers discussed before are still considered, the
excellent biological properties of animal and bacterial sources have gained importance in several
industries.
Thus, besides the key to the depletion of petrochemical feedstock, renewable resources present other
interesting characteristics applicable in other areas, such as environment and biomedicine. Despites the
abundance, variety, spontaneous origin and inexpensive extraction (comparing to the petrochemicals) of
these natural compounds, their high potential biocompatibility and biodegradability have been the most
valued properties nowadays, particularly regarding the specific case that has been discussed in this
chapter – UPs and UPRs [55, 56, 63, 64]. Currently, it can be found (i) naturally occurring polyesters and
also several (ii) monomers from renewable resources suitable to synthesize new polyesters (not
necessarily from natural polyesters). Indeed, the actual novelty lies on the exploitation and use of these
monomers and/or the monomeric compounds of the natural polyesters, since the latter, as a whole, are
only capable of being modified (not used to synthesize new polymers) [61].
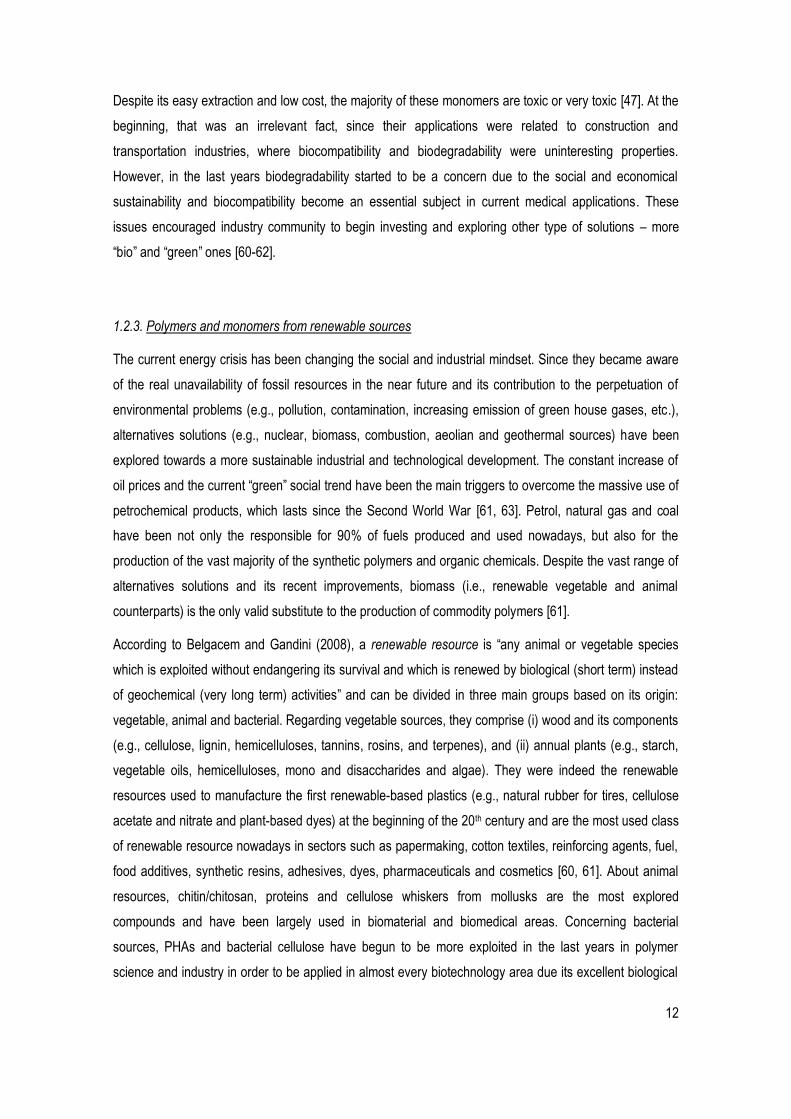
Naturally occurring polyesters
PHAs (Figure 5a) and suberin (Figure 5b) are the two main families of natural polyesters. The first one is
produced by bacteria as an energy reserve and has very good biological (100% biodegradable), physical
(mechanical strength and modulus) and chemical (high crystallinity, high melting temperature and good
resistance to organic solvents) properties. However, its production rate is low and its production conditions
are difficult to control - depending on the type of bacteria and its feeding, and the environmental
conditions. The most common and simplest of the PHAs, PHB, was already used in food packing and
plastic bags or bottles (due to its excellent barrier properties against gas permeation) and considered a
potential substitute of PET in some applications. But its most recent exploitation has been made in the
pharmaceutical and biomedical areas, in particularly, tissue engineering (e.g., scaffolds and bone repairs
materials) and controlled drug delivery systems (due to biodegradability and biocompatibility) [61].
(a) (b)
Figure 5. The general formula of poly(hydroxyalkanoates) (a) and a schematic representation of the structure of suberin (b) – natural polyesters [61].
14
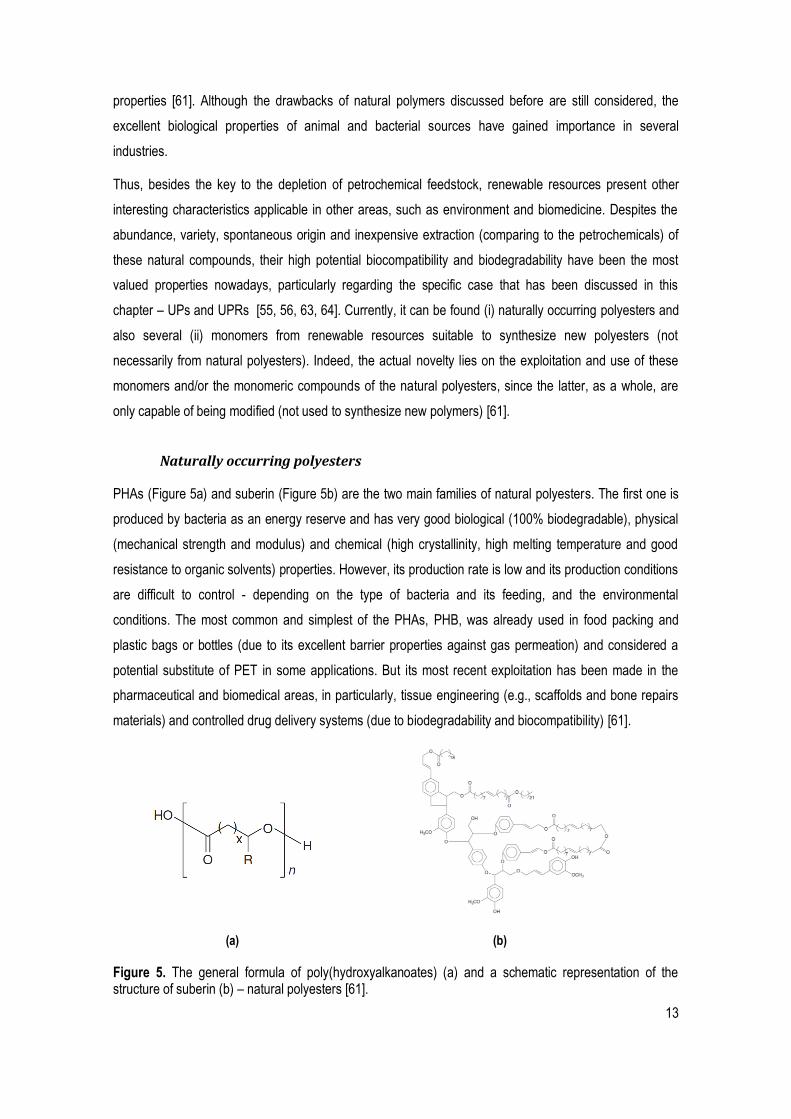
About suberin, it is an aromatic-aliphatic crosslinked polyester and the main component of cork. In
contrast with PHAs, it is not much used as a whole polyester (due to its complex structure). Instead, its
very long aliphatic moieties and interesting monomeric compounds are the most exploited issue in order to
develop macromonomers useful in polymer synthesis, in particular, polyesters. Liquid polyols and
dicarboxylic acids (and also ω,hydroxyfatty acids) - the two essential constituents of polyesters - are
obtained by oxypropylation9 of cork (Figure 6) and by depolymerization10 of suberin, respectively [61].
Figure 6. Schematic view of the oxypropilation of OH-bearing macromolecular materials [61].
Monomers from other renewable resources
Rosin, lignin and vegetable oils, along with monomers such as sugar-based monomers and furan-based
monomers, have been extensively studied regarding polyester synthesis [61-63].
Rosin is the most common wood resin extracted from pine trees and it contains a several unsaturated
polycyclic carboxylic acids, commonly known as resin acids, which are currently isolated and used to
synthesize or functionalize new polymers, including polyesters [61]. Resins acids are diterpenic11 mono-
carboxylic acids derived from four main carbon skeletons, which differ in the position of their instaurations:
abietane, pimarane, isopimarane labdane. The most commons are pimarane and abietane skeletons
(Figure 7), which generate acids such as, respectively, pimaric, isopimaric and sandaracopimaric acids;
and abietic, neoabietic, levopimaric, palustric and dehydroabietic acids. These acids are usually combined
with other substances (e.g., maleic anhydride, fumaric acid, acrylonitrile, acrylic acid, vinyl acetate and
9 Process in which the OH groups tied to the substrate are deprotonated by a nucleophilic catalyst, generating oxianions. These oxianions initiate the anionic polymerization of propylene oxides and, therefore, the respective stereochemical availability of the OH groups [61].
10 Process of converting a polymer into a monomer or a mixture of monomers [61].
11 Organic compound produced by plants and composed by four isoprene units [61].
15
formaldehyde) in order to form monomers which can be used as diacids in polyesters synthesis and UPRs
production [61].
Figure 7. Structures of the some common pirame and abietane-type resin acids [61].
Lignin is an amorphous, irregular and complex organic molecule found in wood matrix and presents a high
number of aliphatic and phenolic hydroxyl groups (Figure 8). Its oxypropilation originates liquid polyols,
which are useful in polyesters synthesis, and several other chemical modifications leads to further
blending with aliphatic polyesters in order to produced lignin with ether and ester moieties -
macromonomers used in other polymer synthesis [61].
Figure 8. Lignin main moieties in a typical macromolecular assembly [61].
16
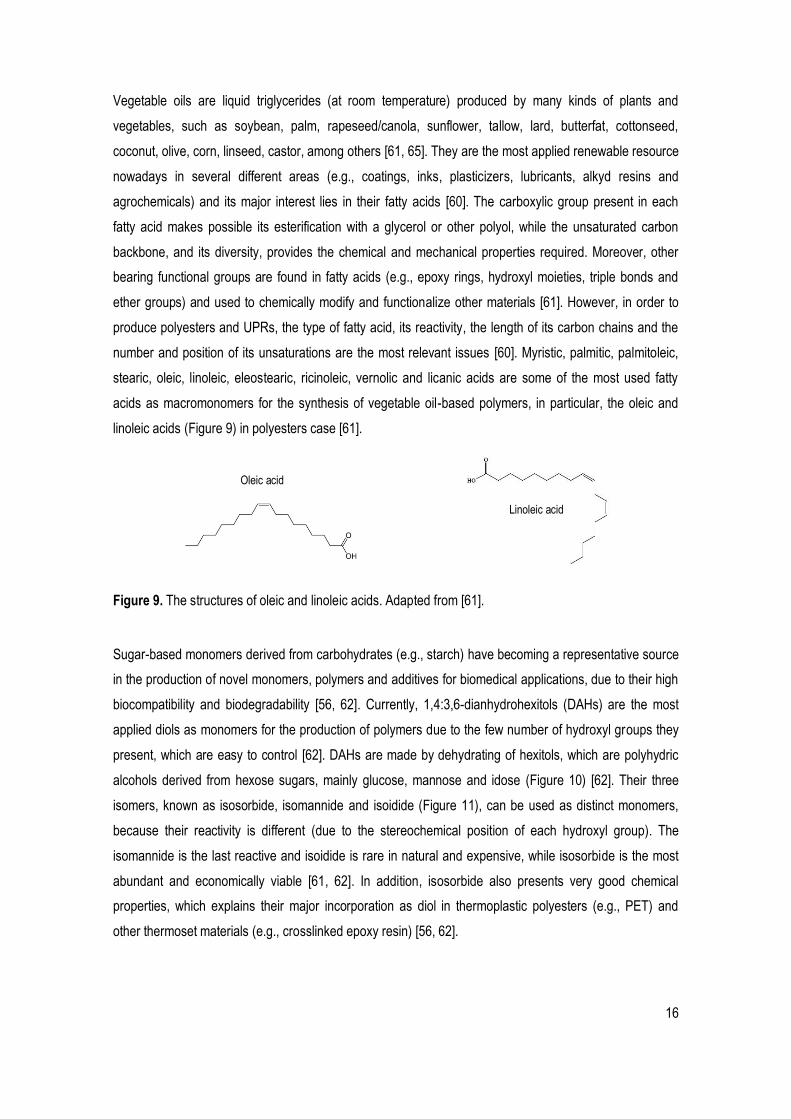
Vegetable oils are liquid triglycerides (at room temperature) produced by many kinds of plants and
vegetables, such as soybean, palm, rapeseed/canola, sunflower, tallow, lard, butterfat, cottonseed,
coconut, olive, corn, linseed, castor, among others [61, 65]. They are the most applied renewable resource
nowadays in several different areas (e.g., coatings, inks, plasticizers, lubricants, alkyd resins and
agrochemicals) and its major interest lies in their fatty acids [60]. The carboxylic group present in each
fatty acid makes possible its esterification with a glycerol or other polyol, while the unsaturated carbon
backbone, and its diversity, provides the chemical and mechanical properties required. Moreover, other
bearing functional groups are found in fatty acids (e.g., epoxy rings, hydroxyl moieties, triple bonds and
ether groups) and used to chemically modify and functionalize other materials [61]. However, in order to
produce polyesters and UPRs, the type of fatty acid, its reactivity, the length of its carbon chains and the
number and position of its unsaturations are the most relevant issues [60]. Myristic, palmitic, palmitoleic,
stearic, oleic, linoleic, eleostearic, ricinoleic, vernolic and licanic acids are some of the most used fatty
acids as macromonomers for the synthesis of vegetable oil-based polymers, in particular, the oleic and
linoleic acids (Figure 9) in polyesters case [61].
Figure 9. The structures of oleic and linoleic acids. Adapted from [61].
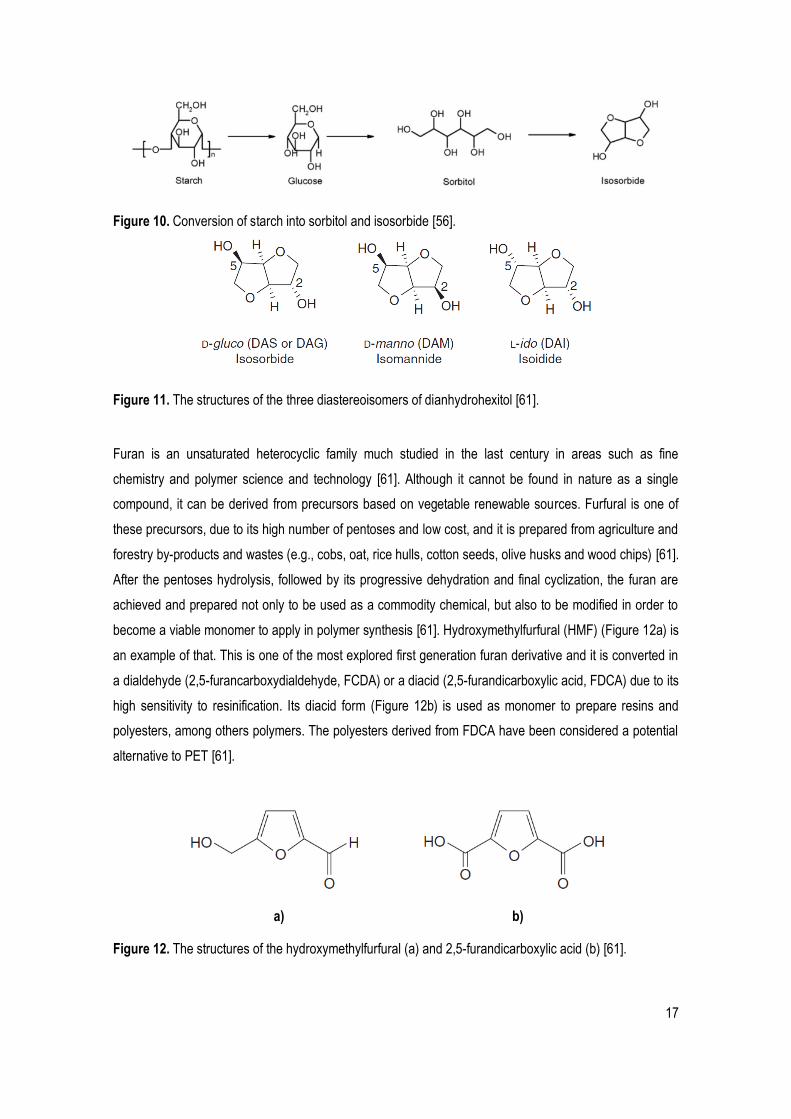
Sugar-based monomers derived from carbohydrates (e.g., starch) have becoming a representative source
in the production of novel monomers, polymers and additives for biomedical applications, due to their high
biocompatibility and biodegradability [56, 62]. Currently, 1,4:3,6-dianhydrohexitols (DAHs) are the most
applied diols as monomers for the production of polymers due to the few number of hydroxyl groups they
present, which are easy to control [62]. DAHs are made by dehydrating of hexitols, which are polyhydric
alcohols derived from hexose sugars, mainly glucose, mannose and idose (Figure 10) [62]. Their three
isomers, known as isosorbide, isomannide and isoidide (Figure 11), can be used as distinct monomers,
because their reactivity is different (due to the stereochemical position of each hydroxyl group). The
isomannide is the last reactive and isoidide is rare in natural and expensive, while isosorbide is the most
abundant and economically viable [61, 62]. In addition, isosorbide also presents very good chemical
properties, which explains their major incorporation as diol in thermoplastic polyesters (e.g., PET) and
other thermoset materials (e.g., crosslinked epoxy resin) [56, 62].
Oleic acid
Linoleic acid
17
Figure 10. Conversion of starch into sorbitol and isosorbide [56].
Figure 11. The structures of the three diastereoisomers of dianhydrohexitol [61].
Furan is an unsaturated heterocyclic family much studied in the last century in areas such as fine
chemistry and polymer science and technology [61]. Although it cannot be found in nature as a single
compound, it can be derived from precursors based on vegetable renewable sources. Furfural is one of
these precursors, due to its high number of pentoses and low cost, and it is prepared from agriculture and
forestry by-products and wastes (e.g., cobs, oat, rice hulls, cotton seeds, olive husks and wood chips) [61].
After the pentoses hydrolysis, followed by its progressive dehydration and final cyclization, the furan are
achieved and prepared not only to be used as a commodity chemical, but also to be modified in order to
become a viable monomer to apply in polymer synthesis [61]. Hydroxymethylfurfural (HMF) (Figure 12a) is
an example of that. This is one of the most explored first generation furan derivative and it is converted in
a dialdehyde (2,5-furancarboxydialdehyde, FCDA) or a diacid (2,5-furandicarboxylic acid, FDCA) due to its
high sensitivity to resinification. Its diacid form (Figure 12b) is used as monomer to prepare resins and
polyesters, among others polymers. The polyesters derived from FDCA have been considered a potential
alternative to PET [61].
a) b)
Figure 12. The structures of the hydroxymethylfurfural (a) and 2,5-furandicarboxylic acid (b) [61].

18
Although petro-based chemicals are still rooted in the major chemical production, the examples discussed
have been demonstrating the promising viability of the known “green” and “bio-refining” concepts in the
future of polymer science and industry. Particularly, in polymeric biomaterials sector, this seems to be an
excellent opportunity to exploit a potential and significant improvement in the biocompatibility and
biodegradability approaches of many biomedical applications.

19
CHAPTER I I. MATERIALS AND METHODS
2.1. Materials
The reagents used to prepare, produce and characterize the UPs and UPRs are presented and divided
based on their function in Table 6.
Table 6. The reagents used in UPs and UPRs production and characterization.
Function Name Abbr. M.W.1 Purity Source
UP Synthesis
Diacids
Fumaric acid FA 116,07 99.0% Sigma-Aldrich
Itaconic acid IA 130,10 99.0% Acros Organics
Sebacic acid SA 202,25 94.5% Sigma-Aldrich
Diols
Isosorbide IB 146,14 98.0% Sigma-Aldrich
Diethylene glycol DG 106,12 99.0% Sigma-Aldrich
Propylene glycol PG 76,09 99.0% Sigma-Aldrich
1,3 Propanediol PDO 76,09 98.0% TCI Europe
Inhibitor Hydroquinone HQ 110,11 99.0% AnalaR
Curing Reactions
Solvent 2-Hydroxyethylmethacrylate HEMA 130,14 97.0% Acros Organics Initiator (thermal)
Benzoyl peroxide BPO 242,23 97.0% Fluka Analytical
Initiator (photo)
Irgacure 2959 Ir-2959 224,30 - Ciba Specialty Chemicals
Acid Value Determination
Base Potassium Hydroxide KOH 56,10 85.0% Sigma-Aldrich
Solvent Ethanol EtOH 46,07 96.0% Panreac
Indicator Phenolphthalein - 318,32 - RPE
Characterization
Solvent Tetrahydrofuran THF 72,11 99.0% Fisher Chemical Solvent Deuterated tetrahydrofuran d8-THF 80,16 99.5% Eurositop
Buffer Phosphate buffered saline tablets
PBS - - Sigma (Aldrich)
Buffer Sodium azide NaN3 65,01 99.0% Panreac 1 Molecular weight.
2.2. Methods
2.2.1. UPs synthesis
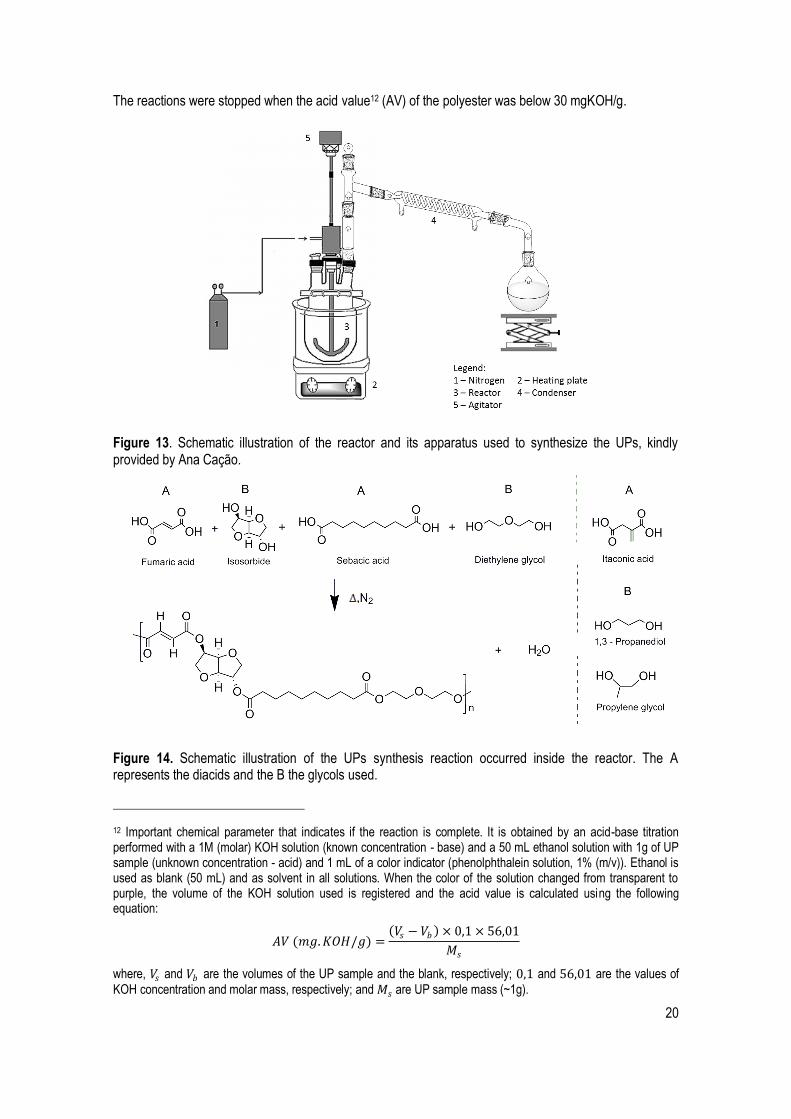
The UPs were prepared by a bulk polycondensation reaction, performed in a four head reactor (250 mL)
and equipped with a mechanical stirrer (700 rpm), a nitrogen inlet with constant flow, and a condenser
attached to a round-bottom flask to collect the water (Figure 13).
The diacids, the diols (Figure 14) and the inhibitor (to prevent premature crosslinking) were put in the
reactor and were heated up around 180 to 200ºC during 11 to 18 hours (depending on each formulation).
20
The reactions were stopped when the acid value12 (AV) of the polyester was below 30 mgKOH/g.
Figure 13. Schematic illustration of the reactor and its apparatus used to synthesize the UPs, kindly provided by Ana Cação.
Figure 14. Schematic illustration of the UPs synthesis reaction occurred inside the reactor. The A represents the diacids and the B the glycols used.
12 Important chemical parameter that indicates if the reaction is complete. It is obtained by an acid-base titration performed with a 1M (molar) KOH solution (known concentration - base) and a 50 mL ethanol solution with 1g of UP sample (unknown concentration - acid) and 1 mL of a color indicator (phenolphthalein solution, 1% (m/v)). Ethanol is used as blank (50 mL) and as solvent in all solutions. When the color of the solution changed from transparent to purple, the volume of the KOH solution used is registered and the acid value is calculated using the following equation:
𝐴𝑉 (𝑚𝑔.𝐾𝑂𝐻/𝑔) = 𝑉𝑠 −𝑉𝑏 × 0,1 × 56,01
𝑀𝑠
where, 𝑉𝑠 and 𝑉𝑏 are the volumes of the UP sample and the blank, respectively; 0,1 and 56,01 are the values of KOH concentration and molar mass, respectively; and 𝑀𝑠 are UP sample mass (~1g).
21
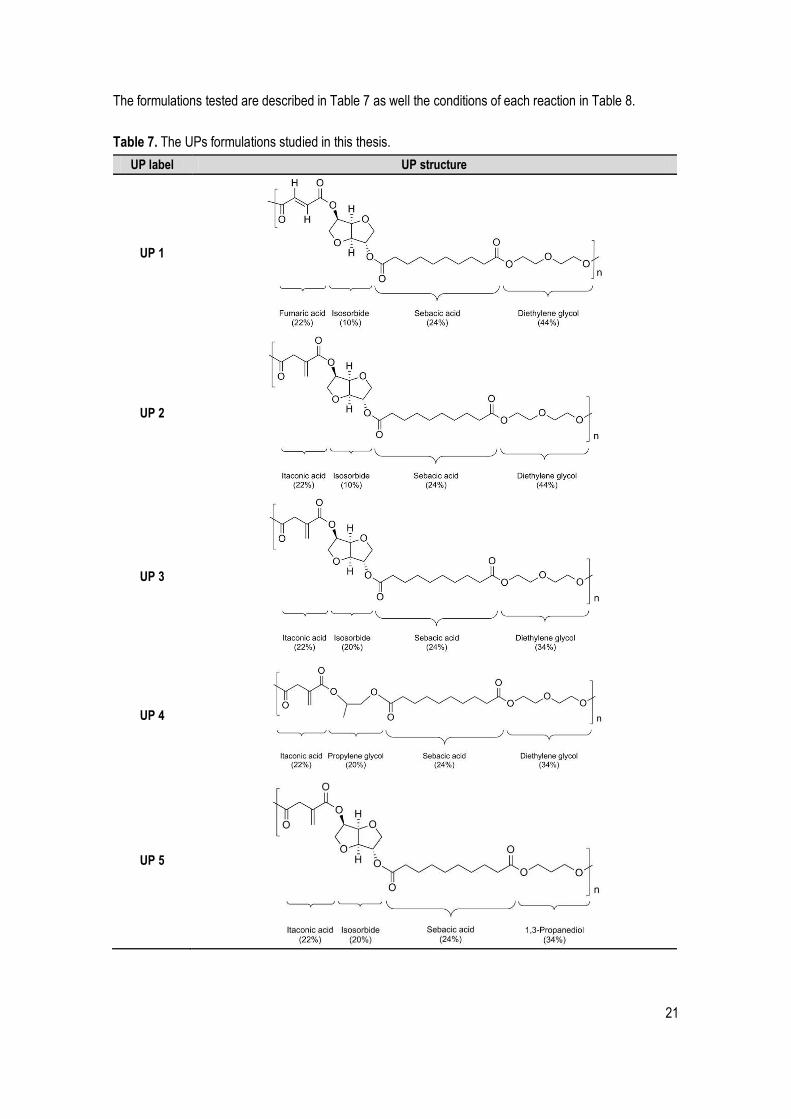
The formulations tested are described in Table 7 as well the conditions of each reaction in Table 8.
Table 7. The UPs formulations studied in this thesis.
UP label UP structure
UP 1
UP 2
UP 3
UP 4
UP 5
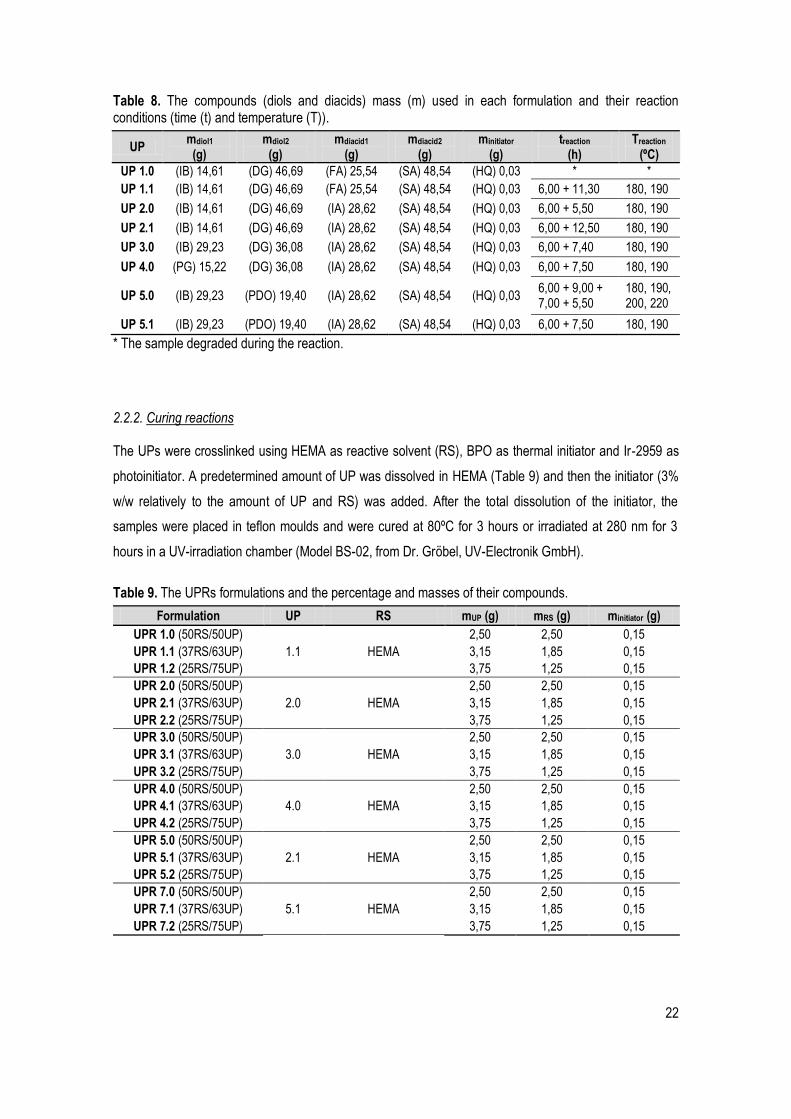
22
Table 8. The compounds (diols and diacids) mass (m) used in each formulation and their reaction conditions (time (t) and temperature (T)).
UP mdiol1
(g) mdiol2
(g) mdiacid1
(g) mdiacid2
(g) minitiator
(g) treaction
(h) Treaction
(ºC)
UP 1.0 (IB) 14,61 (DG) 46,69 (FA) 25,54 (SA) 48,54 (HQ) 0,03 * *
UP 1.1 (IB) 14,61 (DG) 46,69 (FA) 25,54 (SA) 48,54 (HQ) 0,03 6,00 + 11,30 180, 190
UP 2.0 (IB) 14,61 (DG) 46,69 (IA) 28,62 (SA) 48,54 (HQ) 0,03 6,00 + 5,50 180, 190
UP 2.1 (IB) 14,61 (DG) 46,69 (IA) 28,62 (SA) 48,54 (HQ) 0,03 6,00 + 12,50 180, 190
UP 3.0 (IB) 29,23 (DG) 36,08 (IA) 28,62 (SA) 48,54 (HQ) 0,03 6,00 + 7,40 180, 190
UP 4.0 (PG) 15,22 (DG) 36,08 (IA) 28,62 (SA) 48,54 (HQ) 0,03 6,00 + 7,50 180, 190
UP 5.0 (IB) 29,23 (PDO) 19,40 (IA) 28,62 (SA) 48,54 (HQ) 0,03 6,00 + 9,00 + 7,00 + 5,50
180, 190, 200, 220
UP 5.1 (IB) 29,23 (PDO) 19,40 (IA) 28,62 (SA) 48,54 (HQ) 0,03 6,00 + 7,50 180, 190
* The sample degraded during the reaction.
2.2.2. Curing reactions
The UPs were crosslinked using HEMA as reactive solvent (RS), BPO as thermal initiator and Ir-2959 as
photoinitiator. A predetermined amount of UP was dissolved in HEMA (Table 9) and then the initiator (3%
w/w relatively to the amount of UP and RS) was added. After the total dissolution of the initiator, the
samples were placed in teflon moulds and were cured at 80ºC for 3 hours or irradiated at 280 nm for 3
hours in a UV-irradiation chamber (Model BS-02, from Dr. Gröbel, UV-Electronik GmbH).
Table 9. The UPRs formulations and the percentage and masses of their compounds.
Formulation UP RS mUP (g) mRS (g) minitiator (g)
UPR 1.0 (50RS/50UP)
1.1 HEMA
2,50 2,50 0,15
UPR 1.1 (37RS/63UP) 3,15 1,85 0,15
UPR 1.2 (25RS/75UP) 3,75 1,25 0,15
UPR 2.0 (50RS/50UP)
2.0 HEMA
2,50 2,50 0,15
UPR 2.1 (37RS/63UP) 3,15 1,85 0,15
UPR 2.2 (25RS/75UP) 3,75 1,25 0,15
UPR 3.0 (50RS/50UP)
3.0 HEMA
2,50 2,50 0,15
UPR 3.1 (37RS/63UP) 3,15 1,85 0,15
UPR 3.2 (25RS/75UP) 3,75 1,25 0,15
UPR 4.0 (50RS/50UP)
4.0 HEMA
2,50 2,50 0,15
UPR 4.1 (37RS/63UP) 3,15 1,85 0,15
UPR 4.2 (25RS/75UP) 3,75 1,25 0,15
UPR 5.0 (50RS/50UP)
2.1 HEMA
2,50 2,50 0,15
UPR 5.1 (37RS/63UP) 3,15 1,85 0,15
UPR 5.2 (25RS/75UP) 3,75 1,25 0,15
UPR 7.0 (50RS/50UP)
5.1 HEMA
2,50 2,50 0,15
UPR 7.1 (37RS/63UP) 3,15 1,85 0,15
UPR 7.2 (25RS/75UP) 3,75 1,25 0,15

23
2.2.3. Characterization techniques
Chemical structure identification
FTIR spectra were obtained in the range 4000−500 cm−1 at room temperature using a Jasco FT/IR-4200
spectrometer, equipped with a Golden Gate Single Reflection Diamond ATR. Data collection was
performed with 4 cm−1 spectral resolution and 64 accumulations.
1H NMR spectra of the UPs were obtained at 25ºC on a Varian Unity 600 MHz Spectrometer using a 3 mm
broadband NMR probe in THF-d8.Tetramethylsilane (TMS) was used as internal standard.
Molecular weight distribution
The molecular weight distribution of the samples was determined using high-performance gel permeation
chromatography (HPSEC; Viscotek TDAmax) with a differential viscometer (DV); right-angle laser-light
scattering (RALLS, Viscotek); low-angle laser-light scattering (LALLS, Viscotek) and refractive-index (RI)
detectors. The column set consisted of a PL 10 mm guard column (50×7.5 mm2) followed by one Viscotek
T200 column (6 μm), one MIXED-E PLgel column (3 μm), and one MIXED-C PLgel column (5 μm). HPLC
dual piston pump was set with a flow rate of 1 mL.min −1. The eluent (THF) was previously filtered through
a 0.2 μm filter. The system was also equipped with an on-line degasser. The tests were done at 30°C
using an Elder CH-150 heater. Before the injection (100 μL), the samples were filtered through a
polytetrafluoroethylene (PTFE) membrane with 0.2 μm pore. The system was calibrated with narrow
polystyrene (PS) standards.
Thermal and mechanical properties
The thermal stability of the samples, both UPs and UPRs, was evaluated by simultaneous thermal
analysis (heat-flux differential scanning calorimetry (DSC) and thermogravimetric analysis (TGA), using a
TA Instruments SDT Q600 equipment (thermobalance sensitivity: 0.1 g), which was previously calibrated
in the range 25ºC to 1000ºC by running tin and lead as melting standards, at a heating rate () of
10ºC.min−1, using open alumina crucibles and a dry nitrogen purge flow of 100 mL.min−1. Sample weights
ranging from 8 to 10 mg were used.
DMTA was carried out using a Tritec 2000 DMA. The UPs were placed in stainless steel material pockets,
and the test was run in single cantilever bending geometry. The UPRs were analyzed in tension mode.
Both tests were carried out from −150ºC to 150ºC, in multifrequency mode, with a heating rate of
5ºC.min−1.

24
Gel content
The UPRs were weighed, extracted with THF over night and dried under vacuum until constant weight.
The gel content was determined from equation:
𝐺𝑒𝑙 𝑐𝑜𝑛𝑡𝑒𝑛𝑡 % = 𝑊𝑒
𝑊0× 100 (1)
where Wo is the initial weight of the sample and We is the weight of the sample after being extracted.
Swelling capacity
UPR with a known dry weight were immersed in PBS (pH 7.4, 0.01 M) at 37ºC for a period of time that
allowed them to reach the swelling equilibrium. At predetermined times, the swollen samples were
removed from the PBS solution and the surface water gently blotted by filter paper. The swollen samples
were then weighted and the swelling capacity determined from equation:
𝑆𝑤𝑒𝑙𝑙𝑖𝑛𝑔 𝑐𝑎𝑝𝑎𝑐𝑖𝑡𝑦 % = 𝑊𝑠−𝑊𝑑
𝑊𝑑× 100 (2)
where Wd is the weight of the dry samples before immersion, and Ws is the weight of the swollen samples.
Two measurements were done for each UPR.
In vitro hydrolytic degradation
In vitro hydrolytic degradation tests were done using a PBS solution (pH 7.4, 0.01 M) at 37ºC during 50
days. At predetermined periods of time, the samples were removed from PBS and washed with distilled
water. Then, the UPR were dried under vacuum until no weight change was observed. The degree of
degradation was estimated from the weight loss of the gels according to the equation:
𝑊𝑒𝑖𝑔ℎ𝑡 𝑙𝑜𝑠𝑠 % = 𝑊𝑑−𝑊𝑡
𝑊𝑑× 100 (3)
where Wd is the weight of the dry samples before immersion, and Wt is the dry samples weight after
incubation for t days. Two measurements were done for each UPR.
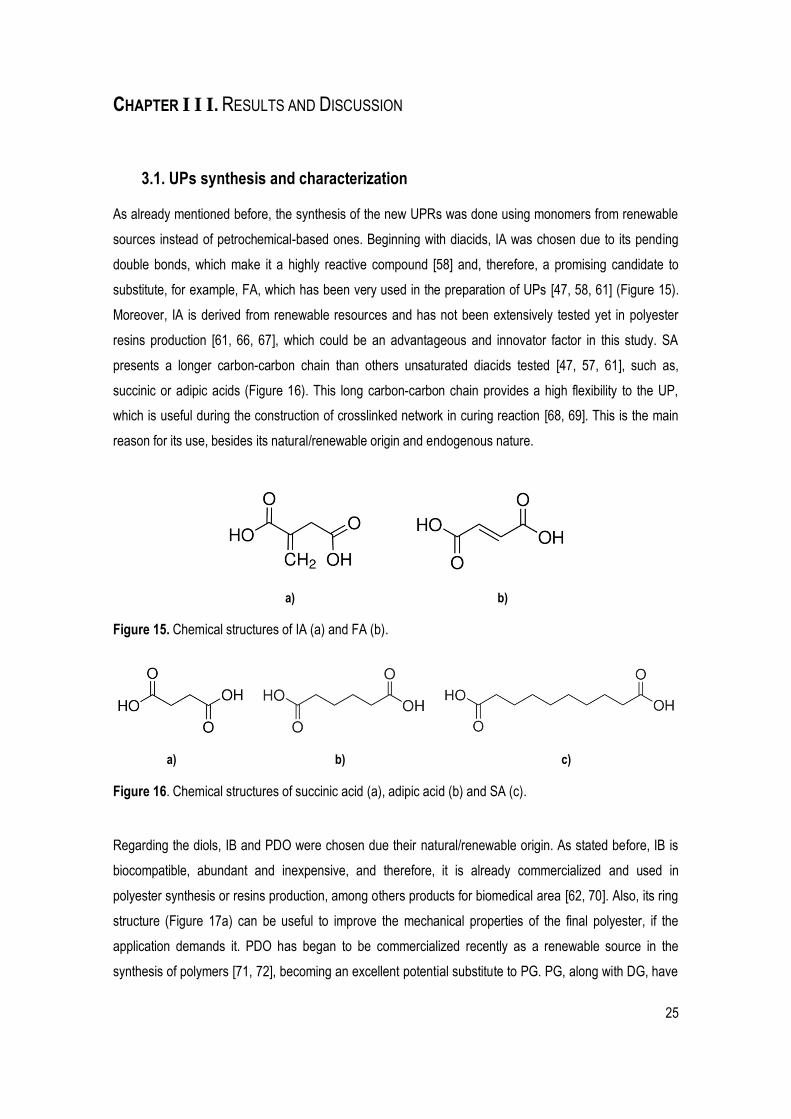
25
CHAPTER I I I. RESULTS AND DISCUSSION
3.1. UPs synthesis and characterization
As already mentioned before, the synthesis of the new UPRs was done using monomers from renewable
sources instead of petrochemical-based ones. Beginning with diacids, IA was chosen due to its pending
double bonds, which make it a highly reactive compound [58] and, therefore, a promising candidate to
substitute, for example, FA, which has been very used in the preparation of UPs [47, 58, 61] (Figure 15).
Moreover, IA is derived from renewable resources and has not been extensively tested yet in polyester
resins production [61, 66, 67], which could be an advantageous and innovator factor in this study. SA
presents a longer carbon-carbon chain than others unsaturated diacids tested [47, 57, 61], such as,
succinic or adipic acids (Figure 16). This long carbon-carbon chain provides a high flexibility to the UP,
which is useful during the construction of crosslinked network in curing reaction [68, 69]. This is the main
reason for its use, besides its natural/renewable origin and endogenous nature.
a) b)
Figure 15. Chemical structures of IA (a) and FA (b).
a) b) c)
Figure 16. Chemical structures of succinic acid (a), adipic acid (b) and SA (c).
Regarding the diols, IB and PDO were chosen due their natural/renewable origin. As stated before, IB is
biocompatible, abundant and inexpensive, and therefore, it is already commercialized and used in
polyester synthesis or resins production, among others products for biomedical area [62, 70]. Also, its ring
structure (Figure 17a) can be useful to improve the mechanical properties of the final polyester, if the
application demands it. PDO has began to be commercialized recently as a renewable source in the
synthesis of polymers [71, 72], becoming an excellent potential substitute to PG. PG, along with DG, have
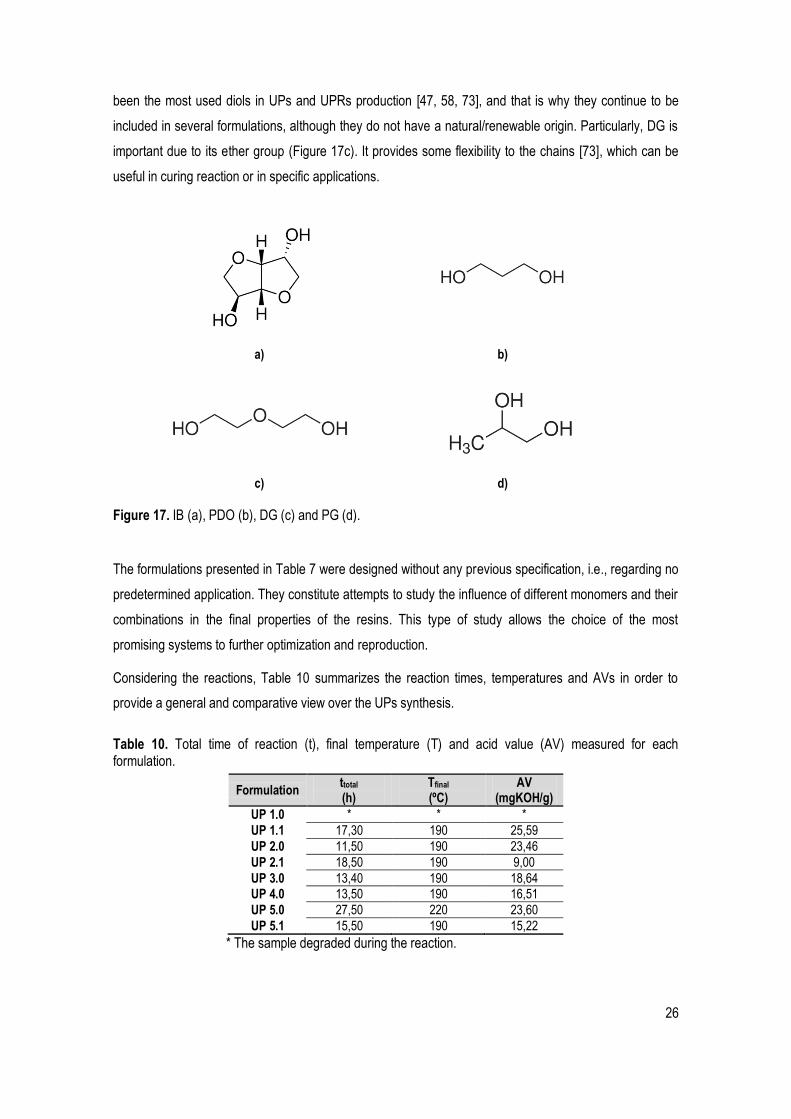
26
been the most used diols in UPs and UPRs production [47, 58, 73], and that is why they continue to be
included in several formulations, although they do not have a natural/renewable origin. Particularly, DG is
important due to its ether group (Figure 17c). It provides some flexibility to the chains [73], which can be
useful in curing reaction or in specific applications.
a) b)
c) d)
Figure 17. IB (a), PDO (b), DG (c) and PG (d).
The formulations presented in Table 7 were designed without any previous specification, i.e., regarding no
predetermined application. They constitute attempts to study the influence of different monomers and their
combinations in the final properties of the resins. This type of study allows the choice of the most
promising systems to further optimization and reproduction.
Considering the reactions, Table 10 summarizes the reaction times, temperatures and AVs in order to
provide a general and comparative view over the UPs synthesis.
Table 10. Total time of reaction (t), final temperature (T) and acid value (AV) measured for each formulation.
Formulation ttotal
(h) Tfinal
(ºC) AV
(mgKOH/g)
UP 1.0 * * *
UP 1.1 17,30 190 25,59
UP 2.0 11,50 190 23,46
UP 2.1 18,50 190 9,00
UP 3.0 13,40 190 18,64 UP 4.0 13,50 190 16,51
UP 5.0 27,50 220 23,60
UP 5.1 15,50 190 15,22
* The sample degraded during the reaction.
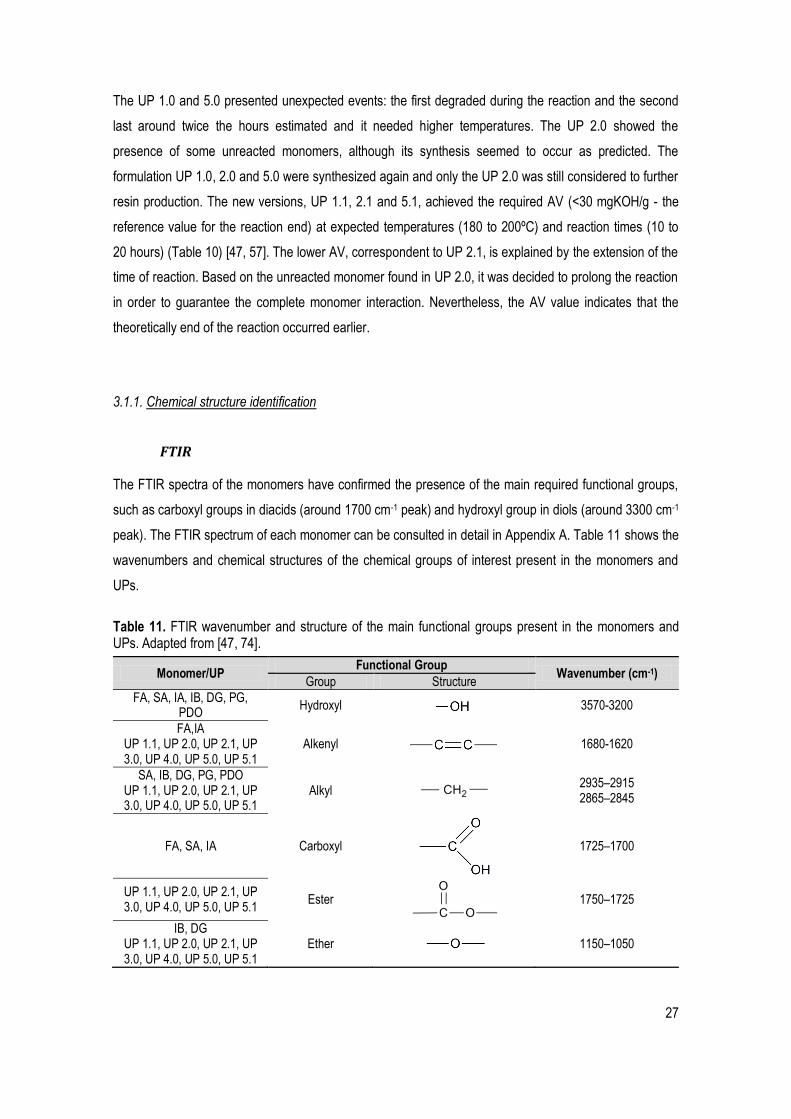
27
The UP 1.0 and 5.0 presented unexpected events: the first degraded during the reaction and the second
last around twice the hours estimated and it needed higher temperatures. The UP 2.0 showed the
presence of some unreacted monomers, although its synthesis seemed to occur as predicted. The
formulation UP 1.0, 2.0 and 5.0 were synthesized again and only the UP 2.0 was still considered to further
resin production. The new versions, UP 1.1, 2.1 and 5.1, achieved the required AV (<30 mgKOH/g - the
reference value for the reaction end) at expected temperatures (180 to 200ºC) and reaction times (10 to
20 hours) (Table 10) [47, 57]. The lower AV, correspondent to UP 2.1, is explained by the extension of the
time of reaction. Based on the unreacted monomer found in UP 2.0, it was decided to prolong the reaction
in order to guarantee the complete monomer interaction. Nevertheless, the AV value indicates that the
theoretically end of the reaction occurred earlier.
3.1.1. Chemical structure identification
FTIR
The FTIR spectra of the monomers have confirmed the presence of the main required functional groups,
such as carboxyl groups in diacids (around 1700 cm-1 peak) and hydroxyl group in diols (around 3300 cm-1
peak). The FTIR spectrum of each monomer can be consulted in detail in Appendix A. Table 11 shows the
wavenumbers and chemical structures of the chemical groups of interest present in the monomers and
UPs.
Table 11. FTIR wavenumber and structure of the main functional groups present in the monomers and UPs. Adapted from [47, 74].
Monomer/UP Functional Group
Wavenumber (cm-1) Group Structure
FA, SA, IA, IB, DG, PG, PDO
Hydroxyl 3570-3200
FA,IA UP 1.1, UP 2.0, UP 2.1, UP 3.0, UP 4.0, UP 5.0, UP 5.1
Alkenyl 1680-1620
SA, IB, DG, PG, PDO UP 1.1, UP 2.0, UP 2.1, UP 3.0, UP 4.0, UP 5.0, UP 5.1
Alkyl 2935–2915 2865–2845
FA, SA, IA Carboxyl
1725–1700
UP 1.1, UP 2.0, UP 2.1, UP 3.0, UP 4.0, UP 5.0, UP 5.1
Ester
1750–1725
IB, DG UP 1.1, UP 2.0, UP 2.1, UP 3.0, UP 4.0, UP 5.0, UP 5.1
Ether 1150–1050
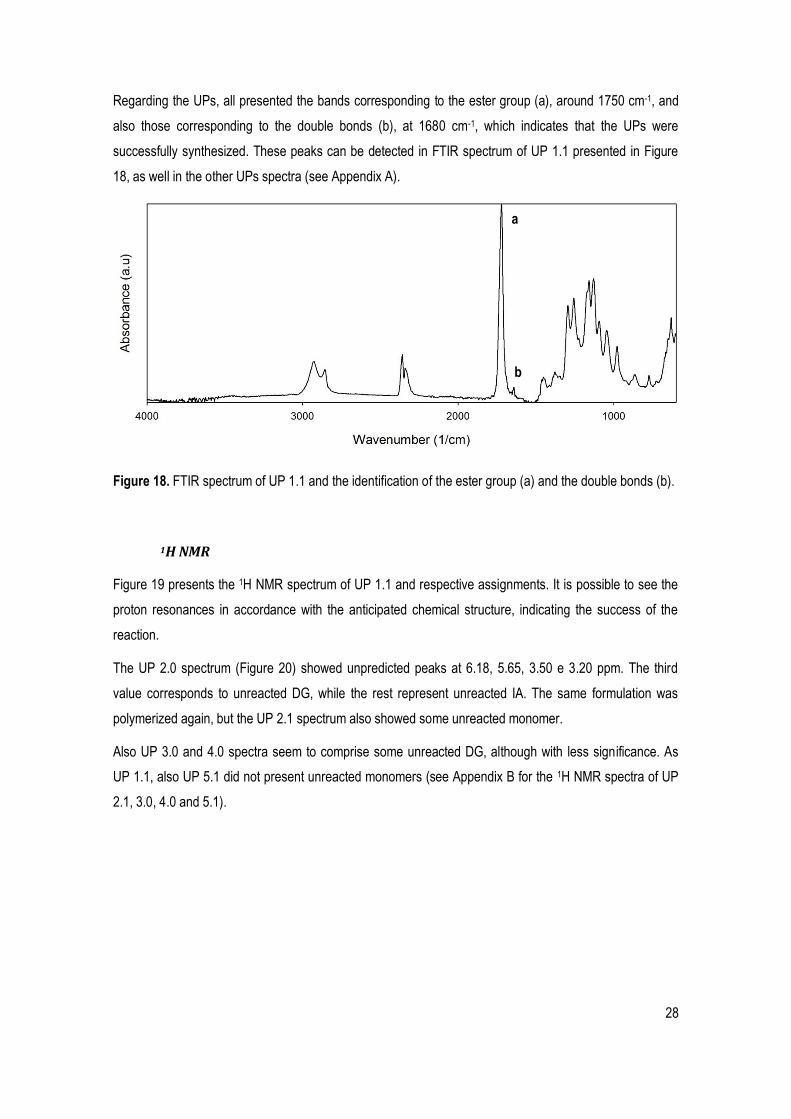
28
Regarding the UPs, all presented the bands corresponding to the ester group (a), around 1750 cm-1, and
also those corresponding to the double bonds (b), at 1680 cm-1, which indicates that the UPs were
successfully synthesized. These peaks can be detected in FTIR spectrum of UP 1.1 presented in Figure
18, as well in the other UPs spectra (see Appendix A).
Figure 18. FTIR spectrum of UP 1.1 and the identification of the ester group (a) and the double bonds (b).
1H NMR
Figure 19 presents the 1H NMR spectrum of UP 1.1 and respective assignments. It is possible to see the
proton resonances in accordance with the anticipated chemical structure, indicating the success of the
reaction.
The UP 2.0 spectrum (Figure 20) showed unpredicted peaks at 6.18, 5.65, 3.50 e 3.20 ppm. The third
value corresponds to unreacted DG, while the rest represent unreacted IA. The same formulation was
polymerized again, but the UP 2.1 spectrum also showed some unreacted monomer.
Also UP 3.0 and 4.0 spectra seem to comprise some unreacted DG, although with less significance. As
UP 1.1, also UP 5.1 did not present unreacted monomers (see Appendix B for the 1H NMR spectra of UP
2.1, 3.0, 4.0 and 5.1).
a
b

29
Figure 19. The 1H NMR spectrum of UP 1.1 and the identification of the protons present in its chemical structure.
Figure 20. 1H NMR spectrum of UP 2.0. The # and * symbols correspond to the unreacted diethylene glycol and itaconic acid, respectively.
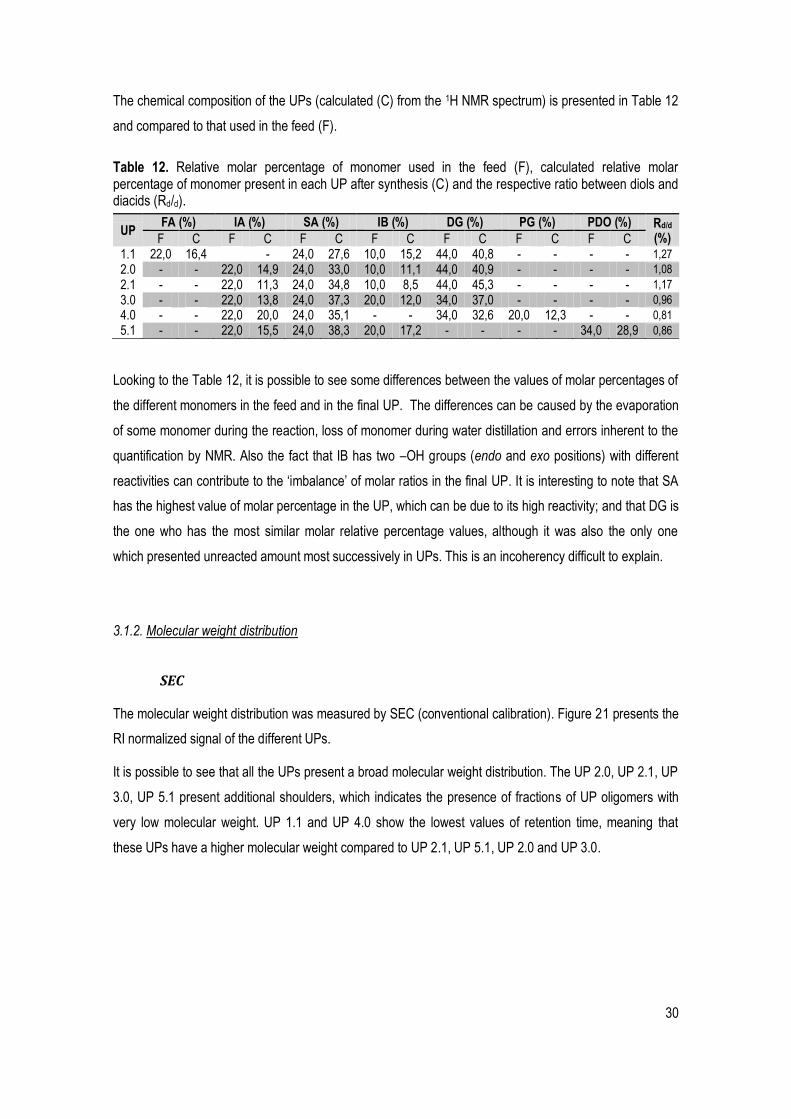
30
The chemical composition of the UPs (calculated (C) from the 1H NMR spectrum) is presented in Table 12
and compared to that used in the feed (F).
Table 12. Relative molar percentage of monomer used in the feed (F), calculated relative molar percentage of monomer present in each UP after synthesis (C) and the respective ratio between diols and diacids (Rd/d).
UP FA (%) IA (%) SA (%) IB (%) DG (%) PG (%) PDO (%) Rd/d
(%) F C F C F C F C F C F C F C 1.1 22,0 16,4 - 24,0 27,6 10,0 15,2 44,0 40,8 - - - - 1,27
2.0 - - 22,0 14,9 24,0 33,0 10,0 11,1 44,0 40,9 - - - - 1,08
2.1 - - 22,0 11,3 24,0 34,8 10,0 8,5 44,0 45,3 - - - - 1,17
3.0 - - 22,0 13,8 24,0 37,3 20,0 12,0 34,0 37,0 - - - - 0,96
4.0 - - 22,0 20,0 24,0 35,1 - - 34,0 32,6 20,0 12,3 - - 0,81
5.1 - - 22,0 15,5 24,0 38,3 20,0 17,2 - - - - 34,0 28,9 0,86
Looking to the Table 12, it is possible to see some differences between the values of molar percentages of
the different monomers in the feed and in the final UP. The differences can be caused by the evaporation
of some monomer during the reaction, loss of monomer during water distillation and errors inherent to the
quantification by NMR. Also the fact that IB has two –OH groups (endo and exo positions) with different
reactivities can contribute to the „imbalance‟ of molar ratios in the final UP. It is interesting to note that SA
has the highest value of molar percentage in the UP, which can be due to its high reactivity; and that DG is
the one who has the most similar molar relative percentage values, although it was also the only one
which presented unreacted amount most successively in UPs. This is an incoherency difficult to explain.
3.1.2. Molecular weight distribution
SEC
The molecular weight distribution was measured by SEC (conventional calibration). Figure 21 presents the
RI normalized signal of the different UPs.
It is possible to see that all the UPs present a broad molecular weight distribution. The UP 2.0, UP 2.1, UP
3.0, UP 5.1 present additional shoulders, which indicates the presence of fractions of UP oligomers with
very low molecular weight. UP 1.1 and UP 4.0 show the lowest values of retention time, meaning that
these UPs have a higher molecular weight compared to UP 2.1, UP 5.1, UP 2.0 and UP 3.0.

31
Figure 21. Molecular weight distribution of the UPs.
Table 13 presents the values of molecular weight and polydispersity index (PDI) of the UPs. The values
were obtained from the conventional calibration.
Table 13. Number average molecular weight (Mn) of each UPs and their polydispersity index (PDI), according to conventional calibration.
UP Formulation Mn (g.mol-1) PDI
UP 1.1 0.22 FA/0.24 SA/0.10 IB/0,44 DEG 3933 1,99 UP 2.0 0.22 IA/0.24 SA/0.10 IB/0.44 DEG 688 4,47 UP 2.1 0.22 IA/0.24 SA/0.10 IB/0.44 DEG 600 6,02 UP 3.0 0.22 IA/0.24 SA/0.20 IB/0.34 DEG 920 4,12 UP 4.0 0.22 IA/0.24 SA/0.20 PG/0.34 DEG 2020 5,05 UP 5.1 0.22 IA/0.24 SA/0.20 IB/0.34 PD 626 5,32
As can be seen from Table 13, UPR 1.1 and UPR 4.0 show the highest values of molecular weight,
whereas the other UPs present a significantly lower value of molecular weight. This can be tentatively
assigned to some differences in reactivity of the different monomers. The UPs show high values of PDI,
which was expected since all the UPs were prepared from polycondensation reactions. Such reactions are
known to provide polymers with broad molecular weight distributions.
3.1.3. Thermal and mechanical properties
SDT
The thermal stability and thermal events of the UPs were evaluated by simultaneous thermal analysis
(TGA/DSC) in a 25-600ºC range. Figure 22 gives a global view of the thermal behavior of UP 1.1.

32
Figure 22. Simultaneous (DSC and TGA) thermoanalytical curves of UP 1.1.
It is possible to see that UP1.1 degrades in a single stage and presents an amorphous nature, since no
transitions below the degradation temperature are detected in the heat flow curve. The remaining UPs
present a similar profile (see Appendix C, for the thermoanalytical curves). Table 14 summarizes the
relevant temperatures taken from the thermoanalytical curves.
Table 14. Characteristic quantities (average and standard deviation) obtained from TGA, DTGA and DSC data. Ton: extrapolated onset temperatures (TGA); T5%: temperature corresponding to 5% of mass loss; T10%: temperature corresponding to 10% of mass loss; Tp: peak temperature (DTGA); Tdeg: degradation temperature of the UPs (DSC).
UP Formulation Ton
(ºC) T5%
(ºC) T10%
(ºC) Tpeak
(ºC) Tdeg
(ºC)
1.1 0.22 FA/0.24 SA/0.10 IB/0,44 DG 386,9±1,9 344,5±3,5 364,9±1,0 425,1±0,8 434,4±3,6 2.0 0.22 IA/0.24 SA/0.10 IB/0.44 DG 394,2±1,9 308,3±6,3 233,6±17,7 430,5±0,4 436,4±0,8 2.1 0.22 IA/0.24 SA/0.10 IB/0.44 DG 388,6±1,9 250,8±6,8 320,5±10,8 431,0±0,4 439,0±2,8 3.0 0.22 IA/0.24 SA/0.20 IB/0.34 DG 390,3±3,0 279,0±3,9 337,4±3,3 430,5±2,0 435,8±0,0 4.0 0.22 IA/0.24 SA/0.20 PG/0.34 DG 382,0±2,3 331,2±8,3 361,2±4,7 430,7±0,8 443,7±4,8 5.1 0.22 IA/0.24 SA/0.20 IB/0.34 PDO 381,4±1,4 249,1±20,0 330,0±7,1 415,4±0,8 416,6±1,6
All the UPs are thermally stable until ca. 390ºC (Ton values) and degrade in a temperature range of 420-
440ºC (Tdeg). UP 1.1 and UP 4.0 show the highest values of Ton, T5%, T10% and Tdeg, indicating their higher
thermal stability, which can be related to their higher molecular weight (see Table 13) relatively to the
remaining UPs. UP 2.0, UP 2.1, UP 3.0 and UP 5.1 present T5% and T10% significantly lower than those of
UP 1.1 and UP 4.0, which can be related to the evaporation of residual monomer present within the UPs.
Nevertheless, if one takes only the Ton as the index of thermal stability no significant differences are seen.
This suggests that changes in the „core‟ composition of the UPs do not change significantly their thermal
stability.
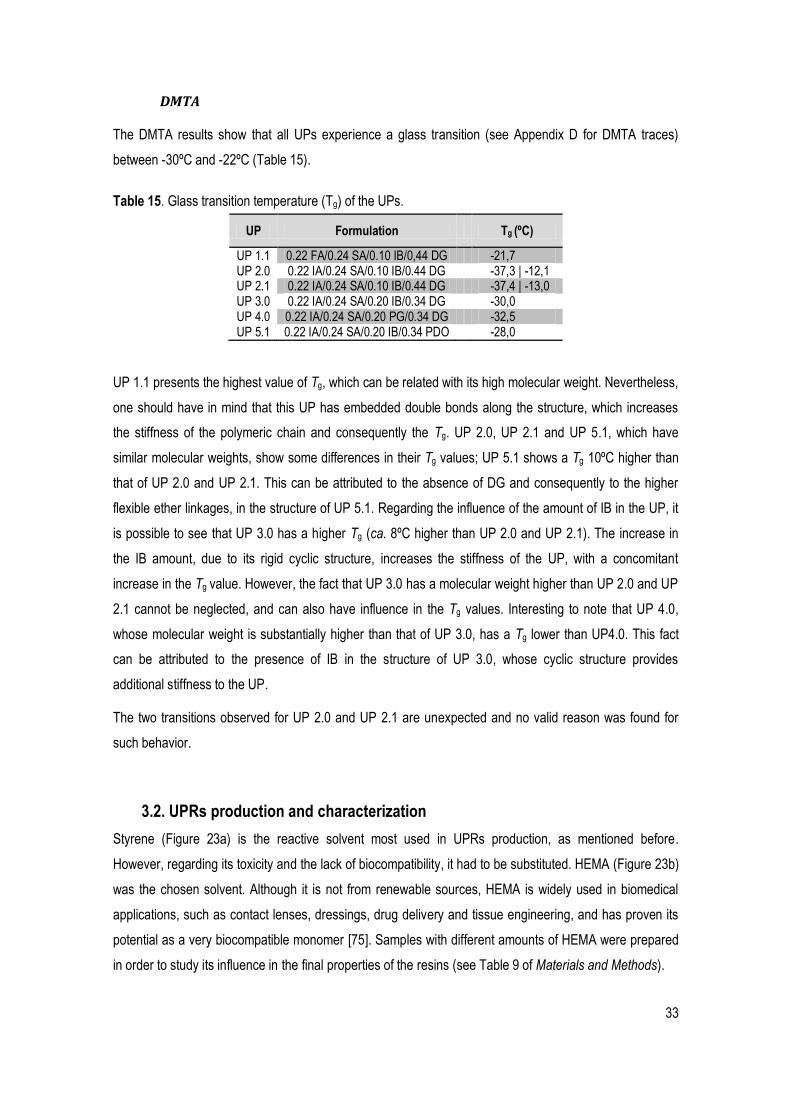
33
DMTA
The DMTA results show that all UPs experience a glass transition (see Appendix D for DMTA traces)
between -30ºC and -22ºC (Table 15).
Table 15. Glass transition temperature (Tg) of the UPs.
UP Formulation Tg (ºC)
UP 1.1 0.22 FA/0.24 SA/0.10 IB/0,44 DG -21,7 UP 2.0 0.22 IA/0.24 SA/0.10 IB/0.44 DG -37,3 | -12,1 UP 2.1 0.22 IA/0.24 SA/0.10 IB/0.44 DG -37,4 | -13,0 UP 3.0 0.22 IA/0.24 SA/0.20 IB/0.34 DG -30,0 UP 4.0 0.22 IA/0.24 SA/0.20 PG/0.34 DG -32,5 UP 5.1 0.22 IA/0.24 SA/0.20 IB/0.34 PDO -28,0
UP 1.1 presents the highest value of Tg, which can be related with its high molecular weight. Nevertheless,
one should have in mind that this UP has embedded double bonds along the structure, which increases
the stiffness of the polymeric chain and consequently the Tg. UP 2.0, UP 2.1 and UP 5.1, which have
similar molecular weights, show some differences in their Tg values; UP 5.1 shows a Tg 10ºC higher than
that of UP 2.0 and UP 2.1. This can be attributed to the absence of DG and consequently to the higher
flexible ether linkages, in the structure of UP 5.1. Regarding the influence of the amount of IB in the UP, it
is possible to see that UP 3.0 has a higher Tg (ca. 8ºC higher than UP 2.0 and UP 2.1). The increase in
the IB amount, due to its rigid cyclic structure, increases the stiffness of the UP, with a concomitant
increase in the Tg value. However, the fact that UP 3.0 has a molecular weight higher than UP 2.0 and UP
2.1 cannot be neglected, and can also have influence in the Tg values. Interesting to note that UP 4.0,
whose molecular weight is substantially higher than that of UP 3.0, has a Tg lower than UP4.0. This fact
can be attributed to the presence of IB in the structure of UP 3.0, whose cyclic structure provides
additional stiffness to the UP.
The two transitions observed for UP 2.0 and UP 2.1 are unexpected and no valid reason was found for
such behavior.
3.2. UPRs production and characterization
Styrene (Figure 23a) is the reactive solvent most used in UPRs production, as mentioned before.
However, regarding its toxicity and the lack of biocompatibility, it had to be substituted. HEMA (Figure 23b)
was the chosen solvent. Although it is not from renewable sources, HEMA is widely used in biomedical
applications, such as contact lenses, dressings, drug delivery and tissue engineering, and has proven its
potential as a very biocompatible monomer [75]. Samples with different amounts of HEMA were prepared
in order to study its influence in the final properties of the resins (see Table 9 of Materials and Methods).
34
a) b)
Figure 23. Chemical structures of styrene (a) and HEMA (b).
Samples were cured by two different methods - thermal crosslinking and photocrosslinking – in order to
compare their behavior and analyze their impact in resins final properties. Regarding the thermal
crosslinking reaction, the most common initiators are peroxides [73], including BPO. Although it is non-
biocompatible, BPO (Figure 24) it highly reactive and has low activation energy [68] – reason why it is
widely used. Considering photo curing reaction, Ir-2959 (Figure 24b) was the selected, from a group of
others photoinitiators previously tested [47]. It seems to be more biocompatible [47], since it has been use
in food packing [76], very reactive and already used in UP functionalization [76]. The amount of initiator
was kept constant (3% w/w).
a) b)
Figure 24. Chemical structures of BPO (a) and Ir-2959 (b).
3.2.1. Gel content
Table 16 and Figure 25 compare the gel content of the different formulations tested, both by thermal
crosslinking and photocrosslinking.
Table 16. Gel content percentages of all thermal (T) and photocrosslinked (P) UPRs.
1.0 1.1 1.2 2.0 2.1 2.2 3.0 3.1 3.2
T (%) 99,9 97,5 95,8 74,5 75,4 73,1 80,7 75,7 71,1
P (%) 91,5 82,0 80,7 82,8 76,8 72,5 68,7 73,4 69,6
4.0 4.1 4.2 5.0 5.1 5.2 7.0 7.1 7.2
T (%) 95,3 93,3 92,7 83,4 78,0 75,1 87,9 82,7 77,2
P (%) 84,5 91,2 89,1 84,6 76,5 71,8 84,0 77,1 77,8

35
Figure 25. Gel content of all UPRs samples.
In general, the UPR 1 samples presented the higher gel content (≥95%), meaning that those samples
present highly crosslinked networks, i.e., with less uncrosslinked monomer and UP. The UPR 1 series
were obtained from the UPs 1.1, whose double bonds were embedded in the structure. For that reason,
they were more sterically hindered and less reactive, when compared to the double bond of IA, present in
the remaining formulations. Thus, it was expected that UPR 1 series presented the formulations with lower
gel content but, surprisingly, this did not occur. It is not possible to explain such phenomenon due to the
lack of information about the performance of these two unsaturated diacids in crosslinking reactions of
UPRs.
The results also demonstrate that the crosslinked networks (UPR 1 and UPR 4) obtained from the UPs
with the highest molecular weight (UP 1.1 and UP 4.0) presented high values of gel content. This can be
ascribed to the higher amount of double bonds present in the polymeric chain, which in turn leads to a
higher amount of crosslinking points.
The series UPR 2, UPR 3, UPR 5 and UPR 7 presented percentages around 70 to 85% of gel content.
Such crosslinked networks were prepared from UPs (UP 2.0, UP 3.0, UP 2.1 and UP 5.1, respectively)
that had very similar composition; the differences lie on the diol used in UP 5.1 (PDO instead of DG) and
the diols percentages tried in each formulation. No information in the literature was found regarding the
diols effect in the gel content of UPRs, and because of that, it is not possible to justify the gel content
results of the above mentioned UPRs.
36
Analyzing the differences between series, a decrease in the gel content when the amount of HEMA also
diminishes is noticed in almost all UPRs samples. This reveals the importance of the reactive monomer
role in the crosslinking reactions of UPs.
Regarding the type of curing reaction, it is clear that the majority of thermally cured UPRs samples
presented higher gel content percentages when compared to photo cured ones. Only the UPR 2 and UPR
5 seemed to diverge, in particular, in series 0. The fact that radiation can be less effective reaching all
areas of the samples, internal and superficial, could be the justification for this outcome.
Thus, it can be assumed that a higher amount of HEMA and the thermal curing method are key
parameters in what concerns the gel content of the UPRs. However, the chemical composition of the UPs
is another parameter that has also a significant influence in the gel content.
Taking into account that the best results were obtained by thermal crosslinking, only the thermally
crosslinked networks were further analyzed.
3.2.2. Thermal and mechanical properties
SDT
The thermal stability and thermal events of the UPRs were evaluated by simultaneous thermal analysis
(TGA/DSC) in a 25-600ºC range. Figure 26 gives a global view of the thermal behavior of UPR 1 (Figure
26a) and UPR 2 (Figure 26b).
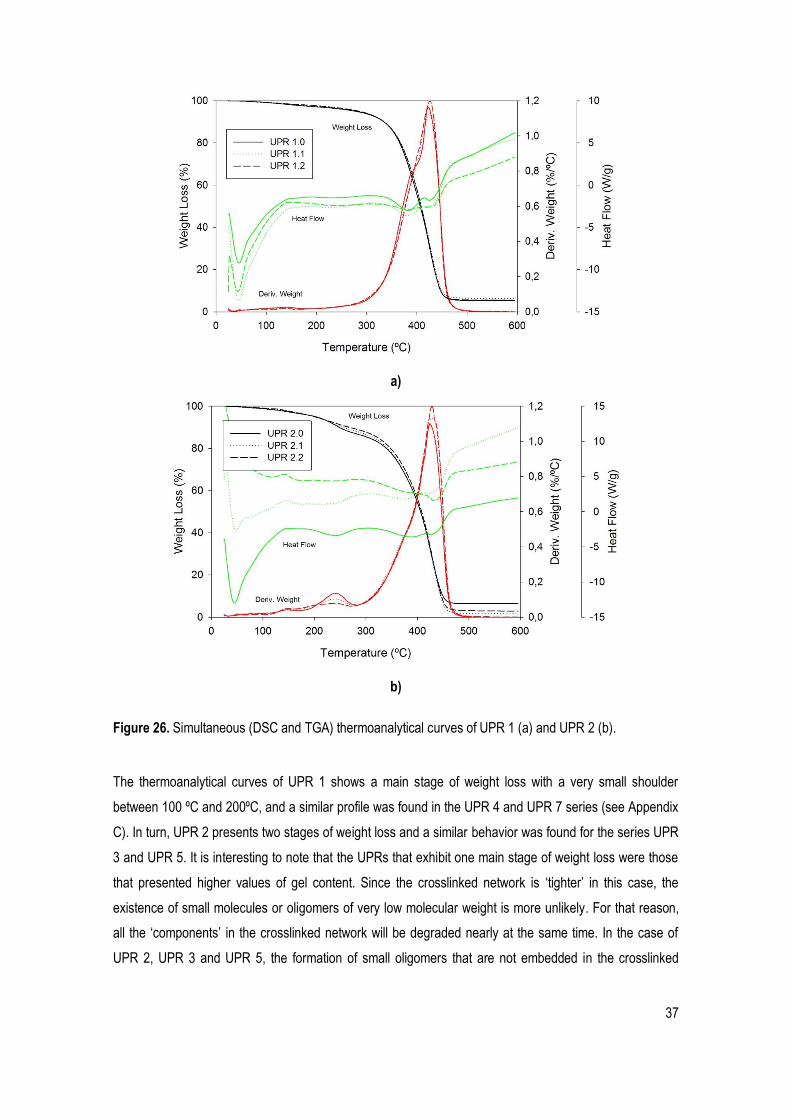
37
a)
b)
Figure 26. Simultaneous (DSC and TGA) thermoanalytical curves of UPR 1 (a) and UPR 2 (b).
The thermoanalytical curves of UPR 1 shows a main stage of weight loss with a very small shoulder
between 100 ºC and 200ºC, and a similar profile was found in the UPR 4 and UPR 7 series (see Appendix
C). In turn, UPR 2 presents two stages of weight loss and a similar behavior was found for the series UPR
3 and UPR 5. It is interesting to note that the UPRs that exhibit one main stage of weight loss were those
that presented higher values of gel content. Since the crosslinked network is „tighter‟ in this case, the
existence of small molecules or oligomers of very low molecular weight is more unlikely. For that reason,
all the „components‟ in the crosslinked network will be degraded nearly at the same time. In the case of
UPR 2, UPR 3 and UPR 5, the formation of small oligomers that are not embedded in the crosslinked
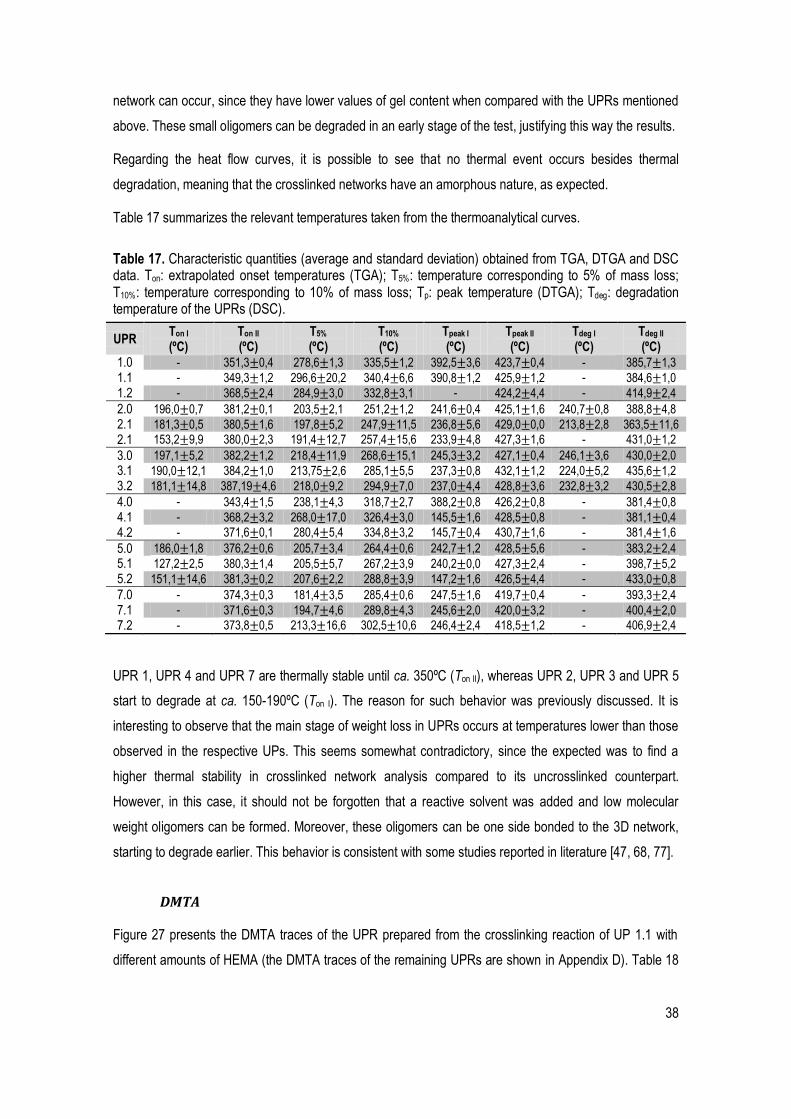
38
network can occur, since they have lower values of gel content when compared with the UPRs mentioned
above. These small oligomers can be degraded in an early stage of the test, justifying this way the results.
Regarding the heat flow curves, it is possible to see that no thermal event occurs besides thermal
degradation, meaning that the crosslinked networks have an amorphous nature, as expected.
Table 17 summarizes the relevant temperatures taken from the thermoanalytical curves.
Table 17. Characteristic quantities (average and standard deviation) obtained from TGA, DTGA and DSC data. Ton: extrapolated onset temperatures (TGA); T5%: temperature corresponding to 5% of mass loss; T10%: temperature corresponding to 10% of mass loss; Tp: peak temperature (DTGA); Tdeg: degradation temperature of the UPRs (DSC).
UPR Ton I
(ºC) Ton II
(ºC) T5%
(ºC) T10%
(ºC) Tpeak I
(ºC) Tpeak II
(ºC) Tdeg I
(ºC) Tdeg II
(ºC) 1.0 - 351,3±0,4 278,6±1,3 335,5±1,2 392,5±3,6 423,7±0,4 - 385,7±1,3
1.1 - 349,3±1,2 296,6±20,2 340,4±6,6 390,8±1,2 425,9±1,2 - 384,6±1,0
1.2 - 368,5±2,4 284,9±3,0 332,8±3,1 - 424,2±4,4 - 414,9±2,4
2.0 196,0±0,7 381,2±0,1 203,5±2,1 251,2±1,2 241,6±0,4 425,1±1,6 240,7±0,8 388,8±4,8
2.1 181,3±0,5 380,5±1,6 197,8±5,2 247,9±11,5 236,8±5,6 429,0±0,0 213,8±2,8 363,5±11,6
2.1 153,2±9,9 380,0±2,3 191,4±12,7 257,4±15,6 233,9±4,8 427,3±1,6 - 431,0±1,2
3.0 197,1±5,2 382,2±1,2 218,4±11,9 268,6±15,1 245,3±3,2 427,1±0,4 246,1±3,6 430,0±2,0
3.1 190,0±12,1 384,2±1,0 213,75±2,6 285,1±5,5 237,3±0,8 432,1±1,2 224,0±5,2 435,6±1,2
3.2 181,1±14,8 387,19±4,6 218,0±9,2 294,9±7,0 237,0±4,4 428,8±3,6 232,8±3,2 430,5±2,8
4.0 - 343,4±1,5 238,1±4,3 318,7±2,7 388,2±0,8 426,2±0,8 - 381,4±0,8
4.1 - 368,2±3,2 268,0±17,0 326,4±3,0 145,5±1,6 428,5±0,8 - 381,1±0,4
4.2 - 371,6±0,1 280,4±5,4 334,8±3,2 145,7±0,4 430,7±1,6 - 381,4±1,6
5.0 186,0±1,8 376,2±0,6 205,7±3,4 264,4±0,6 242,7±1,2 428,5±5,6 - 383,2±2,4
5.1 127,2±2,5 380,3±1,4 205,5±5,7 267,2±3,9 240,2±0,0 427,3±2,4 - 398,7±5,2
5.2 151,1±14,6 381,3±0,2 207,6±2,2 288,8±3,9 147,2±1,6 426,5±4,4 - 433,0±0,8
7.0 - 374,3±0,3 181,4±3,5 285,4±0,6 247,5±1,6 419,7±0,4 - 393,3±2,4
7.1 - 371,6±0,3 194,7±4,6 289,8±4,3 245,6±2,0 420,0±3,2 - 400,4±2,0
7.2 - 373,8±0,5 213,3±16,6 302,5±10,6 246,4±2,4 418,5±1,2 - 406,9±2,4
UPR 1, UPR 4 and UPR 7 are thermally stable until ca. 350ºC (Ton II), whereas UPR 2, UPR 3 and UPR 5
start to degrade at ca. 150-190ºC (Ton I). The reason for such behavior was previously discussed. It is
interesting to observe that the main stage of weight loss in UPRs occurs at temperatures lower than those
observed in the respective UPs. This seems somewhat contradictory, since the expected was to find a
higher thermal stability in crosslinked network analysis compared to its uncrosslinked counterpart.
However, in this case, it should not be forgotten that a reactive solvent was added and low molecular
weight oligomers can be formed. Moreover, these oligomers can be one side bonded to the 3D network,
starting to degrade earlier. This behavior is consistent with some studies reported in literature [47, 68, 77].
DMTA
Figure 27 presents the DMTA traces of the UPR prepared from the crosslinking reaction of UP 1.1 with
different amounts of HEMA (the DMTA traces of the remaining UPRs are shown in Appendix D). Table 18

39
presents the values of Tg of all the UPRs, along with the values of elastic modulus (E‟) at different
temperatures.
a)
b)
Figure 27. DMTA traces of UPR 1.0 at different frequency (1 and 10Hz) (a) and DMTA traces of UPR 1 with different amounts of HEMA at 1Hz (b).
Figure 27 demonstrates that the UPR 1.0, UPR 1.1 and UPR 1.2 present two distinct Tg, which indicates
the presence of two different crosslinked phases. In Table 18, it is possible to observe a decrease in the
higher Tg value as the amount of HEMA decreases in the formulation. Regarding the E‟ values, it is difficult
to find a tendency between the E‟ value and the type of formulation or amount of HEMA at -50ºC.
However, at temperatures above 0ºC it is possible to establish a relationship between E‟ value and the
HEMA amount: E‟ value decreases when the HEMA amount also decreases in the formulation, which

40
indicates that the formulations with less amount of HEMA are less rigid. Concerning the effect of the type
of UP, it is possible to see that the UPR 1, UPR 4, and UPR 7 have the highest values of E‟, showing a
more rigid character. This can be related with their high values of gel content.
Table 18. Main values obtained from DMTA data. Tg: glass transition temperature; E'-50ºC: modulus at -50ºC; E'0ºC: modulus at 0ºC; E'37ºC: modulus at 37ºC; E'50ºC: modulus at 50ºC.
Formulation Tg (ºC) E'-50ºC (MPa) E'0ºC (MPa) E'37ºC (MPa) E'50ºC (MPa)
UPR1.0 (50 IL1/50HEMA) 14,6 | 120,0 1361,0 1014,0 219,4 166,7
UPR1.1 (63IL1/37HEMA) 15,0 | 122,4 2353,6 1422,0 193,4 138,1
UPR1.2 (75IL1/25HEMA) 12,6 | 110,3 1795,9 908,9 90,5 67,9
UPR2.0 (50IL2/50HEMA) -4,8 | 83,6 1163,1 297,0 86,0 51,4
UPR2.1 (63IL2/37HEMA) -8,5 | 55,6 1043,8 172,5 35,5 19,7
UPR2.2 (75IL2/25HEMA) -2,8 | 22,0 1477,7 71,1 9,7 5,3
UPR3.0 (50IL3/50HEMA) -10,3 | 96,8 916,0 231,8 75,6 55,0
UPR3.1 (63IL3/37HEMA) -6,7 | 78,9 1129,4 178,7 43,3 27,9
UPR3.2 (75IL3/25HEMA) -6,7 | 59,1 1701,0 77,4 13,5 8,3
UPR4.0 (50IL4/50HEMA) -8,3 | 112,5 1114,0 356,3 172,8 137,9
UPR4.1 (63IL4/37HEMA) -11,9 | 98,7 1828,5 282,3 87,0 63,0
UPR4.2 (75IL4/25HEMA) -11,0 | 57,9 1976,0 215,3 42,4 29,0
UPR5.0 (50IL2.1/50HEMA) -18,3 | 91,9 985,8 280,6 104,8 72,1
UPR5.1 (63IL2.1/37HEMA) -12,9 | 85,5 890,9 130,8 38,1 23,7
UPR5.2 (75IL2.1/25HEMA) -13,8 | 44,5 1900,5 77,5 11,1 6,7
UPR7.0 (50IL5.1/50HEMA) -1,3 | 96,8 1018,8 361,5 111,2 83,0
UPR7.1 (63IL5.1/37HEMA) -1,7 | 80,7 1900,0 461,5 81,7 49,6
UPR7.2 (75IL5.1/25HEMA) -4,4 | 33,0 1595,1 170,0 15,6 7,8
3.2.3. Swelling capacity
The swelling capacity of all UPRs was evaluated in PBS (pH 7.4) at 37ºC. In general, the UPR 1 was the
group of samples which swelled less (≤15%), while UPR 3 was the one which swelled more (>18%).
UPR 2, UPR 7, UPR 4 and UPR 5 followed the UPR 3, respectively, showing intermediate values of
swelling capacity (15-18%), as it can be verified in Appendix E. The amount of HEMA and the combination
of monomers and their hydrophilicity are the explanation for these different outcomes, as discussed further
on. It should be pointed out that the low values of swelling capacity that are observed indicate a highly
hydrophobic nature of the UPRs.
The increase of HEMA amount in the formulations affected significantly the swelling capacity of all UPRs.
In Figure 28, it can be seen the absorption percentage of UPR 1 rising faster in sample 0 (50% HEMA) in
comparison to samples 1 (37% HEMA) and 2 (25% HEMA). The others UPRs showed the same trend and
this behavior can be justified by the increased amount of HEMA. Being a highly hydrophilic molecule, an
increase in its content turns the UPR more hydrophilic, and therefore, more able to swell.
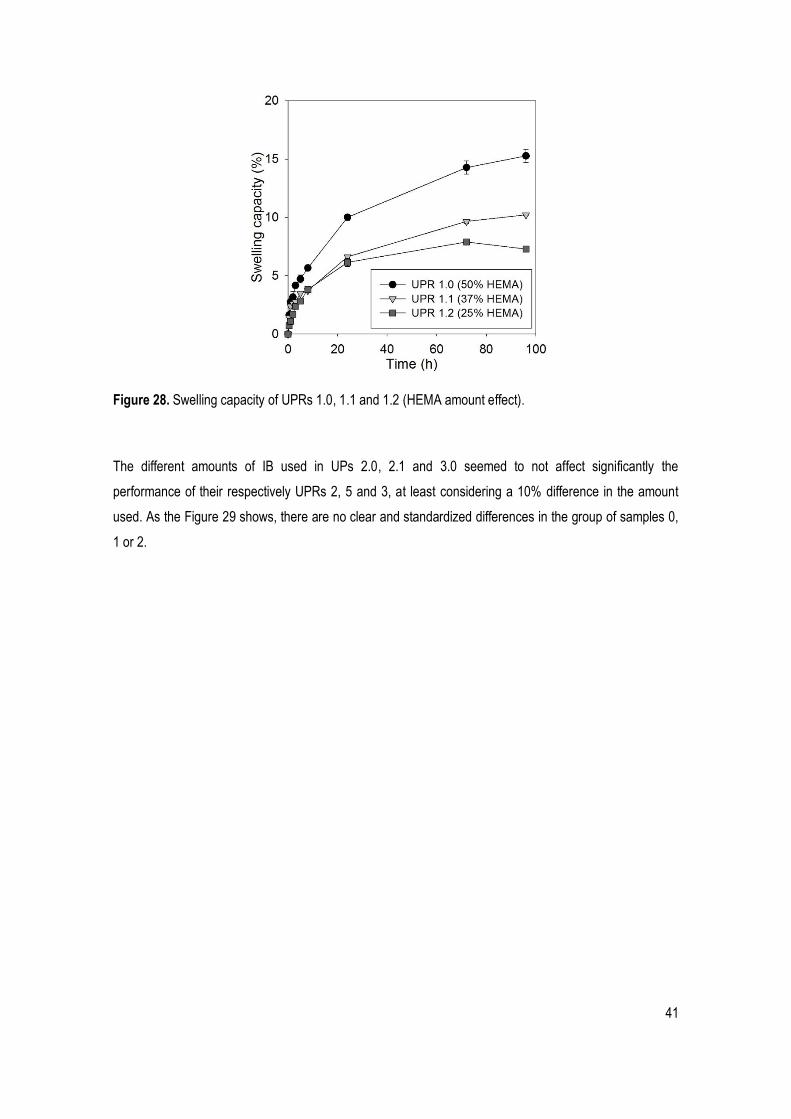
41
Figure 28. Swelling capacity of UPRs 1.0, 1.1 and 1.2 (HEMA amount effect).
The different amounts of IB used in UPs 2.0, 2.1 and 3.0 seemed to not affect significantly the
performance of their respectively UPRs 2, 5 and 3, at least considering a 10% difference in the amount
used. As the Figure 29 shows, there are no clear and standardized differences in the group of samples 0,
1 or 2.
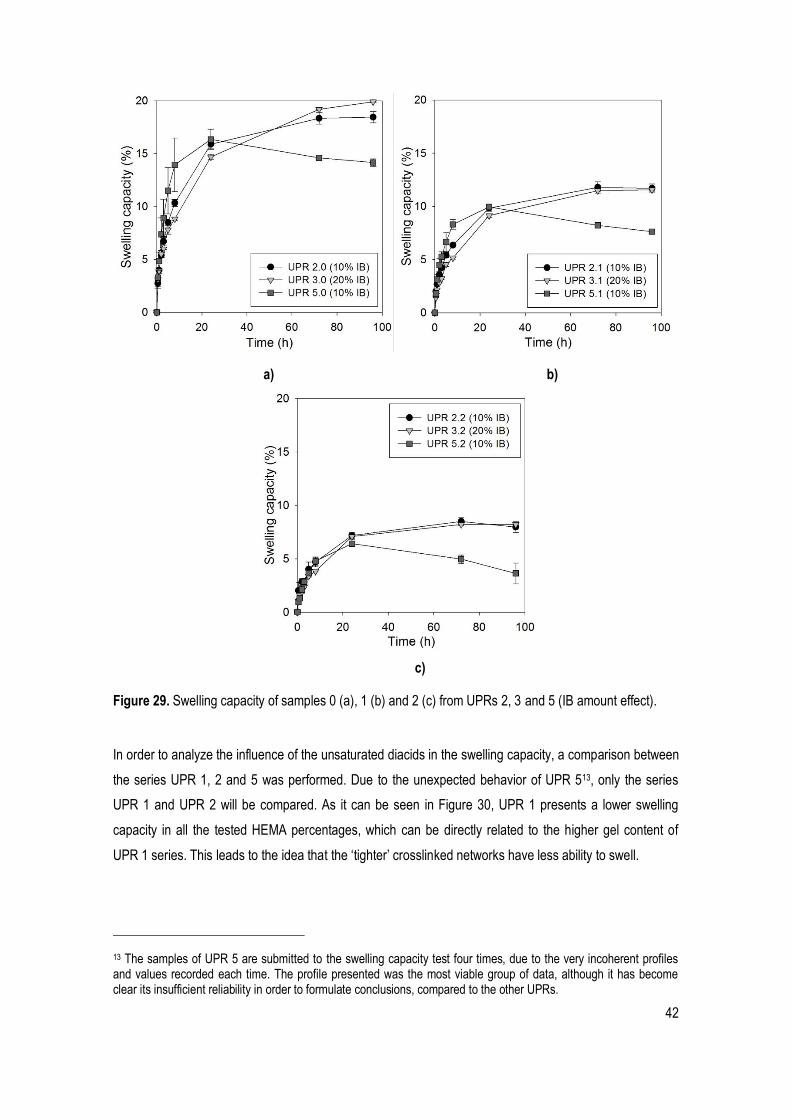
42
a) b)
c)
Figure 29. Swelling capacity of samples 0 (a), 1 (b) and 2 (c) from UPRs 2, 3 and 5 (IB amount effect).
In order to analyze the influence of the unsaturated diacids in the swelling capacity, a comparison between
the series UPR 1, 2 and 5 was performed. Due to the unexpected behavior of UPR 513, only the series
UPR 1 and UPR 2 will be compared. As it can be seen in Figure 30, UPR 1 presents a lower swelling
capacity in all the tested HEMA percentages, which can be directly related to the higher gel content of
UPR 1 series. This leads to the idea that the „tighter‟ crosslinked networks have less ability to swell.
13 The samples of UPR 5 are submitted to the swelling capacity test four times, due to the very incoherent profiles and values recorded each time. The profile presented was the most viable group of data, although it has become clear its insufficient reliability in order to formulate conclusions, compared to the other UPRs.
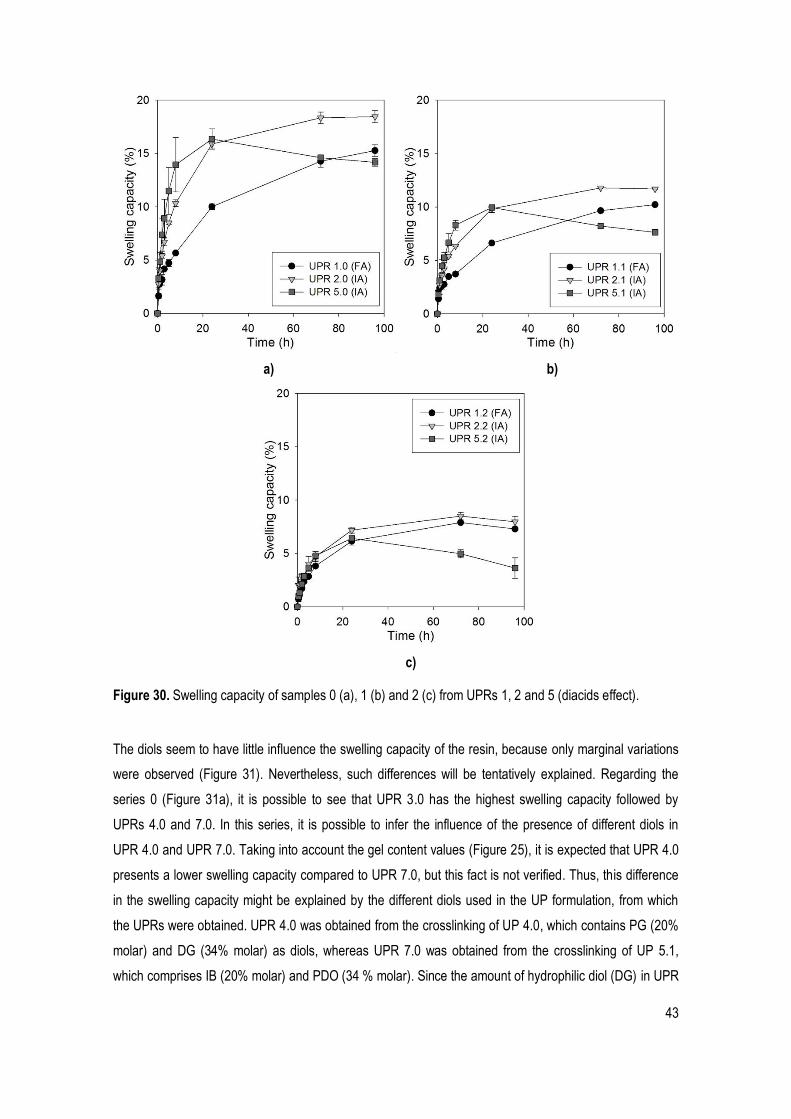
43
a) b)
c)
Figure 30. Swelling capacity of samples 0 (a), 1 (b) and 2 (c) from UPRs 1, 2 and 5 (diacids effect).
The diols seem to have little influence the swelling capacity of the resin, because only marginal variations
were observed (Figure 31). Nevertheless, such differences will be tentatively explained. Regarding the
series 0 (Figure 31a), it is possible to see that UPR 3.0 has the highest swelling capacity followed by
UPRs 4.0 and 7.0. In this series, it is possible to infer the influence of the presence of different diols in
UPR 4.0 and UPR 7.0. Taking into account the gel content values (Figure 25), it is expected that UPR 4.0
presents a lower swelling capacity compared to UPR 7.0, but this fact is not verified. Thus, this difference
in the swelling capacity might be explained by the different diols used in the UP formulation, from which
the UPRs were obtained. UPR 4.0 was obtained from the crosslinking of UP 4.0, which contains PG (20%
molar) and DG (34% molar) as diols, whereas UPR 7.0 was obtained from the crosslinking of UP 5.1,
which comprises IB (20% molar) and PDO (34 % molar). Since the amount of hydrophilic diol (DG) in UPR
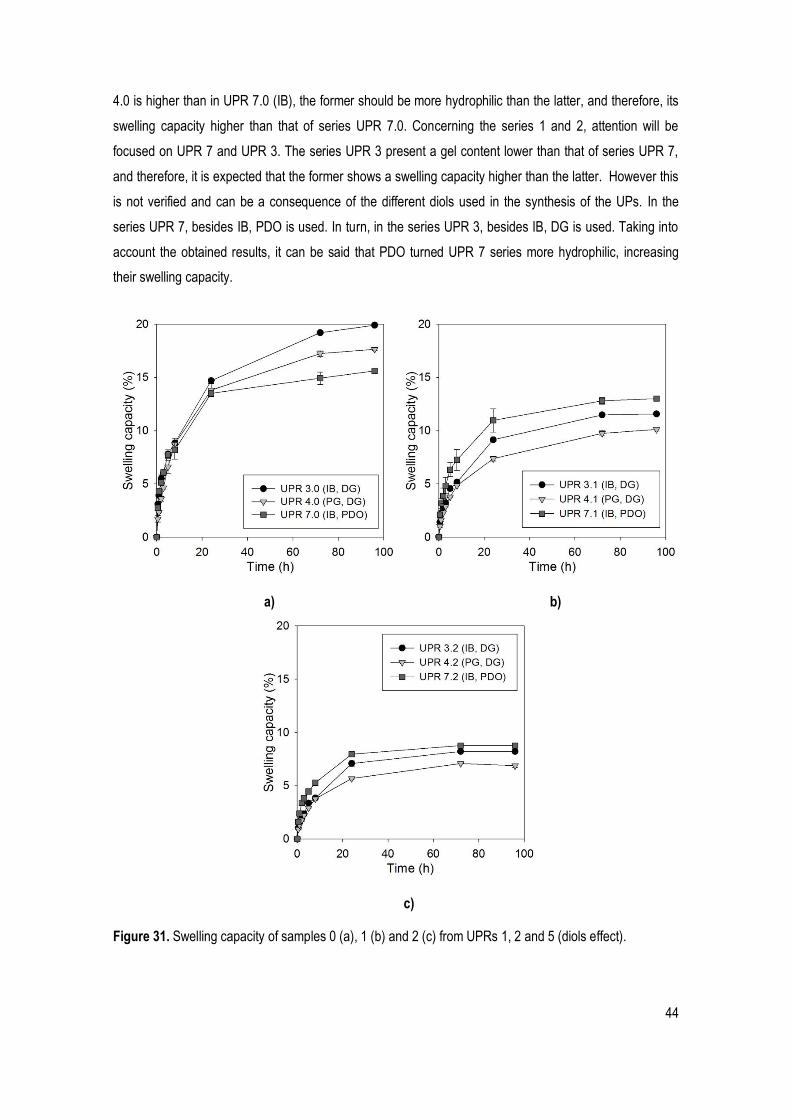
44
4.0 is higher than in UPR 7.0 (IB), the former should be more hydrophilic than the latter, and therefore, its
swelling capacity higher than that of series UPR 7.0. Concerning the series 1 and 2, attention will be
focused on UPR 7 and UPR 3. The series UPR 3 present a gel content lower than that of series UPR 7,
and therefore, it is expected that the former shows a swelling capacity higher than the latter. However this
is not verified and can be a consequence of the different diols used in the synthesis of the UPs. In the
series UPR 7, besides IB, PDO is used. In turn, in the series UPR 3, besides IB, DG is used. Taking into
account the obtained results, it can be said that PDO turned UPR 7 series more hydrophilic, increasing
their swelling capacity.
a) b)
c)
Figure 31. Swelling capacity of samples 0 (a), 1 (b) and 2 (c) from UPRs 1, 2 and 5 (diols effect).
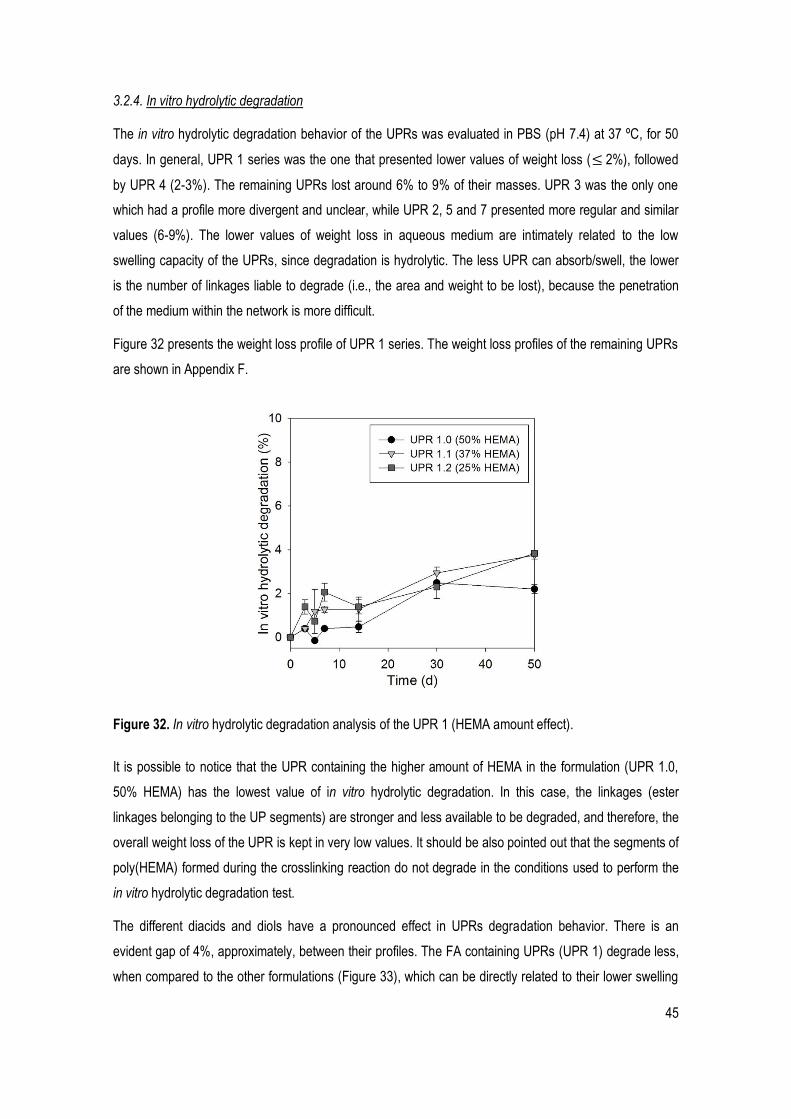
45
3.2.4. In vitro hydrolytic degradation
The in vitro hydrolytic degradation behavior of the UPRs was evaluated in PBS (pH 7.4) at 37 ºC, for 50
days. In general, UPR 1 series was the one that presented lower values of weight loss (≤ 2%), followed
by UPR 4 (2-3%). The remaining UPRs lost around 6% to 9% of their masses. UPR 3 was the only one
which had a profile more divergent and unclear, while UPR 2, 5 and 7 presented more regular and similar
values (6-9%). The lower values of weight loss in aqueous medium are intimately related to the low
swelling capacity of the UPRs, since degradation is hydrolytic. The less UPR can absorb/swell, the lower
is the number of linkages liable to degrade (i.e., the area and weight to be lost), because the penetration
of the medium within the network is more difficult.
Figure 32 presents the weight loss profile of UPR 1 series. The weight loss profiles of the remaining UPRs
are shown in Appendix F.
Figure 32. In vitro hydrolytic degradation analysis of the UPR 1 (HEMA amount effect).
It is possible to notice that the UPR containing the higher amount of HEMA in the formulation (UPR 1.0,
50% HEMA) has the lowest value of in vitro hydrolytic degradation. In this case, the linkages (ester
linkages belonging to the UP segments) are stronger and less available to be degraded, and therefore, the
overall weight loss of the UPR is kept in very low values. It should be also pointed out that the segments of
poly(HEMA) formed during the crosslinking reaction do not degrade in the conditions used to perform the
in vitro hydrolytic degradation test.
The different diacids and diols have a pronounced effect in UPRs degradation behavior. There is an
evident gap of 4%, approximately, between their profiles. The FA containing UPRs (UPR 1) degrade less,
when compared to the other formulations (Figure 33), which can be directly related to their lower swelling
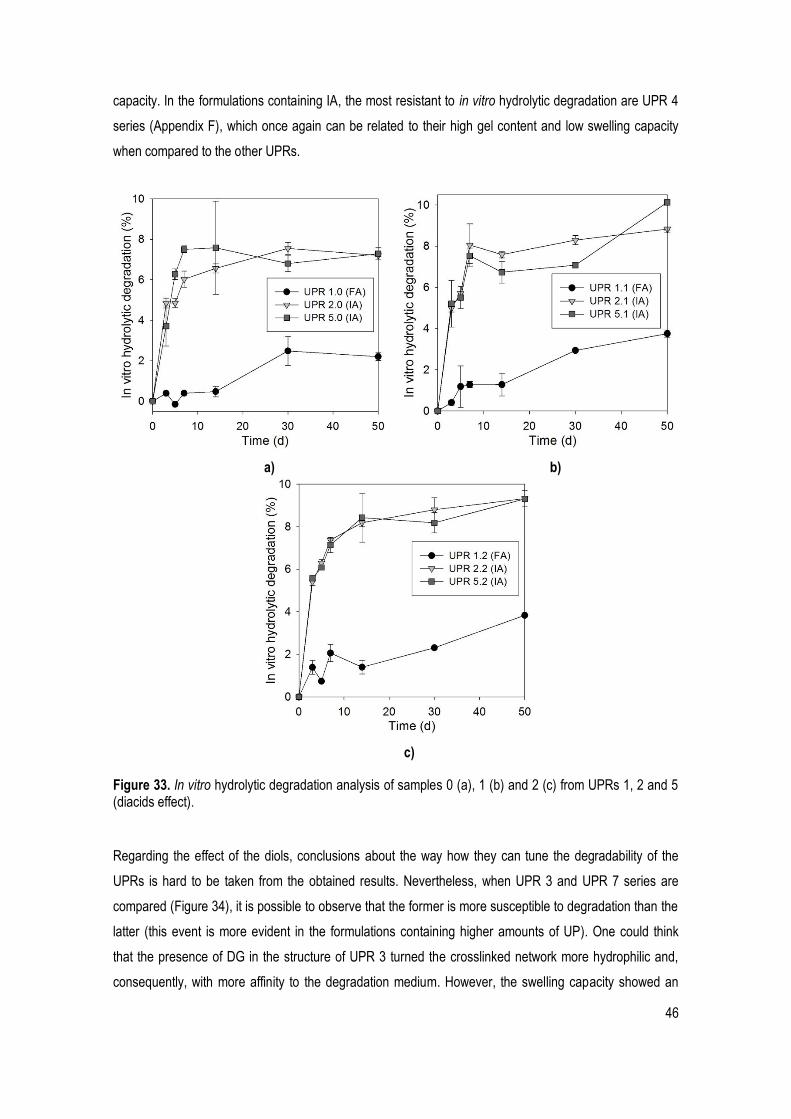
46
capacity. In the formulations containing IA, the most resistant to in vitro hydrolytic degradation are UPR 4
series (Appendix F), which once again can be related to their high gel content and low swelling capacity
when compared to the other UPRs.
a) b)
c)
Figure 33. In vitro hydrolytic degradation analysis of samples 0 (a), 1 (b) and 2 (c) from UPRs 1, 2 and 5 (diacids effect).
Regarding the effect of the diols, conclusions about the way how they can tune the degradability of the
UPRs is hard to be taken from the obtained results. Nevertheless, when UPR 3 and UPR 7 series are
compared (Figure 34), it is possible to observe that the former is more susceptible to degradation than the
latter (this event is more evident in the formulations containing higher amounts of UP). One could think
that the presence of DG in the structure of UPR 3 turned the crosslinked network more hydrophilic and,
consequently, with more affinity to the degradation medium. However, the swelling capacity showed an

47
opposite trend: UPR 7 has a higher swelling capacity than UPR 3. Thus, the reasons behind these
behaviors remain unclear at this point.
a) b)
c)
Figure 34. In vitro hydrolytic degradation analysis of samples 0 (a), 1 (b) and 2 (c) from UPRs 3, 4 and 7 (diols effect).

48
CHAPTER IV. CONCLUSION AND FUTURE WORK
Conclusion
The main objectives of this work were the synthesis of UPs using monomers from renewable resources
and the preparation of their respective resins using biocompatible reactive solvents.
The spectroscopic analysis (FTIR and 1H NMR) indicate that the UPs were successfully synthesized.
However, some optimization is still required, since the presence of unreacted monomers was detected in
some formulations. Additionally, some differences between the molar ratios in the feed and those
calculated by 1H NMR were also observed. The SEC analysis revealed that the UPs presented broad
molecular weight distributions, which is characteristic of products resultant from polycondensation
reactions. Some differences were noticed in the molecular weight values between the UPs, fact that can
be related with the different reactivities of the monomers used. Concerning the thermal stability, the SDT
results showed that all UPs degraded in a single stage, were stable until 390ºC and had an amorphous
nature. In some cases, an initial weight loss was observed, which can be related to the evaporation of
residual monomers. The DMTA analysis showed that all UPs experience a glass transition between -30ºC
and -22ºC. The differences in the values can be attributed to the polyester molecular weight and/or
chemical composition.
Regarding the UPRs, the first characteristic to be evaluated was their gel content. The results indicated
that, in general, the thermally crosslinked network had higher gel content than the photocrosslinked
networks. It was also shown that the HEMA amount and molecular weight of the UPs had important
impact in the gel content. The presence or absence of a specific diacid or diol in the UPs structure seems
to influence also gel content values, but the reasons behind these results remain unaddressed at this
moment and require further studies. The SDT analysis has shown that the UPRs with higher gel content
presented higher thermal stability and a single stage of weight loss, whereas the UPRs with lower gel
contents presented an initial stage of weight loss and less thermal stability. This fact can be related to the
presence of small oligomers or unreacted precursors in the former group of UPRs. It also should be
pointed out that the UPRs had a slightly lower thermal stability than the UPs, which can be related to the
presence of small oligo(HEMA) segments that are bonded in the side of the 3D network and degrade
earlier. The DMTA analysis revealed the existence of two Tg in all formulations, which can be ascribed to
the existence of two different crosslinked phases. The values of E‟ have shown to be dependent on both
HEMA amount and type of formulation, but only at temperatures above 0ºC.
The swelling tests demonstrated that UPR 1 was the group of samples which swelled less. UPR 3 was the
one which swelled more, followed by UPR 2, UPR 7, UPR 4 and UPR 5, respectively. The low values of
swelling capacity obtained are indicative of crosslinked networks with a high hydrophobic nature. The

49
results showed that the swelling capacity of the UPRs enhances with the increase in the amount of HEMA,
which can be justified by the HEMA hydrophilic nature. It was also found that the swelling capacity was
highly dependent on the gel content. On the contrary, the different diacids and diols seemed to have little
influence in this parameter, although some structure/swelling capacity relationships were inferred from the
results. The in vitro hydrolytic degradation tests showed that UPRs were hardly degraded under the
conditions tested. This result can be a consequence of the high hydrophobic nature of the crosslinked
networks. The UPRs containing higher amounts of HEMA showed lower values of weight loss, since
poly(HEMA) segments are not degraded under the conditions tested. The diols showed to have little
impact in the degradation behavior of the UPRs.
To sum up, the main goals of this study were achieved, i.e., the successfully preparation of UPs and UPRs
based on monomers from renewable sources. The results obtained can be seen as important starting
point towards the further optimization of these systems and/or their application in biomedical field.
Future Work
Despite the promising results, there are some issues worth of optimization or/and further analysis.
Regarding the UP‟s formulations, the presence of unreacted monomer is an issue that deserves further
attention. In order to deepen the study about UPs formulations, new monomers could be tested, such as
diols derived from L-lactic acid; and also the relative molar ratios of the monomers could be changed.
Considering the reactive solvent, alternatives to HEMA should be considered, since UPRs prepared with it
are not easily degradable in physiological medium. The use of degradable crosslinkers like diacrylates
derived from L-lactic acid would be of interest.
Finally, the biocompatibility of the UPRs should be further analyzed. Although some of the monomers
have a natural origin and poly(HEMA) is biocompatible, citotoxicity tests would confirm and analyse more
precisely the biocompatibility of these UPRs.

50
REFERENCES
[1] K.-P. H. Rüdiger Kramme and R. S. Pozos, Eds., Springer Handbook of Medical Technology. Berlin, Germany: Springer-Verlag, 2011.
[2] D. G. Peter J. Groen, Marc Wine, “Implantable Medical Devices and EHR Systems,” Virtual Medical Worls, 2007. [Online]. Available: http://www.hoise.com/vmw/07/articles/vmw/LV-VM-06-07-5.html.
[3] K. Bazaka and M. Jacob, “Implantable Devices: Issues and Challenges,” Electronics, vol. 2, no. 1, pp. 1–34, Dec. 2012.
[4] P. S. Malchesky, “Artificial Organs 2012: a year in review,” Artificial organs, vol. 37, no. 3, pp. 324–49, Mar. 2013.
[5] R. M. N. Fisher, John P., Antonios G. Mikos, Pierre M. Galletti, “Tissue Engineering, Prostheses and Artificial Organs,” in in The Biomedical Engineering Handbook: Tissue Engineering and Artificial Organs, 3a ed., J. D. Bronzino, Ed. Taylor & Francis Group, LLC, 2006.
[6] M. Brown, “Special Report: Biomaterials revolution,” Royal Society of Chemistry, 2010. [Online]. Available: http://www.rsc.org/chemistryworld/Issues/2010/July/BiomaterialsRevolution.asp.
[7] M. Poussier, E. Denève, P. Blanc, E. Boulay, M. Bertrand, M. Nedelcu, a Herrero, J.-M. Fabre, and D. Nocca, “A review of available prosthetic material for abdominal wall repair.,” Journal of visceral surgery, vol. 150, no. 1, pp. 52–9, Feb. 2013.
[8] S. Ritika, S. Arjun, K. Sunil, and J. Faraz, “Pulsatile drug delivery system: a review,” International Research Journal of Pharmacy, vol. 3, no. 1, pp. 934–41 ST – Pulsatile Drug Delivery System for Co, 2012.
[9] C. Kiparissides and O. Kammona, “Nanoscale carriers for targeted delivery of drugs and therapeutic biomolecules,” The Canadian Journal of Chemical Engineering, vol. 91, no. 4, p. n/a–n/a, Apr. 2012.
[10] D. M. D. Ribeiro, M. F. M. Colunas, F. A. F. Marques, J. M. Fernandes, P. S. Cunha, and S. Member, “A real time, wearable ECG and continous blood pressure monitoring system for first responders,” in 33rd Annual International Conference of the IEEE EMBS, 2011, pp. 6894–6898.
[11] W. X. LIU and W. F. GAO, “Wireless optical pulsometer system for use in medical filed, has monitoring personal computer attaching monitoring software to display user‟s pulse rate, positional information, body temperature or blood pressure,” JP3167116-U.
[12] D. W. G. Morrison, M. R. Dokmeci, and U. Demirci, “Clinical Applications of Micro- and Nanoscale Biosensors,” in in Biomedical Nanostructures, no. 1, K. E. Gonsalves, C. L. Laurencin, C. R. Halberstadt, and L. S. Nair, Eds. John Wiley & Sons, Inc., 2008, pp. 433–455.
[13] T. Vo-Dinh and B. Cullum, “Biosensors and biochips: advances in biological and medical diagnostics.,” Fresenius Journal Of Analytical Chemistry, vol. 366, no. 6–7, pp. 540–551, 2000.
[14] J. Kirkup, The History and Evolution of Surgical Instruments, vol. 30, no. 3. California, USA: historyofscience.com, 2006.
51
[15] D. F. Williams, “On the mechanisms of biocompatibility,” Biomaterials, vol. 29, no. 20, pp. 2941–2953, Jul. 2008.
[16] S. Bauer, P. Schmuki, K. von der Mark, and J. Park, “Engineering biocompatible implant surfaces. Part I: Materials and surfaces,” Progress in Materials Science, vol. 58, no. 3, pp. 261–326, Apr. 2013.
[17] L. L. Hench and I. Thompson, “Twenty-first century challenges for biomaterials,” Journal of the Royal Society Interface the Royal Society, vol. 7 Suppl 4, pp. S379–91, Aug. 2010.
[18] M. E. Gomes and R. L. Reis, “Biodegradable polymers and composites in biomedical applocations: from catgut to tissue engineering,” International Materials Reviews, vol. 495, pp. 261–273, 2004.
[19] A. C. Vieira, R. M. Guedes, and A. T. Marques, “Development of ligament tissue biodegradable devices: a review,” Journal of biomechanics, vol. 42, no. 15, pp. 2421–30, Nov. 2009.
[20] G. Gaucher, R. H. Marchessault, and J.-C. Leroux, “Polyester-based micelles and nanoparticles for the parenteral delivery of taxanes,” Journal of Controlled Release, vol. 143, no. 1, pp. 2–12, Apr. 2010.
[21] L. Nair and C. Laurencin, “Polymers as biomaterials for tissue engineering and controlled drug delivery,” in in Advances in Biochemical Engineering/Biotechnology, vol. 102, K. Lee and D. Kaplan, Eds. Springer-Verlag, 2006, pp. 47–90.
[22] S. Ramakrishna, J. Mayer, E. Wintermantel, and K. W. Leong, “Biomedical applications of polymer-composite materials: a review,” Composites Science and Technology, vol. 61, no. 9, pp. 1189–1224, 2001.
[23] O. Coulembier, P. Degée, J. L. Hedrick, and P. Dubois, “From controlled ring-opening polymerization to biodegradable aliphatic polyester: Especially poly(β-malic acid) derivatives,” Progress in Polymer Science, vol. 31, no. 8, pp. 723–747, Aug. 2006.
[24] V. Koutsos, “Polymeric materials: an introduction,” in in ICE Manual of Construction Materials, London, UK: Institution of Civil Engineers, 2009, pp. 571–577.
[25] E. A. Rietman, “They‟re everywhere!,” in in Polymer chemistry: introduction to an indispensable science, Virginia, USA: National Science Teachers Association Press, 2004, pp. 3–12.
[26] S. Sullalti, “New eco-friendly polyesters from renewable sources”, MSc thesis, Bologna University, 2012.
[27] P. Bordes, E. Pollet, and L. Averous, “Nano-biocomposites: biodegradable polyester/nanoclay systems,” Progress in Polymer Science, vol. 34, no. 2, pp. 125–155, Feb. 2009.
[28] “Health Research,” European Comission Website, 2012. [Online]. Available: http://ec.europa.eu/research/health/index_en.html.
[29] “Biomedical technologies,” European Comission Website, 2012. [Online]. Available: http://ec.europa.eu/research/health/biotechnology/biomedical-technologies/index_en.html.

52
[30] “A.SPIRE – supporting and implementing SPIRE PPP,” Sustainable Process Industry through Resource and Energy Efficiency Website, 2012. [Online]. Available: http://www.spire2030.eu/about-spire.
[31] “European Renewable Resources and Materials Association,” National Non-Food Crops Centre Website, 2002. [Online]. Available: http://www.errma.com.
[32] “Excellent Science: Horizon 2020,” European Comission Website, 2011. [Online]. Available: http://ec.europa.eu/research/horizon2020/index_en.cfm?pg=excellent-science.
[33] U. Edlund and A. C. Albertsson, “Polyesters based on diacid monomers,” Advanced drug delivery reviews, vol. 55, no. 4, pp. 585–609, Apr. 2003.
[34] A. Albertsson and I. K. Varma, “Aliphatic Polyesters: Synthesis, Properties and Applications,” in in Advances in Polymer Science, vol. 157, Springer-Verlag, 2002, pp. 1–40.
[35] “Lists of acceptable polymers for use in food packaging applications,” Health Canada, 2009. [Online]. Available: http://www.hc-sc.gc.ca/fn-an/legislation/guide-ld/polymers_tc-polymere_tm-eng.php.
[36] K. Jonhson and L. Yang, “Preparation, Properties and Applications of Unsaturated Polyesters,” in in Modern Polyesters: Chemistry and Technology of Polyesters and Copolyesters, J. Scheirs and T. Long, Eds. West Sussex, UK: John Wiley & Sons, Inc., 2003, pp. 699–712.
[37] “Labelling, logos, charts,” European Bioplastics, 2013. [Online]. Available: http://en.european-bioplastics.org/press/press-pictures/labelling-logos-charts.
[38] P. Pan and Y. Inoue, “Polymorphism and isomorphism in biodegradable polyesters,” Progress in Polymer Science, vol. 34, no. 7, pp. 605–640, Jul. 2009.
[39] R. J. Müller, I. Kleeberg, and W. D. Deckwer, “Biodegradation of polyesters containing aromatic constituents.,” Journal of biotechnology, vol. 86, no. 2, pp. 87–95, Mar. 2001.
[40] H. Seyednejad, A. H. Ghassemi, C. F. van Nostrum, T. Vermonden, and W. E. Hennink, “Functional aliphatic polyesters for biomedical and pharmaceutical applications,” Journal of controlled release: official journal of the Controlled Release Society, vol. 152, no. 1, pp. 168–76, May 2011.
[41] A. Finne and A. Albertsson, “New Functionalized Polyesters to Achieve Controlled,” Journal of Polymer Science: Part A: Polymer Chemistry, vol. 42, pp. 444–452, 2003.
[42] A. Rodriguez-Galan, L. Franco, and J. Puiggali, “Degradable Poly(ester amide)s for Biomedical Applications,” Polymers, vol. 3, no. 1, pp. 65–99, Dec. 2010.
[43] Q. Liu, L. Jiang, R. Shi, and L. Zhang, “Synthesis, preparation, in vitro degradation, and application of novel degradable bioelastomers - A review,” Progress in Polymer Science, vol. 37, no. 5, pp. 715–765, May 2012.
[44] M. Hakkarainen, “Aliphatic Polyesters: Abiotic and Biotic Degradation and Degradation Products,” in in Advances in Polymer Science, vol. 157, Springer-Verlag, 2002.

53
[45] T. A. Akopova, T. S. Demina, A. N. Shchegolikhin, T. S. Kurkin, C. Grandfils, N. S. Perov, A. S. Kechekyan, and A. N. Zelenetskii, “A Novel Approach to Design Chitosan-Polyester Materials for Biomedical Applications,” International Journal of Polymer Science, vol. 2012, pp. 1–10, 2012.
[46] S. Ma ̊lberg, P. Plikk, A. Finne-Wistrand, and A.-C. Albertsson, “Design of Elastomeric Homo- and Copolymer Networks of Functional Aliphatic Polyester for Use in Biomedical Applications,” Chemistry of Materials, vol. 22, no. 9, pp. 3009–3014, May 2010.
[47] I. Fabela, “Photopolymerization and Characterization of Unsaturated Polyesters Resins,” MSc thesis, University of Coimbra, 2012.
[48] M. O. Trollsas, “Substituted polycaprolactone for coating,” EP2162503A1, US200802991642010.
[49] A. Löfgren, A.-C. Albertsson, P. Dubois, and R. Jérôme, “Recent Advances in Ring-Opening Polymerization of Lactones and Related Compounds,” Journal of Macromolecular Science, Part C: Polymer Reviews, vol. 35, no. 3, pp. 379–418, Aug. 1995.
[50] A. J. R. Lasprilla, G. a R. Martinez, B. H. Lunelli, A. L. Jardini, and R. M. Filho, “Poly-lactic acid synthesis for application in biomedical devices - a review,” Biotechnology advances, vol. 30, no. 1, pp. 321–328, 2012.
[51] L. Xiao, B. Wang, G. Yang, and M. Gauthier, “Poly(Lactic Acid)-Based Biomaterials: Synthesis, Modification and Applications,” in in Biomedical Science, Engineering and Technology, D. N. Ghista, Ed. InTech, 2012, pp. 247–282.
[52] Sigma-Aldrich, “Polymer Additives,” Sigma-Aldrich Website, 2013. [Online]. Available: http://www.sigmaaldrich.com/materials-science/material-science-products.html?TablePage=16371222.
[53] H. Muller and R. Gachter, Plastics Additives Handbook: Stabilizers, Processing AIDS, Plasticizers, Fillers, Reinforcements, Colorants for Thermoplastics, 4a ed. Hanser Gardner Pubns, 1993.
[54] C. Wolf-Brandstetter, S. Roessler, S. Storch, U. Hempel, U. Gbureck, B. Nies, S. Bierbaum, and D. Scharnweber, “Physicochemical and cell biological characterization of PMMA bone cements modified with additives to increase bioactivity,” Journal of biomedical materials research. Part B, Applied biomaterials, vol. 101, no. 4, pp. 599–609, May 2013.
[55] D. Andjelkovic, D. Culkin, and R. Loza, “Unsaturated Polyester Resins Derived from Renewable Resources,” in COMPOSITES & POLYCON, 2009, pp. 1–6.
[56] J.-M. Raquez, M. Deléglise, M.-F. Lacrampe, and P. Krawczak, “Thermosetting (bio)materials derived from renewable resources: A critical review,” Progress in Polymer Science, vol. 35, no. 4, pp. 487–509, Apr. 2010.
[57] C. Costa, “Síntese e Caracterização de Poliésteres Insaturados - Influência da Estrutura nas Propriedades da Resina”, MSc thesis, University of Coimbra, 2011.
[58] J. K. Fink, Reactive Polymers Fundamentals and Applications: a Concise Guide to Industrial Polymers. New York, USA: William Andrew Publishing, 2005.
[59] Y. Yang and L. Lee, “Microstructure formation in the cure of unsaturated polyester resins,” Polymer, vol. 29, no. 10, pp. 1793–1800, Oct. 1988.
54
[60] M. a. R. Meier, J. O. Metzger, and U. S. Schubert, “Plant oil renewable resources as green alternatives in polymer science,” Chemical Society Reviews, vol. 36, no. 11, p. 1788, 2007.
[61] M. N. Belgacem and A. Gandini, Eds., Monomers, Polymers and Composites from Renewable Resources, 1a ed. UK: Elsevier, 2008.
[62] X. Feng, A. J. East, W. Hammond, M. Jaffe, and L. Street, “Sugar-Based Chemicals for Environmentally Sustainable Applications,” in in ACS Symposium Series: In Contemporary Science of Polymeric Materials, no. 5, L. Korugic-Karasz, Ed. Washington, USA: Amarican Chemical Society, 2010, pp. 3–27.
[63] S. Dworakowska, W. Kasprzyk, S. Bednarz, and D. Bogdał, “Polyesters from renewable sources,” in 15th International Electronic Conference on Synthetic Organic Chemistry, 2011.
[64] P. Bloom and P. Venkitasubramanian, “Monomers and polymers from bioderived carbon,” US 2009/0018300 A12009.
[65] P. S. Sathiskumar and G. Madras, “Synthesis, characterization, degradation of biodegradable castor oil based polyesters,” Polymer Degradation and Stability, vol. 96, no. 9, pp. 1695–1704, Sep. 2011.
[66] J. Retuert, M. Pedram, F. Martínez, and M. Jeria, “Soluble itaconic acid-ethylene glycol polyesters,” Bulletin of the Chemical Society of Japan, vol. 66, pp. 1707–1708, 1993.
[67] S. Ma, X. Liu, Y. Jiang, Z. Tang, C. Zhang, and J. Zhu, “Bio-based epoxy resin from itaconic acid and its thermosets cured with anhydride and comonomers,” Green Chemistry, vol. 15, no. 1, p. 245, 2013.
[68] M. Worzakowska, “Curing reaction of unsaturated (epoxy) polyesters based on different aliphatic glycols,” Journal of Thermal Analysis and Calorimetry, vol. 102, no. 2, pp. 745–750, Dec. 2009.
[69] N. Mohammad, “Synthesis, characterization and properties of the new unsaturated polyester resins for composite applications,” MARA University of Technology, 2007.
[70] F. Fenouillot, a. Rousseau, G. Colomines, R. Saint-Loup, and J.-P. Pascault, “Polymers from renewable 1,4:3,6-dianhydrohexitols (isosorbide, isomannide and isoidide): A review,” Progress in Polymer Science, vol. 35, no. 5, pp. 578–622, May 2010.
[71] “Bio-based, petroleum-free ingredients formulated for higher performance,” DuPont Website, 2011. [Online]. Available: http://www2.dupont.com/Bio-based_Propanediol/en_CN.
[72] S. S. Umare, a. S. Chandure, and R. a. Pandey, “Synthesis, characterization and biodegradable studies of 1,3-propanediol based polyesters,” Polymer Degradation and Stability, vol. 92, no. 3, pp. 464–479, Mar. 2007.
[73] J. Kroschwitz and F. M. Herman, Encyclopedia of Polymer Science and Techonology, 3a ed. John Wiley & Sons, 2003.
[74] J. Coates, “Interpretation of Infrared Spectra, A Practical Approach,” Encyclopedia of Analytical Chemistry. John Wiley& Sons, pp. 10815–10837, 2000.
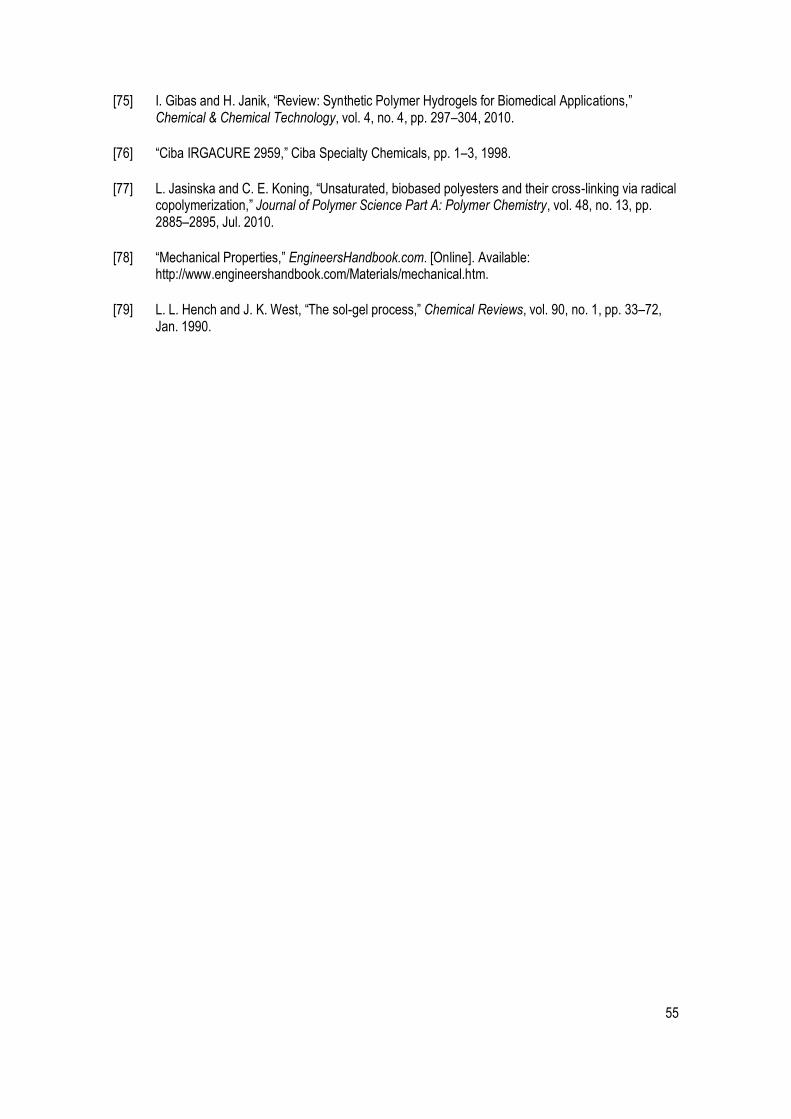
55
[75] I. Gibas and H. Janik, “Review: Synthetic Polymer Hydrogels for Biomedical Applications,” Chemical & Chemical Technology, vol. 4, no. 4, pp. 297–304, 2010.
[76] “Ciba IRGACURE 2959,” Ciba Specialty Chemicals, pp. 1–3, 1998.
[77] L. Jasinska and C. E. Koning, “Unsaturated, biobased polyesters and their cross-linking via radical copolymerization,” Journal of Polymer Science Part A: Polymer Chemistry, vol. 48, no. 13, pp. 2885–2895, Jul. 2010.
[78] “Mechanical Properties,” EngineersHandbook.com. [Online]. Available: http://www.engineershandbook.com/Materials/mechanical.htm.
[79] L. L. Hench and J. K. West, “The sol-gel process,” Chemical Reviews, vol. 90, no. 1, pp. 33–72, Jan. 1990.
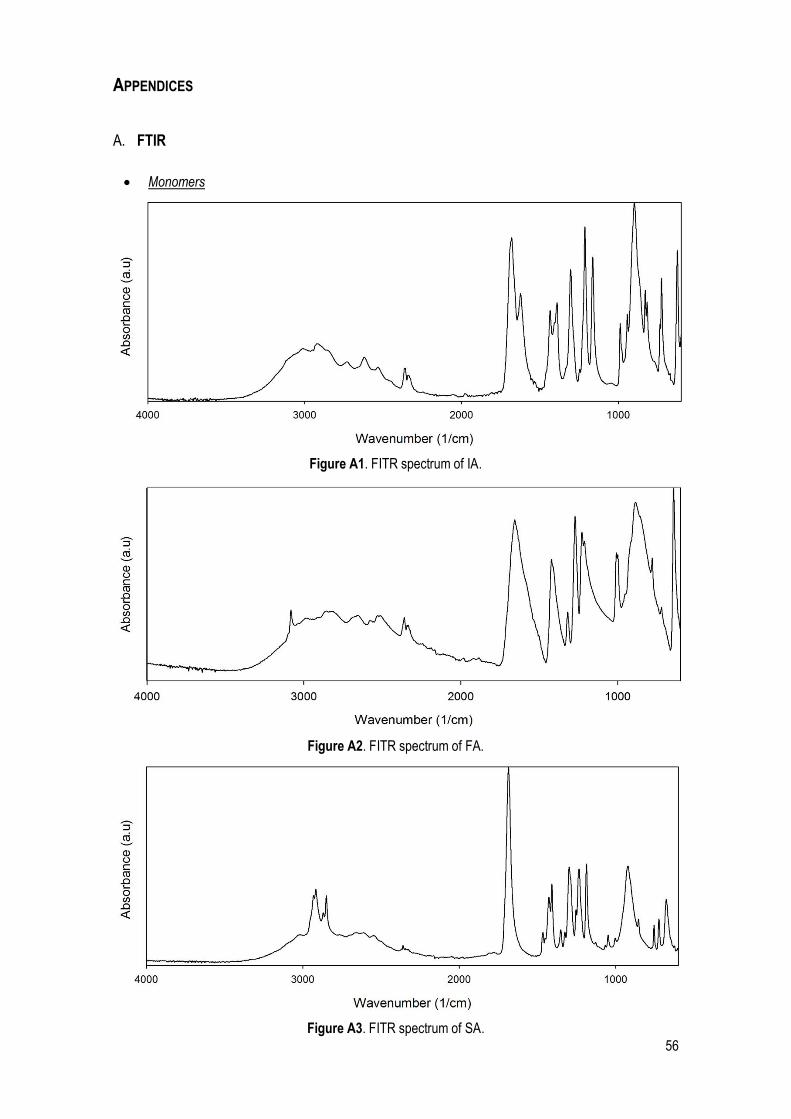
56
APPENDICES
A. FTIR
Monomers
Figure A1. FITR spectrum of IA.
Figure A2. FITR spectrum of FA.
Figure A3. FITR spectrum of SA.
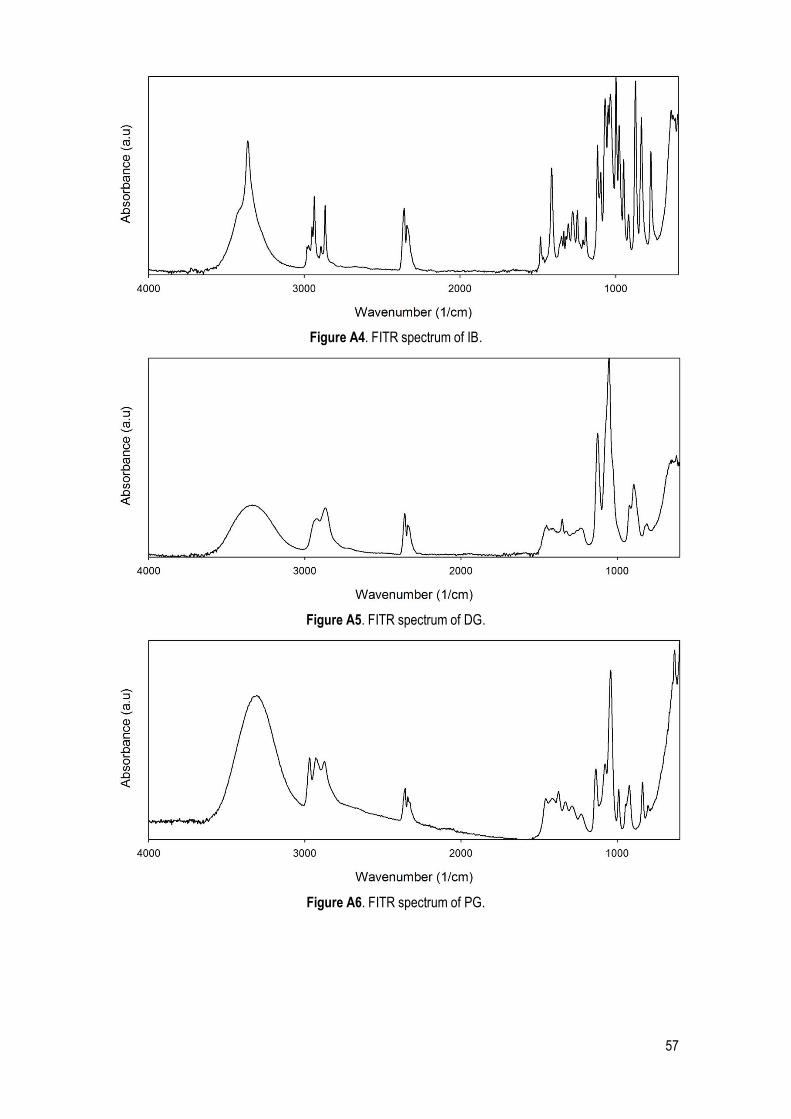
57
Figure A4. FITR spectrum of IB.
Figure A5. FITR spectrum of DG.
Figure A6. FITR spectrum of PG.

58
Figure A7. FITR spectrum of PDO.
UPs
Figure A8. FITR spectrum of UP 2.0.
Figure A9. FITR spectrum of UP 2.1.
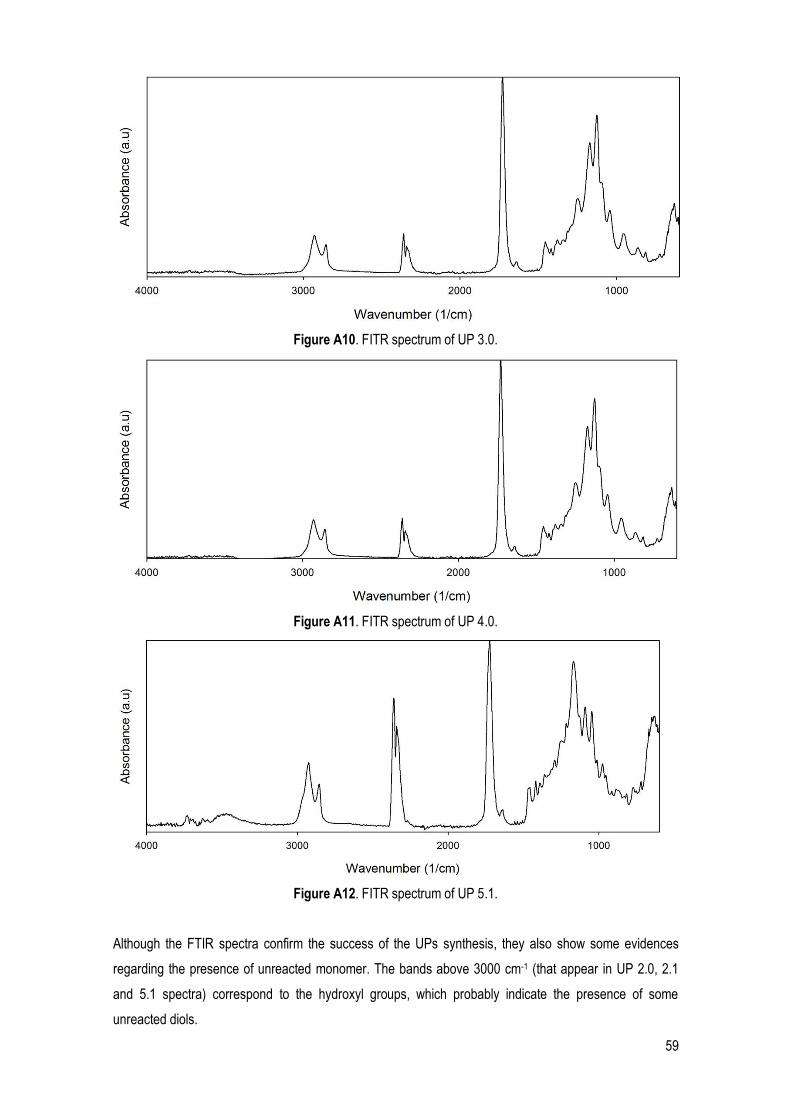
59
Figure A10. FITR spectrum of UP 3.0.
Figure A11. FITR spectrum of UP 4.0.
Figure A12. FITR spectrum of UP 5.1.
Although the FTIR spectra confirm the success of the UPs synthesis, they also show some evidences
regarding the presence of unreacted monomer. The bands above 3000 cm-1 (that appear in UP 2.0, 2.1
and 5.1 spectra) correspond to the hydroxyl groups, which probably indicate the presence of some
unreacted diols.

60
B. 1H NMR
Monomers
The chemical composition of monomers was confirmed by 1H NMR spectra. The number and quantity of
protons expected were identified in each spectrum. The peaks at 1.70 and 3.60 ppm represent the test
solvent, THF, and the absence of OH groups peaks in some diacids is explained by the their continuous
interaction and interchange with the water present in the test, which oftentimes hampers their detection.
The peak around 2.50 ppm seen in diols spectra corresponds to the saturation point of the water, which is
a consequence of the test procedure; and the absence of OH groups peaks in IB spectrum is related to
their unique and complex structure. Nevertheless, this absence seems irrelevant before all the other peaks
that are consistent with the predicted IB chemical composition.
Figure B1. 1H NMR spectrum of FA.
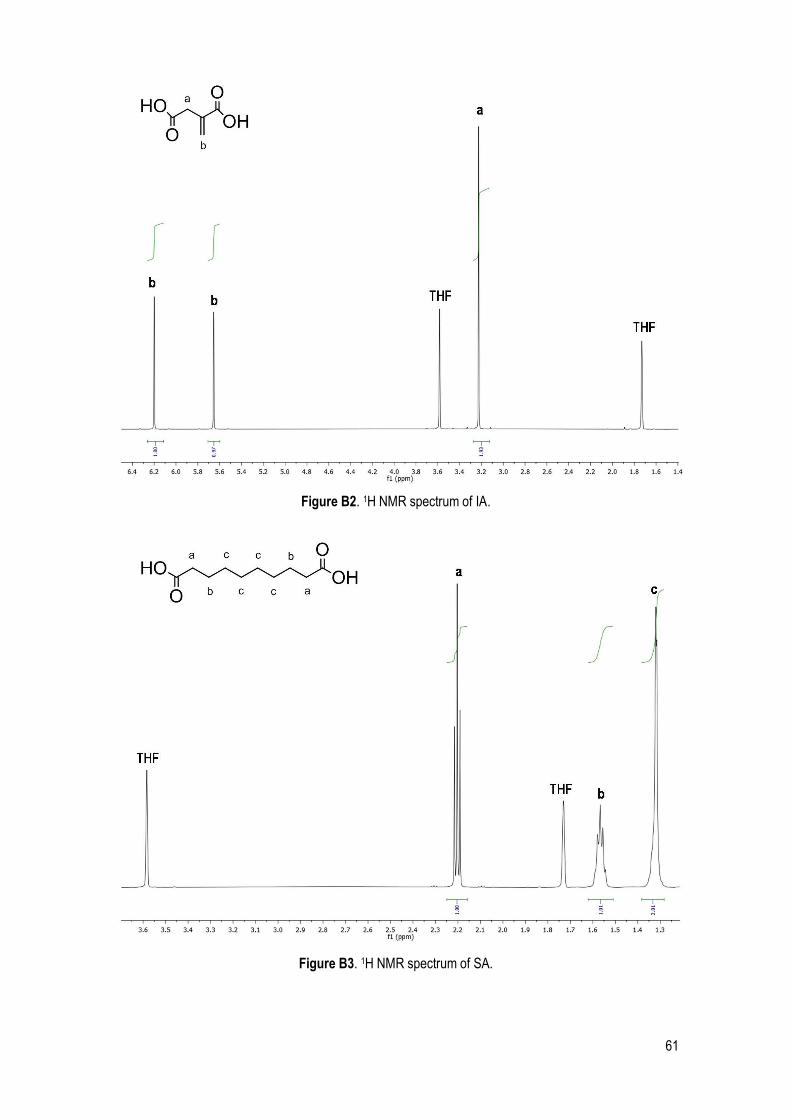
61
Figure B2. 1H NMR spectrum of IA.
Figure B3. 1H NMR spectrum of SA.
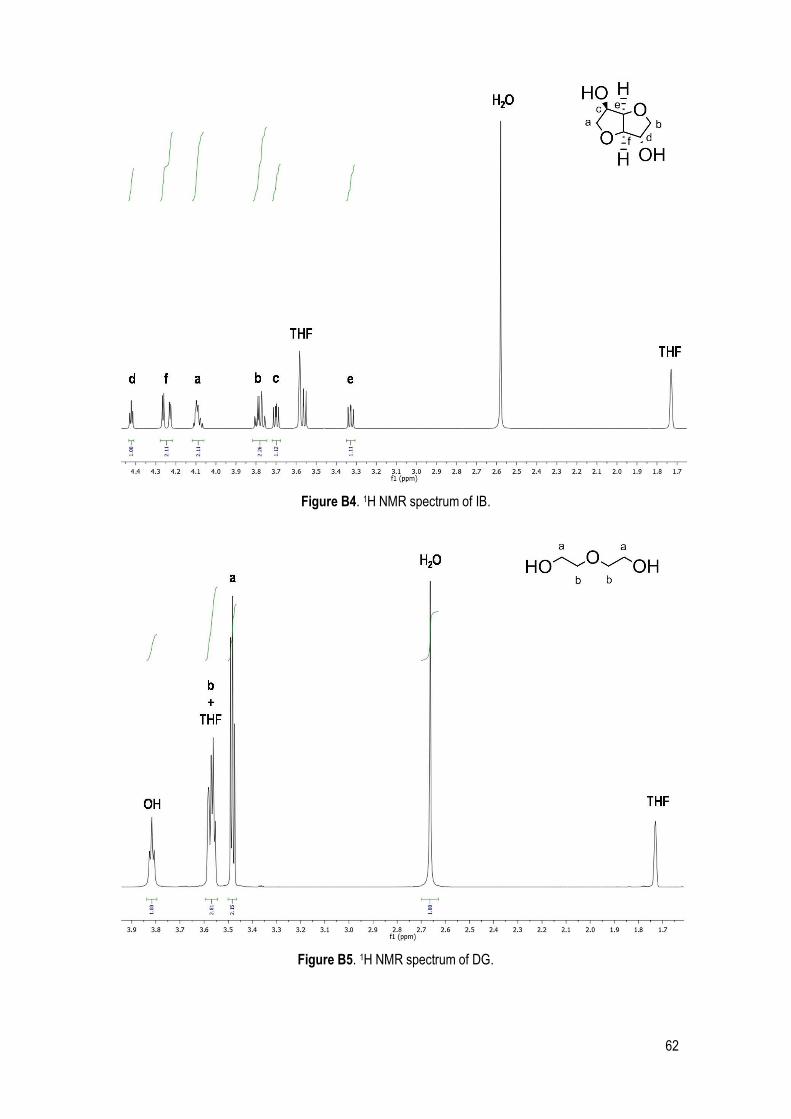
62
Figure B4. 1H NMR spectrum of IB.
Figure B5. 1H NMR spectrum of DG.

63
Figure B6. 1H NMR spectrum of PG.
Figure B7. 1H NMR spectrum of PDO.

64
UPs
Figure B8. 1H NMR spectrum of UP 2.1. The # symbol correspond to the unreacted diethylene glycol.
Figure B9. 1H NMR spectrum of UP 3.0. The # symbol correspond to the unreacted diethylene glycol.
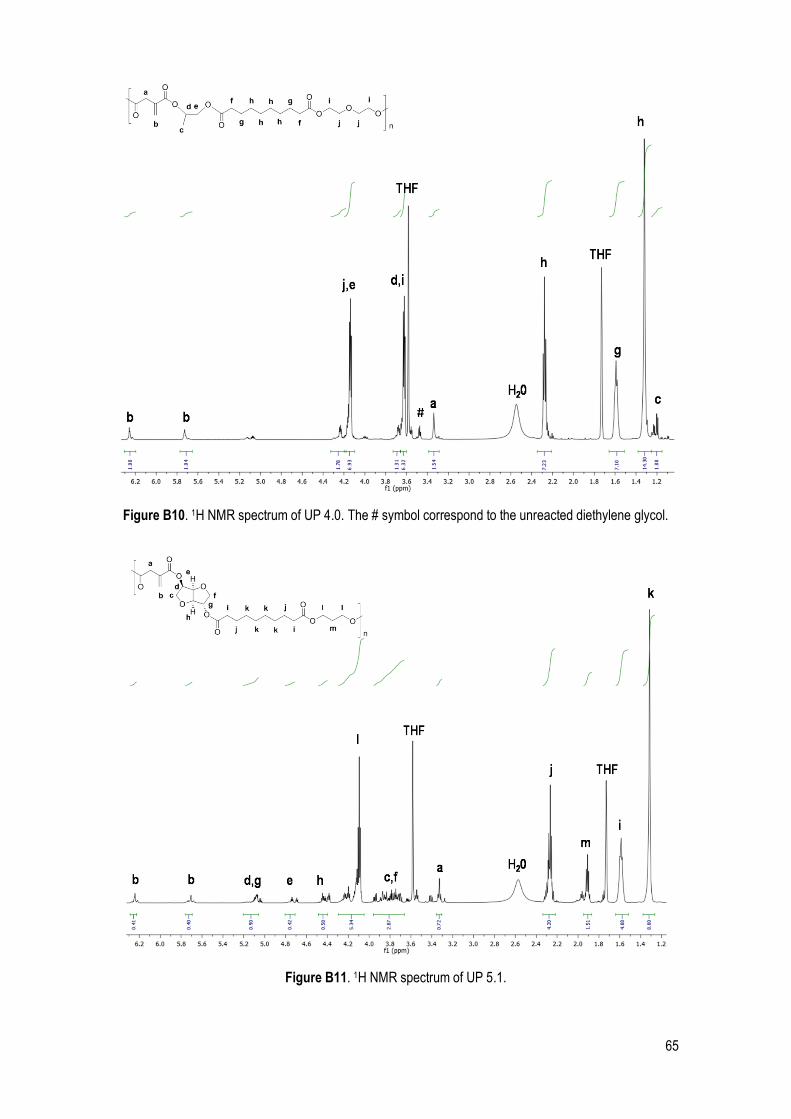
65
Figure B10. 1H NMR spectrum of UP 4.0. The # symbol correspond to the unreacted diethylene glycol.
Figure B11. 1H NMR spectrum of UP 5.1.
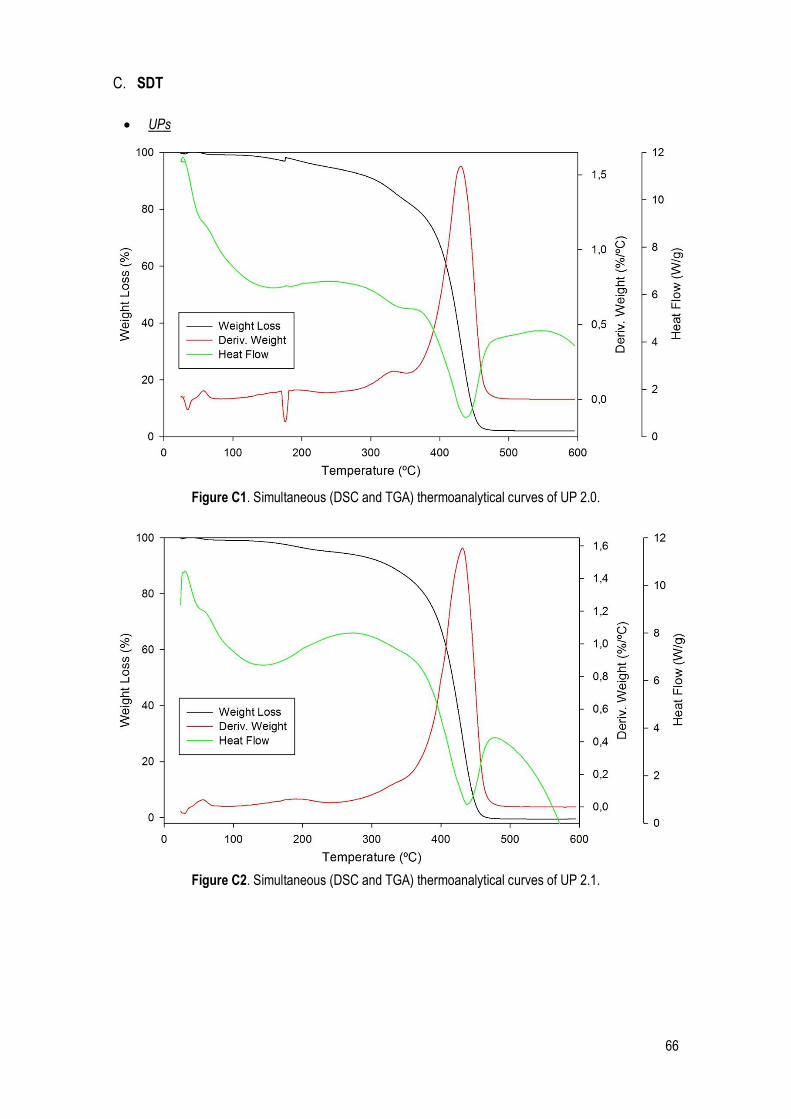
66
C. SDT
UPs
Figure C1. Simultaneous (DSC and TGA) thermoanalytical curves of UP 2.0.
Figure C2. Simultaneous (DSC and TGA) thermoanalytical curves of UP 2.1.
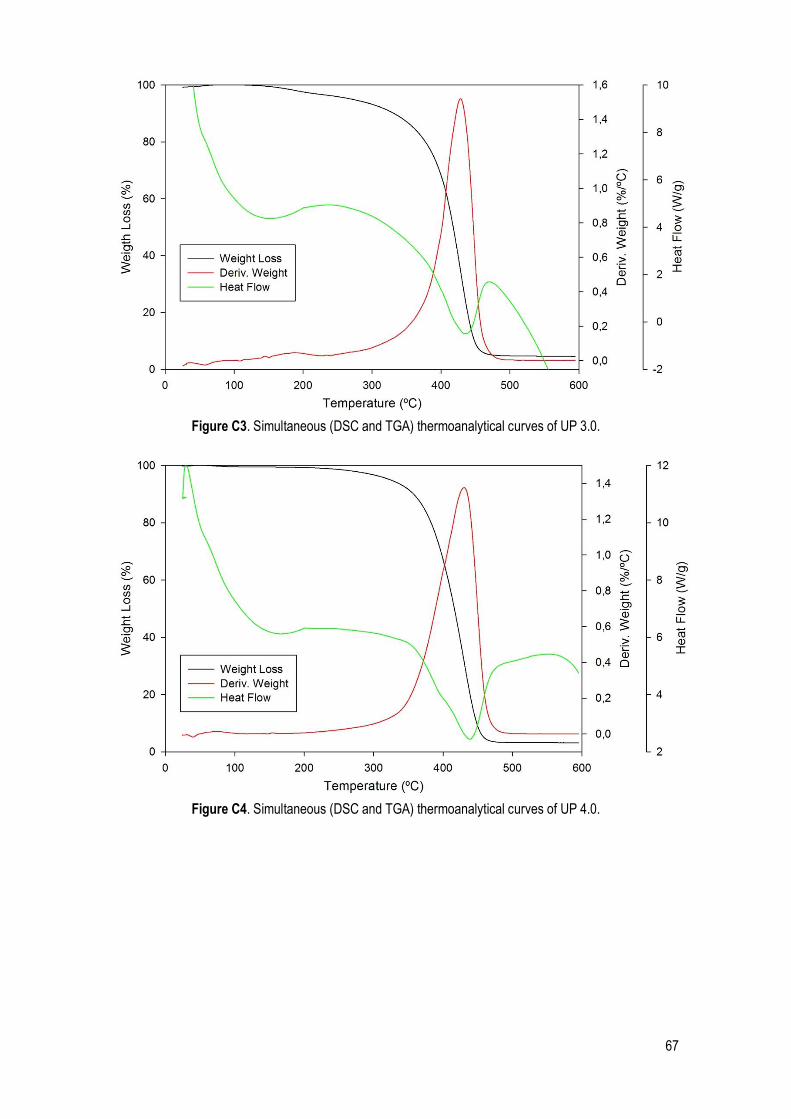
67
Figure C3. Simultaneous (DSC and TGA) thermoanalytical curves of UP 3.0.
Figure C4. Simultaneous (DSC and TGA) thermoanalytical curves of UP 4.0.
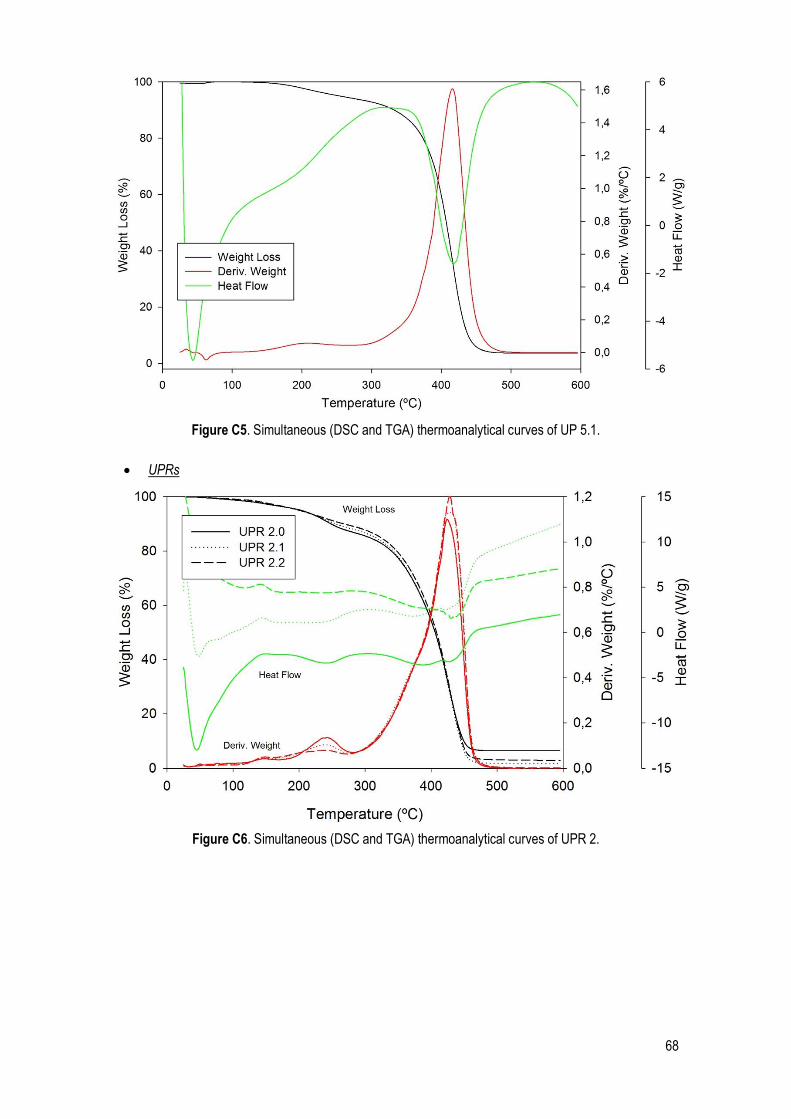
68
Figure C5. Simultaneous (DSC and TGA) thermoanalytical curves of UP 5.1.
UPRs
Figure C6. Simultaneous (DSC and TGA) thermoanalytical curves of UPR 2.
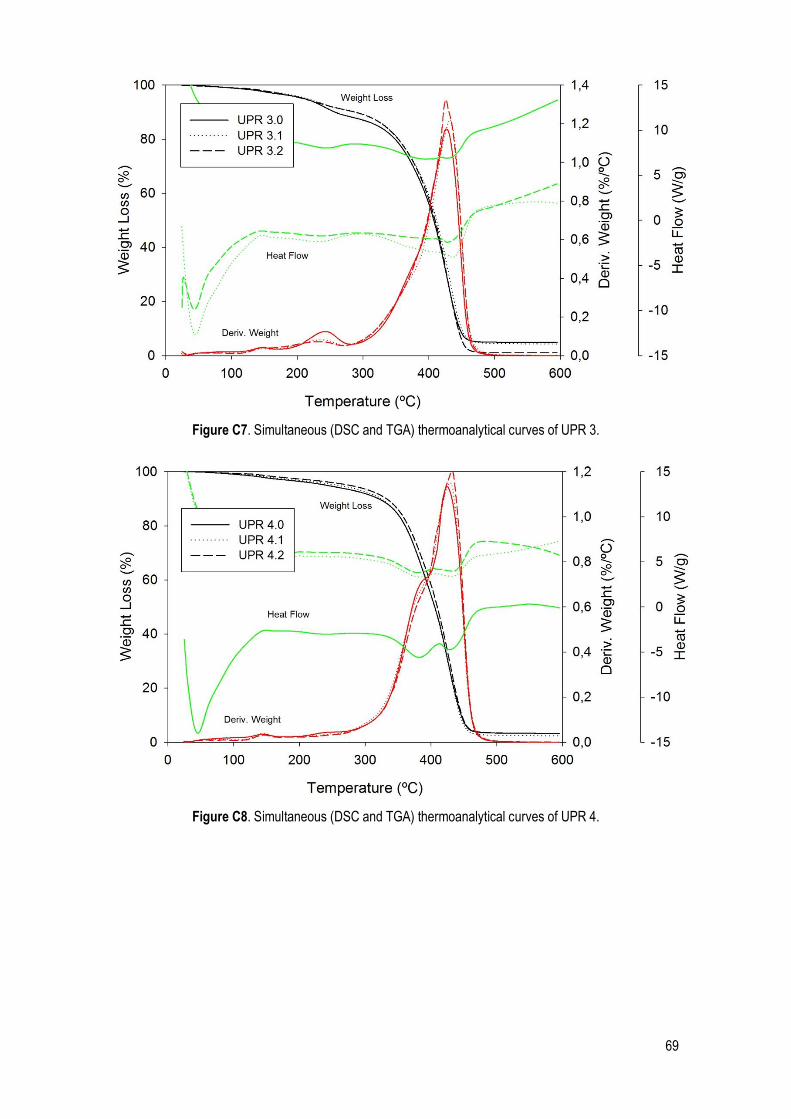
69
Figure C7. Simultaneous (DSC and TGA) thermoanalytical curves of UPR 3.
Figure C8. Simultaneous (DSC and TGA) thermoanalytical curves of UPR 4.

70
Figure C9. Simultaneous (DSC and TGA) thermoanalytical curves of UPR 5.
Figure C10. Simultaneous (DSC and TGA) thermoanalytical curves of UPR 7.
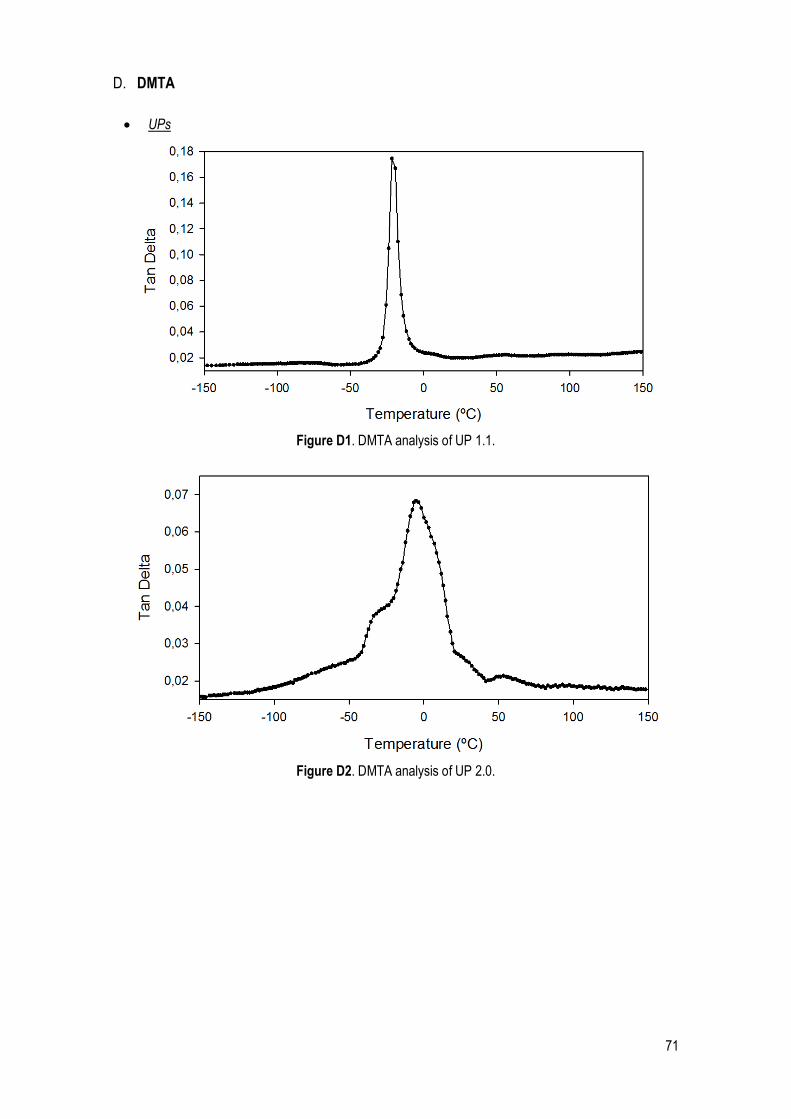
71
D. DMTA
UPs
Figure D1. DMTA analysis of UP 1.1.
Figure D2. DMTA analysis of UP 2.0.

72
Figure D3. DMTA analysis of UP 2.1.
Figure D4. DMTA analysis of UP 3.0.
Figure D5. DMTA analysis of UP 4.0.

73
Figure D6. DMTA analysis of UP 5.1.
UPRs
Figure D7. DMTA analysis of UPR 2.
Figure D8. DMTA analysis of UPR 3.
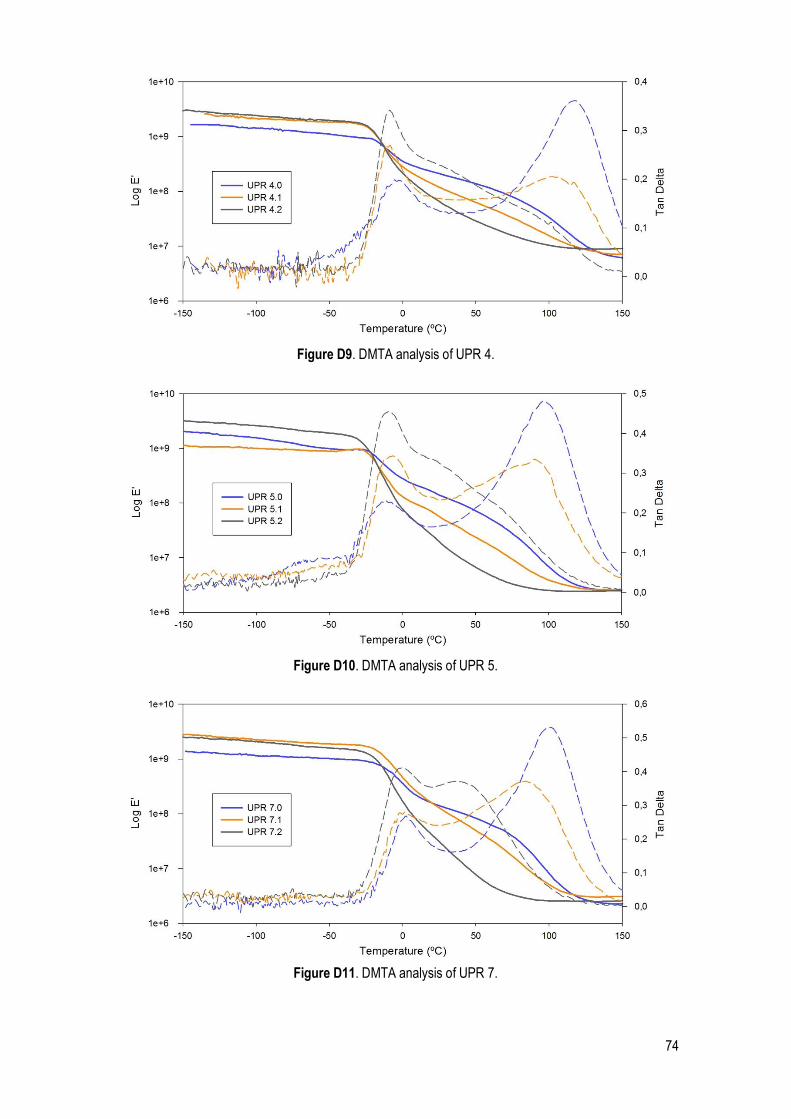
74
Figure D9. DMTA analysis of UPR 4.
Figure D10. DMTA analysis of UPR 5.
Figure D11. DMTA analysis of UPR 7.
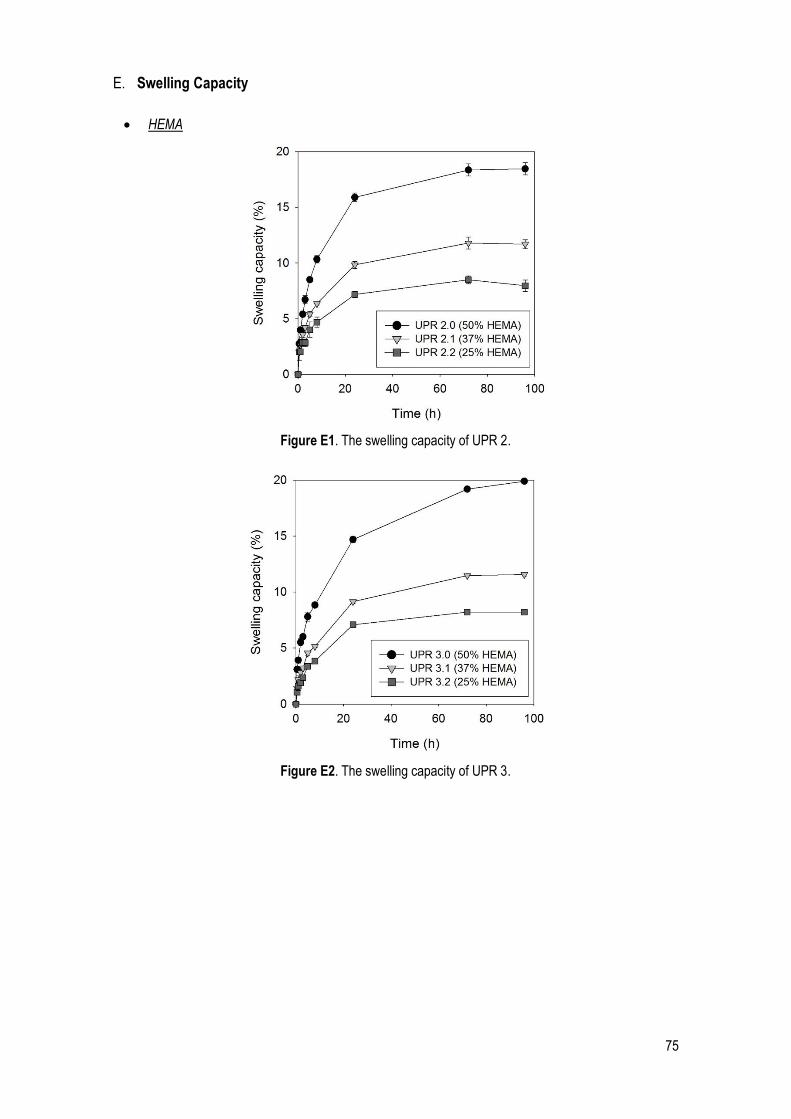
75
E. Swelling Capacity
HEMA
Figure E1. The swelling capacity of UPR 2.
Figure E2. The swelling capacity of UPR 3.

76
Figure E3. The swelling capacity of UPR 4.
Figure E4. The swelling capacity of UPR 5.
Figure E5. The swelling capacity of UPR 7.

77
F. In vitro hydrolytic degradation
HEMA
Figure F1. The In vitro hydrolytic degradation of UPR 2.
Figure F2. The In vitro hydrolytic degradation of UPR 3.
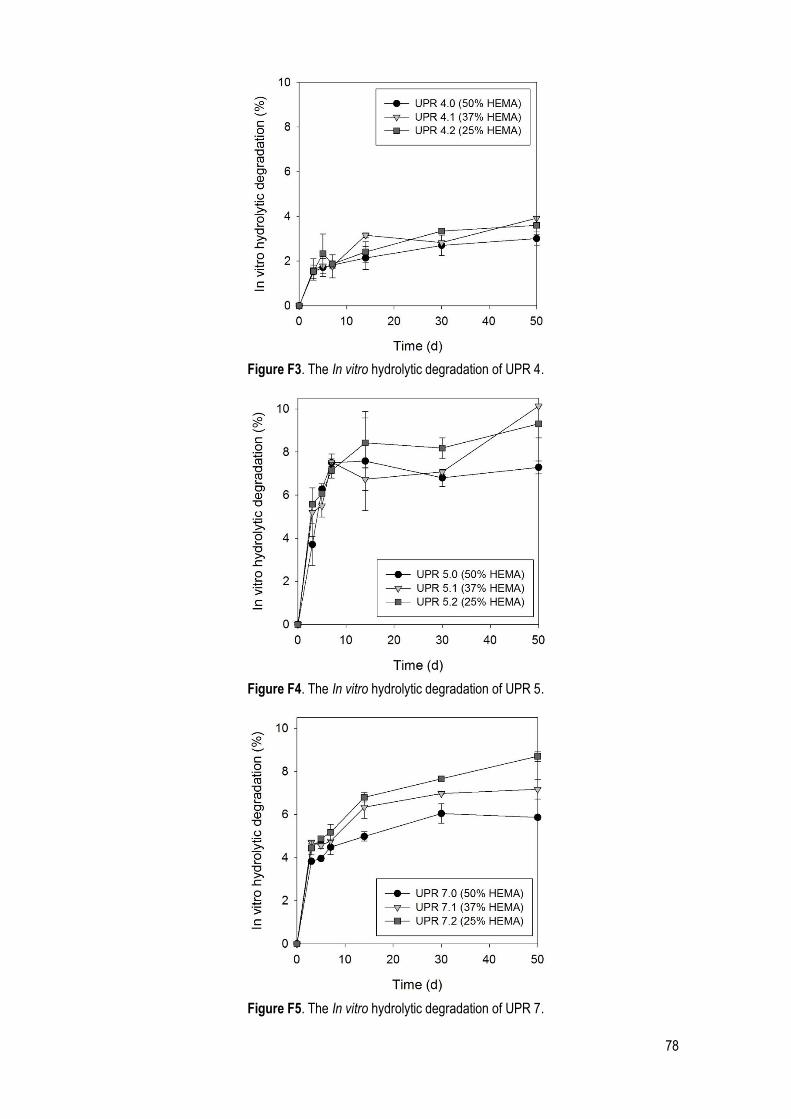
78
Figure F3. The In vitro hydrolytic degradation of UPR 4.
Figure F4. The In vitro hydrolytic degradation of UPR 5.
Figure F5. The In vitro hydrolytic degradation of UPR 7.