DEVELOPMENT OF UNDOPED, DOPED AND CODOPED BORON...
44
DEVELOPMENT OF UNDOPED, DOPED AND CODOPED BORON SILICATE COMPOSITE AS THERMOLUMINESCENT DOSIMETERS FOR MEDIUM AND HIGH DOSE LEVELS BAHRA MOHAMMED NOORI HASSAN UNIVERSITI SAINS MALAYSIA 2017
Transcript of DEVELOPMENT OF UNDOPED, DOPED AND CODOPED BORON...

DEVELOPMENT OF UNDOPED, DOPED AND
CODOPED BORON SILICATE COMPOSITE AS
THERMOLUMINESCENT DOSIMETERS FOR
MEDIUM AND HIGH DOSE LEVELS
BAHRA MOHAMMED NOORI HASSAN
UNIVERSITI SAINS MALAYSIA
2017

DEVELOPMENT OF UNDOPED, DOPED AND
CODOPED BORON SILICATE COMPOSITE AS
THERMOLUMINESCENT DOSIMETERS FOR
MEDIUM AND HIGH DOSE LEVELS
by
BAHRA MOHAMMED NOORI HASSAN
Thesis submitted in fulfillment of the requirements
for the degree of
Doctor of Philosophy
March 2017

1. SPECIAL DEDICATION To:
My late Parents
My Siblings
Nisrin, Omer, Amina, Marjan, Fauzia, Ali
My Nephews and Nieces

ii
ACKNOWLEDGMENT
First and above all, I praise God, Alhamdulillah for providing me the courage,
capability and patience to proceed successfully. This thesis appears in its current form
thanks to the assistance and guidance of several people. I would therefore like to express
my sincere gratitude to all of them.
I offer my great thanks to my advisor Prof. Dr. Mohamad Suhaimi Jaafar for his
continuous excellent support during my PhD study, I have been extremely lucky to have
a main supervisor who has cared so much about my work. His careful editing has
contributed enormously to the production of this thesis. I greatly appreciate his excellent
support. I also want to express my deep thanks to my co-supervisor
Prof. Dr. Husin Wagiran of Universiti Teknologi Malaysia who has also responded to
all my questions and queries. I am really grateful for his excellent support.
I would like to thank the School of Physics, Universiti Sains Malaysia (USM), all
the staff of the Medical Physics Laboratory and Radiation Biophysics Laboratory for
their collaboration, especially that of Mr. Mohad Rizal Rodin and Mr. Hazhar Hassan.
My thanks also goes to all the staff in the Physics Department, Universiti Teknologi
Malaysia (UTM), for assisting and caring so much and giving me such great
encouragement. You have assist so much, all along with Mr. Saiful, Mrs. Anisah, Mr.
Johari and Mr. Jaafar. My gratitude also goes to Physics Department, Universiti
Kebangsaan Malaysia (UKM) in particular Mr. Ahmad Taqim and Department of
Radiotherapy and Oncology, Pantai Hospital, Penang in particular Miss Azean for
performing irradiation on my behalf. My gratitude also goes to my University
(Soran University in Kurdistan Region –Iraq) for giving me the opportunity to complete
my study in Malaysia.
A Sincere thanks to Dr. Ismail Rammadhan, who has been extremely keen to
support me throughout my study and to all my friends; particularly, Dr. Najeba,
Dr.Pegah, Ain Nabilah, Baharak, Rawnaq, Nor Syuhada, Suhailah, Nabilah in USM as
well as Nurul Syazlin in UTM for helping and encouraging me on improving my project,
even it was by one word.
Finally, special thanks to my eldest brother Omer, for his constant support and for
always been there for me in times of need. I appreciate all his help and his kindness. My
siblings, nephews and nieces, thank you for your support and encouragement.

iii
TABLE OF CONTENTS
ACKNOWLEDGMENT ................................................................................................... ii
TABLE OF CONTENTS .................................................................................................. ii
LIST OF TABLES ......................................................................................................... viii
LIST OF FIGURES ........................................................................................................... x
LIST OF ABBREVATIONS ........................................................................................... xv
LIST OF SYMBOLS ...................................................................................................... xvi
ABSTRAK ................................................................................................................... xviii
ABSTRACT ..................................................................................................................... xx
CHAPTER1: INTRODUCTION .................................................................................... 1
1.1 Introduction ............................................................................................................ 1
1.2 Statement of the Problem ....................................................................................... 3
1.3 Objectives of the research ...................................................................................... 4
1.4 Scope of the research .............................................................................................. 4
1.5 Outline of thesis ..................................................................................................... 5
CHAPTER 2: LITERATURE REVIEW ....................................................................... 6
2.1 Introduction ............................................................................................................ 6
2.2 Luminescence ......................................................................................................... 6
2.2.1 Fluorescence ............................................................................................... 6
2.2.2 Phosphorescence......................................................................................... 7

iv
2.2.3 Model of thermoluminescence ................................................................... 8
2.3 Glow curve theory ................................................................................................ 10
2.3.1 First order kinetics .................................................................................... 10
2.3.2 Second –order kinetics ............................................................................. 12
2.3.3 General–Order Kinetic ............................................................................. 13
2.4 Applications of the thermoluminescence ............................................................. 13
5.2 TLD characteristic and measurement ................................................................... 14
2.5.1 Annealing procedure ................................................................................ 15
2.5.2 Glow curve ............................................................................................... 16
2.5.3 Glow curve analysis ................................................................................. 16
2.5.4 Sensitivity ................................................................................................. 20
2.5.5 Dose response (linearity) .......................................................................... 20
2.5.6 Reproducibility (reuse) and stability ........................................................ 22
2.5.7 Energy response........................................................................................ 23
2.5.8 Fading ....................................................................................................... 25
2.5.9 Minimum detectable dose ......................................................................... 26
2.6 Effective atomic number Zeff ................................................................................ 27
2.7 Previous work ....................................................................................................... 28
CHAPTER 3: METHODOLOGY AND INSTRUMENTS ........................................ 34
3.1 Introduction .......................................................................................................... 34
3.2 Raw Chemical Materials ...................................................................................... 34
3.2.1 Zinc Oxide (ZnO) ..................................................................................... 35
3.2.2 Boron trioxide or diboron trioxide (B2O3) ................................................ 35
3.2.3 Silicon dioxide or Silica Oxide (SiO2) ..................................................... 36

v
3.2.4 Copper oxide (Cu2O) ................................................................................ 37
3.2.5 Tin oxide or stannic oxide (SnO2) ............................................................ 38
3.3 Glass system preparation ...................................................................................... 38
3.3.1 Preparation SiO2 using Rice Husk (RH) in the Laboratory. ..................... 39
3.3.2 Preparation three types of glass samples .................................................. 41
3.4 XRD analysis (X-ray diffraction) ......................................................................... 44
3.5 Field emission scanning electron Microscope (FESEM) analysis ....................... 45
3.6 Differential thermal analysis (DTA) .................................................................... 46
3.7 Annealing procedure ............................................................................................ 48
3.8 Samples exposure ................................................................................................. 49
3.8.1 Cobalt-60 gamma cell............................................................................... 49
3.8.2 Linear accelerator (LINAC) ..................................................................... 49
3.9 TLD reader ........................................................................................................... 51
3.10 Other Tools ........................................................................................................... 53
3.10.1 Vacuum tweezers...................................................................................... 53
3.10.2 Milling tool ............................................................................................... 54
3.10.3 Sensitive Electric Balance ........................................................................ 54
CHAPTER 4: RESULTS AND DISCUSSION ......................................................... 56
4.1 Introduction .......................................................................................................... 56
4.2 Glass Samples and Composition .......................................................................... 56
4.3 X-ray Diffraction analysis (XRD) ........................................................................ 59
4.4 Differential thermal analysis (DTA) .................................................................... 60
4.5 Field emission scanning electron microscopy (FESEM) analysis ....................... 62
4.6 Effective atomic number (Zeff) ............................................................................. 67
4.7 Optimization of sample compositions .................................................................. 68

vi
4.7.1 Undoped TL response zinc borate silica ZBS glasses phosphor .............. 69
4.7.2 Optimization of Cu doped and Sn codoped ZBS ..................................... 71
4.8 Annealing Procedure ............................................................................................ 74
4.8.1 Annealing Procedure for undoped composition ....................................... 75
4.8.2 Annealing Procedure for Cu doped composition ..................................... 75
4.8.3 Annealing Procedure for SnO2 codoped composition .............................. 77
4.9 Temperature time profile (TTP) setting ............................................................... 79
4.9.1 Heating rate of undoped (ZBS) glass samples ......................................... 80
4.9.2 Heating rate of doped (ZBS:Cu) glass samples ........................................ 81
4.10 Dose-TL Response Relationship .......................................................................... 84
4.10.1 Gamma ray cobalt- 60 irradiation ............................................................. 84
4.10.2 Electron and x-ray photon (LINAC) irradiation ....................................... 85
4.10.3 Comparison between the optimum (codoped) sample and TLD 100. ...... 87
4.11 TL Sensitivity ....................................................................................................... 89
4.12 Reproducibility ..................................................................................................... 91
4.13 Minimum Detectable Dose (MDD) ...................................................................... 93
4.14 Thermal Fading Measurement ............................................................................. 94
4.15 Measurement Optical Bleaching .......................................................................... 96
4.16 Determination of kinetic Parameters using peaks shape method ......................... 98
4.17 Theoretical calculation of Photon Energy response ........................................... 102
4.17.1 Theoretical calculation of photon energy response for ZBS .................. 103
4.17.2 Theoretical calculation of photon energy response for ZBS:Cu ............ 105
4.17.3 Theoretical calculation of photon energy response for ZBS:Cu.Sn ....... 107
4.18 Outline of the findings ........................................................................................ 110

vii
CHAPTER 5: CONCLUSION .................................................................................... 111
5.1 Conclusion .......................................................................................................... 111
5.2 Recommendations and Future Research ............................................................ 115
REFERENCES ............................................................................................................. 116
APPENDICES .............................................................................................................. 124

viii
LIST OF TABLES
Page
Table 2.1: Values for the constants Cα and bα 18
Table 2.2: Listed the characteristics of some key TL materials
(dosimeters)
29
Table 4.1: The raw materials and chemical compositions of prepared
undoped glasses.
58
Table 4.2: The raw materials and chemical compositions of prepared
doped glasses
58
Table 4.3: The raw materials and chemical compositions of prepared
co doped glasses.
59
Table 4.4: Results of DTA studies of present glasses samples. 61
Table 4.5: Weight percentage of elements in ZBS. 66
Table 4.6: Weight percentage of elements in ZBS:Cu. 66
Table 4.7: Weight percentage of elements in ZBS:Cu.Sn. 67
Table 4.8: Effective atomic number of the glass compositions for
present work and previous works
68
Table 4.9: Annealing temperature and time of present study
compared with others.
79
Table 4.10: Heating Rates of the compositions under study compared
with other work.
83
Table 4.11: The sensitivity of different TL materials for various types
of energies.
90

ix
Table 4.12: The minimum detectable dose of different TL materials
for various types of energies.
93
Table 4.13: Fading characteristics exposed to sun light. 96
Table 4.14: Fading characteristics exposed to fluorescent light. 98
Table 4.15: Kinetic parameters of undoped, doped and codoped glass
under study.
99
Table 4.16: Activation energy and frequency factor of presented glass
samples calculated by using Chen’s equations.
100
Table 4.17: Values of E and S for the compositions under study and
some other works.
101
Table 4.18: Mass energy absorption coefficient of ZBS at various
energies.
103
Table 4.19: Photon energy response and relative energy resopnse of
ZBS normalized at 1.25 MeV
104
Table 4.20: Mass energy absorption coefficient of ZBS:Cu at various
energies.
105
Table 4.21: Photon energy response and relative energy resopnse of
ZBS:Cu normalized at 1.25 MeV.
106
Table 4.22: Mass energy absorption coefficient of ZBS:Cu.Sn at
various energies.
108
Table 4.23: Photon energy response and relative energy response of
ZBS:Cu.Sn normalized at 1.25 MeV.
109
Table 4.24: Summarized of finding concerning for the examined
compositions in this research.
110

x
LIST OF FIGURES
Page
Figure 2.1: Electron transitions involve in the processes of
(a) fluorescence (b) phosphorescence.
7
Figure 2.2: A simple energy band model for thermoluminescence. 8
Figure 2.3: General TL glow curve, showing also the parameters
discussed in the peak shape glow curve analysis methods.
19
Figure 2.4: Linearity curve of TL dosimeter. 21
Figure 2.5: Variation of relative photo energy response with energy. 25
Figure 3.1: Raw Chemical materials used for making glass samples. 39
Figure 3.2: Preparation SiO2 by using raw material rice husk. 40
Figure 3.3: Furnaces used for melting and annealing samples in this
study.
42
Figure 3.4: Flowchart of preparation and analysis glass samples in this
research
43
Figure 3.5: Glass samples with (a) different concentration of doped
Cu2O inside the annealing furnace, (b) the bulk of glass
sample, (c) crush doped Cu2O sample, (d) TLDs glass
samples inside the capsule ready to exposure.
44
Figure 3.6: XRD machine used to study the amorphous phase of glasses
samples.
45
Figure 3.7: Photograph of the FE-SEM machine (JSM-6340F Model)
used in this study.
46
Figure 3.8: Schematic principle of DTA system. 47
Figure 3.9: Computerized system of electric annealing oven. 48
xi
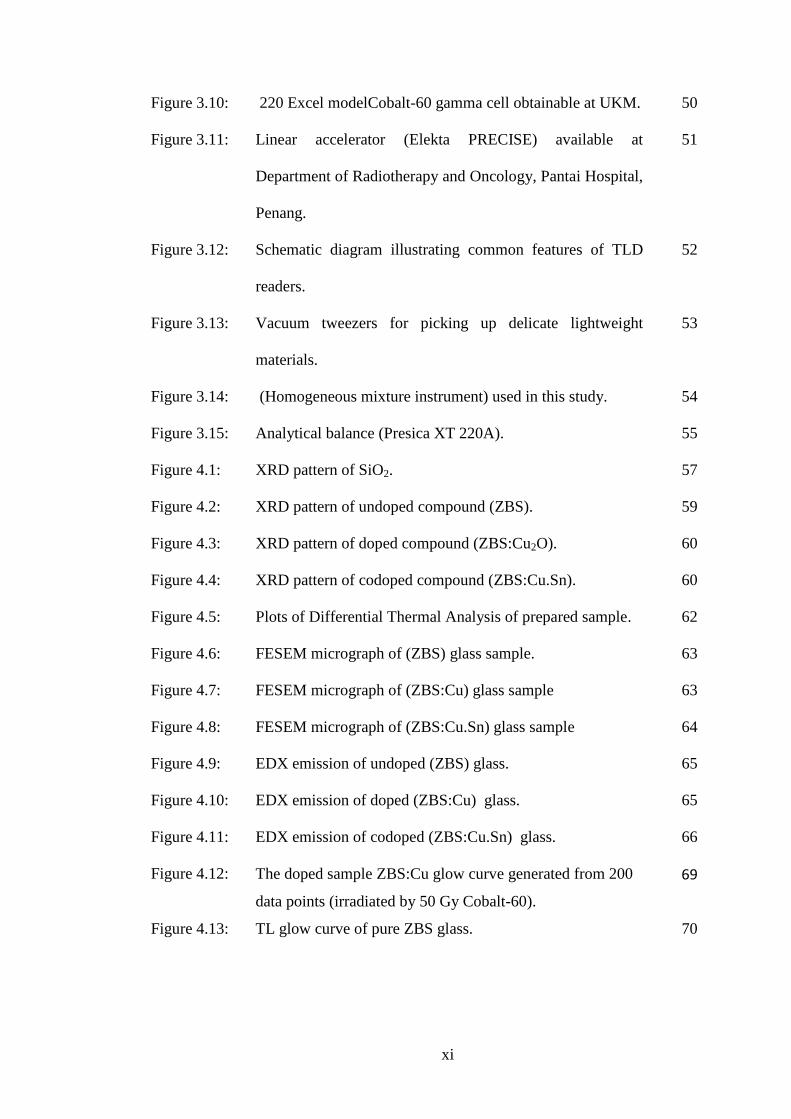
Figure 3.10: 220 Excel modelCobalt-60 gamma cell obtainable at UKM. 50
Figure 3.11: Linear accelerator (Elekta PRECISE) available at
Department of Radiotherapy and Oncology, Pantai Hospital,
Penang.
51
Figure 3.12: Schematic diagram illustrating common features of TLD
readers.
52
Figure 3.13: Vacuum tweezers for picking up delicate lightweight
materials.
53
Figure 3.14: (Homogeneous mixture instrument) used in this study. 54
Figure 3.15: Analytical balance (Presica XT 220A). 55
Figure 4.1: XRD pattern of SiO2. 57
Figure 4.2: XRD pattern of undoped compound (ZBS). 59
Figure 4.3: XRD pattern of doped compound (ZBS:Cu2O). 60
Figure 4.4: XRD pattern of codoped compound (ZBS:Cu.Sn). 60
Figure 4.5: Plots of Differential Thermal Analysis of prepared sample. 62
Figure 4.6: FESEM micrograph of (ZBS) glass sample. 63
Figure 4.7: FESEM micrograph of (ZBS:Cu) glass sample 63
Figure 4.8: FESEM micrograph of (ZBS:Cu.Sn) glass sample 64
Figure 4.9: EDX emission of undoped (ZBS) glass. 65
Figure 4.10: EDX emission of doped (ZBS:Cu) glass. 65
Figure 4.11: EDX emission of codoped (ZBS:Cu.Sn) glass. 66
Figure 4.12: The doped sample ZBS:Cu glow curve generated from 200
data points (irradiated by 50 Gy Cobalt-60).
69
Figure 4.13: TL glow curve of pure ZBS glass.
70

xii
Figure 4.14: Difference of TL intensity with different concentrations of
ZnO.
70
Figure 4.15: Glow curves of ZBS:Cu with different concentrations of
Cu2O doped.
72
Figure 4.16: Difference of TL normalized intensity with diverse
concentrations of Cu2O.
72
Figure 4.17: Glow curves of ZBS:Cu.Sn with different concentrations of
SnO2 doped.
73
Figure 4.18: Difference of normalized TL intensity with fixed Cu2O and
diverse concentrations of SnO2
74
Figure 4.19: Variation of (ZBS) TL intensity with annealing temperature. 75
Figure 4.20: Variation of (ZBS) TL intensity with annealing time. 76
Figure 4.21: Variation of (ZBS:Cu) TL intensity with annealing
temperature.
76
Figure 4.22: Variation of (ZBS:Cu) TL intensity with annealing time. 77
Figure 4.23: Variation of (ZBS:Cu.Sn) TL intensity with annealing
temperature.
78
Figure 4.24: Variation of (ZBS:Cu.Sn) TL intensity with annealing time. 78
Figure 4.25 The co- doped sample ZBS:Cu.Snglow curve generated
from 200 data points (irradiated by 50 Gy Cobalt-60).
80
Figure 4.26: TL response of (ZBS) glass as a function of heating rate. 81
Figure 4.27: Glow curve of (ZBS:Cu) glass as a function of heating rate. 81
Figure 4.28: TL response of (ZBS:Cu) glass as a function of heating rate. 82
Figure 4.29: TL response of (ZBS:Cu.Sn) as a function of heating rate. 83
xiii
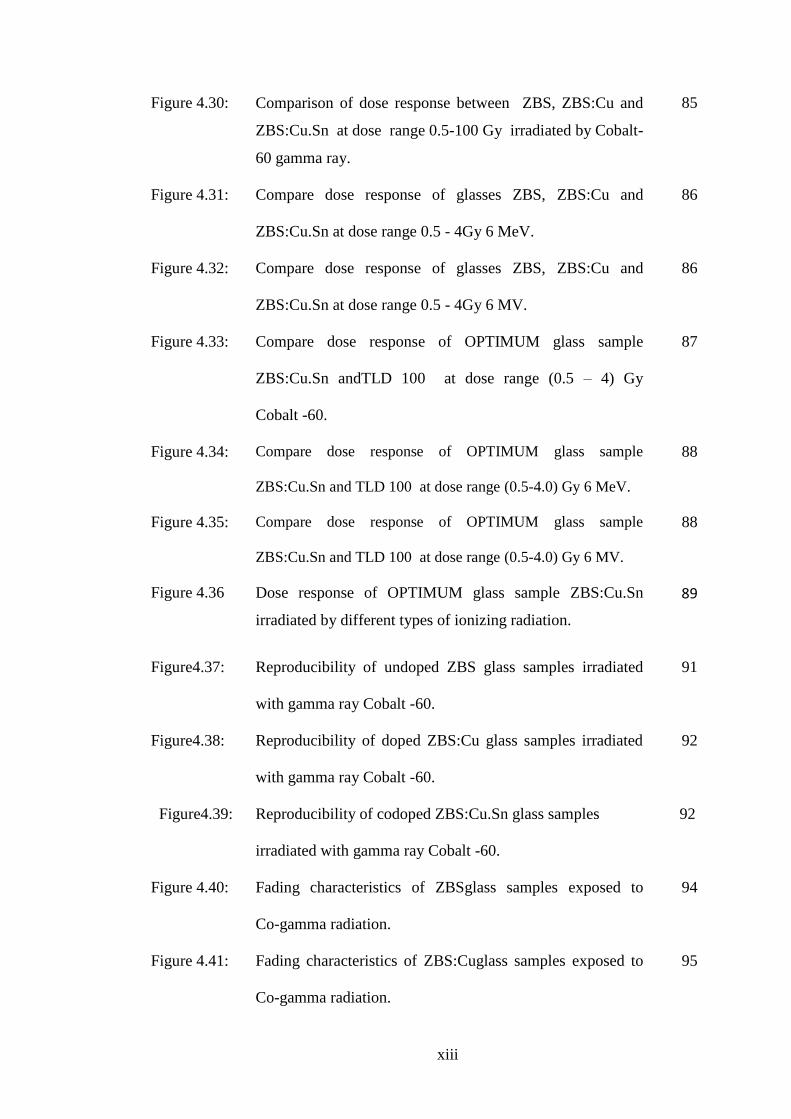
Figure 4.30: Comparison of dose response between ZBS, ZBS:Cu and
ZBS:Cu.Sn at dose range 0.5-100 Gy irradiated by Cobalt-
60 gamma ray.
85
Figure 4.31: Compare dose response of glasses ZBS, ZBS:Cu and
ZBS:Cu.Sn at dose range 0.5 - 4Gy 6 MeV.
86
Figure 4.32: Compare dose response of glasses ZBS, ZBS:Cu and
ZBS:Cu.Sn at dose range 0.5 - 4Gy 6 MV.
86
Figure 4.33: Compare dose response of OPTIMUM glass sample
ZBS:Cu.Sn andTLD 100 at dose range (0.5 – 4) Gy
Cobalt -60.
87
Figure 4.34: Compare dose response of OPTIMUM glass sample
ZBS:Cu.Sn and TLD 100 at dose range (0.5-4.0) Gy 6 MeV.
88
Figure 4.35: Compare dose response of OPTIMUM glass sample
ZBS:Cu.Sn and TLD 100 at dose range (0.5-4.0) Gy 6 MV.
88
Figure 4.36 Dose response of OPTIMUM glass sample ZBS:Cu.Sn
irradiated by different types of ionizing radiation.
89
Figure4.37: Reproducibility of undoped ZBS glass samples irradiated
with gamma ray Cobalt -60.
91
Figure4.38: Reproducibility of doped ZBS:Cu glass samples irradiated
with gamma ray Cobalt -60.
92
Figure4.39: Reproducibility of codoped ZBS:Cu.Sn glass samples
irradiated with gamma ray Cobalt -60.
92
Figure 4.40: Fading characteristics of ZBSglass samples exposed to
Co-gamma radiation.
94
Figure 4.41: Fading characteristics of ZBS:Cuglass samples exposed to
Co-gamma radiation.
95

xiv
Figure 4.42: Fading characteristics of ZBS:Cu.Snglass samples exposed
to Co-gamma radiation.
96
Figure 4.43: Fading characteristics of ZBS, ZBS:Cu and ZBS:Cu.Sn
glass exposed sun light.
97
Figure 4.44: Fading characteristics of ZBS, ZBS:Cu and ZBS:Cu.Sn
glass exposed fluorescent light.
98
Figure 4.45: Geometric parameters of un-coped ZBS glow curve. 99
Figure 4.46: Geometric parameters of coped ZBS:Cu glow curve. 100
Figure 4.47: Geometric parameters of co-coped ZBS:Cu.Sn glow curve. 101
Figure 4.48: Calculated energy dependence of undoped ZBS. 104
Figure 4.49: Calculated energy dependence of doped ZBS:Cu. 106
Figure 4.50: Calculated energy dependence of codoped ZBS:Cu.Sn. 107

xv
LIST OF ABBREVATIONS
CB Conduction band
DTA Differential thermal analysis
EDX Energy dispersive x-ray
ICRU International commission of radiation units
LINAC Linear accelerator
MDD Minimum detectable dose
PMT Photo-multiplier tube
RC Recombination centre
RER Relative energy response
SSD Source surface distance
TL Thermoluminescence
TLD Thermoluminescence dosimeter
TLD100 Lithium fluoride dope with magnesium and titanium (LiF: Mg. Ti)
VB Valance band
XRD X-ray Diffraction
ZBS Zinc borate silica
ZBS:Cu Zinc borate silica doped with Cu2O
ZBS:Cu.Sn Zinc borate silica codoped with SnO2

xvi
LIST OF SYMBOLS
B Standard deviation
(
)
materials energy absorption coefficient
(
)
reference material energy absorption coefficient
Symmetry factor
ai Fractional contents of electrons of element
b Order kinetics
B*
Mean thermoluminescence background signal
B2O3 Boron oxide
C Coulomb
Cu2O Copper oxide I
D Absorbed dose
D (t) Radiation dose at time
D0 Minimum detectable dose
Eα Trap depth (activation energy)
Eg Energy band gap
F calibration factor
Gy Gray
h hour
k Boltzmann’s constant
NA Avogadro’s number
min Minute
P Probability of trap electron
S Frequency factor
s Second
SE (E) Photon energy response
Si Sensitivity factor
SiO2 Silica oxide
SnO2 Tin oxide
T Temperature
xvii
t Time
Tc Crystallization temperature
Tg Transition temperature
Tm Melting temperature
Wi Weight fraction of element
Zeff Effective atomic number
y year
ZnO Zinc oxide

xviii
PEMBANGUNAN KOMPOSIT BORON SILIKAT TAKTERDOP, TERDOP
DAN KOTERDOP SEBAGAI DOSIMETER TERMOLUMINISEN UNTUK
ARAS DOS PERTENGAHAN DAN TINGGI
ABSTRAK
Kajian ini bertujuan untuk menilaikesan terdop dan koterdop keatas sifat sifat
termoluminisens bagi sampel kaca zink borat silika (ZBS).Tiga jenis kaca disediakan
dengan menggunakan kaedah tradisional, iaitu, teknik pencairan pelindapkejutan dan
berasaskan kepada: komposisi takterdop (ZBS), (90-x)ZnO-xB2O3-10SiO2 yang
mana x= 30, 35, 40, 45, 50 mol%, komposisi terdop (45-x) ZnO-45B2O3-10Si2O-
xCu2O yang mana 0.002 ≤ x ≤ 0.1mol% dan komposisi koterdop
(44.995-y)ZnO-45B2O3-10Si2O-0.005Cu2O-ySnO2 yang mana 0.05 ≤ y ≤ 0.5mol%
telah dihasilkan. Nanopartikel SnO2 digunakan sebagai sampel kaca koterdop adalah
bersaiz sekitar 22-31 nm. Semua sampel telah disahkan amorfus berdasarkan analisis
belauan sinar-X. Kaca-kaca itu berada dalam keadaan haba stabil sebagaimana dapat
ditentukan melalui analisis terma bezaan (DTA). Sampel berkenaan adalah tertakluk
kepada jenis sinaran mengion yang berlainan seperti sinar gama Cobalt-60, elektron
bertenaga tinggi 6 MeV dan foton sinar–x 6 MV. Sampel yang dicadangkan telah
diradiasi dengan jenis sinaran mengion yang berlainan seperti sinar gama
daripadadari Kobalt-60, 6 MeV elektron dan 6 MV foton sinar-x daripada LINAC.
Untuk kaca ZBS takterdop, respon TL didapati sangat rendah berbanding dengan
sampel terdop dan koterdop. Ini menunjukkan kesan terdop dan koterdop ke atas
kaca tulen hos. Keamatan optimum TL juga direkodkan dengan kadar pemanasan 1
C/s untuk Cu-terdop dan Sn koterdop. Walau bagaimanapun bagi sampel kaca hos,
kadar pemanasannya adalah 3 C/s. Rawatan haba pada100 C selama 15 min, 100

xix
C selama 30 mindan 300 Cselama 15 min telah diperoleh bagi sampel kaca
takterdop, terdop dan koterdop masing-masing. Kepekatan optimum ZnO adalah 45
mol% untuk kaca tulen hos. Manakala, kepekatan optimum bagi Cu-terdop dan Sn
koterdop adalah 0.005 mol% dan 0.1 mol% masing-masing. Lengkung bara tunggal
dengan puncak ketara diperoleh pada 158 oC, 130
oCdan 147
oC bagi ZBS, ZBS:Cu
dan ZBS:Cu.Sn, masing-masing. Keamatan TL bertambah baik bila hos kaca
diterdop dan semakin bertambah baik dengan koterdop. Tiga jenis sampel kaca
menunjukkan kelinearan dan pekalikorelasi yang baik dalam julat dos sehingga 100
Gy Cobalt-60 danjulat dos 0.5-4.0 Gy elektron dan foton dari LINAC. Kepekaandan
dos dikesan minimum bertambah baik dengan sampel hos kaca (ZBS) didopkan dan
koterdop untuk semua jenis sinaran. Nombor atom berkesan yang tinggi diperoleh
bagi kesemua sistem kaca. Nombor atom berkesan bagi ZBS, ZBS:Cu don
ZBS:Cu.Sn adalah19.89, 19.96 dan 20.14, masing-masing. Tenaga pengaktifan bagi
tiga sistem kaca ZBS, ZBS:Cu and ZBS:Cu.Sn adalah 0.819 eV, 0.873 eV dan 0.638
eV, masing-masing. Faktor frekuensi untuk ZBS, ZBS:CudanZBS:Cu.Snadalah
2.33E+11 s-1
, 4.70E+12 s-1
dan 2.65E+09 s-1
, masing-masing. Semua komposisi kaca
yang dicadangkan menunjukkan respon tenaga relatif foton yang lebih tinggi pada
0.04 MeV dan hampir tiada tindakbalas pada tenaga melebehi 0.1 MeV. Ciri-ciri TL
untuk kaca itu dijelaskan secara terperinci, mengesahkan kemungkinan penggunaan
sampel koterdop tersebut sebagai dosimetri TL untuk mengesan dan mengukur
sinaran mengion.

xx
DEVELOPMENT OF UNDOPED, DOPED AND CODOPED BORON
SILICATE COMPOSITE AS THERMOLUMINESCENT DOSIMETERS FOR
MEDIUM AND HIGH DOSE LEVELS
ABSTRACT
The aim of this study is to evaluate the impacts of doping and co-doping on
the thermoluminescence properties of zinc borate silica (ZBS) glass samples. Three
types of glasses were prepared by the traditional melt quenching technique: undoped
composition (90-x)ZnO-xB2O3-10SiO2 where x= 30, 35, 40, 45, 50 mo l%, doped
composition (45-x)ZnO-45B2O3-10Si2O-xCu2O where 0.002 ≤ x ≤ 0.1 mol% and
codoped composition (44.995-y)ZnO-45B2O3-10Si2O-0.005Cu2O-ySnO2 where
0.05 ≤ y ≤ 0.5mol%. The size of the SnO2 nanoparticles used as codopedglass sample
is around 22-31 nm. All the samples were confirmed to be amorphous using x-ray
diffraction analysis. The glasses were found to be thermally stable as confirmed by
differential thermal analysis (DTA). The proposed samples were irradiated to
different types of ionizing radiation such as gamma ray from Cobalt-60, 6 MeV
electrons and 6 MV x-ray photon from LINAC. For undoped ZBS glass, TL response
was found to be very low compared with doped and codoped samples. This indicates
the effect of doped and codoped on the pure host glass. The optimum TL intensity
was recorded with a heating rate of 1C/s for both Cu doped and Sn codoped, while
for the host glass samples was 3C/s. Thermal treatments at 100 C for 15 min, 100
C for 30 min and 300 C for 15 min were obtained for undoped, doped and codoped
samples, respectively. The optimum concentration of ZnO was 45 mol% in pure
glass host. Whilst, for both Cu doped and Sn codoped are 0.005 mol% and 0.1 mol%,
xxi
respectively. A single glow curve with a prominent peak was obtained at 158 oC,
130 oC and 147
oC for ZBS, ZBS:Cu and ZBS:Cu.Sn, respectively. The TL intensity
was improved when the glass host was doped and further improved with codoped.
Three types of glass samples showed good linearity and good correlation coefficient
in a dose range of up to 100 Gy gamma ray from Cobalt-60 and dose range
0.5-4.0 Gy electron and photon from LINAC. The sensitivity and minimum
detectable dose improved with the doped and codoped host (ZBS) glass samples for
all types of radiations. High effective atomic numbers of glasses were found. ZBS,
ZBS:Cu and ZBS:Cu.Sn have an effective atomic number of 19.89, 19.96 and 20.14,
respectively. The activation energies of the three glass system are 0.819 eV, 0.873
eV and 0.638 eV for ZBS, ZBS:Cu and ZBS:Cu.Sn, respectively. The frequency
factors for ZBS, ZBS:Cu and ZBS:Cu.Sn were found to be 2.33E+11 s-1
,
4.70E+12 s-1
and 2.65E+09 s-1
, respectively. All proposed compositions of glass
reveal a higher photon relative energy response at 0.04 MeV and almost flat response
at energies beyond 0.1 MeV. TL properties for present glasses are mentioned in
details; supporting the possibility of using the proposed glasses sample as TL
dosimetry for detecting and measuring ionizing radiations.

1
CHAPTER1
INTRODUCTION
1.1 Introduction
Dosimeters have been used as an important monitoring tool in personal and
environmental monitoring in the field of medical research and radiation therapy.
Every day humans are being exposed to radiation sources, especially the people who
work in radiation areas such as nuclear energy plants and hospitals where they may
induce genetic defects and cancer. There is a lot of public awareness of radiation
dosimetry, hence people are looking for alternative ways of obtaining personal and
environmental dosimeters.
Nowadays different types of dosimeters are used for measuring absorbed
doses and these include film, ionization chambers, semiconductor dosimeters
(e.g. diodes), thermoluminescent dosimeters, alanine and gel. Whereas some of these
dosimeters are reusable such as ionization chamber, thermoluminescent dosimeters
(TLDs), diode, others are not (films, gels etc). These dosimeters need to be calibrated
from time to time to ensure their consistency.
Thermoluminescent dosimeters are crystalline materials that store absorbed
energy inside their structure from exposure to ionizing radiation and
release this absorbed energy as visible light when it is heated
((Podgorsak, 2005). Thermoluminescent dosimetry is used in many scientific and
applied fields. TL dosimeters are small in size and therefore they are easy to handle
and can be used feasibly as personnel dosimeters.

2
Some other uses of TL dosimeters include radiation protection, radiotherapy
clinic, industry, and environmental and space research, using many different
materials (Shani, 2000).
TLDs have been developed significantly over the years and a lot of materials
were studied to see if they were suitable for applications in different areas for
dosimetry (McKinlay, 1981). TL materials store energy inside their structure when
they are irradiated, as electrons and holes are caught in trapping centres because of
defects. When that material is heated, electrons and holes recombine at luminescence
centres, and thus light is emitted. The light is measured using a photomultiplier tube
(PMT) inside the reader device.
Many factors have to be taken into account in order to find the most suitable
material. The availability is very important as well as the stability of its produced
signal. A low fading rate is important (lower than 5% per month) as well as simple
glow curves with a plain anneal heating cycle. The sensitivity of TLD can be
increased by adding impurities called activators. As there are more impurities in the
material, more traps are included and thus more light is emitted during
thermoluminescence process. Therefore the efficiency of the material is increased
(Knoll, 2010).
The use of the thermoluminescence (TL) technique in radiation dosimetry
becomes popular after the launch of lithium fluoride by Daniels and his colleagues
(Daniels et al., 1953). Daniels and his group first suggested the use of thermal
stimulate luminescence (TSL) as a technique in radiation dosimetry.

3
Through them studies Lithium fluoride was earlier used to measure
radiation dose after a bomb test. Soon the idea of using TSL in dosimetry
caught on and many groups started working in the field of
thermoluminescent dosimetry (TLD).
1.2 Statement of the Problem
Studies of thermoluminescent materials have been extended to glasses,
nanoparticles and optical fibers. The application of thermoluminescent technology
has also been developed in the food preservation field. This shows that the use of
TLD is not restricted to personal and environmental monitoring alone but has also
been developed for use in the food industry.
There are a lot of new compounds produced by researchers, but none of them
have all the desired properties such as near tissue equivalence, high sensitivity,
excellent stability and a simple glow curve structure. The latter properties ideally
sought are a single glow peak at about 200 °C, and a simple annealing procedure for
reproducibility. So, there have always been efforts made to either prepare new
dosimetric materials with enhanced thermoluminescence characteristics or just to
improve upon the already existing dosimetric materials by varying the concentration
of impurities or by codoping of the phosphor with other elements or doping new
impurities in new matrices. Lately, investigations of thermoluminescence dosimetry
in glass as a new material have been carried out. Among these new materials are the
Borate glasses. There are many researchers who work on borate glasses modified by
several elements; however, investigations on borate silica’s thermoluminescence TL
properties have not been studied.

4
1.3 Objectives of the research
The objectives of the research are:
a) To produce a high quality of the SiO2 using free raw rice husk and use
it as one of materials in glass formation.
b) To determine the optimum TL characteristics for undoped (ZBS) as a
host and optimising dopant and codopant concentrations in this host.
c) To determine the best setting of the annealing procedure and heating
rate of the undoped, doped and codoped compositions under study.
d) To investigate the fundamental thermoluminescence properties when
undoped, doped and codoped of ZBS are irradiated to Cobalt-60
gamma ray, 6 MeV electrons and 6 MV x-ray photons.
e) To compare and calibrate the optimum glass sample under study with
standard glass phosphor TLD 100 and to ensure similarity of
properties between the optimum sample under study and standard
TLD 100.
1.4 Scope of the research
This research will focus on undoped, doped and codoped zinc borate silica
glass systems for thermoluminescence dosimeter purposes. In order to study the
characteristics of new materials, the samples will be analysed using field emission
scanning electron microscopy (FESEM), x-ray diffraction (XRD) and differential
thermal analysis (DTA). Three types of glass samples undoped, doped and codoped
ZBS will be irradiated using a linear accelerator machine (LINAC) at 6 MeV
electron and 6 MV x-ray photon beams and Cobalt-60 gamma ray in order to study
the linearity, sensitivity and minimum detectable dose of the new materials.

5
Irradiation by gamma ray Cobalt-60 will be used to study optimization, time
temperature profile, annealing procedure, and analyze the glow curve of undoped,
doped and codoped glass samples.
1.5 Outline of thesis
Chapter one covers the background of the study and its research problem. This
chapter also includes the suggestions and research questions, planned objectives, the
scope of study and the outline of the thesis.
Literature review related to this study is presented in chapter two. The general
notion of luminescence and thermoluminescence in particular, in addition to the
theories and models related with thermoluminescence are integrated in this chapter.
The dosimetric properties of thermoluminescent phosphor and some previous work
are also discussed.
Explaining methods and procedures as well as the instrumentation involved in
this work is presented in chapter three. The methods and procedures include the
identification of materials and the glass sample preparation. Methods and procedures
with regard to thermoluminescence studies are also described in this chapter.
The results obtained from the characterization, temperature time profile
settings and optimization of undoped, doped and codoped compositions and the main
dosimetric properties of the proposed TLDs are discussed in chapter four.
Chapter five includes the summary of the findings of the work. Conclusion and
recommendations for future work are also included.

6
CHAPTER 2
LITERATURE REVIEW
2.1 Introduction
In this chapter, the discussion will focus on the hypothesis
of thermoluminescence phenomena and the dosimetric properties of
thermoluminescence. Three essential ingredients for the production of
thermoluminescence; first, second and general order kinetics will also be explained.
Methods to analyze TL glow peaks and determine various parameters such as the
trap depths (Eα) and the frequency factors (S) will be determined. Earlier works
related to this study will also be discussed.
2.2 Luminescence
When a material is irradiated by ionizing radiation, some of the incident
photons energy will be absorbed by the electrons and then emitted as a photon with a
longer wavelength in the visible region of the electromagnetic spectrum,
this process is called luminescence. Thermoluminescence is a type of luminescence
caused by heating the material and the result is light emission
(McKeever, 1988, Chen and McKeever, 1997). The main types of luminescence are
fluorescence and phosphorescence.
2.2.1 Fluorescence
In fluorescence, the electrons return to ground state immediately after
excitation with released light as shown in Figure 2.1a. The mean time between these
transitions is between 10-3
s - 10-8
s.

7
2.2.2 Phosphorescence
Figure 2.1b illustrates the type of luminescence where electrons are trapped
and then belatedly return to ground state. The transition of electrons to ground state
is forbidden, they need energy to move. In this luminescence process the excited
electron is captured in a localized state at metastable level and then released into a
state excited level, where it acquires energy ΔE (Ee - Em). The electron will, as a
result, relax to a ground state g, thus emitting light. If τc > 10-8
s is between
excitation and emission then the trapping process causes a longer delay. The mean
time of an electron to stay in a trap at temperature T is given by Equation (2.1).
Figure 2.1: Electron transitions involve in the processes of (a) fluorescence
(b) Phosphorescence.
(
) (2.1)
where S is the frequency factor, E is the trap depth (the energy difference
between trap level and conduction band), k is the (Boltzmann’s constant=8.617×10⁻⁵
eV/K) and T is temperature in Kelvin. The luminescence process that takes place in

8
this way is called phosphorescence. Phosphorescence is therefore temperature
dependent.
2.2.3 Model of thermoluminescence
Each TL material possesses scheme of energy band. The general model is the
one used to explain the basic features of thermoluminescence, this model includes
only two localized state, trap centre (E) and recombination centre (L) as shown in
Figure 2.2. After exposure to ionizing radiation, there are three stages in the process
of producing TL in a material. These are electrons trapping, holes trapping and the
recombination of electrons and holes.
Figure 2.2: A simple energy band model for thermoluminescence (McKinlay, 1981).
Figure 2.2 shows the energy band pattern of each stage. Free electrons are
created and moved to the conduction band after the substance has absorbed energy
during irradiation with ionizing radiation (step 1). Free electrons can move through
the crystal or amorphous system (step 2). In a place where there are trapping levels
such as E (metastable state) the electron may become trapped in this trap (step 3).

9
The holes left due to ionization from the valance band may also migrate via the
valence band (step 2/). These holes may also be trapped (step 3
/). But hole centers
are very unstable and can easily decay rapidly at room temperature (step 4/). The
captured electrons will remain in the traps until they have acquired sufficient energy
to escape. Electrons staying in traps is a function of two factors; the depth of the trap
and the temperature of the material. Therefore raising the temperature of the material
will give the trapped electrons enough energy to be released (step 4). Luminescence
centers such as L, serve as recombination centers where electrons and holes
recombine and release excess energy as visible light or ultraviolet photons (step 5).
With the introduction of a modifier, dopant and codopant, there will be a creation of
additional traps and recombination centers. TL emission will therefore be enhanced
(Attix, 2008). The probability P of the escape of the electron from a metastable state
to an excited state is given by by Boltzmann equation.
(
) (2.2)
The exponential factor (
) is the probability of an electron escaping
when it encounters with thermal energy. If E ˃ KT, a trapped electron will stay in
the trap level E. After irradiation, there will be a considerable population (n) of
electrons in the trap level. On the other hand, there must be the same population of
holes at level H because the free electrons and holes are produced in pairs and
annihilated in pairs (recombination center). This population of electrons and holes
show a non equilibrium state due to the normal equilibrium Fermi level
Ef, where Ef is situated lower than E level and higher than H level.
The return to equilibrium can be faster by rising the temperature of the samples
above T0 such as E ≤ KT. By heating the sample, the probability of de-trapping P

10
will be increased and the electrons will now be freed from the trap and shift into the
conduction band. Consequently free electrons will recombine with the holes and the
outcome is thermoluminescence. The glow peak is analyzed by an empirical method
in which a parameter called the order of kinetics is introduced.
2.3 Glow curve theory
A typical glow curve shows one or more glow peaks. Every peak indicates
information about each trap level and the state of occupation in the TL material. The
orders of kinetics obtained by an empirical method analysis of the glow peak, the
thermal energy cause the trapped electrons to jump into the conduction band; they
have two kinds of chance to jump down. One is the re-trapping process of returning
to the same kind of traps and the other is recombination with the hole which is
accompanied by the emission of TL light (Alam and Bauk, 2010).
2.3.1 First order kinetics
In 1945 Randall and Wilkins proposed an arithmetical expression for a TL
peak in a glow curve. The analysis for an isolated glow peak is based on electrons
being trapped at a discrete energy level below the conduction band; during heating of
sample, the electrons are thermally released from the traps, and then recombine with
holes at recombination centers as shown in Figure 2.2. The probability of
re-trapping is negligible (Randall and Wilkins, 1945). Thus, According to this model,
the TL intensity I, at a constant temperature can be written as

11
where n is the concentration of trapped electrons at time t.
The recombination rate of free electrons is equal to the releasing rate of trapped
electrons. The intensity of thermoluminescence, I(t) equals the recombination rate of
free electrons, which yields.
(
)
where nh is the concentration of holes in the recombination center. If the
heating rate is constant, it can be shown as a simple linear heating function:
When the material is heated at constant rate of temperature
, then the solution of Eq. (2.4) is
(
) (
)
On integration of equation (2.5)
{ (
)∫
(
) }
where n0 is the initial concentration of electrons in the trap populated at the
starting heating temperature To (k). The temperature dependence of the emitted TL is
given by:
(
) { (
)∫
(
) }
This equation described the thermoluminescence process with first order
kinetics (Kitis et al., 1998).

12
2.3.2 Second order kinetics
Garlick and Gibson preferred not to suppose that re-trapping was negligible; in
this case the trap filling process may be described as:
(
)
where n is the concentration of electrons in the conduction band; N is the
concentration of an available electron trap of depth E below the conduction band
(Garlick and Gibson, 1948).
Taking into account that
, the luminescence intensity of irradiated
phosphor under an increasing temperature is obtained in the following way
(
)
By integrating
∫
∫ (
)
∫ (
)
, (
)∫ (
)
-
Then, the equation describing the TL intensity for second order is given by:
(
)
,
∫
(
) -

13
2.3.3 General order kinetic
May and Partridge (1964) have suggested an empirical equation to explain the
TL glow peak when conditions for neither first-order nor second order are convinced
. This is known as the general order kinetics equation and its deferential form has
been suggested and it covers several cases (Rasheedy, 1993, McKeever and Chen,
1997, Sunta et al., 1999, Alam and Bauk, 2010).
(
)
where b is the order of kinetics. Generally the value of b is supposed to be
between 1 and 2, but sometimes it can exceed this range. The solution of Eq 2.14 is
given below for b ≠ 1
(
)
,
∫ (
)
-
where
2.4 Applications of the thermoluminescence
Radiation dosimetry was among the different applications of
thermoluminescence as suggested by Daniel and his colleagues (Danial et al., 1953).
Absorbed energy results in electron-hole pair production and filling of metastable
states when a sample is exposed to ionizing radiation. The energy stored in the
sample is proportional to the TL intensity. The early material employed to serve as a
TL dosimeter behind atomic weapon tests in the 1950's was Lithium fluoride LiF
(McKeever, 1985). TL application has continued to expand since that time. The
innovation and improvement of instrumentation has helped utilize TLD phosphor in

14
various fields (McKeever, 1988)There are three main areas using TL as reported by
(Pekpak et al., 2010) which are archaeological aging, geological dating and radiation
dosimetry.
Many studies have been made regarding the phenomenon of TL. They studied
the TL mechanism for pure and impure materials in basic research
(Mesterházy et al., 2012, Gastélum et al., 2002).
2.5 TLD characteristic and measurement
Thermoluminescence has been used for several years as a technique for
radiation dosimetry, particularly in ionizing irradiation. However, not all known
materials are appropriate for dosimetry or tissue equivalent. TL materials are divided
into two main groups (Rivera, 2012):
a) Materials that are tissue equivalent, and that show poor sensitivity to
ionizing radiation.
b) Materials with a high sensitivity to ionizing radiation but with a high
effective atomic number (not tissue equivalent).
The important characteristics of thermoluminescence dosimetry are annealing
procedure, glow curve, sensitivity, dose response, reproducibility, and stability and
fading.

15
2.5.1 Annealing procedure
The heat treatment is a process done before irradiation, which is considered an
important parameter for the removal of the effects of the preceding irradiation
(Prokic, 2001). Consequently the results of measurement will be exact for the dose
applied through irradiation (Pekpak et al., 2010). This process starts with thermal
treatment by putting the TLDs glass samples in an oven and heating them to a
predetermined temperature, maintaining the heating at that temperature for a
predetermined time and then cooling it down to room temperature (Bos, 2001).
For every TL material utilized in dosimetric applications, it is significant to
know the procedure for returning its basic conditions after an irradiation. This
process is the annealing procedure and it has two goals:
a) To empty the traps of the phosphor completely after the irradiation
and readout cycle.
b) To settle down the electron traps in order to obtain, within narrow
limits, the same glow curves even after repeated irradiation and
thermal treatments.
Different annealing is necessary in order to blank all the traps (shallow and
deep) of the phosphor. Numerous TL materials also possess different peaks at a low
temperature; these peaks are likely to be emptied even at room temperature, so in
many cases it is required to carry out a partial annealing before the reading in order
to minimize noise in the information. This procedure is known as pre-read annealing
(Horowitz et al., 2001).

16
2.5.2 Glow curve
The area under the curve is called the glow curve, the area under the glow
curve signifies the radiation energy deposited (Pradhan and Bhatt, 1981). The curve
can be a plot of the luminescent light yield or intensity against temperature. The glow
curve is a good indicator for identifying if the materials are suitable for
thermoluminescence. Ideally, that the glow curve gives a peak at around 200 °C, with
a single and simple peak. If the peak is observed at a low temperature around 100 °C
and is fading away quickly, the information about the radiation content cannot be
yielded. Also a peak is not assigned to good TL properties when it is observed at
around 300 °C (Hunda et al., 2005). There are some parameters that affect the shape,
size and position of the glow curve in every readout case. These parameters are the
heating rate, radiation dose, activator used and the annealing procedure
(Pradhan and Bhatt, 1981).The preparation of the concentration of and the basic
chemical used have an influence over the intensity and the glow curve. Peak
temperatures and shapes are also affected by doping methods and synthesis
(Prokic, 2001, Kayhan and Yilmaz, 2011).
2.5.3 Glow curve analysis
There are various methods for analyzing the glow curve to evaluate TL
parameters, for instance activation energy Eα, frequency factor S and the order of
kinetics b. These some of TL parameters evaluation methods (Furetta and Weng,
1998):
a) Methods based on the analysis of the glow curve shape.
b) Methods based on the temperature at the maximum.
c) Initial Rise Method.

17
d) Area measurement method.
e) Method based on the various Heating Rates.
f) Isothermal method.
g) Inflection method.
h) Numerical curve fitting methods.
Randall and Wilkins (1945) pioneered the glow curve analysis, and then
followed by Garlick and Gibson (1948) who established that the initial rising part of
the TL curve was exponentially dependent on temperature. The trapping parameters
of a TL material consist of kinetic order b, frequency factor S and activation energy
Eα. A peak shape method has been proposed by (Chen and Winer, 1970).
2.5.3.1 Chen’s Method
General TL glow curve and the parameters in the peak shape glow curve
analysis methods are shown in Figure 2.3. The shape method glow curve for TL
analysis was developed more generally by Chen in 1969 (Aboud, 2013), who
considered both first and second order kinetics. Then the activation energy becomes:
.
/
τ = (Tm - T1), δ = (T2 - Tm), ω = (T2 - T1). (2.17)
where α is a factor, that depends on the glow curve temperature widths,
bα is a constant that depends on the order of kinetics and the glow curve temperature
widths. The Cα is also a constant that depends on the order of kinetics and glow curve
18
temperature widths (McKeever, 1988). The values of Cα and bα for the first and
second orders are shown in Table 2.1.
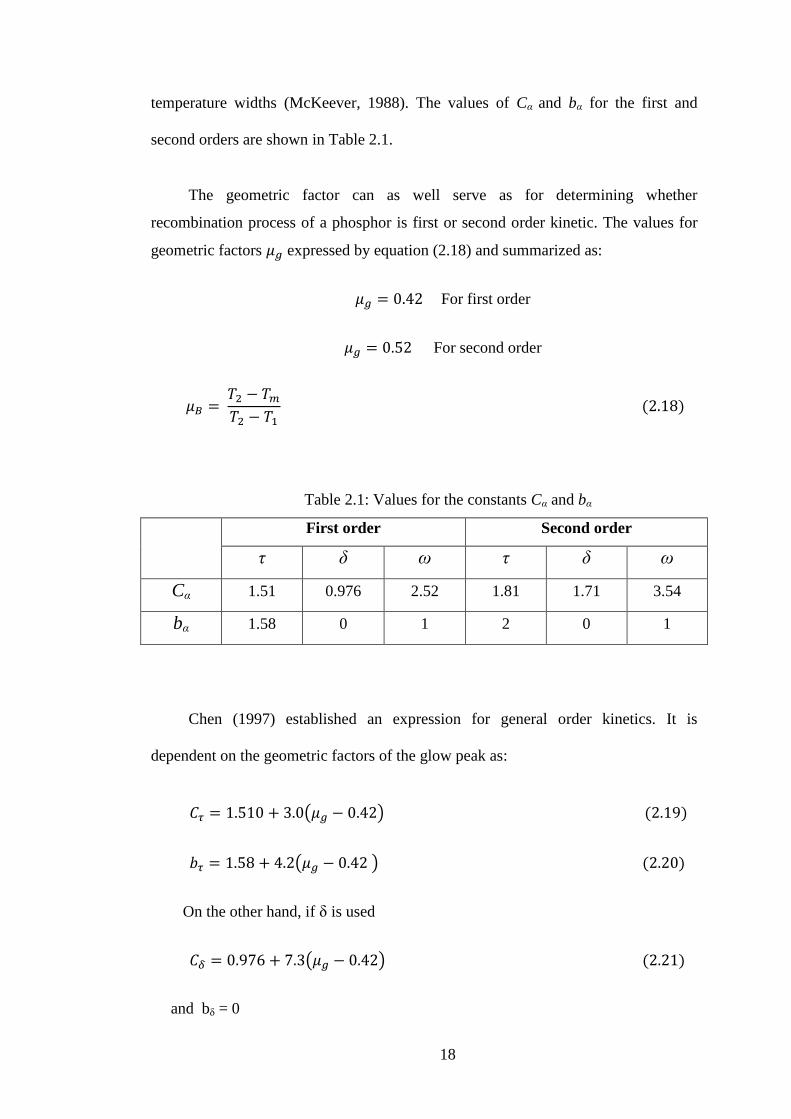
The geometric factor can as well serve as for determining whether
recombination process of a phosphor is first or second order kinetic. The values for
geometric factors expressed by equation (2.18) and summarized as:
For first order
For second order
Table 2.1: Values for the constants Cα and bα
First order Second order
τ δ ω τ δ ω
Cα 1.51 0.976 2.52 1.81 1.71 3.54
bα 1.58 0 1 2 0 1
Chen (1997) established an expression for general order kinetics. It is
dependent on the geometric factors of the glow peak as:
( )
( )
On the other hand, if δ is used
( )
and bδ = 0

19
In the case in which ω is used,
( )
and bω= 1
The above terms for C’s and b’s are applicable for cases where the frequency
factor is only weakly dependant on temperature. The frequency factor S can be
calculated once the activation energy is obtained using the following equation.
(
) (
)
(
) (
) (
where β is the linear heating rate, b is the order of kinetics, E is the activation
energy and Tm is the max temperature.
I /2
I
Figure 2.3: General TL glow curve, showing also the parameters discussed in the
peak shape glow curve analysis methods.
20
2.5.4 Sensitivity
The glow curve area (TL) per unit mass of the dosimeter (m) and per unit of
dose (D) in unit (nC g¯¹ Gy¯¹) is called the TL sensitivity as shown in equation 2.24,
(Furetta et al., 2000).
This data is given relatively to the TL sensitivity of TLD-100
(McKeever et al., 1995), then:
The TL sensitivity depends on both TL materials and reader system, for
instance the heating profile and light detection system (Rasid, 2015). Dosimeters
from the same production batch might be different in their sensitivity. Different
reasons may account for the differences of the sensitivity of the same dosimetric
material such as: difference in the detectors masses; difference in the optical density
of the detectors; or contamination that may cover the surface of a detector. The
calibration process, known as Elemental Correlation Coefficient (ECC) between
dosimeters of the same batch can minimized the error by 1-2%
(Bøtter-Jensen et al., 2003).
2.5.5 Dose response (linearity)
The linear relation between TL intensity (I) and the absorbed dose (D) is an
important characteristic of a TL dosimeter. Some TL materials show non-linear

21
escalation at the range of dose of interest. However, the sign of non-linear regions in
the dose response curve of a TLD is not sufficient reason to ignore its use as a TLD,
it only means that it needs good calibration and correction
(McKeever, 1988, Pekpak et al., 2010). The plot of the TL response as a function of
various doses may demonstrate different zones. This can be seen in Figure 2.4 where
the TL emission is not linear in the low dose D1 region and also at high dose Ds. Two
universal indices have been suggested to describe all forms of nonlinearity. First is
called superlinearity index where it shows the indication of change in the slop of the
dose response. Second is known as supralinearity index or dose function where it is
used to quantify the size of the correction needed for extrapolation of the linear dose
region.
Figure 2.4: The various zones which could be observed in a plot of TL as a
function of dose (Furetta, & Weng, 1998).
A fundamental relation between TL response and the absorbed dose can be
given as the equation (2.26):