Development of the Analytical Hierarchy Process (AHP ... · Development of the Analytical Hierarchy...
12
Development of the Analytical Hierarchy Process (AHP) method for rehabilitation project ranking before disasters M. Yadollahi & M. Z. Rosli Faculty of Civil Engineering, University of Technology, Malaysia Abstract Various proposals for rehabilitation of different structures are presented to decision makers in the forms of rehabilitation proposals. Managers and decision makers have to be aware of the consequences of selecting particular structures as rehabilitation alternatives. The Analytical Hierarchy Process (AHP) as a powerful and simple method can help decision-makers evaluate proposals against a set of weighted criteria and use a data evaluation form to verify that the necessary data have been provided. This study presents a model based on AHP methodology to develop the strategy for ranking non-similar structures against multi-hazard conditions. For this purpose, a quantitative matrix consisting of numerical values for disasters and structures can easily represent the ranking of structures for any purpose such as rehabilitation or fund allocation. It is an approach that describes how good decisions are made rather than prescribes how they should be made. This model offers opportunity to change criteria and modify judgments. A case study for ranking of four types of structures in a road network against four common types of disaster is presented to show the applicability of the proposed model. The results of the study show the relative importance weights of the road structures. The achieved normalized numeric results (for each group of structure) indicate the importance of these structures in the road network. Keywords: risk analysis, disaster management, Analytical Hierarchy Process (AHP), decision making, rehabilitation. Disaster Management and Human Health Risk II 209 www.witpress.com, ISSN 1743-35 (on-line) WIT Transactions on the Built Environment, Vol 119, © 2011 WIT Press 09 doi:10.2495/DMAN110191
Transcript of Development of the Analytical Hierarchy Process (AHP ... · Development of the Analytical Hierarchy...
Development of the Analytical Hierarchy Process (AHP) method for rehabilitation project ranking before disasters
M. Yadollahi & M. Z. Rosli Faculty of Civil Engineering, University of Technology, Malaysia
Abstract
Various proposals for rehabilitation of different structures are presented to decision makers in the forms of rehabilitation proposals. Managers and decision makers have to be aware of the consequences of selecting particular structures as rehabilitation alternatives. The Analytical Hierarchy Process (AHP) as a powerful and simple method can help decision-makers evaluate proposals against a set of weighted criteria and use a data evaluation form to verify that the necessary data have been provided. This study presents a model based on AHP methodology to develop the strategy for ranking non-similar structures against multi-hazard conditions. For this purpose, a quantitative matrix consisting of numerical values for disasters and structures can easily represent the ranking of structures for any purpose such as rehabilitation or fund allocation. It is an approach that describes how good decisions are made rather than prescribes how they should be made. This model offers opportunity to change criteria and modify judgments. A case study for ranking of four types of structures in a road network against four common types of disaster is presented to show the applicability of the proposed model. The results of the study show the relative importance weights of the road structures. The achieved normalized numeric results (for each group of structure) indicate the importance of these structures in the road network. Keywords: risk analysis, disaster management, Analytical Hierarchy Process (AHP), decision making, rehabilitation.
Disaster Management and Human Health Risk II 209
www.witpress.com, ISSN 1743-35 (on-line) WIT Transactions on the Built Environment, Vol 119, © 2011 WIT Press
09doi:10.2495/DMAN110191
1 Introduction
In recent years, the world has witnessed a significant increase in losses associated with natural disasters. Both socio-economic and climatic factors are contributing to this upward trend in disaster losses. Managers and decision makers have to be aware of the consequences of selecting particular structures as rehabilitation alternatives. Various proposals for reconstruction or rehabilitation of different structures present to project managers and decision makers in the forms of rehabilitation proposals. In last decade, the vulnerability assessment of critical infrastructure in road network has been investigated by many researchers and decision makers from different points of view. Jenelius et al. [9] introduced important indices for network links to estimate the vulnerability index. Menoni et al. [10], using a set of parameters measuring the response capacity of lifelines exposed to earthquakes, proposed an assessment tool for measuring the response capacity of lifelines exposed to earthquakes. In the field of landslide, Cardinali et al. [5] proposed a model to evaluate landslide hazard and risk. Same methodologies for evaluating the risk of other hazards for road network infrastructures were done by other researchers. To find the quantitative amount of risk, it is common to introduce a risk index for specific hazard and try to quantify this index. Kannami [7] and Schaerer [8] applied almost the same methods to achieve this goal for hazard of flood and avalanche respectively. This research proposes a model based on Analytical Hierarchy Process (AHP) to develop the matrix of different criteria for different disasters. Based on mathematics and psychology, AHP was developed by Thomas L. Saaty [1] in the 1970s and has been extensively studied and refined since then. Users of the AHP first decompose their decision problem into a hierarchy of more easily comprehended sub-problems, each of which can be analysed independently. AHP is a method where the objectives, attributes, or elements of a decision are formatted in a hierarchy and weighted according to the degree of preference the decision makers assign to each element. This method usually helps the problem of multicriteria decision making in the situation in which there exists a prioritization of criteria. It does not take for granted the measurements on scales, but asks that scale values be interpreted according to the objectives of the problem. In this study, relative importance criteria is evaluated first for different structures and then based on the weights of disasters, new weighs will import to the model. Disaster Weights are numerical values evaluated for each structure when the influence of specific disaster is considered. The result of multiple sets of pair-wise comparisons at each level is a weighted value hierarchy, with all of the priorities in the decision concisely captured and expressed as numerical values. Therefore, there is quantitative matrixes consist of numerical values for disasters and structures that can easily represents the ranking of structures for any purposes such as rehabilitation or fund allocation decision making. It is an approach that describes how good decisions are made rather than prescribes how they should be made.
210 Disaster Management and Human Health Risk II
www.witpress.com, ISSN 1743-35 (on-line) WIT Transactions on the Built Environment, Vol 119, © 2011 WIT Press
09
2 Methodology and formulation of the developed AHP model
The analytic hierarchy process is a structured technique for dealing with complex decisions. Rather than prescribing a "correct" decision, the AHP helps the decision makers find the one that best suits their needs and their understanding of the problem. Once the hierarchy is built, the decision makers systematically evaluate its various elements by comparing them to one another two at a time. In making the comparisons, the decision makers can use real data about the elements, or they can use their judgments about the elements' relative meaning and importance. It is the essence of the AHP that human judgments, and not just the underlying information, can be used in performing the evaluations [1]. Natural disasters are infrequent events with the potential to cause significant economic losses and human suffering. Generally, in real situations, every structure is exposed to more than one type of disasters; although most of the researches in the field of risk management have focused on risk of only one disaster, such as earthquake, and only one structure, such as buildings or bridges. A comprehensive risk analysis includes assessments of various levels of the hazard, as well as of consequences to structures should the hazard occur. Disasters are linked not only to hazardous events but also to the vulnerabilities of the exposed elements and capacities within the society to cope with them. This paper presents a practical methodology for rehabilitation project ranking against different hazards using AHP concept. This methodology is divided in three parts:
Hazard Identification: To score hazards for specific type of structure based on basic AHP method;
Structure Vulnerability Assessment: To score vulnerability of structures against specific type of hazard based on basic AHP method;
Weight Assignment Process: To build the multi-dimensional matrix using two pre-mentioned AHP matrixes to rank the structures against hazards.
If there rare more than one type of structures, then the rank of each structure is assumed as the total risk for the specific structure and is calculated as below:
. (1)
where WStructure is the relative importance weight of structure in comparison to other structures and RankStructure is quantitative value of risk for specific structure against different hazards. Both of the mentioned factors range from 0 to 10, so RankTotal is a number from 0 to 100 and represents the relative ranking of specific structure in comparison to other non-similar structures against different disasters. According to general definition of risk, which is a function of hazard (criticality) and vulnerability, we can easily show that:
. (2)
where VTotal is the total vulnerability of specific structure against all hazards (disasters) and HTotal is the quantitative amount of ranking hazards affecting the
Disaster Management and Human Health Risk II 211
www.witpress.com, ISSN 1743-35 (on-line) WIT Transactions on the Built Environment, Vol 119, © 2011 WIT Press
09
structure in a specific region. In the following sections the way of calculating the qualitative value of these two parameters is presented.
2.1 Hazard identification and weight assignment process
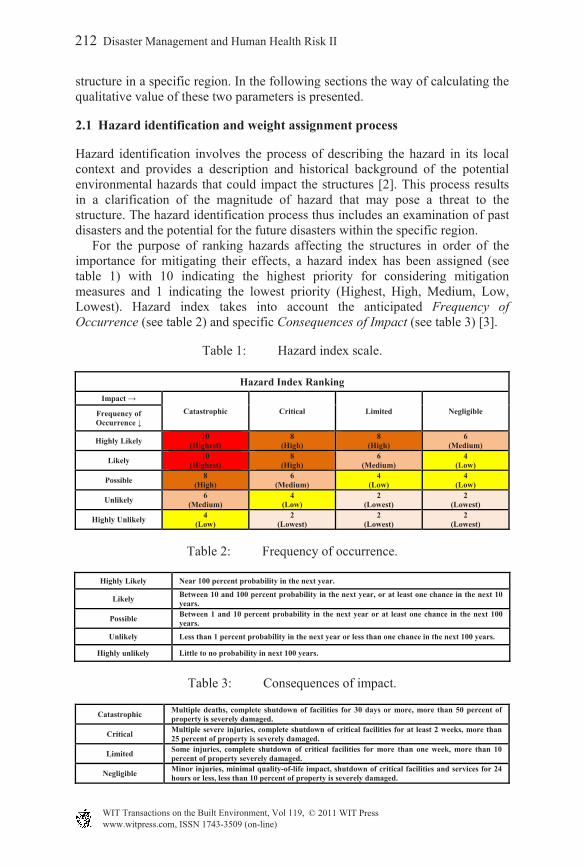
Hazard identification involves the process of describing the hazard in its local context and provides a description and historical background of the potential environmental hazards that could impact the structures [2]. This process results in a clarification of the magnitude of hazard that may pose a threat to the structure. The hazard identification process thus includes an examination of past disasters and the potential for the future disasters within the specific region. For the purpose of ranking hazards affecting the structures in order of the importance for mitigating their effects, a hazard index has been assigned (see table 1) with 10 indicating the highest priority for considering mitigation measures and 1 indicating the lowest priority (Highest, High, Medium, Low, Lowest). Hazard index takes into account the anticipated Frequency of Occurrence (see table 2) and specific Consequences of Impact (see table 3) [3].
Table 1: Hazard index scale.
Hazard Index Ranking
Impact →
Catastrophic Critical Limited Negligible Frequency of Occurrence ↓
Highly Likely 10
(Highest) 8
(High) 8
(High) 6
(Medium)
Likely 10
(Highest) 8
(High) 6
(Medium) 4
(Low)
Possible 8
(High) 6
(Medium) 4
(Low) 4
(Low)
Unlikely 6
(Medium) 4
(Low) 2
(Lowest) 2
(Lowest)
Highly Unlikely 4
(Low) 2
(Lowest) 2
(Lowest) 2
(Lowest)
Table 2: Frequency of occurrence.
Highly Likely Near 100 percent probability in the next year.
Likely Between 10 and 100 percent probability in the next year, or at least one chance in the next 10 years.
Possible Between 1 and 10 percent probability in the next year or at least one chance in the next 100 years.
Unlikely Less than 1 percent probability in the next year or less than one chance in the next 100 years.
Highly unlikely Little to no probability in next 100 years.
Table 3: Consequences of impact.
Catastrophic Multiple deaths, complete shutdown of facilities for 30 days or more, more than 50 percent of property is severely damaged.
Critical Multiple severe injuries, complete shutdown of critical facilities for at least 2 weeks, more than 25 percent of property is severely damaged.
Limited Some injuries, complete shutdown of critical facilities for more than one week, more than 10 percent of property severely damaged.
Negligible Minor injuries, minimal quality-of-life impact, shutdown of critical facilities and services for 24 hours or less, less than 10 percent of property is severely damaged.
212 Disaster Management and Human Health Risk II
www.witpress.com, ISSN 1743-35 (on-line) WIT Transactions on the Built Environment, Vol 119, © 2011 WIT Press
09
Four types of hazards will be evaluated in this study. For each of the hazards, a simple and relative index introduced in order to evaluate the score for the criticality of the region for specific structure. This evaluation is based on rapid risk assessment and, obviously, for more detailed evaluation, other factors need to be assessed. The hazards is introduced based on the most important disasters occurred in road network as a practical sample for developing the model. In the following sections, hazards and relative factor for hazard evaluation is introduced.
2.1.1 Earthquake Earthquake ground motion may be characterized by either [4]:
The peak ground acceleration expected at a site in a given period of time, from which the design spectrum may be drawn based on several simplifying assumptions, or
By two points on the design spectrum from which the remainder of the spectrum may be drawn using fewer, but more realistic, assumptions than in above.
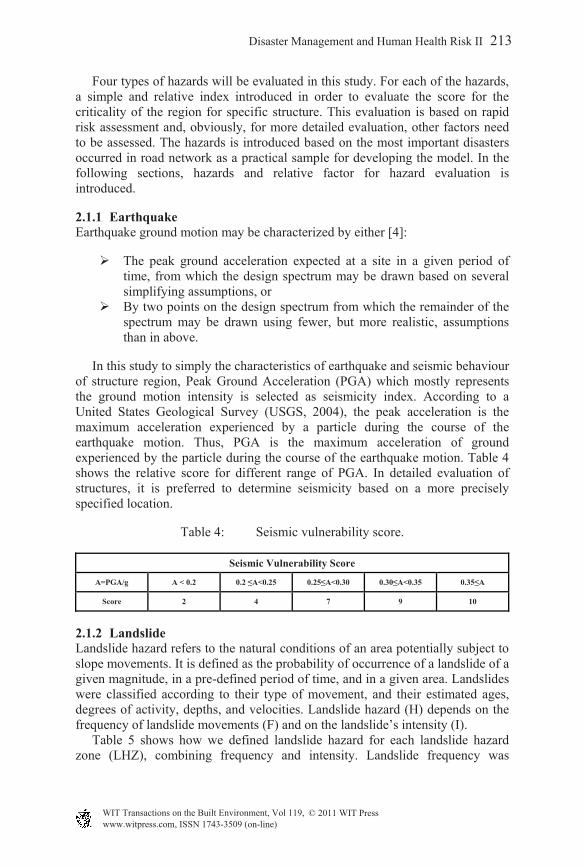
In this study to simply the characteristics of earthquake and seismic behaviour of structure region, Peak Ground Acceleration (PGA) which mostly represents the ground motion intensity is selected as seismicity index. According to a United States Geological Survey (USGS, 2004), the peak acceleration is the maximum acceleration experienced by a particle during the course of the earthquake motion. Thus, PGA is the maximum acceleration of ground experienced by the particle during the course of the earthquake motion. Table 4 shows the relative score for different range of PGA. In detailed evaluation of structures, it is preferred to determine seismicity based on a more precisely specified location.
Table 4: Seismic vulnerability score.
Seismic Vulnerability Score
A=PGA/g A < 0.2 0.2 ≤A<0.25 0.25≤A<0.30 0.30≤A<0.35 0.35≤A
Score 2 4 7 9 10
2.1.2 Landslide Landslide hazard refers to the natural conditions of an area potentially subject to slope movements. It is defined as the probability of occurrence of a landslide of a given magnitude, in a pre-defined period of time, and in a given area. Landslides were classified according to their type of movement, and their estimated ages, degrees of activity, depths, and velocities. Landslide hazard (H) depends on the frequency of landslide movements (F) and on the landslide’s intensity (I). Table 5 shows how we defined landslide hazard for each landslide hazard zone (LHZ), combining frequency and intensity. Landslide frequency was
Disaster Management and Human Health Risk II 213
www.witpress.com, ISSN 1743-35 (on-line) WIT Transactions on the Built Environment, Vol 119, © 2011 WIT Press
09
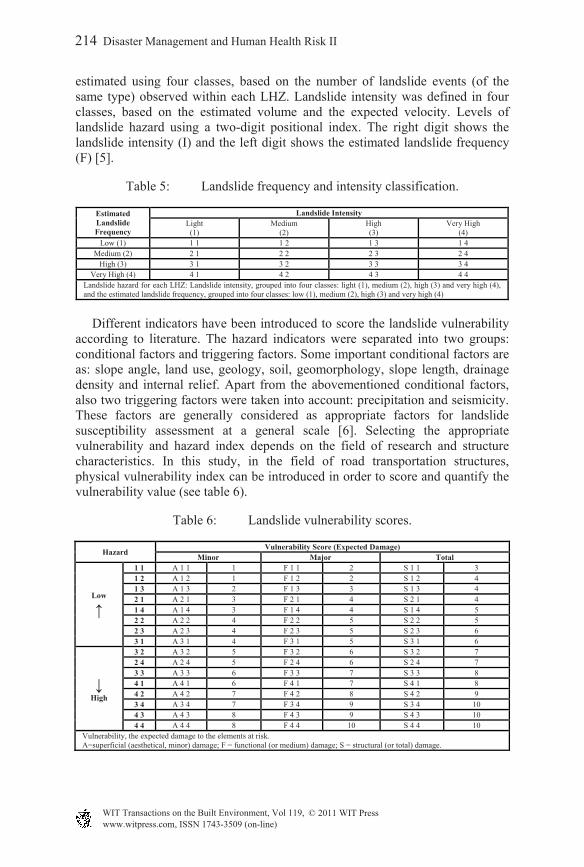
estimated using four classes, based on the number of landslide events (of the same type) observed within each LHZ. Landslide intensity was defined in four classes, based on the estimated volume and the expected velocity. Levels of landslide hazard using a two-digit positional index. The right digit shows the landslide intensity (I) and the left digit shows the estimated landslide frequency (F) [5].
Table 5: Landslide frequency and intensity classification.
Estimated Landslide Frequency
Landslide Intensity Light (1)
Medium (2)
High (3)
Very High (4)
Low (1) 1 1 1 2 1 3 1 4 Medium (2) 2 1 2 2 2 3 2 4
High (3) 3 1 3 2 3 3 3 4 Very High (4) 4 1 4 2 4 3 4 4
Landslide hazard for each LHZ: Landslide intensity, grouped into four classes: light (1), medium (2), high (3) and very high (4), and the estimated landslide frequency, grouped into four classes: low (1), medium (2), high (3) and very high (4)
Different indicators have been introduced to score the landslide vulnerability according to literature. The hazard indicators were separated into two groups: conditional factors and triggering factors. Some important conditional factors are as: slope angle, land use, geology, soil, geomorphology, slope length, drainage density and internal relief. Apart from the abovementioned conditional factors, also two triggering factors were taken into account: precipitation and seismicity. These factors are generally considered as appropriate factors for landslide susceptibility assessment at a general scale [6]. Selecting the appropriate vulnerability and hazard index depends on the field of research and structure characteristics. In this study, in the field of road transportation structures, physical vulnerability index can be introduced in order to score and quantify the vulnerability value (see table 6).
Table 6: Landslide vulnerability scores.
Hazard Vulnerability Score (Expected Damage)
Minor Major Total
Low
↑
1 1 A 1 1 1 F 1 1 2 S 1 1 3 1 2 A 1 2 1 F 1 2 2 S 1 2 4 1 3 A 1 3 2 F 1 3 3 S 1 3 4 2 1 A 2 1 3 F 2 1 4 S 2 1 4 1 4 A 1 4 3 F 1 4 4 S 1 4 5 2 2 A 2 2 4 F 2 2 5 S 2 2 5 2 3 A 2 3 4 F 2 3 5 S 2 3 6 3 1 A 3 1 4 F 3 1 5 S 3 1 6
↓ High
3 2 A 3 2 5 F 3 2 6 S 3 2 7 2 4 A 2 4 5 F 2 4 6 S 2 4 7 3 3 A 3 3 6 F 3 3 7 S 3 3 8 4 1 A 4 1 6 F 4 1 7 S 4 1 8 4 2 A 4 2 7 F 4 2 8 S 4 2 9 3 4 A 3 4 7 F 3 4 9 S 3 4 10 4 3 A 4 3 8 F 4 3 9 S 4 3 10 4 4 A 4 4 8 F 4 4 10 S 4 4 10
Vulnerability, the expected damage to the elements at risk. A=superficial (aesthetical, minor) damage; F = functional (or medium) damage; S = structural (or total) damage.
214 Disaster Management and Human Health Risk II
www.witpress.com, ISSN 1743-35 (on-line) WIT Transactions on the Built Environment, Vol 119, © 2011 WIT Press
09
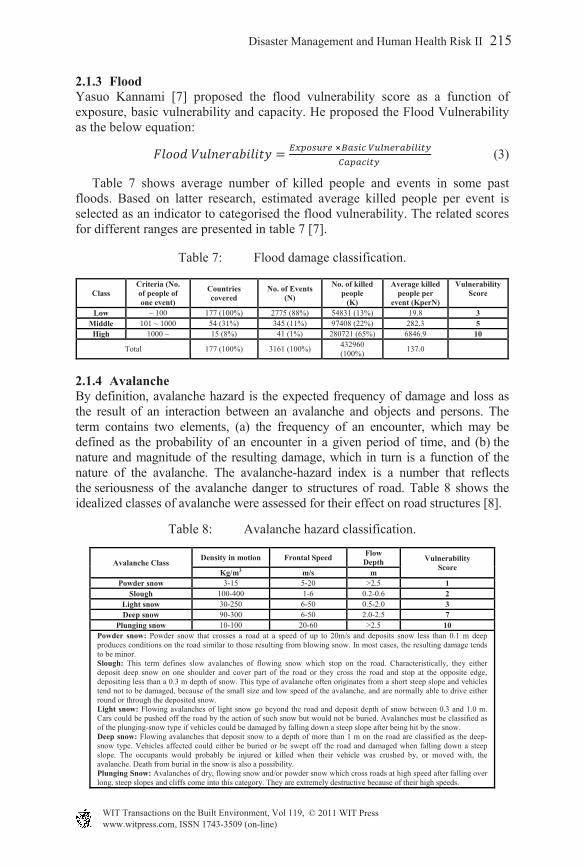
2.1.3 Flood Yasuo Kannami [7] proposed the flood vulnerability score as a function of exposure, basic vulnerability and capacity. He proposed the Flood Vulnerability as the below equation:
⨯
(3)
Table 7 shows average number of killed people and events in some past floods. Based on latter research, estimated average killed people per event is selected as an indicator to categorised the flood vulnerability. The related scores for different ranges are presented in table 7 [7].
Table 7: Flood damage classification.
Class Criteria (No. of people of one event)
Countries covered
No. of Events (N)
No. of killed people
(K)
Average killed people per
event (KperN)
Vulnerability Score
Low ~ 100 177 (100%) 2775 (88%) 54831 (13%) 19.8 3 Middle 101 ~ 1000 54 (31%) 345 (11%) 97408 (22%) 282.3 5 High 1000 ~ 15 (8%) 41 (1%) 280721 (65%) 6846.9 10
Total 177 (100%) 3161 (100%) 432960 (100%)
137.0
2.1.4 Avalanche By definition, avalanche hazard is the expected frequency of damage and loss as the result of an interaction between an avalanche and objects and persons. The term contains two elements, (a) the frequency of an encounter, which may be defined as the probability of an encounter in a given period of time, and (b) the nature and magnitude of the resulting damage, which in turn is a function of the nature of the avalanche. The avalanche-hazard index is a number that reflects the seriousness of the avalanche danger to structures of road. Table 8 shows the idealized classes of avalanche were assessed for their effect on road structures [8].
Table 8: Avalanche hazard classification.
Avalanche Class Density in motion Frontal Speed
Flow Depth Vulnerability
Score Kg/m3 m/s m
Powder snow 3-15 5-20 >2.5 1 Slough 100-400 1-6 0.2-0.6 2
Light snow 30-250 6-50 0.5-2.0 3 Deep snow 90-300 6-50 2.0-2.5 7
Plunging snow 10-100 20-60 >2.5 10 Powder snow: Powder snow that crosses a road at a speed of up to 20m/s and deposits snow less than 0.1 m deep produces conditions on the road similar to those resulting from blowing snow. In most cases, the resulting damage tends to be minor. Slough: This term defines slow avalanches of flowing snow which stop on the road. Characteristically, they either deposit deep snow on one shoulder and cover part of the road or they cross the road and stop at the opposite edge, depositing less than a 0.3 m depth of snow. This type of avalanche often originates from a short steep slope and vehicles tend not to be damaged, because of the small size and low speed of the avalanche, and are normally able to drive either round or through the deposited snow. Light snow: Flowing avalanches of light snow go beyond the road and deposit depth of snow between 0.3 and 1.0 m. Cars could be pushed off the road by the action of such snow but would not be buried. Avalanches must be classified as of the plunging-snow type if vehicles could be damaged by falling down a steep slope after being hit by the snow. Deep snow: Flowing avalanches that deposit snow to a depth of more than 1 m on the road are classified as the deep-snow type. Vehicles affected could either be buried or be swept off the road and damaged when falling down a steep slope. The occupants would probably be injured or killed when their vehicle was crushed by, or moved with, the avalanche. Death from burial in the snow is also a possibility. Plunging Snow: Avalanches of dry, flowing snow and/or powder snow which cross roads at high speed after falling over long, steep slopes and cliffs come into this category. They are extremely destructive because of their high speeds.
Disaster Management and Human Health Risk II 215
www.witpress.com, ISSN 1743-35 (on-line) WIT Transactions on the Built Environment, Vol 119, © 2011 WIT Press
09

2.2 Structure vulnerability assessment
Structure vulnerability is a condition or process resulting from physical and environmental factors, which determine the likelihood and scale of damage from the impact of a given hazard. The goal of the vulnerability assessment in this study is to estimate the consequences of hazards which affect on a specific structure and assign a weight to structure vulnerability against a specific disaster. For this propose, the total vulnerability as any structure, is calculated as below:
∑
(4)
where a1 to a7 are the relative weights of each hazards, Vi are the vulnerability scores of the structures against related hazards and n is the number of hazards. In this equation, Vi are estimated based on tables 4, 6, 7 and 8 for relative hazards. Two other vulnerability score, VStructural and VStability are estimated for each type of structure based on physical condition of structures. ai is estimated based on pair-comparison analysis. The analysis is come from questionnaire survey results.
2.3 Questionnaire survey design based on pair-comparison analysis
Users of the AHP first decompose their decision problem into a hierarchy of more easily comprehended sub-problems, each of which can be analysed independently. The elements of the hierarchy can relate to any aspect of the decision problem, carefully measured or roughly estimated, anything at all that applies to the decision at hand [1]. Table 9 shows the fundamental scale for pair-wise comparisons. In the current study, a pilot survey was conducted with experienced risk managers and engineers to validate the final questionnaire. The questionnaire was then administered by interview with 80 selected risk and disaster practitioners within the ministry of road and transportation and some other consultant companies who are primary participants in disaster risk management area.
Table 9: The fundamental scale for pair-wise comparisons.
Intensity of Importance
Definition Explanation
1 Equal importance Two elements contribute equally to the objective
3 Moderate importance Experience and judgment sightly favour one element over another
5 Strong importance Experience and judgment strongly favour one element over another
7 Very strong importance One element is favoured very strongly over another, its dominance is
demonstrated in practice
9 Extreme importance The evidence favouring one element over another is of the highest
possible orders of affirmation Intensities of 2, 4, 6 and 8 can be used to express intermediate values.
216 Disaster Management and Human Health Risk II
www.witpress.com, ISSN 1743-35 (on-line) WIT Transactions on the Built Environment, Vol 119, © 2011 WIT Press
09
The main important goals of the questionnaire survey were to answer the following questions:
What are the related weights of four aforementioned hazards to any specific structure in the affected area?
What are the relative impotence weights of four structures in the road network?
To find the weighs for these two questions, the responders were asked to compare the hazards in pair and assign weights for their comparison according to the table 9.
3 Case study: road infrastructures
The presented methodology for ranking non-similar structures against various hazards using AHP developed method has been implemented for 4 types of structure in road network against 4 mentioned hazards. The structures are the main vulnerable components of road network which any malfunction, damage or removal from service would significantly affect public safety, national security, economic activity or environmental quality.
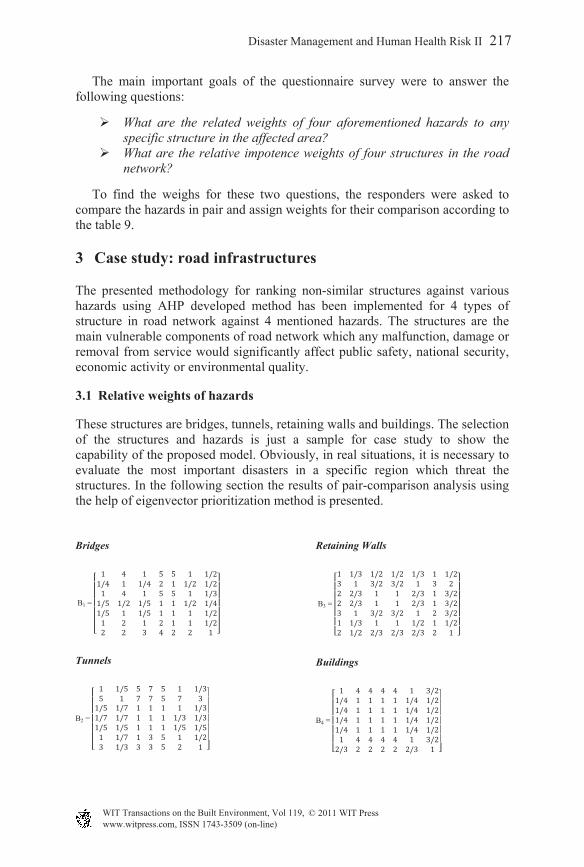
3.1 Relative weights of hazards
These structures are bridges, tunnels, retaining walls and buildings. The selection of the structures and hazards is just a sample for case study to show the capability of the proposed model. Obviously, in real situations, it is necessary to evaluate the most important disasters in a specific region which threat the structures. In the following section the results of pair-comparison analysis using the help of eigenvector prioritization method is presented.
Bridges
B1 =
1 4 1 5 5 1 1/21/4 1 1/4 2 1 1/2 1/21 4 1 5 5 1 1/31/5 1/2 1/5 1 1 1/2 1/41/5 1 1/5 1 1 1 1/21 2 1 2 1 1 1/22 2 3 4 2 2 1
Tunnels
B2 =
1 1/5 5 7 5 1 1/35 1 7 7 5 7 31/5 1/7 1 1 1 1 1/31/7 1/7 1 1 1 1/3 1/31/5 1/5 1 1 1 1/5 1/51 1/7 1 3 5 1 1/23 1/3 3 3 5 2 1
Retaining Walls
B3 =
1 1/3 1/2 1/2 1/3 1 1/23 1 3/2 3/2 1 3 22 2/3 1 1 2/3 1 3/22 2/3 1 1 2/3 1 3/23 1 3/2 3/2 1 2 3/21 1/3 1 1 1/2 1 1/22 1/2 2/3 2/3 2/3 2 1
Buildings
B4 =
1 4 4 4 4 1 3/21/4 1 1 1 1 1/4 1/21/4 1 1 1 1 1/4 1/21/4 1 1 1 1 1/4 1/21/4 1 1 1 1 1/4 1/21 4 4 4 4 1 3/22/3 2 2 2 2 2/3 1
Disaster Management and Human Health Risk II 217
www.witpress.com, ISSN 1743-35 (on-line) WIT Transactions on the Built Environment, Vol 119, © 2011 WIT Press
09
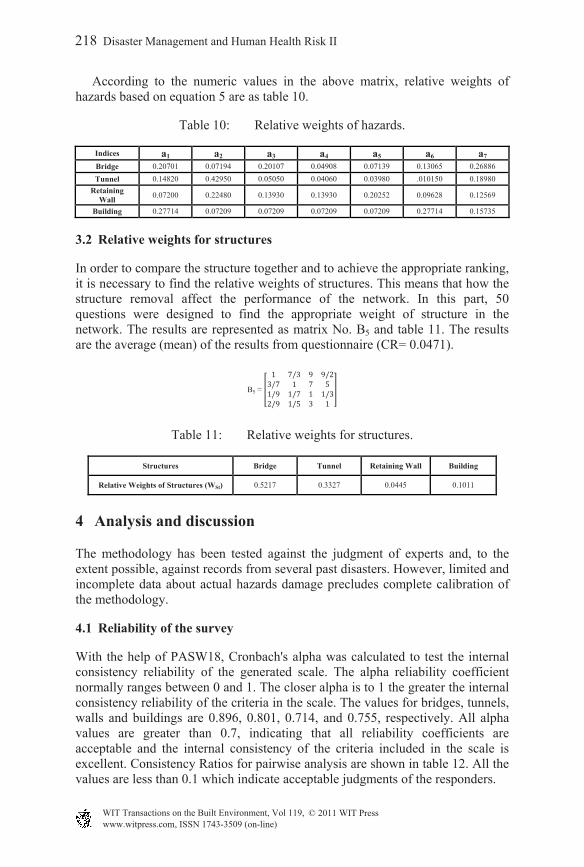
According to the numeric values in the above matrix, relative weights of hazards based on equation 5 are as table 10.
Table 10: Relative weights of hazards.
Indices a1 a2 a3 a4 a5 a6 a7 Bridge 0.20701 0.07194 0.20107 0.04908 0.07139 0.13065 0.26886
Tunnel 0.14820 0.42950 0.05050 0.04060 0.03980 .010150 0.18980
Retaining Wall
0.07200 0.22480 0.13930 0.13930 0.20252 0.09628 0.12569
Building 0.27714 0.07209 0.07209 0.07209 0.07209 0.27714 0.15735
3.2 Relative weights for structures
In order to compare the structure together and to achieve the appropriate ranking, it is necessary to find the relative weights of structures. This means that how the structure removal affect the performance of the network. In this part, 50 questions were designed to find the appropriate weight of structure in the network. The results are represented as matrix No. B5 and table 11. The results are the average (mean) of the results from questionnaire (CR= 0.0471).
B5 =
1 7/3 9 9/23/7 1 7 51/9 1/7 1 1/32/9 1/5 3 1
Table 11: Relative weights for structures.
Structures Bridge Tunnel Retaining Wall Building
Relative Weights of Structures (WSt) 0.5217 0.3327 0.0445 0.1011
4 Analysis and discussion
The methodology has been tested against the judgment of experts and, to the extent possible, against records from several past disasters. However, limited and incomplete data about actual hazards damage precludes complete calibration of the methodology.
4.1 Reliability of the survey
With the help of PASW18, Cronbach's alpha was calculated to test the internal consistency reliability of the generated scale. The alpha reliability coefficient normally ranges between 0 and 1. The closer alpha is to 1 the greater the internal consistency reliability of the criteria in the scale. The values for bridges, tunnels, walls and buildings are 0.896, 0.801, 0.714, and 0.755, respectively. All alpha values are greater than 0.7, indicating that all reliability coefficients are acceptable and the internal consistency of the criteria included in the scale is excellent. Consistency Ratios for pairwise analysis are shown in table 12. All the values are less than 0.1 which indicate acceptable judgments of the responders.
218 Disaster Management and Human Health Risk II
www.witpress.com, ISSN 1743-35 (on-line) WIT Transactions on the Built Environment, Vol 119, © 2011 WIT Press
09
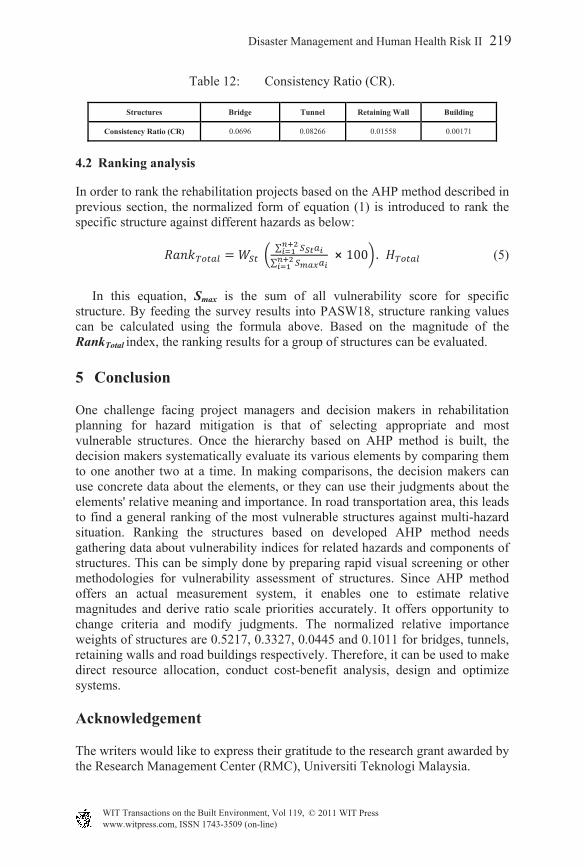
Table 12: Consistency Ratio (CR).
Structures Bridge Tunnel Retaining Wall Building
Consistency Ratio (CR) 0.0696 0.08266 0.01558 0.00171
4.2 Ranking analysis
In order to rank the rehabilitation projects based on the AHP method described in previous section, the normalized form of equation (1) is introduced to rank the specific structure against different hazards as below:
∑
∑ ⨯ 100 . (5)
In this equation, Smax is the sum of all vulnerability score for specific structure. By feeding the survey results into PASW18, structure ranking values can be calculated using the formula above. Based on the magnitude of the RankTotal index, the ranking results for a group of structures can be evaluated.
5 Conclusion
One challenge facing project managers and decision makers in rehabilitation planning for hazard mitigation is that of selecting appropriate and most vulnerable structures. Once the hierarchy based on AHP method is built, the decision makers systematically evaluate its various elements by comparing them to one another two at a time. In making comparisons, the decision makers can use concrete data about the elements, or they can use their judgments about the elements' relative meaning and importance. In road transportation area, this leads to find a general ranking of the most vulnerable structures against multi-hazard situation. Ranking the structures based on developed AHP method needs gathering data about vulnerability indices for related hazards and components of structures. This can be simply done by preparing rapid visual screening or other methodologies for vulnerability assessment of structures. Since AHP method offers an actual measurement system, it enables one to estimate relative magnitudes and derive ratio scale priorities accurately. It offers opportunity to change criteria and modify judgments. The normalized relative importance weights of structures are 0.5217, 0.3327, 0.0445 and 0.1011 for bridges, tunnels, retaining walls and road buildings respectively. Therefore, it can be used to make direct resource allocation, conduct cost-benefit analysis, design and optimize systems.
Acknowledgement
The writers would like to express their gratitude to the research grant awarded by the Research Management Center (RMC), Universiti Teknologi Malaysia.
Disaster Management and Human Health Risk II 219
www.witpress.com, ISSN 1743-35 (on-line) WIT Transactions on the Built Environment, Vol 119, © 2011 WIT Press
09
References
[1] Saaty, Thomas L., Relative Measurement and its Generalization in Decision Making: Why Pairwise Comparisons are Central in Mathematics for the Measurement of Intangible Factors, RACSAM, 102 (2): 251–318, 2008.
[2] John C. Pine, Natural Hazard Analysis, Reducing the Impact of Disasters, CRC Press, Taylor & Francis Group LLC, 2009.
[3] North Carolina Division of Emergency Management (NCDEM). Town of Holden Beach, North Carolina, SECTION 2: Hazard Vulnerability Analysis.
[4] Seismic Retrofitting Manual for Highway Structures, MCEER-08-SP02. Federal Highway Administration, Part 1: Bridges, 2008.
[5] M. Cardinali, P. Reichenbach, F. Guzzetti, M. Cacciano, M. Castellani and P. Salvati, A geomorphological approach to the estimation of landslide hazards and risks in Umbria, Central Italy, Natural Hazards and Earth System Sciences, 2: 57–72c, European Geophysical Society, 2002.
[6] E. A. C. Abella and C. J. Van Westen, Generation of a landslide risk index map for Cuba using spatial multi-criteria evaluation, Springer-Verlag, 2007.
[7] Yasuo Kannami, Establishment of Country-Based Flood Risk Index, Pacific Consultants Co., LTD. of Japan, Director: International Centre for Water Hazard and Risk Management (ICHARM), PWRI, Japan, 2007.
[8] P. Schaerer, The Avalanche-Hazard Index, National Research Council of Canada, Annals of Glaciology 13, International Glaciological Society, 1989.
[9] Jenelius, E., Petersen, T. and Mattsson, L., Importance and exposure in road network vulnerability analysis, Transportation Research, 40, 537–560, 2006.
[10] Menoni, S., Pergalani, S., Boni, M. P. and Petrini, V., Lifelines earthquake vulnerability assessment: a systemic approach, Soil Dynamics and Earthquake Engineering, 22, 1199–1208, 2002.
220 Disaster Management and Human Health Risk II
www.witpress.com, ISSN 1743-35 (on-line) WIT Transactions on the Built Environment, Vol 119, © 2011 WIT Press
09