DEVELOPMENT OF SMALL FLOATING PLATFORM WITH TUNED …
98
DEVELOPMENT OF SMALL FLOATING PLATFORM WITH TUNED LIQUID COLUMN DAMPER CHOI KEAN BOON A project report submitted in partial fulfilment of the requirements for the award of Bachelor of Engineering (Hons.) Mechanical Engineering Lee Kong Chian Faculty of Engineering and Science Universiti Tunku Abdul Rahman May 2015
Transcript of DEVELOPMENT OF SMALL FLOATING PLATFORM WITH TUNED …

DEVELOPMENT OF SMALL FLOATING PLATFORM WITH TUNED
LIQUID COLUMN DAMPER
CHOI KEAN BOON
A project report submitted in partial fulfilment of the
requirements for the award of Bachelor of Engineering
(Hons.) Mechanical Engineering
Lee Kong Chian Faculty of Engineering and Science
Universiti Tunku Abdul Rahman
May 2015

ii
DECLARATION
I hereby declare that this project report is based on my original work except for
citations and quotations which have been duly acknowledged. I also declare that it has
not been previously and concurrently submitted for any other degree or award at
UTAR or other institutions.
Signature :
Name : CHOI KEAN BOON
ID No. : 10UEB04226
Date :

iii
APPROVAL FOR SUBMISSION
I certify that this project report entitled “DEVELOPMENT OF SMALL
FLOATING PLATFROM WITH TUNED LIQUID DAMPER” was prepared by
CHOI KEAN BOON has met the required standard for submission in partial
fulfilment of the requirements for the award of Bachelor of Engineering (Hons.)
Mechanical Engineering at Universiti Tunku Abdul Rahman.
Approved by,
Signature :
Supervisor : Mr King Yeong Jin
Date :

iv
The copyright of this report belongs to the author under the terms of the
copyright Act 1987 as qualified by Intellectual Property Policy of Universiti Tunku
Abdul Rahman. Due acknowledgement shall always be made of the use of any
material contained in, or derived from, this report.
© 2015, CHOI KEAN BOON. All right reserved.

v
Specially dedicated to
my beloved grandmother, mother and father

vi
ACKNOWLEDGEMENTS
First of all, I would like to express my deepest gratitude as well as appreciation to my
research supervisor, Mr King Yeong Jin for his precious advice, guidance and his
enormous patience throughout the course of my Final Year Project. Besides this,
advice given by Mr Wong Hong Mun has been a great help in my project. Without the
relentless help and support from Mr King and Mr Wong, it would impossible to see to
the success of this project
In addition, I would also like to express my gratitude to my loving family
member and friends; Zack Thiem, Steve Lim, Francis Ong, and Tan Cher Ching who
had helped out in my project and given me invaluable encouragement during the
development of my project.
Last but not least, a special thanks to Uncle Ho and Mr Hwang from the
mechanical and civil workshop which has provide me with priceless advice on
manufacturing my prototype.
Finally, I would like to utilise this opportunity to express my utmost gratitude
to everyone who may possibly has contributed to the success of this project.

vii
DEVELOPMENT OF SMALL FLOATING PLATFORM WITH TUNED
LIQUID COLUMN DAMPER
ABSTRACT
Nowadays, offshore engineering has been growing rapidly, indirectly results in the
advancement of the floating platform design. However, the fundamental concept still
remains the same which is the buoyant force required by the floating platform is
determined by using the Archimedes’ Principle while the stability can be quantified
by computing the metacentric height and the critical tilting angle. In order to suppress
the vibration of the platform, TLCD is implemented onto the platform. The parameter
affecting the performance of TLCD against seismic loading on mainland has been
investigated extensively by the researcher around the world, but no the wave loading.
Hence, it is important to validate the effect of the parameter of TLCD when it is reacted
toward wave loading as a badly tuned TLCD may ended up in a disastrous way by
causing the structure to vibrate more vigorously. The main parameter that will be
investigated by this paper will be the head loss coefficient, tuning ratio and mass ratio.
It is shown that there is an optimum value of head loss coefficient depending on the
mass ratio of the floating platform. On the other hand, the effect of mass ratio on the
TLCD is the higher the better. However, the mass ratio is usually restricted by the
practicability as a TLCD of high mass ratio is too costly to manufacture. Thus, the
mass ratio is restricted below 5% for cost saving as the improvement in performance
of the TLCD is not significant anymore when it increase beyond the 5%. The tuning
ratio acts in a similar way of the head loss coefficient. There is an optimum value to
which the TLCD will function the best. Theoretically, the optimum tuning ratio is 1,
however in reality, the optimum tuning ratio is slightly less than 1 due to the fact that
the installation of TLCD onto the platform has induce an addition degree of freedom
onto the platform.

viii
TABLE OF CONTENTS
DECLARATION ii
APPROVAL FOR SUBMISSION iii
ACKNOWLEDGEMENTS vi
ABSTRACT vii
TABLE OF CONTENTS viii
LIST OF TABLES x
LIST OF FIGURES xi
LIST OF SYMBOLS / ABBREVIATIONS xiv
LIST OF APPENDICES xvi
CHAPTER
1 INTRODUCTION 17
1.1 Background 17
1.2 Types of Floating Platform 18
1.3 Tuned Liquid Column Damper (TLCD) 19
1.4 Problem Statement 20
1.5 Aims and Objectives 22
2 LITERATURE REVIEW 23
2.1 Floating Platform 23
2.2 Archimedes’ Principle 26
2.3 Head Loss Coefficient, of TLCD 27
2.4 Length Ratio, 𝛂 of TLCD 31
2.5 Tuning Ratio, β of TLCD 32

ix
2.6 Mass Ratio, 𝝁 of TLCD 34
3 METHODOLOGY 36
3.1 Platform Design Stage 36
3.2 TLCD Design Stage 38
3.2.1 Head Loss Coefficient Study 39
3.2.2 Tuning Ratio and Mass Ratio Study 39
3.3 Manufacturing and Material Selection Approach 40
3.3.1 Platform Manufacturing 41
3.3.2 Bone Frame Reinforcement Manufacturing 44
3.3.3 TLCD Manufacturing 45
3.4 Experimental Setup 47
4 RESULTS, CALCULATION AND DISCUSSION 51
4.1 Theoretical Buoyancy Calculation and Comparison to
Experimental Result 51
4.2 Metacentric Height Calculation and Evaluation 53
4.2.1 Metacentric Height and Righting Arm at Different
Tilting Angle 56
4.3 Effect of Head Loss Coefficient 60
4.4 Composite Effect of Mass Ratio and Tuning Ratio 68
4.5 Hydrostatic Force Simulation Result and Specification of
Platform 71
4.5.1 Technical Drawing of Platform and TLCD 72
4.5.2 Simulation Result 73
5 CONCLUSION AND RECOMMENDATIONS 74
5.1 Problem Encountered and Future Recommendations 74
5.2 Conclusion 75
REFERENCES 77
APPENDICES 79

x
LIST OF TABLES
TABLE TITLE PAGE
2.1 Head Loss Coefficient of TLCD With Varied
Blocking Ratio. (Wu, et al., 2005) 28
2.2 Optimum Parameter of TLCD for Various Mass
Ratio(𝛍 in this table) and Liquid Length Ratio(𝛂
in this table). (Shum, 2005) 30
3.1 Example of The Simulation Done on The
Platform 37
4.1 Metacentric Height and Righting Arm
Distribution on Different Tilting Angle 57
4.2 Blocking Ratio and Head Loss Coefficient for
Different Diameter Orifice Plate 61
4.2 Maximum Absolute Displacement Amplitude of
Channel 1 and Channel 2 for Each Orifice Plate
Diameter 65
4.4 Table of Reciprocal of Amplitude of Power
Spectrum for each Orifice Plate 67
4.2 Mass Ratio and Tuning Ratio for Different
Water Level 69

xi
LIST OF FIGURES
FIGURE TITLE PAGE
1.1 Types of Offshore Structure (Subrata, 2005) 18
1.2 Illustration of TLCD (Lee, Wong and Lee, 2005 19
1.3 Family of TLCD. (Venkateswara, 2013) 19
1.4 Illustration of Metacentre. (Donald, et al., 2013) 20
2.1 Illustration of TLP (Subrata, 2005) 23
2.2 Mechanics of Tendon (Subrata, 2005) 24
2.3 Righting Moment Created During Tilting of
TLP. (Subrata, 2005) 25
2.4 Normalized Displacement of Structure Against
Tuning Ratio (𝛃 in this graph) graph for various
head loss coefficient (𝛏 in this graph). (Matteo, et
al., 2014) 29
2.5 Optimum Blocking Ratio against Mass Ratio.
(Tanmoy and Subrata, et al., 2014) 30
2.6 The Effect of Length Ratio on the Performance
Indices of TLCD on Various Mass Ratio. (Min,
et al., 2005) 32
2.7 Variation of Performance Indices with respect to
Tuning Ratio on Various Mass Ratio. (Min, et al.,
2005) 33
2.8 Normalized Structure Displacement against
Tuning Ratio for Various Mass Ratio. (Matteo,
et al., 2014) 34

xii
3.1 Sample of TLCD to be Built. (Wu, et al., 2005) 38
3.2 Sample of TLCD Parts Drawing For
Manufacture 41
3.3 Vertical Bandsaw 42
3.4 Sample Perspex That Has Been Cut 43
3.5 Perspex Being Sticked Together With Book as
Force 43
3.6 Cross Sectional Design of Aluminium Profile 44
3.7 Identical Left Hand Side and Right Hand Side of
TLCD 45
3.8 Milling Machine 46
3.9 Platform With TLCD Installed 47
3.10 IMC Dynamic Signal Analyser and Kistler Type
K Shear Accelerometer 48
3.11 Full Experimental Setup 48
3.12 Accelerometer to Channel Orientation 49
3.13 Wave Generation Method 49
4.1 Platform’s Height 52
4.2 Height of Liquid Displaced 52
4.3 CG Calculated From SolidWorks 54
4.4 AutoCAD Front View Drawing For Calculation 54
4.5 Platform Tilted by 10° about CG 56
4.6 Righting Arm and Metacentric Height When
Platform Tilted by 10° about CG 57
4.7 Graph of Metacentric Height against Angle
Tilted 58
4.8 Graph of Righting Arm against Angle Tilted 59
4.9 Filtered Acceleration Response for 4 mm
Diameter Orifice Plate 62

xiii
4.10 Displacement Response for 4 mm Diameter
Orifice Plate 63
4.11 Vibration Motion of the Platform Using 4 mm
Diameter Orifice 63
4.12 Displacement Response for 8 mm Diameter
Orifice Plate 64
4.13 Vibration Motion of the Platform Using 8 mm
Diameter Orifice 64
4.14 Power Spectrum Analysis for Channel 1 of
Different Configuration 66
4.15 Power Spectrum Analysis for Channel 2 of
Different Configuration 66
4.16 Performance in Mitigating Vibration against the
Coefficient of Head Loss 67
4.17 Power Spectrum for Different Water Level at
Channel 1 70
4.18 Power Spectrum for Different Water Level at
Channel 2 71
4.19 Modelled Platform with TLCD installed 72
4.20 Technical Drawing of Platform 72
4.21 Stress Analysis by Simulation 73
4.22 Displacement Analysis by Simulation 73

xiv
LIST OF SYMBOLS / ABBREVIATIONS
𝐹𝐵 Buoyant force, N
hD Height of liquid displaced, m
𝜌 Density, kg/m3
VD Volume of fluid displaced, m3
g Gravitational acceleration, m/s2
BD Horizontal column length, m
𝐵𝐷,𝑁𝑒𝑤 Horizontal column length of another new TLCD, m
LD Vertical column length, m
𝐿𝐷,𝑁𝑒𝑤 Vertical column length of another new TLCD, m
L Total length of liquid of the TLCD, m
𝐿𝑁𝑒𝑤 Total length of liquid of another new TLCD, m
A Cross sectional area of TLCD, m2
AD Cross sectional area of liquid displaced, m2
𝐴𝑁𝑒𝑤 Cross sectional area of another new TLCD, m2
𝐷 Diameter of orifice plate, m
∇ Increment or decrement in length, m
𝑚 Mass of the object, kg
𝑚𝐵𝐷 Mass of liquid in the horizontal column, kg
𝑚𝑇𝐿𝐶𝐷 Mass of total liquid in the TLCD, kg
𝜔𝐷 Natural frequency of TLCD, rad/s
𝜔𝑤 Frequency of wave generated, rad/s
𝑊𝑇𝐿𝐶𝐷+𝑃𝑙𝑎𝑡𝑓𝑜𝑟𝑚 Weight of TLCD and platform, N
𝐹𝐿𝑜𝑎𝑑𝑖𝑛𝑔 Total loading on the platform, N
GM metacentric height, m
RA Righting arm, m
𝐶𝐺𝑛𝑒𝑤,𝑦 CG of the platform and TLCD together with the weight, m

xv
𝐶𝐺𝑦 y coordinate of the CG of the object, m
CB Centre of Buoyancy
CG Centre of Gravity
M metacentre
ψ blocking ratio
η head loss coefficient
α length ratio
𝜇 mass ratio
β tuning ratio
Actual Experimental result of a variable
Theoretical Calculated result of a variable
TLCD Tuned Liquid Column Damper
LCVA Liquid Column Vibration Absorber
DTLCD Double Tuned Liquid Column Damper
HTLCD Hybrid Tuned Liquid Column Damper
PTLCD Pressurized Tuned Liquid Column Damper
TLCBD Tuned Liquid Column Ball Damper

xvi
LIST OF APPENDICES
APPENDIX TITLE PAGE
A Result for Graphical Method of GM and RA for
Different Tilting Angle at an increment of 10° 79
B Accelerometer Response for Different Orifice Plate
Diameter at Water Level of 15 cm 87
C Accelerometer Response for 10 cm Orifice Plate
Diameter at Different Water Level 94
D Accelerometer Response for Platform without
TLCD 97

17
CHAPTER 1
1 INTRODUCTION
1.1 Background
The offshore field has been growing rapidly due to the rising need of new energy
source and minerals, consequently the exploration and development in the field of
offshore oil and gas has been stimulated aggressively. Indirectly, this has given rise to
many concepts and structure for application in the deep oceans for harvesting energy
and minerals. (Subrata, 2005)
This includes the development of offshore structures design. Offshore structure
is defined as structure which does not have fixed access to the dry land and may even
be required to stay in position disregarding of the weather condition. There are two
types of offshore structure which is the common one which is fixed to the seabed or
the floating structures which may be anchored to the seabed by using either a rope or
cable or dynamically positioned by other device such as thrusters which allows the
floating structure to drift freely. (Subrata, 2005)
The offshore structure that will be discussed in this report in the latter part will
be restricted to only floating platform due to the fact that the objective of the developed
platform is for mounting solar panel but not for harvesting minerals from the seabed.

18
1.2 Types of Floating Platform
Even though there are many types of offshore structure, but for floating platform there
is only 3 type which is the Semi-FPS (Floating Production Facility), Conventional
Tension Leg Platform (TLP), Mini-TLP. All these 3 types of floating platform suits
for different deep water system as shown in Figure 1.1 (Subrata, 2005)
Figure 1.1: Types of Offshore Structure (Subrata, 2005)
A Semi FPS is a neutrally buoyant floating production unit which allows 6
degree of freedom. It is generally used to produce and harvest the oil and gas cost-
effectively. On the other hand, Conventional TLP is a compliant platform which are
vertically tethered to the seabed. For this type of TLP, the platform is designed with
excess buoyant force and this excessive buoyant force is tethered by using cable or
rope which are called tendon to allow only swaying and surging motion of the platform.
For Mini TLP, as the name implied, is a miniature version of Conventional TLP.
(Subrata, 2005)

19
1.3 Tuned Liquid Column Damper (TLCD)
The idea of utilising liquid in a U-tube to create damping effect for reducing structural
vibration by merely allowing it to pass through a small orifice opening in the U-tube
was first introduced by Sakai F. in the year of 1989. This device is termed as Tuned
Liquid Column Damper as shown in Figure 1.2.(Sakai, 1989)
Figure 1.2: Illustration of TLCD (Lee, Wong and Lee, 2005)
This idea has then be used, further developed extensively and even several
modification has been made to the original TLCD. The classification of TLCD
available is shown at Figure 1.3.
Figure 1.3: Family of TLCD. (Venkateswara, 2013)
The term LCVA stands for Liquid Column Vibration Absorber. The difference
between LCVA and TLCD is that a LVCA has a different cross-section in the
TLCD
LCVA DTLCD HTLCD PTLCD TLCBD

20
horizontal and vertical column while TLCD has a same cross-section in the horizontal
and vertical column. Double Tuned Liquid Column Damper, DTLCD , Hybrid Tuned
Liquid Column Damper, as well as Pressurized Tuned Liquid Column Damper,
PTLCD is not popular due to the complexity in building it and predicting their damping
behaviour. (Wu, Shih and Lin, 2005) On the other hand, Tuned Liquid Column Ball
Damper, TLCBD is the use of a rolling ball instead of an orifice to induce a head loss
in the fluid flow of the TLCD. (Tanmoy and Subrata, 2014)
1.4 Problem Statement
The floating platform designed was meant to act as a platform for a place to hold or
support the solar panel for harvesting solar energy. Hence, the first problem that has
arise would be to design a platform with sufficient buoyant force to ensure that the
platform is able to afloat in the ocean while providing the tendon with sufficient
tension force.
In addition, it is well known that in order to have a floating structure to maintain
stable afloat without tipping over, it would require a metacentre, M of higher than the
centre of gravity of the floating object in order to produce a positive metacentric height,
GM. Once the metacentric height is negative, the floating structure would be unstable
and tip over. An illustration is shown in Figure 1.4 using a ship as an example.
Figure 1.4: Illustration of Metacentre. (Donald, et al., 2013)

21
From Figure 1.4, it is clearly seen that once the ship has tilted, the centre of buoyancy,
CB will change its location. The point of intersection of the buoyant force’s line of
action with the symmetric line passing through the centre of gravity, G is called the
metacentre.
Since the metacentric height varies as the tilting angle of the floating structure
varies, it has been a biggest challenge in obtaining the critical angle whereby the
floating structure will failed by tipping over and this appear to be a significant problem
to be solved.
Even though, we know that which at what critical angle will the floating
structure fails, we still need a device to suppress the vibration of the floating platform
so that it would not easily be tilted to the critical angle. Among so many damper such
as Tuned Mass Damper, Tuned Liquid Column Damper, Controllable Tuned Liquid
Damper and etc, TLCD is the easiest to be used and implemented. (Min, et al., 2005)
The parameter TLCD has been investigated and tested extensively in the main
land by various researcher such as Balendra (1995) , Wu (2005) and Min (2005).
However, there appears to be another big problem in which all these studies on TLCD
were performed for structure on the main land but not for floating structure. Hence,
the problem to be solved would be to test and validate whether TLCD in a floating
structure responding to wave loading will react the same way as if the structure is a
building in a main land subjected to the same loading.
Furthermore, the characteristic of wave has proven to be another big problem
that has to be solved. Even though one could simplify the wave pattern by modelling
the wave as regular wave, this may result in inaccuracy in response compared to the
actual application of the floating platform.

22
1.5 Aims and Objectives
As to be restated once again, the aim of this project is to implement a Tuned Liquid
Column Damper into the design of a small floating platform.
Since all the problem which may arise has been identified in the subsection 1.4
“Problem Statement”, the objective of this project can be stated clearly and concisely
with reference to the problem statement. In short, the objective of that has be achieved
is:
i. To determine the buoyancy force, metacentre and the critical angle of tilting of
the floating platform.
ii. To determine the general effect of head loss coefficient on the TLCD installed
on a floating platform.
iii. To determine the composite effect of mass ratio and tuning ratio on the TLCD
installed on a floating platform and which ratio has a more dominant effect on
TLCD.
The first object corresponded to the first problem identified in the subsection
“problem statement” whereby for a floating platform it is critical to find out the
buoyant force require and the metacentre of the floating platform. Even with this data,
it would prove quite useless for practical uses, hence these data is further processed
into the critical angle in which the floating platform will tilt over.
For the next 3 objectives, it is to validate the effect of the fundamental
parameters in TLCD installed on a floating against the effect which has been
investigated by previous researcher such as Balendra (1995) , Wu (2005) and Min
(2005) on main land structure.
The last problem is not listed as an objective and hence was not studied because
wave itself is a broad field which meant to be investigated standalone in another project
but not to be mingled up with this project concerning the floating platform and the
device to suppress the vibration of the platform which is the TLCD.

23
CHAPTER 2
2 LITERATURE REVIEW
2.1 Floating Platform
Tension Leg Platform, TLP consist of column and pontoon, like any other floating
structure. The uniqueness of this TLP is the mooring system or sometime called the
tether which essentially mean the vertical tendon. A simple illustration of TLP is
shown in Figure 2.1. (Subrata, 2005)
Figure 2.1: Illustration of TLP (Subrata, 2005)

24
The main function of the tether is to restrain the heave motion, hence in order
to achieve this functionality the tendon has to be pretension (normally constitute of 25%
to 45% of the total buoyant force). In addition, the presence of tether also makes the
TLP to be less worry on the hydrostatic and stability issue. The mechanics of tendon
is shown in Figure 2.2. (Subrata, 2005)
Figure 2.2: Mechanics of Tendon (Subrata, 2005)
It is also found that the key analytic area for the performance of a TLP is as
follow:
i. Weight and CG’s
ii. Wind Force
iii. Current Force
iv. Global Performance Analysis
a. Motions
b. Drift Force
c. Tendon Tensions
v. Global Strength

25
This is where the key area that has to be focus in the preliminary stage of TLP
designing. (Subrata, 2005)
From the Handbook of Offshore Engineering written by Subrata (2005), we
can see that the metacentre is not a concern for the TLP. This is because the tension
force from the tendon will tends to create a righting moment when it is tilted at certain
angle as shown in Figure 2.3.
Figure 2.3: Righting Moment Created During Tilting of TLP. (Subrata, 2005)
On the other hand, the wind load is considered due to the fact that Subrata
(2005) assumes the platform for the use of harvesting minerals such as hydrocarbon
which require tall structure to be built on top of the platform. Hence in our case, the
platform is used to mount solar panel which is of relatively low height, hence the wind
load can be neglected.
In a nut shell, in our case the key area that is needed to be focus on is Weight
and CG’s, Current Force, Global Performance Analysis and Global Strength.
26
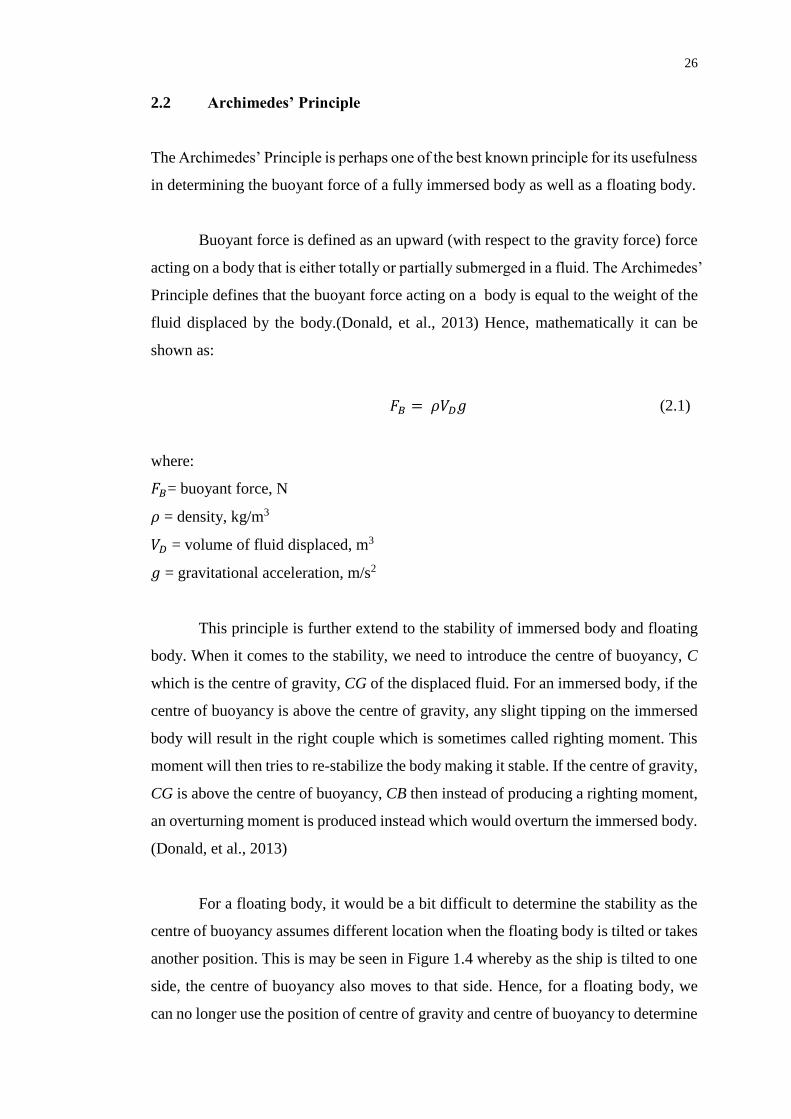
2.2 Archimedes’ Principle
The Archimedes’ Principle is perhaps one of the best known principle for its usefulness
in determining the buoyant force of a fully immersed body as well as a floating body.
Buoyant force is defined as an upward (with respect to the gravity force) force
acting on a body that is either totally or partially submerged in a fluid. The Archimedes’
Principle defines that the buoyant force acting on a body is equal to the weight of the
fluid displaced by the body.(Donald, et al., 2013) Hence, mathematically it can be
shown as:
𝐹𝐵 = 𝜌𝑉𝐷𝑔 (2.1)
where:
𝐹𝐵= buoyant force, N
𝜌 = density, kg/m3
𝑉𝐷 = volume of fluid displaced, m3
𝑔 = gravitational acceleration, m/s2
This principle is further extend to the stability of immersed body and floating
body. When it comes to the stability, we need to introduce the centre of buoyancy, C
which is the centre of gravity, CG of the displaced fluid. For an immersed body, if the
centre of buoyancy is above the centre of gravity, any slight tipping on the immersed
body will result in the right couple which is sometimes called righting moment. This
moment will then tries to re-stabilize the body making it stable. If the centre of gravity,
CG is above the centre of buoyancy, CB then instead of producing a righting moment,
an overturning moment is produced instead which would overturn the immersed body.
(Donald, et al., 2013)
For a floating body, it would be a bit difficult to determine the stability as the
centre of buoyancy assumes different location when the floating body is tilted or takes
another position. This is may be seen in Figure 1.4 whereby as the ship is tilted to one
side, the centre of buoyancy also moves to that side. Hence, for a floating body, we
can no longer use the position of centre of gravity and centre of buoyancy to determine

27
the stability, and another parameter called metacentric height is introduced. (Donald,
et al., 2013)
𝐺𝑀 =
𝐼0
𝑉𝐷− 𝐶𝐺 + 𝐶𝐵 (2.2)
where
GM = metacentric height, m
𝐼0 = second moment of inertia at the waterline, m4
CG = centre of gravity, m
CB = centre of buoyancy, m
By utilizing the GM value, we can easily determine the stability of a floating
body, a positive value indicate stable while a negative value indicate unstable. As a
conclusion, in order to determine whether the floating platform designed is stable, we
will need to determine the metacentric height of the platform. However, equation 2.2
is derived based on the small angle assumption, hence it only guarantee the stability of
the platform for an angle of tilting of below 15°. In order to determine the GM value
for other tilting angle, graphical method is used instead with the aid of software called
AutoCAD.
2.3 Head Loss Coefficient, of TLCD
Head loss coefficient, as it’s name implies is the coefficient that correlates to the head
loss of liquid flowing in the TLCD. Hence the value of head loss coefficient is the due
to the inner resistance and cross sectional area of the liquid column. (Min, et al., 2005)
However, the inner resistance in the liquid may sometimes be too negligent and
the dominating factor which contributes to the head loss is the orifice. Thus, head loss
coefficient is significantly affected by the blocking ratio, ψ of the orifice. (Wu, et al.,
2005) This is shown in the table 2.1 whereby 4 different TLCD is experimented
with different blocking ratio and their corresponding head loss coefficient value

28
shows that for the different configuration of TLCD, unless the blocking ratio is
varied or else the head loss coefficient will not varies much.
Table 2.1: Head Loss Coefficient of TLCD With Varied Blocking Ratio. (Wu, et
al., 2005)
Besides this, the test by Wu, et al. (2005) also shows that value of head
loss coefficient of a TLCD is independent of the mass ratio, 𝜇 as well as the length
ratio, 𝛼 of the TLCD as the 4 different TLCD used in Table 2.1 has different mass
ratio and length ratio. At the end, Wu, et al. (2005) has formulated a formula to
estimate the head loss coefficient value of a TLCD provided the blocking ratio of
the orifice which is :
𝜂 = (−0.6𝜓 + 2.1𝜓0.1)1.6 × (1 – 𝜓)−2 (2.3)
where
𝜂 = head loss coefficient
𝜓 = blocking ratio
So much for the determining the head loss coefficient, nevertheless our main
concern is the effect of the head loss coefficient on the performance of TLCD.
Apparently, there is an optimum head loss coefficient, it is neither the higher the better
nor the lower the better. This is shown in the Matteo, et al. (2014) result in Figure 2.4.

29
Figure 2.4: Normalized Displacement of Structure Against Tuning Ratio (𝛃 in
this graph) graph for various head loss coefficient (𝛏 in this graph). (Matteo, et
al., 2014)
From the result obtained by Matteo, et al. (2014) we can see that the optimum head
loss coefficient depends on the tuning ratio of the TLCD. As the tuning ratio of the
TLCD varies the effect of the head loss coefficient is different. The one remark to be
taken is that Matteo, et al. (2014) did not consider the effect of mass ratio on the
optimum value of the head loss coefficient. This makes Figure 2.4 to be quite
meaningless apart from letting us know that the tuning ratio will affect the optimal
head loss coefficient.
The effect of mass ratio on the optimum head loss coefficient can be obtained
by common sense that is a higher mass ratio would essentially means the liquid inside
the TLCD is carrying a high amount of energy and thus a higher head loss to dampen
the fluid flow while a low mass ratio would mean the liquid inside the TLCD to be
carrying low amount of energy, hence if high head loss is to be applied, the fluid inside
the TLCD would be bring to a stop in short period resulting in no damping effect. This
is agreed by Min, et al. (2005) whereby he stated that the optimal value of head loss
increases as the mass ratio increases or in another way round a TLCD with a higher

30
mass ratio will have a higher optimum head loss coefficient. Min, et al. (2005) further
stated that the performance of TLCD will deteriorate in spite of large mass ratio value
when the head loss coefficient is low. This trend is then backed up by the optimum
parameter of TLCD developed by Shum (2009) as shown in Table 2.2. This is also
agreed by experiment down by Tanmoy and Subrata (2014) shown in Figure 2.5.
Table 2.2: Optimum Parameter of TLCD for Various Mass Ratio(𝛍 in this
table) and Liquid Length Ratio(𝛂 in this table). (Shum, 2005)
Figure 2.5: Optimum Blocking Ratio against Mass Ratio. (Tanmoy and Subrata,
et al., 2014)

31
2.4 Length Ratio, 𝛂 of TLCD
Length Ratio of TLCD is defined as the horizontal length of the TLCD to the total
length of the TLCD. However this is only true provided that the TLCD has uniform
cross sectional area that is the vertical column and horizontal column of the TLCD has
the same cross sectional area. (Wu, et al., 2005)
By referring to Figure 1.2, the length ratio, α can be expressed as:
𝛼 =
𝐵𝐷
𝐵𝐷 + 2𝐿𝐷 (2.4)
where
𝐵𝐷 = horizontal column length, m
𝐿𝐷 = vertical column length, m
If the cross sectional area of the vertical and horizontal column is different,
then the length can be redefined as the mass of liquid in the horizontal column to the
total mass of liquid in the TLCD. (Matteo, et al., 2014)
𝛼 = 𝑚𝐵𝐷
𝑚𝑇𝐿𝐶𝐷 (2.5)
where
𝑚𝐵𝐷 = mass of liquid in the horizontal column, kg
𝑚𝑇𝐿𝐶𝐷 = mass of total liquid in the TLCD, kg
Generally, a larger length ratio will result in a better performance of the TLCD,
but if the length ratio exceeds a certain threshold value than it may destroy the basic
characteristic of the TLCD. (Min, et al., 2005)

32
Figure 2.6: The Effect of Length Ratio on the Performance Indices of TLCD on
Various Mass Ratio. (Min, et al., 2005)
Since the length ratio is often restricted by the design environment like space
available, hence there is no an optimum value but up to the designer to decide the value
which is usually suggested to be 0.7. (Wu, et al., 2005)
2.5 Tuning Ratio, β of TLCD
The tuning ratio is defined as the ratio natural frequency of the TLCD to the natural
frequency of the structure. The natural frequency of the structure, generally refers to
the principal mode if the structure possesses multiple mode of vibration. (Min, et al.,
2005).
One of the advantage of TLCD in the tuning ratio is that the natural frequency
of the TLCD can be controlled precisely by simply varying the total length of the liquid.
The formula for the natural frequency of TLCD is:

33
𝜔𝐷 = √2𝑔
𝐿 (2.6)
where
𝜔𝐷 = natural frequency of TLCD, rad/s
L = total length of liquid in the TLCD, m
Even though this is theoretical formula, Wu, et al. (2005) has tested the practicability
of this formula. The result is that the natural frequency of TLCD predicted by using
equation 2.6 varies by less than 2% from the actual value. (Wu, et al., 2005)
The effect of tuning ratio on the performance of TLCD is like the head loss
coefficient. There exist an optimum value of tuning ratio, too high or too low will only
render the TLCD useless. The theoretical optimum value of tuning ratio is 1 however,
in actual life, the optimum value of tuning ratio only approaches 1 when the mass ratio
decreases while at other times, the optimum tuning ratio is less than 1. (Min, et al.,
2005)
Figure 2.7: Variation of Performance Indices with respect to Tuning Ratio on
Various Mass Ratio. (Min, et al., 2005)

34
Besides this, the same trend has been witness from both Figure 2.7 and Table
2.2 whereby when the mass ratio is getting smaller, the optimum tuning ratio
approaches 1. This may be due to the fact that by installing the TLCD onto the structure,
it introduces a new degree of freedom and weight to it, resulting in some deviation of
the natural frequency of the structure from what we have calculated.
2.6 Mass Ratio, 𝝁 of TLCD
The mass ratio, μ is defined as the ratio of the mass of the TLCD to the mass of the
structure. In general, the effect of mass ratio on the performance of TLCD is very
straight forward, which is the higher the better. (Min, et al., 2005)
This is also supported by Matteo, et al., (2014) whereby in this result, the
normalized structure displacement is getting lesser as the mass ratio increases.
This is show in Figure 2.7
Figure 2.8: Normalized Structure Displacement against Tuning Ratio for
Various Mass Ratio. (Matteo, et al., 2014)
35
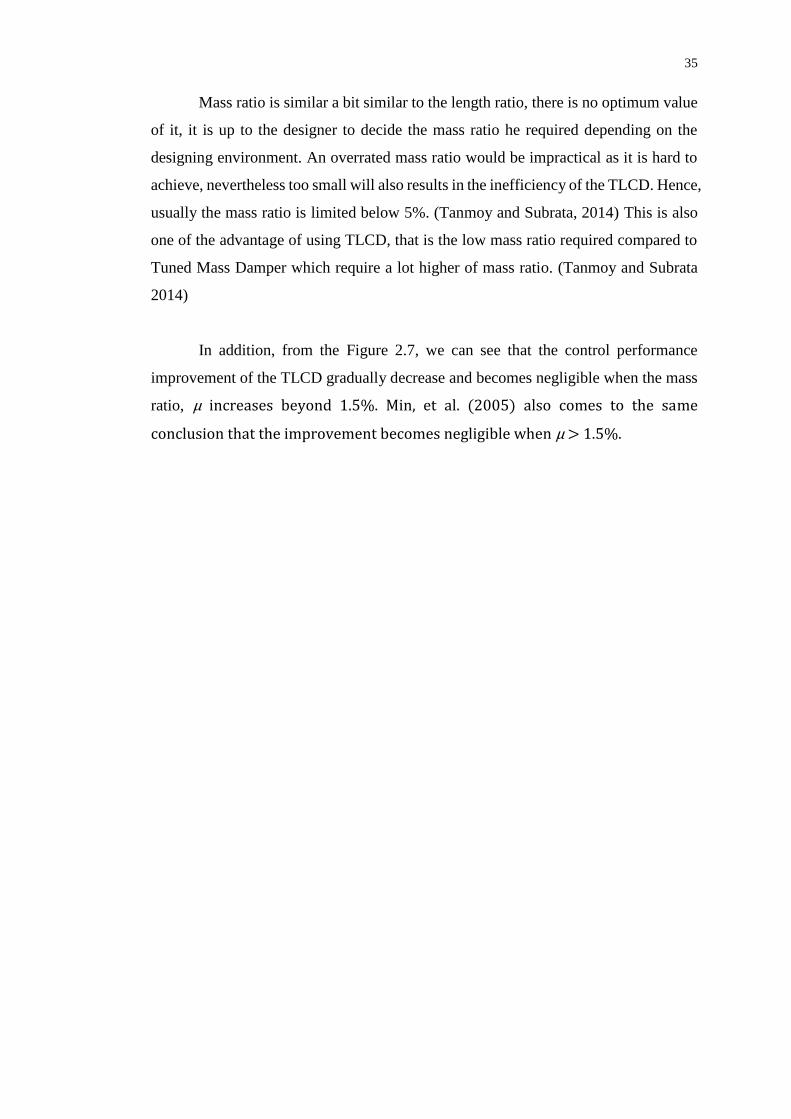
Mass ratio is similar a bit similar to the length ratio, there is no optimum value
of it, it is up to the designer to decide the mass ratio he required depending on the
designing environment. An overrated mass ratio would be impractical as it is hard to
achieve, nevertheless too small will also results in the inefficiency of the TLCD. Hence,
usually the mass ratio is limited below 5%. (Tanmoy and Subrata, 2014) This is also
one of the advantage of using TLCD, that is the low mass ratio required compared to
Tuned Mass Damper which require a lot higher of mass ratio. (Tanmoy and Subrata
2014)
In addition, from the Figure 2.7, we can see that the control performance
improvement of the TLCD gradually decrease and becomes negligible when the mass
ratio, μ increases beyond 1.5%. Min, et al. (2005) also comes to the same
conclusion that the improvement becomes negligible when μ > 1.5%.

36
CHAPTER 3
3 METHODOLOGY
3.1 Platform Design Stage
The floating platform to be designed is a 1.5 m by 1.5 m wide platform for the
mounting of solar panel while the total weight of the housing and the solar panel is
estimated to be 150 kg. However, due to the fact that this project is a low budget fund
with only RM500, a smaller prototype of 450 mm by 500 mm wide platform is made
instead, that is the size is scaled down by approximately 3 times. On the other hand the
total weight of the housing and the solar panel is scaled down to 5 kg instead of 50 kg
due to the fact that in our project the main purpose is to test the functionality and
feasibility of the TLCD instead of the rigidity and strength of the platform.
In this floating platform, the only thing that we will adopt in the Mini-TLP is
the mooring system. However, since the function of mooring system to prevent heave,
the presence of the mooring system is simulated by using a wave with lateral force
only. The reason being for no pontoon and hull will be designed in our floating
platform but only the deck which is a square container is that the intention of the
platform is for mounting solar panel which require very less buoyant force and hence
pontoon is not needed while the stability of the platform is preserved by utilizing the
TLCD and hence the hull is not needed as well. Thus, what to be cared in the designed
platform is to allocate a place for the housing of TLCD only.

37
In order to for the platform to float, the buoyancy force must be greater than
the 150 kg weight plus the weight of the platform and TLCD itself. In order to
calculate that:
𝐹𝐵 = 𝑊𝑇𝐿𝐶𝐷+𝑃𝑙𝑎𝑡𝑓𝑜𝑟𝑚 + 𝐹𝐿𝑜𝑎𝑑 (3.1)
where
𝑊𝑇𝐿𝐶𝐷+𝑃𝑙𝑎𝑡𝑓𝑜𝑟𝑚 = weight of the TLCD and the platform, N
𝐹𝐿𝑜𝑎𝑑 = loading force, N
By utilizing equation 3.1, the desired height of the floating platform can be
calculated. Once the height is calculated, the centre of gravity and the required second
moment of inertia of the platform is obtained by using a software which is SolidWorks.
These data is needed for the calculation of metacentric height in equation 2.2 to ensure
the platform is stable neutrally and the critical angle to which the platform can tilt.
In addition, in order to ensure the platform is able to sustain the global strength,
a simulation is done using SolidWorks to simulate the hydrostatic force and the loading
force acting on the platform as shown in Figure 3.1. Due to this, the whole platform
and TLCD will be modelled by using SolidWorks as well. The exact calculation and
simulation will be discussed in Chapter 4 which is the Result and Discussion Part.
Table 3.1: Example of the Simulation Done on the Platform
Assem ver_1-Study 1-Stress-Stress1

38
3.2 TLCD Design Stage
Since, the various parameter of TLCD has to be tested, multiple TLCD suits for each
different parameter study is designed as it is impossible to perform all the variation of
parameter in a single TLCD.
The TLCD designed will be of constant parameter except the parameter that
has to be study. Generally, the TLCD designing will be start by choosing a suitable
mass ratio and length ratio due to the design constraint such as the space available,
then the optimum value of tuning ratio and head loss coefficient will be determined by
using the optimum parameter table developed by Shum (2009) which will be shown
in the appendix. The optimum head loss coefficient is then achieved by using suitable
blocking ratio orifice plate. The head loss coefficient value of each orifice plate is
calculated using equation 2.3. On the other hand, the optimum tuning ratio is achieved
by adjusting the total length of liquid in the TLCD.
Finally, the last step is to check whether the liquid surface displacement in the
TLCD will exceed the vertical column length to prevent the worst case which is the
spilling of liquid out of the TLCD. This is performed by utilizing the method proposed
by Wu, Chang and Lin. (2009)
Figure 3.1: Sample of TLCD to be Built. (Wu, et al., 2005)

39
3.2.1 Head Loss Coefficient Study
By following the general concept of designing except that the optimum value of head
loss coefficient is not used. Instead, different orifice plate with different blocking ratio
is used. By referring to equation 2.3, the head loss coefficient for each orifice plate is
calculated and the response of the floating platform is obtained by using an
accelerometer.
From here, we can conclude that only one TLCD is required to study the Head
Loss Coefficient
3.2.2 Tuning Ratio and Mass Ratio Study
For tuning ratio study, it is a bit similar to length ratio study. The only difference is
that in order to maintain the length ratio and mass ratio while varying the tuning ratio,
the dimension of the new TLCD is calculated in a different way. Thus a few TLCD
with different dimension is needed to maintain other parameter while varying tuning
ratio.
On the other hand, for mass ratio study, it is first started off by following the
general principle which is first, by deciding the mass ratio and length ratio to obtain
the optimum tuning ratio and head loss coefficient from the optimum parameter table
in appendix. From there onwards, the mass ratio is varied while maintaining the other
optimum parameter by varying the cross-sectional dimension of TLCD. Hence, again
multiple TLCD is needed to study the mass ratio parameter.
From here, it can be concluded that in order to study the effect of tuning ratio
and mass ratio alone a mass number of TLCD with different dimension is needed.
However, due to the budget constraint in buying the material for TLCD, as well as the
time constraint in producing these vast amount of TLCD (at least 8 if it would to follow
the original approach), hence an alternative approach is used instead.

40
In this new approach, the effect of tuning ratio and mass ratio is grouped as one
parameter and is then studied all together the composite effect of tuning ratio and mass
ratio. This is done by varying the total length of liquid in TLCD which can be achieved
by simply reducing or increasing the amount of water inside the TLCD using a straw.
From equation 2.6, by reducing the total length of liquid in TLCD, the natural
frequency of the TLCD is increased, hence equivalent in increasing the tuning ratio.
At the same time, when the total length of liquid in the TLCD is reduced, the
mass ratio of TLCD will reduced as the reduced in total length of liquid in TLCD is
equivalent in reducing the mass of TLCD as the amount of liquid in it is lessen. Thus,
as the total length of liquid of TLCD is reduced, it is equal to increasing tuning ratio
and reducing the mass ratio.
3.3 Manufacturing and Material Selection Approach
In this project, there is two main parts that has to be manufactured which is the platform
that is used for the mounting of the solar panel and the TLCD which is used to mitigates
the vibration of the platform. However, due to rigidity concern of the platform,
reinforcement bone frame at the top of the platform is made to prevent the platform
from bending and buckling in shape.
When preparing to manufacture the parts, a parts drawing produced by using
SolidWorks is printed out before any actual manufacturing process is carried to prevent
minor mistake in the dimension of the parts being manufactured. In addition this extra
steps also provides a systematic ways to manufacture the parts without fear of
duplication and wrong doing. A sample of parts drawing produced by using
SolidWorks is shown in Figure 3.2.

41
Figure 3.2: Sample of TLCD Parts Drawing For Manufacture
3.3.1 Platform Manufacturing
For the platform that is to be manufactured, the material used is perspex. This is
because compared to material used in the conventional industrial for making a floating
platform which is mild steel, perspex is much easier to work with as it does not require
the skill of welding. Even with the skill of welding, it does not guarantee the welded
platform will be “water tight” as the welded portion of the platform maybe porous
especially at the edges resulting in water sipping into the platform, which is why in the
offshore industrial, all the welding worker must be certified by corresponding
organization to prove that they are skilled professional technician in welding that is
capable of welding parts which are meant to be water proof.
With the difficulty in utilizing mild steel, perspex is chosen as the material of
the platform. The next issue will then be determining the thickness of the perspex sheet
that is being used for manufacturing the platform. From the advice of mechanical

42
technician, perspex sheet of thickness lesser than 4 mm is very flexible, hence perspex
sheet of 4 mm thickness is chosen. After which, a simulation on the stress performance
of the platform using perspex of 4 mm thickness is done to double confirm the stress
performance of the platform under load. The result will be discuss in chapter 4.
First of all, the exact size of perspex that has to be cut is drawn onto the perspex
sheet using either a marker pen or a pencil. Then the exact dimension of perspex
wanted is cut off from the whole perspex sheet by using a machine call Vertical
Bandsaw as shown in Figure 3.3 while the sample perspex sheet cut is shown in Figure
3.4.
Figure 3.3: Vertical Bandsaw

43
Figure 3.4: Sample Perspex That Has Been Cut
With all the perspex sheet necessary to build the platform being cut out, all these sheet
is joined together to form the platform by using the chloroform. Chloroform is the
solvent for perspex, hence by applying it onto one of the perspex surface it can
temporarily dissolve the perspex allowing two surface to be joined together by simply
pressing the two surface of perspex together. After the chloroform vaporizes, the
perspex returns back to solid state and the part is joined together through the two
surface as shown in Figure 3.5. Simply put, the chloroform works like a glue that is
specially only for perspex.
Figure 3.5: Perspex Being Sticked Together With Book as Force

44
3.3.2 Bone Frame Reinforcement Manufacturing
For the bone frame of the platform, it is wanted to be rigid in nature to withstand load
as well as act as support when two piece of perspex is joined together as shown in
Figure 3.5. Thus, aluminium which is light and rigid is chosen as the material for this
bone frame reinforcement.
Instead of using aluminium bar, aluminium profile is used. This is because
solid aluminium bar is too heavy and the high rigidity of this solid aluminium bar is
not a necessary to our platform. Hence choosing solid aluminium bar would only
means over design for our platform. However, the hollow aluminium bar is too fragile,
a simple process of drilling 8 mm hole might bend the surface of the hollow aluminium
bar. Thus, the aluminium profile which is sometimes known as “conveyor aluminium”
is chosen. It has the optimum property that platform needed which is light and
sufficiently rigid. The rigidity of this aluminium profile comes from the cross sectional
design of the aluminium profile as shown in Figure 3.6, which makes it lighter than
solid aluminium bar yet possesses higher rigidity than hollow aluminium bar.
Figure 3.6: Cross Sectional Design of Aluminium Profile

45
3.3.3 TLCD Manufacturing
For the TLCD manufacturing, it is divided into multiple smaller parts. All of these part
is manufactured using perspex sheet of 4 mm due to the flexibility of perspex in
machining out the precise shape of TLCD. By referring to Figure 3.2 which is the part
drawing of TLCD as a whole, it is divided into 3 part for the ease of manufacturing
that is the orifice plate which is inside of the TLCD, the left hand side of TLCD and
the right hand side of TLCD. The TLCD is split into left hand side and right hand side
part because it can be seen from Figure 3.2 that the TLCD is symmetric about the
centre (left hand side is identical to right hand side), hence by splitting it into two parts
makes the manufacturing process more easier as we would only need to duplicate
another set of the left hand side of TLCD instead of directly producing the U shape
TLCD as shown in Figure 3.7.
Figure 3.7: Identical Left Hand Side and Right Hand Side of TLCD
By using the Vertical Bandsaw machine as shown in Figure 3.3, the TLCD is
cut into pieces of rectangular shape perspex sheet which is then joined together through

46
the use of chloroform. However, since the TLCD require a certain degree of precision,
another machine call milling machine as shown in Figure 3.8 is used to mill the perspex
sheet to the exact dimension as well as producing a smooth surface.
Figure 3.8: Milling Machine
For the orifice plate manufacturing, it involves cutting out a small piece of
perspex sheet after which a hole is drilled on top of it, representing the vena contracta
channel. Since a gasket is used to ensure the “water proof” in inserting the orifice plate
onto the TLCD, hence the orifice plate does not require a high degree of precision.

47
3.4 Experimental Setup
In this project, the main objective is to develop a floating platform which utilizes
TLCD to mitigate vibration originate from the ocean waves. Thus the main
experimental setup will be the floating platform with the TLCD installed as shown in
Figure 3.9. The technical drawing with specification of the platform and TLCD will
be included in the appendix as reference.
Figure 3.9: Platform With TLCD Installed
Besides the platform with the TLCD installed, a data logger with analyser
function as well as accelerometer sensor is needed as well. The data logger used is
IMC Cronos-PL2 while the accelerometer used is Kistler Type K-shear as shown in
Figure 3.10. In order to mount the accelerometer to the platform, a small amount of
wax is applied to the surface of the platform which is in contact with the accelerometer.
The wax used in this project is petroleum wax which sticks the accelerometer onto the
platform firmly and securely but with the disadvantage of leaving a stain behind when
the accelerometer is dismounted from the platform. After mounting the accelerometer
to the platform, a data cable is used to connect each accelerometer to the data analyser
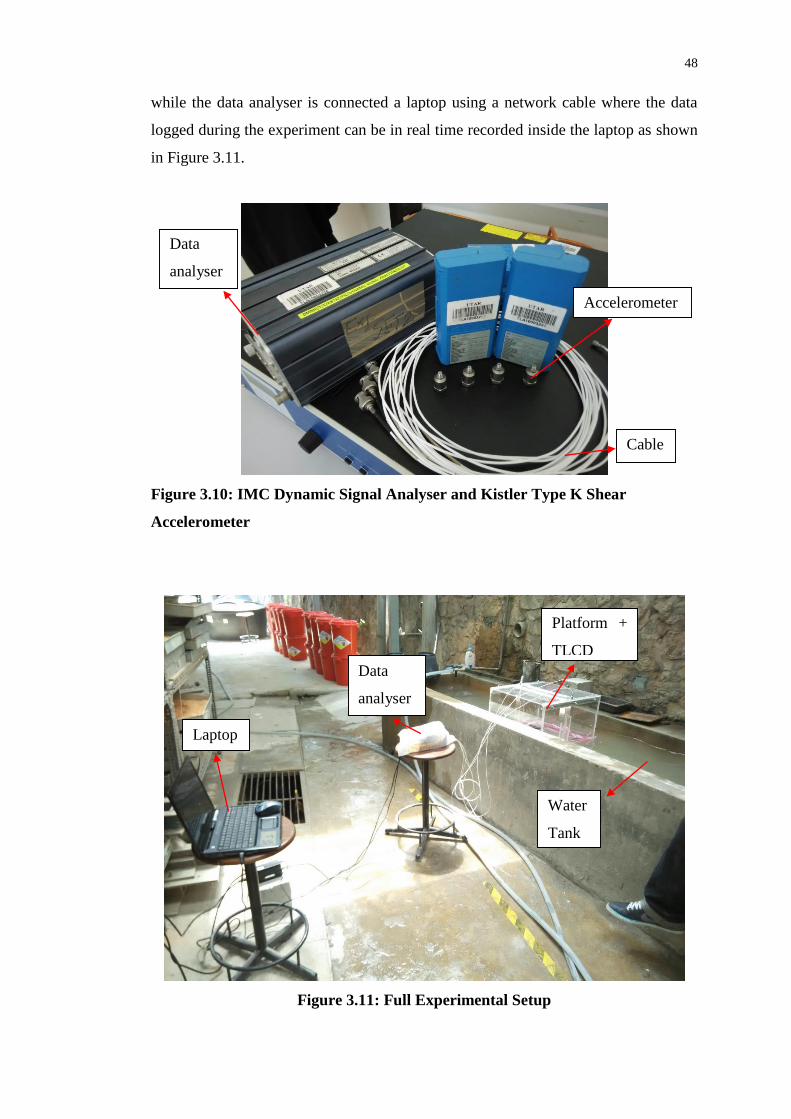
48
while the data analyser is connected a laptop using a network cable where the data
logged during the experiment can be in real time recorded inside the laptop as shown
in Figure 3.11.
Figure 3.10: IMC Dynamic Signal Analyser and Kistler Type K Shear
Accelerometer
Figure 3.11: Full Experimental Setup
Accelerometer
Cable
Data
analyser
Laptop
Data
analyser
Platform +
TLCD
Water
Tank

49
The 4 accelerometer which is mounted on the platform as shown in Figure 3.11 is
connected to the 4 channel of the data analyser in an orientation as shown in Figure
3.12. Channel 3 and Channel 4 is for the sole purpose of determining whether the wave
generated is one directional or not, hence only response of channel 1 and channel 2
will be analysed.
Figure 3.12: Accelerometer to Channel Orientation
On the other hand, the wave generation is done manually by hand, using a metal
plate to pushes the water front and back at a frequency of 1 Hz as shown in Figure 3.12
to produce a one directional wave.
Figure 3.13: Wave Generation Method
Channel 1
Channel 2
Channel 3
Channel 4

50
In order for the experiment to be carried out, the wave produced has to be in one
direction, hence the output of accelerometer of channel 3 and 4 is monitored in real
time to determine whether or not the wave is in one directional. If the output of
accelerometer of channel 3 and 4 is relatively high, it indicates that the waves in not
in one direction towards the other end. Thus once the output of accelerometer of
channel 3 and 4 is high, the experiment has to be redo again. In conventional method,
the wave generation should be done by a mechanism installed in a wave tank. However
due to the cost constraint, a wave tank is not used, instead a water tank with a manual
wave generation as illustrated in Figure 3.13 is used instead.
With all these, the experiment can be carried out by first measuring the height
of liquid displaced as well as the actual critical angle at which the platform will capsize
and record it down. After which, the wave generation is started at approximately
constant frequency of 1 Hz and constant amplitude in which later on the acceleration
data of the platform is recorded for 30 s for the orifice plate of 4 mm diameter, 6 mm
diameter, 8 mm diameter, and 10 mm diameter to test the effect of head loss coefficient.
Throughout this testing, the TLCD is filled with water to a level of 15 cm. For each of
the orifice plate, the experiment is carried out 5 times, in order to average out result.
For the testing of composite effect of mass ratio and tuning ratio, the TLCD
installed with orifice plate of 10 mm diameter is used. However the water level at
which TLCD is filled is changed to 5 cm and 10 cm respectively. At each water level,
the acceleration data is recorded for 30 s and the test is repeated 5 times to average the
result.

51
CHAPTER 4
4 RESULTS, CALCULATION AND DISCUSSION
4.1 Theoretical Buoyancy Calculation and Comparison to Experimental
Result
The buoyant force and metacentre is an important aspect in determining whether the
platform will float steadily or easily tilted over by waves. The load is 4 kg while the
mass of TLCD and platform is obtained from SolidWorks as shown in Figure 4.4 while
the buoyant force required is calculated by using equation 3.1. From there, the
minimum height of platform required is determined as shown below:
𝐹𝐵 = 𝑊𝑇𝐿𝐶𝐷+𝑃𝑙𝑎𝑡𝑓𝑜𝑟𝑚 + 𝐹𝐿𝑜𝑎𝑑
𝐹𝐵 = 62.14 N + 40 N
𝑉𝐷𝜌𝑔 = 102.14 N
𝐴𝐷ℎ𝐷𝜌𝑔 = 102.14 N
ℎ𝐷 = 102.14 N
(0.45 m × 0.5 m)(1000 kg/m3)(9.81 m/s2)
ℎ𝐷 = 0.04627 m
Where
AD = Cross sectional area of liquid displaced, m2
hD = Height of liquid displaced, m
This shows that the minimum requirement height of platform needed is 4.627
cm. In our platform the height is 31.4 cm as shown in Figure 4.1 which is more than
sufficient for it to afloat.

52
Figure 4.1: Platform’s Height
This is also proven by the actual testing of the platform that only approximately
5 cm of platform is submerged in the water as shown in Figure 4.2. The slight
difference from the calculated value might be due to the manufacturing error. In fact
the whole platform which is supposed to be 500 x 450 mm turns out to be 501 x 451
mm while the TLCD which supposed to be 440 mm turns out to be 412 mm. This slight
difference in manufacturing causes the increase in the total weight of the platform and
the TLCD, resulting in this slight deviation. Furthermore, the unit weight which is used
as load in the testing is not exactly 4 kg, it is slightly more than 4 kg, which indirectly
contributes to this error as well.
Figure 4.2: Height of Liquid Displaced
314 cm
~5 cm

53
In order to determine the actual buoyant force exerting on this platform, a
different definition of buoyant force is used, which is buoyant force is equal to the
weight of liquid displaced (in this case is water), mathematically it is expressed by
equation 2.1.
𝐹𝐵 = 𝜌𝑉𝐷𝑔
𝐹𝐵 = (1000 kg/m3) (0.45 m × 0.5 m × 0.05 m)(9.81 m/s2)
𝐹𝐵 = 110.3625 N
𝑃𝑒𝑟𝑐𝑒𝑛𝑡𝑎𝑔𝑒 𝑜𝑓 𝑑𝑒𝑣𝑖𝑎𝑡𝑖𝑜𝑛
=|𝐴𝑐𝑡𝑢𝑎𝑙 − 𝑇ℎ𝑒𝑜𝑟𝑒𝑡𝑖𝑐𝑎𝑙|
𝑇ℎ𝑒𝑜𝑟𝑒𝑡𝑖𝑐𝑎𝑙× 100 %
(4.1)
𝑃𝑒𝑟𝑐𝑒𝑛𝑡𝑎𝑔𝑒 𝑜𝑓 𝑑𝑒𝑣𝑖𝑎𝑡𝑖𝑜𝑛 =|110.3625 − 102.14|
102.14 × 100 %
𝑃𝑒𝑟𝑐𝑒𝑛𝑡𝑎𝑔𝑒 𝑜𝑓 𝑑𝑒𝑣𝑖𝑎𝑡𝑖𝑜𝑛 = 8.05 %
Where
Actual = Experimental result of a variable
Theoretical = Calculated result of a variable
The percentage of deviation of the actual buoyant force from the calculated
buoyant force is 8.05 % which is less than 10 %. This shows that the even with a poor
manufacturing skill, the actual buoyant force acting on the body would hardly deviates
from the theoretical value for more than 10 %. The reason being for this deviation is
the same as the reason being for the deviation in the height of liquid displaced as
discussed in the previous paragraph and hence will not be repeated.
4.2 Metacentric Height Calculation and Evaluation
The metacentric height is essential in determining the stability of the system. It is also
a preliminary study of the stability of an object which is floating. It is calculated by
using equation 2.2. However before using equation 2.2, basic parameter such as the
CG of the platform including the load has to be determined. By referring to Figure 4.4,

54
the CG is calculated. The CG of the platform without the weight is calculated by using
the software SolidWorks as shown in Figure 4.3.
Figure 4.3: CG Calculated From SolidWorks
Figure 4.4: AutoCAD Front View Drawing For Calculation
𝐶𝐺𝑛𝑒𝑤,𝑦 =
∑ 𝑚𝐶𝐺𝑦
𝑚 (4.2)
𝐶𝐺𝑛𝑒𝑤,𝑦 =( 6 kg × 161 mm) + 2 ( 2 kg × 10 mm)
6 kg + 2 × 2 kg
𝐶𝐺𝑛𝑒𝑤,𝑦 = 100.6 mm = 0.1006 m

55
Where
𝐶𝐺𝑛𝑒𝑤,𝑦 = CG of the platform and TLCD together with the weight, m
𝐶𝐺𝑦 = y coordinate of the CG of the object, m
𝑚 = Mass of the object, kg
Since the platform together with the weight is symmetric about the centre line, the x
coordinate of the new CG is the same as the x coordinate of the CG of the platform
and the weight as shown in Figure 4.4. Thus the new coordinates for the CG of the
whole platform together with weight and TLCD is (0.25 m, 0.1006 m).
The next basic parameter to be determined before the metacentric height can
be calculated is the volume of liquid displaced by using equation 2.1 while the centre
of buoyancy is calculated by dividing the height of liquid displaced by 2.
𝑉𝐷 =
𝐹𝐵 + 𝑊𝑇𝐿𝐶𝐷+𝑃𝑙𝑎𝑡𝑓𝑜𝑟𝑚
𝜌𝑔
𝑉𝐷 = 102.14 N
1000 kg/m3 × 9.81 m/s2
𝑉𝐷 = 0.01041 m3
𝐶𝐵 =
ℎ𝐷
2 (4.3)
𝐶𝐵 =0.04627 m
2
𝐶𝐵 = 0.023135 m
With all these value calculated, the metacentric height can be calculated by
using equation 2.2.
𝐺𝑀 = 𝐼0
𝑉𝐷− 𝐶𝐺 + 𝐶𝐵
𝐺𝑀 =
112 (0.45 m)(0.5 m)3
0.01041 m3− 0.1006 m + 0.023135 m
𝐺𝑀 = 0.3728 m

56
The value of metacentric height is positive indicating that the metacentre is
above the CG of the platform, hence the platform is in stable state. However, this
positive metacentric height is calculated at zero angle tilting state, hence it will only
guarantee the stability of the platform within the range of 0° to 15°. For safety reason,
the metacentric height should be recalculated again for tilting angle greater than 15°
to determine whether or not the platform will capsize.
4.2.1 Metacentric Height and Righting Arm at Different Tilting Angle
Since it is very tedious to determine the centre of buoyancy which keeps moving
around as the platform is tilting about the CG as shown in Figure 4.5. Thus, the centre
of buoyancy is located by utilizing graphical method as proposed in chapter 3
methodology. This graphical method is done with the aid of a software called
AutoCAD. By selecting the region at which the water is displaced, the AutoCAD
software can compute the centroid of the volume of water displaced. Since in this case
the centre of gravity coincide with the centroid due to same density and same width of
volume of water displaced, the centre of buoyancy is equivalent to the centroid.
Figure 4.5: Platform Tilted by 10° about CG

57
The degree to which the righting moment will tilt the platform back to the
original position is depending on the righting arm to which the centre of buoyancy and
the weight act as a couple force to rotate the platform back to the original position. The
righting arm of each tilting angle is obtained by graphical method as shown in Figure
4.6.
Figure 4.6: Righting Arm and Metacentric Height When Platform Tilted by 10°
about CG
All of the Metacentric Height and Righting Arm for different tilting angle at the
increment of 10° is tabulated in Table 4.1. The result of the graphical method for the
metacentric height and righting arm listed in Table 4.1 is attached in appendix A
Table 4.1: Metacentric Height and Righting Arm Distribution on Different
Tilting Angle
Angle Tilted (°) GM (m) Righting Arm (m)
0 0.0000 0.0000
10 0.3819 0.0673

58
20 0.2765 0.1006
30 0.1827 0.1055
40 0.1255 0.1053
50 0.0901 0.1074
60 0.0602 0.1042
70 0.0334 0.0917
80 0.0132 0.0751
90 0.0000 0.0564
100 -0.0065 0.0370
110 -0.0065 0.0180
120 -0.0004 0.0006
130 0.0111 -0.0132
140 0.0237 -0.0199
From the Table 4.1, a graph of metacentric height against angle tilted and a
graph of righting moment against the angle tilted are plotted to evaluate the stability
of the platform designed as well as to determine whether or not the platform will return
to its original position or is being capsized.
Figure 4.7: Graph of Metacentric Height against Angle Tilted
-0.0500
0.0000
0.0500
0.1000
0.1500
0.2000
0.2500
0.3000
0.3500
0.4000
0.4500
0 20 40 60 80 100 120 140 160
Metacentric Height against Angle Tilted

59
Figure 4.8: Graph of Righting Arm against Angle Tilted
From Figure 4.6, the righting arm is defined as positive when the resulting
righting moment (the couple moment produced by𝐹𝐵 and total weight of the platform
acting about the righting arm). Thus, when the righting arm is negative value, it shows
that the platform is capsize in which in this case is at clockwise 120° tilting by referring
to Figure 4.7. In addition, Figure 4.7 also provides a mean to measure how fast the
platform will return to its original position. If the value of righting arm is large, it
means that the righting moment acting on the platform to return it to the original
position is large.
For Figure 4.7, it shows the stability of the platform by means that if the
platform would be left at that position would it be still stable. It is noticed from Figure
4.7 that at about clockwise 100° of tilting, the metacentric height becomes negative.
This shows that at this stage, even if the platform is to left undisturbed at this stage, it
will also oscillate indefinitely. From a second point of view is that, the righting
moment has dropped to critical value in which it no longer can maintain the platform
stability, but the platform is yet to be capsized.
From these theoretical value, it shows that the platform is well designed as it is
able to withstand a tilting of 120° before being capsize. However, in actual case, the
platform started to capsize at approximately 110° due to the fact that the top lid of the
-0.0400
-0.0200
0.0000
0.0200
0.0400
0.0600
0.0800
0.1000
0.1200
0 20 40 60 80 100 120 140 160
Righting Arm against Angle Tilted

60
platform is not water proof, hence the water starts to sips in when the platform is tilted
to 90° clockwise. The water enters the platform at a slow rate, which is why the
platform capsize first before sinking.
The percentage of deviation of the critical angle is calculated by using equation
4.1.
𝑃𝑒𝑟𝑐𝑒𝑛𝑡𝑎𝑔𝑒 𝑜𝑓 𝑑𝑒𝑣𝑖𝑎𝑡𝑖𝑜𝑛 =|𝐴𝑐𝑡𝑢𝑎𝑙 − 𝑇ℎ𝑒𝑜𝑟𝑒𝑡𝑖𝑐𝑎𝑙|
𝑇ℎ𝑒𝑜𝑟𝑒𝑡𝑖𝑐𝑎𝑙× 100 %
𝑃𝑒𝑟𝑐𝑒𝑛𝑡𝑎𝑔𝑒 𝑜𝑓 𝑑𝑒𝑣𝑖𝑎𝑡𝑖𝑜𝑛 =|110° − 120°|
120°× 100 %
𝑃𝑒𝑟𝑐𝑒𝑛𝑡𝑎𝑔𝑒 𝑜𝑓 𝑑𝑒𝑣𝑖𝑎𝑡𝑖𝑜𝑛 = 8.33 %
There is a total of 8.33% of deviation in the actual critical angle and the calculated
critical angle. This deviation is mainly due to the inadequate manufacturing skills. The
platform designed was meant to be water proof at the top lid as well, but it ended up
that there is a small gap whereby the water can sips in. This can be overcome by
applying gasket maker on the surface where the top lid is contact with the body of the
platform. Apart from that, the slight deviation in the geometry of the manufactured
platform also contributes to this error. If there is an error in the geometry of the
platform, the CG of the platform will deviates from the calculated value. This deviation
will have a huge impact on the critical angle calculated due to the fact that the tilting
angle is done by rotating the platform about the CG.
4.3 Effect of Head Loss Coefficient
The head loss coefficient is the key parameter in the TLCD design. Thus it is essential
to determine the whether the general effect of head loss coefficient is the same as it is
applied on building to counter translational vibration.
The effect of head loss coefficient is tested by using orifice plate of different
diameter. Hence, the first step would be to obtain the head loss coefficient of each of

61
the orifice plate by using equation 2.3. In order to use equation 2.3, the diameter of
each orifice plate has to be converted into blocking ratio which is the ratio of the cross-
sectional area flow being blocked to the total cross-sectional area of flow by using
equation 4.4.
For 4 mm diameter orifice plate:
𝜓 =𝐴𝐷 −
𝜋4 𝐷2
𝐴𝐷 (4.4)
𝜓 =(0.036 m × 0.036 m) −
𝜋4 (
41000)2
(0.036 m × 0.036 m)
𝜓 = 0.9903
Where
𝐴𝐷 = Cross-sectional area of liquid displaced, m2
𝐷 = Diameter of orifice plate, m
𝜂 = (−0.6𝜓 + 2.1𝜓0.1)1.6 × (1 – 𝜓)−2
𝜂 = (−0.6 × 0.9903 + 2.1 × 0.99030.1)1.6 × (1 – 0.9903)−2
𝜂 = 20430.6
The blocking ratio and head loss coefficient for different diameter of orifice
plate is calculated in the same manner as for 4 mm diameter orifice plate by using a
software call Excel. The result is then tabulated in Table 4.2.
Table 4.2: Blocking Ratio and Head Loss Coefficient for Different Diameter
Orifice Plate
Diameter of Orifice Plate (mm) Blocking Ratio, 𝜓 Head Loss Coefficient, 𝜂
4 0.990304 20430.63
6 0.978183 4055.84
8 0.961215 1292.18
10 0.939398 533.92

62
The response from the accelerometer is in acceleration, it has to be converted
into displacement by integrating twice the acceleration response. The first integration
converts the acceleration response into velocity response while the second integration
converts the velocity response into displacement response. However, the
accelerometer used is very sensitive to noise which is the same as other conventional
accelerometer due to the effect of the gravitational acceleration acting on the
accelerometer as well as the low frequency direct current content of the sensor. Hence,
a high pass filter is needed to filter off these noises to obtain the correct displacement
response.
By using the software call IMC FAMOS, a Butterworth High Pass filter is used
to filter the acceleration response at the second order and cut off frequency of 1 Hz.
The Butterworth High Pass filter is set to a cut off frequency of 1 Hz due to the fact
that the response which we wanted is the wave generated at a constant frequency of 1
Hz while the noise which is unwanted is of low frequency that are less than 1 Hz.
The acceleration response of the platform with the use of 4 mm diameter orifice plate
is as shown in Figure 4.9. Each colour in Figure 4.9 represents a channel that is stated
in Figure 3.12, and all the peak value of each channel is labelled.
Figure 4.9: Filtered Acceleration Response for 4 mm Diameter Orifice Plate

63
In most cases, the acceleration response is hard to analyse and hence it is
integrated twice into displacement response as shown in Figure 4.10.
Figure 4.10: Displacement Response for 4 mm Diameter Orifice Plate
It is notice that the displacement of channel 1 and channel 2 is out of phase by
one cycle which is when channel 1 is positively peaked, channel 2 is negatively peak
which is the same pattern of displacement response when the TLCD isn’t installed in
the platform. From this inference, the vibration motion of the platform is the same as
the sine wave generated as shown in Figure 4.11.
Figure 4.11: Vibration Motion of the Platform Using 4 mm Diameter Orifice

64
However, this vibration motion changes when the orifice plate of 6 mm and 8
mm diameter is used. This shows that the fundamental mode of vibration is altered.
Since the general vibration motion of 6 mm and 8 mm diameter orifice plate is the
same, only 8 mm diameter orifice plate response is shown. All the response that isn’t
shown in this chapter will be attached in the appendix as a reference.
Figure 4.12: Displacement Response for 8 mm Diameter Orifice Plate
This pattern of displacement response as shown in Figure 4.12 essentially
means that the vibration motion is in up and down motion as shown in Figure 4.13.
Figure 4.13: Vibration Motion of the Platform Using 8 mm Diameter Orifice

65
For 10 mm diameter orifice plate, the pattern of the vibration motion is the
same as that of 4 mm diameter orifice plate. This shows that the fundamental mode of
vibration has returned back to the wave generated mode, indicating the in effectiveness
in reducing vibration of this frequency. The maximum absolute displacement of
channel 1 and channel 2 for each orifice diameter is tabulated in Table 4.3.
Table 4.3: Maximum Absolute Displacement Amplitude of Channel 1 and
Channel 2 for Each Orifice Plate Diameter
TLCD Configuration Channel 1 (mm) Channel 2 (mm)
Without TLCD 23.550 23.589
TLCD with 4 mm Orifice Plate 21.651 19.527
TLCD with 6 mm Orifice Plate 17.172 21.216
TLCD with 8 mm Orifice Plate 16.610 16.075
TLCD with 10 mm Orifice Plate 17.841 18.952
However, the maximum absolute displacement amplitude hardly describe the
behaviour of the vibration motion as it may be peak at this value once a while only or
could be frequently peak at this value. Hence, in order to determine the performance
of each of the TLCD configuration towards the wave generated, a power spectrum
analysis is need. The power spectrum analysis is done individually for channel 1 as
shown in Figure 4.14 and then for channel 2 as shown in Figure 4.15. From the Power
Spectrum analysis, it is shown that the fundamental mode of vibration without the
TLCD installed is near 1Hz as predicted. The power spectrum also proves that the use
of 4 mm and 10 mm diameter orifice plate results in the same fundamental mode of
vibration as inferred from the displacement response graph.
For 6 mm and 8 mm diameter orifice plate, it successful in supressing the
fundamental mode of vibration but at the cost of amplifying the vibration at 1.3 Hz
and 0.7 Hz, creating harmonics of 2 mode. If the vibration at this two harmonics is
small, it would seems as a good way to mitigate the vibration of 1 Hz.

66
Figure 4.14: Power Spectrum Analysis for Channel 1 of Different Configuration
Figure 4.15: Power Spectrum Analysis for Channel 2 of Different Configuration
67
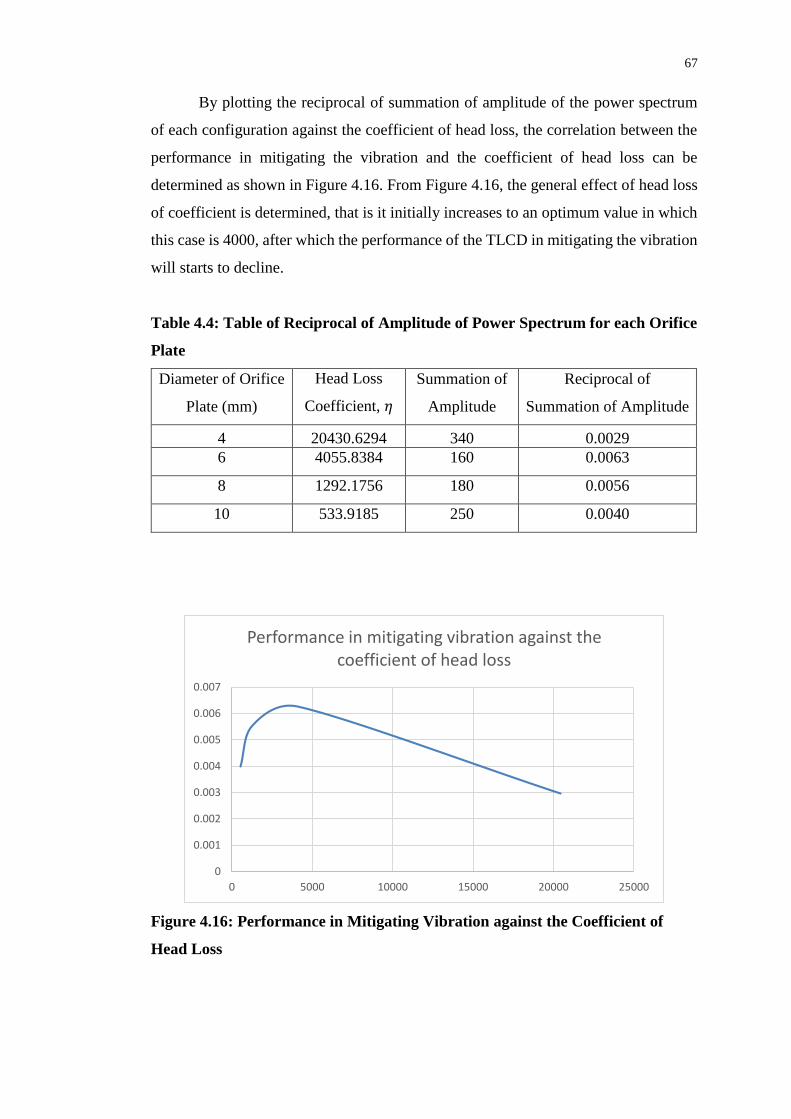
By plotting the reciprocal of summation of amplitude of the power spectrum
of each configuration against the coefficient of head loss, the correlation between the
performance in mitigating the vibration and the coefficient of head loss can be
determined as shown in Figure 4.16. From Figure 4.16, the general effect of head loss
of coefficient is determined, that is it initially increases to an optimum value in which
this case is 4000, after which the performance of the TLCD in mitigating the vibration
will starts to decline.
Table 4.4: Table of Reciprocal of Amplitude of Power Spectrum for each Orifice
Plate
Diameter of Orifice
Plate (mm)
Head Loss
Coefficient, 𝜂
Summation of
Amplitude
Reciprocal of
Summation of Amplitude
4 20430.6294 340 0.0029
6 4055.8384 160 0.0063
8 1292.1756 180 0.0056
10 533.9185 250 0.0040
Figure 4.16: Performance in Mitigating Vibration against the Coefficient of
Head Loss
0
0.001
0.002
0.003
0.004
0.005
0.006
0.007
0 5000 10000 15000 20000 25000
Performance in mitigating vibration against the coefficient of head loss

68
4.4 Composite Effect of Mass Ratio and Tuning Ratio
The composite effect of mass ratio and tuning ratio is tested by reducing the water
level of TLCD from 15 cm to 10 cm then to 5 cm. When it is lowered down, the mass
ratio decreases but the tuning ratio increases. The mass ratio and tuning ratio is
computed using the equation 4.5 and 2.6
𝜇 =𝑚𝑇𝐿𝐶𝐷
𝑊𝑇𝐿𝐶𝐷+𝑃𝑙𝑎𝑡𝑓𝑜𝑟𝑚/9.81 (4.5)
Where
𝑚𝑇𝐿𝐶𝐷 = Mass of total liquid in the TLCD, kg
For 15 cm height water level, effective height is only 13 cm as the calculation is
performed based on the centre line, hence need to subtract off the 2 cm from the 15
cm. From equation 4.5, the mass ratio for 15 cm water level is computer.
𝜇 =(0.036 m × 0.036 m) × 1000 kg/m3 × (0.4 m + 2 × 0.13 m)
(102.14
9.81 ) kg
𝜇 = 0.082
By equation 2.6,
𝜔𝐷 = √2𝑔
𝐿
𝜔𝐷 = √2 × 9.81
0.4 + 2 × 0.13
𝜔𝐷 = 5.45 rad/s
The tuning ratio is defined as the ratio of natural frequency of the TLCD to the natural
frequency of the structure to prevent the earthquake from resonating with the structure.
For wave vibration mitigation, it would be ratio of natural frequency of the TLCD the
frequency of the wave generated. In our case is 1 Hz. Thus the tuning ratio for 15 cm

69
water level is calculated by using this new definition, mathematically expressed as
equation 4.6.
𝛽 =𝜔𝐷
𝜔𝑤 (4.6)
Where
𝜔𝑤 = Frequency of wave generated, rad/s
The frequency of wave generated is in Hz, however to utilize equation 4.6, it
is needed to be converted into rad/s by multiplying with 2π as 1 Hz is equivalent to 2π
rad/s. By using equation 4.6, the tuning ratio is calculated.
𝛽 =𝜔𝐷
𝜔𝑤
𝛽 =5.45
2𝜋 × 1
𝛽 = 0.8678
The tuning ratio and mass ratio for different water level is calculated and
tabulated in Table 4.3.
Table 4.5: Mass Ratio and Tuning Ratio for Different Water Level
Water Level (cm) Mass Ratio, 𝜇 Tuning Ratio, 𝛽
5 0.0573 1.0394
10 0.0697 0.9421
15 0.0822 0.8678
A higher mass ratio generally serves a better purpose in mitigating the vibration
but a tuning ratio closer to 1 is better at suppressing the vibration. Hence in this study,
which ratio has a more dominant effect will be determined, as the water level increases,
one ratio will increase (mass ratio), the other ratio will decrease(tuning ratio) which
allows us to compare the effect of the two ratio.

70
The power spectrum analysis of each of the water level for channel 1 is shown
in Figure 4.17 while for channel 2 is shown in Figure 4.18. From Figure 4.17, it is
shown that the effect of mass ratio is more dominant than that of tuning ratio. This can
be seen that as the tuning ratio is closer to 1 that is for water level of 5 cm the amplitude
of the response in power spectrum is much higher than that of 15 cm water level due
to the fact that the mass ratio of the TLCD configuration with water level of 5 cm is
too low.
On the other hand, for TLCD configuration of 10 cm water level, the tuning
ratio of it is very close to that of 15 cm water level. Hence, the response still falls on
the same frequency unlike water level 5 cm which shifted the fundamental mode of
vibration to somewhere nearer to 1 Hz. However, the drop in mass ratio for TLCD
configuration of 10 cm water level has causes the amplitude of the response to rises
sharply to 0.29597 unlike the 15 cm water level which has only 0.25463. This double
confirm that the effect of mass ratio is more dominant over tuning ratio
Figure 4.17: Power Spectrum for Different Water Level at Channel 1

71
The same pattern could be observed from power spectrum of channel 2 as well,
with the exception that the amplitude of 5 cm water level is a little bit lower than that
of 15 cm water level. This might be due to the misdistribution of weight and the
positioning of channel 2 which might be slightly run off from the centre. At any rate,
by averaging the amplitude response of channel 1 and channel 2, the amplitude of 5
cm water level is clearly higher than that of 15 cm water level.
Figure 4.18: Power Spectrum for Different Water Level at Channel 2
4.5 Hydrostatic Force Simulation Result and Specification of Platform
In the early design, a hydrostatic force simulation is done on the platform to ensure
that the platform is able to withstand the hydrostatic force from the surrounding
without collapsing.

72
4.5.1 Technical Drawing of Platform and TLCD
Before performing the simulation, the platform and the TLCD has to be modelled out
using SolidWorks. Figure 4.19 shows the modelled platform with the TLCD installed,
while Figure 4.20 technical drawing with specification of the Platform with TLCD
installed
Figure 4.19: Modelled Platform with TLCD installed
Figure 4.20: Technical Drawing of Platform

73
4.5.2 Simulation Result
The stress simulation shows that under 4 kg load and hydrostatic pressure from the
water is not a problem to the platform designed. On the other hand, the displacement
simulation shows that only the middle of the perspex sheet will experience bulking out
by the most 0.0155 mm which is negligible in this case. This simulation double
ascertain the rigidity of platform designed against the load that is going to be applied
on it.
Figure 4.21: Stress Analysis by Simulation
Figure 4.22: Displacement Analysis by Simulation

74
CHAPTER 5
5 CONCLUSION AND RECOMMENDATIONS
5.1 Problem Encountered and Future Recommendations
There are lots of problem encountered during the manufacturing stage. First of all, in
order to join up two pieces of perspex nicely and water proof, the surface of contact
between the two pieces of perspex must be extremely smooth. This is why the platform
manufactured in the early stage is not water proof, the water keeps sipping into the
platform via tiny leakage. This can be overcome by using milling machine as shown
in Figure 3.8 to perform an additional steps of surface finishing on the surface of
contact between the two pieces of perspex.
The next major problem encountered is that, the solvent which is the
chloroform used to join up two pieces of perspex vaporizes too quickly. After applying
on one of the surfaces, it has to be joined onto the other perspex within several seconds,
or else the chloroform will vaporizes into air. If one inhale too much these chloroform
vapour, he or she may get dizzy and eventually fainted. Thus, the process of joining
together the perspex sheet into a platform has to be carried out in a room where there
is sufficient air flow to blow away the chloroform vapour.
The recommendation for this problem is to have a few person to help apply the
chloroform onto the surface of contact, while the other person quickly join up the two
perspex sheet to prevent the chloroform from vaporizing. There is also another solution
to this problem which is premixing the chloroform solution with perspex chips. This
helps prolonged the duration at which the chloroform vaporises at the cost of
75
sacrificing the power of chloroform to dissolve the perspex surface that is wanted to
be joined to another perspex sheet. Thus, a reasonable ratio between the chloroform
and perspex chips is needed. From the author’s experience, a ratio of 1.5 portion of
chloroform to 1 portion of perspex chips works the best.
Even if steps is taken during the manufacturing stage to ensure the platform to
be water proof, it would seems that the platform is still vulnerable to water sipping in
especially for the case of TLCD. This is due to the presence of air bubble which traps
in between the surface of contact between two pieces of perspex sheet. In order to
completely water proof the whole thing, it is recommended to use silicon glue to seal
off all the contact surfaces. In this project, a cheap silicon glue is used due to low in
fund, it is recommended to use a better quality silicon glue to seal off the gap as the
harden silicon glue used in this project becomes soft after long time exposure to water.
During the testing of TLCD, a manually produced waves has proposed a big
problem to the experiment. This is because it is hard to produce a constant amplitude
wave manually by human hands, and this may causes a deviation in the resulting
acceleration amplitude collected by the accelerometer. It is recommended that a
mechanism to actuate a constant amplitude and constant frequency wave to be
manufactured for this testing purpose. In addition, during the actuation of wave by
human hands, it is observed that it needs a high amount of torque to start off the wave,
hence a conventional small motor might not fit this purpose. Even pneumatic system
is not recommended to be used as actuator may ended up bending as it is used over a
period of time. The highly recommended system to actuate the wave would be
hydraulic system. If a motor is to be used, a high torque gear box would be needed
and this high torque gear box is often very expensive, not inclusive of the price of
medium duty motor yet.
5.2 Conclusion
For the first objective, it can be concluded that the buoyant force that the platform is
experiencing is 102.14 N. This because the percentage of deviation is only 8.05 %.

76
This shows the calculation approach is sufficiently close enough to the actual value in
a sense that we can assumed it to be the same. For the metacentric height calculation
method shown in chapter 4, it helps to analyse the stability of a floating object but
further detail analysis is needed which is the righting arm analysis if floating object
designed is to be tilted for more than 15°.
By calculating the righting arm through the method shown in chapter 4.2.1, the
graph of righting arm against angle tilted can be plotted. The angle at which is the
righting arm becomes negative indicates that the floating object will capsize. The
calculation shows that the platform should capsize when the angle tilted exceeds 120°
but in actual the platform starts to capsize at approximately 110° resulting in a
deviation of 8.33 % from the actual value. This is due to the poor water proof of the
top lid of the platform. If the platform is water proof as planned, the angle at which it
capsize should be way closer to 120°. Thus it is convincing enough to take the
calculated critical angle of tilting as the actual value for future design of floating object.
On the other hand, the second objective which is the general effect of
coefficient of head loss on the performance of TLCD installed on the platform is
determined as when it is too low, the TLCD will have a low performance , however
when it is too high the TLCD is merely a tank of water doing nothing. There is an
optimum value for the coefficient of head loss, and in this case it is around 4000.
For the third objective, it is found out that the effect of mass ratio will be more
dominant over the effect of tuning ratio. Hence when the design is under constraint,
one should sacrifice the tuning ratio to preserve the mass ratio.
77
REFERENCES
Donald, F.E., Barbara, C.W., Clayton, T.C., John, A.R., 2012. Engineering Fluid
Mechanics. 10th edition. United States: John Wiley & Sons, Inc.
Lee, H.H., Wong, S.H. and Lee, R.S., 2005. Response Mitigation on the Offshore
Floating Platform System With Tuned Liquid Column Damper. Ocean Engineering,
33(8-9), pp. 1118-1142.
Matteo, A.D., Iacono, F.L., Navarra, G., Pirrotta, A., 2014. Direct Evaluation of the
Equivalent Linear Damping for the TLCD systems in Random Vibration for Pre-
design Purposes. International Journal of Non-Linear Mechanic, 63, pp. 19-30.
Min, K.W., Kim, H.S., Lee, S.H., Kim, H.J., Ahn, S.K., 2005. Performance Evaluation
of Tuned Liquid Column Dampers For Response Control of a 76-story Benchmark
Building. Engineering Structures, 27(7), pp. 1101-1112.
Sakai, F., Takeda, S., Tamaki, T., 1989. Tuned Liquid Column Damper – New Type
Device For Suppression of Building Vibrations. In: Proceedings of the International
Conference on Highrise Buildings. Nanjing, China, 25-27th March 1989
Shum, K.M., 2009. Closed Form Optimal Solution of a Tuned Liquid Column Damper
for Suppressing Harmonic Vibration of Structures. Engineering Structures, 31, pp.
84-92.
Subrata, K., 2005. Handbook of Offshore Engineering. Plainfield, USA: Elsevier
Tanmoy, C., Subrata, C., 2014. Vibration Mitigation of Structures Subjected to
Random Wave Forces By Liquid Column Dampers. Ocean Engineering, 87, pp.
151-161.
Venkateswara, R.K., 2013. Experimental and Numerical Studies On Tuned Liquid
Damper. Master. National Institute of Technology Rourkela.
Wu, J.C., Chang, C.H., Lin, Y.Y., 2009. Optimal Designs For Non-uniform Tuned
Liquid Column Dampers In Horizontal Motion. Journal of Sound and Vibration,
326, pp. 104-102.

78
Wu, J.C., Shih, M.H. and Lin, Y.Y., 2005. Design Guidelines for Tuned Liquid
Column Damper for Structures Responding to Wind. Engineering Structures,
27(13), pp. 1893-1905.

79
APPENDICES
APPENDIX A: Result for Graphical Method of GM and RA for Different Tilting
Angle at an increment of 10°
Figure A-1: GM and RA for 10° of Tilting

80
Figure A-2: GM and RA for 20° of Tilting
Figure A-3: GM and RA for 30° of Tilting

81
Figure A-4: GM and RA for 40° of Tilting
Figure A-5: GM and RA for 50° of Tilting

82
Figure A-6: GM and RA for 60° of Tilting
Figure A-7: GM and RA for 70° of Tilting

83
Figure A-8: GM and RA for 80° of Tilting
Figure A-9: GM and RA for 90° of Tilting

84
Figure A-10: GM and RA for 100° of Tilting
Figure A-11: GM and RA for 110° of Tilting

85
Figure A-12: GM and RA for 120° of Tilting
Figure A-13: GM and RA for 130° of Tilting

86
Figure A-14: GM and RA for 140° of Tilting

87
APPENDIX B: Accelerometer Response for Different Orifice Plate Diameter at
Water Level of 15 cm
*The 1, 2, 3 and 4 numbering at the back of the signal represents the number of the
channel. That is Filtered Acceleration_1 represents Filtered Acceleration of Channel 1
and so forth.
Figure A-15: Filtered Acceleration Response for 4 mm Diameter Orifice Plate
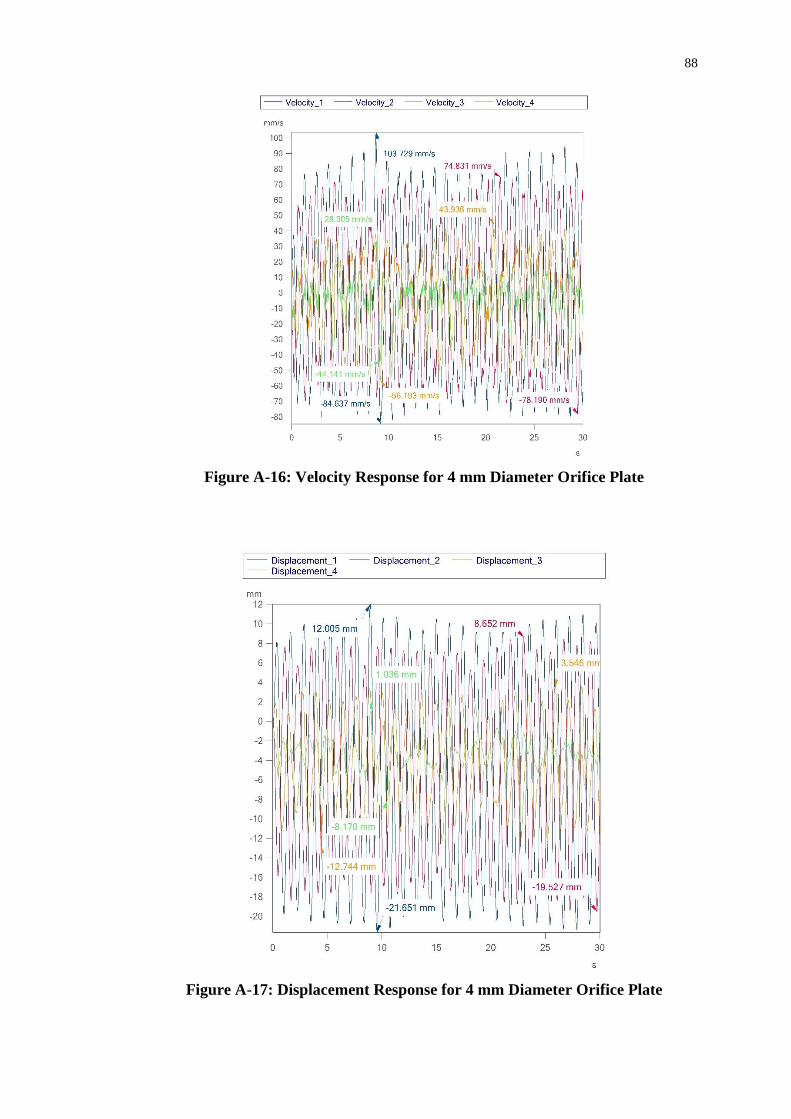
88
Figure A-16: Velocity Response for 4 mm Diameter Orifice Plate
Figure A-17: Displacement Response for 4 mm Diameter Orifice Plate

89
Figure A-18: Filtered Acceleration Response for 6 mm Diameter Orifice Plate
Figure A-19: Velocity Response for 6 mm Diameter Orifice Plate

90
Figure A-20: Displacement Response for 6 mm Diameter Orifice Plate
Figure A-21: Filtered Acceleration Response for 8 mm Diameter Orifice Plate

91
Figure A-22: Velocity Response for 8 mm Diameter Orifice Plate
Figure A-23: Displacement Response for 8 mm Diameter Orifice Plate

92
Figure A-24: Filtered Acceleration Response for 10 mm Diameter Orifice Plate
Figure A-25: Velocity Response for 10 mm Diameter Orifice Plate

93
Figure A-26: Displacement Response for 10 mm Diameter Orifice Plate

94
APPENDIX C: Accelerometer Response for 10 cm Orifice Plate Diameter at
Different Water Level
Figure A-27: Filtered Acceleration Response for Water Level of 5 cm
Figure A-28: Velocity Response for Water Level of 5 cm

95
Figure A-29: Displacement Response for Water Level of 5 cm
Figure A-30: Filtered Acceleration Response for Water Level of 10 cm

96
Figure A-31: Velocity Response for Water Level of 10 cm
Figure A-32: Displacement Response for Water Level of 10 cm

97
APPENDIX D: Accelerometer Response for Platform without TLCD
Figure A-33: Filtered Acceleration Response for Platform without TLCD
Figure A-34: Velocity Response for Platform without TLCD

98
Figure A-35: Displacement Response for Platform without TLCD
![Energies 2012 energies - Semantic ScholarHederson [1] proposed a new five wind turbine semi-submersible floating platform system, and the performance of the new floating system was](https://static.fdocuments.net/doc/165x107/5e87c27856e1252db7524a36/energies-2012-energies-semantic-scholar-hederson-1-proposed-a-new-five-wind.jpg)