Development of resistance type moisture measuring device...
14
Leonardo Electronic Journal of Practices and Technologies ISSN 1583-1078 Issue 30, January-June 2017 p. 255-268 255 http://lejpt.academicdirect.org Engineering, Environment Development of resistance type moisture measuring device for grains Sadiq Sius LAWAL, Katsina Christopher BALA * , Michael Bolaji ADEYEMI Mechanical Engineering Department, Federal University of Technology, P.M.B. 65, Minna, Niger State, Nigeria E-mail(s): [email protected]; [email protected]; [email protected] * Corresponding author, phone: +2348035980302 Received: November 19, 2016 / Accepted: June 14, 2017 / Published: June 30, 2017 Abstract The paper presents a study aimed at developing an indigenous moisture measuring device from locally available materials for grains based on the principle of resistance change of the material with corresponding change in moisture during drying. The developed device has four copper electrode cups positions in which both gauging and dummy copper electrode cups were placed to form Wheatstone bridge circuits of full, half and quarter for four, two and one gauging copper electrode cups respectively, while the remaining positions were used as dummies. These circuits were used to measure the resistances and hence obtaining the moisture content of the grains used. Grains of paddy rice, guinea corn and millet were used to test the device and it was observed that for full bridge circuits of each of the grains, paddy rice have a negative coefficient of correlation of -0.95, -0.99 for guinea corn and -0.99 for millet. The results obtained from predictive empirical equations when compared with the direct oven method, showed that the device can be used to predict or measure moisture content once calibrated. Keywords Grains; Moisture; Resistance; Drying; Bridge circuits; Paddy rice; Guinea corn; Millet
-
Upload
duongthuan -
Category
Documents
-
view
223 -
download
0
Transcript of Development of resistance type moisture measuring device...

Leonardo Electronic Journal of Practices and Technologies
ISSN 1583-1078
Issue 30, January-June 2017
p. 255-268
255
http://lejpt.academicdirect.org
Engineering, Environment
Development of resistance type moisture measuring device for grains
Sadiq Sius LAWAL, Katsina Christopher BALA*, Michael Bolaji ADEYEMI
Mechanical Engineering Department, Federal University of Technology, P.M.B. 65, Minna,
Niger State, Nigeria
E-mail(s): [email protected]; [email protected];
[email protected] * Corresponding author, phone: +2348035980302
Received: November 19, 2016 / Accepted: June 14, 2017 / Published: June 30, 2017
Abstract
The paper presents a study aimed at developing an indigenous moisture measuring
device from locally available materials for grains based on the principle of resistance
change of the material with corresponding change in moisture during drying. The
developed device has four copper electrode cups positions in which both gauging and
dummy copper electrode cups were placed to form Wheatstone bridge circuits of full,
half and quarter for four, two and one gauging copper electrode cups respectively,
while the remaining positions were used as dummies. These circuits were used to
measure the resistances and hence obtaining the moisture content of the grains used.
Grains of paddy rice, guinea corn and millet were used to test the device and it was
observed that for full bridge circuits of each of the grains, paddy rice have a negative
coefficient of correlation of -0.95, -0.99 for guinea corn and -0.99 for millet. The
results obtained from predictive empirical equations when compared with the direct
oven method, showed that the device can be used to predict or measure moisture
content once calibrated.
Keywords
Grains; Moisture; Resistance; Drying; Bridge circuits; Paddy rice; Guinea corn; Millet

Development of resistance type moisture measuring device for grains
Sadiq Sius LAWAL, Katsina Christopher BALA, Michael Bolaji ADEYEMI
256
Introduction
One of the most important factors in quality control of grains especially in controlling
fungus infestations and for processing high quality grains is the moisture content of such
grains [1]. For example, to produce high quality rice with very low breakages from parboiled
paddy rice, the moisture content [2] of about 14% is considered a maximum limit. Beyond
this percentage moisture content, paddy rice can result into quality deterioration and
quantitative losses as a result of fungal, bacterial, insect and mite infestation [3,4]. Drying is
one of the essential steps required in the post-harvest technology of grains such as rice, millet,
maize and guinea corn. Drying processes can be achieved by sun or air drying [5], mechanical
drying as well as oven drying [6]. During drying process, the moisture content of the grain is
monitored using suitable moisture meter so as to achieve the correct percentage moisture
content for processing and storage of such grains. Drying to appropriate percentage moisture
content is one of the key indices of grain storage [7] and can result to retarding the
development of mites and insects, elimination of bacteria and fungi growth, thereby
enhancing maximum quality of the grain. Over drying may also cause deterioration of product
in quality and quantity during production and storage stages of the grains.
Determination of grain moisture content can also be achieved through the use of
electric moisture meters whose operations are based on the fundamental relationship between
moisture content and a different electric property. These electrical methods include:
conductance method (resistance-type), power-loss method, capacitance method, microwave
method, and neutron method [7]. The conductance method [8,9] uses the relationship between
moisture content and direct current conductance, the Power-loss method [10] uses the
relationship between moisture content and the dielectric loss factor of the materials, while the
capacitance method [11] utilizes the relationship between moisture content and the dielectric
constant of the materials. The microwave method and neutron method have many advantages,
such as high accuracy, fast speed, noncontact, non-invasive, and non-destructive measurement
of the grain internal moisture. But the measurement devices are complex and expensive [12]
as well as not able to measure readings below 7% moisture [13] as a result of very little
change in the electrical conductivity.
In this research work, a resistance type moisture measuring device, based on the
change of resistance with moisture loss of grain is developed and used to measure the
percentage moisture content of grains such as paddy rice, guinea corn and millet. The effects

Leonardo Electronic Journal of Practices and Technologies
ISSN 1583-1078
Issue 30, January-June 2017
p. 255-268
257
of Wheatstone bridge circuits’ connection as full bridge, half bridge and quarter bridge on the
measured resistances, and hence on the percentage moisture content of grains were
investigated. Empirical equations relating the percentage moisture content to the measured
resistance for each tested grain and the three bridge circuits employed were determined.
Material and method
The experimental moisture measuring device used for measuring the moisture content
of grains was similar to that constructed by Ogunleye [9]. The moisture measuring device was
made of identical copper cup electrodes of equal dimensions and resistances, top and bottom
steel plates, mild steel cylinder. A plunger made of solid Teflon was screwed to the top plate
and the base plate. Four holes were drilled where the copper electrode cups were placed as
shown in Figure 1(a). Connecting copper wires of equal lengths were used to connect the
moisture device to a digital meter so as to eliminate the introduction of any additional
resistance due to copper wires. The experimental setup is shown in Figure 1(b).
(a)
(b)
Figure 1. (a) Exploded view of the resistance type moisture measuring device
(b) Experimental setup
The experimental procedure included:
- Placing of samples of the paddy rice of known masses on twenty identical containers
of known masses.
- Placing of samples of the paddy rice in these containers inside a hot air oven set to a
temperature of 1300C to dry for ten minutes.
Development of resistance type moisture measuring device for grains
Sadiq Sius LAWAL, Katsina Christopher BALA, Michael Bolaji ADEYEMI
258
- Measurement of the masses of the grain samples using a digital balance of maximum
capacity 310 gm and sensitivity of 0.001 gm to determine the loss of moisture in the grain.
- Determining of percentage moisture content of the paddy rice as the ratio of the loss
of moisture to the dry mass of the grain sample on dry basis as prescribed by [14].
- Samples of the paddy rice of known percentage moisture content were placed inside
a mild steel cylinder positioned on the bottom plate cover with the copper electrode cups
arranged as full, half and quarter Wheatstone bridge connections as shown in Figure 2.
(a) full bridge
(b) half bridge
(c) quarter bridge
Figure 2. Wheatstone bridge arrangements of copper cup electrodes
- The top of the cylindrical container was covered with a top cover plate to which a
Teflon plunger was attached and bolted to the bottom plate cover with bolt and nut
arrangement to ensure constant pressure application on the paddy rice during resistance
measurements.
- A high impedance electronic ohmmeter was used to measure the resistances of the
paddy rice corresponding to the percentages moisture content of the grain obtained by the
oven-drying method. The measured resistances for full bridge, half bridge and quarter bridge.
Wheatstone bridge circuit was recorded for oven drying of the paddy rice at an interval of ten
(10) minutes.
- The above procedures were repeated for other samples of paddy rice and for millet
and guinea corn grains samples at varying oven drying time, until dry mass of each grain
sample was achieved (i.e. no mass change).
Predictive empirical (regression) equations [15] were derived using a simple linear
regression equation relating the percentage moisture content (%MC) to the resistance (R) in
the form of equation (1).

Leonardo Electronic Journal of Practices and Technologies
ISSN 1583-1078
Issue 30, January-June 2017
p. 255-268
259
aRbMc % (1)
Where: a - coefficient of regression of the percentage moisture content; b - constant of
regression. Values of a, b are given by [16] as in equations (2) and (3).
22)(
%%
RRN
RMcRMcNa (2)
22
2%%%
RRN
RMcMcMcRb (3)
Where: N - number of observations.
The coefficient of correlation (or the correlation coefficient) is a measure of the
strength of the linear relationship between two variables and its values lies between +1 and -1.
Therefore, the coefficients of correlation [17] of all the predictive empirical equations were
obtained from equation (4).
2222 %%
%%
McMcNRRN
RMcRMcN (4)
To calibrate the device to generate or derive the empirical equations for predicting the
percentage moisture content and the corresponding coefficients of correlation, statistical
calculations with MATLAB CODES [18] were employed using the experimental data
inputted into equations (1), (2), (3) and (4) appropriately. The resulting respective predictive
empirical equations are as follows Eq. (5-13):
For paddy rice
Full: %Mc = 40.85 - 16.05R (5)
Half: %Mc = 27.58 - 3.75R (6)
Quarter: %Mc = 23.42 - 2.06R (7)
For Guinea corn
Full: %Mc = 44.44 - 9.90R (8)
Half: %Mc = 42.97 - 4.42R (9)
Quarter: %Mc = 29.3 - 1.80R (10)
For Millet:
Full: %Mc = 60.22 - 10.45R (11)
Half: %Mc = 44.14 - 4.84R (12)
Quarter: %Mc = 44.24 - 3.65R (13)

Development of resistance type moisture measuring device for grains
Sadiq Sius LAWAL, Katsina Christopher BALA, Michael Bolaji ADEYEMI
260
These equations (5) to (13) were used to predict the percentage moisture content at
corresponding resistances and the results compared with the direct oven method.
Results and Discussion
Table 1 presents the summary of all the coefficients of correlations for the grains and
the various Wheatstone bridge arrangements.
Table 1. Summary of coefficients of correlation (γ)
Grains Coefficients of correlation (γ)
Full bridge Half bridge Quarter bridge
Paddy rice -0.95 -0.88 -0.58
Guinea corn -0.99 -0.94 -0.42
Millet -0.99 -0.53 -0.47
The results obtained for the moisture content of the various grains at various drying
time intervals is presented in Figure 3.
0
10
20
30
40
50
60
0
10
20
30
40
50
60
70
80
90
100
120
130
140
150
160
Mois
ture
conte
nt (%
)
Drying time (minutes)
Paddy rice Guinea corn Millet
Figure 3. Moisture content
Figure 3 shows that for all the grains samples tested the percentage moisture content
decreases with drying time due to loss of moisture.
Figure 4 is the resistances (full, half and quarter bridges) versus moisture content for
paddy rice.

Leonardo Electronic Journal of Practices and Technologies
ISSN 1583-1078
Issue 30, January-June 2017
p. 255-268
261
0
1
2
3
4
5
6
7
8
6,5
7,1
9,6
12,2
14,4
15,7
18,7
21,3
24,5
26,8
28,7
30,1
Res
ista
nce
(M
Ω)
Moisture content (%)
Full bridge Half bridge Quarter bridge
Figure 4. Resistance of paddy rice versus moisture
Figure 5 shows the resistances (full, half and quarter bridges) versus moisture content
for guinea corn while Figure 6 is the resistances (full, half and quarter bridges) against the
moisture content for millet.
0
1
2
3
4
5
6
7
8
9
5.6
8.8
13.0
14.3
20.3
22.9
26.4
28.4
32.8
34.1
35.9
Res
ista
nce
(M
Ω)
Moisture content (%)
Full bridge Half bridge Quarter bridge
Figure 5. Resistance of guinea corn versus moisture

Development of resistance type moisture measuring device for grains
Sadiq Sius LAWAL, Katsina Christopher BALA, Michael Bolaji ADEYEMI
262
0
1
2
3
4
5
6
7
8
9
2,0
7,1
12,2
15,0
20,2
25,1
29,6
34,2
40,0
41,2
45,7
51,9
55,8
Res
ista
nce
(M
Ω)
Moisture content (%)
Full bridge Half bridge Quarter bridge
Figure 6. Resistance of millet versus moisture
The resistances of the grains as presented in Figures 4, 5 and 6, are found to increase
as the moisture content decreases. Similarly, the measured resistances of the full bridge
arrangement are found also to be lower than the half and quarter bridge connections for all the
grains. The values of the coefficients of correlation obtained in Table 1 imply that the full
bridge is gave the near perfect negative correlation of [17]. From Table 1 shows that the
coefficients of correlation values lies between +1 and -1and this indicates the measure of the
strength of the linearity between the percentage moisture content and the resistances [15,17].
This means also that the moisture content of the grains has a corresponding relationship with
the resistances. This further substantiates the fact that as the moisture content decrease (loss
of water), the resistance increases as seen from Figures 4, 5 and 6. Table 1 also show clearly
high sensitivity with high negative coefficients of correlation when the device was operated
with the full Wheatstone bridge arrangements. Next to the full Wheatstone bridge
arrangements in term of sensitivity and coefficients of correlation is the half Wheatstone
bridge and lastly the quarter Wheatstone bridge arrangements.
Figure 7 is the predicted moisture content of paddy rice for full, half and quarter
bridges from the device after calibration against the moisture content obtained by direct oven
method.

Leonardo Electronic Journal of Practices and Technologies
ISSN 1583-1078
Issue 30, January-June 2017
p. 255-268
263
0
5
10
15
20
25
30
35
18,7
21,3
24,5
26,8
28,7
30,1
Pre
dic
ted
mo
istu
re c
onte
nt
(%)
Oven method moisture content (%)
Oven method Full bridge Half bridge Quarter bridge
Figure 7. Predicted moisture content of paddy rice
Figure 8 shows the predicted moisture content of guinea corn for full, half and quarter
bridges from the device after calibration against the moisture content obtained by direct oven
method.
0
5
10
15
20
25
30
35
40
45
22,9
26,4
28,4
32,8
34,1
35,9
Pre
dic
ted
mo
istu
re c
onte
nt
(%)
Oven method moisture content (%)
Oven method2 Full bridge Half bridge Quarter bridge
Figure 8. Predicted moisture content of guinea corn
Figure 9 presents the predicted moisture content of millet for full, half and quarter

Development of resistance type moisture measuring device for grains
Sadiq Sius LAWAL, Katsina Christopher BALA, Michael Bolaji ADEYEMI
264
bridges from the device after calibration against the moisture content obtained by direct oven
method. The results of direct measurement for the calibration of the device are presented in
Appendix A, as Tables 2, 3 and 4 for paddy rice, guinea corn and millet respectively.
0
10
20
30
40
50
60
34,2
40,0
41,2
45,7
51,9
55,8
Pre
dic
ted
mo
istu
re c
onte
nt
(%)
Oven method moisture content (%)
Oven method Full bridge Half bridge Quarter bridge
Figure 9. Predicted moisture content of millet
The comparison between the predicted values and the percentage moisture contents of
the various grains, using the different bridge arrangements versus the direct oven method for
the grains are shown in Figure 7 for paddy rice, Figure 8 for guinea corn and Figure 9 for
millet. The Figures showed that the full bridge arrangements are the most correlated
(accurate) followed by the half bridge and lastly by the quarter bridge copper electrode
arrangements. This trend was also the case in Table 1 for all the grains. This further asserts
the sensitivity and high negative coefficients of correlation of the full bridge configuration of
the application of the device. Therefore, accurate measurement of moisture content using this
device is better achieved with the full bridge configuration for all the grains.
Conclusions
A resistance type moisture measuring device for grains was developed and
investigations conducted on paddy rice, guinea corn and millet to obtain the resistances of the
grains using a Wheatstone bridge arrangement. The resistances obtained for all the grains are
found to increase as the percentage moisture content decreases.

Leonardo Electronic Journal of Practices and Technologies
ISSN 1583-1078
Issue 30, January-June 2017
p. 255-268
265
The empirical equations relating percentages of moisture content to the measured
resistances shows that the full bridge connection gives the best correlation as indicated by the
high correlation coefficients obtained.
The results obtained have shown that with the various Wheatstone bridge circuits it
can be concluded that the locally developed device can be used to determine the moisture
content of any grain.
Appendix
Table 2. Measurement for calibration of the device for paddy rice samples
S/No Time
(Minutes)
Mass, Ww
(g)
% Moisture
Content (%MC)
Resistances R (MΩ)
Full
Bridge
Half
Bridge
Quarter
Bridge
1 0.00 75.947 30.09255 0.8 0.9 0.9
2 10.00 75.324 28.67934 0.9 1.0 1.1
3 20.00 74.512 26.8374 1.0 1.1 1.2
4 30.00 73.492 24.52364 1.1 1.2 1.4
5 40.00 72.078 21.31612 1.2 1.3 1.7
6 50.00 70.941 18.73696 1.3 1.5 1.9
7 60.00 69.615 15.72906 1.4 1.8 2.1
8 70.00 69.027 14.39525 1.5 1.9 2.2
9 80.00 68.044 12.16541 1.6 3.4 5.5
10 90.00 66.931 9.640686 1.7 4.5 6.4
11 100.00 65.812 7.10235 2.2 5.5 7.3
12 120.00 65.550 6.50803 2.4 6.6 -
13 130.00 64.717 4.693 - - -
14 140.00 63.687 2.319 - - -
15 150.00 62.701 0.05 - - -
16 160.00 62.681 0 - - -
Table 3. Measurements for the calibration of the device for guinea corn samples
S/No Time
(Minutes)
Mass,
Ww (g)
% Moisture
Content (%MC)
Resistances R (MΩ)
Full
Bridge
Half
Bridge
Quarter
Bridge
1 0.00 75.947 35.85862 0.8 0.9 1.0
2 10.00 75.219 34.13403 1.1 1.4 2.2
3 20.00 74.645 32.77426 1.3 2.6 2.9
4 30.00 72.795 28.39173 1.5 4.0 3.2
5 40.00 71.948 26.38524 1.8 4.6 4.2
6 50.00 70.471 22.88631 2.3 5.8 4.5
7 60.00 69.384 20.31128 2.6 5.9 5.7
8 70.00 66.840 14.2847 2.8 6.2 6.4
9 80.00 66.288 12.97704 3.1 6.5 6.7
Development of resistance type moisture measuring device for grains
Sadiq Sius LAWAL, Katsina Christopher BALA, Michael Bolaji ADEYEMI
266
10 90.00 64.527 8.805344 3.6 6.9 7.7
11 100.00 63.155 5.555161 4.0 7.3 -
12 120.00 62.409 3.788 - - -
13 130.00 61.826 2.407 - - -
14 140.00 60.846 0.09 - - -
15 150.00 60.828 0.04 - - -
16 160.00 60.810 0 - - -
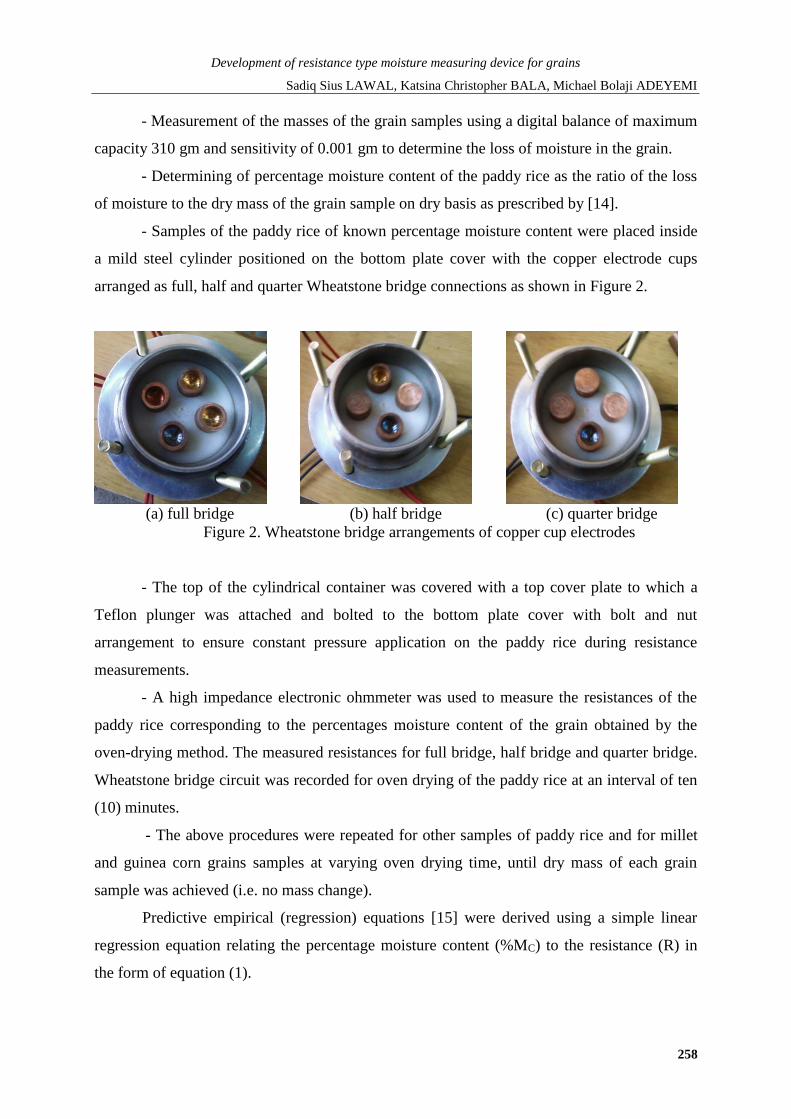
Table 4. Measurement for calibration of the device for millet samples
S/No Time
(Minutes)
Mass
Ww (g)
% Moisture
Content (%MC)
Resistances R (MΩ)
Full
Bridge
Half
Bridge
Quarter
Bridge
1 0.00 75.947 35.85862 0.8 0.9 1.0
2 10.00 75.219 34.13403 1.1 1.4 2.2
3 20.00 74.645 32.77426 1.3 2.6 2.9
4 30.00 72.795 28.39173 1.5 4.0 3.2
5 40.00 71.948 26.38524 1.8 4.6 4.2
6 50.00 70.471 22.88631 2.3 5.8 4.5
7 60.00 69.384 20.31128 2.6 5.9 5.7
8 70.00 66.840 14.2847 2.8 6.2 6.4
9 80.00 66.288 12.97704 3.1 6.5 6.7
10 90.00 64.527 8.805344 3.6 6.9 7.7
11 100.00 63.155 5.555161 4.0 7.3 -
12 120.00 62.409 3.788 - - -
13 130.00 61.826 2.407 - - -
14 140.00 60.846 0.09 - - -
15 150.00 60.828 0.04 - - -
16 160.00 60.810 0 - - -

Leonardo Electronic Journal of Practices and Technologies
ISSN 1583-1078
Issue 30, January-June 2017
p. 255-268
267
References
1. Wang W.P., Design and development of resistive grain moisture meter, Applied
Mechanics and Materials, 2015, 716, p. 961-964.
2. Baird J.H., Grading and maintaining grain quality in storage, Proceeding of Australian
Centre for International Agricultural Research, 1987, 19, p. 35-41.
3. Khan A.R., Mannan A., Stored-products entomology in the tropics, Agricultural Zoology
Reviews, 1991, 4, p. 67-95.
4. Suryalkanta P. (Online), Moisture content determination using rapid moisture meter,
Available at: civilblog.org IS:2720-part 2(accessed 13/5/2013)
5. Banga J.R., Singh R.P., Optimization of air drying of foods, Journal of Food Engineering,
1994, 23, p. 189-211.
6. ElSayed N.I., Mekawy M.M., Megahed F.M., Uncertainty of moisture measurements
methods for grains, Australian Journal of Basic and Applied Science, 2011, 5(7), p. 582-
587.
7. Zhe L., Zhan W., Zhongjie Z., Wenfu W., Hexin L., Research on online moisture detector
in grain drying process based on V/F conversion, Hindawi, Mathematical Problems in
Engineering, 2015.
8. Wexler A., Humidity and moisture measurements and control in science and industry,
Reinhold Publisher, New York, 1965.
9. Ogunleye I.O., Adeyemo S.B., Adeyemi, M. B., Development of moisture measuring
device for cassava particulate during drying, Advance Materials Research, Trans Tech
Publications, Switzerland, 2007, 18, p. 171-176.
10. Nelson S.O., Use of electrical properties for grain-moisture measurement, Journal of
Microwave Power, 1977, 12(1), p. 67-72.
11. Kandala K., Nelson S.O., Lawrence K.C., Non-destructive electrical measurement of
moisture content in single kernels of com, Journal of Agricultural and Engineering
Research, 1989, 44, p. 125-132.
12. Wang W.C., Dai Y.Z., A grain moisture detecting system based on capacitance sensor,
International Journal of Digital Content Technology and Applications, 2011, 5(3), p. 203-
209.
13. Makoto K., Mycotoxin prevention and control in food grains: Corn Sheller and Moisture

Development of resistance type moisture measuring device for grains
Sadiq Sius LAWAL, Katsina Christopher BALA, Michael Bolaji ADEYEMI
268
meter. ISO – 8859 -1, 2012.
14. American Society for Testing and Materials (ASTM), Methods of Measuring Moisture
Content of Wood, ASTM Standard D 2016, Philadelphia, PA.
15. Dalela S., Mansoor A.L., Industrial engineering and production management, K Jan
Standard Publisher Distribution, 2006.
16. Murray R.S., Larry J.S., Theory and problems of statistics, McGraw-Hill, Schaum’s
outline series, London, 2007.
17. Egbe E., Odili G.A., Ugbebor O.O., Further mathematics, Africana-Fep Publishers Plc,
Nigeria, 2010.
18. Lawal S.S., Development of resistant type moisture content measuring device for grains,
M. Eng. Thesis, Department of Mechanical Engineering, Federal University of
Technology, Minna, 2014.


![Gerhardt traite resistances[1]](https://static.fdocuments.net/doc/165x107/55ce3441bb61eb29628b457b/gerhardt-traite-resistances1.jpg)