I TRINITY GLOBAL SCHOOL Jakariyapur , Near Transport Nagar ...

SVENSK KÄRNBRÄNSLEHANTERING AB
SWEDISH NUCLEAR FUEL
AND WASTE MANAGEMENT CO
Box 3091, SE-169 03 Solna
Phone +46 8 459 84 00
skb.se
SVENSK KÄRNBRÄNSLEHANTERING
Development of radionuclide transport models for the near-field
Report for the safety evaluation SE-SFL
Ola Wessely
Pirouz Shahkarami
Report
R-19-05July 2019


Development of radionuclide transport models for the near-fieldReport for the safety evaluation SE-SFL
Ola Wessely, Svensk Kärnbränslehantering AB
Pirouz Shahkarami, Kemakta Konsult AB
ISSN 1402-3091SKB R-19-05ID 1568271
July 2019
Keywords: SE-SFL, Near-field, Transport, Modelling, Simulation, Compartment approach.
A pdf version of this document can be downloaded from www.skb.se.
© 2019 Svensk Kärnbränslehantering AB


SKB R-19-05 3
Abstract
This report focuses on the development of near-field models to describe radionuclide transport in the SFL repository. The proposed models rely on the compartment conceptualization of the near-field backfill materials and waste domain and incorporate many of the important transport-related processes, including diffusion, advection, sorption and chain decay. The models are accompanied by supporting calculations, which aim to confirm the correct implementation of the compartment approach and validity of the assumptions underlying the models.
The developed models are implemented in the Ecolego software and used to calculate the release of radionuclides from the BHA and BHK vaults, which are backfilled with bentonite and concrete, respectively. Three different degradation states are defined to study the effect of the future hydrological evolution of the concrete backfill on the extent of radionuclide release. These are included in the Intact Case (IC) where all the concrete backfill is assumed intact, the Degraded Zone Case (DZC) where the outer half of the concrete backfill is assumed to be degraded, and the Degraded Case (DC) where the entire concrete backfill is assumed to be degraded.
The BHA results indicate that the bentonite backfill can effectively retard the migration of sorbing nuclides, resulting in long retention times that allow many of the important radionuclides to decay to low activity levels before they are released from the vault. The accumulated release from BHA is shown to be dominated by 99Tc, 36Cl and 14C. The accumulated BHK release is, however, dominated by 14C and 59Ni in the IC. The predicted release in the DZC is similar in terms of the dominating nuclides with a moderate increase in the near-field release compared to the IC.
Since the concrete backfill is assumed to be completely degraded in the DC, radionuclides are trans-ported instantly from the waste package to the surrounding rock. This largely increases the near-field release, compared to the IC and DZC. Furthermore, some of the short-lived radionuclides that would have not been released under the condition of the IC and DZC, e.g., 60Co and 90Sr, are released from the repository near-field under the DC conditions.

4 SKB R-19-05
Sammanfattning
Denna rapport fokuserar på utvecklingen av närfältsmodeller för att kunna simulera radionuklid-transport i SFL-förvaret. De föreslagna modellerna bygger på en kompartment-konceptualisering av återfyllnadsmaterial och avfallsdomänen samt innehåller många av de viktiga transportrelaterade processerna, inklusive diffusion, advektion, sorption och radioaktivt sönderfall. Modellerna åtföljs av stödberäkningar, som syftar till att bekräfta ett korrekt genomförande av kompartmentansatsen och validiteten av de antaganden som ligger till grund för modellerna.
De utvecklade modellerna har implementerats i mjukvaran Ecolego och har använts för att beräkna utsläpp av radionuklider från bergsalarna BHA och BHK, vilka har återfyllts med bentonit respektive betong. Tre olika degraderingstillstånd har definierats för att studera effekten av den framtida hydro-logiska utvecklingen av betongåterfyllnaden på omfattningen av radionuklidutsläppet. I dessa tillstånd ingår det intakta fallet (IC) där all betongåterfyllnad antas vara intakt, fallet med en degraderad zon (DZC) där den yttre halvan av betongfyllningen antas vara degraderad och det degraderade fallet (DC) där hela betongåterfyllnaden antas vara degraderad.
BHA-resultaten indikerar att bentonitåterfyllnaden kan effektivt fördröja migrationen av sorberande nuklider, vilket resulterar i långa retentionstider som i sin tur medför att många av de viktiga radio-nukliderna sönderfaller till låga aktivitetsnivåer innan de släpps ut från bergsalen. Ackumulerade utsläppet från BHA domineras av 99Tc, 36Cl och 14C. Ackumulerade utsläppet från BHK domineras emellertid av 14C och 59Ni i fallet IC. Det predikterade utsläppet i DZC-fallet är liknande i termer av dominerande nuklider med en måttlig ökning av utsläpp i närfältet jämfört med IC-fallet.
Eftersom betongåterfyllnaden antas vara fullständigt degraderad i DC-fallet, transporteras radionukli-der direkt från avfallskollina till det omgivande berget. Detta ökar närfältutsläppet i stor utsträckning jämfört med det i fallen IC och DZC. Dessutom släpps några av de kortlivade radionukliderna ut som inte släpps ut under förhållandena i fallen IC och DZC. Som exempel kan det nämnas att 60Co och 90Sr släpps ut från förvarets närområde under DC-förhållanden.

SKB R-19-05 5
Contents
1 Introduction 71.1 Background 71.2 An overview of the existing near-field models and simulation tools 81.3 Aim and scope 91.4 Structure of the report 9
2 SFL repository concept 112.1 Waste vault for reactor internals – BHK 112.2 Waste vault for legacy waste – BHA 122.3 Near-field future hydrological evolution 14
2.3.1 Groundwater flow in the BHK vault 162.3.2 Groundwater flow in the BHA vault 18
3 Near-field radionuclide transport mechanisms 213.1 Diffusion 213.2 Advection 213.3 Dispersion 213.4 Sorption 223.5 Radioactive decay and ingrowth 223.6 Corrosion of metallic waste components 223.7 Solubility limits 223.8 The continuity equation 22
4 Compartment approach 254.1 Capacity and retardation in a compartment with different materials 264.2 Transport in bentonite and concrete backfills 27
4.2.1 Diffusive transport in bentonite and intact concrete 284.2.2 Advective transport between compartments 324.2.3 Effect of advective transport in the degraded concrete 32
4.3 Boundary condition formulation at the vault-rock interface 364.4 Release of radionuclide due to the corrosion of metallic waste components 38
5 NF-RNT calculations for SE-SFL 415.1 Release from the BHA vault 415.2 Release from the BHK vault 44
5.2.1 Intact Case (IC) 445.2.2 Degraded Zone Case (DZC) 455.2.3 Degraded Case (DC) 46
6 Summary and Conclusion 49
7 References 51
Appendix A Analysis of the spatial discretization in the compartment approach 53
Appendix B Comparison between different models of the transport processes 57

SKB R-19-05 7
1 Introduction
This section begins with some background information on the disposal of radioactive waste in the SFL repository. An overview of the existing models for solute transport in the repository near-field is then provided, followed by the objectives and outline of this report.
1.1 BackgroundSKB plans to dispose of long-lived low and intermediate level waste in SFL. About one third of the waste arises from the operation and decommissioning of the Swedish nuclear power plants. The remainder includes legacy waste from the early Swedish nuclear research programs and waste from medicine, industry and research. The capacity of the SFL repository is estimated to be 16 000 m3.
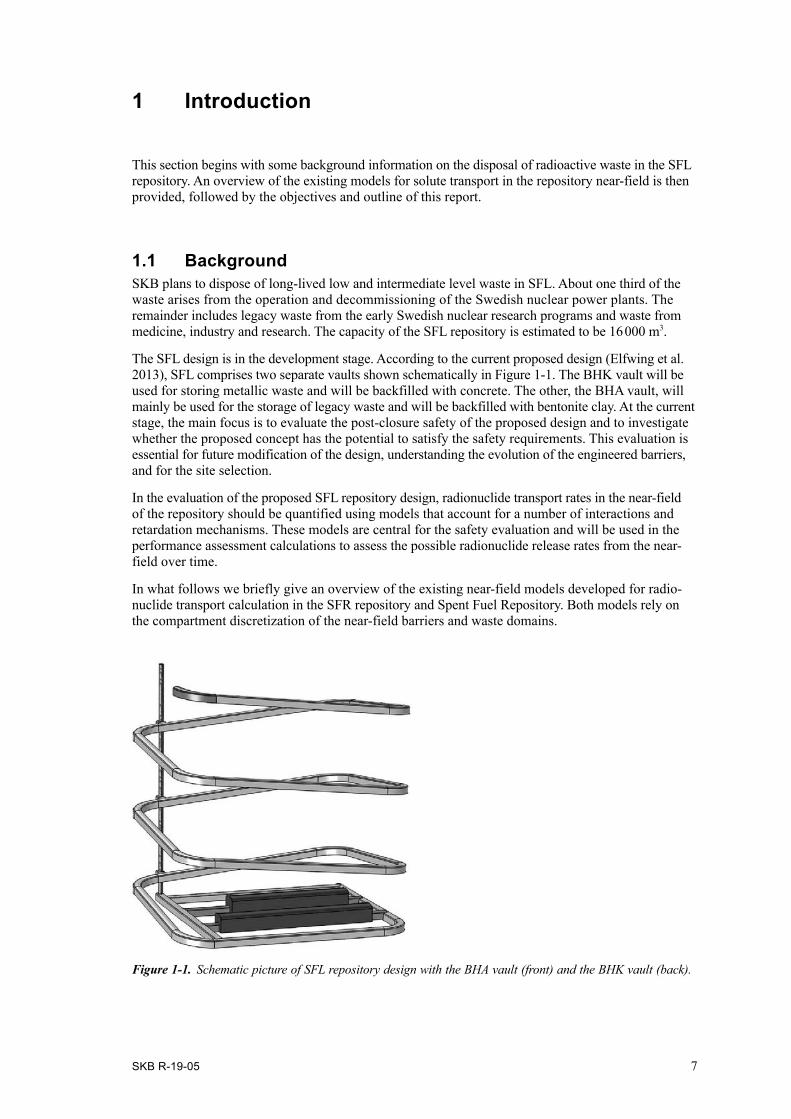
The SFL design is in the development stage. According to the current proposed design (Elfwing et al. 2013), SFL comprises two separate vaults shown schematically in Figure 1-1. The BHK vault will be used for storing metallic waste and will be backfilled with concrete. The other, the BHA vault, will mainly be used for the storage of legacy waste and will be backfilled with bentonite clay. At the current stage, the main focus is to evaluate the post-closure safety of the proposed design and to investigate whether the proposed concept has the potential to satisfy the safety requirements. This evaluation is essential for future modification of the design, understanding the evolution of the engineered barriers, and for the site selection.
In the evaluation of the proposed SFL repository design, radionuclide transport rates in the near-field of the repository should be quantified using models that account for a number of interactions and retardation mechanisms. These models are central for the safety evaluation and will be used in the performance assessment calculations to assess the possible radionuclide release rates from the near-field over time.
In what follows we briefly give an overview of the existing near-field models developed for radio-nuclide transport calculation in the SFR repository and Spent Fuel Repository. Both models rely on the compartment discretization of the near-field barriers and waste domains.
Figure 1‑1. Schematic picture of SFL repository design with the BHA vault (front) and the BHK vault (back).
8 SKB R-19-05
1.2 An overview of the existing near-field models and simulation tools
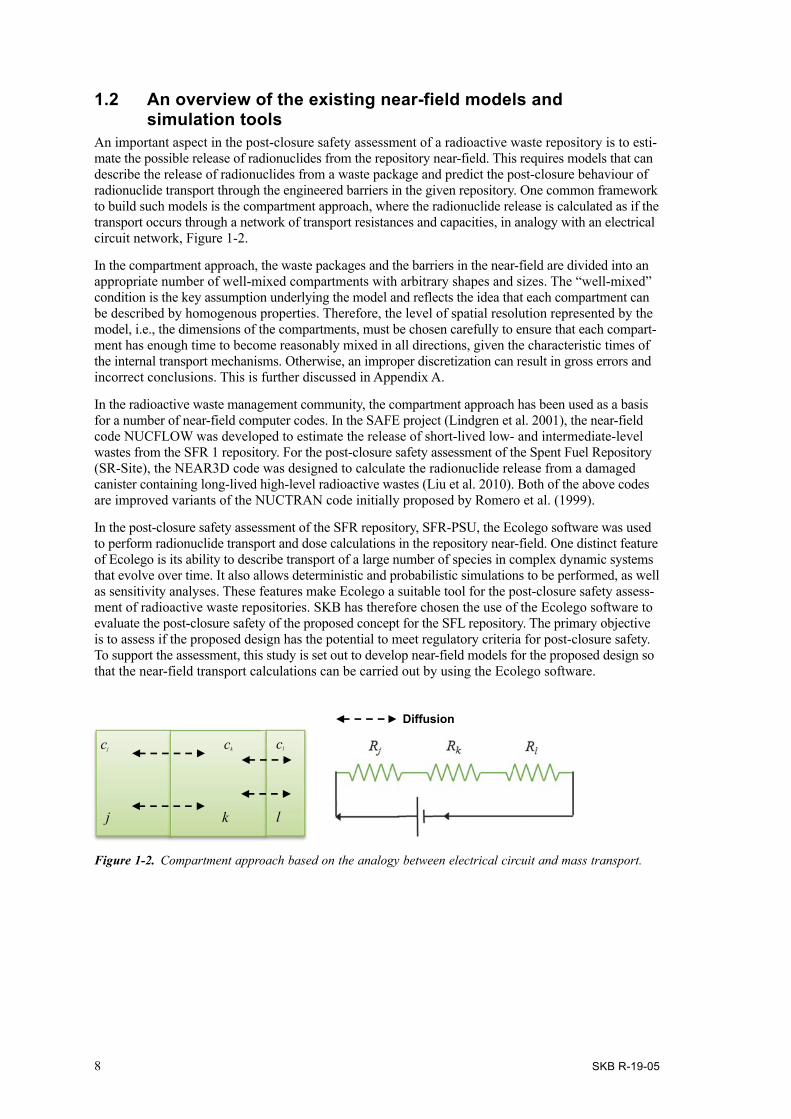
An important aspect in the post-closure safety assessment of a radioactive waste repository is to esti-mate the possible release of radionuclides from the repository near-field. This requires models that can describe the release of radionuclides from a waste package and predict the post-closure behaviour of radionuclide transport through the engineered barriers in the given repository. One common framework to build such models is the compartment approach, where the radionuclide release is calculated as if the transport occurs through a network of transport resistances and capacities, in analogy with an electrical circuit network, Figure 1-2.
In the compartment approach, the waste packages and the barriers in the near-field are divided into an appropriate number of well-mixed compartments with arbitrary shapes and sizes. The “well-mixed” condition is the key assumption underlying the model and reflects the idea that each compartment can be described by homogenous properties. Therefore, the level of spatial resolution represented by the model, i.e., the dimensions of the compartments, must be chosen carefully to ensure that each compart-ment has enough time to become reasonably mixed in all directions, given the characteristic times of the internal transport mechanisms. Otherwise, an improper discretization can result in gross errors and incorrect conclusions. This is further discussed in Appendix A.
In the radioactive waste management community, the compartment approach has been used as a basis for a number of near-field computer codes. In the SAFE project (Lindgren et al. 2001), the near-field code NUCFLOW was developed to estimate the release of short-lived low- and intermediate-level wastes from the SFR 1 repository. For the post-closure safety assessment of the Spent Fuel Repository (SR-Site), the NEAR3D code was designed to calculate the radionuclide release from a damaged canister containing long-lived high-level radioactive wastes (Liu et al. 2010). Both of the above codes are improved variants of the NUCTRAN code initially proposed by Romero et al. (1999).
In the post-closure safety assessment of the SFR repository, SFR-PSU, the Ecolego software was used to perform radionuclide transport and dose calculations in the repository near-field. One distinct feature of Ecolego is its ability to describe transport of a large number of species in complex dynamic systems that evolve over time. It also allows deterministic and probabilistic simulations to be performed, as well as sensitivity analyses. These features make Ecolego a suitable tool for the post-closure safety assess-ment of radioactive waste repositories. SKB has therefore chosen the use of the Ecolego software to evaluate the post-closure safety of the proposed concept for the SFL repository. The primary objective is to assess if the proposed design has the potential to meet regulatory criteria for post-closure safety. To support the assessment, this study is set out to develop near-field models for the proposed design so that the near-field transport calculations can be carried out by using the Ecolego software.
Figure 1‑2. Compartment approach based on the analogy between electrical circuit and mass transport.
j k
cj ck
Diffusion
cl
l
SKB R-19-05 9
1.3 Aim and scopeThe main aim of this study is to develop near-field radionuclide transport (NF-RNT) models to calculate radionuclide release from the SFL repository near-field. These models will help assess the post-closure performance of the repository barriers. The developed models are based on the proposed concept for the SFL repository and rely on the compartment conceptualization of the waste packages and engineered barriers in the backfill.
The near-field release calculations presented in this report are performed using the Ecolego software and aim to quantitatively describe radionuclide transport in the repository near-field. The calculations also analyse the effect of different future evolutions of the SFL engineered barriers on the extent of radionuclide release from the repository. Supporting calculations are presented in Appendix A to ensure the correct implementation of the compartment approach and to examine the validity of simplifications made in the model.
The calculations in this study rely on data and information collected as part of the SFL safety evaluation project (SE-SFL), which aimed to estimate the radiological risk associated with the SFL repository (Shahkarami 2019).
The results of this study contribute to the report describing radionuclide transport and dose calcula-tions for SE-SFL (SKB 2019c), which itself forms part of the main report for the SE-SFL Project (SKB 2019b).
1.4 Structure of the reportThis report contains descriptions of the SFL repository design, compartment approach, proposed near-field transport models, calculation sets and results from the radionuclide transport calculation by the Ecolego software. The following is a brief description of the contents and structure of the report.
Section 1 – Introduction: This section provides background information on the SE-SFL and gives an overview of the existing near-field transport models relying on the compartment approach.
Section 2 – SFL repository concept: This section describes the proposed repository concept for the SFL repository. This is followed by the descriptions of the future hydrological evolution of the SFL repository near-field.
Section 3 – Near-field radionuclide transport mechanisms: This section provides an overview of the important transport mechanisms in the SFL repository near-field.
Section 4 – Compartment approach: This section describes the compartment approach that will be used to model and calculate the radionuclide release from the SFL repository near-field.
Section 5 – NF-RNT calculations for SE-SFL: The radionuclide transport calculation results are presented in this section. These include the radionuclide release rates from the BHA and BHK vaults.
Section 6 – Summary and Conclusion: This section presents the most important conclusions of the study.
Appendix A – This appendix provides an analysis of the spatial discretization in the compartment approach.
Appendix B – This appendix compares different models of the transport processes.

SKB R-19-05 11
2 SFL repository concept
The design of the SFL repository is in the development stage. The proposed SFL repository concept includes two waste storage vaults (Elfwing et al. 2013). One vault is intended to contain the metallic wastes from the operation and decommissioning of Swedish nuclear power plants (BHK) and the other is designed to contain legacy waste from the early Swedish nuclear research programs as well as wastes from research and industry (BHA). This section provides an overview of the SFL repository vaults and their specifications. A brief description of the repository scale model used to study the evolution of the near-field hydrology is also given in this section.
2.1 Waste vault for reactor internals – BHKAbout one third of the waste planned to be placed in the SFL repository arises from the maintenance and decommissioning of the nuclear power plants (NPPs). The NPP wastes typically comprise neutron-activated metallic components situated inside and close (0.5–1.0 m) to the reactor core. A complete list of the components planned for disposal in BHK can be found in SKB (2019a).
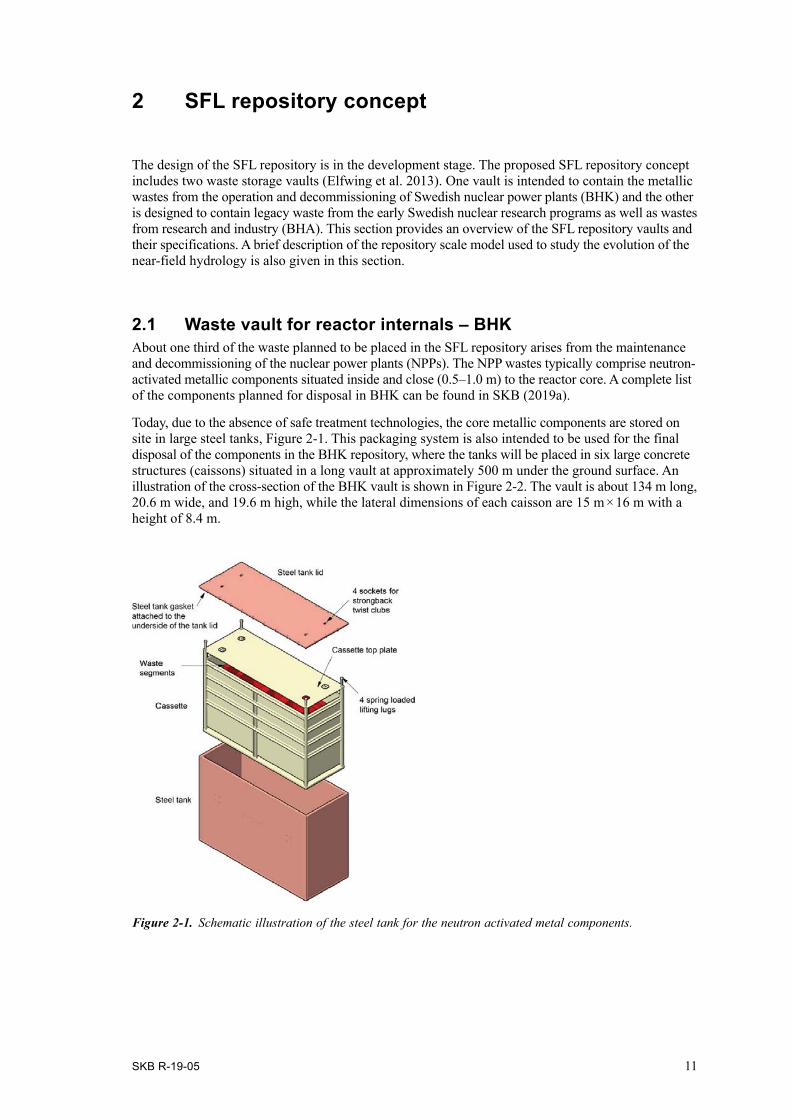
Today, due to the absence of safe treatment technologies, the core metallic components are stored on site in large steel tanks, Figure 2-1. This packaging system is also intended to be used for the final disposal of the components in the BHK repository, where the tanks will be placed in six large concrete structures (caissons) situated in a long vault at approximately 500 m under the ground surface. An illustration of the cross-section of the BHK vault is shown in Figure 2-2. The vault is about 134 m long, 20.6 m wide, and 19.6 m high, while the lateral dimensions of each caisson are 15 m × 16 m with a height of 8.4 m.
Figure 2‑1. Schematic illustration of the steel tank for the neutron activated metal components.

12 SKB R-19-05
After emplacement, the gap between the tanks will be filled with grout to stabilise the stack of waste packages and to reduce the void volume. The grout will also stabilise the waste packages and improve the mechanical strength of the tanks. The vault will then be backfilled with concrete, which acts as a physical barrier against groundwater flow and also contributes to radionuclide retardation. The choice of concrete is based on its favourable key properties. Intact concrete has a very low hydraulic conduc-tivity and, therefore, high flow rates are not expected around the caissons. It also has a very low diffusion coefficient for many important radionuclides. Furthermore, concrete provides an alkaline environment, which can create a passivating layer on the surface of the steel components, reducing the corrosion rate of steel and, therefore, limiting the release rate of radionuclides (SKB 2019a). Concrete has also a high sorption coefficient for many radionuclides, but not for anions, e.g., chlorine and molybdenum.
2.2 Waste vault for legacy waste – BHAThe vault for legacy waste, BHA, is designed for the disposal of radioactive waste from research activities at Studsvik Nuclear AB as well as low-level wastes from other sources in Sweden including medicine, industries and research. The waste mainly consists of ion-exchange resins, precipitation sludge, exchanged components from the research reactor at Studsvik, tools, instruments, articles of consumption, laboratory outfit, ashes, glove boxes and radiation sources (Herschend 2014, 20151).
Today, the BHA wastes are typically stored in metallic drums of 200- and 280-liters capacity. For the underground disposal of the waste, the drums will be placed in a steel framework, Figure 2-3. The waste package will then be placed in a concrete structure located in the vault and the gap between the drums and waste packages will be filled with grout. Once the concrete structure has been closed with a lid, the vault will be backfilled by a thick layer of bentonite clay, as shown schematically in Figure 2-4.
The concrete structure is intended to provide radiation shielding during the operational phase. Bentonite clay is chosen as a backfill material because of its favourable properties for isolation of the
1 Herschend B, 2015. Long-lived waste from AB SVAFO and Studsvik Nuclear AB. SKBdoc 1431282 ver 1.0, Svensk Kärnbränslehantering AB. Internal document.
Figure 2‑2. Schematic cross-sectional layout of BHK with (1) Theoretical tunnel contour, (2) Concrete backfill, (3) Grout, (4) Concrete structure (0.5 m), (5) Steel tanks, (6) Concrete. Approximate dimensions: A = 20.6 m, B = 19.6 m, C = 15 m, D = 2.8 m, E = 2.4 m, F = 8.8 m. After Elfwing et al. (2013).
SKB R-19-05 13
waste package and containment of the waste. When in contact with water, the clay particles adsorb water molecules, which makes the bentonite swell strongly, filling the voids and cracks surrounding the concrete structure. Compact bentonite has a very low hydraulic conductivity and the water flow around the canister surface is expected to be practically negligible. Furthermore, the clay has a high sorption capacity for many important radionuclides and can strongly retard sorbing species.
The grout between the waste packages contributes to the high alkalinity in the vault and, therefore, reduces the corrosion rate. Thus, the concrete walls, lid, grout, the floor and the bentonite constitute a set of barriers limiting the release of radionuclides from the vault. The BHA vault is about 170 m long, 20.6 m wide and 18.4 m high. The concrete structure has the lateral dimensions of approximately 16 m × 140 m and a height of 8.4 m.
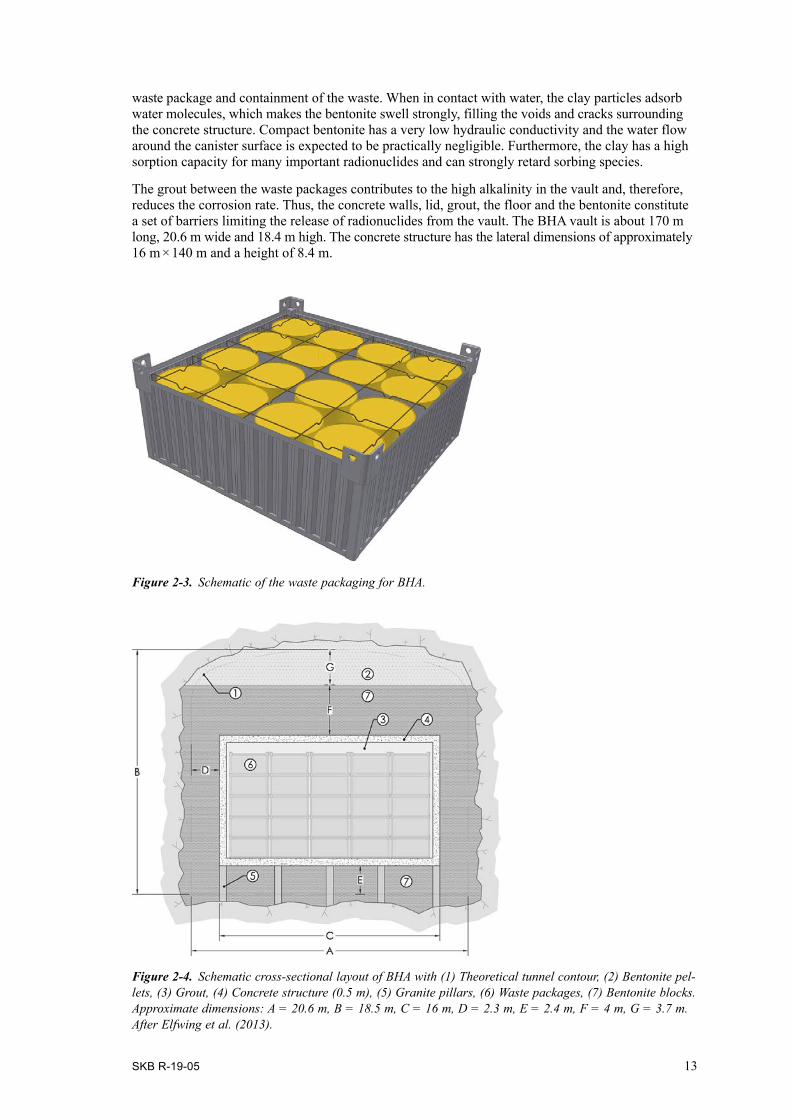
Figure 2‑3. Schematic of the waste packaging for BHA.
Figure 2‑4. Schematic cross-sectional layout of BHA with (1) Theoretical tunnel contour, (2) Bentonite pel-lets, (3) Grout, (4) Concrete structure (0.5 m), (5) Granite pillars, (6) Waste packages, (7) Bentonite blocks. Approximate dimensions: A = 20.6 m, B = 18.5 m, C = 16 m, D = 2.3 m, E = 2.4 m, F = 4 m, G = 3.7 m. After Elfwing et al. (2013).

14 SKB R-19-05
2.3 Near-field future hydrological evolutionThe backfill materials in the BHK and BHA vault are the central barriers limiting groundwater flow through the SFL near-field. It can, therefore, be inferred that the future evolution of the near-field hydrology is mainly characterized by changes in the hydraulic properties of the backfill materials. The bentonite backfill in BHA is assumed to retain its hydraulic properties throughout the safety evaluation for SFL. However, the hydraulic properties of the concrete backfill in BHK will, change over time. This is mainly because groundwater, over time, leaches cement minerals from the concrete and forms degraded zones. The material in the degraded zones is more permeable than the intact concrete, which affects the water flow in the BHK vault and waste.
A repository scale model has been set up and solved to evaluate the groundwater flow within and around the SFL vaults and wastes (Abarca et al. 2019). This included simulations of the following degradation scenarios for the BHK concrete backfill:
• Intact Case (IC): All the concrete backfill is intact. This is referred to as “base” case in Abarca et al. (201X).
• Degraded Zone Case (DZC): Leaching of the outer half of the concrete backfill creates a more permeable zone.
• Degraded Case (DC): The entire concrete backfill is leached and becomes more permeable.
The repository scale model is developed in COMSOL Multiphysics and describes water flow behav-iour in and around the geometries depicted in Figure 2-2 and Figure 2-4. Each vault is divided into a set of sections along its longitudinal axis, Figure 2-5. The sections in BHA and BHK are, thereafter, divided into 5 and 9 control volumes, respectively, to give a fair representation of flow around the waste packages, as schematically shown in Figure 2-6. Essentially, the repository scale model allows the flow conditions to be determined for the radionuclide transport calculation. More specifically, the control volumes and their surfaces provide information on the spatial distribution of the flow through the backfill and waste packages, which is essential for the transport calculation. This includes infor-mation on the flow through each control volume in the backfill and waste packages as well as the flow across the vault-rock interface (Abarca et al. 2019).
The particle density of the bentonite and concrete backfill materials are 2.78 × 10³ kg/m3 and 2.63 × 10³ kg/m3, respectively. Other transport properties associated with the BHA and BHK backfills are summarized in Table 2-1, where k is the permeability, De is the effective diffusion coefficient and ϵ is the physical porosity (Abarca et al. 2019, Shahkarami 2019).
Table 2-1. The backfill material properties in BHA and BHK.
Entity k* (m2) De (m2/s) ϵ
BHA bentonite backfill (cations/anions)
2 × 10⁻²⁰ 1.4 × 10⁻¹⁰/1.1 × 10−11 0.43
BHK (IC) 1.7 × 10⁻¹⁶ 3.5 × 10⁻¹² 0.11
BHK (DZC) (inner zone/outer zone)
1.7 × 10⁻¹⁶/2.4 × 10−14 3.5 × 10⁻¹²/5 × 10−12 0.11/0.14
BHK (DC) 2 × 10⁻¹⁴ 5 × 10⁻¹² 0.14
Waste Package 2 × 10⁻¹⁴ 3.5 × 10⁻¹⁰ 0.30
* For ρ = 1 000 kg/m3 and µ = 0.002 Pa.s.
It should be noted that the repository scale model has been coupled to the regional hydrogeology model (Joyce et al. 2019). The regional hydrogeology model simulates the entire transient evolution of groundwater flow under temperate climate conditions. However, in the repository scale model, a stationary flow field in the near-field has been calculated based upon a snap-shot of the regional hydrology simulation at 2000 AD. Hydraulic properties of the bedrock, including the position of high permeability fractures that intersect the vaults as well as boundary and initial conditions, are also inherited from the regional flow model (Joyce et al. 2019).
SKB R-19-05 15
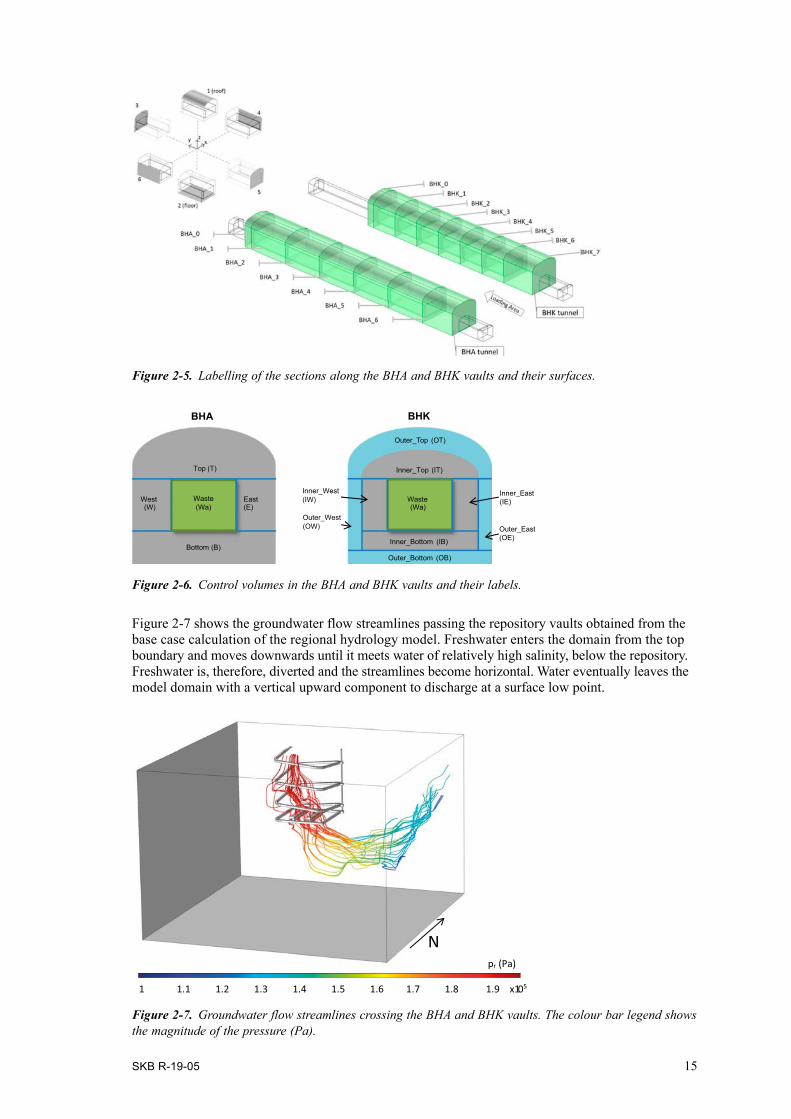
Figure 2-7 shows the groundwater flow streamlines passing the repository vaults obtained from the base case calculation of the regional hydrology model. Freshwater enters the domain from the top boundary and moves downwards until it meets water of relatively high salinity, below the repository. Freshwater is, therefore, diverted and the streamlines become horizontal. Water eventually leaves the model domain with a vertical upward component to discharge at a surface low point.
Figure 2‑5. Labelling of the sections along the BHA and BHK vaults and their surfaces.
Figure 2‑6. Control volumes in the BHA and BHK vaults and their labels.
BHA BHK
Top (T)
Bottom (B)
East(E)
West(W)
Inner_Top (IT)
Inner_Bottom (IB)
Inner_East(IE)
Inner_West(IW)
Outer_East(OE)
Outer_Top (OT)
Outer_West(OW)
Outer_Bottom (OB)
Waste(Wa)
Waste(Wa)
Npr (Pa)
1 1.1 1.2 1.3 1.4 1.5 1.6 1.7 1.8 1.9 x10⁵
Figure 2‑7. Groundwater flow streamlines crossing the BHA and BHK vaults. The colour bar legend shows the magnitude of the pressure (Pa).
16 SKB R-19-05
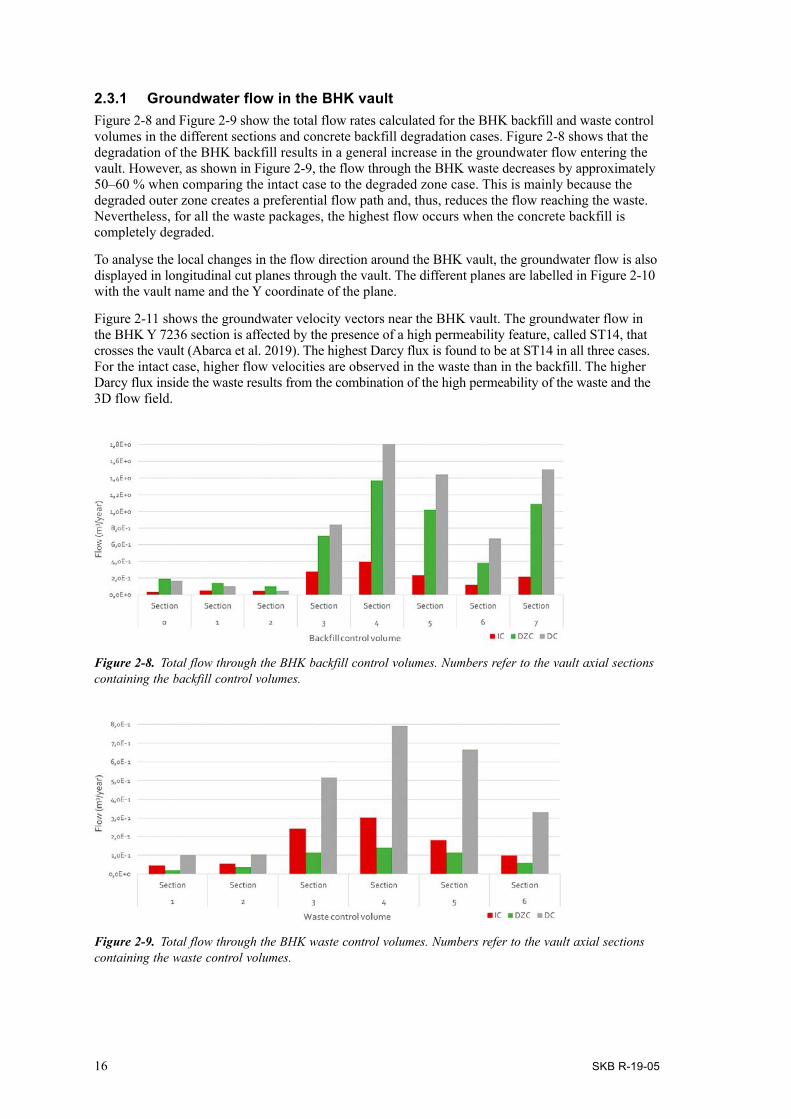
2.3.1 Groundwater flow in the BHK vaultFigure 2-8 and Figure 2-9 show the total flow rates calculated for the BHK backfill and waste control volumes in the different sections and concrete backfill degradation cases. Figure 2-8 shows that the degradation of the BHK backfill results in a general increase in the groundwater flow entering the vault. However, as shown in Figure 2-9, the flow through the BHK waste decreases by approximately 50–60 % when comparing the intact case to the degraded zone case. This is mainly because the degra ded outer zone creates a preferential flow path and, thus, reduces the flow reaching the waste. Nevertheless, for all the waste packages, the highest flow occurs when the concrete backfill is completely degraded.
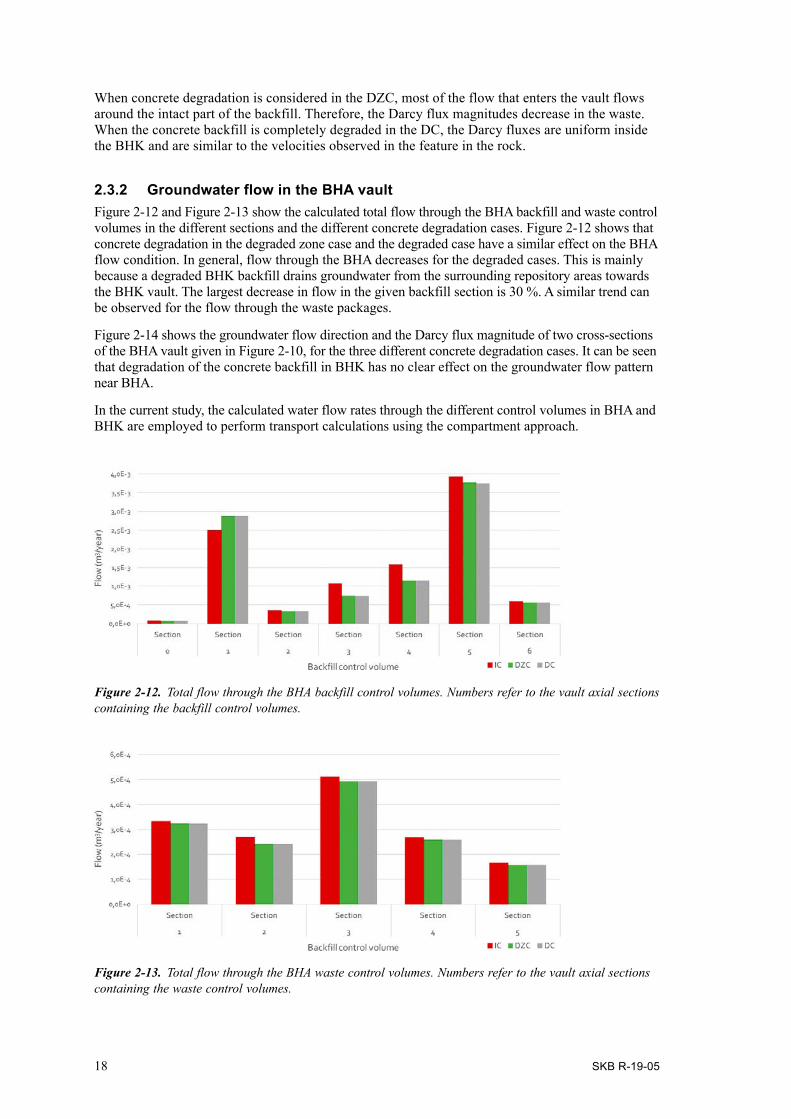
To analyse the local changes in the flow direction around the BHK vault, the groundwater flow is also displayed in longitudinal cut planes through the vault. The different planes are labelled in Figure 2-10 with the vault name and the Y coordinate of the plane.
Figure 2-11 shows the groundwater velocity vectors near the BHK vault. The groundwater flow in the BHK Y 7236 section is affected by the presence of a high permeability feature, called ST14, that crosses the vault (Abarca et al. 2019). The highest Darcy flux is found to be at ST14 in all three cases. For the intact case, higher flow velocities are observed in the waste than in the backfill. The higher Darcy flux inside the waste results from the combination of the high permeability of the waste and the 3D flow field.
Figure 2‑8. Total flow through the BHK backfill control volumes. Numbers refer to the vault axial sections containing the backfill control volumes.
Figure 2‑9. Total flow through the BHK waste control volumes. Numbers refer to the vault axial sections containing the waste control volumes.
SKB R-19-05 17
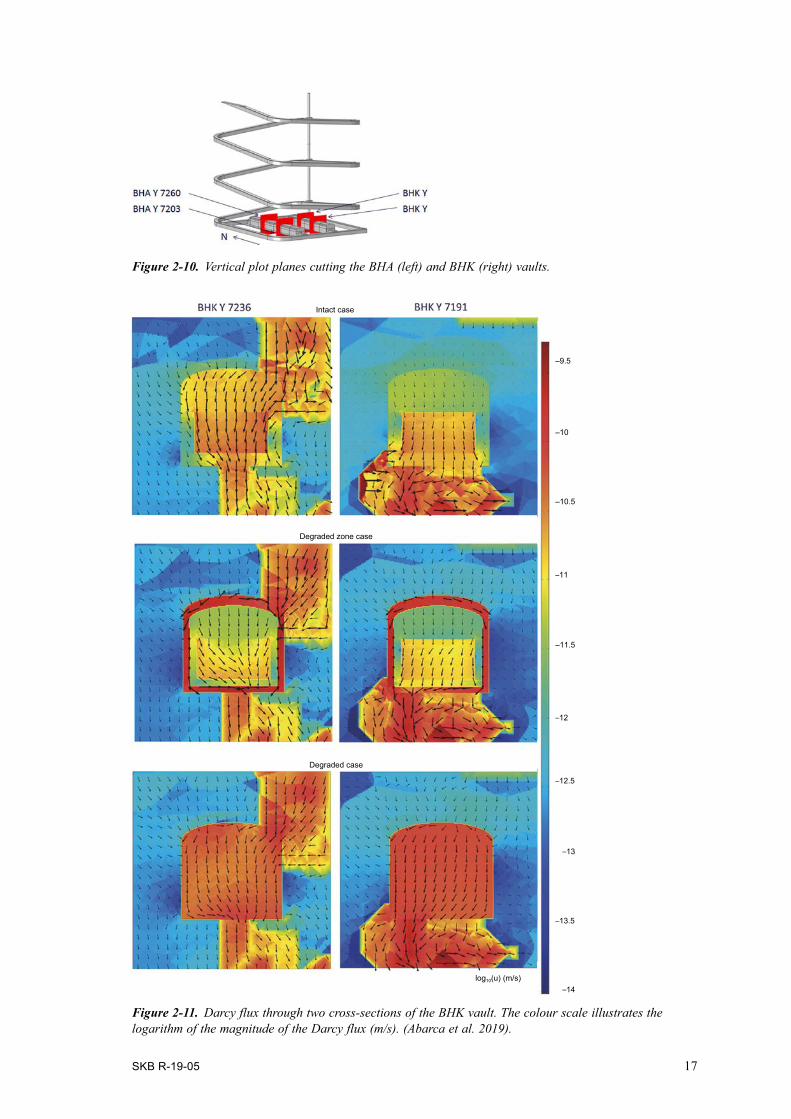
Figure 2‑10. Vertical plot planes cutting the BHA (left) and BHK (right) vaults.
–9.5
–10
–10.5
–11.5
–11
–12
log10(u) (m/s)
–12.5
–13
–13.5
–14
Degraded zone case
Degraded case
Intact case
Figure 2‑11. Darcy flux through two cross-sections of the BHK vault. The colour scale illustrates the logarithm of the magnitude of the Darcy flux (m/s). (Abarca et al. 2019).
18 SKB R-19-05
When concrete degradation is considered in the DZC, most of the flow that enters the vault flows around the intact part of the backfill. Therefore, the Darcy flux magnitudes decrease in the waste. When the concrete backfill is completely degraded in the DC, the Darcy fluxes are uniform inside the BHK and are similar to the velocities observed in the feature in the rock.
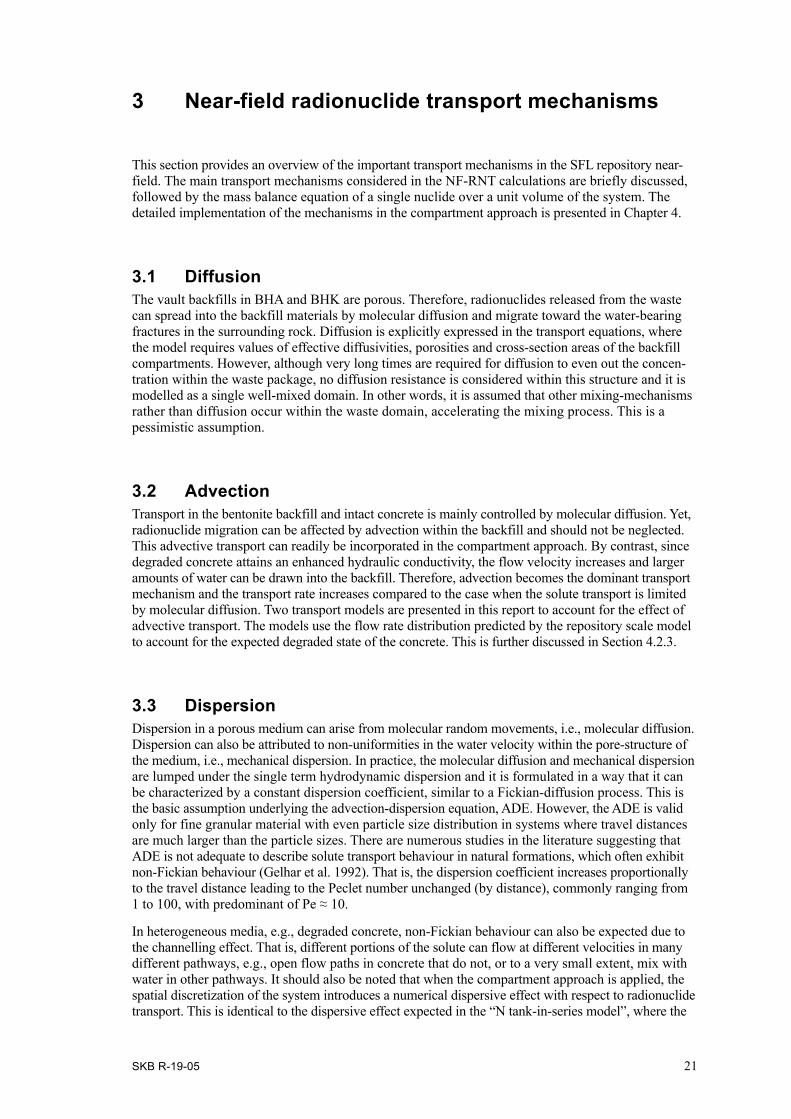
2.3.2 Groundwater flow in the BHA vaultFigure 2-12 and Figure 2-13 show the calculated total flow through the BHA backfill and waste control volumes in the different sections and the different concrete degradation cases. Figure 2-12 shows that concrete degradation in the degraded zone case and the degraded case have a similar effect on the BHA flow condition. In general, flow through the BHA decreases for the degraded cases. This is mainly because a degraded BHK backfill drains groundwater from the surrounding repository areas towards the BHK vault. The largest decrease in flow in the given backfill section is 30 %. A similar trend can be observed for the flow through the waste packages.
Figure 2-14 shows the groundwater flow direction and the Darcy flux magnitude of two cross-sections of the BHA vault given in Figure 2-10, for the three different concrete degradation cases. It can be seen that degradation of the concrete backfill in BHK has no clear effect on the groundwater flow pattern near BHA.
In the current study, the calculated water flow rates through the different control volumes in BHA and BHK are employed to perform transport calculations using the compartment approach.
Figure 2‑12. Total flow through the BHA backfill control volumes. Numbers refer to the vault axial sections containing the backfill control volumes.
Figure 2‑13. Total flow through the BHA waste control volumes. Numbers refer to the vault axial sections containing the waste control volumes.

SKB R-19-05 19
Figure 2‑14. Darcy flux through two cross-sections of the BHA vault. The colour scale illustrates the logarithm of the magnitude of the Darcy flux (m/s) (Abarca et al. 2019).
Intact case
Degraded zone case
Degraded case
log10(u) (m/s)

SKB R-19-05 21
3 Near-field radionuclide transport mechanisms
This section provides an overview of the important transport mechanisms in the SFL repository near-field. The main transport mechanisms considered in the NF-RNT calculations are briefly discussed, followed by the mass balance equation of a single nuclide over a unit volume of the system. The detailed implementation of the mechanisms in the compartment approach is presented in Chapter 4.
3.1 DiffusionThe vault backfills in BHA and BHK are porous. Therefore, radionuclides released from the waste can spread into the backfill materials by molecular diffusion and migrate toward the water-bearing fractures in the surrounding rock. Diffusion is explicitly expressed in the transport equations, where the model requires values of effective diffusivities, porosities and cross-section areas of the backfill compartments. However, although very long times are required for diffusion to even out the concen-tration within the waste package, no diffusion resistance is considered within this structure and it is modelled as a single well-mixed domain. In other words, it is assumed that other mixing-mechanisms rather than diffusion occur within the waste domain, accelerating the mixing process. This is a pessimistic assumption.
3.2 AdvectionTransport in the bentonite backfill and intact concrete is mainly controlled by molecular diffusion. Yet, radionuclide migration can be affected by advection within the backfill and should not be neglected. This advective transport can readily be incorporated in the compartment approach. By contrast, since degraded concrete attains an enhanced hydraulic conductivity, the flow velocity increases and larger amounts of water can be drawn into the backfill. Therefore, advection becomes the dominant transport mechanism and the transport rate increases compared to the case when the solute transport is limited by molecular diffusion. Two transport models are presented in this report to account for the effect of advective transport. The models use the flow rate distribution predicted by the repository scale model to account for the expected degraded state of the concrete. This is further discussed in Section 4.2.3.
3.3 DispersionDispersion in a porous medium can arise from molecular random movements, i.e., molecular diffusion. Dispersion can also be attributed to non-uniformities in the water velocity within the pore-structure of the medium, i.e., mechanical dispersion. In practice, the molecular diffusion and mechanical dispersion are lumped under the single term hydrodynamic dispersion and it is formulated in a way that it can be characterized by a constant dispersion coefficient, similar to a Fickian-diffusion process. This is the basic assumption underlying the advection-dispersion equation, ADE. However, the ADE is valid only for fine granular material with even particle size distribution in systems where travel distances are much larger than the particle sizes. There are numerous studies in the literature suggesting that ADE is not adequate to describe solute transport behaviour in natural formations, which often exhibit non-Fickian behaviour (Gelhar et al. 1992). That is, the dispersion coefficient increases proportionally to the travel distance leading to the Peclet number unchanged (by distance), commonly ranging from 1 to 100, with predominant of Pe ≈ 10.
In heterogeneous media, e.g., degraded concrete, non-Fickian behaviour can also be expected due to the channelling effect. That is, different portions of the solute can flow at different velocities in many different pathways, e.g., open flow paths in concrete that do not, or to a very small extent, mix with water in other pathways. It should also be noted that when the compartment approach is applied, the spatial discretization of the system introduces a numerical dispersive effect with respect to radionuclide transport. This is identical to the dispersive effect expected in the “N tank-in-series model”, where the
22 SKB R-19-05
Fickian dispersion can be characterized by Pe = 2 × Nc, where N indicates the number of compartments (Levenspiel 1999). For instance, if the expected Peclet number is Pe = 10, the use of five compartments will give a similar standard deviation. However, great caution must be exercised when choosing the number of compartments to ensure that the full-mixing condition is met.
In contrast to the transport by diffusion, dispersion is not explicitly accounted for in the compartment approach equations. Its effect is, instead, approximated by the numerical dispersion, Pe = 10~20.
3.4 SorptionMany of the dissolved radionuclides can sorb onto internal surfaces of the backfill and be withdrawn from the liquid phase. Therefore, they will have more time to decay. In this study, sorption on the near-field backfill materials is explicitly included in the equations assuming linear equilibrium sorption, which is parametrized by a constant sorption coefficient, Kd.
3.5 Radioactive decay and ingrowthRadionuclides may decay while travelling through a geological formation, but they may also be formed by ingrowth. Therefore, it is essential to account for these processes when evaluating radio-nuclide transport. If a radionuclide travel time is much longer than its half-life, and no ingrowth occurs, the nuclide can decay to very low activity levels before it reaches to the biosphere. By contrast, if the radionuclide is transported through fast-flow paths where travel times are shorter than its half-life, it can be released to the biosphere. In this case, a part of the initial radionuclide mass may still undergo substantial decay while being transported in other, slower paths. Radioactive decay and in-growth are well-known processes and are commonly modelled as first-order reactions parameterised with kinetic constants. This model is also used in this report to account for the effects of radioactive decay and ingrowth on radionuclide transport in the SFL repository near-field.
3.6 Corrosion of metallic waste componentsPart of the metallic wastes in the BHK vault contains radionuclides that are produced as a result of neu-tron activation of the steel during the operation of nuclear reactors. After the closure of the repository, these radionuclides within the metallic wastes are assumed to be released together with the corrosion products as the steel corrodes. This study assumes that all metal parts corrode by the same corrosion rate as that of stainless steel under alkaline and anoxic conditions.
3.7 Solubility limitsNo solubility limit is considered in this report. That is, all radionuclide species in the waste packages are assumed to be available for release. The only exception is the fraction in the BHK inventory where the radionuclides are released by corrosion.
3.8 The continuity equationAs discussed above, radionuclides that are released from the waste package spread into the backfill and experience different transport and retardation mechanisms. Provided that the near-field backfill can be represented by a continuous porous media, the mass balance equation is straightforward to set up. The transport equation can generally be expressed as (Fetter 1999).
(3-1)

SKB R-19-05 23
where:
ci (x) = Concentration of species i in the pore water as a function of Position x (Bq/m3).εi = Porosity of species i (–).λi = Decay constant of species i (1/s).ρbulk = Bulk density of the sorbing material i.e. concrete or bentonite (kg/m3).K i
d = Distribution coefficient for species i (m3/kg).Bri
m = Branching ratio from mother nuclide m to radionuclide i (–).Di
e = Effective diffusivity of species i (m2/s).uD = Darcy flux of the water (m/s).Ri
c = Release of R species i due to corrosion of metallic waste (Bq/s m3).Vj(ε i
j + K id ρbulk) = Capacity of compartment j for species i (m3).
(εm + K md ρbulk) Br i
m λicm = Ingrowth by mother nuclide m (Bq/s m3).
This equation is formulated to relate the concentration of a species i, ci(x), at any position x, to the processes that affect this concentration, including advection, diffusion, sorption, radioactive decay, ingrowth and release due to metal corrosion. The terms on the left-hand side of Equation (3-1) repre-sent the accumulation of the species in the water and solid by sorption, as well as radioactive decay and ingrowth. On the right-hand side, the first two terms describe diffusion and advection, respectively, and the third term represents the release from the waste by corrosion.

SKB R-19-05 25
4 Compartment approach
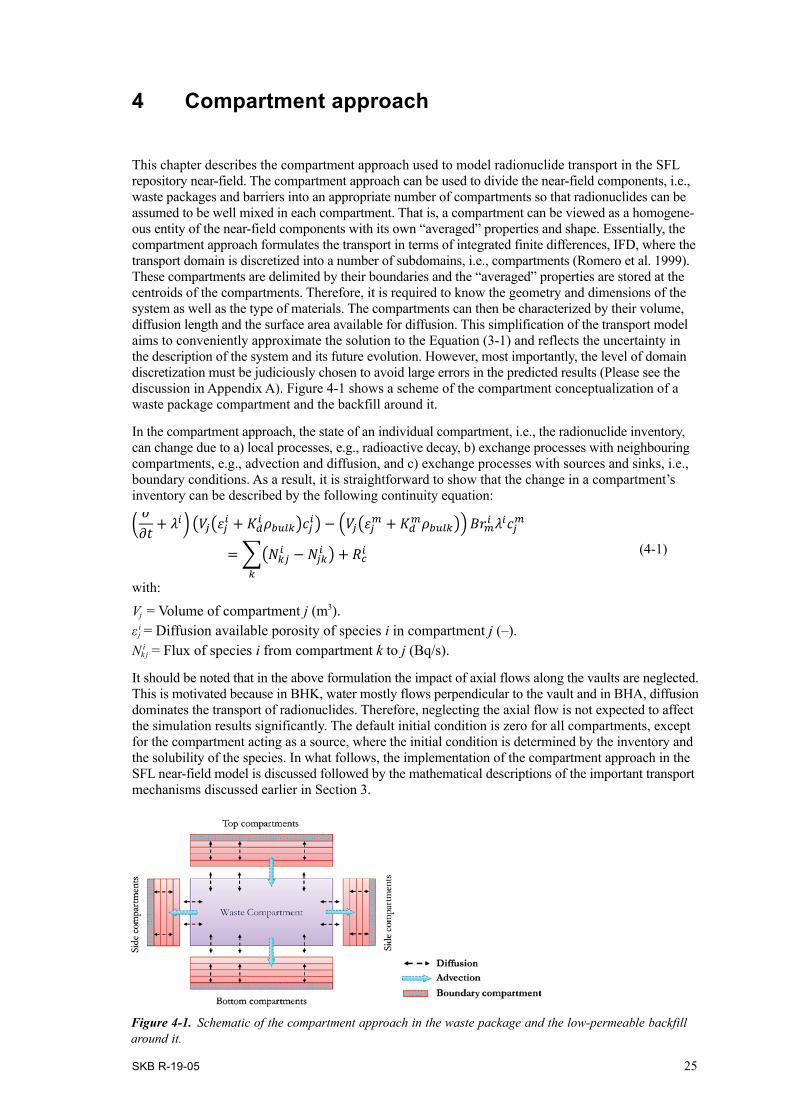
This chapter describes the compartment approach used to model radionuclide transport in the SFL repository near-field. The compartment approach can be used to divide the near-field components, i.e., waste packages and barriers into an appropriate number of compartments so that radionuclides can be assumed to be well mixed in each compartment. That is, a compartment can be viewed as a homogene-ous entity of the near-field components with its own “averaged” properties and shape. Essentially, the compartment approach formulates the transport in terms of integrated finite differences, IFD, where the transport domain is discretized into a number of subdomains, i.e., compartments (Romero et al. 1999). These compartments are delimited by their boundaries and the “averaged” properties are stored at the centroids of the compartments. Therefore, it is required to know the geometry and dimensions of the system as well as the type of materials. The compartments can then be characterized by their volume, diffusion length and the surface area available for diffusion. This simplification of the transport model aims to conveniently approximate the solution to the Equation (3-1) and reflects the uncertainty in the description of the system and its future evolution. However, most importantly, the level of domain discretization must be judiciously chosen to avoid large errors in the predicted results (Please see the discussion in Appendix A). Figure 4-1 shows a scheme of the compartment conceptualization of a waste package compartment and the backfill around it.
In the compartment approach, the state of an individual compartment, i.e., the radionuclide inventory, can change due to a) local processes, e.g., radioactive decay, b) exchange processes with neighbouring compartments, e.g., advection and diffusion, and c) exchange processes with sources and sinks, i.e., boundary conditions. As a result, it is straightforward to show that the change in a compartment’s inventory can be described by the following continuity equation:
� 𝜕𝜕𝜕𝜕𝜕𝜕 � 𝜆𝜆�� �𝑉𝑉����� � ���𝜌𝜌�����𝑐𝑐��� � �𝑉𝑉����� � ���𝜌𝜌������ 𝐵𝐵𝐵𝐵�� 𝜆𝜆�𝑐𝑐��
������� � ���� ��
� ��� (4-1)
with:
Vj = Volume of compartment j (m3).ε i
j = Diffusion available porosity of species i in compartment j (–).N i
k j = Flux of species i from compartment k to j (Bq/s).
It should be noted that in the above formulation the impact of axial flows along the vaults are neglected. This is motivated because in BHK, water mostly flows perpendicular to the vault and in BHA, diffusion dominates the transport of radionuclides. Therefore, neglecting the axial flow is not expected to affect the simulation results significantly. The default initial condition is zero for all compartments, except for the compartment acting as a source, where the initial condition is determined by the inventory and the solubility of the species. In what follows, the implementation of the compartment approach in the SFL near-field model is discussed followed by the mathematical descriptions of the important transport mechanisms discussed earlier in Section 3.
Figure 4‑1. Schematic of the compartment approach in the waste package and the low-permeable backfill around it.
26 SKB R-19-05
4.1 Capacity and retardation in a compartment with different materials
The capacity of compartment j for species i, Capij, is defined as:
𝐶𝐶𝐶𝐶𝑝𝑝�� � ������ � �� � ������ 𝜌𝜌�� (4-2)
where ϵj is the porosity of the sorbing material, e.g., cement, in compartment j, and ρp is the particle density in the compartment, defined as:
𝝆𝝆𝒑𝒑 � 𝝆𝝆𝒃𝒃𝒃𝒃𝒃𝒃𝒃𝒃���𝒋𝒋 (4-3)
The transport of radionuclides goes on in the diffusion available porosity, ε. For concrete, the whole physical porosity, ϵc, is available for transport. For bentonite, however, the whole physical porosity ϵb is only available for transport of cations. For anions, the diffusion available porosity, εb, is less than the physical porosity, εb = 0.174 (Shahkarami 2019).
For a mixed media like concrete, the radionuclides are assumed to sorb only onto the cement phase of the concrete. The amount of sorbed radionuclides per volume unit of the concrete can, therefore, be expressed as:
�� � �������� 𝑐𝑐𝑓𝑓�𝜌𝜌�𝑐𝑐� (4-4)
Where cfc is the weight fraction of cement in the concrete. In this report, cfc = 0.22 (Shahkarami 2019). Following this, the capacity of a compartment with concrete can be defined as:
𝐶𝐶𝐶𝐶𝑝𝑝�� � �𝑉𝑉����� � �� � �������� 𝑐𝑐𝑓𝑓�𝜌𝜌��� (4-5)
The amount of sorbed radionuclides within the waste domain is proportional to the distribution coef-ficient times the amount of sorbing material within the waste domain. The amount of radionuclides sorbed onto the cement in the grout within the waste domain and the cement in the concrete structure in the waste domain is given by:
��� ∙ 𝑐𝑐𝑐𝑐� ∙ 𝐾𝐾���� � ��� ∙ �� � ��� ∙ 𝜌𝜌� ∙ 𝑐𝑐𝑐𝑐� ∙ 𝐾𝐾���� � ∙ 𝑐𝑐� (4-6)
where:
Mg = Total amount of grout in the waste (kg).cfg = Cement fraction in the grout (–).K i
d,c = Distribution coefficient of cement (m3/kg).Vcs = Volume of the concrete structure (m3).ϵc = Physical porosity of the concrete (–).ρc = Particle density of the concrete (kg/m3).cfc = Cement fraction in the concrete (–).
The capacity of a compartment representing grouted waste within a concrete structure can then be described by:
𝐶𝐶𝐶𝐶𝑝𝑝� � ��𝜖𝜖� � �� ∙ 𝑐𝑐𝑐𝑐� ∙ 𝐾𝐾���� � ��� ∙ ��𝜖𝜖� � �� � 𝜖𝜖�� ∙ 𝜌𝜌� ∙ 𝑐𝑐𝑐𝑐� ∙ 𝐾𝐾���� � (4-7)
where:
Vw = Volume of the waste or volume inside the concrete structure (m3).ϵw = Porosity of the waste (–).
In this report, the total amount of grout in the waste in BHA and BHK are MgBHA = 8.65 × 10⁶ kg and
MgBHK = 5.42 × 10⁶ kg (Shahkarami 2019). It is assumed that cfg = 3.47 × 10⁻¹ and waste porosities
in BHA and BHK are ϵwBHA = 3.1 × 10⁻¹ and ϵw
BHK = 2.8 × 10⁻¹. It is also assumed that the concrete structure has the same properties as the concrete backfill.
SKB R-19-05 27
4.2 Transport in bentonite and concrete backfillsThe bentonite backfill in BHA has a very low hydraulic conductivity and transport is expected to be mostly driven by diffusion. By contrast, the intact concrete backfill in BHK is more permeable and allows larger amounts of water to seep through the vault and carry radionuclides with a much larger rate than they can escape by molecular diffusion. This weakened flow resistance can be observed by comparing the magnitude of Darcy flux in Figure 2-11 and Figure 2-14. When degraded, the concrete permeability largely increases, and this provides fast transport paths for radionuclides to escape from the vaults to the surrounding rock, as discussed earlier in Section 2.
A criterion based on the Péclet number, Pe, is used in this report to decide on the relative importance of advection and diffusion mechanisms in the vault backfills. The Péclet number is a dimensionless number that relates the effectiveness of mass transport by advection to the effectiveness of mass transport by diffusion (Huysmans and Dassargues 2005). This analysis is helpful since molecular diffusion is the only mixing mechanism in bentonite and concrete, in the absence of other dispersive mechanisms. The Pe, therefore, can provide a measure to estimate the degree of mixing in the compart-ments, noting that that the full-mixing condition is a prerequisite for using the compartment approach.
For reasonably homogeneous materials, the Pe is defined to be the ratio of the characteristic time for diffusive mixing, tdiff, to the characteristic time for advection, tadv. For a non-sorbing nuclide, the Pe can be expressed as:
(4-8)
where u is the velocity magnitude in the medium and L is the characteristic length. De and ε are the effective diffusion coefficient and the diffusion available porosity in the porous medium, respectively.
When the Péclet number is smaller than one, Pe < 1, the effect of diffusion exceeds that of advection in determining the overall mass flux. This suggests that diffusion dominates in the domain and the concentration may become equilibrated over a certain course of time, similar to a well-mixed tank. By contrast, a large Peclet number, Pe >> 1, indicates that transport mainly occurs by advection, similar to a plug flow reactor. However, advection only displaces the fluid in the absence of turbulent effects and can hardly add to the radionuclide mixing. Therefore, the full-mixing assumption is not expected to be satisfied in the backfill where transport occurs mainly by advection. Alternative models to address radionuclide transport within these domains are therefore required. In the following discussion, we explore the degree of advection/diffusion dominance in the bentonite and concrete backfill materials and address the implementation of diffusive and advective transport in the compartment approach.
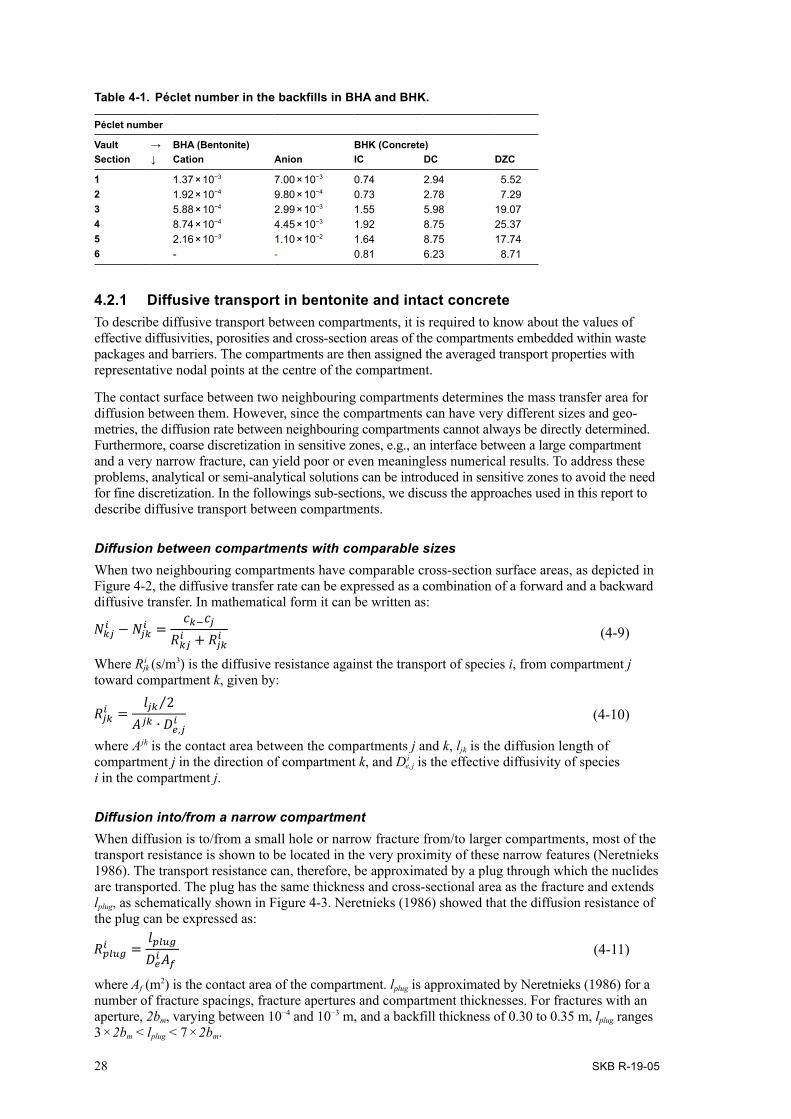
Given the spatial flow distribution in the BHA and BHK backfill (Figure 2-9 and Figure 2-13), as well as the backfill material properties (Table 2-1), the Péclet number in the bentonite, intact concrete and degraded concrete is evaluated and listed in Table 4-1. It can be seen that transport in the bentonite backfill is strongly driven by diffusion, with Pe << 1, both for anions and cations. It can, therefore, be inferred that over the period for the safety evaluation of the SFL repository, i.e., one million years, diffusion can even out the concentration within the transport domain, provided that the compartments are appropriately sized (see Appendix A).
The estimated Pe in the intact concrete backfill lie between one and four, 1 < Pe < 4, where the highest Pe are associated with the sections intersected by the high-permeable features, e.g., ST14. The Pe values suggest that advection and diffusion are comparably important and contribute equally to the radionuclide transport through the intact concrete. Therefore, compared to the bentonite backfill, finer discretization is required to attain full-mixing (by molecular diffusion) in the compartments associated with the intact concrete backfill (see Appendix A).
In contrast to the low-permeable bentonite and intact concrete, the degraded concrete in the BHK allows higher rates of water flow through the vault. The Pe number is, therefore, expected to show higher values. The estimated Pe in the degraded concrete is much larger than one, Pe >> 1, suggesting that the advection dominates and that the full-mixing condition can hardly, if ever, be attained in the degraded concrete backfill. This makes the applicability of the compartment approach questionable. Two alternative models are, therefore, presented in Section 4.2.3 to include the effect of strong advec-tive transport in degraded concrete backfill in the compartment approach.
28 SKB R-19-05
Table 4-1. Péclet number in the backfills in BHA and BHK.
Péclet number
Vault → BHA (Bentonite) BHK (Concrete)Section ↓ Cation Anion IC DC DZC
1 1.37 × 10⁻³ 7.00 × 10⁻³ 0.74 2.94 5.522 1.92 × 10⁻⁴ 9.80 × 10⁻⁴ 0.73 2.78 7.293 5.88 × 10⁻⁴ 2.99 × 10⁻³ 1.55 5.98 19.074 8.74 × 10⁻⁴ 4.45 × 10⁻³ 1.92 8.75 25.375 2.16 × 10⁻³ 1.10 × 10⁻² 1.64 8.75 17.746 - - 0.81 6.23 8.71
4.2.1 Diffusive transport in bentonite and intact concreteTo describe diffusive transport between compartments, it is required to know about the values of effective diffusivities, porosities and cross-section areas of the compartments embedded within waste packages and barriers. The compartments are then assigned the averaged transport properties with representative nodal points at the centre of the compartment.
The contact surface between two neighbouring compartments determines the mass transfer area for diffusion between them. However, since the compartments can have very different sizes and geo-metries, the diffusion rate between neighbouring compartments cannot always be directly determined. Furthermore, coarse discretization in sensitive zones, e.g., an interface between a large compartment and a very narrow fracture, can yield poor or even meaningless numerical results. To address these problems, analytical or semi-analytical solutions can be introduced in sensitive zones to avoid the need for fine discretization. In the followings sub-sections, we discuss the approaches used in this report to describe diffusive transport between compartments.
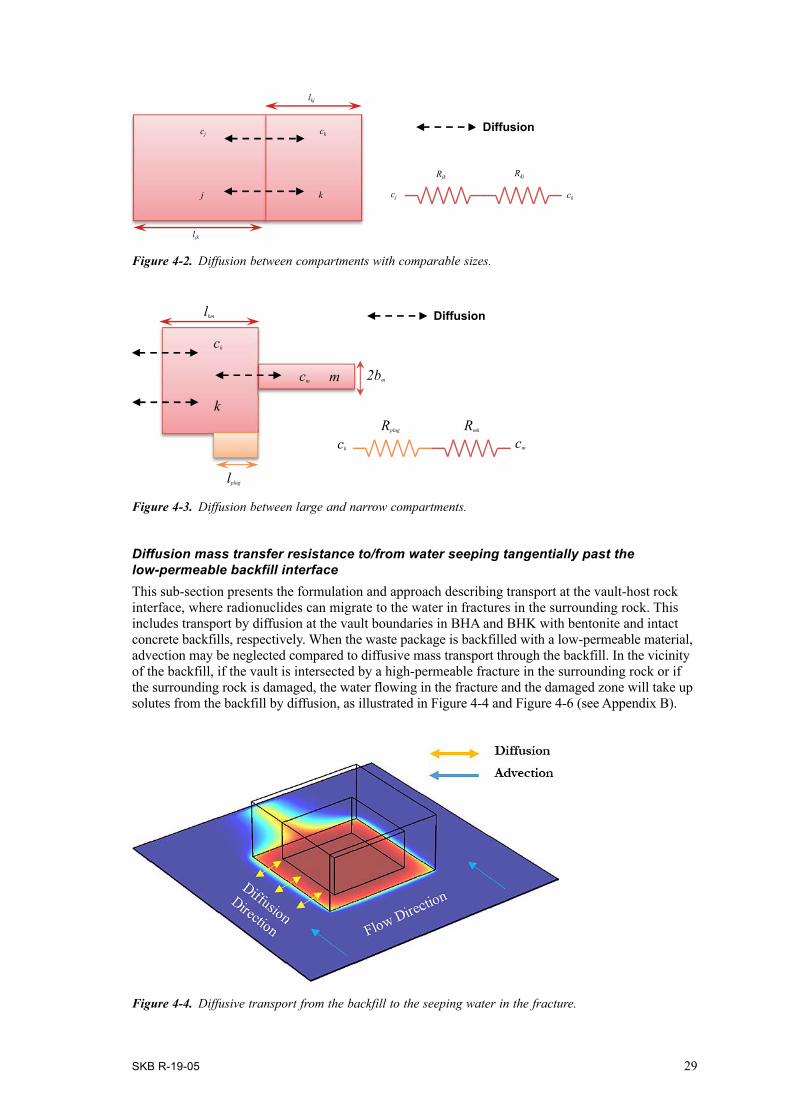
Diffusion between compartments with comparable sizesWhen two neighbouring compartments have comparable cross-section surface areas, as depicted in Figure 4-2, the diffusive transfer rate can be expressed as a combination of a forward and a backward diffusive transfer. In mathematical form it can be written as:
(4-9)
Where Rijk (s/m3) is the diffusive resistance against the transport of species i, from compartment j
toward compartment k, given by:
(4-10)
where Ajk is the contact area between the compartments j and k, ljk is the diffusion length of compartment j in the direction of compartment k, and Di
e,j is the effective diffusivity of species i in the compartment j.
Diffusion into/from a narrow compartmentWhen diffusion is to/from a small hole or narrow fracture from/to larger compartments, most of the transport resistance is shown to be located in the very proximity of these narrow features (Neretnieks 1986). The transport resistance can, therefore, be approximated by a plug through which the nuclides are transported. The plug has the same thickness and cross-sectional area as the fracture and extends lplug, as schematically shown in Figure 4-3. Neretnieks (1986) showed that the diffusion resistance of the plug can be expressed as:
(4-11)
where Af (m2) is the contact area of the compartment. lplug is approximated by Neretnieks (1986) for a number of fracture spacings, fracture apertures and compartment thicknesses. For fractures with an aperture, 2bm, varying between 10−4 and 10−3 m, and a backfill thickness of 0.30 to 0.35 m, lplug ranges 3 × 2bm < lplug < 7 × 2bm.
SKB R-19-05 29
Diffusion mass transfer resistance to/from water seeping tangentially past the low-permeable backfill interfaceThis sub-section presents the formulation and approach describing transport at the vault-host rock interface, where radionuclides can migrate to the water in fractures in the surrounding rock. This includes transport by diffusion at the vault boundaries in BHA and BHK with bentonite and intact concrete backfills, respectively. When the waste package is backfilled with a low-permeable material, advection may be neglected compared to diffusive mass transport through the backfill. In the vicinity of the backfill, if the vault is intersected by a high-permeable fracture in the surrounding rock or if the surrounding rock is damaged, the water flowing in the fracture and the damaged zone will take up solutes from the backfill by diffusion, as illustrated in Figure 4-4 and Figure 4-6 (see Appendix B).
Figure 4‑2. Diffusion between compartments with comparable sizes.
Figure 4‑3. Diffusion between large and narrow compartments.
Figure 4‑4. Diffusive transport from the backfill to the seeping water in the fracture.
lplug
k
cm m
ck
Rplug
Diffusion
Rmk
lkm
ck cm
2bm
j k
cj ck
lkj
Diffusion
Rjk Rkj
cj ck
ljk
30 SKB R-19-05
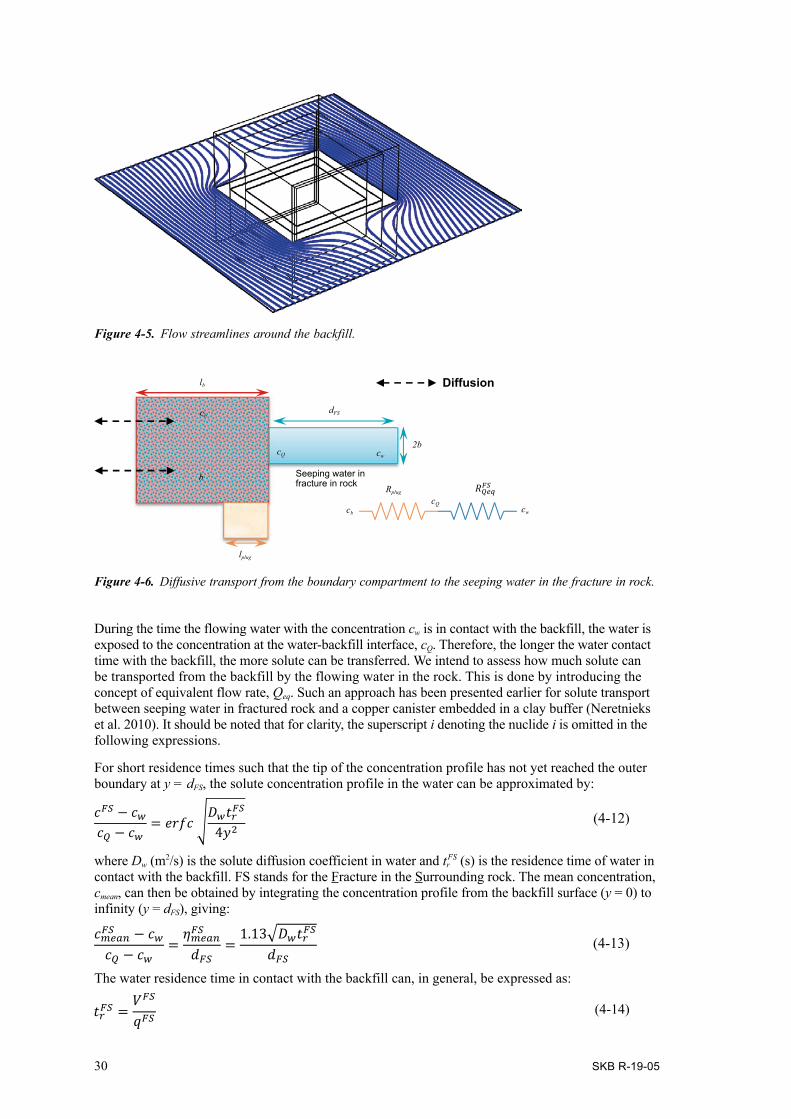
During the time the flowing water with the concentration cw is in contact with the backfill, the water is exposed to the concentration at the water-backfill interface, cQ. Therefore, the longer the water contact time with the backfill, the more solute can be transferred. We intend to assess how much solute can be transported from the backfill by the flowing water in the rock. This is done by introducing the concept of equivalent flow rate, Qeq. Such an approach has been presented earlier for solute transport between seeping water in fractured rock and a copper canister embedded in a clay buffer (Neretnieks et al. 2010). It should be noted that for clarity, the superscript i denoting the nuclide i is omitted in the following expressions.
For short residence times such that the tip of the concentration profile has not yet reached the outer boundary at y = dFS, the solute concentration profile in the water can be approximated by:
(4-12)
where Dw (m2/s) is the solute diffusion coefficient in water and trFS (s) is the residence time of water in
contact with the backfill. FS stands for the Fracture in the Surrounding rock. The mean concentration, cmean, can then be obtained by integrating the concentration profile from the backfill surface (y = 0) to infinity (y = dFS), giving:
(4-13)
The water residence time in contact with the backfill can, in general, be expressed as:
(4-14)
Figure 4‑5. Flow streamlines around the backfill.
Figure 4‑6. Diffusive transport from the boundary compartment to the seeping water in the fracture in rock.
lplug
Diffusion lb
b
2b
cb
Rplug
cb cw
Seeping water infracture in rock
cQ
dFS
cwcQ
SKB R-19-05 31
where V FS (m3) is the available volume for water to flow around the backfill and qFS (m3/s) is the water flow rate in the fracture in the surrounding rock. In the above model, the backfill material is assumed to be much less permeable than the fracture. Therefore, flowing water accesses only the volume of the fracture around the backfill and cannot spread out upward and downward in the backfill. The water residence time can, thus, be approximated by:
(4-15)
with
(4-16)
where A (m2) is the cross-section area of the fracture in the direction of the flow. SFS (m2) is the cross-section area of the backfill, rFS (m) is the radius of an equivalent cylinder that has the same surface area as that of the backfill, S FS, and uFS (m/s) is the velocity of the flowing water in the fracture in the surrounding rock. The mean penetration depth of the solute into the flowing water can then be obtained from:
(4-17)
where η FSmean (m) is the mean distance into the flowing water that can exchange solute with the backfill
during the contact time between the water and the backfill. The width of the lighter-coloured region downstream of the waste package in Figure 4-4 illustrates the meaning of penetration depth, one from each side of the backfill. The water flow rate in this width, i.e., η FS
mean , has taken up the solute. This is called the equivalent flow rate, Q FS
eq (m3/s), and can be expressed as:
(4-18)
or equivalently:
(4-19)
Where bFS (m) is the fracture half-aperture. The rate of transport, N FS (Bq/s), is proportional to the concentration difference and inversely proportional to the solute transport resistance RFS
eq. That is:
(4-20)
The total diffusive transport rate to the host rock can, hence, be determined by:
(4-21)
Equations (4-12) and (4-17) are valid only if the dimensionless time , or equivalently, when η FS
mean is about four times smaller than the dFS. It should be emphasized that when the dimensionless time τFS ≥ 1, molecular diffusion can effectively even out the concentration in the direction of diffusion, i.e., cFS
mean = cQ. The equivalent flow rate can, therefore, be approximated to be Q FS
eq = qFS. In this study, for mathematical convenience, it is assumed that the water flowing around the backfill is essentially equilibrated with the surface concentration, cQ, provided that τFS ≥ 0.065. This is a pessimistic assumption.
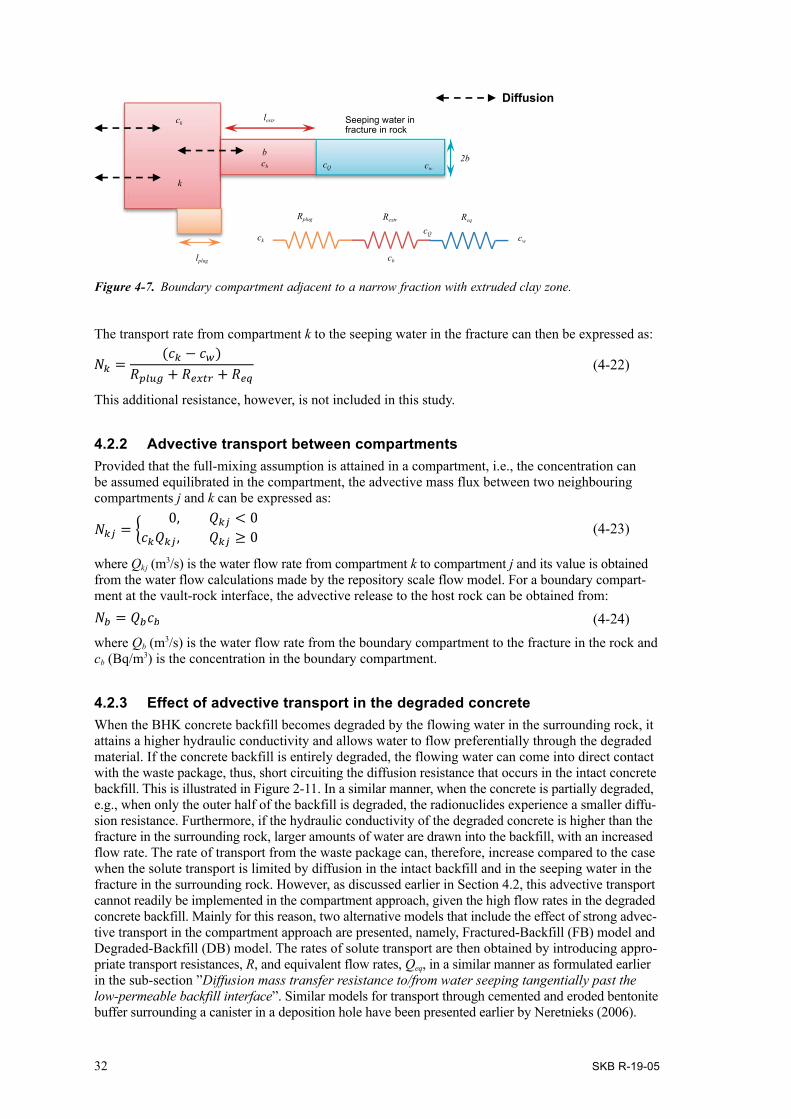
Diffusion in bentonite buffer that has intruded the fracture in the rockAn additional resistance can contribute to the transport resistance in the bentonite backfill, caused by intrusion of the expanding clay buffer into the fracture. Some field experiments have shown that the clay rapidly, in a matter of weeks to months, expands into the slot with seeping water. The clay is not carried away by the water but forms a stagnant diffusion barrier. At present, little is known about the extent of this intruded zone. However, if such data are available, the additional resistance can readily be included in the near-field model by representing the stagnant buffer zone with a compartment, as schematically illustrated in Figure 4-7.
32 SKB R-19-05
The transport rate from compartment k to the seeping water in the fracture can then be expressed as:
(4-22)
This additional resistance, however, is not included in this study.
4.2.2 Advective transport between compartmentsProvided that the full-mixing assumption is attained in a compartment, i.e., the concentration can be assumed equilibrated in the compartment, the advective mass flux between two neighbouring compartments j and k can be expressed as:
(4-23)
where Qkj (m3/s) is the water flow rate from compartment k to compartment j and its value is obtained from the water flow calculations made by the repository scale flow model. For a boundary compart-ment at the vault-rock interface, the advective release to the host rock can be obtained from:
(4-24)where Qb (m3/s) is the water flow rate from the boundary compartment to the fracture in the rock and cb (Bq/m3) is the concentration in the boundary compartment.
4.2.3 Effect of advective transport in the degraded concreteWhen the BHK concrete backfill becomes degraded by the flowing water in the surrounding rock, it attains a higher hydraulic conductivity and allows water to flow preferentially through the degraded material. If the concrete backfill is entirely degraded, the flowing water can come into direct contact with the waste package, thus, short circuiting the diffusion resistance that occurs in the intact concrete backfill. This is illustrated in Figure 2-11. In a similar manner, when the concrete is partially degraded, e.g., when only the outer half of the backfill is degraded, the radionuclides experience a smaller diffu-sion resistance. Furthermore, if the hydraulic conductivity of the degraded concrete is higher than the fracture in the surrounding rock, larger amounts of water are drawn into the backfill, with an increased flow rate. The rate of transport from the waste package can, therefore, increase compared to the case when the solute transport is limited by diffusion in the intact backfill and in the seeping water in the fracture in the surrounding rock. However, as discussed earlier in Section 4.2, this advective transport cannot readily be implemented in the compartment approach, given the high flow rates in the degraded concrete backfill. Mainly for this reason, two alternative models that include the effect of strong advec-tive transport in the compartment approach are presented, namely, Fractured-Backfill (FB) model and Degraded-Backfill (DB) model. The rates of solute transport are then obtained by introducing appro-priate transport resistances, R, and equivalent flow rates, Qeq, in a similar manner as formulated earlier in the sub-section ”Diffusion mass transfer resistance to/from water seeping tangentially past the low-permeable backfill interface”. Similar models for transport through cemented and eroded bentonite buffer surrounding a canister in a deposition hole have been presented earlier by Neretnieks (2006).
Figure 4‑7. Boundary compartment adjacent to a narrow fraction with extruded clay zone.
k
Diffusion
b
ck
cb
lextr
Rplug Rextr
ck
Seeping water infracture in rock
cQ2b
cQ
cw
cw
Req
cblplug
SKB R-19-05 33
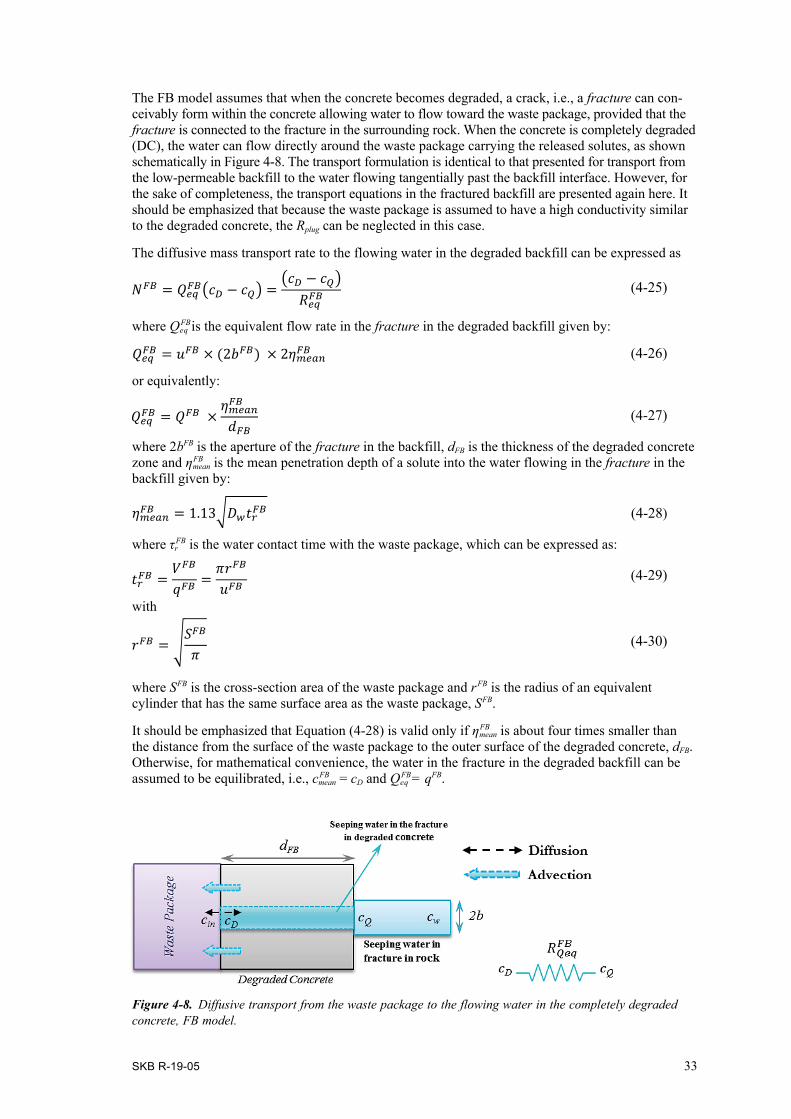
The FB model assumes that when the concrete becomes degraded, a crack, i.e., a fracture can con-ceivably form within the concrete allowing water to flow toward the waste package, provided that the fracture is connected to the fracture in the surrounding rock. When the concrete is completely degraded (DC), the water can flow directly around the waste package carrying the released solutes, as shown schematically in Figure 4-8. The transport formulation is identical to that presented for transport from the low-permeable backfill to the water flowing tangentially past the backfill interface. However, for the sake of completeness, the transport equations in the fractured backfill are presented again here. It should be emphasized that because the waste package is assumed to have a high conductivity similar to the degraded concrete, the Rplug can be neglected in this case.
The diffusive mass transport rate to the flowing water in the degraded backfill can be expressed as
(4-25)
where QFBeq is the equivalent flow rate in the fracture in the degraded backfill given by:
(4-26)
or equivalently:
(4-27)
where 2bFB is the aperture of the fracture in the backfill, dFB is the thickness of the degraded concrete zone and ηFB
mean is the mean penetration depth of a solute into the water flowing in the fracture in the backfill given by:
(4-28)
where τrFB is the water contact time with the waste package, which can be expressed as:
(4-29)
with
(4-30)
where SFB is the cross-section area of the waste package and rFB is the radius of an equivalent cylinder that has the same surface area as the waste package, SFB.
It should be emphasized that Equation (4-28) is valid only if ηFBmean is about four times smaller than
the distance from the surface of the waste package to the outer surface of the degraded concrete, dFB. Otherwise, for mathematical convenience, the water in the fracture in the degraded backfill can be assumed to be equilibrated, i.e., cFB
mean = cD and QFBeq = qFB.
Figure 4‑8. Diffusive transport from the waste package to the flowing water in the completely degraded concrete, FB model.
34 SKB R-19-05
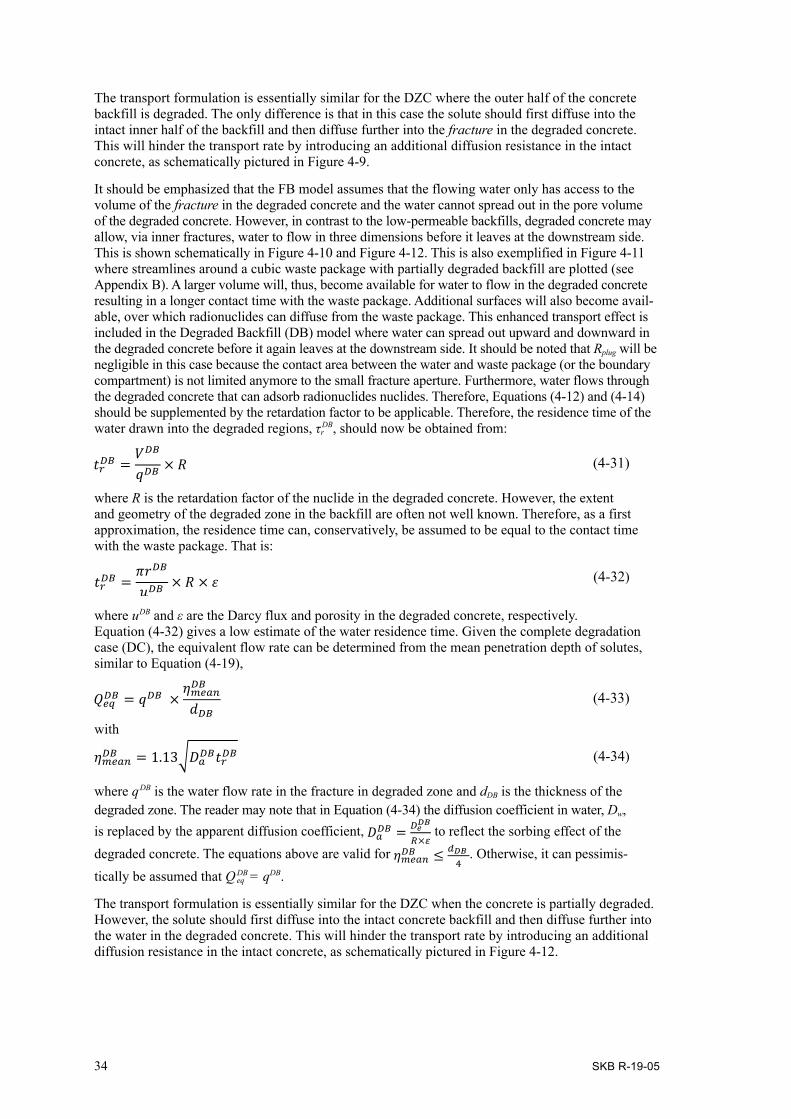
The transport formulation is essentially similar for the DZC where the outer half of the concrete backfill is degraded. The only difference is that in this case the solute should first diffuse into the intact inner half of the backfill and then diffuse further into the fracture in the degraded concrete. This will hinder the transport rate by introducing an additional diffusion resistance in the intact concrete, as schematically pictured in Figure 4-9.
It should be emphasized that the FB model assumes that the flowing water only has access to the volume of the fracture in the degraded concrete and the water cannot spread out in the pore volume of the degraded concrete. However, in contrast to the low-permeable backfills, degraded concrete may allow, via inner fractures, water to flow in three dimensions before it leaves at the downstream side. This is shown schematically in Figure 4-10 and Figure 4-12. This is also exemplified in Figure 4-11 where streamlines around a cubic waste package with partially degraded backfill are plotted (see Appendix B). A larger volume will, thus, become available for water to flow in the degraded concrete resulting in a longer contact time with the waste package. Additional surfaces will also become avail-able, over which radionuclides can diffuse from the waste package. This enhanced transport effect is included in the Degraded Backfill (DB) model where water can spread out upward and downward in the degraded concrete before it again leaves at the downstream side. It should be noted that Rplug will be negligible in this case because the contact area between the water and waste package (or the boundary compartment) is not limited anymore to the small fracture aperture. Furthermore, water flows through the degraded concrete that can adsorb radionuclides nuclides. Therefore, Equations (4-12) and (4-14) should be supplemented by the retardation factor to be applicable. Therefore, the residence time of the water drawn into the degraded regions, τr
DB, should now be obtained from:
(4-31)
where R is the retardation factor of the nuclide in the degraded concrete. However, the extent and geometry of the degraded zone in the backfill are often not well known. Therefore, as a first approximation, the residence time can, conservatively, be assumed to be equal to the contact time with the waste package. That is:
(4-32)
where uDB and ε are the Darcy flux and porosity in the degraded concrete, respectively. Equation (4-32) gives a low estimate of the water residence time. Given the complete degradation case (DC), the equivalent flow rate can be determined from the mean penetration depth of solutes, similar to Equation (4-19),
(4-33)
with
(4-34)
where qDB is the water flow rate in the fracture in degraded zone and dDB is the thickness of the degraded zone. The reader may note that in Equation (4-34) the diffusion coefficient in water, Dw, is replaced by the apparent diffusion coefficient, to reflect the sorbing effect of the degraded concrete. The equations above are valid for . Otherwise, it can pessimis-tically be assumed that Q DB
eq = qDB.
The transport formulation is essentially similar for the DZC when the concrete is partially degraded. However, the solute should first diffuse into the intact concrete backfill and then diffuse further into the water in the degraded concrete. This will hinder the transport rate by introducing an additional diffusion resistance in the intact concrete, as schematically pictured in Figure 4-12.

SKB R-19-05 35
Figure 4‑9. Diffusive transport from the waste package to the flowing water in the partially degraded concrete, FB model.
Figure 4‑10. Diffusive transport from the waste package to the flowing water in the completely degraded concrete, DB model.
Figure 4‑11. Simulated streamlines around the waste package when the concrete backfill is partially degraded.
Figure 4‑12. Diffusive transport from the waste package to the flowing water in the partially degraded concrete, DB model.
2b
Was
te P
acka
ge
(WP)
Diffusion DegradedConcrete
k
cw
IntactConcrete
cQcD
Seeping water in thefracture in degradedconcrete
cin ck
cin cQcD
RkWP
Seeping water infracture in rock
ck
Rkplug
lplug
Was
te P
acka
ge
Diffusion
cw 2b cin cQ
cDDegraded Concrete
Seeping water in the fracture indegraded concrete dDB
cD
cQ
Seeping water infracture in rock
2b
Was
te P
acka
ge
(WP)
Diffusion DegradedConcrete
k
cw
IntactConcrete
cQcD
Seeping water in thefracture in degradedconcrete
cin cQ ck
cin cQcD
RkWPSeeping water infracture in rock
36 SKB R-19-05
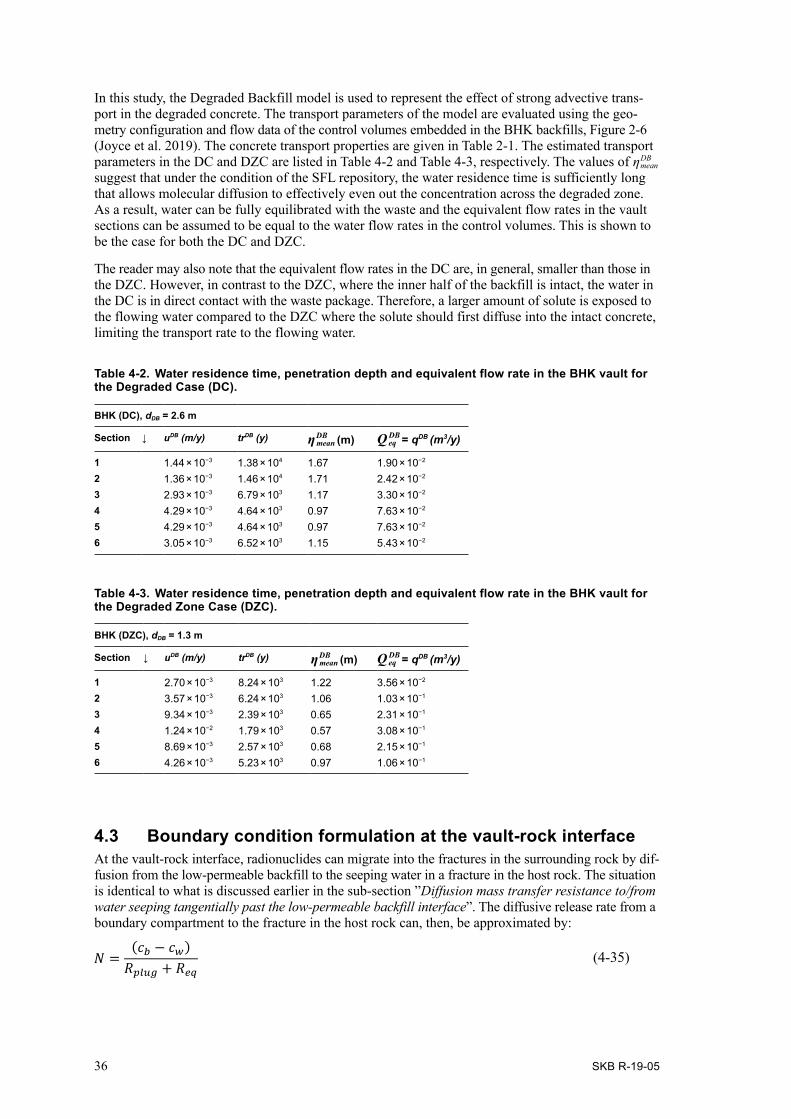
In this study, the Degraded Backfill model is used to represent the effect of strong advective trans-port in the degraded concrete. The transport parameters of the model are evaluated using the geo-metry configuration and flow data of the control volumes embedded in the BHK backfills, Figure 2-6 (Joyce et al. 2019). The concrete transport properties are given in Table 2-1. The estimated transport parameters in the DC and DZC are listed in Table 4-2 and Table 4-3, respectively. The values of ηDB
mean suggest that under the condition of the SFL repository, the water residence time is sufficiently long that allows molecular diffusion to effectively even out the concentration across the degraded zone. As a result, water can be fully equilibrated with the waste and the equivalent flow rates in the vault sections can be assumed to be equal to the water flow rates in the control volumes. This is shown to be the case for both the DC and DZC.
The reader may also note that the equivalent flow rates in the DC are, in general, smaller than those in the DZC. However, in contrast to the DZC, where the inner half of the backfill is intact, the water in the DC is in direct contact with the waste package. Therefore, a larger amount of solute is exposed to the flowing water compared to the DZC where the solute should first diffuse into the intact concrete, limiting the transport rate to the flowing water.
Table 4-2. Water residence time, penetration depth and equivalent flow rate in the BHK vault for the Degraded Case (DC).
BHK (DC), dDB = 2.6 m
Section ↓ uDB (m/y) trDB (y) ηDBmean (m) Q DB
eq = qDB (m3/y)
1 1.44 × 10⁻³ 1.38 × 10⁴ 1.67 1.90 × 10⁻²
2 1.36 × 10⁻³ 1.46 × 10⁴ 1.71 2.42 × 10⁻²
3 2.93 × 10⁻³ 6.79 × 10³ 1.17 3.30 × 10⁻²
4 4.29 × 10⁻³ 4.64 × 10³ 0.97 7.63 × 10⁻²
5 4.29 × 10⁻³ 4.64 × 10³ 0.97 7.63 × 10⁻²
6 3.05 × 10⁻³ 6.52 × 10³ 1.15 5.43 × 10⁻²
Table 4-3. Water residence time, penetration depth and equivalent flow rate in the BHK vault for the Degraded Zone Case (DZC).
BHK (DZC), dDB = 1.3 m
Section ↓ uDB (m/y) trDB (y) ηDBmean (m) Q DB
eq = qDB (m3/y)
1 2.70 × 10⁻³ 8.24 × 10³ 1.22 3.56 × 10⁻²
2 3.57 × 10⁻³ 6.24 × 10³ 1.06 1.03 × 10⁻¹
3 9.34 × 10⁻³ 2.39 × 10³ 0.65 2.31 × 10⁻¹
4 1.24 × 10⁻² 1.79 × 10³ 0.57 3.08 × 10⁻¹
5 8.69 × 10⁻³ 2.57 × 10³ 0.68 2.15 × 10⁻¹
6 4.26 × 10⁻³ 5.23 × 10³ 0.97 1.06 × 10⁻¹
4.3 Boundary condition formulation at the vault-rock interfaceAt the vault-rock interface, radionuclides can migrate into the fractures in the surrounding rock by dif-fusion from the low-permeable backfill to the seeping water in a fracture in the host rock. The situation is identical to what is discussed earlier in the sub-section ”Diffusion mass transfer resistance to/from water seeping tangentially past the low-permeable backfill interface”. The diffusive release rate from a boundary compartment to the fracture in the host rock can, then, be approximated by:
(4-35)
SKB R-19-05 37
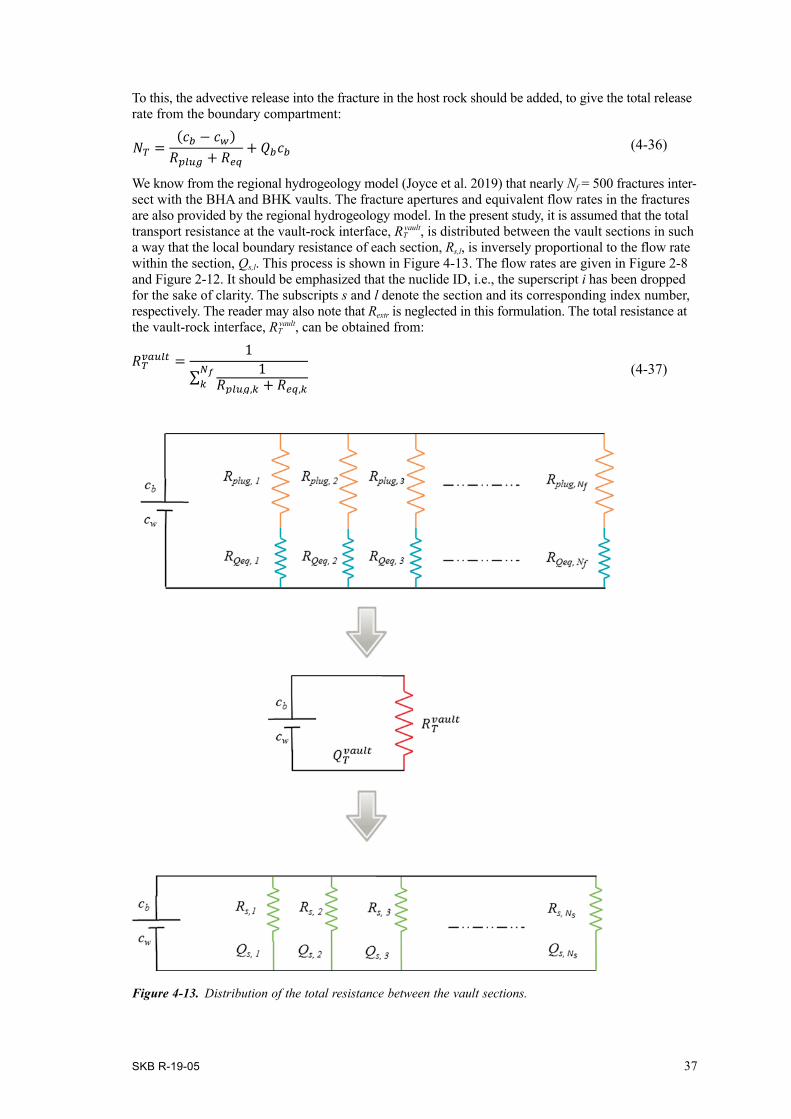
To this, the advective release into the fracture in the host rock should be added, to give the total release rate from the boundary compartment:
(4-36)
We know from the regional hydrogeology model (Joyce et al. 2019) that nearly Nf = 500 fractures inter-sect with the BHA and BHK vaults. The fracture apertures and equivalent flow rates in the fractures are also provided by the regional hydrogeology model. In the present study, it is assumed that the total transport resistance at the vault-rock interface, RT
vault, is distributed between the vault sections in such a way that the local boundary resistance of each section, Rs,l, is inversely proportional to the flow rate within the section, Qs,l. This process is shown in Figure 4-13. The flow rates are given in Figure 2-8 and Figure 2-12. It should be emphasized that the nuclide ID, i.e., the superscript i has been dropped for the sake of clarity. The subscripts s and l denote the section and its corresponding index number, respectively. The reader may also note that Rextr is neglected in this formulation. The total resistance at the vault-rock interface, RT
vault, can be obtained from:
(4-37)
Figure 4‑13. Distribution of the total resistance between the vault sections.
38 SKB R-19-05
Hence, the local boundary resistance for each section can be expressed as:
(4-38)
with
(4-39)
and
(4-40)
The total transport rate from the backfill (all sections) to the host rock can then be approximated as:
(4-41)
where cb,l is the concentration in the boundary compartment of section l. The above formulation applies to both BHA and BHK, with the latter backfilled with intact concrete, i.e., the IC. When concrete gradually degrades in the DZC and DC, the boundary diffusive transport rates should be estimated using the formulae provided in Section 4.2.3.
From each vault, groundwater that carries radionuclides flows into the host rock in a number of trajec-tories. Distribution of the total radionuclide release from the near-field over the host rock trajectories will be done by assigning a source term distribution factor to each such trajectory and multiplying this distribution factor by the vault’s total release rate (Shahkarami 2019).
It should also be emphasized that, in contrast to the BHA vault where it is plausible to assume an ideal interface between the bentonite and rock, the geometrical characteristics of the rock-backfill interface in BKH vault are not well known. One possible complication that may arise is that a dam-aged (spalling) zone appears at the rock-(intact) concrete interface during the construction period. This can lead to an increase in the mass transfer between the surrounding rock and the backfill. The enhanced transport rate should then be accounted for by the Degraded Backfill (DB) model. Another possible complication that may arise is the formation of stagnant water zones at the rock-concrete interface, due to the geometrical irregularities that exist at the interface. Therefore, radionuclides should, first, diffuse into the pool of stagnant water and then find their way toward the fractures in the host rock adjacent to the water body. To account for this retarding effect, each stagnant water zone can be viewed as an extra buffer compartment with the diffusive resistance of:
(4-42)
where Aswz is the contact area between the stagnant water zone and the boundary compartment, dswz is the diffusion length in the stagnant water zone, and De,s is the diffusivity in the stagnant water zone.
4.4 Release of radionuclide due to the corrosion of metallic waste components
Part of the waste that is planned to be stored in the BHK vault contains metallic components with neutron-induced activity. The radionuclides within the metallic waste are assumed to be released from the components by corrosion at a constant rate. For this study, the corrosion rate of steel within the waste domain is assumed to be 1 × 10⁻⁸ m/year. This corrosion rate corresponds to the corrosion rate of stainless steel given in SKB (2019a).
The radionuclide release rate is determined by the corrosion rate, thickness of the metal components, and corrosion time Tl. The latter is the time that the metal components are assumed to be fully cor-roded, depending on their thickness. The metal components are categorized in three different groups with increasing thickness,
SKB R-19-05 39
• Component thickness of 1–10 mm with release time of 50 000 years.• Component thickness of 10–20 mm with release time of 500 000 years.• Component thickness of more than 20 mm with release time of 1 000 000 years.
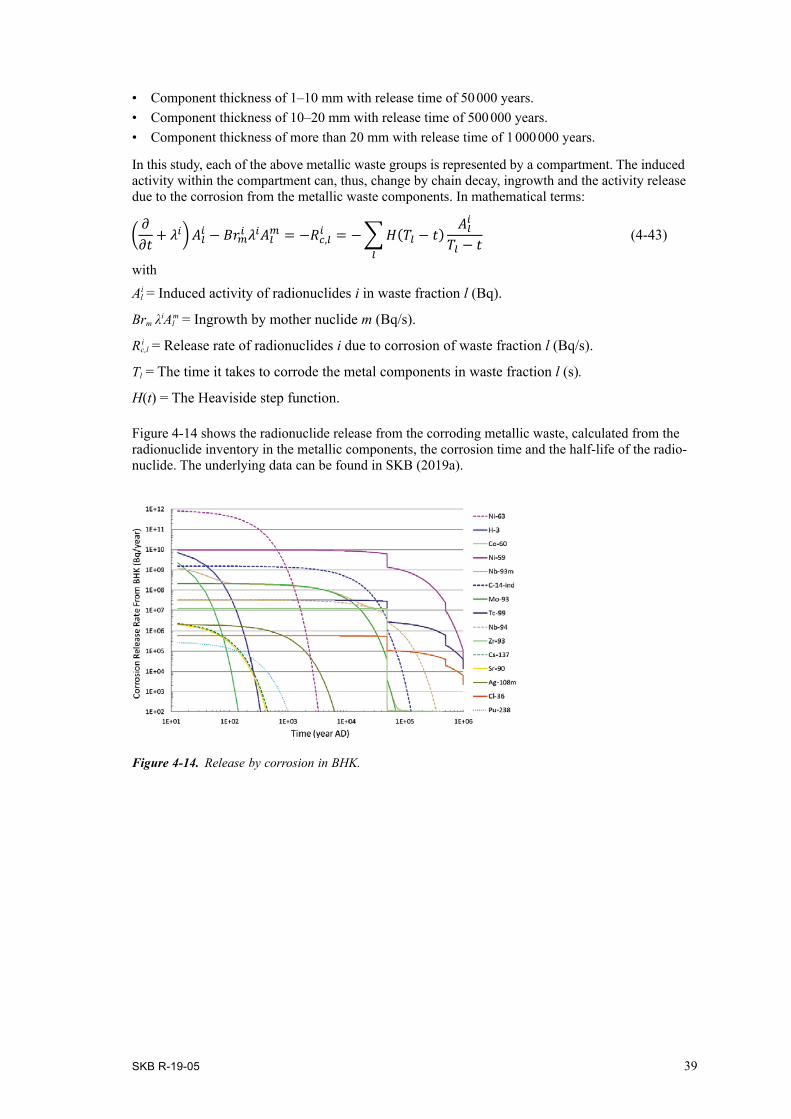
In this study, each of the above metallic waste groups is represented by a compartment. The induced activity within the compartment can, thus, change by chain decay, ingrowth and the activity release due to the corrosion from the metallic waste components. In mathematical terms:
(4-43)
with
Ail = Induced activity of radionuclides i in waste fraction l (Bq).
Brm λiAlm = Ingrowth by mother nuclide m (Bq/s).
Ric,l = Release rate of radionuclides i due to corrosion of waste fraction l (Bq/s).
Tl = The time it takes to corrode the metal components in waste fraction l (s).
H(t) = The Heaviside step function.
Figure 4-14 shows the radionuclide release from the corroding metallic waste, calculated from the radionuclide inventory in the metallic components, the corrosion time and the half-life of the radio-nuclide. The underlying data can be found in SKB (2019a).
Figure 4‑14. Release by corrosion in BHK.

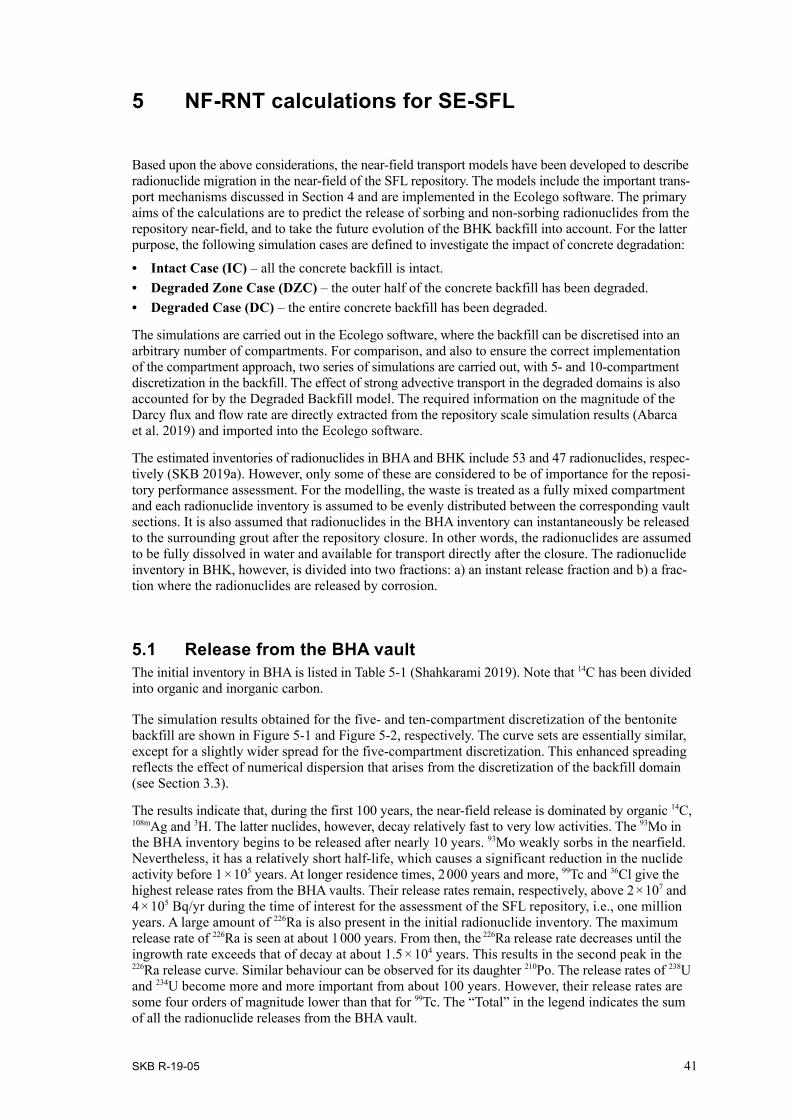
SKB R-19-05 41
5 NF-RNT calculations for SE-SFL
Based upon the above considerations, the near-field transport models have been developed to describe radionuclide migration in the near-field of the SFL repository. The models include the important trans-port mechanisms discussed in Section 4 and are implemented in the Ecolego software. The primary aims of the calculations are to predict the release of sorbing and non-sorbing radionuclides from the repository near-field, and to take the future evolution of the BHK backfill into account. For the latter purpose, the following simulation cases are defined to investigate the impact of concrete degradation:
• Intact Case (IC) – all the concrete backfill is intact.• Degraded Zone Case (DZC) – the outer half of the concrete backfill has been degraded.• Degraded Case (DC) – the entire concrete backfill has been degraded.
The simulations are carried out in the Ecolego software, where the backfill can be discretised into an arbitrary number of compartments. For comparison, and also to ensure the correct implementation of the compartment approach, two series of simulations are carried out, with 5- and 10-compartment discretization in the backfill. The effect of strong advective transport in the degraded domains is also accounted for by the Degraded Backfill model. The required information on the magnitude of the Darcy flux and flow rate are directly extracted from the repository scale simulation results (Abarca et al. 2019) and imported into the Ecolego software.
The estimated inventories of radionuclides in BHA and BHK include 53 and 47 radionuclides, respec-tively (SKB 2019a). However, only some of these are considered to be of importance for the reposi-tory performance assessment. For the modelling, the waste is treated as a fully mixed compartment and each radionuclide inventory is assumed to be evenly distributed between the corresponding vault sections. It is also assumed that radionuclides in the BHA inventory can instantaneously be released to the surrounding grout after the repository closure. In other words, the radionuclides are assumed to be fully dissolved in water and available for transport directly after the closure. The radionuclide inventory in BHK, however, is divided into two fractions: a) an instant release fraction and b) a frac-tion where the radionuclides are released by corrosion.
5.1 Release from the BHA vaultThe initial inventory in BHA is listed in Table 5-1 (Shahkarami 2019). Note that 14C has been divided into organic and inorganic carbon.
The simulation results obtained for the five- and ten-compartment discretization of the bentonite backfill are shown in Figure 5-1 and Figure 5-2, respectively. The curve sets are essentially similar, except for a slightly wider spread for the five-compartment discretization. This enhanced spreading reflects the effect of numerical dispersion that arises from the discretization of the backfill domain (see Section 3.3).
The results indicate that, during the first 100 years, the near-field release is dominated by organic 14C, 108mAg and 3H. The latter nuclides, however, decay relatively fast to very low activities. The 93Mo in the BHA inventory begins to be released after nearly 10 years. 93Mo weakly sorbs in the nearfield. Nevertheless, it has a relatively short half-life, which causes a significant reduction in the nuclide activity before 1 × 10⁵ years. At longer residence times, 2 000 years and more, 99Tc and 36Cl give the highest release rates from the BHA vaults. Their release rates remain, respectively, above 2 × 10⁷ and 4 × 10⁵ Bq/yr during the time of interest for the assessment of the SFL repository, i.e., one million years. A large amount of 226Ra is also present in the initial radionuclide inventory. The maximum release rate of 226Ra is seen at about 1 000 years. From then, the 226Ra release rate decreases until the ingrowth rate exceeds that of decay at about 1.5 × 10⁴ years. This results in the second peak in the 226Ra release curve. Similar behaviour can be observed for its daughter 210Po. The release rates of 238U and 234U become more and more important from about 100 years. However, their release rates are some four orders of magnitude lower than that for 99Tc. The “Total” in the legend indicates the sum of all the radionuclide releases from the BHA vault.
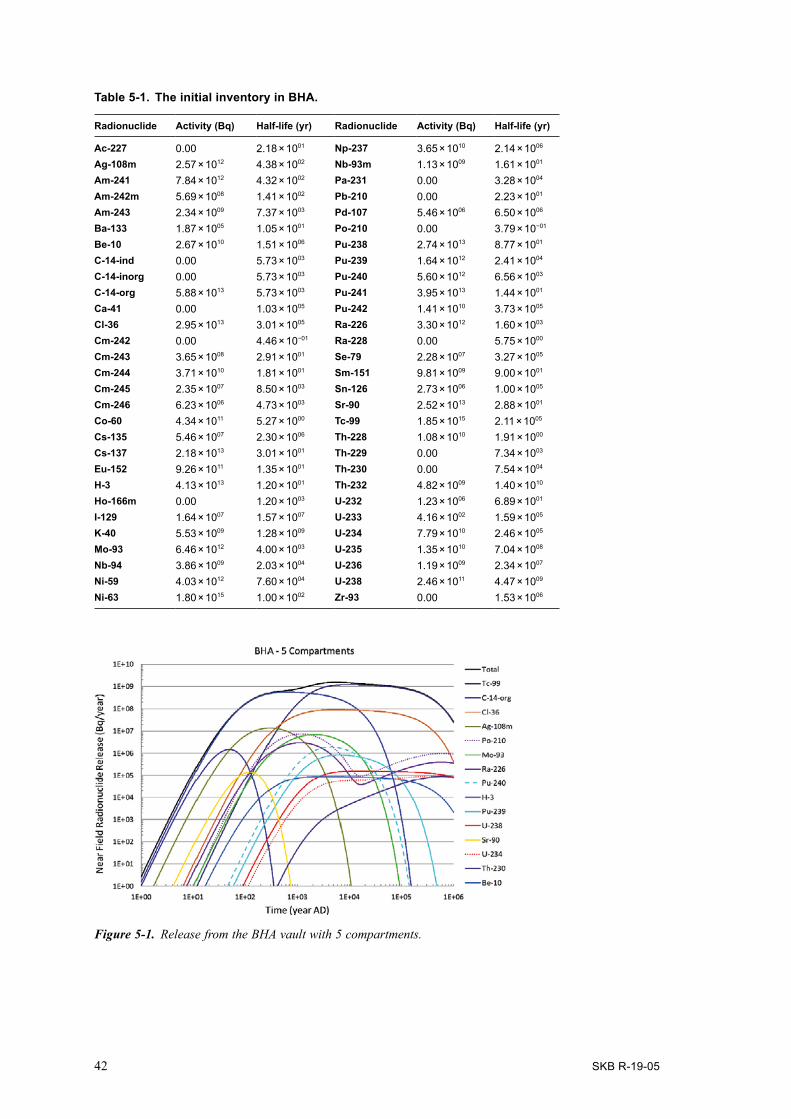
42 SKB R-19-05
Table 5-1. The initial inventory in BHA.
Radionuclide Activity (Bq) Half-life (yr) Radionuclide Activity (Bq) Half-life (yr)
Ac-227 0.00 2.18 × 1001 Np-237 3.65 × 10¹⁰ 2.14 × 1006
Ag-108m 2.57 × 10¹² 4.38 × 1002 Nb-93m 1.13 × 1009 1.61 × 1001
Am-241 7.84 × 10¹² 4.32 × 1002 Pa-231 0.00 3.28 × 1004
Am-242m 5.69 × 1008 1.41 × 1002 Pb-210 0.00 2.23 × 1001
Am-243 2.34 × 1009 7.37 × 1003 Pd-107 5.46 × 1006 6.50 × 1006
Ba-133 1.87 × 1005 1.05 × 1001 Po-210 0.00 3.79 × 10−01
Be-10 2.67 × 10¹⁰ 1.51 × 1006 Pu-238 2.74 × 10¹³ 8.77 × 1001
C-14-ind 0.00 5.73 × 1003 Pu-239 1.64 × 10¹² 2.41 × 1004
C-14-inorg 0.00 5.73 × 1003 Pu-240 5.60 × 10¹² 6.56 × 1003
C-14-org 5.88 × 10¹³ 5.73 × 1003 Pu-241 3.95 × 10¹³ 1.44 × 1001
Ca-41 0.00 1.03 × 1005 Pu-242 1.41 × 10¹⁰ 3.73 × 1005
Cl-36 2.95 × 10¹³ 3.01 × 1005 Ra-226 3.30 × 10¹² 1.60 × 1003
Cm-242 0.00 4.46 × 10−01 Ra-228 0.00 5.75 × 1000
Cm-243 3.65 × 1008 2.91 × 1001 Se-79 2.28 × 1007 3.27 × 1005
Cm-244 3.71 × 10¹⁰ 1.81 × 1001 Sm-151 9.81 × 1009 9.00 × 1001
Cm-245 2.35 × 1007 8.50 × 1003 Sn-126 2.73 × 1006 1.00 × 1005
Cm-246 6.23 × 1006 4.73 × 1003 Sr-90 2.52 × 10¹³ 2.88 × 1001
Co-60 4.34 × 10¹¹ 5.27 × 1000 Tc-99 1.85 × 10¹⁵ 2.11 × 1005
Cs-135 5.46 × 1007 2.30 × 1006 Th-228 1.08 × 10¹⁰ 1.91 × 1000
Cs-137 2.18 × 10¹³ 3.01 × 1001 Th-229 0.00 7.34 × 1003
Eu-152 9.26 × 10¹¹ 1.35 × 1001 Th-230 0.00 7.54 × 1004
H-3 4.13 × 10¹³ 1.20 × 1001 Th-232 4.82 × 1009 1.40 × 10¹⁰
Ho-166m 0.00 1.20 × 1003 U-232 1.23 × 1006 6.89 × 1001
I-129 1.64 × 1007 1.57 × 1007 U-233 4.16 × 1002 1.59 × 1005
K-40 5.53 × 1009 1.28 × 1009 U-234 7.79 × 10¹⁰ 2.46 × 1005
Mo-93 6.46 × 10¹² 4.00 × 1003 U-235 1.35 × 10¹⁰ 7.04 × 1008
Nb-94 3.86 × 1009 2.03 × 1004 U-236 1.19 × 1009 2.34 × 1007
Ni-59 4.03 × 10¹² 7.60 × 1004 U-238 2.46 × 10¹¹ 4.47 × 1009
Ni-63 1.80 × 10¹⁵ 1.00 × 1002 Zr-93 0.00 1.53 × 1006
Figure 5‑1. Release from the BHA vault with 5 compartments.

SKB R-19-05 43
The potential of the proposed repository design to retard the radionuclides released from the waste should also be addressed. For this, we have calculated the total amount of radionuclides released from the bentonite backfill. The results are summarized in Figure 5-3. It can be seen that the final release is dominated by 99Tc, 36Cl and organic 14C. The results suggest that bentonite backfill can effectively retard many of the important sorbing radionuclides. Of these, radionuclides with short half-lives decay to very low activities in the backfill, while those with longer half-lives have enough time to decay to a lower activity before they leave the BHA vault. The retention of the long-lived, non-sorbing nuclides is, however, only slightly affected by the presence of the bentonite backfill.
Figure 5‑2. Release from the BHA vault with 10 compartments.
Figure 5‑3. Total radionuclide release from the BHA backfill.
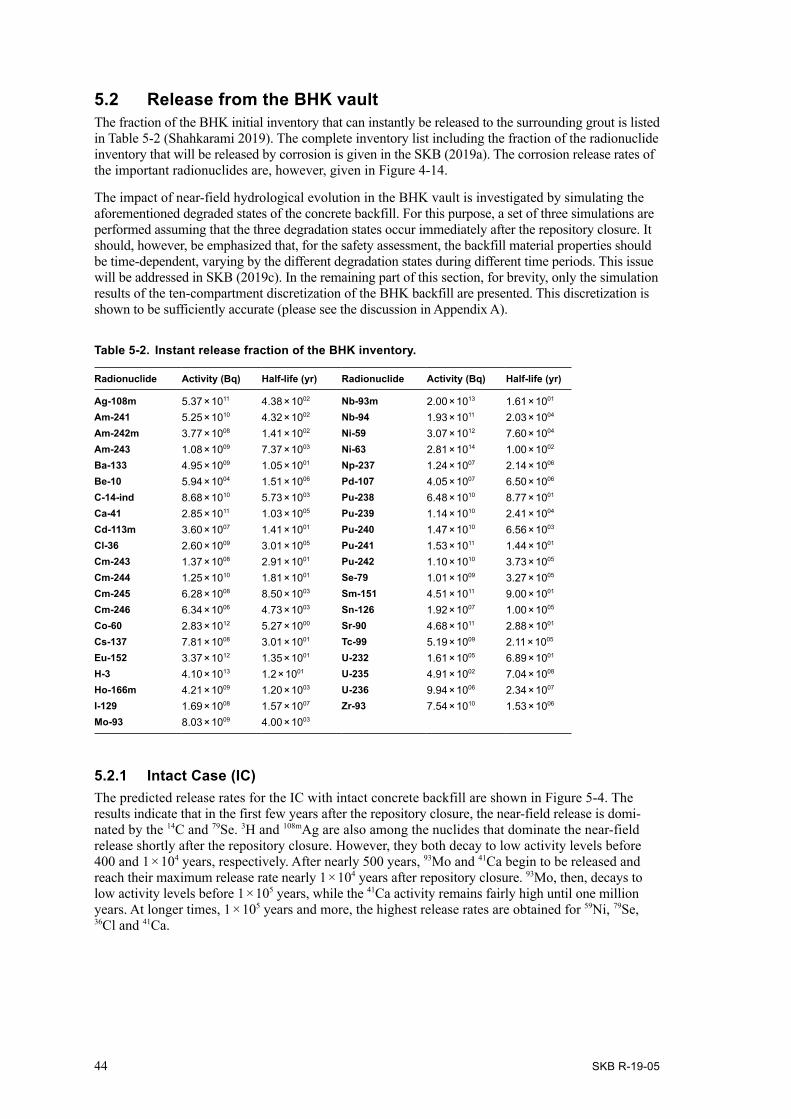
44 SKB R-19-05
5.2 Release from the BHK vaultThe fraction of the BHK initial inventory that can instantly be released to the surrounding grout is listed in Table 5-2 (Shahkarami 2019). The complete inventory list including the fraction of the radionuclide inventory that will be released by corrosion is given in the SKB (2019a). The corrosion release rates of the important radionuclides are, however, given in Figure 4-14.
The impact of near-field hydrological evolution in the BHK vault is investigated by simulating the aforementioned degraded states of the concrete backfill. For this purpose, a set of three simulations are performed assuming that the three degradation states occur immediately after the repository closure. It should, however, be emphasized that, for the safety assessment, the backfill material properties should be time-dependent, varying by the different degradation states during different time periods. This issue will be addressed in SKB (2019c). In the remaining part of this section, for brevity, only the simulation results of the ten-compartment discretization of the BHK backfill are presented. This discretization is shown to be sufficiently accurate (please see the discussion in Appendix A).
Table 5-2. Instant release fraction of the BHK inventory.
Radionuclide Activity (Bq) Half-life (yr) Radionuclide Activity (Bq) Half-life (yr)
Ag-108m 5.37 × 10¹¹ 4.38 × 1002 Nb-93m 2.00 × 10¹³ 1.61 × 1001
Am-241 5.25 × 10¹⁰ 4.32 × 1002 Nb-94 1.93 × 10¹¹ 2.03 × 1004
Am-242m 3.77 × 1008 1.41 × 1002 Ni-59 3.07 × 10¹² 7.60 × 1004
Am-243 1.08 × 1009 7.37 × 1003 Ni-63 2.81 × 10¹⁴ 1.00 × 1002
Ba-133 4.95 × 1009 1.05 × 1001 Np-237 1.24 × 1007 2.14 × 1006
Be-10 5.94 × 1004 1.51 × 1006 Pd-107 4.05 × 1007 6.50 × 1006
C-14-ind 8.68 × 10¹⁰ 5.73 × 1003 Pu-238 6.48 × 10¹⁰ 8.77 × 1001
Ca-41 2.85 × 10¹¹ 1.03 × 1005 Pu-239 1.14 × 10¹⁰ 2.41 × 1004
Cd-113m 3.60 × 1007 1.41 × 1001 Pu-240 1.47 × 10¹⁰ 6.56 × 1003
Cl-36 2.60 × 1009 3.01 × 1005 Pu-241 1.53 × 10¹¹ 1.44 × 1001
Cm-243 1.37 × 1008 2.91 × 1001 Pu-242 1.10 × 10¹⁰ 3.73 × 1005
Cm-244 1.25 × 10¹⁰ 1.81 × 1001 Se-79 1.01 × 1009 3.27 × 1005
Cm-245 6.28 × 1008 8.50 × 1003 Sm-151 4.51 × 10¹¹ 9.00 × 1001
Cm-246 6.34 × 1006 4.73 × 1003 Sn-126 1.92 × 1007 1.00 × 1005
Co-60 2.83 × 10¹² 5.27 × 1000 Sr-90 4.68 × 10¹¹ 2.88 × 1001
Cs-137 7.81 × 1008 3.01 × 1001 Tc-99 5.19 × 1009 2.11 × 1005
Eu-152 3.37 × 10¹² 1.35 × 1001 U-232 1.61 × 1005 6.89 × 1001
H-3 4.10 × 10¹³ 1.2 × 1001 U-235 4.91 × 1002 7.04 × 1008
Ho-166m 4.21 × 1009 1.20 × 1003 U-236 9.94 × 1006 2.34 × 1007
I-129 1.69 × 1008 1.57 × 1007 Zr-93 7.54 × 10¹⁰ 1.53 × 1006
Mo-93 8.03 × 1009 4.00 × 1003
5.2.1 Intact Case (IC)The predicted release rates for the IC with intact concrete backfill are shown in Figure 5-4. The results indicate that in the first few years after the repository closure, the near-field release is domi-nated by the 14C and 79Se. 3H and 108mAg are also among the nuclides that dominate the near-field release shortly after the repository closure. However, they both decay to low activity levels before 400 and 1 × 10⁴ years, respectively. After nearly 500 years, 93Mo and 41Ca begin to be released and reach their maximum release rate nearly 1 × 10⁴ years after repository closure. 93Mo, then, decays to low activity levels before 1 × 10⁵ years, while the 41Ca activity remains fairly high until one million years. At longer times, 1 × 10⁵ years and more, the highest release rates are obtained for 59Ni, 79Se, 36Cl and 41Ca.

SKB R-19-05 45
5.2.2 Degraded Zone Case (DZC)Degradation of concrete leads to the emergence of high-permeable zones within the BHK backfill, thus increasing the water flow and transport rate from the backfill. The magnitude and direction of the water flow has been estimated by the repository scale model (Abarca et al. 2019). The magnitude of transport rate is estimated by the Degraded Backfill model presented in this report, Section 4.2.3.
The release from the BHK vault in the DZC is shown in Figure 5-5. The release is to a great extent similar to that from the IC in terms of the dominating nuclides. Nevertheless, the results indicate that the increase in the flow in the backfill leads to an increase in the radionuclide release rate compared to the IC. Essentially, it can be seen that in the DZC, the radionuclide arrival times are two times shorter than those in the IC and the curve peaks exhibit larger values. The only exceptions for the latter observation are for radionuclides with very long half-lives, e.g., 129I.
Figure 5‑4. Release from the BHK vault (Intact Case) with 10 compartments.
Figure 5‑5. Release from the BHK vault (DZC) with 10 compartments.
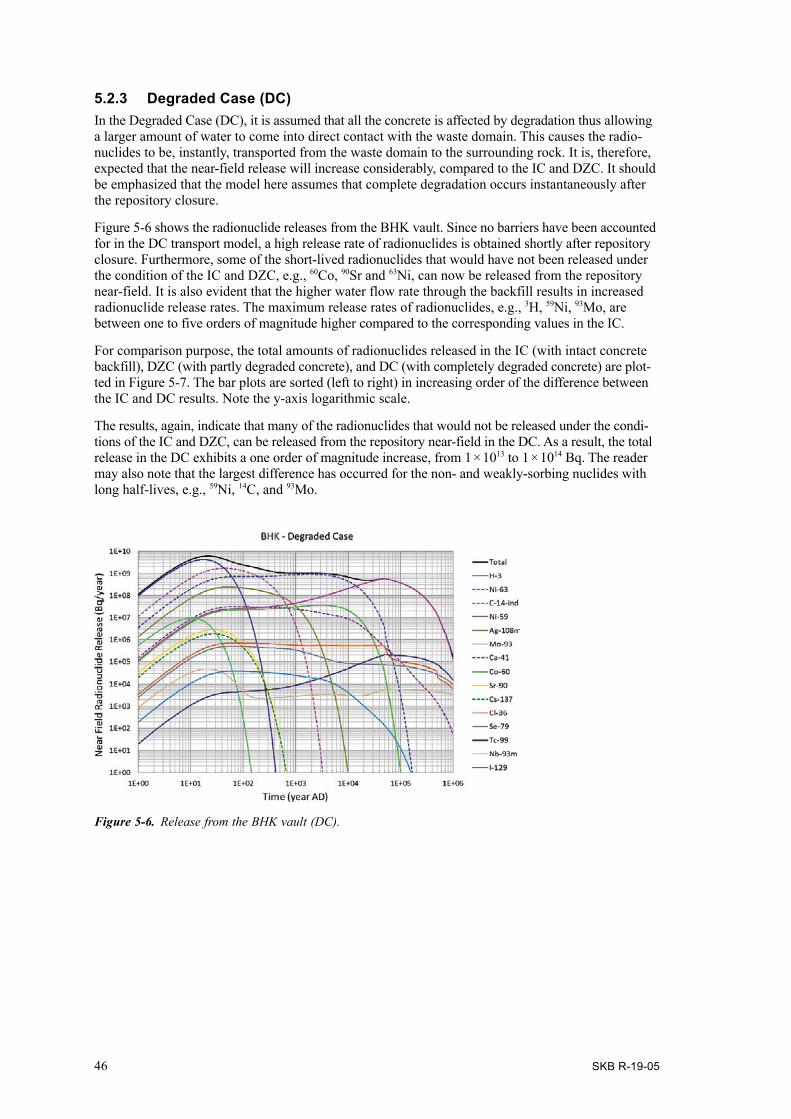
46 SKB R-19-05
5.2.3 Degraded Case (DC)In the Degraded Case (DC), it is assumed that all the concrete is affected by degradation thus allowing a larger amount of water to come into direct contact with the waste domain. This causes the radio-nuclides to be, instantly, transported from the waste domain to the surrounding rock. It is, therefore, expected that the near-field release will increase considerably, compared to the IC and DZC. It should be emphasized that the model here assumes that complete degradation occurs instantaneously after the repository closure.
Figure 5-6 shows the radionuclide releases from the BHK vault. Since no barriers have been accounted for in the DC transport model, a high release rate of radionuclides is obtained shortly after repository closure. Furthermore, some of the short-lived radionuclides that would have not been released under the condition of the IC and DZC, e.g., 60Co, 90Sr and 63Ni, can now be released from the repository near-field. It is also evident that the higher water flow rate through the backfill results in increased radionuclide release rates. The maximum release rates of radionuclides, e.g., 3H, 59Ni, 93Mo, are between one to five orders of magnitude higher compared to the corresponding values in the IC.
For comparison purpose, the total amounts of radionuclides released in the IC (with intact concrete backfill), DZC (with partly degraded concrete), and DC (with completely degraded concrete) are plot-ted in Figure 5-7. The bar plots are sorted (left to right) in increasing order of the difference between the IC and DC results. Note the y-axis logarithmic scale.
The results, again, indicate that many of the radionuclides that would not be released under the condi-tions of the IC and DZC, can be released from the repository near-field in the DC. As a result, the total release in the DC exhibits a one order of magnitude increase, from 1 × 10¹³ to 1 × 10¹⁴ Bq. The reader may also note that the largest difference has occurred for the non- and weakly-sorbing nuclides with long half-lives, e.g., 59Ni, 14C, and 93Mo.
Figure 5‑6. Release from the BHK vault (DC).
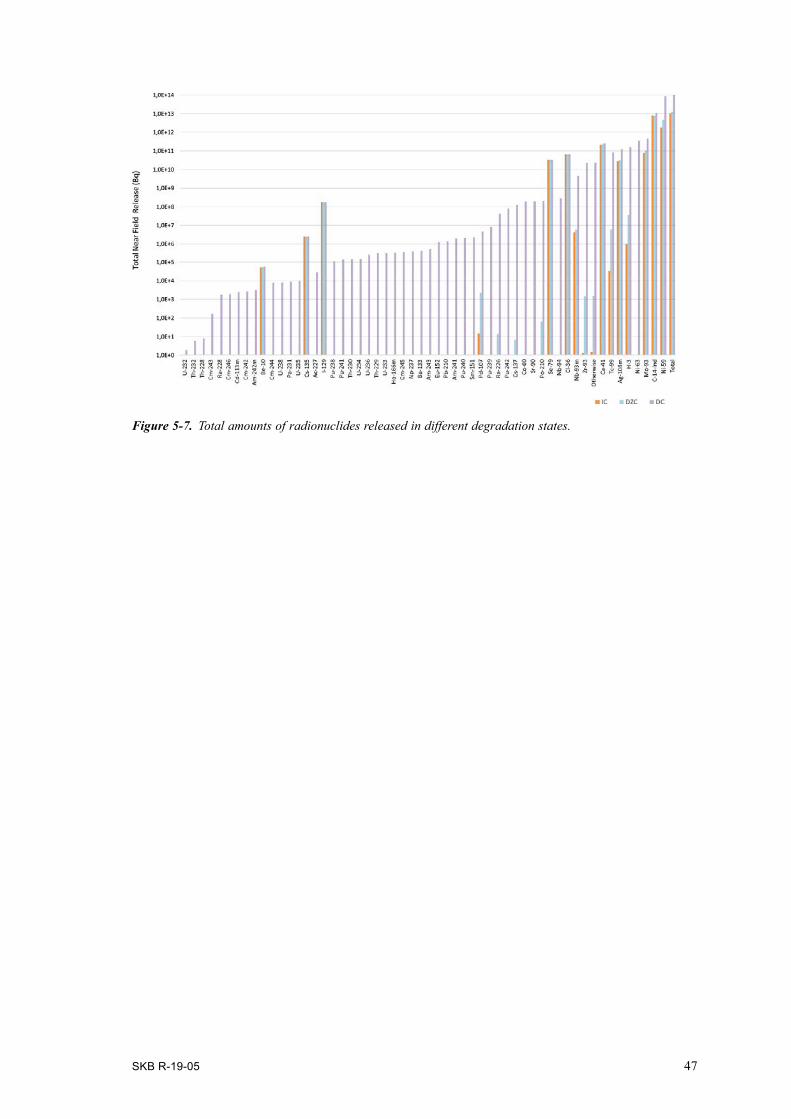
SKB R-19-05 47
Figure 5‑7. Total amounts of radionuclides released in different degradation states.

SKB R-19-05 49
6 Summary and Conclusion
This study has developed new models to describe radionuclide transport in the SFL repository near-field. Yet, most formulations in this report are general transport models that can be applied to solute transport in different practical situations.
The work in this study can be grouped into two main parts based on the context and the desired objectives. The first part aimed to develop radionuclide transport models to calculate the radionuclide releases from the SFL repository near-field. The developed models rely on the compartment conceptu-alization of the near-field backfills and address the diffusive and advective transport of radionuclides through the repository barriers. The near-field models also include two sub-models that take the effect of strong advective transport around the repository backfills into account. This part of the study also includes a series of scoping calculations to ensure the correct implementation of the compartment approach and validity of the simplifications made in the modelling stage.
The second part of this report deals with the near-field radionuclide transport calculation in the reposi-tory BHA and BHK vaults with bentonite and concrete backfills, respectively. For this purpose, the developed models are implemented in the Ecolego software to calculate the release of radionuclides from the repository vaults. Three different concrete degradation states were defined to study the effect of future evolution of the BHK backfill: the Intact Case (IC), Degraded Zone Case (DZC), and Degraded Case (DC).
The simulation results indicate that the release from the BHA vault is dominated by 99Tc, 36Cl, organic 14C and 210Po. The results also suggest that bentonite backfill can effectively retard radionuclide migra-tion and the long retention time allows many of the important radionuclides to decay considerably. The short-lived radionuclides decay to very low activity levels. Therefore, their releases from the BHA vault are mostly negligible. The sorbing long-lived radionuclides have enough time to decay to lower activity levels before they are released from the vault. The retention of the long-lived, non-sorbing nuclides is, however, only partly affected by the presence of the bentonite backfill.
The predicted radionuclide release rates from the BHK vault indicate that the near-field release is dominated by 14C, 59Ni, 41Ca, 93Mo, 36Cl and 79Se in the IC. The predicted release in the DZC is similar in terms of the dominating nuclides. However, the enhanced flow rate in the DZC leads to a moderately increased near-field release compared to the IC. In the DC, the concrete backfill is assumed to be completely degraded. Therefore, radionuclides can, instantly, be transported from the waste package to the surrounding rock. This increases the near-field release, compared to the IC and DZC. Furthermore, some of the shorter-lived radionuclides that would not be released under the condition of the IC and DZC, e.g., 60Co and 90Sr, are now released from the repository near-field.


SKB R-19-05 51
7 References
SKB’s (Svensk Kärnbränslehantering AB) publications can be found at www.skb.com/publications.SKBdoc documents will be submitted upon request to [email protected].
Abarca E, Sampietro D, Molinero J, von Schenck H, 2019. Modelling of the near-field hydro-geology – Temperate climate conditions. Report for the safety evaluation SE-SFL. SKB R-19-03, Svensk Kärnbränslehantering AB.
Bird R B, Stewart W E, Lightfoot E N, 2002. Transport phenomena. 2nd ed. New York: Wiley.
Elfwing M, Evins L Z, Gontier M, Grahm P, Mårtensson P, Tunbrant S, 2013. SFL concept study. Main report. SKB TR-13-14, Svensk Kärnbränslehantering AB.
Fetter C W, 1999. Contaminant hydrogeology. 2nd ed. Upper Saddle River, NJ: Prentice Hall.
Gelhar L W, Welty C, Rehfeldt K R, 1992. A critical review of data on field‐scale dispersion in aquifers. Water Resources Research 28, 1955–1974.
Herschend B, 2014. Long-lived intermediate level waste from Swedish nuclear power plants. Reference inventory. SKB R-13-17, Svensk Kärnbränslehantering AB.
Huysmans M, Dassargues A, 2005. Review of the use of Péclet numbers to determine the relative importance of advection and diffusion in low permeability environments. Hydrogeoly Journal 13, 895–904.
Joyce S, Appleyard P, Hartley L, Tsitsopoulos V, Woollard H, Marsic N, Sidborn M and Crawford J, 2019. Groundwater flow and reactive transport modelling of temperate conditions. Report for the safety evaluation SE-SFL. SKB R-19-02, Svensk Kärnbränslehantering AB.
Levenspiel O, 1999. Chemical reaction engineering. 3rd ed. New York: Wiley.
Lindgren M, Pettersson M, Karlsson S, Moreno L, 2001. Project SAFE. Radionuclide release and dose from the SFR repository. SKB R-01-18, Svensk Kärnbränslehantering AB.
Liu L, Moreno L, Neretnieks I, Gylling B, 2010. A safety assessment approach using coupled NEAR3D and CHAN3D – Forsmark. SKB R-10-69, Svensk Kärnbränslehantering AB.
Shahkarami P, 2019. Input data report for near-field and geosphere radionuclide transport modelling in the safety evaluation SE-SFL. SKB R-19-09, Svensk Kärnbränslehantering AB.
Neretnieks I, 1986. Stationary transport of dissolved species in the backfill surrounding a waste canister in fissured rock – A simple analytical solution. Nuclear Technology 72, 194–200.
Neretnieks I, 2006. Flow and transport through a damaged buffer – exploration of the impact of a cemented and an eroded buffer. SKB TR-06-33, Svensk Kärnbränslehantering AB.
Neretnieks I, Liu L, Moreno L, 2010. Mass transfer between waste canister and water seeping in rock fractures. Revisiting the Q-equivalent model. SKB TR-10-42, Svensk Kärnbränslehantering AB.
Romero L, Thompson A, Moreno L, Neretnieks I, Widén H, Boghammar A, 1999. Comp23/Nuctran user’s guide. Proper version 1.1.6. SKB R-99-64, Svensk Kärnbränslehantering AB.
SKB, 2019a. Initial state for the repository for the safety evaluation SE-SFL. SKB TR-19-03, Svensk Kärnbränslehantering AB.
SKB, 2019b. Post-closure safety for a proposed repository concept for SFL. Main report for the safety evaluation SE-SFL. SKB TR-19-01, Svensk Kärnbränslehantering AB.
SKB, 2019c. Radionuclide transport and dose calculations for the safety evaluation SE-SFL. SKB TR-19-06, Svensk Kärnbränslehantering AB.


SKB R-19-05 53
Appendix A
Analysis of the spatial discretization in the compartment approachThe use of the compartment model can have some advantages over traditional finite element, FEM, and finite difference, FD, methods. However, the model must be judiciously compartmentalized to assure that the “full-mixing” condition can be attained in the compartments during the time of interest for transport calculation. Otherwise, coarse discretization can lead to dramatic errors.
In the absence of other dispersive processes, molecular diffusion is the sole mixing mechanism in the SFL repository near-field. Here we present a simple practical approach to analyse the assumption of full mixing by diffusion in a compartment. Such analysis can be used to guide how the compartment discretization should be made to avoid misleading or, even, meaningless results.
Consider a finite one-dimensional domain initially with concentration c = 0 that is subjected to a concentration C0 at the surface for t > 0. We explore how the concentration within the domain evolves over time. This is similar to exploring how quickly the concentration between the most distant surfaces at y = 0 and y = d will even out with the time in the domain. Mass balance calculations for a sorbing nuclide in the domain gives:
(A-1)
with the boundary conditions:
c = C0 at y = 0
at y = d
where De and R are the effective diffusion coefficient and retardation factor of the nuclide in the domain, respectively and ε is the diffusion available porosity of the nuclide in the domain. Given the initial and boundary conditions, the exact analytical solution to this equation, is (Bird et al. 2002):
(A-2)
T is the dimensionless diffusion time defined as:
(A-3)
The mean concentration cmean can be obtained by integration over the distance from y = 0 to y = d to give:
(A-4)
Figure A-1 shows how the mean concentration in the domain increases with the dimensionless time T. It can be seen that at T = 1.12, the mean concentration only deviates by 5 %. For the present study, we will assume that for T ≥ 1.12, the concentration has become uniform and the domain has attained the well-mixed condition. In this way, the time that the well-mixed condition will be attained in the domain, i.e., the full-mixing time, tmix, can be estimated as:
(A-5)

54 SKB R-19-05
Given the material properties of the SFL backfills, listed in Table 2-1, some measurements of the required full-mixing times in bentonite and concrete backfills are presented in Figure A-2 and Figure A-3, respectively. In these figures, the x-axis represents the size of the compartment in the direction of diffusion. The retardation factors are considered to range from R = 1 for non-sorbing nuclides to R = 1 000 for weakly-sorbing nuclides. The dashed lines in Figure A-2 represent tmix for anions and the solid lines represent the corresponding values for cations. Figure A-2 indicates that tmix for anions generally shows five times larger values than those for cations. The results suggest that for non-sorbing anions with R = 1, about 550 years are required for a compartment of 1 m long to be reasonably equilibrated. This value, for a compartment of 10 m long is, however, 55 000 years. This implies that if there is some process significantly changing the concentration in a location 10 m distant, assuming full mixing, one will underestimate the time for which the disturbance is felt at times shorter than tmix. For weekly-sorbing anions with, e.g., R = 1 000, a 10-meter-long compartment would give misleading results for times smaller than sixty million years. Therefore, compared to the non-sorbing anions, smaller compartment sizes must be selected to give meaningful results.
Similar conclusions can be made for the required full mixing time in the intact concrete backfill, Figure A-3. However, the reader may note that tmix in this case shows an order of magnitude larger values than those in the bentonite. Therefore, it can be inferred that finer discretization is required in the concrete backfill to assure that the full mixing condition can be attained in the compartments and the compartment approach can properly be used to describe radionuclide transport in the SFL repository near-field.
The average thickness of the backfills in BHA and BHK are 2.35 m and 2.6 m, respectively. Given the times of interest for the safety assessment of the SFL repository, i.e., one million years, the bentonite and intact concrete backfills are discretized into 5 < Nc < 10 compartments corresponding to compart-ment sizes of nearly 0.26 < L < 0.5. This also corresponds to the Peclet number 10 < Pe < 20, which lies in the range that is often observed in natural systems, i.e., Pe = 1~100 with a predominance of Pe = 1~10 (Gelhar et al. 1992).
Figure A‑1. Mean concentration in the domain as a function of dimensionless time T.
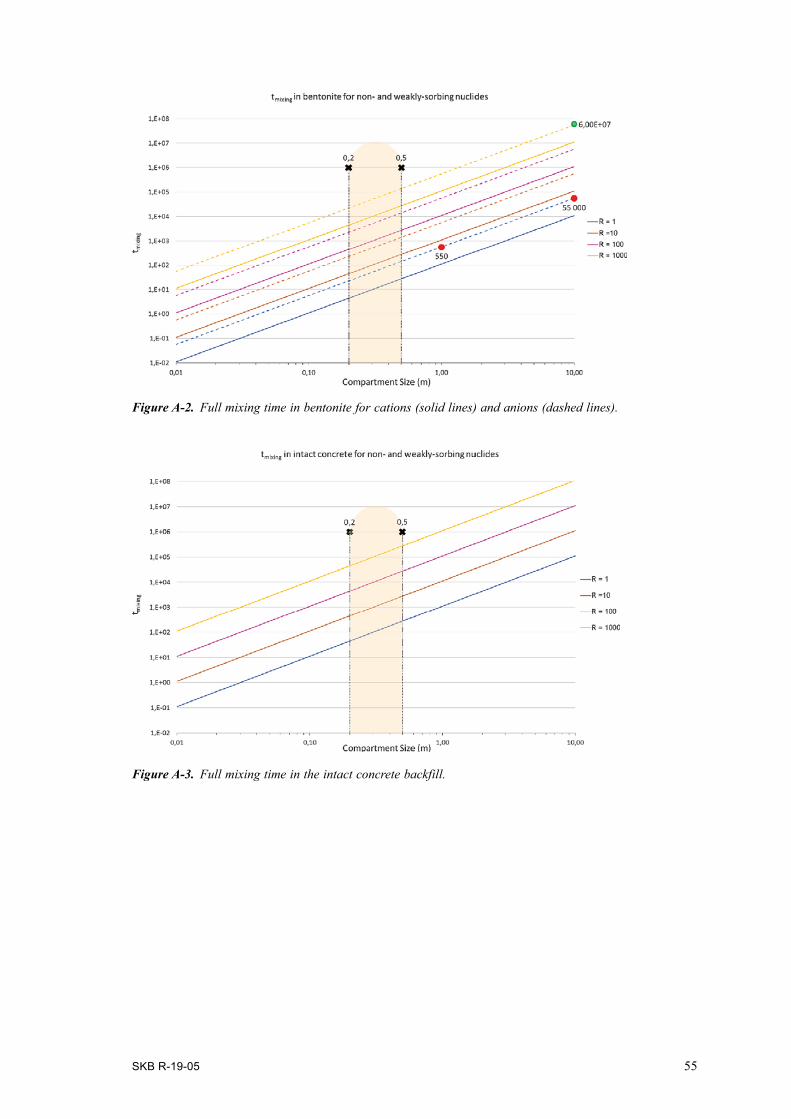
SKB R-19-05 55
Figure A‑2. Full mixing time in bentonite for cations (solid lines) and anions (dashed lines).
Figure A‑3. Full mixing time in the intact concrete backfill.
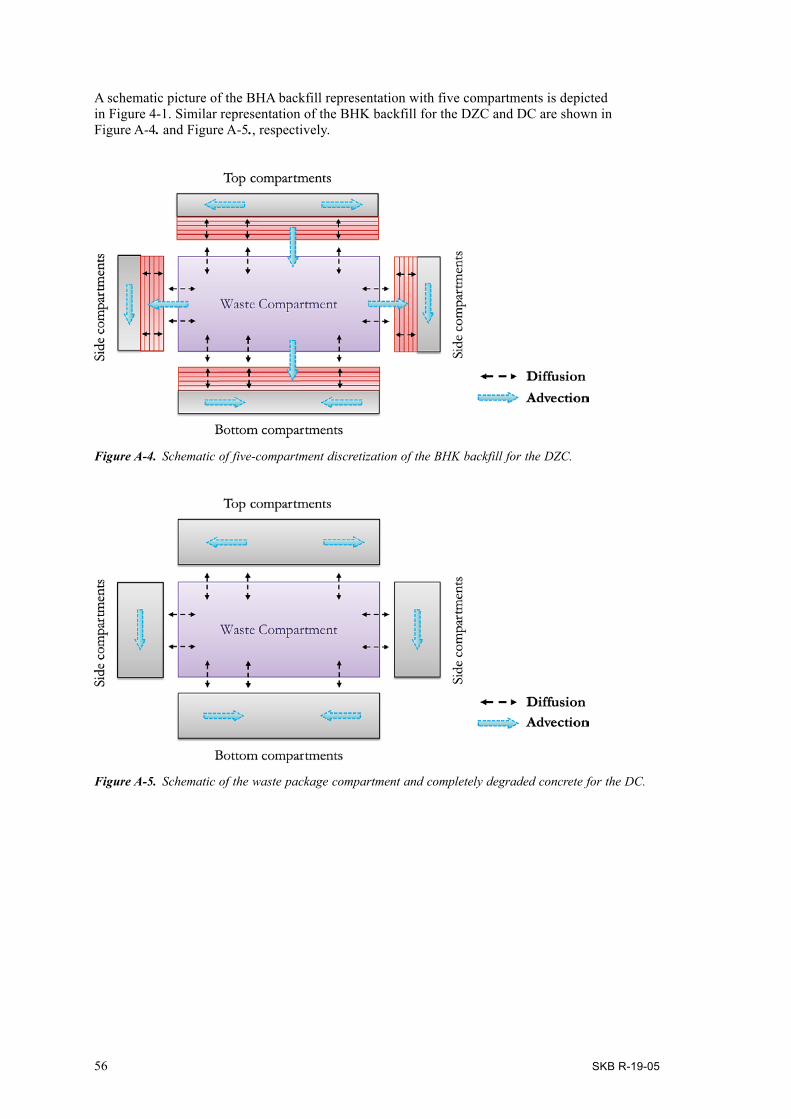
56 SKB R-19-05
A schematic picture of the BHA backfill representation with five compartments is depicted in Figure 4-1. Similar representation of the BHK backfill for the DZC and DC are shown in Figure A-4. and Figure A-5., respectively.
Figure A‑5. Schematic of the waste package compartment and completely degraded concrete for the DC.
Figure A‑4. Schematic of five-compartment discretization of the BHK backfill for the DZC.
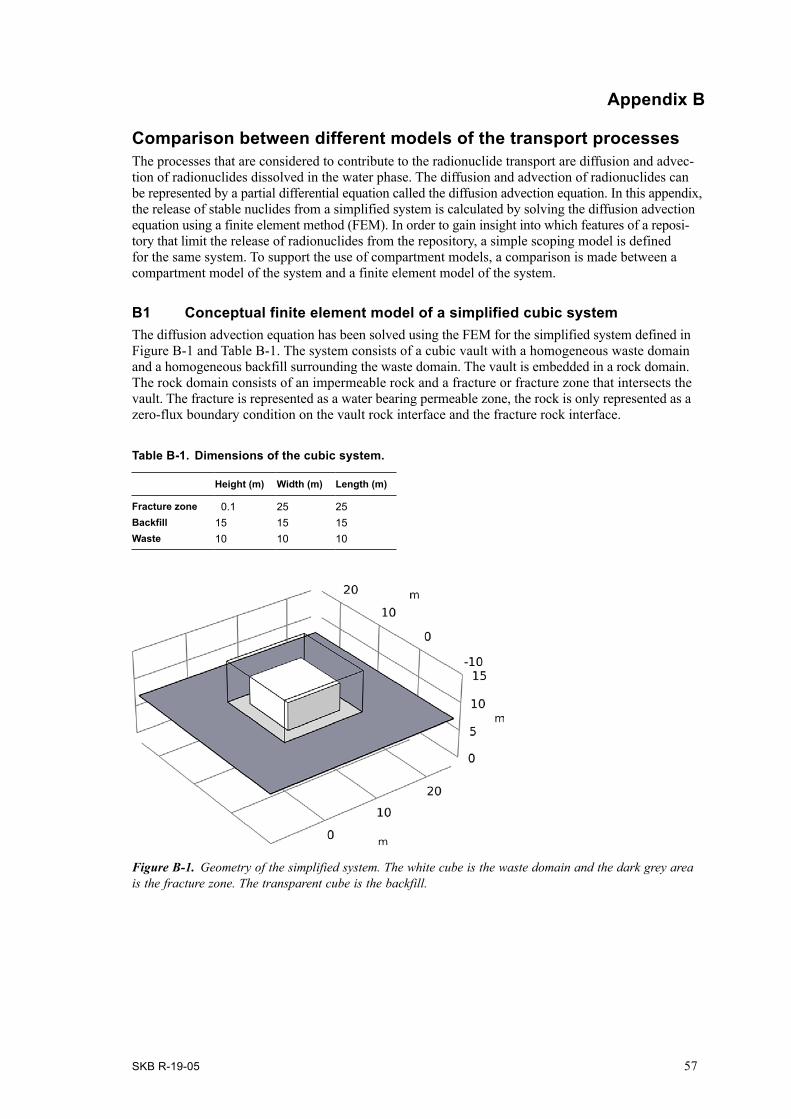
SKB R-19-05 57
Appendix B
Comparison between different models of the transport processesThe processes that are considered to contribute to the radionuclide transport are diffusion and advec-tion of radionuclides dissolved in the water phase. The diffusion and advection of radionuclides can be represented by a partial differential equation called the diffusion advection equation. In this appendix, the release of stable nuclides from a simplified system is calculated by solving the diffusion advection equation using a finite element method (FEM). In order to gain insight into which features of a reposi-tory that limit the release of radionuclides from the repository, a simple scoping model is defined for the same system. To support the use of compartment models, a comparison is made between a compartment model of the system and a finite element model of the system.
B1 Conceptual finite element model of a simplified cubic systemThe diffusion advection equation has been solved using the FEM for the simplified system defined in Figure B-1 and Table B-1. The system consists of a cubic vault with a homogeneous waste domain and a homogeneous backfill surrounding the waste domain. The vault is embedded in a rock domain. The rock domain consists of an impermeable rock and a fracture or fracture zone that intersects the vault. The fracture is represented as a water bearing permeable zone, the rock is only represented as a zero-flux boundary condition on the vault rock interface and the fracture rock interface.
Table B-1. Dimensions of the cubic system.
Height (m) Width (m) Length (m)
Fracture zone 0.1 25 25Backfill 15 15 15Waste 10 10 10
B1.1 Water flow
Figure B‑1. Geometry of the simplified system. The white cube is the waste domain and the dark grey area is the fracture zone. The transparent cube is the backfill.
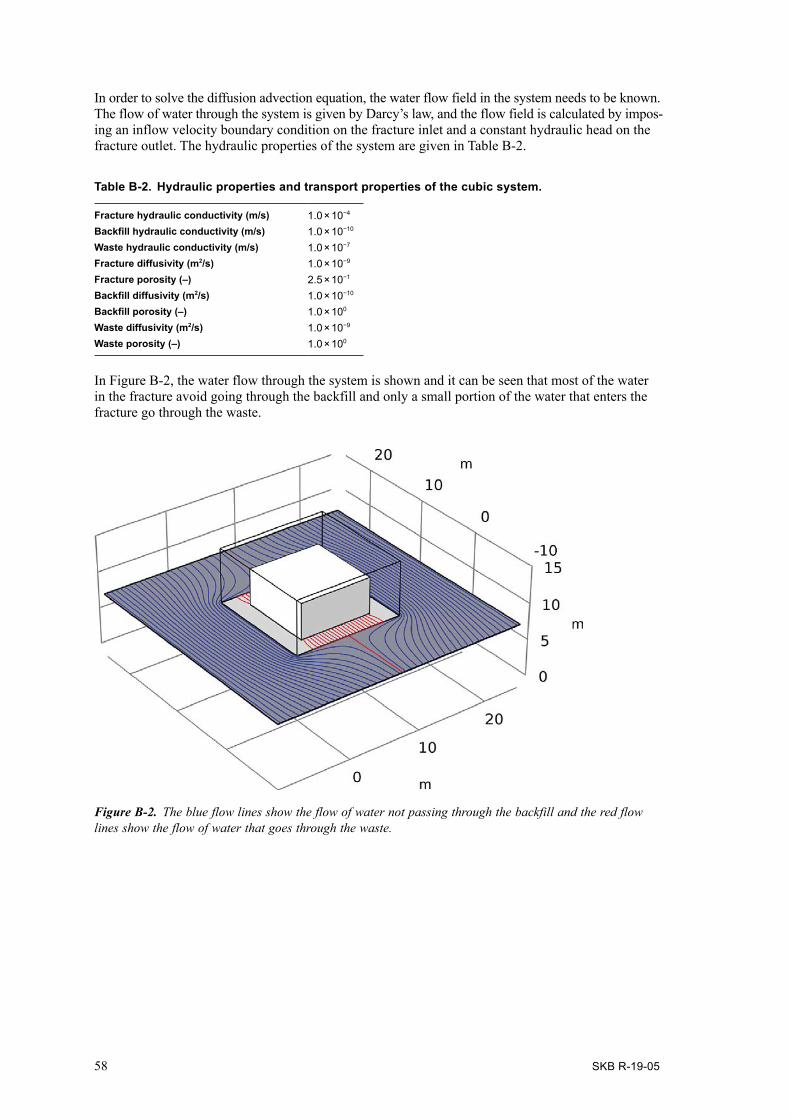
58 SKB R-19-05
In order to solve the diffusion advection equation, the water flow field in the system needs to be known. The flow of water through the system is given by Darcy’s law, and the flow field is calculated by impos-ing an inflow velocity boundary condition on the fracture inlet and a constant hydraulic head on the fracture outlet. The hydraulic properties of the system are given in Table B-2.
Table B-2. Hydraulic properties and transport properties of the cubic system.
Fracture hydraulic conductivity (m/s) 1.0 × 10⁻⁴
Backfill hydraulic conductivity (m/s) 1.0 × 10⁻¹⁰
Waste hydraulic conductivity (m/s) 1.0 × 10⁻⁷
Fracture diffusivity (m2/s) 1.0 × 10⁻⁹
Fracture porosity (–) 2.5 × 10⁻¹
Backfill diffusivity (m2/s) 1.0 × 10⁻¹⁰
Backfill porosity (–) 1.0 × 100
Waste diffusivity (m2/s) 1.0 × 10⁻⁹
Waste porosity (–) 1.0 × 100
In Figure B-2, the water flow through the system is shown and it can be seen that most of the water in the fracture avoid going through the backfill and only a small portion of the water that enters the fracture go through the waste.
Figure B‑2. The blue flow lines show the flow of water not passing through the backfill and the red flow lines show the flow of water that goes through the waste.
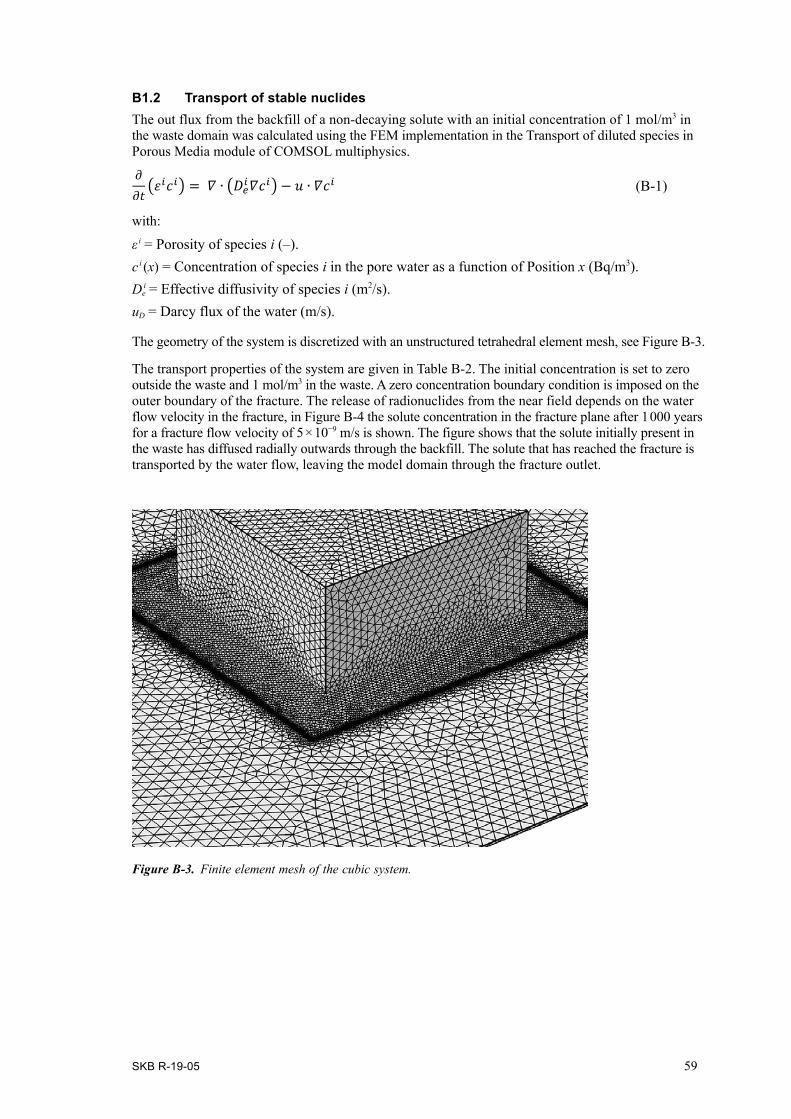
SKB R-19-05 59
B1.2 Transport of stable nuclidesThe out flux from the backfill of a non-decaying solute with an initial concentration of 1 mol/m3 in the waste domain was calculated using the FEM implementation in the Transport of diluted species in Porous Media module of COMSOL multiphysics.
(B-1)
with:
ε i = Porosity of species i (–).ci (x) = Concentration of species i in the pore water as a function of Position x (Bq/m3).D i
e = Effective diffusivity of species i (m2/s).uD = Darcy flux of the water (m/s).
The geometry of the system is discretized with an unstructured tetrahedral element mesh, see Figure B-3.
The transport properties of the system are given in Table B-2. The initial concentration is set to zero outside the waste and 1 mol/m3 in the waste. A zero concentration boundary condition is imposed on the outer boundary of the fracture. The release of radionuclides from the near field depends on the water flow velocity in the fracture, in Figure B-4 the solute concentration in the fracture plane after 1 000 years for a fracture flow velocity of 5 × 10⁻⁹ m/s is shown. The figure shows that the solute initially present in the waste has diffused radially outwards through the backfill. The solute that has reached the fracture is transported by the water flow, leaving the model domain through the fracture outlet.
Figure B‑3. Finite element mesh of the cubic system.
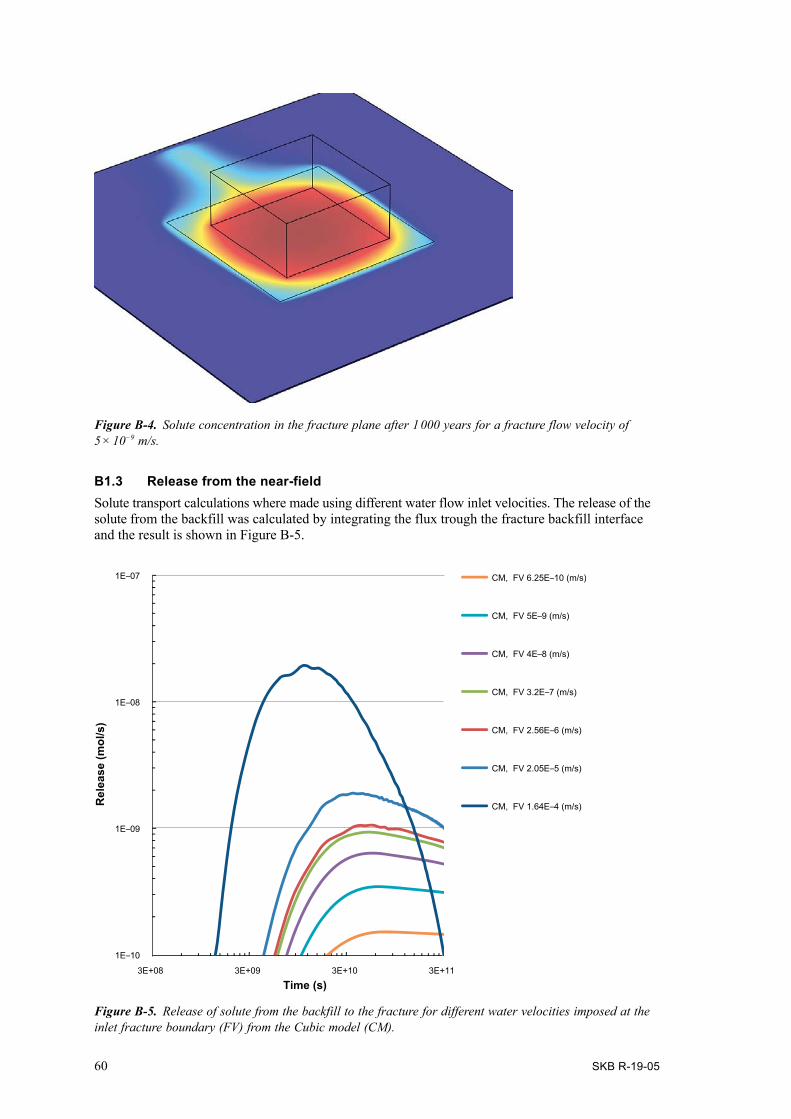
60 SKB R-19-05
B1.3 Release from the near-fieldSolute transport calculations where made using different water flow inlet velocities. The release of the solute from the backfill was calculated by integrating the flux trough the fracture backfill interface and the result is shown in Figure B-5.
Figure B‑4. Solute concentration in the fracture plane after 1 000 years for a fracture flow velocity of 5 × 10⁻⁹ m/s.
Figure B‑5. Release of solute from the backfill to the fracture for different water velocities imposed at the inlet fracture boundary (FV) from the Cubic model (CM).
1E–10
1E–09
1E–08
1E–07
3E+08 3E+09 3E+10
Rel
ease
(mol
/s)
3E+11
Time (s)
CM, FV 6.25E–10 (m/s)
CM, FV 5E–9 (m/s)
CM, FV 4E–8 (m/s)
CM, FV 3.2E–7 (m/s)
CM, FV 2.56E–6 (m/s)
CM, FV 2.05E–5 (m/s)
CM, FV 1.64E–4 (m/s)
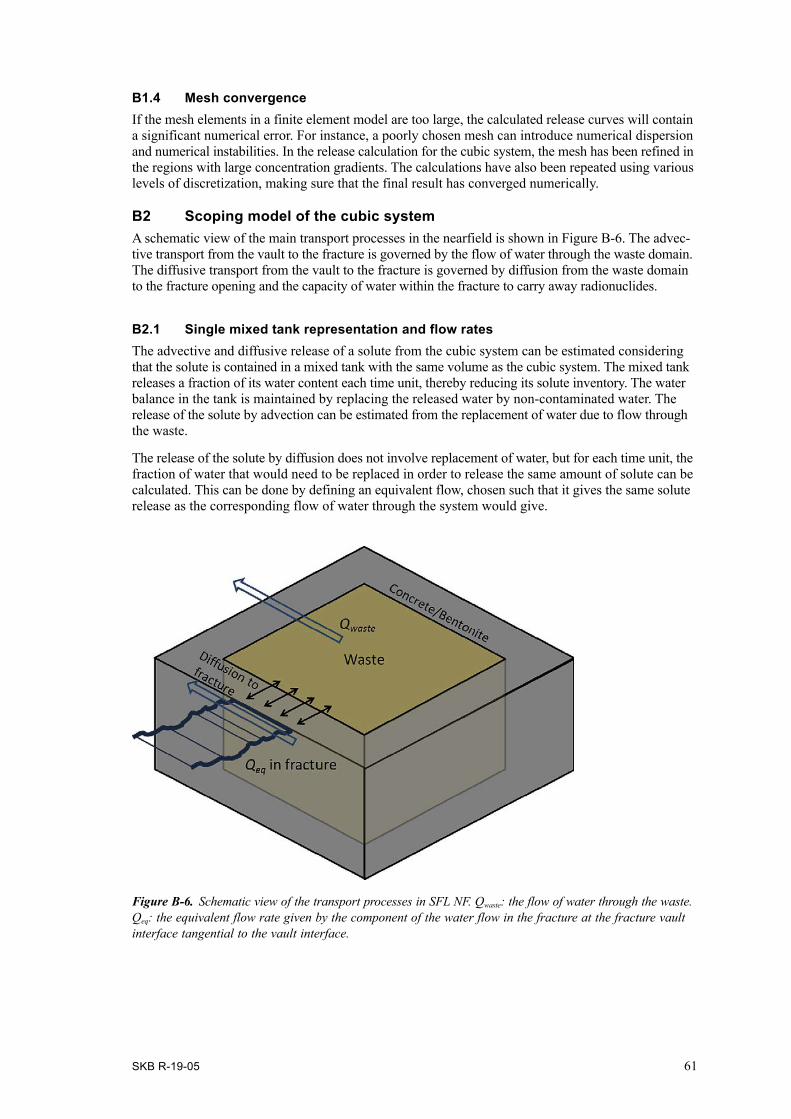
SKB R-19-05 61
B1.4 Mesh convergenceIf the mesh elements in a finite element model are too large, the calculated release curves will contain a significant numerical error. For instance, a poorly chosen mesh can introduce numerical dispersion and numerical instabilities. In the release calculation for the cubic system, the mesh has been refined in the regions with large concentration gradients. The calculations have also been repeated using various levels of discretization, making sure that the final result has converged numerically.
B2 Scoping model of the cubic systemA schematic view of the main transport processes in the nearfield is shown in Figure B-6. The advec-tive transport from the vault to the fracture is governed by the flow of water through the waste domain. The diffusive transport from the vault to the fracture is governed by diffusion from the waste domain to the fracture opening and the capacity of water within the fracture to carry away radionuclides.
B2.1 Single mixed tank representation and flow ratesThe advective and diffusive release of a solute from the cubic system can be estimated considering that the solute is contained in a mixed tank with the same volume as the cubic system. The mixed tank releases a fraction of its water content each time unit, thereby reducing its solute inventory. The water balance in the tank is maintained by replacing the released water by non-contaminated water. The release of the solute by advection can be estimated from the replacement of water due to flow through the waste.
The release of the solute by diffusion does not involve replacement of water, but for each time unit, the fraction of water that would need to be replaced in order to release the same amount of solute can be calculated. This can be done by defining an equivalent flow, chosen such that it gives the same solute release as the corresponding flow of water through the system would give.
Figure B‑6. Schematic view of the transport processes in SFL NF. Qwaste: the flow of water through the waste. Qeq: the equivalent flow rate given by the component of the water flow in the fracture at the fracture vault interface tangential to the vault interface.

62 SKB R-19-05
The total effective amount of water released per time unit can be estimated by the expression:
(B-2)
where:
Qwaste = The flow of water through the waste (m3/s).Qeq = The capacity of ground water in the fracture to carry away a solute (m3/s).Res = Transport resistance of the backfill (s/m3).
The release of solute from the tank is given by the equation:
(B-3)
where:
N = The solute flux from the vault (mol/s).V = The volume of the mixed tank (m3).c = The solute concentration in the mixed tank (mol/m3).
Equation (B-3) is a first order differential equation and the solute release from the system is given by its solution.
(B-4)
In Section B2.3, all the parameters on the right hand side of Equation (B-2) are estimated from the basic properties of the cubic system. An alternative way of estimating Qtot is given in the section below.
B2.2 Extraction of transport parameters from the conceptual modelThe flow of water through the waste, Qwaste, the capacity of ground water in the fracture to carry away a solute, Qeq and the transport resistance of the backfill, Res, can be extracted from the Cubic model considering that:
•••
(B-5)
where: vin is the fracture inlet water flow velocity.
Also note that if the solute concentration in the waste domain is set to a constant value of 1 mol/m3 in the finite element model, the steady state solute release from the vault would be equivalent to the Qtot in the mixed tank model. If the mixed tank model is correct, the steady state solute flux from the vault as a function of the fracture water flow velocity is thus expected to be approximately:
(B-6)
where: A, B and C are constant parameters.
Figure B-7 shows the solute flux from the vault, obtained from a time independent solution of the finite element model, with a solute concentration of 1 mol/m3 in the waste domain as a function of the fracture inlet water flow velocity.
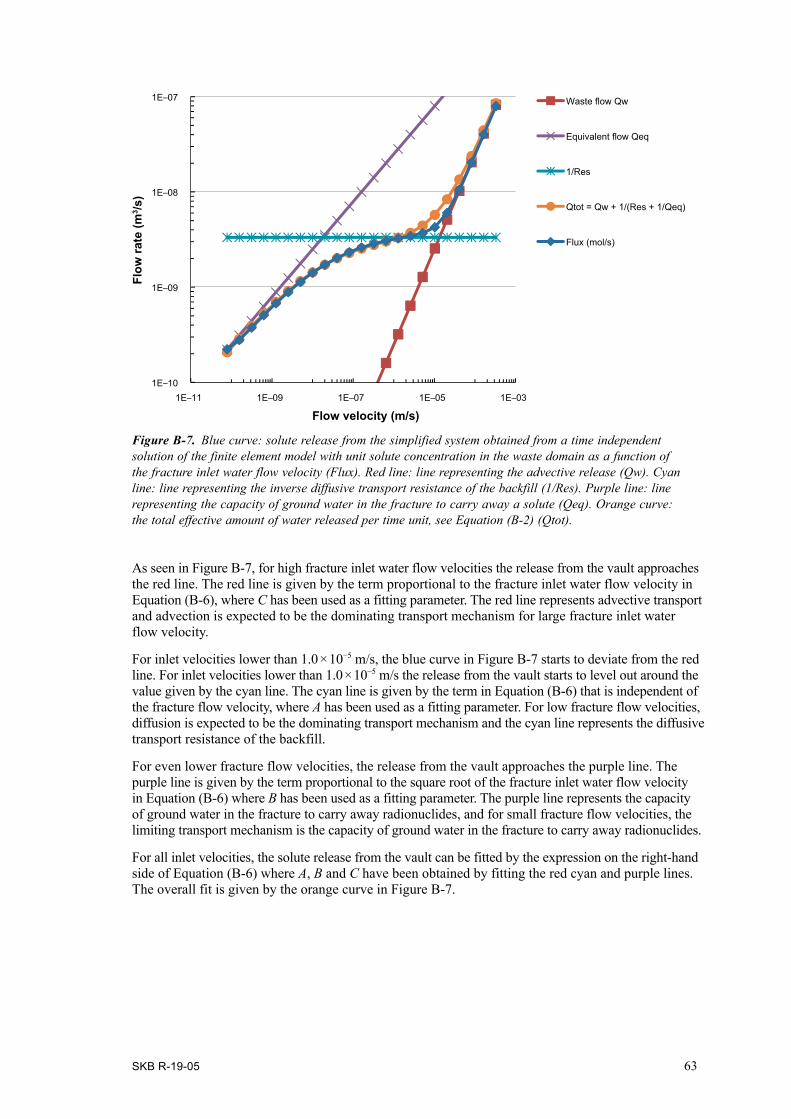
SKB R-19-05 63
As seen in Figure B-7, for high fracture inlet water flow velocities the release from the vault ap proaches the red line. The red line is given by the term proportional to the fracture inlet water flow velocity in Equation (B-6), where C has been used as a fitting parameter. The red line represents advective transport and advection is expected to be the dominating transport mechanism for large fracture inlet water flow velocity.
For inlet velocities lower than 1.0 × 10⁻⁵ m/s, the blue curve in Figure B-7 starts to deviate from the red line. For inlet velocities lower than 1.0 × 10⁻⁵ m/s the release from the vault starts to level out around the value given by the cyan line. The cyan line is given by the term in Equation (B-6) that is independent of the fracture flow velocity, where A has been used as a fitting parameter. For low fracture flow velocities, diffusion is expected to be the dominating transport mechanism and the cyan line represents the diffusive transport resistance of the backfill.
For even lower fracture flow velocities, the release from the vault approaches the purple line. The purple line is given by the term proportional to the square root of the fracture inlet water flow velocity in Equation (B-6) where B has been used as a fitting parameter. The purple line represents the capacity of ground water in the fracture to carry away radionuclides, and for small fracture flow velocities, the limiting transport mechanism is the capacity of ground water in the fracture to carry away radionuclides.
For all inlet velocities, the solute release from the vault can be fitted by the expression on the right-hand side of Equation (B-6) where A, B and C have been obtained by fitting the red cyan and purple lines. The overall fit is given by the orange curve in Figure B-7.
Figure B‑7. Blue curve: solute release from the simplified system obtained from a time independent solution of the finite element model with unit solute concentration in the waste domain as a function of the fracture inlet water flow velocity (Flux). Red line: line representing the advective release (Qw). Cyan line: line representing the inverse diffusive transport resistance of the backfill (1/Res). Purple line: line representing the capacity of ground water in the fracture to carry away a solute (Qeq). Orange curve: the total effective amount of water released per time unit, see Equation (B-2) (Qtot).
1E–10
1E–09
1E–08
1E–07
1E–11 1E–09 1E–05 1E–03
Flow
rate
(m3 /s
)
1E–07
Flow velocity (m/s)
Waste flow Qw
Equivalent flow Qeq
1/Res
Qtot = Qw + 1/(Res + 1/Qeq)
Flux (mol/s)
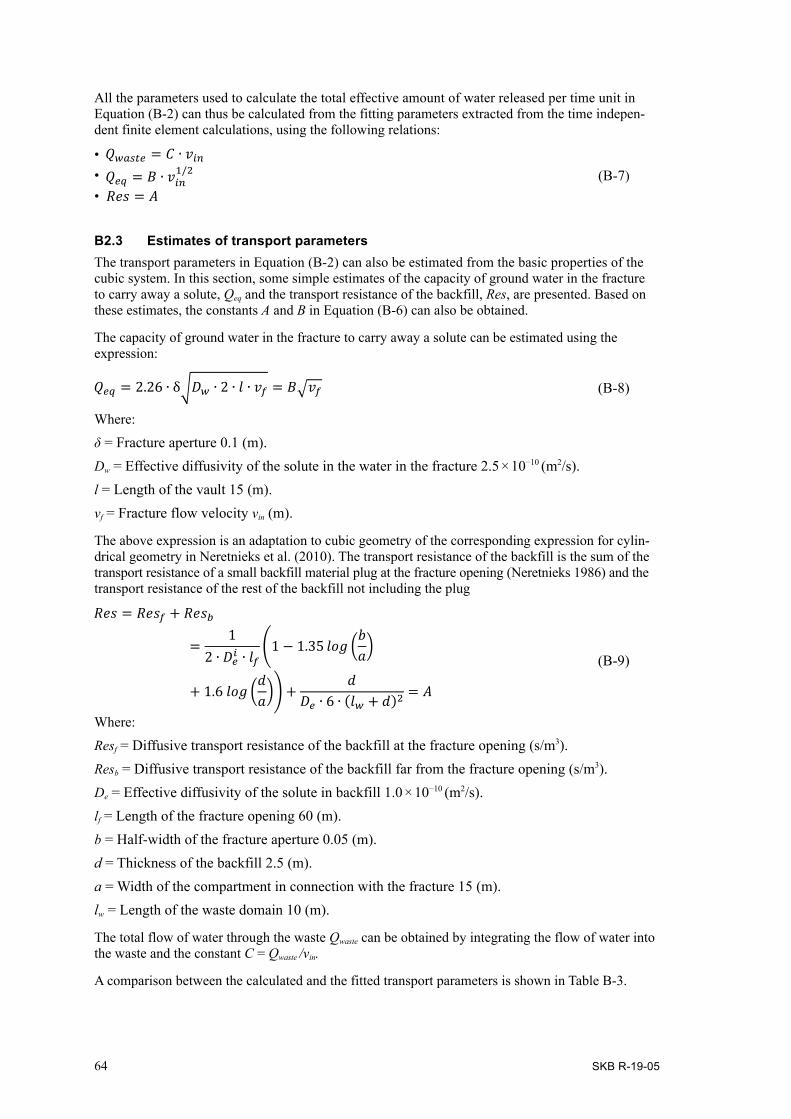
64 SKB R-19-05
All the parameters used to calculate the total effective amount of water released per time unit in Equation (B-2) can thus be calculated from the fitting parameters extracted from the time indepen-dent finite element calculations, using the following relations:
•••
(B-7)
B2.3 Estimates of transport parametersThe transport parameters in Equation (B-2) can also be estimated from the basic properties of the cubic system. In this section, some simple estimates of the capacity of ground water in the fracture to carry away a solute, Qeq and the transport resistance of the backfill, Res, are presented. Based on these estimates, the constants A and B in Equation (B-6) can also be obtained.
The capacity of ground water in the fracture to carry away a solute can be estimated using the expression:
(B-8)
Where:
δ = Fracture aperture 0.1 (m).Dw = Effective diffusivity of the solute in the water in the fracture 2.5 × 10⁻¹⁰ (m2/s).l = Length of the vault 15 (m).vf = Fracture flow velocity vin (m).
The above expression is an adaptation to cubic geometry of the corresponding expression for cylin-drical geometry in Neretnieks et al. (2010). The transport resistance of the backfill is the sum of the transport resistance of a small backfill material plug at the fracture opening (Neretnieks 1986) and the transport resistance of the rest of the backfill not including the plug
(B-9)
Where:
Resf = Diffusive transport resistance of the backfill at the fracture opening (s/m3).Resb = Diffusive transport resistance of the backfill far from the fracture opening (s/m3).De = Effective diffusivity of the solute in backfill 1.0 × 10⁻¹⁰ (m2/s).lf = Length of the fracture opening 60 (m).b = Half-width of the fracture aperture 0.05 (m).d = Thickness of the backfill 2.5 (m).a = Width of the compartment in connection with the fracture 15 (m).lw = Length of the waste domain 10 (m).
The total flow of water through the waste Qwaste can be obtained by integrating the flow of water into the waste and the constant C = Qwaste /vin.
A comparison between the calculated and the fitted transport parameters is shown in Table B-3.
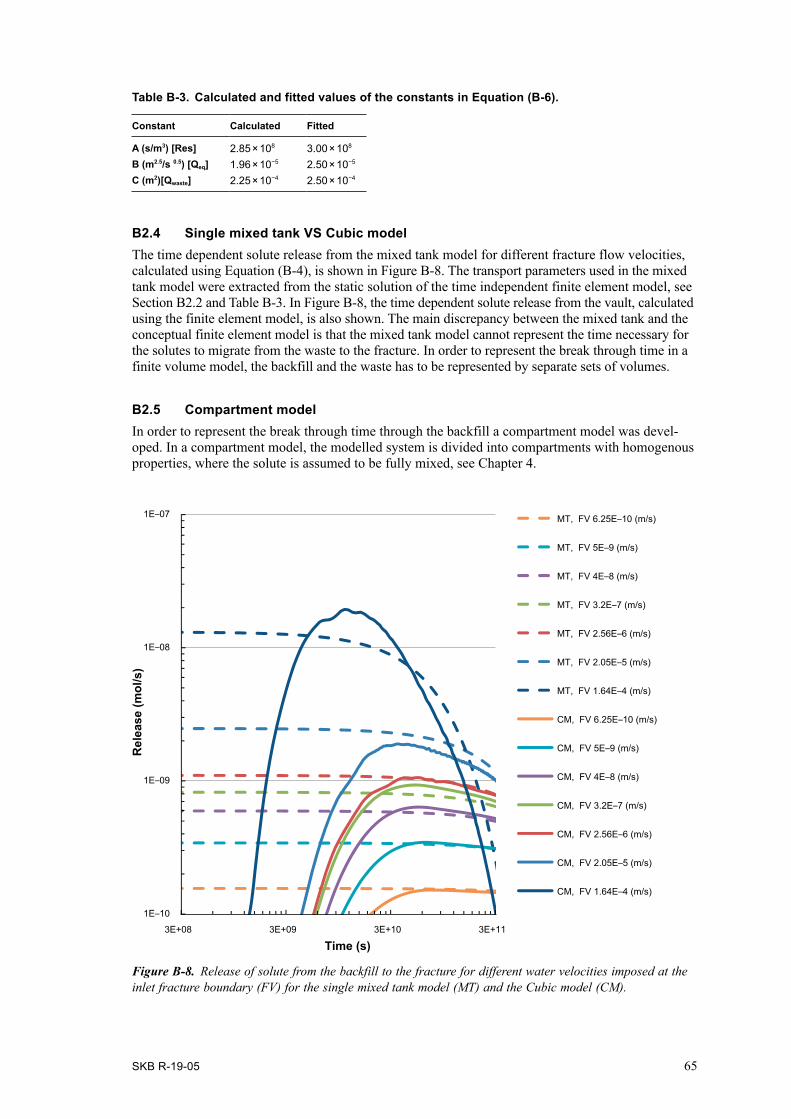
SKB R-19-05 65
Table B-3. Calculated and fitted values of the constants in Equation (B-6).
Constant Calculated Fitted
A (s/m3) [Res] 2.85 × 10⁸ 3.00 × 10⁸
B (m2.5/s 0.5) [Qeq] 1.96 × 10⁻⁵ 2.50 × 10⁻⁵
C (m2)[Qwaste] 2.25 × 10⁻⁴ 2.50 × 10⁻⁴
B2.4 Single mixed tank VS Cubic modelThe time dependent solute release from the mixed tank model for different fracture flow velocities, calculated using Equation (B-4), is shown in Figure B-8. The transport parameters used in the mixed tank model were extracted from the static solution of the time independent finite element model, see Section B2.2 and Table B-3. In Figure B-8, the time dependent solute release from the vault, calculated using the finite element model, is also shown. The main discrepancy between the mixed tank and the conceptual finite element model is that the mixed tank model cannot represent the time necessary for the solutes to migrate from the waste to the fracture. In order to represent the break through time in a finite volume model, the backfill and the waste has to be represented by separate sets of volumes.
B2.5 Compartment modelIn order to represent the break through time through the backfill a compartment model was devel-oped. In a compartment model, the modelled system is divided into compartments with homogenous properties, where the solute is assumed to be fully mixed, see Chapter 4.
Figure B‑8. Release of solute from the backfill to the fracture for different water velocities imposed at the inlet fracture boundary (FV) for the single mixed tank model (MT) and the Cubic model (CM).
1E–10
1E–09
1E–08
1E–07
3E+08 3E+09 3E+10
Rel
ease
(mol
/s)
3E+11
Time (s)
MT, FV 6.25E–10 (m/s)
MT, FV 5E–9 (m/s)
MT, FV 4E–8 (m/s)
MT, FV 3.2E–7 (m/s)
MT, FV 2.56E–6 (m/s)
MT, FV 2.05E–5 (m/s)
MT, FV 1.64E–4 (m/s)
CM, FV 6.25E–10 (m/s)
CM, FV 5E–9 (m/s)
CM, FV 4E–8 (m/s)
CM, FV 3.2E–7 (m/s)
CM, FV 2.56E–6 (m/s)
CM, FV 2.05E–5 (m/s)
CM, FV 1.64E–4 (m/s)
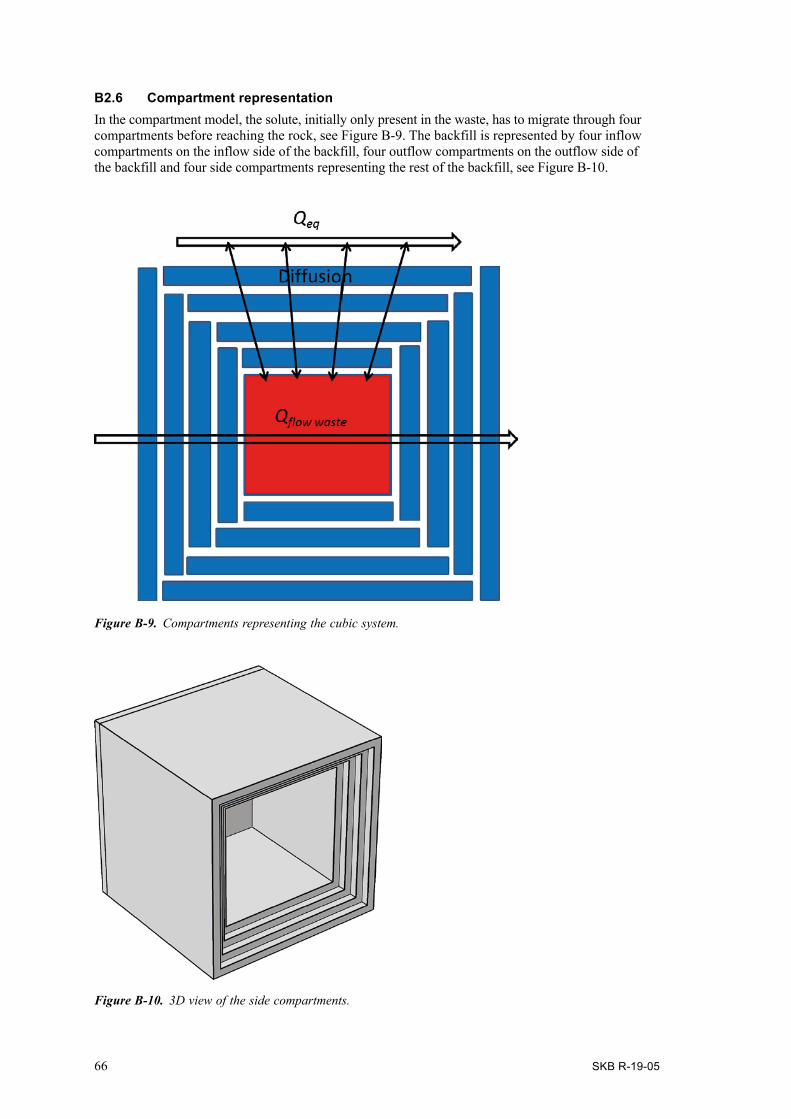
66 SKB R-19-05
B2.6 Compartment representationIn the compartment model, the solute, initially only present in the waste, has to migrate through four compartments before reaching the rock, see Figure B-9. The backfill is represented by four inflow compartments on the inflow side of the backfill, four outflow compartments on the outflow side of the backfill and four side compartments representing the rest of the backfill, see Figure B-10.
Figure B‑9. Compartments representing the cubic system.
Figure B‑10. 3D view of the side compartments.
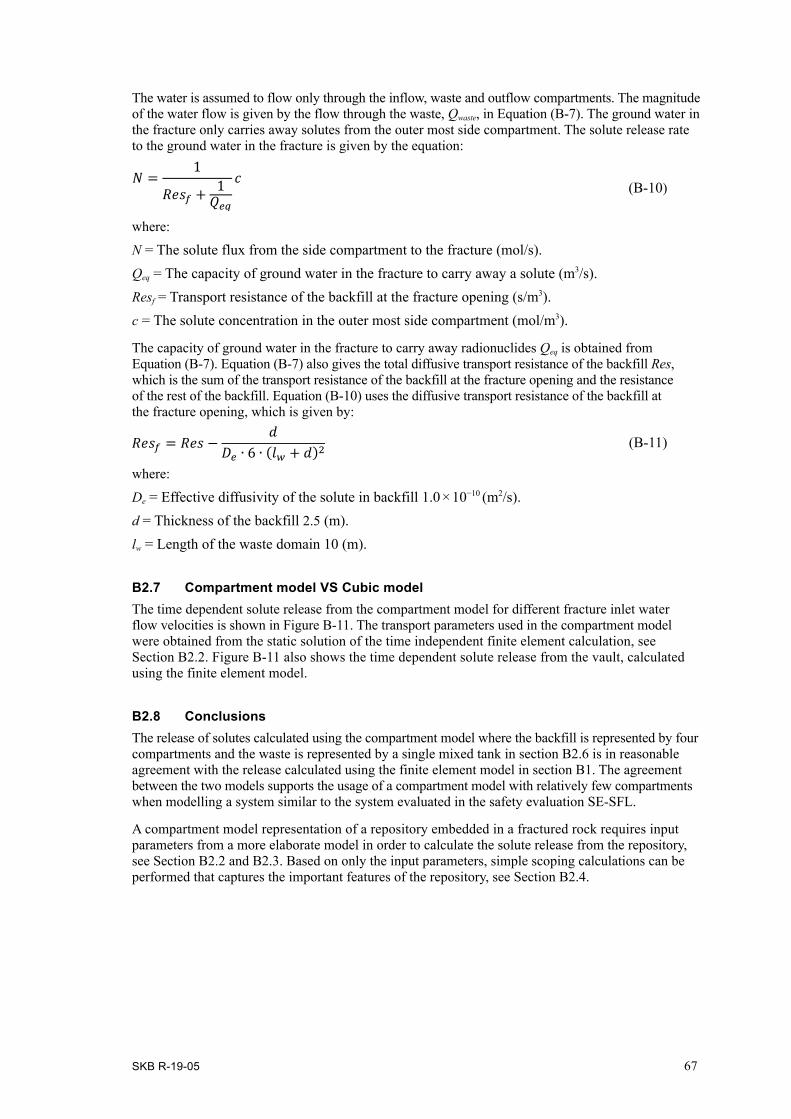
SKB R-19-05 67
The water is assumed to flow only through the inflow, waste and outflow compartments. The magnitude of the water flow is given by the flow through the waste, Qwaste, in Equation (B-7). The ground water in the fracture only carries away solutes from the outer most side compartment. The solute release rate to the ground water in the fracture is given by the equation:
(B-10)
where:
N = The solute flux from the side compartment to the fracture (mol/s).Qeq = The capacity of ground water in the fracture to carry away a solute (m3/s).Resf = Transport resistance of the backfill at the fracture opening (s/m3).c = The solute concentration in the outer most side compartment (mol/m3).
The capacity of ground water in the fracture to carry away radionuclides Qeq is obtained from Equation (B-7). Equation (B-7) also gives the total diffusive transport resistance of the backfill Res, which is the sum of the transport resistance of the backfill at the fracture opening and the resistance of the rest of the backfill. Equation (B-10) uses the diffusive transport resistance of the backfill at the fracture opening, which is given by:
(B-11)
where:
De = Effective diffusivity of the solute in backfill 1.0 × 10⁻¹⁰ (m2/s).d = Thickness of the backfill 2.5 (m).lw = Length of the waste domain 10 (m).
B2.7 Compartment model VS Cubic modelThe time dependent solute release from the compartment model for different fracture inlet water flow velocities is shown in Figure B-11. The transport parameters used in the compartment model were obtained from the static solution of the time independent finite element calculation, see Section B2.2. Figure B-11 also shows the time dependent solute release from the vault, calculated using the finite element model.
B2.8 ConclusionsThe release of solutes calculated using the compartment model where the backfill is represented by four compartments and the waste is represented by a single mixed tank in section B2.6 is in reasonable agreement with the release calculated using the finite element model in section B1. The agreement between the two models supports the usage of a compartment model with relatively few compartments when modelling a system similar to the system evaluated in the safety evaluation SE-SFL.
A compartment model representation of a repository embedded in a fractured rock requires input parameters from a more elaborate model in order to calculate the solute release from the repository, see Section B2.2 and B2.3. Based on only the input parameters, simple scoping calculations can be performed that captures the important features of the repository, see Section B2.4.
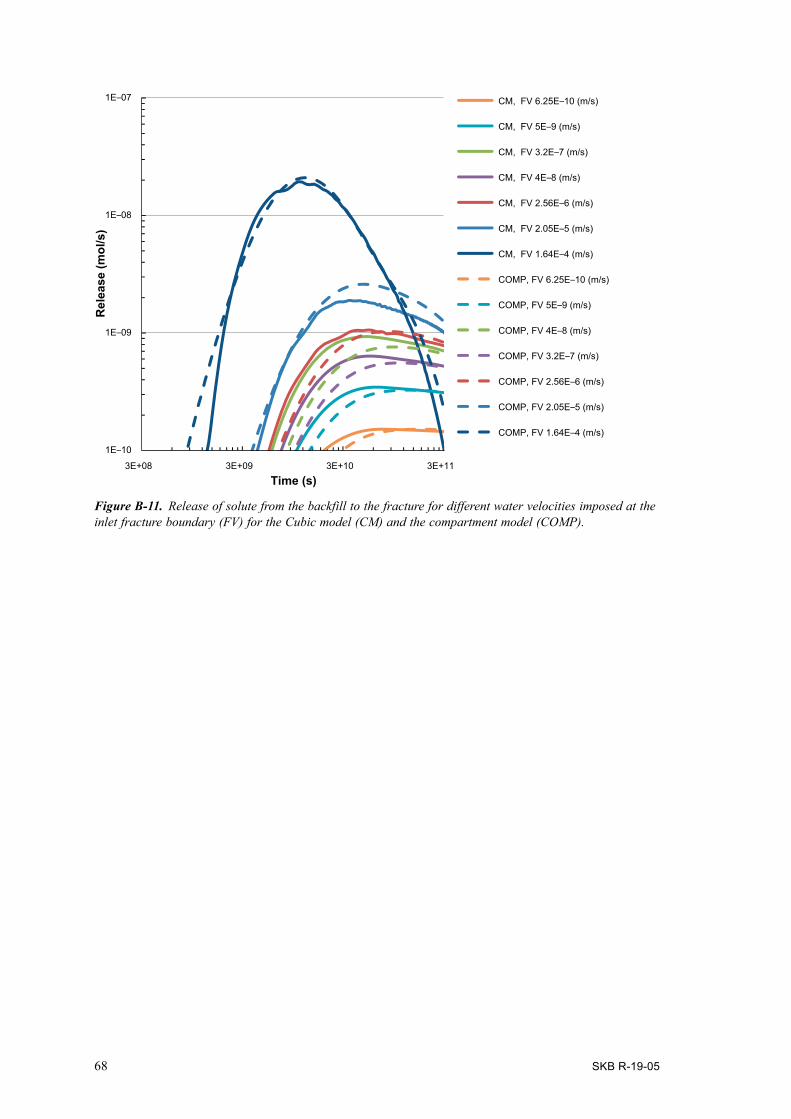
68 SKB R-19-05
Figure B‑11. Release of solute from the backfill to the fracture for different water velocities imposed at the inlet fracture boundary (FV) for the Cubic model (CM) and the compartment model (COMP).
1E–10
1E–09
1E–08
1E–07
3E+08 3E+09 3E+10
Rel
ease
(mol
/s)
3E+11
Time (s)
CM, FV 6.25E–10 (m/s)
CM, FV 5E–9 (m/s)
CM, FV 3.2E–7 (m/s)
CM, FV 4E–8 (m/s)
CM, FV 2.56E–6 (m/s)
CM, FV 2.05E–5 (m/s)
CM, FV 1.64E–4 (m/s)
COMP, FV 6.25E–10 (m/s)
COMP, FV 5E–9 (m/s)
COMP, FV 4E–8 (m/s)
COMP, FV 3.2E–7 (m/s)
COMP, FV 2.56E–6 (m/s)
COMP, FV 2.05E–5 (m/s)
COMP, FV 1.64E–4 (m/s)


Arkite
ktkop
ia AB
, Bro
mm
a, 20
19
SVENSK KÄRNBRÄNSLEHANTERING
SKB is responsible for managing spent nuclear fuel and radioactive
waste produced by the Swedish nuclear power plants such that man
and the environment are protected in the near and distant future.
skb.se