DEVELOPMENT OF PULSED FIBRE LASERS AND … · 2.3 Optical Kerr effect and SPM 17 ... CHAPTER 3...
161
DEVELOPMENT OF PULSED FIBRE LASERS AND SUPERCONTINUUM LIGHT SOURCE BASED ON NONLINEAR EFFECT ARMAN ZAREI THESIS SUBMITTED IN FULFILLMENT OF THE REQUIREMENT FOR THE DEGREE OF DOCTOR OF PHILOSOPHY DEPARTMENT OF ELECTRICAL ENGINEERING FACULTY OF ENGINEERING UNIVERSITY OF MALAYA KUALA LUMPUR 2015
Transcript of DEVELOPMENT OF PULSED FIBRE LASERS AND … · 2.3 Optical Kerr effect and SPM 17 ... CHAPTER 3...

DEVELOPMENT OF PULSED FIBRE LASERS AND
SUPERCONTINUUM LIGHT SOURCE BASED ON
NONLINEAR EFFECT
ARMAN ZAREI
THESIS SUBMITTED IN FULFILLMENT OF THE
REQUIREMENT FOR THE DEGREE OF
DOCTOR OF PHILOSOPHY
DEPARTMENT OF ELECTRICAL ENGINEERING
FACULTY OF ENGINEERING
UNIVERSITY OF MALAYA
KUALA LUMPUR
2015

UNIVERSITI MALAYA
ORIGINAL LITERARY WORK DECLARATION
Name of Candidate: ARMAN ZAREI (I.C/Passport No: H95658835)
Registration/Matric No: KHA120034
Name of Degree: DOCTOR OF PHILOSOPHY
Title of Project Paper/Research Report/Dissertation/Thesis (“this Work”):
DEVELOPMENT OF PULSED FIBRE LASERS AND SUPERCONTINUUM LIGHT
SOURCE BASED ON NONLINEAR EFFECT
Field of Study: Photonics
I do solemnly and sincerely declare that:
(1) I am the sole author/writer of this Work;
(2) This Work is original;
(3) Any use of any work in which copyright exists was done by way of fair dealing
and for permitted purposes and any excerpt or extract from, or reference to or
reproduction of any copyright work has been disclosed expressly and
sufficiently and the title of the Work and its authorship have been acknowledged
in this Work;
(4) I do not have any actual knowledge nor do I ought reasonably to know that the
making of this work constitutes an infringement of any copyright work;
(5) I hereby assign all and every rights in the copyright to this Work to the
University of Malaya (“UM”), who henceforth shall be owner of the copyright
in this Work and that any reproduction or use in any form or by any means
whatsoever is prohibited without the written consent of UM having been first
had and obtained;
(6) I am fully aware that if in the course of making this Work I have infringed any
copyright whether intentionally or otherwise, I may be subject to legal action or
any other action as may be determined by UM.
Candidate’s Signature Date
Subscribed and solemnly declared before,
Witness’s Signature Date
Name:
Designation:

iii
ABSTRACT
This thesis aims to investigate and demonstrate the generation of different types of pulse
lasers and supercontinuum (SC) light based on nonlinear effects. At first, Brillouin fiber
laser (BFL) is demonstrated using a long piece of Single mode fiber (SMF), Erbium-
doped fiber (EDF) and highly nonlinear fiber (HNLF) as the gain medium. With 10 km
long SMF, the BFL exhibits temporal characteristics where the pulse width and repetition
frequency of the laser are obtained at 440 µs and 2 kHz, respectively. The Brillouin
Erbium fiber laser (BEFL) also shows a self-pulsing characteristic with repetition rates
of 66.7 kHz while mode-locked BFL is obtained by replacing the SMF with a 100m-long
HNLF. Several passively mode-locked and Q-switched fiber lasers are then demonstrated
based on nonlinear effects inside the ring laser cavity. For instance, a nanosecond optical
pulse operating in fundamental mode is successfully generated in the EDF laser (EDFL)
cavity by incorporating a 100 m long HNLF based on nonlinear polarization rotation
(NPR) technique. The laser operates at 1567.2 nm and produced a pulse train with a
repetition rate of 1.56 MHz, pulse width of 297 ns and the maximum pulse energy of 1.4
nJ. SC generation is then demonstrated by launching Q-switched mode-locking (QML),
continuous-wave mode-locking (CWML) and dark pulse trains into various nonlinear
fibers. With the amplified QML laser, the SC ranging from 1350 nm and 1900 nm has
been successfully generated in 100 m long HNLF. With the amplified dark pulse, SC
ranging from 1200 nm to 1810 nm, 1200 nm to 1920 nm and 1480 nm to 1740 nm are
produced with the use of 50 m long photonic Crystal fiber (PCF), 100 m long HNLF and
20 km long PCF, respectively. Pulsed lasers have many applications in micromachining
while super-continuum light sources are very useful for spectroscopy, frequency
metrology, device characterization and medical science.

iv
ABSTRAK
Tesis ini bertujuan untuk menyiasat dan mendemonstrasi generasi pelbagai jenis laser
denyut dan cahaya super-kontinum (SC) berdasarkan kesan tak-linear. Pada mulanya,
laser gentian Brillouin (BFL) didemonstrari menggunakan sekeping panjang gentian
SMF, gentian Erbium-didopkan (EDF) dan gentian sangat tak-linear (HNLF) sebagai
medium gandaan. Dengan SMF 10 km panjang yang mempamerkan ciri-ciri BFL
sementara, masing-masing lebar denyut dan frekuensi kekerapan laser yang diperolehi
adalah 440 μs dan 2 kHz. Laser gentian Brillouin Erbium (BEFL) ini juga menunjukkan
ciri-ciri berdenyut sendiri dengan kadar pengulangan 66.7 kHz manakala mod-kunci BFL
diperolehi dengan menggantikan SMF dengan HNLF 100m panjang. Beberapa pasif
mod-kunci dan gentian laser Q-suis kemudian didemonstrasi berdasarkan kesan tak-
linear dalam rongga cincin laser. Sebagai contoh, satu denyutan optik nano-saat
beroperasi dalam mod asas berjaya dijanakan dalam rongga laser EDF (EDFL) dengan
menggabungkan HNLF 100 m panjang berdasarkan teknik putaran polarisasi tak-linear
(NPR). Laser beroperasi pada 1567,2 nm dan menghasilkan rantaian denyut dengan kadar
pengulangan 1.56 MHz, lebar denyut 297 ns dan tenaga denyut maksimum 1.4 nJ.
Generasi SC kemudian menunjukkan dengan melancarkan Q-suis mod-kunci (QML),
gelombang selanjar mod-kunci (CWML) dan rantaian denyut gelap ke dalam pelbagai
gentian tak-linear. Dengan QML laser yang dikuatkan, SC terdiri daripada 1350 nm dan
1900 nm telah berjaya dijana dalam HNLF 100 m panjang. Dengan rantaian denyut yang
dikuatkan, SC terdiri daripada 1200 nm hingga 1810 nm, 1200 nm hingga 1920 nm dan
1480 nm hingga 1740 nm, masing-masing dihasilkan dengan menggunakan PCF 50 m
panjang, HNLF 100 m panjang dan PCF 20 km panjang. Laser berdenyut mempunyai
banyak aplikasi dalam pemesinan mikro, manakala sumber cahaya super-kontinum
sangat berguna untuk spektroskopi, kekerapan metrologi, peranti pencirian dan sains
perubatan.

v
ACKNOWLEDGEMENT
I would like to express my greatest gratitude to my supervisor, Prof. Dr. Sulaiman
Wadi Harun for the continuous support, motivation, patience and knowledge throughout
my Ph.D study. I have been extremely lucky to have a supervisor who cared so much
about my work, and who responded to my questions and queries so promptly. Besides
Prof. Dr. Sulaiman Wadi Harun, I would like to thank my co-supervisor Prof. Dr. Harith
Ahmad for his advices.
My special thanks should go to the member of Photonics Research Center, Tiu
Zian Cheack, Dr. Ali Abdulhadi Jasim, Muneswaran Suthaskumar and all the photonics
members for their assistance as well as support throughout my research.
To my wife, parents and siblings, thank you for your endless love and continuous
support. I also wish to record my heartfelt thanks to my parents for showing great
understanding in allowing me and supporting me all the way till I completed my research
works.
Lastly, I wish to convey my heartfelt thanks to everyone who had helped me
directly or indirectly with my research.

vi
TABLE OF CONTENTS
ABSTRACT iii
ABSTRAK iv
ACKNOWLEDGEMENT v
TABLE OF CONTENTS vi
LIST OF FIGURES ix
LIST OF TABLES xiii
LIST OF SYMBOLS AND ABBREVIATIONS xiv
CHAPTER 1 INTRODUCTION 1
1.1 History Overview 1
1.2 Overview of pulsed lasers and motivation of the study 3
1.3 Thesis Objectives 6
1.4 Thesis layout 6
1.5 Original Contributions 8
CHAPTER 2 LITERATURE REVIEW ON NONLINEAR EFFECTS FOR
PULSED LASER AND SUPERCONTINUUM LIGHT SOURCE 10
2.1 Understanding Nonlinear Optics 10
2.2 Stimulated Brillouin Scattering (SBS) 13
2.3 Optical Kerr effect and SPM 17
2.4 Birefringence 19
2.5 Nonlinear Polarization Rotation 20
2.6 Pulsed Laser 21
2.6.1 Q-switching 22
2.6.2 Mode-locking 24
2.6.3 NPR based fiber lasers 26

vii
2.6.4 Soliton pulse 29
2.6.5 Dark soliton 33
2.7 Supercontinuum generation 34
CHAPTER 3 INVESTIGATION OF STIMULATED BRILLOUIN
SCATTERING FOR PULSE GENERATION 37
3.1 Introduction 37
3.2 SBS generation in 10 km long SMF and a few cm long microfiber 38
3.2.1 SBS in 10 km long SMF 39
3.2.2 Brillouin Scattering in microfiber 41
3.3 Spectrum and temporal characteristics of BFL 53
3.4 Brillouin Erbium fiber laser 59
3.5 Generation of nanosecond pulse with highly nonlinear fiber (HNLF) based on SBS
68
3.5.1 Configuration of the proposed mode-locked BFL 68
3.5.2 The performance of the nanosecond mode-locked BFL 69
3.6 Summary 72
CHAPTER 4 DEVELOPMENT OF PULSED LASER BASED ON NONLINEAR
EFFECTS 74
4.1 Introduction 74
4.2 Harmonic mode-locked EDFL based on NPR effect in a ring laser cavity with
assistance from a 10 km long single-mode fiber 75
4.3 Generation of nanosecond pulse with a HNLF 82
4.4 Q-switched EDFL with HNLF in NOLM cavity 87
4.4.1 Configuration of the proposed NOLM cavity 88
4.4.2 Q-switching performance 89

viii
4.5 Q-switched Brillouin fiber laser with MWCNT SA 92
4.5.1 SA preparation and experimental setup 94
4.5.2 Characteristics of SA 96
4.5.3 Performance of the Q-switched BFL 99
4.6 Summary 105
CHAPTER 5 SUPERCONTINUUM GENERATION 107
5.1 Introduction 107
5.2 SC generation by a continuous wave mode-locked and Q-switched mode-locked
fiber lasers 108
5.2.1 Experimental arrangement 109
5.2.2 Performance of QML and CWML EDFLs 110
5.2.3 Performance of the SC generation 116
5.3 Enhance SC generation with picosecond dark pulse 119
5.3.1 Experimental arrangement 120
5.3.2 Performance of the dark pulse and SC generations 121
5.4 Summary 125
CHAPTER 6 CONCLUSION AND FUTURE WORK 127
6.1 Conclusion 127
6.2 Future Outlooks 132
REFERENCES 133
LIST OF PUBLICATIONS 145
APPENDIX 146

ix
LIST OF FIGURES
Figure 2. 1 Classification of nonlinear effects in optical fiber 13
Figure 2. 2 Schematic diagram of the SBS process in an optical fiber 14
Figure 2. 3 Spectrum of reflected light from a long piece of SMF when the BP
wavelength is fixed at 1550 nm. 15
Figure 2. 4 Nonlinear polarization rotation of an ellipse as it propagates through a Kerr
medium. 21
Figure 2. 5 Operation principle of NPR 27
Figure 2. 6 Transmittivity due to NPR with different PC settings 29
Figure 2. 7 The plot of bright soliton with γ=1f (Jonsson, 2003) 32
Figure 2. 8 The shape of |A(z,t)|2 dark soliton (Jonsson, 2003) 34
Figure 3.1: Experimental setup for generating Brillouin scattering in the backward
direction. Ip and Is denote the intensities of the pump and Brillouin signal lights,
respectively. 40
Figure 3. 2 : The reflection spectrum are demonstrated in different input power. BP
reflection is due to BP Rayleigh scattering whereas the Brillouin Stokes (BS) and anti-
Stokes waves are generated by Brillouin scattering and degenerate four-wave mixing
process, respectively. 41
Figure 3. 3: Microscopic image for the fabricated non-adiabatic microfibre. 43
Figure 3. 4: The experimental setup for investigating the generation of Brillouin Stokes
signal in both adiabatic and non-adiabatic microfibres. 44
Figure 3. 5: The transmission spectra of the ASE for the three samples. 45
Figure 3. 6: The spectra of the launched BP and the back propagating Brillouin Stokes
for the three microfibre samples. 46
Figure 3. 7: The fabricated IMZI structure (a) schematic diagram and (b) microscopic
images for the three tapered regions of IMZI, where the images (i), (ii) and (iii)
represent the 2nd tapered region, interferometer region and 1st tapered region
respectively. 49
Figure 3. 8: The transmission spectra of the ASE for the IMZI. 50
Figure 3. 9: The spectra of the back propagating Brillouin Stokes for the IMZI and
sample 2. 50
Figure 3. 10: The SpBS with different launched BP power. 52
Figure 3. 11: The spectra of the back propagating Brillouin Stokes for different fiber
length, where the red and blue colors represent SMF with length of 200 m and 20 km
respectively and the green color represent sample 2 of the non-adiabatic microfiber 52
Figure 3. 12: Schematic diagram of the BFL using a 10 km long SMF as the gain
medium 54
Figure 3. 13: Output spectra of the BFL at various pump powers. 55

x
Figure 3. 14: The output peak power of the BFL against the BP at three different output
couplers. 56
Figure 3. 15: Temporal characteristic of the BFL at different BP power (a) 1.2 dBm, (b)
1.4 dBm (c) 1.6 dBm (d) >1.8 dBm 58
Figure 3. 16: The pulse width and Stokes peak power characteristic at different ratio of
BP power to the threshold pump power 59
Figure 3. 17: Configuration of the proposed BEFL 61
Figure 3. 18: Output spectrum from the BEFL and BFL 62
Figure 3. 19: a) Output spectra of the BEFL at various 1480 nm pump power. b) Inset
shows the peak power of the laser against the input 1480 nm pump power. 64
Figure 3. 20: The Stokes peak power against the BP power for both BEFL and BFL 65
Figure 3. 21: The output spectrum of the BEFL at different BP wavelengths 66
Figure 3. 22: Oscilloscope trace from the BEFL and BFL 67
Figure 3. 23: Schematic configuration of the proposed nanosecond BFL 69
Figure 3. 24: Output spectra of the BFL configured with HNLF at various BP power 70
Figure 3. 25: Typical pulse train of the proposed nanosecond BFL 71
Figure 3. 26: The RF spectrum of the nanosecond pulse BFL 72
Figure 4. 1: Experimental setup of the proposed EDFL for generating harmonic
nanosecond pulses. 77
Figure 4. 2: Typical pulse train at different pump powers, which produces a different
orders of harmonic (a) fundamental (b) 2nd (c) 3rd 79
Figure 4. 3: RF spectrum of the generated fundamental harmonic pulse 81
Figure 4. 4: Output spectra of the nanosecond pulses at different order of harmonics. 82
Figure 4. 5: Configuration of the passively mode-locked EDFL with a HNLF 83
Figure 4. 6: Typical output spectrum of the nanosecond pulse laser 84
Figure 4. 7: Typical pulse train of the nanosecond mode-locked EDFL 85
Figure 4. 8: Single pulse envelope 86
Figure 4. 9: RF spectrum of the nanosecond mode-locking pulse showing a SNR of
around 50 dB. 86
Figure 4. 10: Schematic configuration of the proposed Q-switched EDFL 88
Figure 4. 11: Q-switched pulse emission of the proposed EDFL at different pump power
90
Figure 4. 12: Output spectrum of the NOLM based Q-switched EDFL. 91
Figure 4. 13: The change of repetition rate and pulse width against pump power. 91
Figure 4. 14: Average output power and pulse energy of the laser against pump power
92

xi
Figure 4. 15: Schematic configuration of the proposed-switched BFL 95
Figure 4. 16: FESEM image of the prepared MWCNTs-PVA film 97
Figure 4. 17: Raman spectrum obtained from the MWCNTs-PVA film 97
Figure 4. 18: Transmission spectrum of the MWCNTs-PVA film 98
Figure 4. 19: Linear transmission curve of the MWCNTs-PVA film, which shows that
the saturable absorption and non saturable absorption of around 4% and 45%,
respectively 98
Figure 4. 20: Output spectrum of the proposed Q-switched BFL with MWCNTs-PVA
SA 100
Figure 4. 21: Output peak power of the BFL against the BP power with and without the
MWCNTs-PVA SA in the laser cavity. 100
Figure 4. 22: The typical oscilloscope trace from the BFL configured without the SA at
two different BP powers; 1.0 and 5.0 dBm. 102
Figure 4. 23: Typical pulse train of the Q-switched BFL at three different BP powers of
5.0, 5.5 and 6.0 dBm 104
Figure 4. 24: The RF spectrum of the Q-switched BFL at BP power of 5.5 dBm. 104
Figure 5. 1: Schematic diagram of experimental setup used for generating SC with
QML EDFL. 200 m ling SMF is incorporated in the ring EDFL’s cavity to change the
pulse train output from QML to CWML. 110
Figure 5. 2: Output spectrum of the QML laser at pump power of 145 mW. 111
Figure 5. 3: Temporal characteristic of the QML laser (a) Typical pulse train at pump
power of 145 mW, showing the Q-switching repetition rate of 49 kHz (b) A single pulse
envelop with mode-locking repetition rate of 9.4 MHz. 112
Figure 5. 4: Autocorrelation trace of the QML output pulse 113
Figure 5. 5: RF spectrum of the QML pulse at pump power of 145 mW. 113
Figure 5. 6: Output spectrum of the CWML pulse laser, which is obtained before being
launched into EDFA. 115
Figure 5. 7: Typical pulse train of the CWML pulse. 115
Figure 5. 8: RF spectrum of the CWML pulse at pump power of 145 mW 116
Figure 5. 9: SC spectra from the QML EDFL at various pump power 117
Figure 5. 10: SC spectra from the CWML EDFL at various pump power 118
Figure 5. 11: Comparison of SC generation between QML and bright pulse at the
maximum pump power of 18.0 dBm 119
Figure 5. 12: Experimental setup to investigate the SC generation with a dark pulse 121
Figure 5. 13: Typical dark pulse train obtained from the mode-locked EDFL 122
Figure 5. 14: Output spectrum from the mode-locked EDFL at pump power of 145 mW.
123

xii
Figure 5. 15: AC Sech2 pulse curve fitting with resolution of 100 fs. 123
Figure 5. 16: RF spectrum of the dark pulse soliton at pump power of 145 mW. 124
Figure 5. 17: Supercontinuum spectra at three different gain media using the amplified
dark pulse soliton. 125

xiii
LIST OF TABLES
Table 3. 1: Geometrical parameters of the microfibre samples 43

xiv
LIST OF SYMBOLS AND ABBREVIATIONS
𝐴𝑒𝑓𝑓 Effective area
𝐿𝑒𝑓𝑓 Effective length
𝛽2 Group velocity dispersion parameter
𝐼 Light intensity
𝛼 Nonlinear coefficient
𝑛2 Nonlinear refractive index
𝑛 Refractive index
𝑃𝑡ℎ Threshold Pump
𝑇 Transmittivity of light
𝜆 Wavelength
AC Auto-correlator
ASE Amplified Spontaneous Emission
BEFL Brillouin Erbium Fiber Laser
BFL Brillouin Fiber Laser
BP Brillouin Pump
BS Brillouin Spacing
BP Brillouin Pump
Cir Circulator
CW Continuous Wave
DCF Dispersion Compensating Fiber
DWDM Dense Wavelength Division Multiplexing
EDF Erbium Doped Fiber
EDFA Erbium Doped Fiber Amplifier
FWHM Full Width Half Maximum
FWM Four-Wave Mixing
GVD Group Velocity Dispersion
HNLF Highly Nonlinear Fiber
IMZI Inline microfibre Mach–Zehnder interferometer

xv
NLSE Nonlinear Schrödinger Equation
NPR Nonlinear Polarization Rotation
NZ-DSF Non-zero Dispersion Shifted fiber
OSA Optical Spectrum Analyzer
OSC Oscilloscope
OSNR Optical Signal to Noise Ratio
OTDM Optical Time Division Multiplexing
PCF Photonic Crystal Fiber
RFSA Radio Frequency Spectrum Analyzer
SA Saturable Absorber
SBS Stimulated Brillouin Scattering
SEM Scanning Electron Microscope
SMF Single Mode Fiber
SNR Signal to Noise ratio
SOA Semiconductor Optical Amplifier
SPM Self Phase Modulation
SRS Stimulated Raman Scattering
TDM Time Division Multiplexing
TLS Tunable Laser Source
WDM Wavelength Division Multiplexing
XPM Cross Phase Modulation

1
CHAPTER 1
INTRODUCTION
1.1 History Overview
The first laser was realized by Maiman (Maiman, 1960) based on a ruby crystal
pumped by a Xenon flash discharge. It was a laser pulse with pulse duration ranging from
microsecond to millisecond. Later that year, Javan(Javanet al., 2013) demonstrated the
first Helium-Neon (He-Ne) laser operating in continuous wave (CW) mode. Other
researchers saw the potential in Maiman’s work and decided to take steps in furthering
this research. They began incorporating different substrates and rare-earth ions such as
Erbium, Neodymium, Ytterbium, Holmium, Praseodymium and even Uranium. This
leads to the invention of the Neodymium – Yttrium Aluminum Garnet (Nd-YAG) laser
in 1964 (Geusic et al., 1964).
In 1961 Hellwarth (Hellwarth, 1961) proposed the concept of Q-switching, a
process in which the laser is forced to emit pulses with duration on the order of several
times the round trip propagation time of light in the laser cavity. Then, the proposal of
achieving shorter pulses came using the concept of mode-locking. By constructive
interference, a short pulse is formed when many longitudinal modes are held in phase in
a laser resonator. There are various techniques that have been employed, usually are
grouped under two categories active and passive mode-locking. Active mode-locking
uses a modulator inside the laser resonator, whereas passive scheme uses a saturable
absorber to lock the relative phase. The first active mode-locking of He-Ne laser was
demonstrated by Hargrove et. al. (Hargrove et al., 1964) in 1964. Shortly after, in 1965,
Mocker and Collins (Mocker et al., 1965) showed the first passive mode-locking laser
using a saturable dye in ruby laser cavity. The first pulses shorter than 1 𝑝𝑠 were obtained
by Shank and Ippen (Shank et al., 1974) in 1974. They demonstrated the first femtosecond

2
pulses using a tunable broad gain dye laser media in combination with a saturable dye
absorber.
The concept of a fiber laser was firstly proposed and demonstrated by Snitzer in
1961 (Snitzer, 1961). Early works on fiber lasers was mainly focused on Neodymium-
doped multimode fibers, which operate at 1060 nm region. Since then, fiber lasers have
always been an active research area but did not really attract much attention until the late
1980s after low loss rare-earth-doped fibers were demonstrated (Poole et al., 1985).Since
that time Erbium doped fiber lasers (EDFLs) have received much attention because of the
lasing wavelength of 1550 nm, which coincides with the low loss window of standard
fiber. The first CW EDFL was reported by Mears et. al.(Mears et al., 1986) based on a
three level energy system at room temperature. They also demonstrated the first Q-
switched operating of an EDFL producing 60 ns pulse using an intra-cavity acousto-optic
modulator. Development in the field of EDFL has been continuously growing since the
first demonstration in the mid-80s. The performance and pulse characteristics of EDFLs
have been significantly improved, by employing various cavity configurations
(Desurvire, 2002) and mode-locking techniques (Haus, 2000).
The achievable pulse width and energy from a fiber laser are not nearly equal to
that of a Ti-Sapphire laser, however they do have many advantages that have motivated
significant research over the past 20 years. Among the numerous advantages of fiber
lasers are low losses and possibility of pumping with compact and efficient diodes. The
fiber itself provides the waveguide; hence the need for bulk optics is minimized. These
lasers are also easily mode-locked because of an enhancement of fiber nonlinearities due
to high intensities and long interaction length. Fiber lasers are compact, robust and
inexpensive source of ultra-short pulses with numerous applications in field of optics.

3
1.2 Overview of pulsed lasers and motivation of the study
Lasers operating in CW or quasi-CW mode have limited optical output power,
depending on the maximum available pump power. The laser peak output power can be
improved by concentrating the available energy in a single, short optical pulse, or in a
periodic sequence of optical pulses as in a Q-switched fiber laser. Q-switching is a
technique for obtaining energetic optical pulse at repetition rate in kHz region and pulse
width in a range of microseconds to nanoseconds by sudden switching of the cavity loss.
Compared to CW fiber lasers, high-peak-power Q-switched fiber lasers are practically
useful in numerous applications, such as range finding, remote sensing, medical surgery
and industrial processing (Kennedy et al., 2004; McGrath et al., 1998; Zajac et al., 2004).
Although Q-switching does not produce the ultra-short pulses as in mode-locked lasers,
it has several advantages such as inexpensive, easy to implement and efficient in
extracting energy stored in upper laser level.
Mode-locking is a technique in optics by which a laser can be made to produce
pulses of light of extremely short duration, on the order of nanosecond (10−9 s),
picoseconds (10−12 s) or femtoseconds (10−15 s). The basis of the technique is to induce a
fixed phase relationship between the longitudinal modes of the laser's resonant cavity.
The laser is then said to be phase-locked or mode-locked. Interference between these
modes causes the laser light to be produced as a train of pulses. Depending on the
properties of the laser, these pulses may be of extremely brief duration, as short as a few
femtoseconds.
Pulsed lasers have numerous applications in both research and industry and their
uses are expected to broaden. These applications vary depending on wavelength, power
and pulse width. Short pulse duration and high peak powers are the two main
characteristics of ultra-short laser pulses that have been useful in the analysis of materials.
They allow for time resolved experiments in which the transient response of materials

4
can be observed on an ultra-short pulse scale. Fabrication of passive integrated optical
devices is another area in which pulse lasers are being employed. Ultra short pulse lasers
have been shown to directly induce large refractive index changes in glasses and other
dielectric materials. Hence they have been used for fabrication of optical devices, such as
optical waveguides (Hirao et al., 1998) and Bragg grating (Kawamura et al., 2000)
With the imminent arrival of practical, compact and cost effective pulsed laser
sources, real world application of ultrashort laser pulses in communicatins systems has
become very likely. Short pulse lasers are ideal for use as sources in all optical switching
based on the third order nonlinear Kerr effect, as they provide the large intensities that
are required (Asobe et al., 1996). The large spectral bandwidth offered by short pulse
lasers also make them an ideal light source for wavelength division miultiplexed (WDM)
and time divison multiplexed (TDM) networks.(Mikulla et al., 1999)
There are various methods that can be adopted to generate pulsed laser to suit
different applications. These include the active and passive pulsing techniques. An
external modulator is required to electronically synchronize to the cavity repetition rate
for the active technique while for the passive technique this external synchronization is
not needed but rather uses an all optical nonlinear process in a laser resonator. The
construction of active technique for Q-switching and mode-locking can be considered
complex, complicated and bulky with the employment of external modulator. For passive
method, the mechanism used is by generating saturable absorption action. One can use
real saturable absorbers (SAs) or can also exploit the artificial SAs. Real SAs are such as
semiconductors and the newly discovered carbon nanotubes (CNTs) and graphene while
the most prominent artificial SA is called nonlinear polarization rotation (NPR). The
benefits of passive over active mode-locking is for its simple and compact construction,
cost efficiency, robustness and ultra-short pulse generation (Sotor et al., 2012).

5
Recently, nonlinear polarization rotation (NPR) technique has been widely used
to provide an artificial SA effect especially in mode-locked fiber ring laser (ZC Luo et
al., 2009). The components needed to construct NPR based oscillator are polarization
sensitive element (polarizer and polarization tuning component) and a segment of
nonlinear fiber to allow an intensity dependent transmission for pulse generation. The
self-started mode-locking phenomenon occurs in a way similar to real SAs, where light
of higher intensity undergoes less absorption loss at the polarizer upon selecting the
appropriate light polarization at the polarizer. The advantage of the NPR technique is its
ultra-fast response, whereby it can produce ultra-short femtosecond pulse (Deng et al.,
2009) in the stretched pulse region. Wu et al. reported on the generation of nanosecond
pulses directly from a mode-locked erbium-doped fiber laser (EDFL) with NPR technique
(Wu et al., 2009) .
Moreover, NPR techniques are flexible and can be applied in all-fiber
configurations, as polarizing fiber isolators and fiber polarization controllers are widely
available. However, most of the fiber lasers generate bright pulses. Besides the bright
pulses, there are also the dark pulses, which having a temporary drop in laser intensity
with respect to the laser background level (H. Zhang et al., 2009). Recently, these pulses
have also attracted the attention of researchers who strive to understand the mechanism
of laser pulse oscillation and evolution from their unconventional behavior. Furthermore,
dark pulses display other advantages such as being less affected by intra pulse-stimulated
Raman scattering, less sensitive to fiber loss than bright pulses, and having better stability
in long-distance communications with respect to the Gordon–Haus jitter (Kivshar et al.,
1994).
This PhD work is intended to explore several passive pulsing approaches based
on nonlinear effects to generate different Q-switching and mode-locking pulse profiles.
In this thesis, at first, we demonstrate self-pulsing characteristic in a Brillouin fiber lasers

6
(BFL). We also demonstrate various bright and pulse emissions in EDFL based on NPR
technique. The newly developed Q-switched and mode-locked fiber lasers are then
employed to generate super-continuum (SC) light source using various nonlinear fibers
as the gain medium. The SC generation is defined as an extreme spectral broadening
induced by the coupling of a high peak power pulse laser in a nonlinear optical fiber. It
has been a hot topic in recent years due to its potential applications in a variety of areas
such as surgery (Zajac et al., 2004), optical communication (Palais, 1988) and sensing
(Kaminski et al., 2008).
1.3 Thesis Objectives
As discussed in the previous section, pulsed fiber lasers and supercontinuum light
sources are indeed important devices for optical communication, sensor industries and
medical diagnostics. There is great incentive to develop a new generation of pulse lasers
and super-continuum light that are compact, robust and easy to operate. The main
objective of this thesis is realize and study practical pulsed fiber lasers and super-
continuum light source by utilizing various nonlinear effects in optical fibers. To achieve
this, several objectives have been outlined to guide the research direction:
1. To study SBS effect for generating pulsed laser.
2. To demonstrate both Q-switched and mode-locked fiber lasers based on nonlinear
effects such as SBS and NPR techniques.
3. To generate super-continuum using various type of pulse profiles such as the Q-
switched mode-locking, nanosecond and dark soliton pulses, which were obtained
based on NPR technique.
1.4 Thesis layout
Although several interesting concepts were investigated and many experiments
carried out in the laboratory, only the issues directly related to the objective of the project

7
will be discussed, therefore limiting the writing to six brief chapters. This thesis aims to
comprehensively demonstrate the generation of pulsed laser and super-continuum
generation based on nonlinear effects.
Chapter 2 provides a brief discussion of laser theory, various nonlinear effects in
optical fibers, principle of NPR, NPR based fiber lasers and principle of SC generation.
There literatures are relevant to the experimental part of the thesis. The stimulated
Brillouin scattering (SBS) effect in optical fibers and self-pulsing characteristic in
Brillouin fiber lasers are presented.
In Chapter 3, at first, we investigate on the SBS phenomenon in both single mode
fiber and microfiber. The temporal characteristic of both Brillouin fiber laser (BFL) and
Brillouin Erbium fiber laser (BEFL) is then demonstrated. A nanosecond mode-locked
BFL is also demonstrated using an SBS effect in a highly nonlinear fiber (HNLF).
In Chapter 4, several passively mode-locked and Q-switched fiber lasers are
demonstrated based on nonlinear effects inside the ring laser cavity. At first, the NPR
based mode-locked EDFL with three switchable operation states is proposed and
demonstrated by incorporating a 10 km long SMF in the ring cavity. Then, a nanosecond
optical pulse generation is demonstrated in EDFL by using a 100 m long HNLF instead
of the SMF. The HNLF plays an important role to induce Kerr effect in the cavity, which
allows the polarization rotation occur in the cavity. This allows a mode-locking pulse is
generated based on NPR technique. A Q-switched EDFL is also demonstrated based on
nonlinear optical loop mirror (NOLM) cavity. The NOLM is used in the laser cavity to
generate the intensity dependent transmission so that it functions as a saturable absorber.
Finally, a Q-switched BFL is demonstrated using multi-walled carbon nanotubes
(MWCNTs) embedded in polyvinyl alcohol (PVA) film as a passive saturable absorber.
The performances of these lasers (NPR-based EDFL and BFL) are compared in terms of
threshold pump power, pulse stability, complexity of cavity and ease of implementation.

8
Chapter 5 focuses on generating SC spectrum using various type of pulse profiles,
which are obtained using the newly developed mode-locked fiber lasers. A mode-locked
EDFL with dark pulse output is also proposed and demonstrated for realizing a simple
optical fiber-based supercontinuum source. Finally, chapter 6 summarizes the findings
for this PhD work.
1.5 Original Contributions
The major contributions of this research work are summarized below:
1. Demonstration of SBS effect in both SMF and microfiber.
It is found that the microfiber geometry, which determines the amount of acoustic
modes’ irritation inside the device, plays an important role in both SBS generation
and gain bandwidth broadening. Nevertheless, the short length of non-adiabatic
microfibers (in millimeters) retains the relative advantages of design simplicity and
lower cost in generation of SBS.
2. Development of a new type of pulsed laser based on SBS self-pulsing:
BFL and BEFL behave as a pulsed laser when the pump power is set slightly above
the SBS threshold power due to relaxation oscillation. As the pump power increases,
it transforms from pulsed laser to continuous wave (CW) laser. A BFL with a mode-
locking characteristic is also demonstrated using a HNLF as a Brillouin gain medium
in conjunction with relaxation oscillation technique.
3. Demonstration of NPR fiber laser using a long SMF and short HNLF.
A nanosecond harmonic pulse laser source operating with ultra-low repetition rate
was demonstrated by inserting a 10 km long SMF in the ring cavity. The SMF plays
an important role to induce Kerr effect in the cavity, which allows the polarization
rotation occur in the cavity. This allows a mode-locking pulse is generated based on
NPR technique. Then, a nanosecond optical pulse generation was demonstrated in the

9
similar EDFL cavity by replacing the SMF section with a 100 m long HNLF. The
laser operated at 1567.2 nm and produced a pulse train with a constant repetition rate
of 1.56 MHz and pulse width of 297 ns.
4. Demonstration of Q-switching NPR fiber laser.
To improve the pulse energy, a Q-switched EDFL was also demonstrated based on
NOLM cavity. The NOLM was used in the laser cavity to generate the intensity
dependent transmission so that it functions as a saturable absorber.
5. Development of a Q-switched BFL.
A Q-switched BFL was successfully demonstrated using MWCNTs embedded in
PVA film as a SA. The SA was obtained by sandwiching the developed MWCNTs–
PVA film between two FC/PC fiber connectors after depositing index matching gel
onto the fiber ends.
6. Demonstration of SC generation.
The performance of SC generation in QML and CWML EDFLs, which was amplified
by an EDFA as pump source was investigated. A SC generation based on dark pulse
was also demonstrated in three different fiber spools in a passively mode locked
EDFL.

10
CHAPTER 2
LITERATURE REVIEW ON NONLINEAR EFFECTS FOR PULSED LASER
AND SUPERCONTINUUM LIGHT SOURCE
2.1 Understanding Nonlinear Optics
Nonlinear optics deals mainly with various new optical effects and novel
phenomena arising from the interactions of intense coherent optical radiation with matter.
A light wave consists of electric and magnetic fields varying sinusoidally at high
frequencies (Buck, 2004). When light propagates through matter it induces motion of the
charged particles that constitute the material. In a dielectric medium the charges are
bound together and will start to oscillate in the applied electric field; they form oscillating
electric dipoles. The contribution from the magnetic field part of the light and from
electric quadruples is much weaker and is usually neglected. This is called the electric
dipole approximation. The oscillating dipoles add up to a macroscopic polarization
𝑃 which is used to describe the response of the material. For low light intensities, i.e.
small amplitudes of the electric field 𝐸, the charges can follow the field almost exactly
and the relationship between 𝐸 and 𝑃 is essentially linear. For larger amplitudes the
motion of the particles will be distorted and nonlinear terms will become important. The
origin of nonlinear optics can be uncovered by recalling Maxwell’s equations, which are
a set of laws governing light-matter interaction (Boyd, 2003; Buck, 2004; Jackson et al.,
1962).
∇. �⃗⃗� = 𝜌𝑓
∇. �⃗� = 0
∇ × �⃗� = −𝜕�⃗�
𝜕𝑡
∇. �⃗⃗� = 𝐽𝑓⃗⃗⃗ +𝜕�⃗⃗�
𝜕𝑡
(2.1)
(2.2)
(2.3)
(2.4)
11
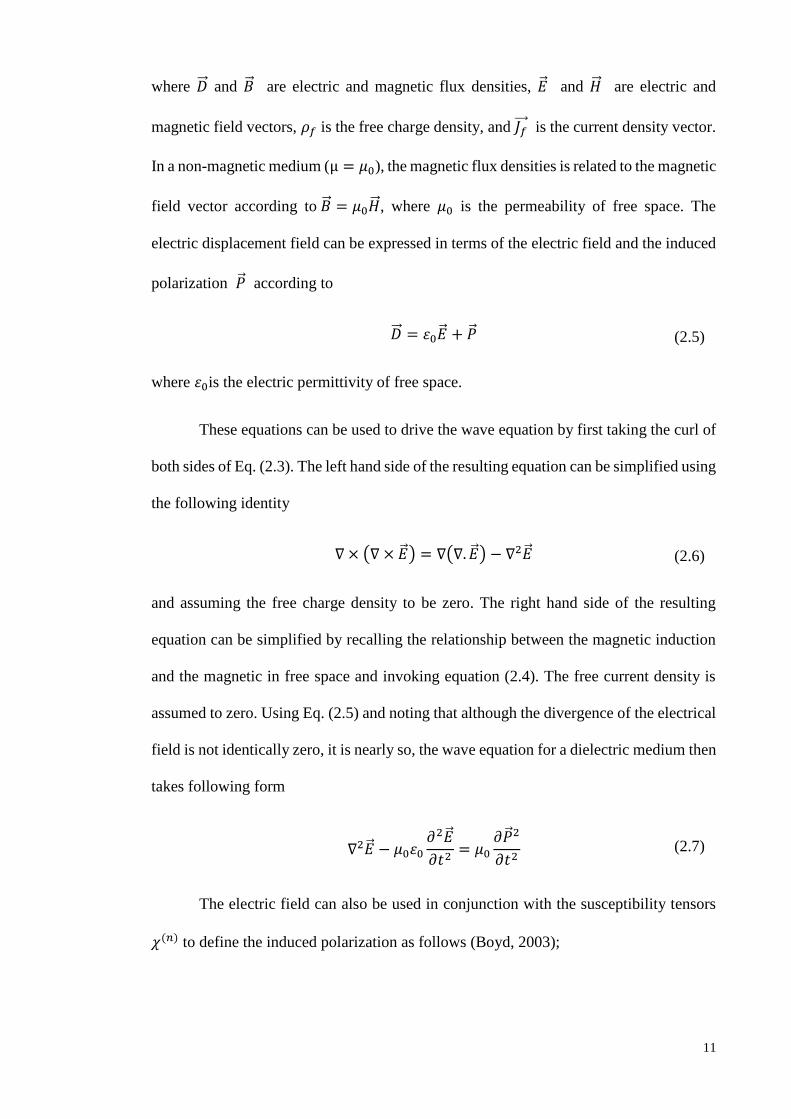
where �⃗⃗� and �⃗� are electric and magnetic flux densities, �⃗� and �⃗⃗� are electric and
magnetic field vectors, 𝜌𝑓 is the free charge density, and 𝐽𝑓⃗⃗⃗ is the current density vector.
In a non-magnetic medium (µ = 𝜇0), the magnetic flux densities is related to the magnetic
field vector according to �⃗� = 𝜇0�⃗⃗� , where 𝜇0 is the permeability of free space. The
electric displacement field can be expressed in terms of the electric field and the induced
polarization �⃗� according to
�⃗⃗� = 휀0�⃗� + �⃗�
where 휀0is the electric permittivity of free space.
These equations can be used to drive the wave equation by first taking the curl of
both sides of Eq. (2.3). The left hand side of the resulting equation can be simplified using
the following identity
∇ × (∇ × �⃗� ) = ∇(∇. �⃗� ) − ∇2�⃗�
and assuming the free charge density to be zero. The right hand side of the resulting
equation can be simplified by recalling the relationship between the magnetic induction
and the magnetic in free space and invoking equation (2.4). The free current density is
assumed to zero. Using Eq. (2.5) and noting that although the divergence of the electrical
field is not identically zero, it is nearly so, the wave equation for a dielectric medium then
takes following form
∇2�⃗� − 𝜇0휀0
𝜕2�⃗�
𝜕𝑡2= 𝜇0
𝜕�⃗� 2
𝜕𝑡2
The electric field can also be used in conjunction with the susceptibility tensors
𝜒(𝑛) to define the induced polarization as follows (Boyd, 2003);
(2.5)
(2.6)
(2.7)

12
�⃗� = 휀0(𝜒(1). �⃗� + 𝜒(2): �⃗� �⃗� + 𝜒(3): �⃗� �⃗� �⃗� + ⋯)
The order of each susceptibility tensor is denoted by the superscript 𝑛. The first order
susceptibility tensor 𝜒(1) is associated with several of the linear properties of a material,
including the index of refraction and absorption. While the second order susceptibility
𝜒(2) is the lowest nonlinear susceptibility responsible for second-order nonlinear effects
such as second harmonic generation and sum-frequency generation. The third order
nonlinear susceptibility tensor 𝜒(3)is connected to many other optical phenomena,
including stimulated Raman scattering (SRS), stimulated Brillioun scattering (SBS), and
self-phase modulation (SPM)(Boyd, 2003).
Fig. 2.1 shows the classification of nonlinear effects in optical fibers. It is divided
into two main effects: nonlinear refractive index and elastic scattering effects. Fiber
nonlinearity along transmission path causes inter mixing of the optical subcarriers and it
has three different effects, namely four-wave mixing (FWM), cross-phase modulation
(XPM) and SPM. The two main nonlinear effects in the inelastic scattering are SBS and
SRS. These scattering causes the optical field to transfer a part of its energy to the
nonlinear medium. They can be explained quantum-mechanically as scattering of an
incident light photon to a lower energy photon called Stokes photon by generating an
acoustic phonon in SBS and optical phonon in SRS with energy equal to the energy
reduction of the initial photon. The main difference between the two is the type of interval
mode involved. SRS involves non propagating collective modes as optical phonons in the
medium whereas SBS involves low frequency propagating acoustic wave phonons in the
medium. Another fundamental difference is that SBS occurs only in the backward
direction which is the opposite direction with respect to the incident light. However, SRS
is able to occur in both forward and backward directions although it dominates in the
(2.8)

13
forward direction where it is in the same direction as the incident light. The other
difference is that the downshifted scattered light is about 10 GHz for SBS but 13 THz for
SRS with respect to the incident light frequency in SMF. Finally, the Brillouin gain
spectrum is less than 100 MHz bandwidth which is very narrow in comparing with Raman
gain spectrum bandwidth which is more than 20 to 30 THz (Bloembergen, 1996).
Figure 2. 1 Classification of nonlinear effects in optical fiber
2.2 Stimulated Brillouin Scattering (SBS)
When a narrow line width laser radiation is propagated through a long piece of
optical fiber, a part of the light is seen to scatter in the backward direction when the power
exceeds a certain limit (G. P. Agrawal, 2007). This nonlinear phenomenon is referred
Stimulated Brillouin Scattering (SBS) (Ruffin, 2004) and it occurs at power as low as a
few 𝑚𝑊 in the small core of a single-mode fiber (SMF). As the pump power reaches the
threshold level, it generates acoustic vibration in a nonlinear medium or optical fiber. The
acoustic wave generated by the optical power affects the density of the material and thus
changes its refractive index. This refractive index fluctuation can scatter light to generate

14
a Stokes wave whose frequency is downshifted from an incident pump light by the
amount set by the nonlinear medium. The scattered light is downshifted in frequency,
because of the Doppler shift associated with a grating moving at the acoustic velocity
(Cotter, 1983). The working principle of SBS can be explained as illustrated in Fig. 2.2.
As shown in Fig. 2.2, the characteristic of SBS is strongly on the density 𝜌,
frequency 𝛺𝐵 and the wave vector 𝑘𝐴 of the acoustic wave. Since the energy and
momentum are conserved during the scattering events, the frequencies and wave vectors
of the pump light, scattered light, and acoustic fields are given by following equations;
𝑘𝐴 = 𝑘𝑃 − 𝑘𝑆
Ω𝐵 = 𝜔𝑃 − 𝜔𝑆
where 𝜔𝑃 and 𝜔𝑆 are the frequencies, and 𝑘𝑃 and 𝑘𝑆 are the wave vectors, of the pump
and Stokes waves, respectively. The frequency 𝛺𝐵 and the wave vector 𝑘𝐴 of the acoustic
wave satisfy the standard dispersion relation
2 sin( 2),B A A A pk k
ρ, ΩB, kA
Es, ωs, ks
Ep, ωp, kp
(2.9)
(2.10)
(2.11)
Figure 2. 2 Schematic diagram of the SBS process in an
optical fiber

15
where 𝑣𝐴 is the speed of sound in the medium and is the angle between the pump and
Stokes fields. However, in a single-mode fiber the relevant values are 0 and 𝜋. Hence,
SBS occurs only in the backward direction with the Brillouin shift given by
2 2B B A pnv
where 𝑛 is the modal index or refractive index of fiber core at the pump wavelength 𝜆𝑃(G.
P. Agrawal, 2007; Mills, 1991).
Since the scattering occurs in backward direction, the angle 𝜃 is 𝜋. By using 𝑣𝐴 =
5.96 𝑘𝑚/𝑠 and 𝑛 = 1.45 as typical values for silica fibers, the shift is found to be
11 GHz or 0.08 nm at 1550nm region based on Equation (2.12). Fig. 2.3 shows the
example of the SBS signal reflected from a long piece of silica fiber. The peak at the
lower wavelength is a reflected BP signal, which is caused by the combination of
Rayleigh scattering as well as the spurious reflections from connectors and splice joints.
The Stokes signal due to the SBS is obtained at a longer wavelength, which is 0.08 nm
shifted from the BP signal. Anti-Stokes is obtained in the shorter wavelength as shown in
Fig. 2.3.
Figure 2. 3 Spectrum of reflected light from a long piece of SMF when the BP
wavelength is fixed at 1550 nm.
-80
-75
-70
-65
-60
-55
-50
-45
-40
1549.7 1549.8 1549.9 1550 1550.1 1550.2
Back
sca
tter
ed p
ow
er(d
Bm
)
Wavelength(nm)
Input Shifted
~0.08 nm
Brillouin
Scattering Rayleigh scattering
& reflection
Anti-Stokes
(2.12)

16
The Brillouin gain spectrum, gB (𝜈), which has a Lorentzian spectral shape can be
also determined by (G. P. Agrawal, 2007; Mills, 1991);
2
2 2
( / 2)( ) ( )
( ) ( / 2)
BB B B
B B
g g
where 𝛥𝜈𝐵is the 3dB spectral bandwidth that is related inversely to the decay time of
acoustic phonons (−100 ns). The peak value of the Brillouin gain coefficient at 𝜈 = 𝜈𝐵
can be evaluated using the following equation,
7 2
12
2
0
2( )B B
p A B
n pg
c
where 12p is the longitudinal electro-optic coefficient, 0 is the density of the material
and 𝜆𝑃 is the pump wavelength. The typical value of gB for pure silica core fibre is gB
=5 × 10 − 11 𝑚/𝑊. Both the Brillouin shift 𝜈𝐵 and the gain bandwidth 𝛥𝜈𝐵 can vary
from fiber to fiber because of the presence of dopants in the fiber core (G. P. Agrawal,
1997).
The development of SBS in optical fibers is governed by a set of two coupled
equations as follows (G. Agrawal, 2001):
( )ss s B p s
dII g I I
dz
( ( ) )p
p p B p s
dII g I I
dz
where the absorption coefficients 𝛼𝑆 and 𝛼𝑃 account for the fiber loss at the Stokes and
pump frequencies, respectively. Two simplifications can be made because of the fact that
the Brillouin shift is relatively small, as 𝜔𝑃 ≈ 𝜔𝑆 it follows that 𝛼𝑃 ≈ 𝛼𝑆 = 𝛼. We also
assume that the Stokes and pump are co-polarized. If we assume that the pump is so
intense compared with the Stokes, the pump depletion is neglected. Hence, the Stokes
(2.15)
(2.16)
(2.13)
(2.14)

17
intensity inside the fibre is found to grow exponentially in the backward direction where
𝐼0 is the pump intensity at 𝑧 = 0 according to the relation.
0(0) ( )exp( )s s B eff effI I L g P L A L
We used 𝑃0 = 𝐼𝑃(0)𝐴𝑒𝑓𝑓, where 𝑃0 and 𝐿 are the input pump power and length,
respectively. In Eq. (2.14) the Stokes signal incident at 𝑧 = 𝐿 grows in the backward
direction as a result of SBS. In the case of a pump laser with a Lorentzian spectral profile,
the Brillouin threshold can be written (G. P. Agrawal, 2007)as,
21( ) (1 )
( )
eff p
th
B B eff B
AP mW
g L
where 𝜈𝑝 is the frequency linewidth of the pump, 𝜈𝐵 is the spontaneous Brillouin
linewidth. However, the Brillouin threshold, by a good approximation, is summarized by;
( ) 21eff
B B th
eff
Lg P
A
Using gB = 5×10-11 m/W and 𝐴𝑒𝑓𝑓 = 50 µ𝑚2 as typical values, the threshold power 𝑃𝑡ℎ
for the SBS onset can be as low as 1 𝑚𝑊 for CW signals in the wavelength region near
1.55 µm (Abedin, 2005).
2.3 Optical Kerr effect and SPM
Most of the nonlinear effects in optical fibers originate from nonlinear refraction,
a phenomenon that refers to the intensity dependence of the refractive index. This effect
is known as the optical Kerr effect. The intensity dependent refractive index derives from
the third order susceptibility and is given by (2.8)
(2.17)
(2.18)
(2.19)

18
n(I) = n0 + n2I
where 𝒏𝟎 is the linear refractive index, 𝐼 ~ |𝐸|2 is the optical intensity and 𝒏𝟐 is the
nonlinear coefficient (the optical Kerr coefficient). Many phenomena arise from the
linear variation of refractive index with intensity; one of particular interest to the work in
this thesis is SPM.
The intensity dependent refractive index has a direct effect on the spectrum of any
optical pulse, because the pulse has a time varying intensity (G. P. Agrawal et al., 1989).
The propagation of a pulse described by the slowly varying amplitude approximation is
given by
𝐸(𝐿, 𝑡) =1
2[𝐴(𝐿, 𝑡)𝑒𝑗(𝜔0𝑡−𝐾𝐿)]
where 𝐴(𝐿, 𝑡) is the slowly varying envelope and 𝐿 is the length of the Kerr medium.
Further 𝐾𝐿 =2π(n0+n2I(t))
λ0L =
2πn0L
λ0+
2πn2I(t)L
λ0 ; the second term represents the
nonlinear phase shift caused by SPM.
SPM is a phenomenon that leads to spectral broadening of optical pulses as a
result of the time dependent nonlinear phase shift. A temporally varying phase implies
that the instantaneous optical frequency differs across the pulse. The time dependence of
the different frequencies can be viewed as a frequency chirp. The chirp is induced by
SPM and increases in magnitude with propagation distance (Lamminpää, 2003). In other
words, new frequency components are continuously being generated as the pulse
propagates down the fiber. These generated frequency components broaden the spectrum
over its initial width. The maximum nonlinear phase shift experienced by a pulse is given
by
(2.21)
(2.20)

19
𝜙𝑁𝐿𝑚𝑎𝑥 =
2𝜋𝑛2𝐼0𝐿
𝜆0
where 𝐿 is the propagating distance, 𝜆0 is the center wavelength, and 𝐼0 is the peak
intensity of the pulse. The maximum amount of spectral broadening for a pulse of
duration 𝜏0is given by (Boyd, 2003)
𝛿𝜔𝑚𝑎𝑥 ≅𝜙𝑁𝐿
𝑚𝑎𝑥
𝜏0
Phase modulation can be converted into intensity modulation, for example by using a
difference between self modulated phase of two polarization components as a wavelength
retarder placed between crossed polarizers.
SPM is often accompanied by cross phase modulation (XPM), a phenomenon that
leads to coupling between two or more incident waves or modes through the fiber
nonlinearity. This occurs because the effective refractive index of a wave depends not
only on the intensity of that wave but also on the intensity of other co-propagating waves
(G. P. Agrawal, 2007).
2.4 Birefringence
A single mode fiber is not truly single mode; even a perfectly cylindrical single
mode fiber supports two degenerate polarization modes. Small departures from a perfect
cylindrical geometry or small fluctuations in the material anisotropy results in these
modes becoming slightly non-degenerate. Therefore, in practice a fiber supports two
direction. Mathematically, the mode-propagation constant become a slightly different for
modes polarized in the 𝑋 and 𝑌 directions. This is referred to as modal birefringence. The
degree of modal birefringence 𝐵 is defined by (G. P. Agrawal, 2007)
𝐵 = 𝐾0|𝑛𝑋 − 𝑛𝑦|
where 𝐾0 = 2𝜋 𝜆⁄ , 𝑛𝑋 and 𝑛𝑌 are the effective mode indices in the two orthogonal
polarization states. The axis along which the effective mode index is smaller is called the
(2.22)
(2.23)
(2.24)

20
fast axis, as the group velocity is larger for light propagating in that direction. Similarly
the axis with the larger mode index is called the slow axis.
The relative strength of the birefringence is described by the beat length. The
length of period in which the polarization state is reproduced. The beat length is given by
Eq. (2.25) and for standard SMF fiber this length is approximately 2 − 10 𝑚 at 1550nm.
𝐿𝐵 =2𝜋
𝐵
Elliptically polarized light can be resolved into its right and left hand circulator
polarization components of different intensities. If the light input to a fiber is elliptically
polarized, XPM induces nonlinear coupling between 𝑋 and 𝑌 electric field components
creating nonlinear birefringence, which changes the state of polarization. This
phenomenon is referred to as nonlinear ellipse rotation since it is manifested as a rotation
of the polarization ellipse (Duling III, 2006).
2.5 Nonlinear Polarization Rotation
Since the refractive index depends on the intensity of light, elliptically polarized
light sees an induced birefringence the index is slightly higher for polarization along the
major axis of the ellipse. This holds back the phase of that component of the E-field, and
alters the ellipse slightly. The effect is to tilt the major axis of the ellipse slightly as shown
in Fig. 2.4. The effect is continuous, since there is now a new birefringence along a new
major axis. The net effect is that high intensity elliptically polarized light in a Kerr
medium experiences a continuous rotation of the major axis of the ellipse. This is called
Kerr ellipse rotation or nonlinear polarization rotation (NPR).
(2.25)

21
Figure 2. 4 Nonlinear polarization rotation of an ellipse as it propagates through a Kerr
medium.
Another way to look at this is in terms of the right and left hand circularly
polarized light. Consider an elliptically polarized light made up of a strong right-hand
circular light and somewhat weaker left-hand circular light. The right circular light will
see a slightly larger index of refraction than the left, thus the right circular component
will steadily drop back in phase, relative to the left circular component. The result is a
slow rotation of the polarization ellipse as the light propagates (Boyd, 2003).
2.6 Pulsed Laser
Lasers can be classified into two categories based on its operating conditions. A
continuous wave (CW) laser is where its output power runs continuously over time while
the output power of a pulsed laser is due to light emission in the form of optical pulses.
In a CW laser, the laser modes usually oscillate in random phase and have unbalanced
amplitudes. Generally, there are two common methods to produce pulsed laser which are
Q-switching and mode-locking. Depending on the wavelength requirements such as pulse
duration, pulse repetition rate and pulse energy, different methods to generate various
types of pulses. Details of these techniques are presented in the following sub-sections.
-1.5
-1
-0.5
0
0.5
1
1.5
-1.5 -1 -0.5 0 0.5 1 1.5
-1.5
-1
-0.5
0
0.5
1
1.5
-1.5 -1 -0.5 0 0.5 1 1.5
-1.5
-1
-0.5
0
0.5
1
1.5
-1.5 -1 -0.5 0 0.5 1 1.5

22
2.6.1 Q-switching
One of the common practices to produce pulsed laser is Q-switching. Q-switched
laser is a device to which the technique of active or passive Q-switching is applied, so
that it emits high-energy pulses (Spühler et al., 1999). In Q-switching, cavity losses are
high in the beginning until the gain medium has stored high energy by increasing input
pump power. After that the losses in the cavity are reduced to extremely low values which
enables the cavity to increase the power of laser radiation and thus pulsed laser is
generated (Siegman, 1986) . By decreasing the optical loss, Q-factor of the cavity will
be increased.
𝑄 = 2𝜋𝜐0 (𝑊
𝐸𝑒𝑟𝑔𝑦 𝑙𝑜𝑠𝑡 𝑝𝑒𝑟 𝑠𝑒𝑐𝑜𝑛𝑑)
where 𝜐0 is the central frequency of the laser and 𝑊 is the energy stored in the cavity.
Energy loss per second is given by 𝛿𝑊𝐶
𝑛𝐿 , where 𝛿 is the energy loss rate for single path
propagation of light in the cavity, 𝐿 is the length of the resonator, 𝑛 is refractive index of
the medium and 𝑐 is the light velocity. Thus, the equation (2.26) can be simplified as
𝑄 = 2𝜋𝜈0
𝑊
𝛿𝑊 𝑐𝑛𝑙⁄
=2𝜋𝑛𝑙
𝛿𝜆0
where 𝜆0 laser central wavelength in the vacuum. From equation (2.27) it is clearly
observable that the 𝑄 value is inversely proportional to the resonator loss (𝛿) when the
value of 𝜆0 and 𝐿 are definite. The conditions for light oscillations in the laser cavity can
be summarized as follows:
a) If the loss (𝛿) is high, the 𝑄 value will be low and will require a higher threshold,
which in turn makes it difficult for oscillation to be initiated.
(2.26)
(2.27)

23
b) If the loss (𝛿) is small, the 𝑄 value which is inversely related to the loss (𝛿) will be
higher and thus requires a lower threshold, thereby oscillation will be easily initiated.
It is also evident from equation (2.27) that to change the threshold of the laser, we could
change the 𝑄 value or the loss (𝛿) will be higher and thus require a low threshold,
oscillation will be easily initiated.
Active Q-switching uses external means to control the loss or Q-factor inside the
laser cavity. In active Q-switching, the losses of the laser are modulated by employing
acousto optic modulator (AOM) (Delgado-Pinar et al., 2006) or electro optic modulator
(EOM)(El-Sherif et al., 2003). By inserting the external control element, the output
characteristics of the generated pulsed can be controlled. Recently, Huang (Huang et al.,
2011) had demonstrated a hybrid technique using AOM and semiconductor saturable
absorber (SESAMs) in generating Q-switched pulse laser. They reported an improvement
of output pulse in comparison to purely passive Q-switched and purely active Q-switched
operation.
In a passively Q-switched laser, no external modulator is needed where the cavity
loss is modulated by saturable absorber. Saturable absorber can be exhibited artificially
by polarization effect such as nonlinear polarization rotation (NPR)(Degnan, 1995) or
real saturable absorber by means of transition metal doped crystals (Pan et al.,
2007),SESAMs (Nodop et al., 2007), SWCNTs (Dong et al., 2011; Harun et al., 2012),
grapheme (Zhengqian Luo et al., 2010; Popa et al., 2010), graphene oxide (GO)(Lee et
al., 2013) and reduced graphene oxide (rGO)(Sobon et al., 2012). The saturable absorber
transmission or reflection depends on the light intensity where the low light intensity will
be absorbed by the material and the high light intensity will be released depending on the
material recovery time.
Compared to mode-locking, Q-switching requires less control of cavity
parameters and efficient in terms of cost, operation and implementation. Recently,

24
tunable fiber laser have been demonstrated using graphene (Popa et al., 2010) and
SWCNTs (Zhou et al., 2009) which enable simultaneous wavelength tuning with pulse
laser.
2.6.2 Mode-locking
Mode-locking is a powerful technique for obtaining ultra-short pulses ranging
from picoseconds to femtoseconds. It is a process in which the longitudinal modes of a
laser are forced into phase synchronism. The different modes add constructively in such
a way that the laser produces a train of pulses (Siegman, 1986) . The numbers of
longitudinal modes that can simultaneously lase are dependent on the gain linewidth,∆𝜐𝑔
and the frequency separation between modes. Under sufficiently strong pumping, we can
expect that the number of modes oscillating in the cavity is given by:
𝑀 =Δ𝜐𝑔
𝑐2𝐿⁄
=2𝐿
𝑐Δ𝜐𝑔
where 𝑐 is the speed of light and 𝐿 is the length of a linear cavity. The shortest duration
that we can expect to obtain by a given gain linewidth is
𝜏𝑚𝑖𝑛 = 𝜏𝑀 =2𝐿
𝑐𝑀=
1
𝜈𝑔
From (equation 2.29) we can conclude that the shortest pulse that can be obtained is a
reciprocal of gain linewidth (in Hz) (Milonni et al., 2010)
The laser cavity arrangement for mode-locked laser needs careful design because
the dynamics of ultrashort pulse is usually much more complicated than Q-switched pulse
as it involves dispersion, SPM, XPM etc. The repetition rate of the laser pulses is
determined by the length of the laser cavity, and for laser with ring cavity the relation is
given by:
(2.28)
(2.29)

25
Δ𝑓 =𝐶
𝑛𝐿
where Δ𝑓 is the repetition rate(Hz), 𝑐 is the velocity of light in vacuum, 𝑛 is the refractive
index and 𝐿 is length of cavity. As the round-trip time, 𝑇𝑅 , is the inverse of repetition
rate, therefore, 𝑇𝑅 is given as;
𝑇𝑅 =𝐿𝑛
𝑐
Depending on the cavity type, under certain conditions, the repetition rate can be some
integer multiple of the fundamental repetition rate. In this case, it is called harmonic
mode-locking. Typically the repetition rate is in the range of megahertz with shorter pulse
width compared to pulse generation by Q-switching method. Mode locking methods can
be divided into two main categories: active and passive.
Active mode-locking requires an active element driven by an external electronic
signal to modulate the loss inside the fiber cavity. There are two type types of modulators
which is amplitude modulation (AM) and frequency modulation (FM). The use of
modulator is to provide a high speed pulse train that is an order higher than the
fundamental repetition rate. In AM mode locking, the loss cavity is periodically
modulated and the pulse is built up at the position having minimum loss in the fiber
cavity. The repetition rate reported by applying AM for mode locking is as high as 3.77
GHz (Gupta et al., 2002) FM mode locking is carried out by repeated up or down
frequency chirping. After many round trips the pulse is built up and shortened because
the chirped light is swept out of the gain bandwidth of the laser. By applying FM to mode
locked, the reported repetition rate is about 40 GHz (Nakazawa et al., 1998), with a
shorter pulse width compared to AM mode locking.
Passive mode locking is a method that does not require any external trigger when
nonlinear element is part of the laser cavity. The characteristic of the output pulse is
achieved by using saturable absorber or artificial saturable absorber such as Kerr lens
(2.30)
(2.31)

26
mode-locking, NPR and additive pulse mode-locking. They are two types of saturable
absorbers, which is artificial saturable absorber or real saturable absorber. Apart from the
above mentioned techniques, self-pulsing with relaxation oscillation induced by SBS can
also seed mode-locking(G. P. Agrawal, 2007). Details on mode-locking techniques that
are applied in this study are presented in the following sub-sections.
2.6.3 NPR based fiber lasers
NPR is a phenomenon that is caused by the changes in the polarization direction
of light inside the laser cavity due to SPM and XPM as well as to some birefringence of
the fiber. It exploits the nonlinear effects in optical fiber, which causes rotation of light
in fiber to enable intensity modulation mechanism in the laser cavity. Through
appropriately selecting the orientation of the polarizer or the length of the fiber, an
artificial saturable absorber effect with ultra-fast response could then be achieved in a
fiber laser cavity. The NPR based fiber laser relies on the Kerr effect in an Erbium doped
fiber (EDF) in conjunction with an optical isolator to produce a pulse by setting the initial
polarization state to elliptical. This elliptical state can be resolved into right and left-hand
circular polarization components of different intensities. As a result, an elliptically
polarized pulse will have its 𝑥 and 𝑦 components experience different phase shifts, thus
rotating the polarization ellipse. Since this is a nonlinear process, the polarization rotation
depends on the intensity.
The transmission path of NPR is shown in Fig. 2.5, which can be used to explain
the working principle of the NPR-based fiber laser. As a linear polarized light leaves the
polarizer, it becomes elliptically polarized light after propagating through the polarization
controller (van Saarloos et al.). The light can then be resolved into two orthogonal
polarized lights, that is 𝐸𝑥 and 𝐸𝑦. After passing through the fiber, both 𝐸𝑥 and 𝐸𝑦
accumulate nonlinear phase shift due to the SPM and XPM effects in the fiber. The angle

27
of polarization can be changed from 𝛼1 to 𝛼2 as it the light propagates through the fiber.
Here, 𝛼1 is the angle between the polarization direction of the input signal and the fast
axis of the fiber and 𝛼2 is the angle between the fast axis of the fiber and the polarization
direction of the polarizer. Both 𝛼1 and 𝛼2 angles can be adjusted by PCs.
Figure 2. 5 Operation principle of NPR
The light transmission is described using the following equation (Feng et al.,
2006; ZC Luo et al., 2009):
𝑇 = 𝑐𝑜𝑠2𝛼1𝑐𝑜𝑠2𝛼2 + 𝑠𝑖𝑛2𝛼1𝑠𝑖𝑛
2𝛼2 +1
2𝑠𝑖𝑛2𝛼1𝑠𝑖𝑛2𝛼2 cos(𝛥𝜑𝐿 + 𝛥𝜑𝑁𝐿)(2.19)
where Δ𝜑𝐿is the linear phase shift from modal birefringence and is the nonlinear phase
shift contributed by both SPM and XPM effects. Δ𝜑𝐿𝑎𝑛𝑑 Δ𝜑𝑁𝐿 are represented by:
Δ𝜑𝐿 =2𝜋𝐿
𝜆(𝑛𝑦 − 𝑛𝑥)
Δ𝜑𝑁𝐿 =2𝜋𝑛2𝐿𝑃
3𝐴𝑒𝑓𝑓𝜆𝑐𝑜𝑠2𝛼1
(2.32)
(2.33)
(2.34)

28
where 𝑛𝑦 𝑎𝑛𝑑 𝑛𝑥 are the refractive indexes of the respective fast and slow axes of the
optical fiber, 𝐿 is the fiber length, 𝜆 is the operating wavelength, 𝑛2 signifies the nonlinear
refractive index, 𝑃 is the instantaneous peak power of the input signal while 𝐴𝑒𝑓𝑓 is the
effective core area. The angles of 𝛼1 and 𝛼2 can be manipulated by rotating the PC.
When the light transmission (T) is plotted against power (P), two regions of
transmittivity, namely region 𝐴 and region 𝐵 are obtained as illustrated in Fig. 2.6. Region
𝐴 is the region where transmittivity increases with power. The combination of PC-fiber-
PC-polarizer acts as an artificial saturable absorber that is responsible for mode-locking.
PC is adjusted so that only the high intensity light leaves the polarizer while the
propagation of low intensity light is prevented. Subsequently, this leads to the formation
of train of pulses. In contrast, there is also another region where transmittivity decreases
with power (region B). In this region, higher intensity light experiences higher losses.
The inhomogeneous loss encountered by the high intensity in region B can be used to
suppress mode competition in EDF, thereby allowing generation NPR-based stable multi-
wavelength laser with uniform spacing. As can be observed from Eq. (2.33), the
transmittivity of system also oscillates with operating wavelength. By adjusting the PC,
the polarization of light varies for different wavelengths. As the polarizer only allows
certain light polarizations to pass through, the combination of PC-fiber-PC-polarizer
provides wavelength dependent loss which permits the laser to oscillate at more than one
wavelength at the same time. Additionally, wavelength switching can also be executed
by controlling the wavelength dependent loss through the rotation of PC. Fig. 2.6 shows
the transmittivity due to different settings of PC.

29
Figure 2. 6 Transmittivity due to NPR with different PC settings
2.6.4 Soliton pulse
Pulse width is influenced by group velocity dispersion (GVD) and SPM. When
SPM and GVD (𝛽2) are balanced, a pulse can propagate in a nonlinear medium without
changes in shape. This type of pulse is addressed as the soliton pulse and it is produced
under negative cavity GVD (𝛽2 < 0). A soliton pulse laser is a promising laser source
since its pulse shape is unaltered due to the chirping of both the dispersion and
nonlinearity cancelling out each other during propagation. Pulsed laser in a nonlinear
dispersive medium, is described by the nonlinear Schrödinger equation (NLSE) as
follows (Ghatak et al., 1998):
−𝑖 (𝜕𝐴
𝜕𝑍+
1
𝜐𝑔
𝜕𝐴
𝜕𝑡) −
𝛽2
2
𝜕2𝐴
𝜕𝑡2+ γ|𝐴|2𝐴 = 0,
(2.35)

30
where
1
𝜐𝑔=
𝑑𝑘
𝑑𝜔|𝜔=𝜔0
𝛽2 =𝑑2𝑘
𝑑𝜔2|𝜔=𝜔0
γ =1
2𝜔0𝜖0𝑛0𝑛2
where γ is responsible for SPM. It is often easier to write Equation (2.35) in a frame
moving at the group velocity by making the substitution
𝑇 = 𝑡 −𝑧
𝜐𝑔,
in which case Eq. (2.35) becomes
−𝑖𝜕𝐴
𝜕𝑍−
𝛽2
2
𝜕2𝐴
𝜕𝑇2+ 𝛾|𝐴|2𝐴 = 0,
In the case of CW radiation, the amplitude 𝐴 is independent of 𝑇 at the input end of the
fiber at 𝑧 = 0.
Assuming 𝐴(𝑧, 𝑡) remains time independent during propagation inside the fiber,
Eq. (2.40) can be solved to obtain the steady-state solution
�̅� = √𝑃0exp (𝑖∅𝑁𝐿)
where 𝑃0 is the incident power and ∅𝑁𝐿 = 𝛾𝑃0𝑧 is the nonlinear phase shift induced by
SPM. Equation 2.41 implies that a CW light is unchanged when it propagates through the
fiber, except for acquiring a power–dependent phase shift and for reduction in power due
to fiber losses.
(2.36)
(2.37)
(2.38)
(2.39)
(2.40)
(2.41)

31
A slight perturbation is then introduced to the steady state solution as shown
below.
𝐴 = (√𝑃0 + α)exp (𝑖∅𝑁𝐿)
Examining the evolution of the perturbation 𝛼(𝑧, 𝑇) using a linear stability analysis by
substituting Eq. (2.42) in Eq. (2.40) and linearizing it, we obtain
−𝑖𝜕𝐴
𝜕𝑍=
𝛽2
2
𝜕2𝐴
𝜕𝑇2− 𝛾𝑃0(𝛼 + 𝛼′),
This linear equation can be easily solved in the frequency domain, nevertheless, because
of the 𝛼′ term in the above equation, the Fourier components at frequencies Ω and − Ω
are coupled. Then, we obtain,
𝛼(𝑧, 𝑇) = 𝑎1𝑒𝑥𝑝/[𝑖𝐾𝑧 − Ω𝑇)] + 𝑎2𝑒𝑥𝑝/[𝑖𝐾𝑧 − Ω𝑇)]
where 𝐾 is the wave number of perturbation. Eq. (2.43) and Eq. (2.44) provide a set of
two homogenous equations for 𝑎1 𝑎𝑛𝑑 𝑎2. This set has a non-trivial solution only when
𝐾 and Ω satisfy the following dispersion relation
𝐾 = ±1
2|𝛽2Ω|[Ω2 + 𝑠𝑔𝑛(𝛽2)Ω𝑐
2]1
2⁄
where 𝑠𝑔𝑛(𝛽2) = ±1 depending on the 𝑠𝑖𝑔𝑛 on 𝛽2,
Ω𝑐2 =
4𝛾𝑃0
|𝛽2|=
4
|𝛽2|𝐿𝑁𝐿
(2.42)
(2.43)
(2.44)
(2.45)
(2.46)
1)

32
The nonlinear length 𝐿𝑁𝐿 is defined as 𝐿𝑁𝐿 = 1𝛾𝑃0
⁄ .because of the factor
exp(𝑖(𝛽0𝑧𝜔0𝑡)) have been factored (previously) in
𝐸(𝑟, 𝑡) =1
2�̂�{𝐹(𝑥, 𝑦)𝐴(𝑧, 𝑡) exp[𝑖(𝛽0𝑧 − 𝜔0𝑡)] + 𝑐. 𝑐}
The actual wave number and the frequency of perturbation are 𝛽0 ± 𝑘 and 𝜔0 ±
Ω respectively. Therefore, the two terms in the equation represent two different frequency
components, 𝜔0 + Ω and 𝜔0 − Ω, that are present simultaneously.
The dispersion relation shows that steady state stability depends critically on
whether light experiences normal or anomalous GVD inside the fiber. The plot of bright
soliton with 𝛾 = 1 is shown in Fig. 2.7. In the case of normal GVD (𝛽0 > 0), the wave
number 𝐾 is real for all Ω, and the steady state is stable against small perturbations. In the
case of anomalous GVD(𝛽0 < 0), 𝐾 becomes imaginary for |Ω| < Ω𝑐, and the
perturbation 𝛼(𝑧, 𝑇) grows exponentially with 𝑧 as seen from Equation (2.47) (Dennis et
al., 1994; Nelson et al., 1997). As a result, the CW solution Eq. (2.47) is inherently
unstable for 𝛽0 < 0. This instability is referred to as modulation instability. It leads to
spontaneous temporal modulation of the CW beam and transforms it into a pulse train (G.
P. Agrawal, 2007)
Figure 2. 7 The plot of bright soliton with γ=1f (Jonsson, 2003)
(2.47)

33
2.6.5 Dark soliton
Soliton pulses discussed in the previous sub-section are reported to operate in the
bright pulse region. In addition to the bright pulse, fiber lasers can also generate dark
solitons that are also a solution of the nonlinear Schrödinger equation (NLSE)(Zakharov
et al., 1973).Similar to the case of bright solitons, the inverse scattering method can be
used to find dark-soliton solutions of Equation (2.40)
(−𝑖𝜕𝐴
𝜕𝑍−
𝛽2
2
𝜕2𝐴
𝜕𝑇2+ 𝛾|𝐴|2𝐴 = 0)
by imposing the boundary condition that |𝐴(𝑧, 𝑡)| tends toward a constant
nonzero value for large values of |𝑡|. Dark solitons can also be obtained by assuming
(𝛽0 > 0) for the first order (𝛾 = 1) (G. P. Agrawal, 2007; Jonsson, 2003):
𝐴(𝑧, 𝑡) = tanh (𝑡)𝑒𝑖𝑧
The shape of |𝐴(𝑧, 𝑡)|2 dark soliton is shown in Fig. 2.8. For higher order
solitons (𝛾 > 1) the following closed form expression is used:
𝐴(𝑡, 𝑧 = 0) = 𝛾 tanh (𝑡)
It is a soliton, in the sense that it propagates without changing its shape, but it is not
generated by a normal bright pulse. Rather, it is due to lack of energy in a continuous
time beam. The intensity is constant, but for a short time during which it jumps to zero
and back again, thus generating a “dark pulse”. These solitons can actually be generated
to introduce short dark pulses in much longer standard pulses.
(2.48)
1)
(2.49)
1)

34
Figure 2. 8 The shape of |A(z,t)|2 dark soliton (Jonsson, 2003)
2.7 Supercontinuum generation
A supercontinuum (SC) is an extreme spectral broadening induced by the
coupling of a high peak power pulsed laser in a long nonlinear optical fiber. The
interaction between dispersion and nonlinearity exhibits novel phenomena that are
responsible for new frequency generation. Microstructure fiber can provide a nonlinearity
for a supercontinuum generation. There are several different types of microstructure
fibers being used to produce supercontinuum. The most commonly used is highly
nonlinear fiber (HNLF), micro fiber and photonic crystal fiber (PCF). It has generated
great interest in recent years due to its potential applications in spectroscopy, frequency
metrology, device characterization and surgery (Shi, 2007; Wood et al., 2012). Many
works have been performed to understand the phenomenon as well as to construct the
intended practical devices. The SC generation is dependent on both the pump pulse and
the fiber characteristics. A SC can be generated using femtosecond to nanosecond pulses,
or even a continuous wave pump where spectral broadening is initiated in the so-called
‘‘long pulse’’ region (Shahabuddin et al., 2012). The dominant nonlinear effects
occurring in the generation of a supercontinuum include SRS, FWM and SPM. The

35
spectral broadening is due to the effect of SPM in cavity, which is significantly enhanced
by the incorporation of nonlinear fiber. When a pulse travels into the nonlinear fiber,
higher light intensity of the pulse undergoes higher refractive index change compared to
its lower light intensity part. The varying refractive index will produce nonlinear phase
changes in optical pulse, leading to a change in the pulse frequency spectrum. The Raman
self-frequency shift transfers energy from the shorter to longer wavelengths
(by about 13 THZ) as the pulse propagates. The FWM process generates new frequency
components due to interaction of the primary frequencies. The supercontinuum
generation process can be studied by solving the generalized nonlinear Schrödinger
equation (NLSE) (G. P. Agrawal, 2007; Kaminski et al., 2008) as shown below;
𝜕𝐴
𝜕𝑧+
1
2(𝛼 + 𝑖𝛼1
𝜕
𝜕𝑡)𝐴 + ∑ 𝑖𝑚−1
𝑀
𝑚=2
𝛽𝑚
𝑚!
𝜕𝑚𝐴
𝜕𝑡𝑚
= 𝑖 (𝛾 + 𝑖𝛾1
𝜕
𝜕𝑡) (𝐴(𝑧, 𝑡)∫ 𝑅(𝑡′)|𝐴(𝑧, 𝑡 − 𝑡′)|2𝑑𝑡′
∞
0
)
,where ∝ is the fiber loss and 𝛽𝑚 are the coefficients of Taylor-series expansion of the
propagation constant 𝛽 and m represents the order up to which dispersive effects are
included. The 𝑚 = 1 term has been removed from Eq. (2.50) by assuming
that 𝑡 represents time in a frame moving at the group velocity of the input pulse. The loss
terms can be neglected for a short fiber. The approximation 𝛾1 ≈𝛾
𝜔0⁄ is often employed
in practice but its use is not always justified. The response function, R (t), may be written
as:
𝑅(𝑡) = (𝑖 − 𝑓𝑅)𝛿(𝑡) + 𝑓𝑅ℎ𝑅(𝑡)
(2.50)
(2.51)

36
where ℎ𝑅(𝑡) is the Raman response function and 𝛿(𝑡) is frequency shift. Eq. (2.51) has
gained successful in modeling most features of supercontinuum spectra observed
experimentally by launching ultrashort optical pulses into HNLF (Abeeluck et al., 2004)

37
CHAPTER 3
INVESTIGATION OF STIMULATED BRILLOUIN SCATTERING FOR
PULSE GENERATION
3.1 Introduction
The field of nonlinear fiber optics has gained a tremendous interest since 1990s
and has grown considerably recently. It has led to a number of advances important from
the fundamental as well as the technological point of view. Nonlinear effects in optical
fibers occur due to the interaction of intense light with dielectric material (G. P. Agrawal,
2007). These effects can be classified into two categories. The first category arises due to
the interaction of light waves with phonons which causes inelastic scattering phenomenon
such as stimulated Raman scattering (SRS) and stimulated Brillouin scattering (SBS).
The intensity of scattered light grows exponentially if the incident power exceeds a
certain threshold value. The difference between Brillouin and Raman scattering is that
the Brillouin generated phonons (acoustic) are coherent and give rise to a macroscopic
acoustic wave in the fiber, while in Raman scattering the phonons (optical) are incoherent
and no macroscopic wave is generated. The second category is due to the change in the
refractive index of the medium with optical intensity, which is responsible for the Kerr-
effect. Depending upon the type of input signal, the Kerr-nonlinearity manifests itself in
three different effects such as Self-Phase Modulation (SPM), Cross-Phase Modulation
(XPM) and Four-Wave Mixing (FWM).
Stimulated Brillouin scattering (SBS) is a nonlinear effect arising from the
interaction between the intense pump light and acoustic waves in a medium, giving rise
to backward-propagating, frequency-shifted light (G. P. Agrawal, 2007; Shirazi et al.,
2008). The thermally excited acoustic waves generate an index grating that co-propagates
with the pump light at the acoustic velocity in the medium. This moving grating reflects

38
the pump light and causes a frequency downshift in the backscattered light due to the
Doppler effects. Although this scattering creates problems for some nonlinear signal
processing applications that involve using a strong continuous wave (cw) pump
(Chraplyvy, 1990), stimulated Brillouin scattering (SBS) can however be used for
amplification of light propagating in a direction opposite to the pump light. This has
leaded to many applications, such as in Brillouin amplifiers, lasers, and microwave signal
processors (Ahmad et al., 2010; Chraplyvy, 1990).
In this chapter, a SBS in single mode fiber and microfiber is investigated. The
Brillouin fiber laser is then demonstrated using a 10 km long SMF, Erbium-doped fiber
(EDF) and highly nonlinear fiber. The temporal characteristics of these BFLs are also
investigated.
3.2 SBS generation in 10 km long SMF and a few cm long microfiber
SBS is a nonlinear phenomenon which takes place in optical fiber through a
nonlinear interaction between the pump (input) and Stokes field through an acoustic
wave. It arises when the pump light interacts with the acoustic waves inside an optical
fiber thus generates a backward propagating frequency shifted light (G. P. Agrawal, 2007;
Shirazi et al., 2008). SBS will be initiated in the backward propagating direction when
the pump power reaches a crucial value, which is regarded as the SBS threshold. SBS
threshold is defined as the input power where the Stokes power increases exponentially
(Shee et al., 2009). When the pump power is beyond this SBS threshold, majority of the
pump power is transferred to the Stokes wave and the pump power becomes depleted.
One of the important parameters that characterize SBS is its threshold. Low SBS
threshold is desirable especially for multi-wavelength Brillouin fiber laser applications
whereby more Stokes lines can be produced. In this section, Brillouin Stokes generation

39
is investigated in two gain media; 10 km long single mode fiber (SMF) and SMF based
microfiber structures.
3.2.1 SBS in 10 km long SMF
Figure 3.1 shows the experimental setup to examine the SBS effect in a piece of
10 km long SMF. As shown in the figure, a tunable laser source (TLS) is used as the
Brillouin pump (BP) with maximum peak power approximately 6 dBm at the wavelength
of 1550 nm. The maximum BP power is launched into the 10 km SMF through the ports
1 and 2 of the optical circulator (OC). The reflection is detected through the port 3 of the
OC by using the optical spectrum analyzer (OSA) with the resolution of 0.02 nm. As
described in many literatures (Harun et al., 2010), the acoustic phonons involved in the
Brillouin scattering and the interactions occurs typically over a narrow order of tens of
MHz of Brillouin gain linewidth, such as 35 MHz for fused silica (Shibata et al., 1988;
Smith, 1972). Fig. 3.2 shows back-propagating Brillouin when the BP is fixed at 1550.4
nm. The anti-Stokes, the BP Rayleigh reflection and the Brillouin Stokes for 0 dBm input
power are observed in the reflection spectrum with the peak power of about -66.4 dBm,-
46 dBm, and -65.14 dBm, respectively.
As shown in Fig. 3.2, the Brillouin Stokes light wavelength is shifted upward by
0.088 nm, which is equivalent to the downshifted frequency of around 11 GHz from the
BP signal. The shift is determined by the velocity of the acoustic grating along the fibre
and is therefore dependent on the mechanical properties of the fibre such as the elasto-
optic coefficient, applied strain and ambient temperature (Nikles et al., 1996; Yoshizawa
et al., 1993). SBS provides gain in the opposite direction of the direction of the BP wave
source. The pump power is depleted to be converted to a potentially strong Brillouin
Stokes wave propagating backward to the pump direction. The Brillouin Stokes distorts

40
communication signal in optical communication systems, which may harmful in some
cases. Therefore, an optical isolator is normally deployed in the system to eliminate the
back-propagating signals.
Figure 3.1: Experimental setup for generating Brillouin scattering in the backward
direction. Ip and Is denote the intensities of the pump and Brillouin signal lights,
respectively.
The Brillouin Stokes is obtained due to the interactions between the gain media
and BP. According to the SBS theory, the beat frequency between the Brillouin scattered
wave and the incident BP light is equal to the frequency of the acoustic wave. As long as
the Brillouin laser pump and the Brillouin Stokes wave interactions reinforce the acoustic
waves, it amplifies the scattered Brillouin Stokes wave so that the stimulated Brillouin
scattering (SBS) occurs. Rayleigh scattering in the fibre causes some portion of BP is
reflected back as shown in the Fig. 3.2. The anti-Stokes signal is also observed in the
reflection spectrum where its wavelength is shifted downward by 0.088 nm from the BP
wavelength. The anti-Stokes is caused by the degenerate four-wave mixing effect which
happening between the BP and Brillouin Stokes waves.
IP IS
Circulator
OSA
Brillouin pump
TLS
Fibre under test

41
Figure 3. 2 : The reflection spectrum are demonstrated in different input power. BP
reflection is due to BP Rayleigh scattering whereas the Brillouin Stokes (BS) and anti-
Stokes waves are generated by Brillouin scattering and degenerate four-wave mixing
process, respectively.
3.2.2 Brillouin Scattering in microfiber
Microfibres have attracted considerable interests in recent years, as they exhibit a
number of exciting properties such as large evanescent field and strong confinement light
which light is confined in a very small area over long length allowing it to observe the
nonlinear interactions. These properties are advantageous for a wide range of applications
including lasing systems, sensing devices and nonlinear optics.Their high nonlinearity
was often used to generate ultra-broad supercontinuum light (Cordeiro et al., 2005).
Microfibres may be divided into two distinct categories which are adiabatic and non-
adiabatic. The microfibre is considered as an adiabatic type when a large portion of the
power remains in the fundamental mode and does not couple to higher order modes as it
propagates along the microfibre. To avoid coupling between the fundamental and higher
order modes, the microfibre local length scale is designed to be so much larger than the
coupling length between these two modes. In other words, the relative local change in the
taper radius or angle has to be very small (Lacroix et al., 1988; Muhammad et al., 2013).
The non-adiabatic fibre tapers occurs when an abrupt change in tapering angle can be
-80
-70
-60
-50
-40
-30
-20
-10
0
1549.8 1550 1550.2 1550.4 1550.6 1550.8 1551
Pea
k P
ow
er(d
Bm
)
Wavelength(nm)
-12 dBm
7 dBm
0 dBm
BPBS
Anti-Stokes

42
made so that coupling occurs primarily between the fundamental mode and the higher
order modes. This phenomenon causes interference between the fundamental mode HE11
and its closest higher order mode HE12 while am increase in the insertion loss is also
observed due to the large difference in the refractive index (RIs) of air and glass.
Therefore, the non-adiabatic tapered microfibre is normally not suitable to be used in the
fabrication of microfibre based resonators and interferometers devices.
Recently, spontaneous and stimulated Brillouin scattering have been extensively
investigated and demonstrated using various gain media such as photonic crystal fibres
(PCF) (Woodward et al., 2014) and a hybrid chalcogenide-PMMA microwire, which
exhibit an ultra-high Kerr nonlinearity (Beugnot et al., 2013).The microfibre with a small
diameter, surrounded by air, has similar acoustic and optical properties to the PCFs, due
to the confinement light in a small core (Dainese, Russell, Wiederhecker, et al., 2006;
Kang et al., 2008). In this section, we demonstrate the generation of spontaneous Brillouin
scattering (SpBS) in a non-adiabatic microfibre and inline microfibre Mach-Zehnder
interferometer (IMZI) or microfiber based MZI (MMZI) for the first time. Both devices
are fabricated based on flame brusing technique from a standard silica fibre.
At first, three microfibre samples are fabricated from a standard telecom single-
mode fibre (SMF) using a flame brushing technique. We use the similar fabrication
technique as explained in reference (Jasim et al., 2012). Table 3.1 summarizes the
geometrical characteristic of the microfibre samples used in this work. Sample 1 is an
adiabatic type of microfibre, which has a total length of 70 mm and waist diameter of 4.6
µm. Samples 2 and 3 are fabricated by making an abrupt tapering angle at the transition
part of one end of the microfibre as shown in Fig. 3.3. This type of microfibre is referred
to a non-adiabatic type. Sample 2 has a total tapered length of 50 mm and waist diameter
of 4.9 µm while the sample 3 has shorter length of 40 mm with a waist diameter of larger
waist diameter of 6.5 µm. The abrupt change in taper angle of the non-adiabatic

43
microfibre allows the fundamental mode of the un-tapered fibre couples into two modes
of the microfibre which one mode propagating in the core of the waist and another extend
through the cladding–air interface, due to the large difference of the refractive indices of
air and glass, the microfibre normally supports more than one mode. The back and forth
coupling between the single mode of the fibre and the two (or more) modes of the
microfibre produces an interference spectral response at the output of the microfibre.
Table 3. 1: Geometrical parameters of the microfibre samples
Sample 1 Sample 2 Sample 3
Type of tapered device Adiabatic
(uniform)
Non-adiabatic
(abrupt)
Non-adiabatic
(abrupt)
Taper length (mm) 70 50 40
Waist diameter (µm) 4.6 4.9 6.5
Figure 3. 3: Microscopic image for the fabricated non-adiabatic microfibre.
Fig. 3.4 shows the experimental setup for demonstrating the SpBS effect in the
fabricated microfibre. It consists of three main components; Brillouin pump (BP), 3-ports
optical circulator (Ahmad et al.) and microfibre sample. The BP is assembled by an
external TLS and erbium doped fibre amplifier (EDFA), where the input laser from the
TLS is amplified by the EDFA to achieve the maximum BP power of 24 dBm. The BP is
then launched into the microfibre through port 2 of the OC to investigate the backward
propagating Brillouin Stokes signal, which is generated based on the SpBS process. The
Brillouin scattering was monitored through port 3 of the OC by using an optical spectrum
330 µm
Waist region
Abrupt tapering angle
125 µm

44
analyzer (OSA) with resolution of 0.02 nm. Two samples of fabricated non- adiabatic
microfibres and one adiabatic microfibre sample with varied waist diameters and tapering
length are used in this experiment to investigate the Brillouin scattering. The total length
for each sample including fibre pigtails and the tapered section is estimated to be around
80 cm.
Figure 3. 4: The experimental setup for investigating the generation of Brillouin Stokes
signal in both adiabatic and non-adiabatic microfibres.
During the fabrication of the microfibres, a broadband amplified spontaneous emission
(ASE) light source is launched into the microfibre and the loss and spectral response are
monitored using an OSA at the output end of the microfibre. Fig. 3.5 shows the
transmission spectra of all the microfibres used in the experiment. As shown in the figure,
sample 1 produces a uniform spectrum without any interference, which indicates that the
fabricated microfibre has a low loss with adiabatic tapering characteristic. As expected,
the output spectra for samples 2 and 3 exhibit interference fringes with extinction ratio of
7.6 dB and 6.7 dB at 1533 nm respectively, due to the beating between the modes. The
highest loss is observed with sample 3, which has the shortest taper length. This is due to
OSA
TLS EDFA
Waist region
Tapered length
BP

45
the abrupt change in tapering angle, which increase the leakage loss. The bending at the
transition region allows more photons to escape from the fibre due to scattering effect.
Figure 3. 5: The transmission spectra of the ASE for the three samples.
Fig. 3.6 shows the reflected light spectra from the three microfibre samples as the
BP operating at 1558 nm is launched into the microfibre via an optical circulator (as
illustrated in Fig. 3.4). The reflected light spectrum from an un-tapered fibre is also
shown for comparison purpose. As shown in Fig. 3.6, Brillouin Stokes and anti-Stokes
are generated in both non-adiabatic microfibre of samples 2 and 3. This is attributed to
the nonlinear beating between the incident light (BP) and Stokes fields creating a moving
interference pattern that induces an acoustic wave via the electrostriction effect, resulting
in so-called the spontaneous Brillouin scattering (G. P. Agrawal, 2007; Bernini et al.,
2002). SpBS is manifested through the generation of a backward-propagating Stokes
wave whose frequency is downshifted from that of the pumping field by an amount set
by the nonlinear medium. As shown in figure 4, the Brillouin Stokes light wavelength is
-80
-70
-60
-50
-40
-30
-20
-10
1510 1520 1530 1540 1550
Ou
tpu
t P
ow
er
(dB
m)
Wavelength (nm)
Sample 1
Sample 2
Sample 3

46
shifted upward by 0.088 nm (10 GHz) from the BP wavelength and the anti-Stokes
wavelength is downshifted by the same spacing for both samples. On the other hand, the
spectrum of the sample 1 shows no Stokes and it is quite similar to the spectrum of the
launched BP before tapering the fibre.
Figure 3. 6: The spectra of the launched BP and the back propagating Brillouin Stokes
for the three microfibre samples.
The reason for such result is due to the abrupt and asymmetric shape of tapering
where the non-adiabatic microfibres plays as a key effect in irritation the acoustic modes
inside the microfibre due to the great contrast of the refractive indices of air and glass
caused by changing density of a glass during tapering (Bernini et al., 2002). The complex
geometry and “hard” boundaries provide strong acoustic reflections can be guided in the
core (Russell, 2006). This periodic perturbation of the refractive index of the fibre
associated with the acoustic wave can reflect the pump field by Bragg diffraction, thus
make SpBS occurs with the Brillouin shift given by (Nikles et al., 1997) :
Anti-stokes Brillouin stokes

47
𝜈𝑖 = 2𝑛𝑒𝑓𝑓𝑉𝑎𝑖/𝜆 ,
where 𝑛𝑒𝑓𝑓 is the the effective refractive index of the fibre optical, 𝑉𝑎𝑖 is the effective
acoustic velocity of the 𝑖-th order acoustic modes and 𝜆 is the wavelength in vacuum. It
is worth noting that the Brillouin shift which caused by the periodic perturbation of the
acoustic mode velocity along the fibre is dependent on the the mechanical properties of
the fibre such as the elasto-optic coefficient, applied strain and ambient temperature
(Nikles et al., 1997). From Fig. 3.6, it also observed that the magnitude of the Brillouin-
gain spectra of sample 3 is higher than that magnitude of sample 2, where the three peaks
of Brillouin stokes, BP Rayleigh backscattering and anti-stokes of the sample 2 is
observed at the power of around -68dBm, -30dBm and -68.5dBm repectively; while the
three peaks for the sample 3 is observed at -66.3 dBm, -24.6 dBm and -66.9dBm
respectively. The explanation of that is because the waist diameter for the sample 2 is
thiner than the waist diameter of the sample 3 which partially makes a multiple excitation
to the acoustic modes (Dainese, Russell, Joly, et al., 2006). The magnitude and shape of
the Brillouin gain spectrum is corresponding to the different acoustic modes in the fibre
since each mode has a different acoustic velocity 𝑉𝑎𝑖 which is strongly influenced by the
fibre geometry (G. P. Agrawal, 2007). The fibre geometry as well can make factual effect
to the bandwidth of the Brillouin-gain where the inhomogeneities of the fibre-core cross
can broading the bandwidth.
As seen in Fig. 3.6, the bandwidth of the reflection spectrum of sample 3 is
broader than the bandwidth of the sample 2 owing to the inhomogeneities shape of the
sample. This sample has a stronger inhomogeneities compared to that of sample 2. In
order to investigate the effect of the fibre geometry on the Brillouin gain bandwidth
broadening, we fabricated another non-adiabatic microfibre structure so-called inline
Mach-Zehnder Interferometer (IMZI). This structure is fabricated by re-tapering both
(3.1)

48
transition regions of the microfibre to realize the IMZI structure of Fig. 3.7. The total
length of the fabricated IMZI was about 50 mm where the length of the first tapered
region, second tapered region and the interferometer region are 25 mm, 4 mm and 8 mm
while the waist diameters are 6.4µm, 12µm and 46µm respectively. The IMZI allows the
input light to split into two or more modes at the entrance of the interferometer region.
These modes are defined as guided and unguided modes. The guided mode keeps
travelling in the core and the unguided mode propagates through the cladding-air
interface. An interference signal occurs when the two modes are recombined at the exit
part of the interferometer region. The phase difference between the core and cladding
modes can be expressed as:
𝜑 = (2 𝜋(∆𝑛𝑒𝑓𝑓 ) 𝐿
𝜆 )
where ∆𝑛𝑒𝑓𝑓 is defined as (𝑛𝑐𝑒𝑓𝑓- 𝑛𝑐𝑙
𝑒𝑓𝑓) which is the difference of the effective
refractive indices of the core and the cladding modes, L is the length of the interferometer
region and λ is the input wavelength.
(a)
L=8mm, Ø= 46µm L=25mm, Ø= 6.4µm
50mm
L=4mm, Ø= 12µm
Interferometer
region
2nd tapered
region
1st tapered region
(3.2)

49
Figure 3. 7: The fabricated IMZI structure (a) schematic diagram and (b) microscopic
images for the three tapered regions of IMZI, where the images (i), (ii) and (iii)
represent the 2nd tapered region, interferometer region and 1st tapered region
respectively.
Fig. 3.8 shows the transmission spectrum of the fabricated IMZI, which was
obtained by using an ASE spectrum from EDFA as a light source. The transmission
spectrum before the fabrication of the IMZI structure is also included for comparison
purpose. As shown in Fig. 3.8, the IMZI produces interference fringes with extinction
ratio of approximately 15 dB due to the mode interferences in the device. The insertion
loss of fabrication inline MMZI is measured to be approximately 9 dB. When the IMZI
is incorporated into the experimental setup of figure 2 for generating Brillouin scattering,
the Brilloun Stokes and anti-Stokes are observed as shown in Fig. 3.9. Fig. 3.9 compares
the back propagating Brillouin signal for the sample 2 and the IMZI when the BP is fixed
at 1558 nm. It is found that the Brillouin Stokes wavelength is shifted upward by 0.088
nm (10 GHz) from the BP wavelength and the anti-Stokes wavelength is downshifted by
the same spacing. As seen in Fig. 3.9, the magnitude of the Brillouin-gain spectra for the
IMZI is higher than that magnitude of the sample 2, where the three peaks of Brillouin
Stokes, BP Rayleigh backscattering and anti-Stokes of the sample 2 is observed at the
power of around -66.7dBm, -28.9dBm and -66.9dBm respectively. This is due to the
IMZI structure, which allows a stronger multimode interference and thus improves the
SpBS generation in the fibre. Also observed from Fig. 3.9, the bandwidth of the dominant
gain for the IMZI is broader than the bandwidth of the sample 2 owing to the
(i) (iii) (ii)
90 µm (b)

50
inhomogeneities shape of the fabricated IMZI. This shows that the microfibre geometry
plays an important role in the SpBS generation.
Figure 3. 8: The transmission spectra of the ASE for the IMZI.
Figure 3. 9: The spectra of the back propagating Brillouin Stokes for the IMZI and
sample 2.
Fig. 3.10, shows the SpBS process by increasing the launched BP power to the
non-adiabatic microfibre. From Fig. 3.10, it can clearly observed that the Brillouin Stokes
-60
-50
-40
-30
-20
-10
1520 1530 1540 1550 1560 1570
Ou
tpu
t P
ow
er
(dB
m)
Wavelength (nm)
ASE before fabricating IMZI
ASE after fabricating IMZI
-85
-75
-65
-55
-45
-35
-25
1557.8 1557.89 1557.98 1558.07 1558.16 1558.25
Ou
tpu
t P
ow
er
(dB
m)
Wavelength (nm)
Sample 2
IMZI

51
and anti-stokes started to appears at the launched BP power of 39.8 mw ≈ 16 dBm; and
the intensity of these signals are slightly improved by increasing the BP power to the 50.1
mW ≈ 17 dBm and 63 mW ≈ 18 dBm. It can be also observed from Fig. 3.10 that the
peak power of the BP Rayleigh backscattering and the Brillouin gain bandwidth are
reducing by increasing the BP power, owing to the improving of the Brillouin Stokes.
Such results indicated that the SpBS based on non-adiabatic microfibre will require a high
BP power to be stimulated strongly, as well as an increase of the tapered length and a
decrease the diameter of the waist regions. Such measures should enhance the
nonlinearity of the non-adiabatic microfibres, and thus lead to Brillouin Stokes being
affected significantly with increasing BP power. Nevertheless, the short length of non-
adiabatic microfibres (in millimeters) retains the relative advantages of design simplicity
and lower cost in generation of Brillouin Stokes. Whereas, when the non-adiabatic
microfibre (sample 2) replaced by 200 meter of non-tapered standard SMF, the Brillouin
Stokes could not be observed even at the maximum BP power of 24 dBm as shown in
Fig. 3.11. However, by using much longer length of SMF of 20 km, the Brillouin Stokes
could stimulate at lower BP power of 0.79 mW ≈ -1 dBm, due to enhancement of the
nonlinearity in the long fibre. Still, the non-adiabatic microfibres based SBS generations
retain the key advantage of shortness fibre length, showing a much greater potential for
stimulating Brillouin Stokes than that long length of SMF based SBS generations.

52
Figure 3. 10: The SpBS with different launched BP power.
Figure 3. 11: The spectra of the back propagating Brillouin Stokes for different fiber
length, where the red and blue colors represent SMF with length of 200 m and 20 km
respectively and the green color represent sample 2 of the non-adiabatic microfiber
-80
-70
-60
-50
-40
-30
1557.85 1557.9 1557.95 1558 1558.05 1558.1 1558.15 1558.2 1558.25
Ou
tpu
t P
ow
er(
dB
m)
Wavelength(nm)
39.8 mW
50.1 mW
63.1 mW
-75
-65
-55
-45
-35
-25
-15
-5
1557.8 1557.9 1558 1558.1 1558.2
Ou
tpu
tPo
we
r(d
Bm
)
Wavelength(nm)
200 m
20 km
Sample 2 (50 mm)

53
3.3 Spectrum and temporal characteristics of BFL
This section demonstrates a Brillouin fiber laser (BFL) generation using a 10 km
long SMF as the gain medium in a ring configuration and investigates the spectrum and
temporal characteristics of the laser. The configuration of BFL is based on the
conventional ring set-up as illustrated in Fig. 3.12. It consists of an optical circulator,
polarization controller (van Saarloos & Hohenberg), an output coupler and a 10 km long
SMF. The SMF has a cut-off wavelength of 1161 nm, a zero dispersion wavelength of
1315 nm and a mode field diameter of 9.36 µm at 1310 nm. The BP is an external cavity
TLS with a maximum power of approximately 6 dBm and a linewidth of about 15 MHz.
It is injected into the SMF from port 1 through port 2 of the optical circulator in a
clockwise direction. The BP wavelength is fixed at 1550 nm in this experiment. The BP
is launched through the optical circulator to generate a backward propagating SBS, which
oscillates inside the resonator to generate the laser at wavelength downshifted by 0.088
nm from the BP wavelength. The backward-propagating SBS generated oscillates inside
the resonator in anti-clockwise direction to generate the Brillouin laser, which is coupled
out using a coupler. The optical circulator which protects the TLS from any BP reflection
is also used to force the unidirectional operation of the laser in the cavity although SBS
in the SMF propagates only in the backward direction due to the SBS feature. The laser
output spectrum is characterized using the optical spectrum analyzer (OSA, Yokogawa,
AQ6370B) with a spectral resolution of 0.015 nm whereas the oscilloscope is used to
observe the output temporal characteristics emission via a 1 GHz bandwidth photo-
detector.

54
Figure 3. 12: Schematic diagram of the BFL using a 10 km long SMF as the gain
medium
The threshold power of the BPL is defined as the BP power at the point where the
resonator starts to generate laser via SBS. At the BP threshold power, a sudden jump of
the BFL’s peak power should be observed. Below this threshold power, only spontaneous
scattering emission is oscillating in the resonator and thus the output Stokes power is low.
The BFL output power characteristic is investigated at various BP power in order to
determine the threshold BP power for the proposed BFL. Fig. 3.13 shows the output
spectra of the BFL at three different BP powers. In the experiment, the 10/90 output
coupler is used where 90% of the light is allowed to oscillate in the ring cavity. As shown
in the figure, the resonator generates a Brillouin Stokes at around 1550.088 nm, which is
0.088 nm longer than the BP wavelength. The Stokes peak power increases with the
increment of the BP power and exceeds the residual BP power, which indicates the
generation of BFL at pump power of 1 dBm or above. The anti-Stokes signal is also
observed at a shorter wavelength due to four-wave mixing between the BP wave and the
Brillouin Stokes wave. The 3-dB bandwidth of the Stokes line is observed to be less than
0.02 nm, limited by the OSA resolution. Fig. 3.14 shows the output peak power of the

55
Brillouin Stokes against the input BP power at the different output coupler ratios. In the
experiment, the BP power is varied from 0 to 6 dBm while the BP wavelength is fixed at
1550 nm. As shown in the figure, at 0 dBm pump power, a spontaneous Brillouin
scattering is generated, which the power increases with the pump power.
Figure 3. 13: Output spectra of the BFL at various pump powers.
As the BP is increased above a certain threshold, we observe a sudden increase in
Stokes peak power due to the SBS process, which initiate the Brillouin Stokes lasing. The
threshold BP powers for the BFL are obtained at 1.2, 1.5, 2.2 dBm for the laser cavity
configured with 10/90, 20/80, and 50/50 output coupler, respectively. It is found that the
threshold BP power increases with the use of higher output taper ratio, which increases
the cavity loss. After the threshold, the peak power exponentially increases with the 1550
nm BP power. It is also observed that the maximum output power increases with the
increment of the output coupler ration. For instance, the maximum laser’s peak power of
-3.12 dBm is obtained for the BFL configured with 50/50 coupler. The incorporation of
-80
-70
-60
-50
-40
-30
-20
-10
0
1549.5 1549.6 1549.7 1549.8 1549.9 1550 1550.1 1550.2 1550.3 1550.4 1550.5
Ou
tpu
tPow
er (
dB
m)
Wavelength(nm)
0 dBm
1 dBm
6 dBm

56
optical circulator in the cavity ensures the unidirectional operation of the BFL and
suppresses the residual BP. This also reduces the four-wave mixing effect in the cavity
and thus the generation of anti-Stokes was suppressed.
Figure 3. 14: The output peak power of the BFL against the BP at three different output
couplers.
The temporal characteristics of the BFL configured with 10/90 coupler are also
investigated and the result is shown in Fig. 3.15. When the BP power reaches the
threshold, the laser outputs stable pulse array in periods. At a threshold pump power of
1.2 dBm, the pulse width and repetition frequency of the laser are obtained at 440 µs and
2 kHz, respectively as shown in Fig. 3.15 (a). As the pump power increases, the pulse
width becomes shorter while the repetition rate increases. For instance, the pulse width
reduces from 440 to 40 µs and the repetition rate increases from 2 kHz to 19.7 kHz as the
BP power increases from 1.2 dBm to 1.6 dBm. This Q-switching or pulsing behavior is
due to the relaxation oscillation, a natural trait of fiber laser, which occurs around the
laser threshold as the SBS grows. Physically, the origin of relaxation oscillation can be
explained as follows: rapid growth of the Stokes power near the input end of the fiber
depletes the pump. This reduces the gain until the depleted portion of the pump passes
-60
-50
-40
-30
-20
-10
0
0 1 2 3 4 5 6
Ou
t p
ut
pea
k p
ow
er (
dB
m)
Input BP Power (dBm)
pp(10/90)
pp(20/80)
pp(50/50)

57
through of the fiber. The gain then builds up, and process repeats itself. In other word,
the relaxation oscillation and instabilities happen due to the gain, which reacts too slowly
to the light field and the stimulated lifetime, which is too long compared with the cavity
decay time. However, the pulsing behavior becomes unstable and the pulse periodicity
becomes so infinitesimal that the periodicity disappears as the BP is increased above 1.8
dBm as shown in Fig. 3.15 (d). This can be explained by that the backwards Stokes get
more energy in center longitudinal mode frequency, and the direct current part amplitude
of oscillation get higher at mean time, the other part of the longitudinal mode energy get
less. When the direct current part is big enough that the longitudinal mode in the range of
non-uniform line width disappears because of the absence of pump energy, then the laser's
output is a stable value.
0
0.01
0.02
0.03
0.04
0.05
0.06
0 0.0001 0.0002 0.0003 0.0004 0.0005
Inte
nsi
ty (
V)
Time(s)
BP=1.2 dBm
Pulse width = 440 µs
0
0.01
0.02
0.03
0.04
0.05
0.06
0 0.0001 0.0002 0.0003 0.0004 0.0005
Inte
nsi
ty (
V)
Time (s)
b BP=1.4 dBm
Pulse Width= 194 µs
a

58
Figure 3. 15: Temporal characteristic of the BFL at different BP power (a) 1.2 dBm, (b)
1.4 dBm (c) 1.6 dBm (d) >1.8 dBm
Fig. 3.16 shows the pulse width and Stokes peak power against the increase of the
pump power. We use a ratio of BP power to the threshold pump power to represent the
𝑥 −axis as shown in Fig. 3.16. As shown in the figure, the width of pulse array decreases
as the ratio of pump power to the threshold power is increased. In the nonlinear process
of converting pump power to Stokes wave, the multilevel SBS effect and the pump
exhaust of Brillouin generate under the effect of gain saturation and pump exhausts, As
increase of multilevel SBS increase with the increase of pump power, and then the peak
power of the output laser pulse increases gradually and the width decreases gradually.
0
0.01
0.02
0.03
0.04
0.05
0.06
0 0.0001 0.0002 0.0003 0.0004 0.0005
Inte
nsi
ty (
v)
Time (s)
c
0
0.01
0.02
0.03
0.04
0.05
0.06
0 0.0001 0.0002 0.0003 0.0004 0.0005
Inte
nsi
ty (
V)
Time (s)
d
BP=1.6 dBm
Pulse Width= 40 µs
BP > 1.8 dBm

59
Figure 3. 16: The pulse width and Stokes peak power characteristic at different ratio of
BP power to the threshold pump power
3.4 Brillouin Erbium fiber laser
Brillouin Erbium fiber laser (BEFL) is demonstrated under a new approach using
an EDF with very high fiber nonlinearity as both linear and nonlinear gains medium. The
Stokes is generated in the EDF by the injection of a narrow linewidth Brillouin pump.
With the use of 1480 nm pumping on the EDF, the generated Brillouin Stokes is amplified
to generate a BEFL. The EDF has also a high Erbium dopant concentration and thus it
can be used to realize a compact BEFL. The temporal characteristic of the BEFL is
investigated in this study. The performance of the BEFL is then compared with the
conventional BFL.
A configuration of the BEFL is shown in Fig. 3.17, which the resonator consists
of a circulator, a WDM coupler, 3 m long EDF, an isolator and 80/20 output coupler. The
EDF has a cutoff wavelength of 945 nm, core diameter of 4 µm and a numerical aperture
of 0.23. Since the core diameter of the fiber is small, the fiber nonlinearity is expected to
0
1
2
3
4
5
6
7
0
50
100
150
200
250
300
350
400
450
500
0 0.2 0.4 0.6 0.8 1 1.2
Sto
ckes
pea
k p
ow
er (
dB
m)
Pu
lse
wid
th (
µs)
BP power / Threshold power
Pulse width (µs)
SP Power(dBm)

60
be reasonably high in this EDF compared to the standard EDF with core diameter of
around 8 µm. The absorption of the EDF is 11.9 and 17.5 dB/m at 979 and 1531 nm,
respectively. It is forward pumped using a 1480nm laser diode to generate amplified
spontaneous emission (ASE) in 1550 nm region. The ASE oscillates in the ring cavity to
generate a random laser as well as to provide a linear gain for assisting in Brillouin laser
generation. A 1480/1550 nm WDM is used to combine the 1480nm pump and the
oscillating signal in the ring cavity. The EDF is also pumped by an external cavity tunable
laser source (TLS) with a linewidth of approximately 20 MHz and a maximum power of
approximately 5 dBm to generate a nonlinear gain or Stokes, which is injected into the
ring cavity via optical circulator.
The injected BP generates backward propagating Brillouin Stokes, which is
amplified by the linear EDF gain and oscillates in the loop to generate a BEFL in a counter
clockwise direction. An optical isolator is inserted inside the loop to block the BP from
oscillating in the loop. By using a single fiber for the linear amplification and Brillouin
Stokes generation, we are simultaneously amplifying the BP and Brillouin signal in this
cavity. This allows shorter length of active fiber to be used for the BEFL generation,
which in turn reduces a total cavity loss and increase the output power. A 20% output
coupler is used to extract BEFL output, which is characterized using an optical spectrum
analyzer (OSA). Oscilloscope and RF spectrum analyser are used to analyse the temporal
characteristic of the laser via a 460 kHz bandwidth photo-detector (Thor lab, PDA50B-
EC). The performance of the conventional Brillouin fiber laser, which is obtained by
replacing the WDM coupler and EDF with a 20 km long a standard SMF is also
investigated.

61
Figure 3. 17: Configuration of the proposed BEFL
Without the BP, the proposed EDFL produces a random laser with a spectrum of
few peaks at wavelength region of 1561 nm. As the BP with the operating wavelength
close to these peaks is injected into the laser cavity, the BEFL is generated. Figure 3.18
compares the output spectrum of the generated BEFL with the conventional BFL
configured with a long length of standard SMF as the gain medium. In the experiment,
the BP and 1480 nm pump power is fixed at 5 dBm and 34 mW, respectively. As shown
in Figure 3.18, both lasers operate at wavelength that is shifted by 0.08 nm from the BP.
The peak power of the proposed BEFL is 5 dB higher than the conventional BFL due to
the stimulated emission from the Erbium ion, which provides additional gain in the cavity.
However the spontaneous emission from the Erbium ion increases the noise level of the
laser. The side mode suppression ratios (the difference between the Brillouin laser peak
and the residual BP power) are measured to be around 5 dB and 30 dB for the BEFL and
BFL, respective

62
Figure 3. 18: Output spectrum from the BEFL and BFL
The performance of BEFL was studied for different 1480nm pumping power. The
BP power is fixed at 5 dBm. Fig. 3.19 shows the output spectrum of the BEFL. As shown
in the figure, a BEFL wavelength component at separation of 0.08 nm at longer
wavelength could be easily observed when the 1480nm pump power exceeded ~13 mW,
and peak power grew up to -5 dBm as the pump power was raised to 34 mW. As shown
in the figure, the 1480 nm pump power threshold is approximately within 13 mW. Below
this pump power, the erbium gain is very low and cannot sufficiently compensate for the
loss inside the laser cavity and thus no Stokes is observed. The generated BEFL power is
observed to increase as the 1480nm pump power increases, which is attributed to the
increment of the erbium gain with pump power. This situation provides sufficient signal
power for SBS to generate Stokes, which is then amplified by the erbium gain.
Inset of Figure 3.19 shows the relationship between the peak power and the
injected 1480 nm pump power when the BP power is fixed at 5 dBm. The Brillouin Stokes

63
laser starts to lase at pump power of 13 mW and drastically increased by 8 dB as the
pump power increased to 16 mW. After that the peak power exponentially increases with
the 1480 nm pump power with the rate of 0.55 dB/mW. At the maximum 1480 nm pump
power of 34 mW, the BEFL has a peak power of -5 dBm and a side mode suppression
ratio (SMSR) of more than 5 dB. The incorporation of both optical isolator and circulator
in the cavity ensure the unidirectional operation of the BEFL and suppresses the residual
BP. These supresses the four-wave mixing effect in the cavity and thus the generation of
anti-Stokes was avoid.
-60
-50
-40
-30
-20
-10
0
1560.7 1560.8 1560.9 1561 1561.1 1561.2 1561.3 1561.4 1561.5
ou
tpu
t p
ow
er (
dB
m)
wavelenght (nm)
10 mw
13 mw
34 mw
a)

64
Figure 3. 19: a) Output spectra of the BEFL at various 1480 nm pump powers. b) Inset
shows the peak power of the laser against the input 1480 nm pump power.
The performance of the BEFL was also studied for different input powers and
wavelengths of the BP. Fig. 3.20 shows the relation between the BEFL peak power and
the BP power. In the experiment, the 1480 nm pump power and BP wavelength is fixed
at 34 mW and 1561 nm, respectively. The result for the conventional BFL is also included
in Fig. 3.20 for comparison purpose. It is observed that the threshold BP power, which is
required to initiate SBS in the EDF is about 2 dBm and the output power of the BEFL
does not change much as the BP is further increased.
-25
-20
-15
-10
-5
0
10 15 20 25 30 35
Pea
k P
ow
er (
dB
m)
Input Power (mw)
b)

65
Figure 3. 20: The Stokes peak power against the BP power for both BEFL and BFL
This is attributed to the Brillouin gain which is too small and thus the output power is
mainly contributed by higher Erbium gain. On the other hand, the threshold BP power is
slightly lower in the conventional BFL (1 dBm). After the threshold, the output power of
the BFL linearly increases with the BP power. It is also observed that the output power
of the laser is reasonably lower than that of the BEFL because it only depends on Brillouin
gain. Fig. 3.21 shows the output spectrum of the BEFL at various BP wavelengths. In this
experiment, the BP and 1480nm pump power is fixed at 5 dBm and 34 mW, respectively.
As shown in the figure, the BP can be tuned from 1560.6 to 1562.6 nm with peak power
variation of less than 4.7 dB.
-70
-60
-50
-40
-30
-20
-10
0
0 1 2 3 4 5
Pea
k P
ow
er(d
Bm
)
BP Power (dBm)
SMF
EDF

66
Figure 3. 21: The output spectrum of the BEFL at different BP wavelengths
The temporal characteristic could be observed in both BEFL and BFL as the
Stokes is generated. A stable self pulsing behavior is observed in the BEFL as the 1480
nm pump power is set within 13 mW to 20 mW. As the pump power is increased further,
the Stokes generation process stabilizes and the pulse generation disappears. In case of
the BFL, the self pulsing is obtained when the BP power is set within 1 to 2 dBm. Figure
3.22 shows the oscilloscope trace of the BEFL and BFL at the threshold pump power
settings. Both BEFL and BFL show a self pulsing characteristic with repetition rates of
66.7 kHz and 102.0 kHz respectively. The self-pulsing behavior is due to the relaxation
oscillation, a natural trait of fiber laser which occurs around the laser threshold as the
SBS grows. Physically, the origin of relaxation oscillation can be explained as follows;
rapid growth of the Stokes power near the input end of the fiber depletes the pump. This
reduces the gain until the depleted portion of the pump passes through of the fiber. The
gain then builds up, and process repeats itself. In other word, the relaxation oscillation

67
and instabilities happen due to the gain which reacts too slow to the light field and the
stimulated lifetime which is too long compared with the cavity decay time. As shown in
Fig. 3.22, the self-pulsing characteristic is more pronounched in BFL, which has longer
cavity length than that of BEFL. This is due to the longer cavity length that exhibits a
higher instability and thus a pulse train can be easily produced based on nonlinear and
spectral hole burning effects. This result shows that a stable CW Brillouin laser with low
threshold can be realized in BEFL with low loss ring cavity.
Figure 3. 22: Oscilloscope trace from the BEFL and BFL

68
3.5 Generation of nanosecond pulse with highly nonlinear fiber (HNLF) based
on SBS
Recently, nanosecond pulse lasers attracted broad attention from scientists due to
their potential applications in various fields such as medical surgery and sensing
(Englender et al., 1992). Compared to the conventional picosecond or femtosecond
pulses, nanosecond laser exhibits higher pulse energy. Besides, the nanosecond mode-
locked fiber lasers can operate in higher frequency (Megahertz) compared to typical Q-
switched laser, which operates in kilohertz region. In this section, a nanosecond mode-
locked BFL is demonstrated using an SBS effect in a highly nonlinear fiber (HNLF). The
BFL is based on mode locking process, which is a self-starting and does not require an
intra-cavity modulator. The occurrence of pulses is also found to be highly stable.
3.5.1 Configuration of the proposed mode-locked BFL
The configuration of the BFL is shown in Fig. 3.23, which consists of a BP,
Erbium-doped fiber amplifier (EDFA), an optical circulator, 100 m long HNLF and a
95/5 output coupler. The HNLF exhibits loss coefficient, dispersion slope and nonlinear
parameter of 1531 nm, 0.73 dB/km, 0.007 ps/nm2km and 11.5 W-1km-1 respectively. The
BP is an external cavity TLS with a line width of approximately 20 MHz, which is
amplified by an EDFA to provide the maximum output power of 15 dBm and operated in
1560 nm. The BP output is launched into the HNLF through an optical circulator to
generate a backward propagating SBS, which oscillates inside the resonator to generate
the laser at a wavelength which is downshifted by 0.08 nm from the BP wavelength. The
optical circulator is also used to induce unidirectional operation of the laser in the cavity.
The counter-clockwise oscillating laser is extracted from the resonator via the 5 % coupler
and examined by an OSA with a wavelength resolution of 0.02nm. Besides, a 350 MHz

69
oscilloscope in conjunction with a 1.2 GHz bandwidth photo-detector is used to analyze
the temporal characteristic.
Figure 3. 23: Schematic configuration of the proposed nanosecond BFL
3.5.2 The performance of the nanosecond mode-locked BFL
Fig. 3.24 shows the output spectrum of the proposed nanosecond pulsed BFL with
a HNLF as the gain medium at different BP powers. It is observed that a Brillouin Stokes
is generated at a wavelength shifted by 0.08nm from that of the BP as the BP power
reaches 10.5 dBm and above. The Stokes peak power increases with the increment of the
BP power and exceeds the residual BP power, which indicates the generation of BFL at
pump power of 10.9 dBm. A slight spectral broadening is also observed for the Stokes
signal, which is most probably due to the self-phase modulation (SPM) effect. The HNLF
has a zero dispersion wavelength at 1531 nm and the fiber laser is estimated to operate in
the normal dispersion regime.

70
Figure 3. 24: Output spectra of the BFL configured with HNLF at various BP power
Fig. 3.25 shows a typical pulse train of the mode-locked laser at threshold of BFL.
It is observed that the laser operates at repetition rates of 1.76 MHz at pump power of
10.9dBm. The corresponding pulse widths are 270 ns. The development of the short pulse
is attributed to the onset of SBS, which creates a traveling high reflector in the HNLF and
thereby depletes the energy stored in the gain medium through mode-locking process
(Jusoh et al., 2013). This mode-locking behavior is due to a nonlinear self-pulsing
mechanism based on inherent instability of the BFL. The origin of this instability lies in
the relaxation oscillation, a natural trait of fiber laser which occurs around the laser
threshold that causes a series of avalanche processes. The Stokes power generated by the
BP does not approach its steady state value monotonically but exhibits relaxation
oscillations with a period of 2𝑇𝑟, where 𝑇𝑟 = 𝐿/𝑣𝑔the transit time for a fiber of length 𝐿
and 𝒗𝒈 is the group velocity. In the presence of external feedback, the relaxation
oscillations can be turned into a stable oscillation where both pump and Stokes wave can
develop self-induced intensity modulation. Even though the group velocity 𝑣𝑔 is nearly
the same for the pump and the Stokes wave, their relative speed is 2𝑣𝑔 because of their

71
counter propagating nature. Relaxation oscillations occur as a result of this group velocity
mismatch. Unlike the conventional mode-locking fiber lasers, in which the pulse duration
is proportional to the photon lifetime in the resonator, the short pulses generated by the
SBS do not depend on the photon lifetime in the resonator but rather on the dynamics of
the nonlinear process. It is found that the fundamental repetition rate fits the free-spectral
range of longitudinal modes in the cavity. This is attributed to the relaxation oscillation,
which allows the proposed BFL to generate Stokes pulses with a repetition rate nearly
equal to the longitudinal mode spacing.
Figure.4.13: Typical pulse train of the nanosecond pulse BFL
The output frequency spectrum of the laser is also analyzed with the RF spectrum
analyzer as shown in Fig. 3.26. The signal to noise ratio (SNR) obtained is about 38 dB,
which confirms the stability of the pulses. However, the obtained SNR is still lower
compared to other techniques based on saturable absorber, which has an SNR more than
40 dB similar mode (Ahmad et al., 2013). These results show that the SBS can serve as a
passive mode-locker inside the fiber laser resonator to generate nanosecond pulses. The
proposed BFL is capable of producing nanosecond pulses with extensive wavelength
Figure 3. 25: Typical pulse train of the proposed nanosecond BFL

72
tunability, which has many potential applications such as telecommunication
applications.
Figure 3. 26: The RF spectrum of the nanosecond pulse BFL
3.6 Summary
A SBS in both SMF and microfiber structures such as non-adiabatic microfiber
and IMZI have been investigated. It was observed that the Stokes wavelength is up-
shifted by 0.088 nm (10 GHz) from the BP wavelength while the anti-Stokes wavelength
is downshifted by the same spacing. It was found that the IMZI can produce higher
spontaneous Brillouin scattering Stokes and anti-Stokes powers due to its stronger
multimode interference effect compared to the non-adiabatic microfiber. However, both
microfiber structures cannot produce the SBS with our current facilities. Therefore, the
BFL was then demonstrated using a long piece of SMF, EDF and HNLF as the gain
medium. With 10 km long SMF, the threshold BP powers for the ring BFL were obtained
at 1.2, 1.5, 2.2 dBm for the laser cavity configured with 10/90, 20/80, and 50/50 output
coupler, respectively. The maximum laser’s peak power of -3.12 dBm is obtained for the

73
BFL configured with 50/50 coupler. At a threshold pump power of 1.2 dBm, the BFL
exhibited temporal characteristic where the pulse width and repetition frequency of the
laser are obtained at 440 µs and 2 kHz, respectively. As the pump power increases, the
pulse width becomes shorter while the repetition rate increases. This Q-switching or
pulsing behavior is due to the relaxation oscillation, a natural trait of fiber laser, which
occurs around the laser threshold as the SBS grows. With 3 m long EDF, the BEFL was
realized to operate at 1561.5nm region with a peak power of −5dBm and an SMSR of
more than 5 dB when the BP and 1480nm pump powers were fixed at 5dBm and 34mW,
respectively. The BEFL also showed a self-pulsing characteristic with repetition rates of
66.7 kHz but the amplitude of the pulse was significantly lower than the previous BFL.
With 100 m long HNLF, the BFL produced a self-starting mode-locking pulse train with
a repetition rate of 1.76 MHz at BP power of 10.9 Bm. The pulse width of the laser was
maintained at around 270 ns.

74
CHAPTER 4
DEVELOPMENT OF PULSED LASER BASED ON NONLINEAR EFFECTS
4.1 Introduction
Passively pulsed fiber lasers are attractive for many applications because of their
simplicity, compactness, efficient heat dissipation, and ability to generate high-quality
pulses (G. P. Agrawal, 2007). For instance, mode-locked Erbium-doped fiber lasers
(EDFLs), which are capable of generating ultra-short pulses in the telecommunication
wavelength of about 1.55𝜇𝑚, are promising for use in the next generation
telecommunication applications (Dinu et al., 2003). Generation of ultra-short pulses has
also attracted considerable attention in other areas of physics such as the ultrafast physics
and nonlinear optics. The fundamental of the pulsed lasers is highly related to various
type of nonlinearity. For instance, nonlinear polarization rotation (NPR) implementation
can easily tune the phase shift in a laser cavity and to achieve different type of fix phase
condition in a laser cavity (Xu et al., 2004).
In the previous chapter, the potential of Stimulated Brillouin Scattering (SBS) for
generating pulse was investigated. A nanosecond mode-locked pulse train was
successfully realized by using a highly nonlinear fiber (HNLF) as a Brillouin gain
medium in a ring configuration. In this chapter, several passively mode-locked and
Q-switched fiber lasers are demonstrated based on nonlinear effects inside the ring laser
cavity. At first, the NPR based mode-locked EDFL with three switchable operation states
is proposed and demonstrated by incorporating a 10 km long SMF in the ring cavity.
Then, a nanosecond optical pulse generation is demonstrated in EDFL by using a 100 m
long HNLF instead of the SMF. The HNLF plays an important role to induce Kerr effect
in the cavity, which allows the polarization rotation occur in the cavity. This allows a

75
mode-locking pulse is generated based on NPR technique. A Q-switched EDFL is also
demonstrated based on NOLM cavity. The NOLM is used in the laser cavity to generate
the intensity dependent transmission so that it functions as a saturable absorber. Finally,
a Q-switched Brillouin fibre laser (BFL) is demonstrated using multi-walled carbon
nanotubes (MWCNTs) embedded in polyvinyl alcohol (PVA) film as a passive saturable
absorber.
4.2 Harmonic mode-locked EDFL based on NPR effect in a ring laser cavity
with assistance from a 10 km long single-mode fiber
Most of the reports on mode-locked EDFLs were focused on ultrafast fiber lasers
that emitted femtosecond and picosecond pulses. There are still lacks of research work
on generation of nanosecond pulses. Usually nanosecond pulses emitted from mode-
locked fiber lasers are giant-chirped and have large duration and low peak power, which
may induce little nonlinear phase accumulation during amplification (Komarov et al.,
2006; Zhao et al., 2007). Therefore, a nanosecond pulsed EDFL is preferred as a better
alternative seed oscillator than a femtosecond or picosecond pulsed one for chirped pulse
amplification (CPA) and average power scaling systems. In this section, generation of
nanosecond pulses in EDFL based on NPR technique is demonstrated. We employ a long-
cavity ring resonator for producing nanosecond pulses in normal dispersion regime. It is
worth noting that although the cavity length is significantly long, the fiber laser still
operates at its fundamental repetition rate without pulse breaking. The operation regime
of the proposed pulse laser can be tuned from fundamental to 3th order harmonic
operating regimes under appropriate polarization orientation and pump power.
The experimental setup of our proposed NPR-based mode-locked EDFL is
schematically shown in Fig. 4.1. It has a ring configuration and the total cavity length of
more than 10 km. A segment of 3.5 m erbium doped fiber (EDF) with an erbium

76
concentration of 2000 ppm, cut-off wavelength of 910 nm, a pump absorption coefficient
of 24 dB/m at 980 nm and a dispersion coefficient of -21.64 ps/nm∙km at 1550 nm was
employed as the gain fiber. The rest of the ring was made of standard single mode fiber
(SMF), whose GVD parameter was 17 ps/(nm km). . The EDF was pumped by a
commercial 980 nm laser diode (LD) through a wavelength division multiplexer (WDM).
A polarization dependent isolator (PDI) was spliced in the cavity to ensure unidirectional
operation of the laser and at the same time to generate linear light polarization. A
polarization controller (van Saarloos & Hohenberg) was employed to adjust polarization
of light by fine-tuning the linear cavity birefringence. A 10 km spool of SMF constitutes
the long cavity and also serves to increase the nonlinearity and dispersion. A 5% of the
circulating light is taken out of the cavity via a 95/5 coupler and then split into two outputs
by a 3 dB coupler for optical spectral and temporal analysis. The optical spectrum
analyser (OSA, Yokogawa, AQ6370B) is used for the spectral analysis of the proposed
EDFL with a spectral resolution of 0.02 nm whereas the oscilloscope is used to observe
the output pulse train of the EDFL pulse emission via a 1 GHz bandwidth photo-detector.
The cavity is operating in a large negative dispersion region due to the long SMF.

77
Figure 4. 1: Experimental setup of the proposed EDFL for generating harmonic
nanosecond pulses.
The harmonic pulse is generated based on NPR effect in the ring cavity (Becker
et al., 1972). The polarization state evolves nonlinearly during the propagation of the
pulse inside the EDF and SMF due to SPM and cross phase modulation (XPM) effects in
the ring cavity. The state of polarization is non-uniform across the pulse because of the
intensity dependence of the nonlinear phase shift. The PC is adjusted so that it forces the
polarization to be linear in the central part of the pulse. The polarizing isolator lets the
central intense part of the pulse pass but blocks (absorbs) the low-intensity pulse wings.
The net result is that the pulse is slightly shortened after one round trip inside the ring
cavity, an effect identical to that produced by a fast SA. In other words, the PDI, working
together with the birefringence fibers generates an intensity dependent loss mechanism
in the cavity that contributes to pulse generation in the cavity.
By carefully adjustment of the PC orientation, pulse emission operating in
fundamental repetition rate of 20 kHz could be observed at pumping power threshold of
36 mW as shown in Fig. 4.2(a). To obtain a stable pulse train of laser emission, it is
980 nm
pump
PDI
OSA
RF/OSC
EDF
95 / 5
Coupler
WDM
SMF
PC
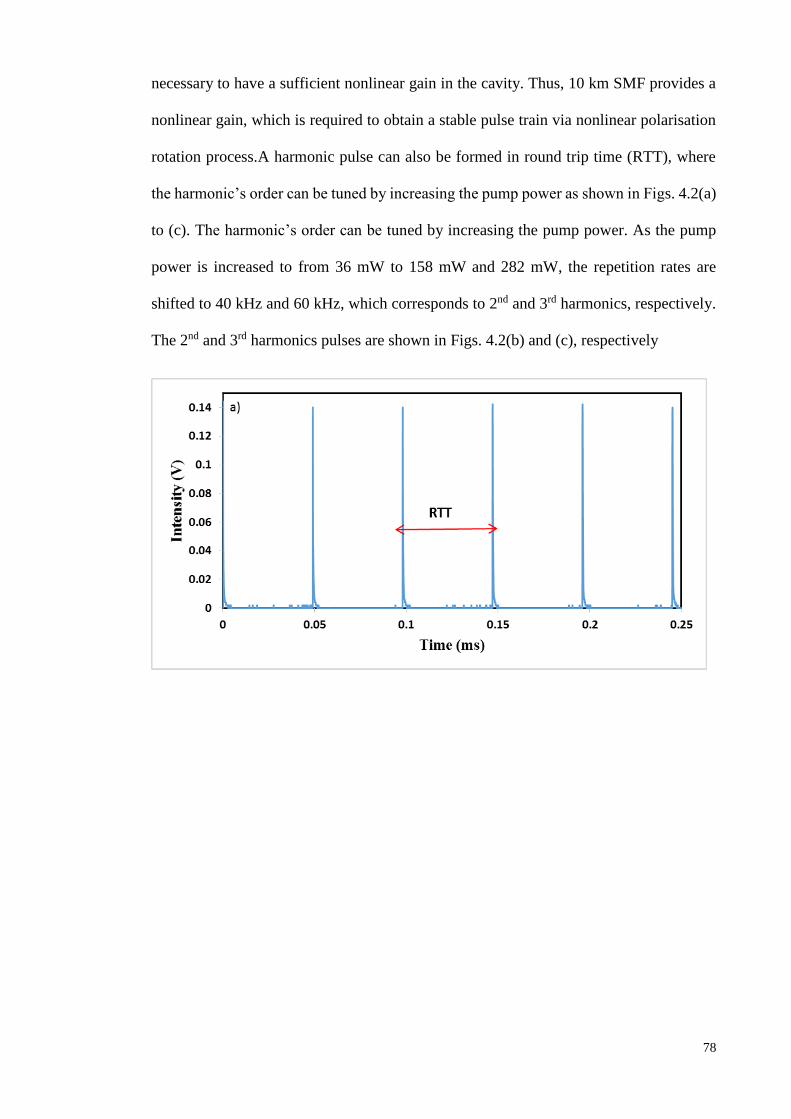
78
necessary to have a sufficient nonlinear gain in the cavity. Thus, 10 km SMF provides a
nonlinear gain, which is required to obtain a stable pulse train via nonlinear polarisation
rotation process.A harmonic pulse can also be formed in round trip time (RTT), where
the harmonic’s order can be tuned by increasing the pump power as shown in Figs. 4.2(a)
to (c). The harmonic’s order can be tuned by increasing the pump power. As the pump
power is increased to from 36 mW to 158 mW and 282 mW, the repetition rates are
shifted to 40 kHz and 60 kHz, which corresponds to 2nd and 3rd harmonics, respectively.
The 2nd and 3rd harmonics pulses are shown in Figs. 4.2(b) and (c), respectively

79
Figure 4. 2: Typical pulse train at different pump powers, which produces a different
orders of harmonic (a) fundamental (b) 2nd (c) 3rd
As shown in Fig. 4.2, fundamental repetition rate is observed at 36 mW, whereas
2ndorder and 3rd harmonics are obtained at higher pump powers of 158 mW and 282 mW
respectively. However, there is no higher harmonic pulses as the pump power is further
increased up to 340 mW. This may be caused by the pump power limitation which
constrained the pulse from further breaking after the 3th order harmonic. Noted that in
high pump power, the pulse trains are able to shift to lower harmonic order by properly
adjusting the PC. Higher light intensity may induce a difference in the intensity dependant
0
0.02
0.04
0.06
0.08
0.1
0.12
0.14
0 0.05 0.1 0.15 0.2 0.25
Inte
nsi
ty (
V)
Time (ms)
RTT
b)
0
0.02
0.04
0.06
0.08
0.1
0.12
0.14
0 0.05 0.1 0.15 0.2 0.25
Inte
nsi
ty (
V)
Time (ms)
RTT
c)

80
phase due to the long and short trajectories in the cavity. With the proper adjustment of
PC, the phase variation between the long and short trajectories can be supressed and
achieved plateau harmonic. The output power increases from 0.9 mW to 3. 6 mW as the
harmonic order is changed from fundamental to 3th order.
Fig. 4.3 shows the radio frequency (RF) spectrum for fundamental of harmonic
pulse (at pump power of 36 mW), which reveals the repetition rate of 20 kHz respectively.
The signal to noise ratio (SNR) obtained from the intensity ratio of the fundamental peak
to the pedestal extinction is estimated to be approximately 50 dB, which indicates the
stability of the laser. It is also observed that the pulse energy decrease with the increment
of pump power. Harmonic pulses exhibit pulse energy in the nano-Joule range due to the
long cavity length used in the laser setup. By increasing the pump power from 36 mW to
282 mW, the pulse energy reduces drastically in a range of 60 to 45 nJ. This is due to the
occurrence of pulse breaking phenomena where a single pulse breaks into many pulses;
three pulses in this experiment (Liu, 2010). After a single pulse is formed and traverses
in the cavity, it encounters high nonlinear effects and dispersion, introduced by the long
SMF. A single pulse will break into many pulses where overtaking of different parts of a
pulse will lead to optical wave breaking. It can be concluded that a laser should remain
single pulse operation in order to realize higher pulse energy.

81
Figure 4. 3: RF spectrum of the generated fundamental harmonic pulse
Fig. 4.4 shows the output spectra of the EDFL at different harmonic orders. By
careful adjustment of the PC, the laser produces nanosecond pulses operating in the
fundamental, 2nd and 3rd harmonic regimes at pump powers of 36 mW, 158 mW and 282
mW, respectively. The laser operates at 1567 nm and the bandwidth increases with the
increase of pulse repetition rate in higher order harmonic. If there is no perturbation
introduced to the laser, harmonic pulse EDFL can last several hours under normal
laboratory condition.
-100
-90
-80
-70
-60
-50
-40
-30
10 30 50 70 90 110 130 150 170 190
Ou
tpu
t p
ow
er (
dB
m)
Frequency (kHz)

82
Figure 4. 4: Output spectra of the nanosecond pulses at different order of harmonics.
4.3 Generation of nanosecond pulse with a HNLF
In the previous chapter, highly nonlinear fiber (HNLF) was used to demonstrate
nanosecond pulses generation in Brillouin fiber laser (BFL). In this section, nanosecond
optical pulse generation is demonstrated in EDFL by using a 100 m long HNLF based on
NPR technique. The HNLF plays an important role to induce Kerr effect in the cavity,
which allows the polarization rotation occur in the cavity. Compare to BFL, NPR exhibits
filtering effect to produce better SNR for nanosecond mode-locked. Fig. 4.5 shows the
experimental setup of the proposed EDFL, which is modified version of the previous
setup of Fig. 4.1 by replacing the SMF with a HNLF. The HNLF is 100 m long with an
effective area of 12.3 µm2, dispersion coefficient of 0.15 ps/nm.km at 1550 nm,
attenuation of 0.73 dB/km at 1550 nm and nonlinearity coefficient of 10.8 W-1km-1. The
estimated net GVD is 0.88 ps2, which in turn increases the energy of the random pulse
that emerges from the background noise as light propagates in the cavity. A PDI is used
to form a unidirectional cavity and acted as a polarizer to allow only high intensity light
-80
-70
-60
-50
-40
-30
-20
1500 1530 1560 1590 1620 1650
Ou
tpu
t p
ow
er (
dB
m)
Wavelength (nm)
Fundamental
2nd order harmonic
3rd order harmunic

83
to propagate through. PC is used to tune the polarization in the cavity to achieve phase
locked in the cavity. The output of the laser is tapped out of the cavity through a 95/5
coupler while keeping 95% of the light oscillating in the ring cavity. The OSA and
oscilloscope are used to inspect the spectrum and the temporal characteristic of the EDFL.
The total cavity length of the ring resonator is measured to be around 106 m.
Figure 4. 5: Configuration of the passively mode-locked EDFL with a HNLF
In the experiment, the CW operation of the laser is achieved when the pump power
is increased to about 45 mW. By appropriately adjusting PC and pump power, we found
that it is easier to achieve nanosecond mode-locked pulses. Fig.4.6 shows the output
spectrum of nanosecond mode locked EDFL. As observed in Fig 4.6, the laser operates
at around 1567.2 nm with 3-dB bandwidths of 1.62 nm. Besides, a significant spectrum
broadening is observed due to SPM effect. It shows a soliton-like spectrum with small
Kelly sidebands, which confirms the attainment of the anomalous dispersion. Fig. 4.7
shows a typical oscilloscope trace of the nanosecond pulse trains at pump power of 145
mW. It is observed that the mode-locked laser produces a nanosecond pulse train with a

84
constant repetition rate of 1.56 MHz throughout the tuning range from 45 mW to 145
mW. This confirmed the mode-locking operation in the cavity. Additionally, with the
total cavity length of 140 m, this further identify the laser is operate in fundamental mode.
The output power is 2.21 mW at maximum pump power of 145 mW. Taking the average
output power divided by pulse repetition rate, the maximum pulse energy is calculated as
1.4 nJ with pulse width of 297 ns. This is considerable high mode-locked pulse energy
compare to neither typical picosecond nor femtosecond mode-locked.
Figure 4. 6: Typical output spectrum of the nanosecond pulse laser
-80
-70
-60
-50
-40
-30
-20
1558 1560 1562 1564 1566 1568 1570 1572 1574 1576 1578
Ou
tpu
t P
ow
er (
dB
m)
Wavelenght (nm)

85
Figure 4. 7: Typical pulse train of the nanosecond mode-locked EDFL
To further identify the mode-locking operation in a single pulse state, the single-
pulse temporal profile is also measured as shown in Fig 4.8. The pulse duration (FWHM)
was measured to be 297 ns and no bunched pulses were observed in the pulse internal
structure. This indicates that the nanosecond pulse obtained is a clean and stable single
pulse. In addition, the time-bandwidth product (TBP) of the generated nanosecond pulse
is calculated to be 0.401. The deviation from the TBP value of 0.315 expected for
transform-limited Sech2 soliton pulses indicates that the output pulses are heavily chirped.
The stability of the nanosecond mode-locked is further studied with radio frequency (RF)
spectrum as shown in Fig 4.9. The stability of the nanosecond mode-locked is
considerable good as the SNR is more than 50 dB. Besides, the repetition frequency of
1.55 MHz is well tallied with the cavity’s fundamental mode. It is believed that the
proposed nanosecond pulsed laser with compact all-fiber configuration, high pulse
energy and excellent stability can contribute to various applications in optical
communication, material processing and biomedicine technology.
-0.009
-0.006
-0.003
0
0.003
0.006
0.009
0 0.5 1 1.5 2 2.5 3 3.5 4 4.5 5
Inte
nsi
ty (
V)
Time (µs)

86
Figure 4. 8: Single pulse envelope
Figure 4. 9: RF spectrum of the nanosecond mode-locking pulse showing a SNR of
around 50 dB.
-0.009
-0.007
-0.005
-0.003
-0.001
0.001
0.003
0.005
0.007
0.009
0.4 0.5 0.6 0.7 0.8 0.9 1 1.1 1.2
Inte
nsi
ty (
V)
Time (µs)
297 ns
-75
-65
-55
-45
-35
-25
-15
0 0.5 1 1.5 2 2.5 3 3.5 4 4.5 5
Ou
tpu
t P
ow
er (
dB
m)
Frequency (MHz)
~50 dB

87
4.4 Q-switched EDFL with HNLF in NOLM cavity
Q-switched pulsed laser systems operating in the eye-safe wavelength region
(𝜆 > 1.4 µ𝑚) are promising for applications such as light detection and ranging
(lidar)(Reutebuch et al., 2005), differential absorption lidar, optical communication,
sensor and instrumentations (Harun et al., 2012; Laroche et al., 2006) Fiber lasers are
particularly attractive for such applications due to the fact that the beam quality can be
independent of output power and they can be robustly engineered. There is an increasing
interest in Q-switched EDFLs, which can be generated by using either active or passive
techniques. Compared with the actively Q-switched ones, passively Q switched EDFLs
have attracted much attention for their advantages of compactness, low cost, flexibility
and simplicity of design. Signac interferometer, such as nonlinear optical loop mirror
(NOLM), has been widely used to generate pulsed laser(Duling et al., 1994). NOLM with
an imbalance coupler or two different kinds of fiber with imbalanced dispersion (Boscolo
et al., 2008) which can operate as a nonlinear power switching device due to the self-
phase modulation (SPM) can be used as saturable absorber for pulsed laser.
In this section, a Q-switched EDFL operating in 1561.5 nm band is demonstrated
based on NOLM cavity. The laser cavity is based on the figure-of- eight structure. The
short range NOLM consisting of a symmetrical coupler and a piece highly nonlinear fiber
(HNLF) is used in the laser to generate the intensity dependent transmission so that it
functions as a saturable absorber. The proposed laser is capable to generate a Q-switching
pulse train with a repetition rate can be controlled within 7.6 kHz to around 22.1 kHz.

88
4.4.1 Configuration of the proposed NOLM cavity
The experimental setup of the proposed all-fiber passively Q-switched EDFL is
shown in Fig. 4.10. The setup is based on our figure-of-eight laser system, where the ring
resonator consists of a 3.5 m long EDF as the gain medium, WDM, PDI, 100 m long
HNLF, PC and 3 dB couplers. The length and characteristics of EDF and HNLF used are
similar with the previous lasers in the earlier sections. The EDF was pumped by a 1480
nm laser diode via the WDM. A PDI was used in the cavity to force the unidirectional
operation of the ring, and an in-line PC was inserted in the cavity to adjust the linear
birefringence of the cavity. A 2 x 2 3 dB fiber coupler was used to form a figure-of-eight
structure with a piece of HNLF is inserted in the new loop to introduce asymmetric
nonlinear phase shift between clockwise propagating light and counterclockwise
propagating light in the NOLM. The output of the laser is collected from the cavity via
a 3dB coupler which retains half of the light in the ring cavity to oscillate.
Figure 4. 10: Schematic configuration of the proposed Q-switched EDFL

89
4.4.2 Q-switching performance
By carefully adjustment of the PC orientation and increase the 1480nm pump over
the thereshold pump power of 37 mW, Q-switching operation is achieved in the laser.
Fig. 4.11 shows the typical pulse train of the laser at three different pump powers. The
formation of Q-switching pulse is due to the NOLM structure in the cavity, which
functions as an artificial saturable absorber. At first the laser cavity is in high loss and
lots of inverted population is accumulated in the upper level of erbium-ion. When the
cavity is saturated, the cavity loss rapidly reduces and allows efficient extraction of the
stored energy by the laser pulse. The time interval between pulses reduces while the pulse
amplitude increases as the pump power increases from 37 to 125 mW, as shown in Fig.
4.11. Unlike the mode-locked fiber laser wherein the repetition rate is dependent on cavity
length, the repetition rate of the Q-switched fiber laser increases with pump power.
-0.005
-0.003
-0.001
0.001
0.003
0.005
0.007
0.009
0.011
0.013
0.015
0 0.05 0.1 0.15 0.2 0.25 0.3 0.35 0.4 0.45 0.5
Inte
nsi
ty (
V)
Time (s)
a)

90
Figure 4. 11: Q-switched pulse emission of the proposed EDFL at different pump power
Fig. 4.12 shows the output spectrum of the Q-switched EDFL when the pump
power is fixed at 125 mW. The laser operates at central wavelength of 1561.5 nm with a
3 dB bandwidth of 2.5 nm. A significant spectrum broadening is also observed due to
SPM effect. Fig. 4.13 shows how repetition rate and pulse width are related to the pump
power. The dependence of the pulse repetition rate can be seen to increase almost linearly
with the pump power, whereas pulse width decreases almost linearly with the pump
-0.005
-0.003
-0.001
0.001
0.003
0.005
0.007
0.009
0.011
0.013
0.015
0 0.05 0.1 0.15 0.2 0.25 0.3 0.35 0.4 0.45 0.5
Inte
nsi
ty (
V)
Time (s)
b)
c)

91
power. This agrees well with the passive Q-switching theory. The pulse repetition rate of
the Q-switched EDFL can be widely tuned from 7.6 to 22.11 kHz by varying the pump
power from 37 to 125 mW. On the other hand, the pulse width reduces from 9 to 5.7 μs
as the pump power increases from 37 to 125 mW. Fig. 4.14 shows how the average output
power and pulse energy of the all fiber passively Q-switched EDFL are related with the
pump power. As shown in the figure, average output power almost linearly increases from
5 μW to 18 μW as the pump power increases from 37 to 125 mW while the pulse energy
increases from 0.6 to 8.2 nJ at the same pump power range.
Figure 4. 12: Output spectrum of the NOLM based Q-switched EDFL.
Figure 4. 13: The change of repetition rate and pulse width against pump power.

92
Figure 4. 14: Average output power and pulse energy of the laser against pump power
4.5 Q-switched Brillouin fiber laser with MWCNT SA
Q-switched fibre lasers are mainly used for generating high energy pulses at
relatively low repetition rates. They can be constructed by various passive techniques
such as NPR and NOLM techniques. They have also been intensively investigated using
different kinds of saturable absorbers (SAs) such as transition metal-doped crystals and
semiconductor saturable absorber mirrors (Huang et al., 2009; Pan et al., 2007). However,
these SAs are complex and expensive to fabricate. Furthermore, they are incompatible
with many optical fibres which limits widespread application.
In the past few years, single-walled carbon nanotubes (SWCNTs) have been
discovered to have promising potential for SA applications because of their intrinsic
saturable absorption properties, ultrafast recovery time and wide absorption wavelength
bandwidth (Harun et al., 2012; Hasan et al., 2009). Recently, new, multi-walled carbon
nanotubes (MWCNTs) (Iijima, 1991; Su et al., 2012) have also attracted much attention

93
because they possess many advantages in non-linear optics. The growth of the MWCNT
material does not need complicated techniques or special growing conditions so that its
production yield is high for each growth. Therefore, the production cost of MWCNT
material is about 50%–20% of that of SWCNT material (L. Zhang et al., 2011). In
addition, MWCNT material has good thermal characteristics, which is of great
importance for high power ultrafast laser development. Compared with SWCNTs, the
MWCNTs have higher mechanical strength, better thermal stability as well as the ability
to absorb more photons per nanotube because of its higher mass density of the multi-
walls. These favourable features are because of the structure of MWCNTs which takes
the form of a stack of concentrically rolled graphene sheets. The outer walls can protect
the inner walls from damage or oxidation so that the thermal or laser damage threshold
of MWCNTs is higher than that of SWCNTs (Banhart, 1999; Ramadurai et al., 2008).
However, there are reported that the MWCNTs has a high saturation intensity and thus it
was considered a not good SA for mode-locking operation as this would require high
irradiation intensity to reach absorption saturation(Elim et al., 2004; Lim et al., 2006).
Therefore to date, there are only a few reported works on application of MWCNTs
material as a SA. For instance, Lin et al. (Lin et al., 2013) employ multi-walled MWCNTs
based SA for mode locking of a Nd:YVO4 laser. In another work, Q-switched Nd-YAG
laser is demonstrated using the MWCNTs based SA as a Q-switcher (Wong et al., 2007).
On the other hand, many works have also been reported on Brillouin fibre lasers
(BFL), which use a non-linear effect in optical fibre to generate a narrow linewidth and
high coherence laser (Jusoh et al., 2013; Shirazi et al., 2008). The applications of such a
laser include optical gyroscope, microwave frequency generation, high-rate amplitude
modulation, interferometric position sensors and laser radar. In the previous chapter, the
temporal characteristics of BFL was investigated and demonstrated for realizing a pulse
laser. We have successfully demonstrated a Q-switched and mode-locked BFL by

94
manipulating the cavity of the laser. A Q-switched EDFL is also demonstrated in the
previous section based on NOLM effect. In this section, a Q-switched BFL using a
passive SA made of MWCNTs embedded in a polyvinyl alcohol (PVA) film is
demonstrated for the first time. It exploits the stimulated Brillouing scattering (SBS)
effect from the interaction between intense pump light and acoustic waves in a 5 km long
dispersion shifted fibre (DSF) to generate a non-linear laser shifted by 0.08 nm from the
pump wavelength. The SA is constructed by sandwiching a MWCNTs-PVA film between
two fiber connectors. The laser delivers Q-switched pulses with a repetition rate of 30.21
kHz and pulse width of 1.11 μs at the pump power of 6 dBm.
4.5.1 SA preparation and experimental setup
The MWCNTs material used for the fabrication of the absorber in this experiment
was dispersed in water with assistance of surfactant. The diameter of the MWCNTs used
was about 10–20 nm and their length was around 1 to 2 μm. The surfactant solution was
prepared by dissolving 4 g of sodium dodecyl sulphate (SDS) in 400 ml deionized water.
Then 250 mg of MWCNT was added to the solution and the homogenous dispersion of
MWCNTs was achieved after the mixed solution was sonicated for 60 minutes at 50 W.
The solution was then centrifuged at 1000 rpm to remove large particles of undispersed
MWCNTs to obtain a stable dispersed suspension. Next, PVA solution was prepared by
dissolving 1 g of PVA in 120 ml of deionized water. Afterward, the dispersed MWCNTs
suspension was poured into the PVA solution at four to one ratio to obtain MWCNTs-
PVA composite. The MWCNTs-PVA composite was made homogeneous by sonification
process for more than one hour. It was then casted onto a glass petri dish and left to dry
at room temperature for about one week to produce thin film with thickness around 50
µm. The SA is fabricated by cutting a small part of the prepared film and sandwiching it

95
between two FC/PC fiber connectors, after depositing index-matching gel onto the fiber
ends. The insertion loss of the SA was measured to be around 3 dB at 1550 nm.
The experimental set-up of the proposed BFL is illustrated in Fig. 4.15 which
consists of a Brillouin pump (BP), a 3-port optical circulator, a 5 km DSF, a 80:20 coupler
and a MWCNTs-PVA SA. The BP is an external tunable laser source (TLS) with a
maximum power of 6 dBm at 1550 nm wavelength. The BP is launched into the DSF
from port 1 to port 2 of the optical circulator to generate the backward propagating Stokes
via the SBS process. The Stokes oscillates inside the ring cavity to initiate laser at a
wavelength which is downshifted by 0.08 nm from the BP wavelength. The MWCNTs-
PVA SA is used to generate a Q-switching pulse train. The output of the laser is collected
from the cavity via a 80:20 coupler which retains 80% of the light in the ring cavity to
oscillate. The OSA is used for the spectral analysis of the BFL’s wavelength with a
spectral resolution of 0.02 nm. The temporal characteristic of the laser is measured by a
photo-detector and an oscilloscope.
Figure 4. 15: Schematic configuration of the proposed-switched BFL

96
4.5.2 Characteristics of SA
In order to check the existance of the MWCNTs in the film, we use the Field
Emission Scanning Electron Microscope (FESEM) and Raman spectrometer to check the
image and its material characteristic, respectively. Fig. 4.16 illustrates the FESEM image
of the film at magnification of 35,000 times which indicates the MWCNTs are randomly
embedded in the polymer composite. Fig. 4.17 shows the Raman spectrum, which is
dominated by two peaks; the G band at 1593 cm-1, which corresponds to tangential C-C
stretching vibrations in the nanotube wall plane and the D-band at 1356 cm-1, which
originates from a double resonance process and is due to the presence of amorphous
disordered carbon. In the SWCNT, there is a series of bands appearing at the frequency
region of around 200 cm-1 known as Radial Breathing Mode or RBM bands. The RBM
bands correspond to the expansion and contraction of the tubes. The RBM modes are not
presented in the MWCNT because the outer tubes restrict the breathing mode. The G'
band is also observed at 2720 cm-1 due to two-phonon scattering phenomena. In addition,
another intense peak at 2915 cm-1 is also obtained due to the existence of PVA polymer.
We also use the UV-Vis/NIR spectrophotometer to check the transmission spectrum of
the film at 1550 nm wavelength region. The initial transmission at 1550 nm is measured
to be around 46 % as shown in Fig. 4.18. The dependence of the linear transmission of
the MWCNTs-PVA film on the signal power is also investigated as shown in Fig. 4.19.
In the experiment, the input signal wavelength is fixed at 1550 nm. The curve indicates
that the film has the saturable absorption (modulation depth) of around 4% and non
saturable absorption of around 45%.

97
Figure 4. 16: FESEM image of the prepared MWCNTs-PVA film
Figure 4. 17: Raman spectrum obtained from the MWCNTs-PVA film
0
200
400
600
800
1000
1200
1400
1600
500 1000 1500 2000 2500 3000
Inte
nsi
ty (
CC
D c
ou
nt)
Raman shift (cm-1)
DG G'

98
Figure 4. 18: Transmission spectrum of the MWCNTs-PVA film
Figure 4. 19: Linear transmission curve of the MWCNTs-PVA film, which shows that
the saturable absorption and non saturable absorption of around 4% and 45%,
respectively
0
10
20
30
40
50
60
1000 1200 1400 1600 1800 2000
Tra
nsm
issi
on
(%
)
Wavelength (nm)
52.5
53.0
53.5
54.0
54.5
55.0
55.5
56.0
30 50 70 90 110 130
Lin
ear
Tra
nsm
issi
on
(%
)
Input Power (mW)

99
4.5.3 Performance of the Q-switched BFL
Fig. 4.20 shows the output spectrum of the Q-switched BFL at different pump
powers. The Brillouin Stokes operates at a wavelength which is 0.08 nm shifted from the
BP wavelength at BP power of 4.5 dBm. By increasing the BP power to 5 dBm, the peak
power of the Stokes increases drastically from -49.4 dBm to -15.5 dBm. The peak power
linearly increases to -9.8 dBm as the pump power further increases to 6 dBm. As shown
in Fig.4.6, anti-Stokes is also obtained at a wavelength, which is 0.08 nm shorter than the
BP. The regenerative FWM between co-propagating Rayleigh-backscattered pump and
Brillouin Stokes waves can generate an idler wave or anti-Stokes at the wavelength 0.08
nm shorter than the pump. However, the power of the idler should be proportional to the
pump power squared times the Stokes power. Another idler is also expected to appear at
a wavelength 0.08nm longer than the Stokes wave due to the FWM interaction. Since the
anti-Stokes power is almost unchanged with the pump power and another idler cannot be
found in Fig. 4.20, we expect the origin of the anti-Stokes component may be spontaneous
anti-Stokes Brillouin scattering. The plot of the peak power against the BP power is
shown in Fig. 4.21 for both BFLs configured with and without the SA. Without the
MWCNTs-PVA SA, the BFL threshold is observed to be around 1 dBm. As the SA is
incorporated in the cavity, the cavity loss is increased and the Brillouin laser threshold
increases to around 5 dBm. After reaching the threshold, the peak power of the BFL
linearly increases with the pump power. The average output power is lower in the Q-
switched BFL due to the SA insertion loss.

100
Figure 4. 20: Output spectrum of the proposed Q-switched BFL with MWCNTs-PVA
SA
Figure 4. 21: Output peak power of the BFL against the BP power with and without the
MWCNTs-PVA SA in the laser cavity.
-80
-70
-60
-50
-40
-30
-20
-10
0
1549.5 1549.7 1549.9 1550.1 1550.3 1550.5
Ou
tpu
t p
ow
er (
dB
m)
Wavelength (nm)
6 dBm
5 dBm
4.5 dBm
-60
-50
-40
-30
-20
-10
0
0 1 2 3 4 5 6 7
Ou
tpu
t P
eak
po
we
r (d
Bm
)
Pump power (dBm)
With MWCNT
Without MWCNT

101
Fig. 4.22 shows the typical oscilloscope trace of the BFL configured without the
SA at two different BP powers of 1 and 5 dBm. At threshold pump power of 1 dBm, a
random pulse is obtained due to a nonlinear self-pulsing mechanism based on inherent
instability of the BFL. The origin of this instability lies in the relaxation oscillation, a
natural trait of fiber laser which occurs around the laser threshold (Fotiadi et al., 1999)
that causes a series of avalanche processes. The Stokes power generated by the BP does
not approach its steady state value monotonically but exhibits relaxation oscillations with
a period of 2Tr, where Tr = L/νg is the transit time for a fiber of length L and νg is the
group velocity. In the closed cavity, the relaxation oscillations can be turned into a stable
oscillation where both pump and Stokes wave can develop self-induced intensity
modulation. Even though the group velocity νg is nearly the same for the pump and the
Stokes wave, their relative speed is 2νg because of their counter-propagating nature.
Relaxation oscillations occur as a result of this group velocity mismatch. As the BP
power increases the self-pulsing disappears. Therefore, we only observe noise at BP
power of 5 dBm.

102
Figure 4. 22: The typical oscilloscope trace from the BFL configured without the SA at
two different BP powers; 1.0 and 5.0 dBm.
With the assistance of MWCNTs in the cavity, a stable Q-switched pulse train is
self-started at BP power of 5 dBm. Fig. 4.23 shows the pulse train evolution as the BP
power increases from 5 to 6 dBm. At the threshold BP power of 5 dBm, the pulse train
exhibits peak to peak duration of about 36 μs, which can be translated to a repetition rate
of 27.75 kHz. The corresponding pulse width is measured to be 3.25 μs. By increasing
the BP power, the repetition rate shows an increasing trend to the maximum value of
30.21 kHz at BP power of 6 dBm. On the other hand, the pulse width is inversely
proportional to the BP power. The pulse width reduces from 3.25 to 1.11 μs as the BP
power increases from 5 to 6 dBm. At BP power of 6.0 dBm, the pulse energy is calculated
to be about 0.13 nJ. The intensities have slight negative values in the curves shown in
Figs.4.8 and 9 due to the un-calibrated oscilloscope.

103
The output frequency spectrum of the laser is also analyzed with the RF spectrum
analyzer (at BP power of 5.5 dBm) as shown in Fig. 4.24. As seen in the figure, the
fundamental frequency of the laser is obtained at 29.01 kHz, which corresponds to the
repetition rate of the laser. The signal to noise ratio (SNR) obtained is around 50 dB,
which confirms the stability of the pulses. These results show that the MWCNTs can be
used as a SA to realize a passive Q-switched BFL. The proposed BFL is capable of
producing Q-switching pulses with extensive wavelength tenability, which has many
potential applications such as for supercontinuum generation, fiber sensors and Brillouin
optical amplifier. The laser can perform as a low-cost and easy-built all fiber light source,
and can be modified by including an optical feedback in the cavity to produce multi-
wavelength output. The Q-switched multi-wavelength laser has potential applications in
various fields i.e., temperature or strain fiber sensors(Junqing et al., 2012).

104
Figure 4. 23: Typical pulse train of the Q-switched BFL at three different BP powers of
5.0, 5.5 and 6.0 dBm
Figure 4. 24: The RF spectrum of the Q-switched BFL at BP power of 5.5 dBm.
-120
-110
-100
-90
-80
-70
-60
-50
-40
-30
-20
10000 30000 50000 70000 90000 110000
Ou
tpu
t p
ow
er (
dB
m)
Frequency (Hz)

105
4.6 Summary
Several passively mode-locked and Q-switched fiber lasers were successfully
demonstrated by means of nonlinear effects such as NPR and SA. A nanosecond
harmonic pulse laser source operating with ultra-low repetition rate was demonstrated by
inserting a 10 km long SMF in the ring cavity. The SMF plays an important role to induce
Kerr effect in the cavity, which allows the polarization rotation occur in the cavity. This
allows a mode-locking pulse is generated based on NPR technique. A stable harmonic
pulse was obtained at the fundamental repetition rate of 20 kHz at a threshold pump power
of 36 mW. The harmonic pulse can be switch from fundamental to 3th order harmonic by
increasing the pump power. Then, a nanosecond optical pulse generation was
demonstrated in the similar EDFL cavity by replacing the SMF section with a 100 m long
HNLF. The laser operated at 1567.2 nm and produced a pulse train with a constant
repetition rate of 1.56 MHz and pulse width of 297 ns. The maximum pulse energy of 1.4
nJ was obtained at the maximum pump power of 145 mW. The nanosecond mode-locked
was considered stable since the SNR of the RF spectrum was more than 50 dB. To
improve the pulse energy, a Q-switched EDFL was also demonstrated based on NOLM
cavity. The NOLM was used in the laser cavity to generate the intensity dependent
transmission so that it functions as a saturable absorber. The Q-switched laser operated
at 1561.5 nm with the pulse repetition rate varied from 7.6 to 22.11 kHz as the pump
power is increased from 37 to 125 mW. On the other hand, the lowest pulse width of 5.7
μs and the maximum pulse energy of 8.2 nJ were obtained at the maximum pump power
of 125 mW. Finally, a Q-switched BFL was successfully demonstrated using MWCNTs
embedded in PVA film as a SA. The SA was obtained by sandwiching the developed
MWCNTs–PVA film between two FC/PC fiber connectors after depositing index
matching gel onto the fiber ends. The proposed Q-switched BFL incorporated a 5 km
long DSF in a ring cavity structure to generate Stokes shifted by 0.08 nm from the

106
Brillouin pump wavelength. The BFL starts to generate a Q-switching pulse train at
threshold pump power of 5 dBm. As the BP power is varied from 5.0 to 6.0 dBm, the
repetition rate of the Q-switched BFL exhibits an increasing trend from 27.75 to 30.21
kHz, whereas the pulse width exhibits a decreasing trend from 3.25 μs to 1.11 μs. The
maximum pulse energy of 0.13 nJ is obtained at maximum BP power of 6.0 dBm.

107
CHAPTER 5
SUPERCONTINUUM GENERATION
5.1 Introduction
Supercontinuum (SC) generation describes extreme spectral broadening induced
by the interaction of a high peak power sub picosecond pulse laser with a nonlinear optical
fiber. It has been a hot topic due to its many applications in a variety of areas such as
optical coherent tomography (Humbert et al., 2006), sensing (Kaminski et al., 2008) and
optical communication (Morioka et al., 1996).Investigations have been carried out to
understand the phenomenon as well as to find its applications. Speciaty optical fibers such
as photonic crystal fibers (PCFs) and highly nonlinear fiber (HNLF) possess high
nonlinearity with managed dispersion profile, and thus are suitable for generating SC
light (Nicholson et al., 2003).The SC can be generated using picosecond to nanosecond
pulses, or even a continuous wave pump where spectral broadening is initiated in the so-
called “long pulse” regime (Dudley et al., 2002; Genty et al., 2009). Research has now
shifted to producing SC using a more robust and cheaper mode-locked laser through some
innovative design as well as to seeking new understanding of the SC process with
picosecond or nanosecond pulse lasers.
In the previous chapter, several passively mode-locked and Q-switched fiber
lasers were demonstrated based on nonlinear effects inside the ring laser cavity. These
lasers have been tried to be implemented in the experiment to generate SC, but the result
is not promising. In this chapter, new mode-locked fiber lasers are proposed and
demonstrated for a SC generation. A mode-locked EDFL with dark pulse output is also
proposed and demonstrated for realizing a simple optical fiber-based supercontinuum
source.

108
5.2 SC generation by a continuous wave mode-locked and Q-switched mode-
locked fiber lasers
Supercontinuum generation is the formation of an ultrabroad spectral broadening
induced by the coupling of a high peak power sub picosecond pulse laser with a nonlinear
optical fiber of adequate length (Chernikov et al., 1997). The supercontinuum spectrum
is determined by the sequence of events in the supercontinuum generation, and is
dependent on both the pump pulse and the fiber characteristics namely the pump pulse
wavelength, power, and pulse duration. The dominant nonlinear effects occurring in the
generation of an SC includes self-phase modulation, stimulated Raman scattering and
soliton effects. Since supercontinuum was first discovered in 1970 by Alfano (R. Alfano
et al., 1970), many works have been performed to understand the phenomenon as well as
its implementation in practical devices where it has found applications in areas of
semiconductor, biology, chemistry, optical coherent tomography, sensing and optical
communication, femtosecond carrier-envelope phase stabilization, ultrafast pulse
compression, time and frequency metrology, and atmospheric science (R. R. Alfano,
1989; Hartl et al., 2001; Kaminski et al., 2008). These included the study of primary
events in photosynthesis, nonradiative processes in photoexcited chemicals, excitation of
optical phonons, surgery and frequency clocks (Keller, 2003).
Mode-locking operation can be classified into two categories, which are
continuous wave mode-locked (CWML) and Q-switched mode-locked (QML) (Svelto,
2010). For CWML, the ultra-short pulses can be generated for each round trip time in the
laser cavity, which typically produces megahertz (MHz) pulse repetition rate (Svelto,
2010). Meanwhile, QML possesses Q-switching modulation pulse repetition rate in
kilohertz (kHz) range (Yang et al., 2007). Therefore, the QML pulses may be attractive

109
in precise fabrication of microstructures and nonlinear frequency conversion (Neev et al.,
1996).
In this section, SC generation in HNLF is investigated using QML and CWML
as the pump source (Kneis et al, 2015). These pulses are formed under nonlinear
polarization rotation (NPR) effect in an Erbium-doped fiber laser (EDFL) cavity. The SC
generation is investigated in 100 m long highly nonlinear fiber (HNLF) with a zero
dispersion wavelength of around 1550 nm and nonlinear coefficient of 11.5 W-1km-1.
5.2.1 Experimental arrangement
The experimental setup for investigating the SC generation using a QML EDFL
as a pump is shown in Fig. 5.1. The mode-locked laser resonator consists of a 3.5 m long
EDF as the linear gain medium, wavelength division multiplexer (WDM), polarization-
dependent isolator (PDI) and polarization controller (van Saarloos & Hohenberg). The
EDF has a cutoff wavelength of 945 nm, core diameter of 4 µm and numerical aperture
of 0.23. Since the core diameter of the fiber is small, the fiber nonlinearity is expected to
be reasonably high in this EDF compared to the standard EDF with core diameter of
around 8 µm. The absorption of the EDF is 11.9 and 17.5 dB/m at 979 and 1531 nm,
respectively. A 1480 nm laser diode is used to pump the EDF via the WDM. A PDI and
PC are incorporated in the laser cavity to ensure unidirectional propagation of the
oscillating laser and to enable nonlinear polarization rotation (NPR) process in the ring
cavity, respectively. The output of the laser is tapped out from the cavity via 5/95 fiber
coupler while allowing 95% of the light to oscillate in the cavity. The 5% output from the
ring resonator is then amplified by an Erbium-doped fiber amplifier (EDFA) before it is
launched into 100 m long HNLF which acts as nonlinear gain medium for SC generation.
The maximum average output power after the EDFA is about 18.0 dBm.

110
The SC generation performance is also investigated with the CWML EDFL,
which was obtained by incorporating a 200 m long single-mode fiber (SMF) in the cavity
and then adjusting a PC. The dispersion parameter of the SMF is 17 ps/nm km.
Figure 5. 1: Schematic diagram of experimental setup used for generating SC with
QML EDFL. 200 m ling SMF is incorporated in the ring EDFL’s cavity to change the
pulse train output from QML to CWML.
5.2.2 Performance of QML and CWML EDFLs
At first, QML pulse train is successfully formed under NPR effect in the ring
EDFL’s cavity at threshold pump power of 45 mW by proper adjusting of the intra-cavity
PC. A typical output in the QML range is sustained until the maximum pump power of
145 mW. Fig. 5.2 shows the output spectrum, operating at center wavelength about
1560.5 nm, measured before EDFA at pump power of 145 mW. Spectral broadening due
to self-phase modulation (SPM) effect in the cavity can be clearly observed. The temporal
characteristic of the QML laser is shown in Fig. 5.3. Fig. 5.3(a) shows a typical pulse
train of the laser at 145 mW pump power with a Q-switching repetition rate of 49 kHz
and pulse width of 3.53 µs. Fig. 5.3 (b) shows a single envelop of the Q-switched pulse
with mode-locking repetition rate of 9.4 MHz and constant pulse width. The pulse energy
1480 nm
pump
WDM
EDF
SMF
PDI PC
EDFA
HNLF
OSA

111
is calculated to be around 81 nJ, whilst the maximum average output power is measured
as 4 mW at maximum pump power. The QML pulse width is further investigated by using
auto-correlator (AC) as shown in Fig. 5.4. The curve fitting of the AC is also shown using
Sech2 pulse with 100 fs resolution. As shown in Fig. 5.4, the pulse width of the mode-
locking pulse train of the laser is estimated to be around 1 ps. Fig. 5.5 shows RF spectrum
of the QML pulse at pump power of 145 mW, which indicates a constant pulse repetition
rate of 9.4 MHz. The stability of QML pulse is further studied by the RF spectrum
analyzer, and the SNR is measured to be around 34 dB at fundamental frequency of 9.4
MHz.
Figure 5. 2: Output spectrum of the QML laser at pump power of 145 mW.
-80
-70
-60
-50
-40
-30
-20
1530 1540 1550 1560 1570 1580 1590
Ou
tpu
t p
ow
er (
dB
m)
Wavelength (nm)

112
Figure 5. 3: Temporal characteristic of the QML laser (a) Typical pulse train at pump
power of 145 mW, showing the Q-switching repetition rate of 49 kHz (b) A single pulse
envelop with mode-locking repetition rate of 9.4 MHz.
-10
0
10
20
30
40
0 0.05 0.1 0.15 0.2
Inte
nsi
ty (
mv)
Time (ms)
-10
0
10
20
30
40
-0.001 0.001 0.003 0.005 0.007
Inte
nsi
ty (
mv)
Time (ms)
(b)
(a)

113
Figure 5. 4: Autocorrelation trace of the QML output pulse
Figure 5. 5: RF spectrum of the QML pulse at pump power of 145 mW.
The QML pulse can be switched to the CWML pulse by adding a 200 m long
SMF in the ring cavity of Fig. 5.1 and adjusting the PC. Despite of the fact that no
0
0.2
0.4
0.6
0.8
1
1.2
-5 -3 -1 1 3 5
Inte
nsi
ty (
a.u
)
Time delay (ps)
Measured pulse
Sech curve fitting
1 ps
-70
-60
-50
-40
-30
0 10 20 30 40 50
Ou
tpu
t p
ow
er (
dB
m)
Frequency (MHz)

114
polariser was inserted in the cavity and no other mode-locking technique was adopted, it
was observed that the mode locking could still self-start in the laser cavity as the pump
power is increased gradually to around 45 mW. It produced a stable stretched pulse
because of the large residual polarization dependent loss (PDL) of the cavity component,
which acts as an artificial saturable absorption. Fig. 5.6 shows the output spectrum
characteristic of the stretched pulse CWML laser when the pump power is fixed at the
maximum value of 145 mW. As shwon in the figure, the output peak of −35.5 dBm is
obtained at the central wavelength of 1565 nm with a 3 dB bandwidth of 23.8 nm. The
spectral bandwidth of the laser is broadened due to changes in dispersion characteristics
of the cavity.
Fig. 5.7 shows the typical pulse train of the CWML laser, which reveals that the
pulses repeat with a repetition rate of 942 kHz. The pulse width of the laser is obtained at
around 367 ns. The pulse energy is calculated to be around 2.7 nJ at the maximum pump
power of 145 mW. Fig. 5.8 shows the RF spectrum of CWML pulse at maximum pump
power of 145 mW. The SNR is measured to be around 55 dB at fundamental frequency
of 942 kHz. This indicates the stability of the laser. The output pulse train is is then
amplified by an EDFA before it is launched into a HNLF for SC generation.

115
Figure 5. 6: Output spectrum of the CWML pulse laser, which is obtained before being
launched into EDFA.
Figure 5. 7: Typical pulse train of the CWML pulse.
-90
-80
-70
-60
-50
-40
-30
1520 1540 1560 1580 1600 1620
Ou
tpu
t p
ow
er (
dB
m)
Wavelength (nm)
-40
-20
0
20
40
60
80
0 5 10 15 20
Inte
nsi
ty (
mv)
Time (μs)

116
Figure 5. 8: RF spectrum of the CWML pulse at pump power of 145 mW
5.2.3 Performance of the SC generation
Fig. 5.9 shows the attenuated SC spectrum, which was generated by a 100 m long
HNLF which is pumped by the amplified QML EDFL. The QML laser operates at 1560.5
nm wavelength with a repetition rate of 49 kHz. In the experiment, the amplified pump
power is varied from 11.5 to 18.0 dBm by controlling the pumping power of the EDFA.
It worth to note that, there is no supercontinuum light at lower pump power. As shown in
Fig. 5.9, the SC light is successfully obtained at pump power of 11.5 dBm with the
spectrum starts at wavelength as small as 1410 nm. The SC spectrum broadens and starts
at a shorter wavelength as the pump power increases. For instance, at the maximum pump
power of 18.0 dBm, the SC spectrum is obtained within 1350 nm to 1950 nm wavelength
region. At first, the symmetrical sidebands are generated in the spectrum due to
modulation instability and self-phase modulation (SPM). Further propagation of pump
light causes multiple sidebands to grow from the phase matched Four Wave Mixing
-75
-65
-55
-45
-35
-25
-15
-5
0 1 2 3 4 5 6 7
Ou
tpu
t p
ow
er (
dB
m)
Frequency (MHz)

117
(FWM) process and the spreading of continuum to larger wavelength side occurs due to
the overlap with Raman bandwidth and the Stimulated Raman Scattering (SRS) effect.
Higher pump power makes SPM effects dominant over the other nonlinear processes
involved in the SC generation, thus leading to a smoother emitted spectrum as shown in
Fig. 5.9. The spectral peak at around 1560.5 nm is due to the residual QML EDFL pump.
Figure 5. 9: SC spectra from the QML EDFL at various pump power
Fig. 5.10 shows the attenuated SC spectrum obtained as the HNLF is pumped by
the CWML EDFL operating at 1565 nm with repetition rate of 942 kHz. The SC
generation shows the similar trend with the previous result with QML laser. Fig. 5.11
compares the attenuated SC spectra from a 100 m long HNLF between QML and CWML
pulse. As shown in the figure, the CWML pulse generates a slightly broader SC spectrum

118
compared to the QML pulse. The spectral broadening below 1200 nm region is not
examined due to spectral sensitivity of the OSA. The output power intensity is also higher
with the CWML pulse even though the pulse energy was higher in the QML pulse before
amplification. This proves that the SC generation is more efficient with CWML pulse
compared to the conventional QML pulse. This is most probably due to the CWML pulse
are less affected by the fiber loss and background noise than the QML pulse (Hönninger
et al., 1999).
Figure 5. 10: SC spectra from the CWML EDFL at various pump power

119
Figure 5. 11: Comparison of SC generation between QML and bright pulse at the
maximum pump power of 18.0 dBm
.
5.3 Enhance SC generation with picosecond dark pulse
Soliton formation is a topic that has attracted an extensive investigation in recent
years due to its many potential applications in optical communications, sensors and
instrumentations. To date, most of the reported works on soliton mode-locked lasers are
operating under the bright pulse regime (Tiu et al., 2014). Besides bright pulses, there are
also other types of mode-locking pulses, the so-called dark solitons that are also solutions
of the nonlinear Schrödinger equation (NLSE) (Zakharov & Shabat, 1973) and the
complex Ginzburg-Landau equation (CGLE) (van Saarloos & Hohenberg, 1992;
Zakharov & Shabat, 1973). Here, dark pulses are referred to as a train of intensity dips in
a continuous wave (CW) background of the laser emission to date, most of the SC
generations were reported using a bright soliton pulses.
-70
-60
-50
-40
-30
-20
-10
0
1200 1300 1400 1500 1600 1700 1800 1900 2000
Ou
tpu
t P
ow
er
(dB
m)
Wavelength (nm)
CWML
QML

120
In this section, we investigate a SC generation in various gain medium using dark
soliton pulses. These pulses are formed under NPR effect in the EDFL cavity. The SC
generation is investigated in three samples of gain medium; 50 m long photonic crystal
fiber (PCF), 100 m long highly nonlinear fiber (HNLF) and 20 km long standard single-
mode fiber (SMF) with a zero dispersion wavelength of around 1550 nm and nonlinear
coefficients of 11 W-1km-1, 11.5 W-1km-1 and 1.3 W-1km-1 respectively.
5.3.1 Experimental arrangement
The experimental setup for the SC generation from a dark pulse soliton mode-
locked EDFL is shown in Fig. 5.12. The mode-locked laser resonator consists of a 3.5 m
long EDF as the linear gain medium, wavelength division multiplexer (WDM),
polarization-dependent isolator (PDI), polarization controller (van Saarloos &
Hohenberg). The EDF used has an Erbium ion concentration of 2000 ppm, core diameter
of 4 µm, mode field diameter of 6 µm and NA of 0.24. A 1480 nm laser diode is used to
pump the EDF via the WDM. A PDI and PC are incorporated in the laser cavity to ensure
unidirectional propagation of the oscillating laser and to act as a polarizer to enable NPR
process in the ring cavity. The output of the laser is tapped out from the cavity via 5/95
fiber coupler while allowing 95% of the light to oscillate in the cavity. The 5% output
from the ring resonator is then amplified by an EDFA before it is launched into a piece
of nonlinear gain medium for SC generation. In this experiment, the performance of the
SC generation is investigated for three different nonlinear gain media; 50 m long PCF,
100 m long HNLF and 20 km long SMF. The nonlinearity coefficient of the PCF, HNLF
and SMF are 11 W-1km-1, 11.5 W-1km-1 and 1.3 W-1km-1 respectively.

121
Figure 5. 12: Experimental setup to investigate the SC generation with a dark pulse
5.3.2 Performance of the dark pulse and SC generations
A nonlinear Schrödinger equation (NLSE) type dark soliton (Weiner et al., 1988)
is formed under NPR effect in the laser cavity at threshold pump power of 45 mW by
proper adjusting of the intra-cavity PC. It is observed that the dark pulse train operation
is sustained until the maximum pump power of 145 mW. Fig. 5.13 shows the typical
pulse train of the dark pulse generated by the proposed laser cavity, which is measured
before EDFA at pump power of 145 mW. Formation of dark pulse is represented as a
narrow intensity dip in the strong CW laser emission background as shown in the figure.
CW noise is observed at the flat positive peaks, whereas the negative peaks are referring
to the dip intensity. The generation of dark pulse is due to the change of linear refractive
index coefficient in the normal dispersion cavity.
Fig. 5.14 shows the output spectrum of the mode-locked EDFL, which exhibits
single peak profile. This shows that the generated pulse is a NLSE type of dark pulse. As
shown in Fig. 5.14, the output spectrum operates at a center wavelength of about 1570
nm. The spectral broadening is also observed, which is due to SPM effect in the laser

122
cavity. The dark pulse width is further studied by using auto-correlator (AC) as shown in
Fig. 5.15. We use a sech2 pulse trend with 100 fs resolution to curve fit the AC result.
The AC curve shows a pulse width of 0.82 ps. However, conventional AC can only
measure the positive pulse width. Hence, by taking the ratio of negative width over
positive width to multiply with the curve fitting result, the dark pulse width is estimated
to be around 0.5 ps. It is observed that the output laser power and pulse energy are directly
proportional with the pump power within the pump power region from 45 to 145 mW.
The maximum average output power is measured as 2.9 mW at maximum pump power
of 145 mW. With a constant pulse repetition rate of 8.06 MHz and constant pulse width
of 0.5 ps throughout the tuning range, the pulse energy is calculated to be around 360 pJ
at maximum pump power of 145 mW. The stability of dark pulse is further studied by RF
spectrum analyzer. As shown in Fig. 5.16, the SNR is measured to be around 45 dB at
fundamental frequency of 8.06 MHz.
Figure 5. 13: Typical dark pulse train obtained from the mode-locked EDFL
-20
-15
-10
-5
0
0 0.1 0.2 0.3 0.4 0.5 0.6 0.7 0.8
Inte
nsi
ty (
mv)
Time (μs)

123
Figure 5. 14: Output spectrum from the mode-locked EDFL at pump power of 145 mW.
Figure 5. 15: AC Sech2 pulse curve fitting with resolution of 100 fs.
-70
-60
-50
-40
-30
-20
-10
0
1520 1540 1560 1580 1600 1620
Ou
tpu
t p
ow
er (
dB
m)
Wavelength (nm)

124
Figure 5. 16: RF spectrum of the dark pulse soliton at pump power of 145 mW.
Fig. 5.17 shows the attenuated SC spectra at 3 different nonlinear media using an
amplified 1570 nm nanosecond dark pulse laser as a pump. In the experiment, the output
power from the EDFA is constantly maintained at 18 dBm. The spectral broadening
below 1200 nm region is not examined due to spectral sensitivity of the OSA. It is
observed that the SC spectrum wavelength spans from 1200 nm to 1810 nm, 1200 nm to
1920 nm and 1480 nm to 1740 nm with the use of PCF, HNLF and SMF respectively, as
the nonlinear gain medium. This wavelength range is obtained by considering -30 dBm
power level of Fig. 5 as a SC operation output power threshold. This is due to, most of
the optical devices, in general, have a sensitivity lower than -30 dBm. The SC bandwidth
is smallest in SMF since it exhibits the lowest nonlinearity. The bandwidth is increased
from 181 nm to 222 nm as the gain medium is changed to 50 m long PCF, which has a
higher nonlinearity of about 11 W-1km-1. As HNLF exhibits almost similar nonlinearity
with PCF, the SC bandwidth can be almost doubled to around 466 nm by using 100 m
-90
-80
-70
-60
-50
-40
0 10 20 30 40 50
Ou
tpu
t p
ow
er (
dB
m)
Frequency (MHz)

125
long HNLF (double the length of PCF) as the gain medium. The spectral peak at around
1570 nm is the residual mode locked EDFL pump.
Figure 5. 17: Supercontinuum spectra at three different gain media using the amplified
dark pulse soliton.
5.4 Summary
SC generation has been successfully demonstrated in all three NPR-based pulse
EDFLs. At first, the performance of SC generation in QML and CWML EDFLs, which
was amplified by an EDFA as pump source was investigated and demonstrated. The QML
EDF laser generates a pulse train operating at 1560.5 nm which is amplified up to 18 dBm
of average power by the EDFA to produce SC ranging from about 1350 nm to 1900 nm.
On the other hand, SC generated by CWML was operating at 1565 nm with slightly better
performances in term of output power and bandwidth. A SC generation based on dark
pulse was also demonstrated in three different fiber spools in a passively mode locked
EDFL. The mode locked EDF laser generates a dark pulse train operating at 1570 nm

126
with a repetition rate of 8.06 MHz and a pulse width of 0.55 ps. It is amplified up to 18
dBm of average power by the EDFA to produce SC ranging from 1200 nm to 1810 nm,
1200 nm to 1920 nm and 1480 nm to 1740 nm with the use of 50 m long PCF, 100 m
long HNLF and 20 km long PCF.

127
CHAPTER 6
CONCLUSION AND FUTURE WORK
6.1 Conclusion
Nonlinear effects are harmful and unwanted in Dense Wavelength Division
Multiplexing (DWDM) system as they cause distortion and degradation to the carried
information. Regardless of this drawback, nonlinear effects can be utilized for many
applications such as optical amplification, laser and optical switching. Among the
significant applications of nonlinear effects are in pulsed laser and super-continuum (SC)
generations. Pulsed laser has been widely used in industry for micromachining such as
cutting, drilling and welding while in medical, pulsed laser is employed for surgery. For
communication purposes, pulsed laser with narrow pulse width is the key enabler for high
speed communication in Optical Time Division Multiplexing (OTDM). On the other
hand, SC light source is very useful for different applications such as spectroscopy,
frequency metrology, device characterization and medical science.
The generation of pulsed laser can be categorized into two techniques; the active
and passive techniques. This thesis aimed to propose and demonstrate both Q-switched
and mode-locked pulse lasers using passive techniques based on nonlinear effects. The
nonlinear effects were also employed to generate SC light source. In this work, various
techniques such as self-pulsing with stimulated Brillouin scattering (SBS), and nonlinear
polarization rotation (NPR) techniques were used to generate laser pulses.
In chapter 3, SBS effect in optical fiber was investigated for pulse generation. At
first, we investigated SBS effect in a standard single mode fiber (SMF) and microfiber
structures such as non-adiabatic microfiber and inline Mach-Zhender interferometer
(IMZI). Both non-adiabatic microfibre and IMZI were fabricated from a standard silica
fibre using a flame brushing technique to produce mode interference. It was observed that

128
the Stokes wavelength is up-shifted by 0.088 nm (10 GHz) from the BP wavelength while
the anti-Stokes wavelength is downshifted by the same spacing. It was found that the
IMZI can produce higher spontaneous Brillouin scattering Stokes and anti-Stokes powers
due to its stronger multimode interference effect compared to the non-adiabatic
microfiber. However, both microfiber structures cannot produce the SBS and laser in a
ring configuration due to the limitation of our facilities such as high BP power source.
Therefore, a 10 km long SMF was used in this study to demonstrate Brillouin fiber laser
(BFL) and pulse generation.
The threshold BP powers for the ring BFL were obtained at 1.2, 1.5, 2.2 dBm for
the laser cavity configured with 10/90, 20/80, and 50/50 output coupler, respectively. The
maximum laser’s peak power of -3.12 dBm is obtained for the BFL configured with 50/50
coupler. The temporal characteristic of proposed BFL with 10/90 output coupler was also
investigated. At a threshold pump power of 1.2 dBm, the pulse width and repetition
frequency of the laser are obtained at 440 µs and 2 kHz, respectively. As the pump power
increases, the pulse width becomes shorter while the repetition rate increases. This Q-
switching or pulsing behavior is due to the relaxation oscillation, a natural trait of fiber
laser, which occurs around the laser threshold as the SBS grows. In another work, a single
wavelength Brillouin Erbium fiber laser (BEFL) was successfully demonstrated by using
only a 3-m-long Erbium-doped fiber (EDF) as both linear and nonlinear gains mediums.
The BEFL is obtained at a wavelength of the 1561.5nm region with a peak power of
−5dBm and an SMSR of more than 5 dB with the BP and 1480nm pump powers of 5dBm
and 34mW, respectively. The BEFL also shows a self-pulsing characteristic with
repetition rates of 66.7 kHz as the 1480nm pump power is set within 13–20mW.
However, the amplitude of the pulse is significantly lower than the conventional BFL,
which has a longer cavity length.

129
At the end of Chapter 3, the BFL with a mode-locking characteristic was
demonstrated using a 100m-long highly nonlinear fiber (HNLF) as a Brillouin gain
medium in conjunction with relaxation oscillation technique. The BFL generates a self-
starting pulse train with a repetition rates of 1.76 MHz at BP power of 10.9 Bm. The pulse
width of the laser is maintained at around 270 ns. These results are useful for applications
in distributed medical surgery, temperature and strain sensing as well as the line width
measurement of narrow line width laser and so on.
Chapter 4 presented and demonstrated several passively mode-locked and Q-
switched fiber lasers based on nonlinear effects inside the ring laser cavity. At first, the
nonlinear polarization rotation (NPR) based mode-locked EDFL with three switchable
operation states was proposed and demonstrated by incorporating a 10 km long SMF and
in the ring cavity. The SMF plays an important role to induce Kerr effect in the cavity,
which allows the polarization rotation occur in the cavity. We have successfully obtained
a nanosecond harmonic pulse train operating with ultra-low repetition rate with the
proposed laser cavity. A stable harmonic pulse was obtained at the fundamental repetition
rate of 20 kHz at a threshold pump power of 36 mW. The harmonic pulse can be switch
from fundamental to 3th order harmonic by increasing the pump power.
Then, a nanosecond optical pulse operating in fundamental mode was
successfully generated in the similar EDFL cavity by replacing the SMF section with a
100 m long HNLF. The laser operated at 1567.2 nm and produced a pulse train with a
constant repetition rate of 1.56 MHz and pulse width of 297 ns. The maximum pulse
energy of 1.4 nJ was obtained at the maximum pump power of 145 mW. The nanosecond
mode-locked was considered stable since the SNR of the RF spectrum was more than 50
dB.
To improve the pulse energy, a Q-switched EDFL was proposed and
demonstrated based on nonlinear optical loop mirror (NOLM) cavity. The NOLM was

130
used in the laser cavity to generate the intensity dependent transmission so that it
functions as a saturable absorber (SA). The proposed Q-switched laser operated at 1561.5
nm with the pulse repetition rate varied from 7.6 to 22.11 kHz as the pump power is
increased from 37 to 125 mW. On the other hand, the lowest pulse width of 5.7 μs and
the maximum pulse energy of 8.2 nJ were obtained at the maximum pump power of 125
mW. A Q-switched BFL was also demonstrated using multi-walled carbon nanotubes
(MWCNTs) embedded in polyvinyl alcohol (PVA) film as a passive SA. In the proposed
BFL, a 5 km long dispersion shifted fiber (DSF) was used as a Brillouin gain medium.
The SA was obtained by sandwiching the MWCNT–PVA film between two FC/PC fibre
connectors. The self-starting Q-switching pulse train was succsefully generated as the BP
reaches a threshold pump power of 5.0 dBm. As the BP power is increased from 5.0 to
6.0 dBm, the repetition rate of the Q-switched BFL increases from 27.75 to 30.21 kHz,
whereas the pulse width decreases from 3.25 μs to 1.11 μs. The maximum pulse energy
of 0.13 nJ is obtained at BP power of 6 dBm.
These lasers have been tried to be implemented in the experiment to generate SC,
but the result is not promising. Therefore, three new mode-locked fiber lasers were
proposed and demonstrated in Chapter 5 for a SC generation. Mode-locking operation
can be classified into two categories, which are continuous wave mode-locked (CWML)
and Q-switched mode-locked (QML). For CWML, the ultra-short pulses can be generated
for each round trip time in the laser cavity which typically produces megahertz (MHz)
pulse repetition rate. Meanwhile, QML possesses Q-switching modulation pulse
repetition rate in kilohertz (kHz) range. At first, SC generation in HNLF is investigated
using QML and CWML as the pump source. These pulses are formed under NPR effect
in an EDFL cavity. The SC generation is investigated in 100 m long HNLF with a zero
dispersion wavelength of around 1550 nm and nonlinear coefficient of 11.5 W-1km-1.

131
The proposed QML EDFL generated a pulse train operating at 1560.5 nm. At 145
mW pump power, the laser produced Q-switching repetition rate of 49 kHz with pulse
width of 3.53 µs. In a single envelop of the Q-switched pulse, there were mode-locking
pulse train with a repetition rate of 9.4 MHz and 1 ps pulse width. The pulse energy was
calculated to be around 81 nJ. The QML laser was then amplified up to 18 dBm of average
power by the EDFA to produce SC ranging from about 1350 nm to 1900 nm. The CWML
operating at 1565 nm was realized in the same laser cavity by incorporating a 200 m long
SMF. The laser produced a pulse train with 942 kHz repetition rate, 367 ns pulse width
2.7 nJ pulse energy at the maximum pump power of 145 mW. The output pulse train is
then amplified by an EDFA before it is launched into a HNLF for SC generation. It is
found that SC light generated by CWML was slightly better in term of output power and
bandwidth. This is most probably due to the CWML pulses are less affected by the fiber
loss and background noise than the QML pulse.
To date, most of the reported works on soliton mode-locked lasers are operating
under the bright pulse regime. Besides bright pulses, there are also other types of mode-
locking pulses, the so-called dark solitons that are also solutions of the nonlinear
Schrödinger equation (NLSE) and the complex Ginzburg-Landau equation (CGLE). To
date, most of the SC generations were reported using a bright soliton pulses. In the final
section of Chapter 5, A SC generation based on dark pulse was demonstrated in three
different fiber spools in a passively mode locked EDFL. Here, dark pulses are referred to
as a train of intensity dips in a continuous wave (CW) background of the laser emission.
The mode locked EDF laser generates a dark pulse train operating at 1570 nm with a
repetition rate of 8.06 MHz and a pulse width of 0.55 ps. It is amplified up to 18 dBm of
average power by the EDFA to produce SC ranging from 1200 nm to 1810 nm, 1200 nm
to 1920 nm and 1480 nm to 1740 nm with the use of 50 m long PCF, 100 m long HNLF
and 20 km long PCF.

132
In conclusion, we have successfully demonstrated various practical pulsed fiber
lasers and SC light sources by utilizing various nonlinear effects in optical fibers. The SC
light source is of great interest for different applications such as spectroscopy, frequency
metrology, device characterization and medical science
6.2 Future Outlooks
In this thesis, many works have been carried out on both pulsed laser and SC
generation. However, there are still many works that can be further explored and
investigated in the future. For instance, pulse width of BFL can be further reduced by
replacing the long fibers with a shorter nonlinear medium like microfibers. Besides, SBS
self-pulsing with semiconductor optical amplifier (SOA) is another prospect that can be
investigated in the future. Pulse width of NPR based EDFL can also be made narrower,
near transform limit by optimizing the net dispersion in the cavity. With the advancement
of ultra-fast laser system, the cavity length can be reduced to several meters to allow
hundreds of Mega-Hertz and also Giga-Hertz repetition rate for applications in high
capacity telecommunication systems and photonic switching devices. NPR based pulsed
laser can also be extended to other regions such as 1 μm and 2μm.
NPR based Q-switched and mode-locked fiber lasers can be further studied to
allow tunable operation. New saturable absorbers such as graphene can also be explored
for ultra-short pulse fiber laser generation. Another related field of interest is to construct
SC light source by using pulsed BFL as well as NPR based EDFL. This light source can
then be sliced into many wavelengths for DWDM applications. Future directions can also
include engaging high power laser diode to produce high pulse energy by scaling up the
energy to micro-Joule and generate supercontinuum in shorter nonlinear medium. With
this, it is hoped that this work will contribute to the further development of ultra-fast
optics.

133
REFERENCES
Abedin, K. S. (2005). Observation of strong stimulated Brillouin scattering in single-
mode As2Se3 chalcogenide fiber. Optics Express, 13(25), 10266-10271.
Abeeluck, A. K., Headley, C., & Jørgensen, C. G. (2004). High-power supercontinuum
generation in highly nonlinear, dispersion-shifted fibers by use of a continuous-
wave Raman fiber laser. Optics letters, 29(18), 2163-2165.
Agrawal, G. (2001). Applications of nonlinear fiber optics: Academic press.
Agrawal, G. P. (1997). Fiber-optic communication systems (Vol. 1).
Agrawal, G. P. (2007). Nonlinear fiber optics: Academic press.
Agrawal, G. P., & Olsson, N. A. (1989). Self-phase modulation and spectral broadening
of optical pulses in semiconductor laser amplifiers. Quantum Electronics, IEEE
Journal of, 25(11), 2297-2306.
Ahmad, H., Muhammad, F., Zulkifli, M., & Harun, S. (2013). Graphene-Based Mode-
Locked Spectrum-Tunable Fiber Laser Using Mach–Zehnder Filter. Photonics
Journal, IEEE, 5(5), 1501709-1501709.
Ahmad, H., Shahi, S., & Harun, S. (2010). Bismuth-based erbium-doped fiber as a gain
medium for L-band amplification and Brillouin fiber laser. Laser physics, 20(3),
716-719.
Alfano, R., & Shapiro, S. (1970). Observation of self-phase modulation and small-scale
filaments in crystals and glasses. Physical Review Letters, 24(11), 592.
Alfano, R. R. (1989). The supercontinuum laser source.
Asobe, M., Ohara, T., Yokohama, I., & Kaino, T. (1996). Low power all-optical
switching in a nonlinear optical loop mirror using chalcogenide glass fibre.
Electronics Letters, 32(15), 1396-1397.
Banhart, F. (1999). Irradiation effects in carbon nanostructures. Reports on progress in
physics, 62(8), 1181.
Becker, M., Kuizenga, D. J., & Siegman, A. (1972). Harmonic mode locking of the
Nd:YAG laser. Quantum Electronics, IEEE Journal of, 8(8), 687-693. doi:
10.1109/JQE.1972.1077271

134
Bernini, R., Minardo, A., & Zeni, L. (2002, 2002). A reconstruction technique for
stimulated Brillouin scattering fiber-optic sensors for simultaneous measurement
of temperature and strain. Paper presented at the Sensors, 2002. Proceedings of
IEEE.
Beugnot, J. C., Ahmad, R., Rochette, M., Laude, V., Maillotte, H., & Sylvestre, T. (2013).
Stimulated Brillouin scattering in chalcogenide-PMMA hybrid microwires. Paper
presented at the Workshop on Specialty Optical Fibers and their Applications.
Bloembergen, N. (1996). Nonlinear optics: World Scientific.
Boscolo, S., Turitsyn, S. K., & Blow, K. J. (2008). Nonlinear loop mirror-based all-
optical signal processing in fiber-optic communications. Optical Fiber
Technology, 14(4), 299-316.
Boyd, R. W. (2003). Nonlinear optics: Academic press.
Buck, J. A. (2004). Fundamentals of optical fibers: John Wiley & Sons.
Chernikov, S., Zhu, Y., Taylor, J., & Gapontsev, V. (1997). Supercontinuum self-Q-
switched ytterbium fiber laser. Optics letters, 22(5), 298-300.
Chraplyvy, A. R. (1990). Limitations on lightwave communications imposed by optical-
fiber nonlinearities. Journal of Lightwave Technology, 8(10), 1548-1557.
Cordeiro, C. M. B., Wadsworth, W. J., Birks, T. A., & Russell, P. S. J. (2005).
Engineering the dispersion of tapered fibers for supercontinuum generation with
a 1064 nm pump laser. Optics letters, 30(15), 1980-1982. doi:
10.1364/OL.30.001980
Cotter, D. (1983). Stimulated Brillouin scattering in monomode optical fiber. Journal of
Optical Communications, 4(1), 10-19.
Dainese, P., Russell, P. S. J., Joly, N., Knight, J. C., Wiederhecker, G. S., Fragnito, H. L.,
. . . Khelif, A. (2006). Stimulated Brillouin scattering from multi-GHz-guided
acoustic phonons in nanostructured photonic crystal fibres. Nat Phys, 2(6), 388-
392. doi:
http://www.nature.com/nphys/journal/v2/n6/suppinfo/nphys315_S1.html
Dainese, P., Russell, P. S. J., Wiederhecker, G. S., Joly, N., Fragnito, H. L., Laude, V., &
Khelif, A. (2006). Raman-like light scattering from acoustic phonons in photonic
crystal fiber. Optics Express, 14(9), 4141-4150. doi: 10.1364/OE.14.004141

135
Degnan, J. J. (1995). Optimization of passively Q-switched lasers. Quantum Electronics,
IEEE Journal of, 31(11), 1890-1901.
Delgado-Pinar, M., Zalvidea, D., Diez, A., Perez-Millan, P., & Andres, M. (2006). Q-
switching of an all-fiber laser by acousto-optic modulation of a fiber Bragg
grating. Optics Express, 14(3), 1106-1112.
Dennis, M. L., & Duling III, I. N. (1994). Experimental study of sideband generation in
femtosecond fiber lasers. Quantum Electronics, IEEE Journal of, 30(6), 1469-
1477.
Desurvire, E. (2002). Erbium-doped fiber amplifiers: principles and applications: Wiley-
Interscience.
Dinu, M., Quochi, F., & Garcia, H. (2003). Third-order nonlinearities in silicon at telecom
wavelengths. Applied Physics Letters, 82(18), 2954-2956.
Dong, B., Hao, J., Hu, J., & Liaw, C.-y. (2011). Short linear-cavity Q-switched fiber laser
with a compact short carbon nanotube based saturable absorber. Optical Fiber
Technology, 17(2), 105-107.
Dudley, J. M., Provino, L., Grossard, N., Maillotte, H., Windeler, R. S., Eggleton, B. J.,
& Coen, S. (2002). Supercontinuum generation in air–silica microstructured
fibers with nanosecond and femtosecond pulse pumping. JOSA B, 19(4), 765-771.
Duling, I., Chen, C., Wai, P., & Menyuk, C. (1994). Operation of a nonlinear loop mirror
in a laser cavity. IEEE journal of quantum electronics, 30(1), 194-199.
Duling III, I. N. (2006). Compact sources of ultrashort pulses (Vol. 18): Cambridge
University Press.
El-Sherif, A. F., & King, T. A. (2003). High-energy, high-brightness Q-switched Tm 3+-
doped fiber laser using an electro-optic modulator. Optics Communications,
218(4), 337-344.
Elim, H., Ji, W., Ma, G., Lim, K., Sow, C., & Huan, C. (2004). Ultrafast absorptive and
refractive nonlinearities in multiwalled carbon nanotube films. Applied Physics
Letters, 85(10), 1799-1801.
Englender, J., Beregi, J. P., Fayoux, D., Astier, R., Perennec, J., Antonetti, A., &
Lecarpentier, Y. (1992). Stretched nanosecond pulses of a Q-switched Nd-YAG
laser: Transmission through optical fibres and in vitro effects on human calcified
tissues. Lasers in Medical Science, 7(1-4), 467-476. doi: 10.1007/BF02594090

136
Feng, X., Tam, H.-y., & Wai, P. (2006). Stable and uniform multiwavelength erbium-
doped fiber laser using nonlinear polarization rotation. Optics Express, 14(18),
8205-8210.
Fotiadi, A. A., Ikiades, A., Vainos, N. A., Deparis, O., & Kiyan, R. V. (1999). Q-
switching dynamics in SBS/Er fiber laser with low-power pump. Paper presented
at the Photonics East'99.
Genty, G., & Dudley, J. M. (2009). Route to coherent supercontinuum generation in the
long pulse regime. Quantum Electronics, IEEE Journal of, 45(11), 1331-1335.
Geusic, J., Marcos, H., & Van Uitert, L. (1964). Laser oscillations in Nd‐doped yttrium
aluminum, yttrium gallium and gadolinium garnets. Applied Physics Letters,
4(10), 182-184.
Ghatak, A., & Thyagarajan, K. (1998). An introduction to fiber optics: Cambridge
university press.
Gupta, K. K., Onodera, N., Abedin, K. S., & Hyodo, M. (2002). Pulse repetition
frequency multiplication via intracavity optical filtering in AM mode-locked fiber
ring lasers. Photonics Technology Letters, IEEE, 14(3), 284-286.
Hargrove, L., Fork, R., & Pollack, M. (1964). Locking of He–Ne laser modes induced by
synchronous intracavity modulation. Applied Physics Letters, 5(1), 4-5.
Hartl, I., Li, X., Chudoba, C., Ghanta, R., Ko, T., Fujimoto, J., . . . Windeler, R. (2001).
Ultrahigh-resolution optical coherence tomography using continuum generation
in an air–silica microstructure optical fiber. Optics letters, 26(9), 608-610.
Harun, S., Ismail, M., Ahmad, F., Ismail, M., Nor, R., Zulkepely, N., & Ahmad, H.
(2012). A Q-switched erbium-doped fiber laser with a carbon nanotube based
saturable absorber. Chinese Physics Letters, 29(11), 114202.
Harun, S., Shahi, S., & Ahmad, H. (2010). Brillouin fiber laser with a 49 cm long
Bismuth‐based erbium‐doped fiber. Laser Physics Letters, 7(1), 60-62.
Hasan, T., Sun, Z., Wang, F., Bonaccorso, F., Tan, P. H., Rozhin, A. G., & Ferrari, A. C.
(2009). Nanotube–polymer composites for ultrafast photonics. Advanced
Materials, 21(38‐39), 3874-3899.
Haus, H. A. (2000). Mode-locking of lasers. IEEE Journal of Selected Topics in Quantum
Electronics, 6(6), 1173-1185.

137
Hellwarth, R. (1961). Control of fluorescent pulsations. Paper presented at the Advances
in quantum electronics.
Hirao, K., & Miura, K. (1998). Writing waveguides and gratings in silica and related
materials by a femtosecond laser. Journal of non-crystalline solids, 239(1), 91-
95.
Hönninger, C., Paschotta, R., Morier-Genoud, F., Moser, M., & Keller, U. (1999). Q-
switching stability limits of continuous-wave passive mode locking. JOSA B,
16(1), 46-56.
Huang, J., Huang, W., Zhuang, W., Su, K., Chen, Y., & Huang, K. (2009). High-pulse-
energy, passively Q-switched Yb-doped fiber laser with AlGaInAs quantum wells
as a saturable absorber. Optics letters, 34(15), 2360-2362.
Huang, J., Zhuang, W., Huang, W., Su, K., Huang, K., & Chen, Y. (2011). Hybrid Q-
switched Yb-doped fiber laser. Optics Express, 19(10), 9364-9370.
Humbert, G., Wadsworth, W., Leon-Saval, S., Knight, J., Birks, T., St J Russell, P., . . .
Breuer, E. (2006). Supercontinuum generation system for optical coherence
tomography based on tapered photonic crystal fibre. Optics Express, 14(4), 1596-
1603.
Iijima, S. (1991). Helical microtubules of graphitic carbon. nature, 354(6348), 56-58.
Jackson, J. D., & Jackson, J. D. (1962). Classical electrodynamics (Vol. 3): Wiley New
York etc.
Jasim, A., Harun, S., Lim, K., Rahman, B., & Ahmad, H. (2012). Microfibre Mach-
Zehnder interferometer and its application as a current sensor. Optoelectronics,
IET, 6(6), 298-302.
Javan, A., Bennett Jr, W., & Herriott, D. (2013). Population Inversion and Continuous
Optical Maser Oscillation in a Gas Discharge. Essentials of Lasers: The
Commonwealth and International Library: Selected Readings in Physics, 167.
Jonsson, F. (2003). Lecture Notes on.
Junqing, Z., Peiguang, Y., Shuangchen, R., Yongqin, Y., Geguo, D., Gelin, Z., . . . Jie, L.
(2012). Multi-wavelength graphene-based Q-switched erbium-doped fiber laser.
Optical Engineering, 51(7), 074201-074201-074201-074204.

138
Jusoh, Z., Shahabuddin, N., Ali, N., Ahmad, H., & Harun, S. (2013). Nanosecond Pulse
Generation Using the Stimulated Brillouin Scattering Effect in a Photonic Crystal
Fiber. Chinese Physics Letters, 30(11), 114204.
Kaminski, C., Watt, R., Elder, A., Frank, J., & Hult, J. (2008). Supercontinuum radiation
for applications in chemical sensing and microscopy. Applied Physics B, 92(3),
367-378.
Kang, M. S., Brenn, A., Wiederhecker, G. S., & Russell, P. S. J. (2008). Optical excitation
and characterization of gigahertz acoustic resonances in optical fiber tapers.
Applied Physics Letters, 93(13), 131110.
Kawamura, K., Ogawa, T., Sarukura, N., Hirano, M., & Hosono, H. (2000). Fabrication
of surface relief gratings on transparent dielectric materials by two-beam
holographic method using infrared femtosecond laser pulses. Applied Physics B,
71(1), 119-121.
Keller, U. (2003). Recent developments in compact ultrafast lasers. nature, 424(6950),
831-838.
Kennedy, J. T., Hart, R. A., Laughman, L., Fontanella, J., Demaria, A. J., Newman, L.
A., & Henschke, R. (2004). Q-switched cavity dumped CO2 laser for material
processing: Google Patents.
Kivshar, Y. S., Emplit, P., Hamaide, J.-P., & Haelterman, M. (1994). Gordon–Haus effect
on dark solitons. Optics letters, 19(1), 19-21.
Kneis, C., Donelan, B., Berrou, A., Manek-Hönninger, I., Cadier, B., Robin, T., ... &
Kieleck, C. (2015). 4.5 W mid-infrared supercontinuum generation in a ZBLAN
fiber pumped by a Q-switched mode-locked Tm3+-doped fiber laser. SPIE
LASE (pp. 93420B-93420B). International Society for Optics and Photonics.
Komarov, A., Leblond, H., & Sanchez, F. (2006). Passive harmonic mode-locking in a
fiber laser with nonlinear polarization rotation. Optics Communications, 267(1),
162-169. doi: http://dx.doi.org/10.1016/j.optcom.2006.06.012
Lacroix, S., Gonthier, F., Black, R. J., & Bures, J. (1988). Tapered-fiber interferometric
wavelength response: the achromatic fringe. Optics letters, 13(5), 395-397. doi:
10.1364/OL.13.000395
Lamminpää, A. (2003). Measurement of nonlinearity of optical fiber. Helsinki university
of technology, Master thesis, 17th of July.

139
Laroche, M., Gilles, H., Girard, S., Passilly, N., & Aït-Ameur, K. (2006). Nanosecond
pulse generation in a passively Q-switched Yb-doped fiber laser by Cr 4+: YAG
saturable absorber. Photonics Technology Letters, IEEE, 18(6), 764-766.
Lee, J., Koo, J., Debnath, P., Song, Y.-W., & Lee, J. H. (2013). A Q-switched, mode-
locked fiber laser using a graphene oxide-based polarization sensitive saturable
absorber. Laser Physics Letters, 10(3), 035103.
Lim, S., Elim, H., Gao, X., Wee, A., Ji, W., Lee, J., & Lin, J. (2006). Electronic and
optical properties of nitrogen-doped multiwalled carbon nanotubes. Physical
Review B, 73(4), 045402.
Lin, X. C., Zhang, L., Tsang, Y. H., Wang, Y. G., Yu, H. J., Yan, S. L., . . . Hou, W.
(2013). Multi-walled carbon nanotube as a saturable absorber for a passively
mode-locked Nd: YVO4 laser. Laser Physics Letters, 10(5), 055805.
Liu, X. (2010). Mechanism of high-energy pulse generation without wave breaking in
mode-locked fiber lasers. Physical Review A, 82(5), 053808.
Luo, Z., Luo, A., Xu, W., Song, C., Gao, Y., & Chen, W. (2009). Sideband controllable
soliton all-fiber ring laser passively mode-locked by nonlinear polarization
rotation. Laser Physics Letters, 6(8), 582.
Luo, Z., Zhou, M., Weng, J., Huang, G., Xu, H., Ye, C., & Cai, Z. (2010). Graphene-
based passively Q-switched dual-wavelength erbium-doped fiber laser. Optics
letters, 35(21), 3709-3711.
Maiman, T. H. (1960). Stimulated optical radiation in ruby.
McGrath, A. J., Munch, J., Smith, G., & Veitch, P. (1998). Injection-seeded, single-
frequency, Q-switched erbium: glass laser for remote sensing. Applied Optics,
37(24), 5706-5709.
Mears, R., Reekie, L., Poole, S., & Payne, D. (1986). Low-threshold tunable CW and Q-
switched fibre laser operating at 1.55 μm. Electronics Letters, 22(3), 159-160.
Mikulla, B., Leng, L., Sears, S., Collings, B., Arend, M., & Bergman, K. (1999). Broad-
band high-repetition-rate source for spectrally sliced WDM. IEEE Photonics
Technology Letters, 11(4), 418-420.
Mills, D. (1991). Nonlinear optics: Springer Berlin etc.

140
Milonni, P. W., & Eberly, J. H. (2010). Laser physics. from
http://www.books24x7.com/marc.asp?bookid=43238
Mocker, H. W., & Collins, R. (1965). Mode competition and self‐locking effects in aq‐switched ruby laser. Applied Physics Letters, 7(10), 270-273.
Morioka, T., Takara, H., Kawanishi, S., Kamatani, O., Takiguchi, K., Uchiyama, K., . . .
Kanamori, T. (1996). 1 Tbit/s (100 Gbit/s× 10 channel) OTDM/WDM
transmission using a single supercontinuum WDM source. Electronics Letters,
32(10), 906-907.
Muhammad, M. Z., Jasim, A. A., Ahmad, H., Arof, H., & Harun, S. W. (2013). Non-
adiabatic silica microfiber for strain and temperature sensors. Sensors and
Actuators A: Physical, 192(0), 130-132. doi:
http://dx.doi.org/10.1016/j.sna.2012.12.036
Nakazawa, M., Kubota, H., Sahara, A., & Tamura, K. (1998). Time-domain ABCD
matrix formalism for laser mode-locking and optical pulse transmission. Quantum
Electronics, IEEE Journal of, 34(7), 1075-1081.
Neev, J., Da Silva, L. B., Feit, M. D., Perry, M. D., Rubenchik, A. M., & Stuart, B. C.
(1996). Ultrashort pulse lasers for hard tissue ablation. Selected Topics in
Quantum Electronics, IEEE Journal of, 2(4), 790-800.
Nelson, L., Jones, D., Tamura, K., Haus, H., & Ippen, E. (1997). Ultrashort-pulse fiber
ring lasers. Applied Physics B: Lasers and Optics, 65(2), 277-294.
Nicholson, J., Abeeluck, A., Headley, C., Yan, M., & Jørgensen, C. (2003). Pulsed and
continuous-wave supercontinuum generation in highly nonlinear, dispersion-
shifted fibers. Applied Physics B, 77(2-3), 211-218.
Nikles, M., Thevenaz, L., & Robert, P. A. (1997). Brillouin gain spectrum
characterization in single-mode optical fibers. Lightwave Technology, Journal of,
15(10), 1842-1851.
Nikles, M., Thévenaz, L., & Robert, P. A. (1996). Simple distributed fiber sensor based
on Brillouin gain spectrum analysis. Optics letters, 21(10), 758-760.
Nodop, D., Limpert, J., Hohmuth, R., Richter, W., Guina, M., & Tünnermann, A. (2007).
High-pulse-energy passively Q-switched quasi-monolithic microchip lasers
operating in the sub-100-ps pulse regime. Optics letters, 32(15), 2115-2117.
Palais, J. C. (1988). Fiber optic communications: Prentice Hall Englewood Cliffs.

141
Pan, L., Utkin, I., & Fedosejevs, R. (2007). Passively Q-switched ytterbium-doped
double-clad fiber laser with a Cr 4+: YAG saturable absorber. Photonics
Technology Letters, IEEE, 19(24), 1979-1981.
Poole, S., Payne, D. N., & Fermann, M. E. (1985). Fabrication of low-loss optical fibres
containing rare-earth ions. Electronics Letters, 21(17), 737-738.
Popa, D., Sun, Z., Hasan, T., Torrisi, F., Wang, F., & Ferrari, A. (2010). Graphene Q-
switched, tunable fiber laser. arXiv preprint arXiv:1011.0115.
Ramadurai, K., Cromer, C. L., Lewis, L. A., Hurst, K. E., Dillon, A. C., Mahajan, R. L.,
& Lehman, J. H. (2008). High-performance carbon nanotube coatings for high-
power laser radiometry. Journal of Applied Physics, 103(1), 013103.
Reutebuch, S. E., Andersen, H.-E., & McGaughey, R. J. (2005). Light detection and
ranging (LIDAR): an emerging tool for multiple resource inventory. Journal of
Forestry, 103(6), 286-292.
Ruffin, A. B. (2004). Stimulated Brillouin scattering: an overview of measurements,
system impairments, and applications. Paper presented at the Technical Digest:
Symposium on Optical Fiber Measurements.
Russell, P. S. J. (2006). Photonic-Crystal Fibers. Lightwave Technology, Journal of,
24(12), 4729-4749. doi: 10.1109/JLT.2006.885258
Shahabuddin, N., Awang, N., Ahmad, H., Arof, H., Dimyati, K., Yusoff, Z., & Harun, S.
(2012). Supercontinuum generation using a passive mode-locked stretched-pulse
bismuth-based erbium-doped fiber laser. Optics & Laser Technology, 44(4), 741-
743.
Shank, C., & Ippen, E. (1974). Subpicosecond kilowatt pulses from a mode‐locked cw
dye laser. Applied Physics Letters, 24(8), 373-375.
Shee, Y., Mahdi, M., Al-Mansoori, M., Ismail, A., Hambali, N., Zamzuri, A., . . . Yaakob,
S. (2009). Threshold reduction of stimulated Brillouin scattering in photonic
crystal fiber. Laser physics, 19(12), 2194-2196.
Shi, K. (2007). Supercontinuum imaging and spectroscopy: ProQuest.
Shibata, N., Azuma, Y., Horiguchi, T., & Tateda, M. (1988). Identification of longitudinal
acoustic modes guided in the core region of a single-mode optical fiber by
Brillouin gain spectra measurements. Optics letters, 13(7), 595-597.

142
Shirazi, M., Harun, S., Biglary, M., & Ahmad, H. (2008). Linear cavity Brillouin fiber
laser with improved characteristics. Optics letters, 33(8), 770-772.
Siegman, A. E. (1986). Lasers University Science Books. Mill Valley, CA, 37.
Smith, R. G. (1972). Optical power handling capacity of low loss optical fibers as
determined by stimulated Raman and Brillouin scattering. Applied Optics, 11(11),
2489-2494.
Snitzer, E. (1961). Optical maser action of Nd+ 3 in a barium crown glass. Physical
Review Letters, 7(12), 444.
Sobon, G., Sotor, J., Jagiello, J., Kozinski, R., Librant, K., Zdrojek, M., . . . Abramski, K.
M. (2012). Linearly polarized, Q-switched Er-doped fiber laser based on reduced
graphene oxide saturable absorber. Applied Physics Letters, 101(24), 241106.
Sotor, J., Sobon, G., Krzempek, K., & Abramski, K. M. (2012). Fundamental and
harmonic mode-locking in erbium-doped fiber laser based on graphene saturable
absorber. Optics communications, 285(13), 3174-3178.
Spühler, G., Paschotta, R., Fluck, R., Braun, B., Moser, M., Zhang, G., . . . Keller, U.
(1999). Experimentally confirmed design guidelines for passively Q-switched
microchip lasers using semiconductor saturable absorbers. JOSA B, 16(3), 376-
388.
Su, L., Wang, Y., Liu, J., Zheng, L., Su, L., & Xu, J. (2012). Double‐wall carbon nanotube
absorber for passively mode‐locked Yb3+: Sc2SiO5 laser. Laser Physics Letters,
9(2), 120-125.
Svelto, O. (2010). Properties of laser beams Principles of Lasers (pp. 475-504): Springer.
Tiu, Z. C., Tan, S. J., Ahmad, H., & Harun, S. W. (2014). Dark pulse emission in
nonlinear polarization rotation-based multiwavelength mode-locked erbium-
doped fiber laser. Chinese Optics Letters, 12(11), 113202.
van Saarloos, W., & Hohenberg, P. (1992). Fronts, pulses, sources and sinks in
generalized complex Ginzburg-Landau equations. Physica D: Nonlinear
Phenomena, 56(4), 303-367.
Weiner, A., Heritage, J., Hawkins, R., Thurston, R., Kirschner, E., Leaird, D., &
Tomlinson, W. (1988). Experimental observation of the fundamental dark soliton
in optical fibers. Physical Review Letters, 61(21), 2445.

143
Wong, T.-H., Gupta, M. C., & Hernandez-Garcia, C. (2007). Nanosecond laser pulse-
induced electron emission from multiwall carbon nanotube film. Nanotechnology,
18(13), 135705.
Wood, T. C., & Elson, D. S. (2012). A tunable supercontinuum laser using a digital
micromirror device. Measurement Science and Technology, 23(10), 105204.
Woodward, R., Kelleher, E., Popov, S., & Taylor, J. (2014). Stimulated Brillouin
scattering of visible light in small-core photonic crystal fibers. Optics letters,
39(8), 2330-2333.
Wu, X., Tang, D., Zhang, H., & Zhao, L. (2009). Dissipative soliton resonance in an all-
normal-dispersion erbium-doped fiber laser. Optics Express, 17(7), 5580-5584.
Xu, C., Liu, X., & Wei, X. (2004). Differential phase-shift keying for high spectral
efficiency optical transmissions. Selected Topics in Quantum Electronics, IEEE
Journal of, 10(2), 281-293.
Yang, K., Zhao, S., Li, G., Li, M., Li, D., Wang, J., & An, J. (2007). Diode-pumped
passively Q-switched mode-locked c-cut Nd: GdVO 4 laser with a GaAs coupler.
Optical Materials, 29(9), 1153-1158.
Yoshizawa, N., & Imai, T. (1993). Stimulated Brillouin scattering suppression by means
of applying strain distribution to fiber with cabling. Lightwave Technology,
Journal of, 11(10), 1518-1522.
Zajac, A., Skorczakowski, M., Swiderski, J., & Nyga, P. (2004). Electrooptically Q-
switched mid-infrared Er: YAG laser for medical applications. Optics Express,
12(21), 5125-5130.
Zakharov, V., & Shabat, A. (1973). Interaction between solitons in a stable medium. Sov.
Phys. JETP, 37(5), 823-828.
Zhang, H., Tang, D., Zhao, L., & Wu, X. (2009). Dark pulse emission of a fiber laser.
Physical Review A, 80(4), 045803.
Zhang, L., Wang, Y., Yu, H., Sun, L., Hou, W., Lin, X., & Li, J. (2011). Passive mode-
locked Nd: YVO4 laser using a multi-walled carbon nanotube saturable absorber.
Laser physics, 21(8), 1382-1386.
Zhao, L. M., Tang, D. Y., Cheng, T. H., & Lu, C. (2007). Nanosecond square pulse
generation in fiber lasers with normal dispersion. Optics Communications, 272(2),
431-434. doi: http://dx.doi.org/10.1016/j.optcom.2006.11.035

144
Zhou, W., Bai, X., Wang, E., & Xie, S. (2009). Synthesis, Structure, and Properties of
Single‐Walled Carbon Nanotubes. Advanced Materials, 21(45), 4565-4583.

145
LIST OF PUBLICATIONS
Zarei, A., Jasim, A. A., Harun, S. W., & Ahmad, H. (2014). Investigation of spontaneous
Brillouin scattering generation based on non-adiabatic microfibres.Laser Physics
Letters, 11(12), 125105.
Zarei, A., Rosdin, R. Z. R. R., Ali, N. M., Ahmad, H., & Harun, S. W. (2014). Brillouin
Lasing with a Reduced Self-Pulsing Characteristic Using a Short-Length Erbium-Doped
Fiber as the Nonlinear Gain Medium. Chinese Physics Letters, 31(5), 054202.
Tiu, Z. C., Tan, S. J., Zarei, A., Ahmad, H., & Harun, S. W. (2014). Nonlinear
Polarization Rotation-Based Mode-Locked Erbium-Doped Fiber Laser with Three
Switchable Operation States. Chinese Physics Letters, 31(9), 094206.
Tiu, Z. C., Ahmad, F., Tan, S. J., Zarei, A., Ahmad, H., & Harun, S. W. (2014). Multi-
wavelength Q-switched Erbium-doped fiber laser with photonic crystal fiber and multi-
walled carbon nanotubes. Journal of Modern Optics, 61(14), 1133-1139.
Tiu, Z. C., Zarei, A., Tan, S. J., Ahmad, H., & Harun, S. W. (2014). Q-Switching Pulse
Generation with Thulium-Doped Fiber Saturable Absorber.Chinese Physics
Letters, 31(12), 124203.
Zarei, A., Tiu, Z. C., Ahmad, F., Ahmad, H., & Harun, S. W. (2015). Q-switched
Brillouin fibre laser with multi-wall carbon nanotube saturable absorber. IET
Optoelectronics, 9(2), 96-100.
Zian, C. T., Arman. Z., Sin, J. T., Harith, A., & Sulaiman, W. H. (2015). Harmonic Dark
Pulse Emission in Erbium-Doped Fiber Laser. Chinese Physics Letters, 32(3), 034203.
Z.C. Tiu, M. Suthaskumar, A. Zarei, S.J. Tan , H. Ahmad, S.W. Harun (2015).
Generation of switchable domain wall and Cubic–Quintic nonlinear Schrödinger
equation dark pulse. Optics & Laser Technology 73 127–129
Rosdin, R. Z. R. R., Zarei, A., Ali, N. M., Arof, H., Ahmad, H., & Harun, S. W. (2015,
January). Fundamental and harmonic soliton mode-locked erbium-doped fiber laser using
a single-walled carbon nanotubes embedded in poly (ethylene oxide) film saturable
absorber. In International Seminar on Photonics, Optics, and Applications 2014 (pp.
94440I-94440I). International Society for Optics and Photonics.

146
APPENDIX
A selection of published works are attached in this appendix