Development of Product Service System Modelling in SMED ...
13
JOURNAL OF MODERN MANUFACTURING SYSTEMS AND TECHNOLOGY 01 (2018) 094-106 94 ABSTRACT Development of Product Service System (PSS) in Small and Medium Enterprise Development (SMED) has been growing rapidly in the manufacturing industries. PSS is a combination between product and service in one system. Off ering a PSS in a manufacturing requires effective inventory control. However, for manufacturing company increased focus on inventory control on PSS means new challenges because PSS inventory is not only created through the physical products, but also with services. The research carried out involved proposing generic model using IDEF0 and evaluate the generic model development using Enterprise Dynamics Simulation (EDS). Development of Product Service System Modelling in SMED: The Case of Inventory Control Samsiah Suaily, Siti Zubaidah Ismail 1* INTRODUCTION Industry 4.0 is increasingly popular in manufacturing field in Malaysia. Industry 4.0 is the next step movement of development in the industry. The development toward in 4.0 can give huge opportunities for understanding sustainable manufacturing using the information and communication technology (ICT) infrastructure (Stock & Seliger, 2016). There are three things in industrial 4.0 that give benefit to human manufacturing which is mechanisation, information technology (IT) and electricity. Combine two principles which is custom manufacturing and production line manufacturing in a smart environment is the objective of Industry 4.0. Industry 4.0 have four vision and concept in manufacturing such as factory, JOURNAL OF MODERN MANUFACTURING SYSTEMS AND TECHNOLOGY Homepage: http://journal.ump.edu.my/jmmst ISSN (Online): 2636-9575 *Correspondence [email protected] +This author contributes equally to this work 1 Faculty of Manufacturing Engineering, Universiti Malaysia Pahang, 26600, Pekan, Pahang, Malaysia Keywords: PSS Inventory Control Industry 4.0 IDEF0 EDS Articles Info: Received 22 June 2018 Received in revised form 16 Aug 2018 Accepted 11 Sept 2018 Available Online 13 Sept 2018
Transcript of Development of Product Service System Modelling in SMED ...

JOURNAL OF MODERN MANUFACTURING SYSTEMS AND TECHNOLOGY 01 (2018) 094-106
94
ABSTRACT
Development of Product Service System (PSS) in Small and Medium Enterprise Development
(SMED) has been growing rapidly in the manufacturing industries. PSS is a combination
between product and service in one system. Off ering a PSS in a manufacturing requires
effective inventory control. However, for manufacturing company increased focus on
inventory control on PSS means new challenges because PSS inventory is not only created
through the physical products, but also with services. The research carried out involved
proposing generic model using IDEF0 and evaluate the generic model development using
Enterprise Dynamics Simulation (EDS).
Development of Product Service System
Modelling in SMED: The Case of Inventory
Control
Samsiah Suaily, Siti Zubaidah Ismail1*
INTRODUCTION
Industry 4.0 is increasingly popular in manufacturing field in Malaysia. Industry 4.0 is the next step movement of development in the industry. The development toward in 4.0 can give huge opportunities for understanding sustainable manufacturing using the information and communication technology (ICT) infrastructure (Stock & Seliger, 2016). There are three things in industrial 4.0 that give benefit to human manufacturing which is mechanisation, information technology (IT) and electricity. Combine two principles which is custom manufacturing and production line manufacturing in a smart environment is the objective of Industry 4.0. Industry 4.0 have four vision and concept in manufacturing such as factory,
JOURNAL OF MODERN
MANUFACTURING SYSTEMS
AND TECHNOLOGY
Homepage: http://journal.ump.edu.my/jmmst ISSN (Online): 2636-9575
*Correspondence
+This author contributes equally to this work 1 Faculty of Manufacturing Engineering, Universiti
Malaysia Pahang, 26600, Pekan, Pahang, Malaysia
Keywords: PSS
Inventory Control
Industry 4.0
IDEF0
EDS
Amet
Articles Info: Received 22 June 2018
Received in revised form
16 Aug 2018
Accepted 11 Sept 2018
Available Online 13 Sept
2018

JOURNAL OF MODERN MANUFACTURING SYSTEMS AND TECHNOLOGY 01 (2018) 094-106
95
business, product and customers. With these four, the organization will be complete and can start to operate.
Nowadays, the topic of "transition to service" by manufacturing industry have been growing in the manufacturing world. What is Product Service system (PSS)? PSS is business models that provide for delivery both of product and service in company (Piscicelli et al., 2015). PSS is increasingly popular among all manufacturing companies because it is mainly aimed at increasing the profitability and competitiveness of companies while meeting the needs of customers while minimizing environmental impact (Pan & Nguyen, 2015). One of the benefits of PSS is it can save a lot of time for manufacturing company. Besides that, it also can save cost for manufacturing company.
Inventory control PSS is the process of determining the appropriate inventory quantity, and in order to plan for efficient inventory management, the frequency of purchasing inventory and order volume so that effective inventory control mechanism and procedures can be executed (Ismail et al., 2016). There are two types of PSS inventory which is the product subsystem and the service subsystem. The challenge to this inventory is higher due to management complexity. There are difficulties and pressures for suppliers who are attempting to introduce and operate the PSS system because variables exist in subsystems due to customer's demand, use of consumer products, various uncertainties related to lack of information (Ismail et al., 2016).
Manufacturing companies face a challenge when they start the transition from product-based to product service system. All manufacturer has a trend to change to a system which is including service so that it can increase product value (Teso & Walters, 2016). In addition, depending on customer's needs and requirements such as environmental aspects and competition with other companies, the manufacturing company will change into a business model. This is to ensure all revenue and revenue sources within the company (Gaiardelli et al., 2014).
This research proposed a generic model using IDEF0. IDEF0 is an abbreviation for "Icam DEFinition for Function Modeling", ICAM stands for "Integrated Computer Aided Manufacturing. IDEF0 is a family component of IDEF modeling in software engineering and is built on the basis of Structural Analysis and Design Technique (SADT) (Press, 2001). IDEF0 is a functional modeling method for describing production functions, providing a modeling language for analysis, documenting and analyzing business processes (Pieterse, 2006).
Enterprise Dynamics Simulation is used to evaluate the generic model development. INCONTROL Simulation Solutions have been developed Enterprise Dynamics which is discrete event simulation. Enterprise Dynamics Simulation can be used to design and implement the simulation. The Enterprise Dynamics (ED) platform has many market-specific libraries to adapt to client requirements (E.Serova, 2009). Enterprise Dynamics allows to deal with resources, implementation, costs, time and safety.
METHODOLOGY
Research has been done in two stages: (1) current industry example of PSS inventory were investigated; (2) developed and validated a generic model. I Development of case study
For this project, Company A has been selected for the case study. Company A is one of the automotive companies in Malaysia. This company provide automotive parts and electronic parts to the other company. This company is located in the Selangor. This company under Original Equipment Manufacturer (OEM) which is company that produces parts and equipment that be sold by other manufacturer. This company established in 1992. It has four factories in industrial hub in Malaysia. Besides that, it providing industrial product design and development, mould fabrication, injection moulding, painting and assembly. In this company, it fabricates 150 types of part from different company. It has 30 main customers, and the customers not only in Malaysia but also in Europe, South America and across Asia. II (a) Development of generic model
IDEF0 is an abbreviation for "Icam DEFinition for Function Modeling", ICAM stands for "Integrated Computer Aided Manufacturing. IDEF0 is a family component of IDEF modeling in software engineering and is built on the basis of Structural Analysis and Design Technique (SADT) (Press, 2001). IDEF0 is one of the graphical languages known as structured analysis and design techniques. IDEF0 (function modelling method) can be used to design a model the activities of a manufacturing organization. The IDEF0 modelling method can be used as an analysis for another system.
As an analytical tool, IDEF0 can help to identifying the functions performed in the software. The IDEF0 tools have been widely used in the manufacturing field because it is easy to use. Function or activity

JOURNAL OF MODERN MANUFACTURING SYSTEMS AND TECHNOLOGY 01 (2018) 094-106
96
box placed at the center. Inputs are indicated by arrows on the left side of the activity box and outputs are shown as arrows going out on the right side of the box. Controls are indicated by arrows at the top of the box and mechanisms are displayed as arrows arriving from the bottom of the box. Figure 3.1 shows an IDEF0 model diagram.
The IDEF0 model's box represents the boundary line drawn around the activity. This
organizational strategy is also useful for hiding unnecessary complexity so that a deeper understanding is required as shown in Figure 3.2. IDEF0 is very useful in the context of manufacturing because it allows for the creation of a consistent multilevel model. This multi-tiered model displays only the main breakdown of more detailed activities, which are the main causes of the main activities, from more general ones.
II (b) Validation of generic model
Enterprise Dynamics Simulation (EDS) is a simulation software platform to help and support modeling and analyzing every problem. In addition, Enterprise Dynamics (ED) is a comprehensive enterprise simulation software platform that provides a configurable, scalable, easy-to-use simulation environment. Excellent simulation software platform not only provides powerful modeling capabilities and superior visualization capabilities, it also offers the potential for reuse of pre-modeled models, models and component segments.
Figure 3.1: IDEF0 model diagram
Figure 3.2: Organizational Strategic for IDEF0

JOURNAL OF MODERN MANUFACTURING SYSTEMS AND TECHNOLOGY 01 (2018) 094-106
97
Enterprise Dynamics is a solution to solve many challenges related to people, processes, technologies, and infrastructure using data driven answers in most applications for commercial, government, education, and industrial applications Sophisticated modular objectoriented simulation platform. Enterprise Dynamics provides a wide range of simulation object libraries, specialized branches. The purpose of flexible and perfect simulation is to provide users with the ability to express simple and complex processes and systems.
RESULTS AND DICUSSIONS
Although the company does not provide customer service, after-sales service, product maintenance, it does provide integrated product design and development services into the finished product from the original idea. In addition, the company provides a technical platform for research and development of products, supports product design and concept proof. Lastly, this company also provides services such as intensive training (design) CATIA and CAE for anyone interested in learning. They also provide service rent software (design) to everyone. All of these services will be managed by the company.
The main market of Company A is manufactured in advance, which can be divided into three major submarkets. There are three main sub-markets at the main level, the first one is design and fabrication including product design, parts design, mould design, mould fabrication and product fabrication. This means that company A will carry out the detailed design parts and designs moulds according to specifications required by customers and makes moulds. After that the production of the product is done by the company. The second is mould and product fabrication. That is, the customer provides all the detailed designs to form the product and parts, and the company A only fabricates simply the mould and the product for the customer.
The third is the manufacture of products. That is, Company A constitutes only the product, and the customer provides all the products except materials for the injection moulding and fabrication machine. The secondary market provides a technology platform for research and development of products, but it supports product design and concept proof. Each technical platform has technical personnel specializing in fields and related machines to support customers. However, customers cannot operate the machine by themselves. All products require different types of moulds as customer based production orders.
For automotive parts, there are some complexities that happen in the company. This is because it involves many companies and requires many parts to be produced. Because of the demand for the ordering products is higher, the probability of a finished product in the time set is hard. All the factors involved were reviewed in inventory control at the company. The problem involves is process tracing and tracking. This problem has caused the Enterprise Resource Planning (ERP) process to run is not good. One of the workers were interviewed and asked some questions related to the problem. I Generic Model
The model can come in many shapes, sizes and styles. It is important to emphasize that the model is not a real world, it only builds people to help us understand the real world system. The generic data model is a generalization of traditional data models. They define a standardized common relationship, together with the kinds of things that may be related by such a relation type. Figure 4.1 shows a generic model of Company A.
The processes that involved in the production line is painting area, material storage, injection moulding, sub assembly area, finished goods, inspection, warehouse and loading bay, customer and vendor. Each process connected each other and in between process will have inventory control. Painting area is not connected to another because it is still in progress and it is still not working. Painting is a practice of applying paint, pigment, colour or other medium to a solid surface (support). Painting area is needed for painting the product so that the product looks attractive and beautiful.
The production line will start with material storage containing raw materials. The storage of important materials and stores is a part for keeping all parts raw materials to producing partial or complete assemblies. Employees can easily find the raw materials because they use a pallet storage system by labelling. The main raw material of this production is polypropylene (PP). Polypropylene (PP), also known as polypropene, is a thermoplastic polymer used for various applications. It is an additional polymer made from propylene monomers and has various attractive structures including packaging and labelling, textiles, plastic parts and various types of reusable containers, laboratory equipment, automotive parts and medical equipment can be produced. Polypropylene is a mechanically rough white material and holds many chemical solvents, bases and acids.

JOURNAL OF MODERN MANUFACTURING SYSTEMS AND TECHNOLOGY 01 (2018) 094-106
98
Then the polypropylene (PP) will go into the injection molding machine to be processed. An
injection moulding machine (BrE injection moulding machine) also known as an injection press machine is a machine for manufacturing plastic products in an injection molding process. It consists of two main parts, an injection unit and a clamping unit. For the production of this company, there are 27 machines in the injection molding division, each machine is operated by operator and produces parts from both thermoplastic material and plastic thermosetting resin. In one period, each machine injects various types of products based on customer's order.
The product from the injection moulding machine will go either to the sub assembly area or to the vendor. A subassembly is a collection of integral parts as a unit for use in the manufacture of larger assemblies or final items or more items. But at some point, it may be a subassembly at another. Sub assembly area is needed to assembly the product. In the assembly area, other raw materials received from the vendor will be combined together with the product produced from the injection moulding machine through the fastening process. A vendor or supplier is a term of chain supply management and means any person who provides goods or services to a company or individual. Vendors often issue stocks and sell their goods to customers. For this operation, vendor will go to the sub assembly area to supply another type of raw material and it also will go to the finish good process.
After the product comes out of the finish department, the product will go to the inspection department. In manufacturing field testing includes measure, inspect, test or measure the characteristics of one or more products or processes, compare the results with specific requirements, determine whether the requirements of each function are met. Inspection process is very important for all factories because the workers will do the testing process to the product. Based on the testing result, it will determine whether the product can be used or not. It may be necessary to revise the workstation as part of the process path, or it may be necessary to rework due to defects identified during the inspection. After the product has been inspected, the product will go to the warehouse department.
In the warehouse department, these products will be placed separately based on the orders received from different customers. Warehouse is a commercial building to store goods. Warehouses are used by manufacturers, importers, exporters, wholesalers, freight forwarders and customs brokers. They are usually large common buildings in industrial areas. After the warehouse process, the product will proceed to the loading bay process which will provide the product to be sent to the customer. A loading dock or a loading bay is an area of a building where goods vehicles (usually roads or trains) are loaded and unloaded. They are usually found in commercial and industrial buildings, especially in warehouses. These are part of the service infrastructure or utility facility and usually have direct access to the playground, storage room and transport lift. Lastly, the product is delivered to the customer. Each process procedure operates at the factory or consigned to the supplier.
The last process is from the customer to the services. This service is a change in the state of a product unit caused by the activities of several other economic units, based on the previous agreement with the previous person or economic unit. For this company, there are three main services which is the first
Figure 4.1: Generic Model of Company A

JOURNAL OF MODERN MANUFACTURING SYSTEMS AND TECHNOLOGY 01 (2018) 094-106
99
one is customer complaints. Complaints such as defective products and non-functional products received from customer will be send to the quality control department for check. The results from the quality control will determine whether the product can still be used or not. If the product undergoes a permanent defect, the product will be reinserted into the injection molding machine. Like integrated product design and integration services, the company provides this service from the first idea to a finished product including an injection molding machine for processing. Lastly, service provided by the company is provide training using CATIA and CAE. This service is typical for anyone who is interested in learning using CATIA and CAE software. They also provide service rent software (design) to everyone. II IDEF0 IDEF0 is a method designed to model decisionmaking, behavior, organizational or system activity. IDEF0 comes from a stable graphical language. IDEF0 cosists of 4 factors namely input, control, mechanism and output. Figure 4.2 shows an IDEF0 of Company A. The process that involved in this company is check machine and labour resources, check production inventory, generate production schedule and production plan and issue work order and documents. Mostly this process is same like all production company because it will start with work order from customers and finish it with production plans. Production planning is the planning of manufacturing and manufacturing of modules within the company or industry. It utilizes allocation of worker resources, materials and production capacity to provide services to different customers.
Figure 4.2: IDEF0 for Company A

JOURNAL OF MODERN MANUFACTURING SYSTEMS AND TECHNOLOGY 01 (2018) 094-106
100
First process in Company A is check machine and labour resources. The input for this process is work order that received from customer. After work order is received to the company, the production section will check the machine to be used and check the amount of labor required to complete the order. The control or factor that constrain this process is demand from customer. This is because all customers have their demand on the product so the company needs to fulfill the request so that there is no complaint from the customer. Besides that, the capacity of the product to be completed also a key factor in this process. This is because the company has to prepare all the products within a certain period of time. Mechanism that involved in this process are ICT support and employees. All mechanisms used to perform this process so that the process can runs smoothly. Lastly, the output for this process is inventory requirements and production requirements. For inventory requirements, it will go to the next process which is check production inventory and for the production requirement, it will go to the generate production schedule and production plan.
Second process in Company A is check production inventory. The input for this process is inventory requirements. Inventories or stocks are goods and materials owned by companies for resale. The company will check inventory requirements first before starting the next process. This is to prevent the occurrence of excessive product. The control or factor that constrain the process is inventory policies and inventory level. The company must know about the policy of the inventory and level of the inventory so it does not prevent the process. Mechanism that involved in this process are ICT support and employees. All company need ICT support because it will provide all the data for example order from customer. Besides that, ICT support also important to the company because it will save data of the company. Lastly, the output for this process is orders to suppliers, schedule service, inventory information and material requisition. The company will order to suppliers if the materials required to make the product inadequate. The company will also make a schedule of service so that the product can be set up within the set time period. For inventory information, it will go to the next process which is generate production schedule and production plan and for the material requisition, it will go to the issue work order and documents.
Third process in Company A is generate production schedule and production plan. The input in this process is production requirements and inventory information. The company needs to know the production requirements in order to control the amount of production to be prepared. Besides that, inventory information is very important because it needs to be known by the company to avoid excessive product yield. The control or factor that constrain the process is shop floor calendars and equipment to produce the product. Shop floor calendar in the company is very important so that the workers alert with the due date of the production. The company must provide the necessary equipment to complete the product so that the workers have no reason not to complete customer orders. Mechanism that involved in this process are ICT support and employees. The importance of ICT support and employees in the company is very high as it will help companies to develop. The output for this process is material production schedule. For the material production schedule, it will go to the issue work order and documents.
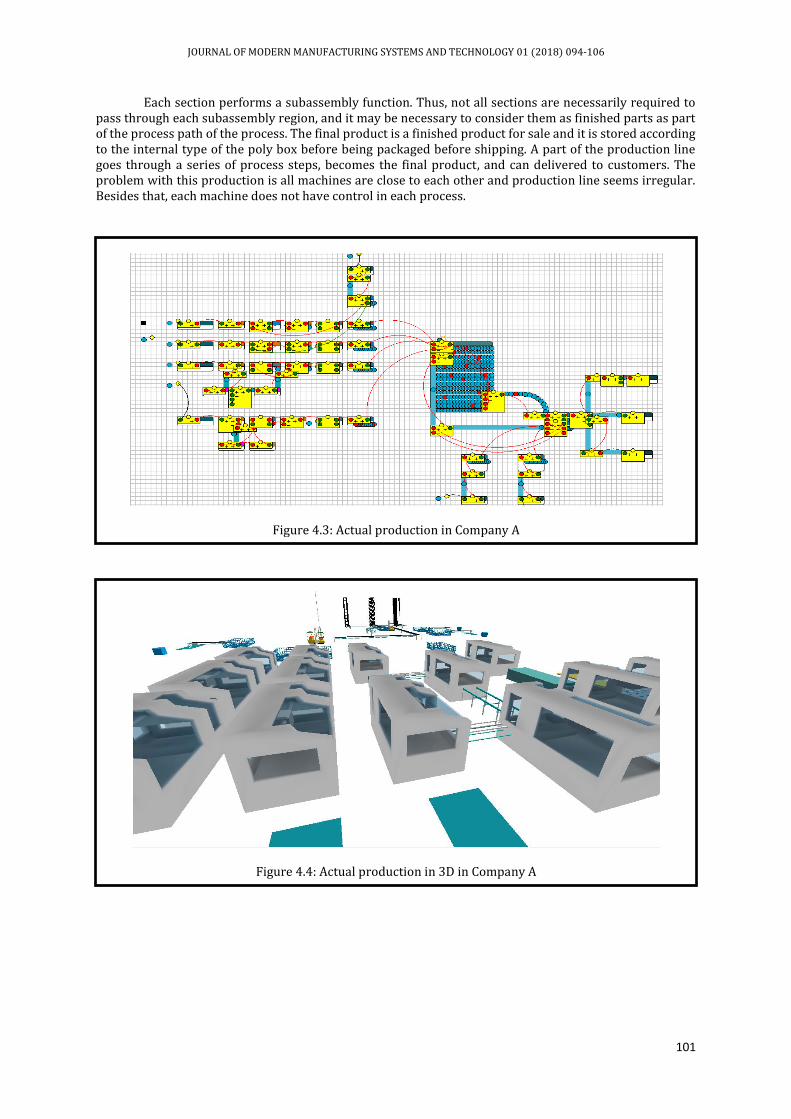
Last process in Company A is issue work order and documents. The input for this process is material requisition and material production schedule. Materials are very important in the manufacture of products. The company should concentrate heavily on requisition material such as choosing suppliers who will supply quality material. The company also needs to create a material production schedule so that workers can see the amount of material to be used. The control or factor that constrain the process is standardize work processes. Standardize work processes are very important in the company, as it is to ensure that all work processes are in order. Mechanism that involved in this process are ICT support and employees. This mechanism was the same as the previous process. The output for this process is production plans. The company needs to make production plans so that all production can be done properly. III Actual production in 2D in Company A Based on the figure below, this is an actual production line in Company A that contains injection moulding, material storage, sub assembly area and finished goods. Figure 4.3 is the actual production using EDS simulation in 2D while figure 4.4 is the actual production using EDS simulation in 3D. There are 27 machines in the injection molding section, and each machine is operated by one worker. There are two subassembly areas, each subassembly area divided into five sections. Each section runs different processes and departments within a certain time period.
JOURNAL OF MODERN MANUFACTURING SYSTEMS AND TECHNOLOGY 01 (2018) 094-106
101
Each section performs a subassembly function. Thus, not all sections are necessarily required to pass through each subassembly region, and it may be necessary to consider them as finished parts as part of the process path of the process. The final product is a finished product for sale and it is stored according to the internal type of the poly box before being packaged before shipping. A part of the production line goes through a series of process steps, becomes the final product, and can delivered to customers. The problem with this production is all machines are close to each other and production line seems irregular. Besides that, each machine does not have control in each process.
Figure 4.3: Actual production in Company A
Figure 4.4: Actual production in 3D in Company A

JOURNAL OF MODERN MANUFACTURING SYSTEMS AND TECHNOLOGY 01 (2018) 094-106
102
IV Analysis Data
Based on the data above, all this data taken for 8 hours. This data divided into three parts namely content, throughput and staytime. Content is divided into two parts, current data and average data. The throughput is also divided into two data input and output data, and the staying time has only average data. For this data, the same product named product1 is used. There are 4 lines in this data, which is 1st line, 2nd line, 3rd line, 4th line. All lines had the same process which is starting with raw material and ending with quality control (QC). The amount of each raw material in the 4 lines were different, the amount of raw material increased in the first 3 lines but decreased in the 4th line. Input for loading bay process was 2605 but decreased to 1205. This reduction of all process was 1400. Input for warehouse was 3244 and decreased at output which is 2619. Line 1 (Throughput)
Input and output for raw materials same which is 100. Input and output for injection moulding process also same which is 100 which means all products are in good condition. Input for assembly process was 2134 while at output was 2133 which means there is 1 defect product. Input in finished good (FG) process was 2133 while output in FG process was 2132 which means there is 1 defect product. Quality control (QC) process decreased by 10 from 641 to 631. Line 2 (Throughput)
Input and output for raw materials same which is 1755. Input for injection moulding process was 1755 and output for this process was 1754 which means there is 1 defect product. Input for assembly process was 1754 while at output was 1753 which means there is 1 defect product. Input in finished good (FG) process was 1753 while output in FG process was 1752 means there is 1 defect product. Quality control (QC) process in line 2 also decreased by 10 from 640 to 630. Line 3 (Throughput)
Input and output for raw materials same which is 1858. Input for injection moulding process was 1858 and output for this process was 1857 which means there is 1 defect product. Input in finished good (FG) process was 1849 while output in FG process was 1848 means there is 1 defect product. Quality control (QC) process in line 3 also decreased by 10 from 427 to 417. Line 4 (Throughput)
Input and output for raw materials same which is 1630. Input for injection moulding process was 1630 and output for this process was 1629 which means there is 1 defect product. Input in finished good (FG) process was 1628 while output in FG process was 1628 means there is no defect product. Quality control (QC) process in line 4 also decreased by 10 from 425 to 415.
Figure 4.5: Result of the Actual Production Line
JOURNAL OF MODERN MANUFACTURING SYSTEMS AND TECHNOLOGY 01 (2018) 094-106
103
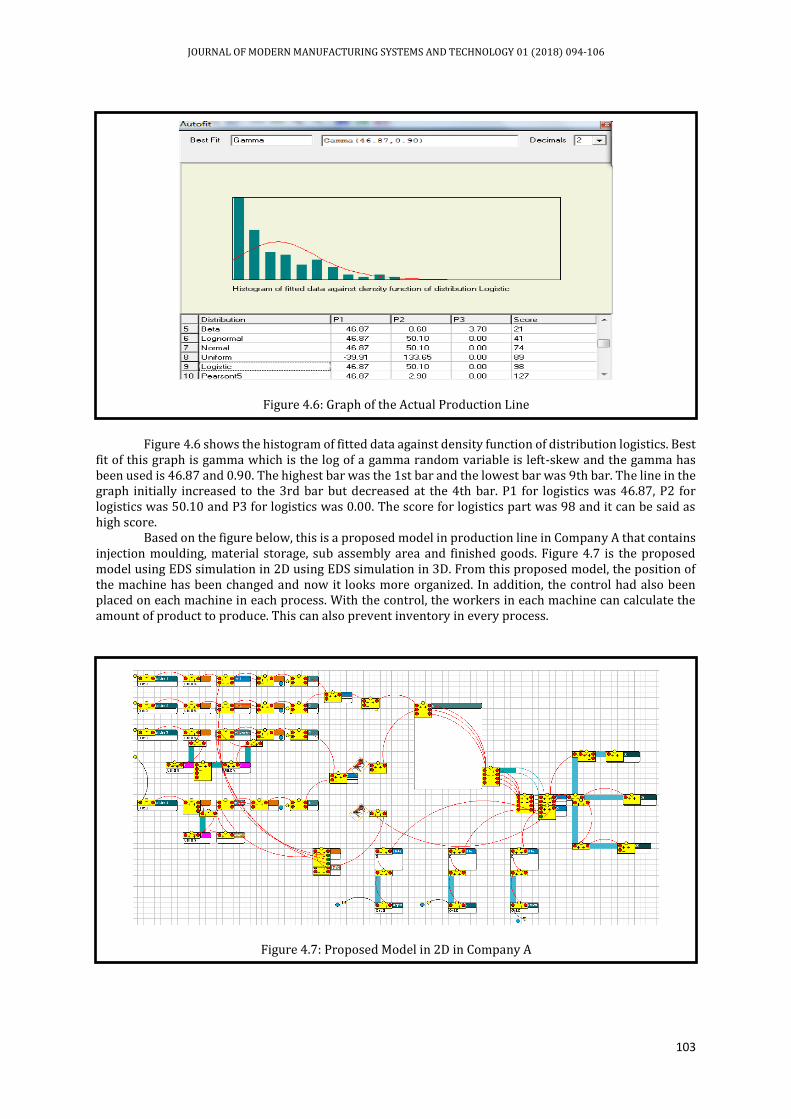
Figure 4.6 shows the histogram of fitted data against density function of distribution logistics. Best fit of this graph is gamma which is the log of a gamma random variable is left-skew and the gamma has been used is 46.87 and 0.90. The highest bar was the 1st bar and the lowest bar was 9th bar. The line in the graph initially increased to the 3rd bar but decreased at the 4th bar. P1 for logistics was 46.87, P2 for logistics was 50.10 and P3 for logistics was 0.00. The score for logistics part was 98 and it can be said as high score.
Based on the figure below, this is a proposed model in production line in Company A that contains injection moulding, material storage, sub assembly area and finished goods. Figure 4.7 is the proposed model using EDS simulation in 2D using EDS simulation in 3D. From this proposed model, the position of the machine has been changed and now it looks more organized. In addition, the control had also been placed on each machine in each process. With the control, the workers in each machine can calculate the amount of product to produce. This can also prevent inventory in every process.
Figure 4.6: Graph of the Actual Production Line
Figure 4.7: Proposed Model in 2D in Company A

JOURNAL OF MODERN MANUFACTURING SYSTEMS AND TECHNOLOGY 01 (2018) 094-106
104
Based on the data above, all this data taken for 8 hours. This data divided into three parts namely content, throughput and stay time. Content is divided into two parts, current data and average data. The throughput is also divided into two data input and output data, and the staying time has only average data. For this data, the same product named product1 is used. There are 4 rows in this data, which is 1st line, 2nd line, 3rd line, 4th line. All lines had the same process which is starting with raw material and ending with quality control (QC). The amount of each raw material in the 4 lines were different, the amount of raw material increased in the first 3 lines but decreased in the 4th line. Input for loading bay process was 2136 but decreased to 1205. This reduction of all process was 931. Input and output for warehouse same which is 2136. Line 1 (Throughput)
Input and output for raw materials same which is 100. Input and output for injection moulding process also same which is 100 which means there is no defect product. Input and output for assembly process also same which is 100. Input in finished good (FG) process was 100 while output in FG process was 100 which means all products are in good condition. Quality control (QC) process also had the same value for input and output which is 100. Line 2 (Throughput)
Input and output for raw materials same which is 1726. Input for injection moulding process was 1726 and output for this process was 1725 which means there is 1 defect product. Input for assembly process was 1725 while at output was 1724 which means there is 1 defect product. Input in finished good (FG) process was 1724 while output in FG process was 1724 means there is no defect product. Quality control (QC) process in line 2 decreased by 100 from 1402 to 1302. Line 3 (Throughput)
Input and output for raw materials same which is 1825. Input for injection moulding process was 1825 and output for this process was 1824 which means there is 1 defect product. Input in finished good (FG) process was 1815 while output in FG process was 1814 means there is 1 defect product. Quality control (QC) process in line 3 decreased by 100 from 936 to 836. Line 4 (Throughput)
Input for raw material was 1685 while the output for raw material was 1684 which means there 1 of defect raw material. Input for injection moulding process was 1684 and output for this process was 1683 which means there is 1 defect product. Input in finished good (FG) process was 1680 while output in FG process was 1679 means there is 1 defect product.
Figure 4.8: Result of the Proposed Model

JOURNAL OF MODERN MANUFACTURING SYSTEMS AND TECHNOLOGY 01 (2018) 094-106
105
Figure 4.9 shows the histogram of fitted data against density function of distribution logistics. Best fit of this graph is lognormal which is the log of a lognormal random variable is normal and the lognormal has been used is 48.98 and 40.66. The highest bar was the 3th bar and the lowest bar was 13th bar. The line in the graph initially increased to the 5th bar but decreased at the 6th bar. P1 for logistics was 48.98, P2 for logistics was 40.66 and P3 for logistics was 0.00. The score for logistics part is 74 and it lower than the actual production.
CONCLUSIONS As a conclusion, half of the project's objectives are achieved. From the result, we can see that the
difference between two graph which is in the difference between logistics. Logistics score in the actual graph is 98 while the logistics score in the proposed graph is 74. From the logistics score of both results, the improvement we get is as much as 24. With that improvement, there are many advantages that we can get such as the time used for the logistics part can be reduced.
REFERENCES
[1] Piscicelli, L., Cooper, T., & Fisher, T. (2015). The role of values in collaborative consumption: Insights from a product-service system for lending and borrowing in the UK. Journal of Cleaner Production, 97, 21–29. http://doi.org/10.1016/j.jclepro.2014.07.032
[2] Pan, J. N., & Nguyen, H. T. N. (2015). Achieving customer satisfaction through product-service systems. European Journal of Operational Research, 247(1), 179–190. http://doi.org/10.1016/j.ejor.2015.05.018
[3] Ismail, S. Z., Harding, J. A., & Morton, S. C. (2016). Pss and inventory control: Provision in the uk manufacturing case study. In Proceedings of the International Conference on Industrial Engineering and Operations Management (Vol. 8–10 March).
[4] Teso, G., & Walters, A. (2016). Assessing Manufacturing SMEs’ Readiness to Implement Service Design. In Procedia CIRP (Vol. 47, pp. 90–95). http://doi.org/10.1016/j.procir.2016.03.063
[5] Gaiardelli, P., Resta, B., Martinez, V., Pinto, R., & Albores, P. (2014). A classification model for product-service offerings. Journal of Cleaner Production, 66, 507–519. http://doi.org/10.1016/j.jclepro.2013.11.032
[6] Stock, T., & Seliger, G. (2016). Opportunities of Sustainable Manufacturing in Industry 4.0. In Procedia CIRP (Vol. 40, pp. 536–541). http://doi.org/10.1016/j.procir.2016.01.129
[7] Dilberoglu, U. M., Gharehpapagh, B., Yaman, U., & Dolen, M. (2017). The Role of Additive Manufacturing in the Era of Industry 4.0. Procedia Manufacturing, 11, 545–554. http://doi.org/10.1016/j.promfg.2017.07.148
Figure 4.9: Graph of the Proposed Model

JOURNAL OF MODERN MANUFACTURING SYSTEMS AND TECHNOLOGY 01 (2018) 094-106
106
[8] Grieco, A., Caricato, P., Gianfreda, D., Pesce, M., Rigon, V., Tregnaghi, L., & Voglino, A. (2017). An Industry 4.0 Case Study in Fashion Manufacturing. Procedia Manufacturing, 11, 871–877. http://doi.org/10.1016/j.promfg.2017.07.190
[9] Qin, J., Liu, Y., & Grosvenor, R. (2016). A Categorical Framework of Manufacturing for Industry 4.0 and beyond. In Procedia CIRP (Vol. 52, pp. 173–178). http://doi.org/10.1016/j.procir.2016.08.005
[10] Tupa, J., Simota, J., & Steiner, F. (2017). Aspects of Risk Management Implementation for Industry 4.0. Procedia Manufacturing, 11, 1223–1230. http://doi.org/10.1016/j.promfg.2017.07.248
[11] Poonpakdee, P., Koiwanit, J., & Yuangyai, C. (2017). Decentralized Network Building Change in Large Manufacturing Companies towards Industry 4.0. In Procedia Computer Science (Vol. 110, pp. 46–53). http://doi.org/10.1016/j.procs.2017.06.113
[12] Lee, J., Bagheri, B., & Kao, H. A. (2015). A Cyber-Physical Systems architecture for Industry 4.0-based manufacturing systems. Manufacturing Letters, 3, 18– 23. http://doi.org/10.1016/j.mfglet.2014.12.001
[13] Nishino, N., Wang, S., Tsuji, N., Kageyama, K., & Ueda, K. (2013). Five models of platform-type product service systems in manufacturing. In Procedia CIRP (Vol. 7, pp. 389–394). http://doi.org/10.1016/j.procir.2013.06.004
[14] Li, M., Cao, X., Wang, L., & Deng, L. (2016). The product service lifecycle management based on sustainable development. In Proceedings - 2016 IEEE International Conference on Service Operations and Logistics, and Informatics, SOLI 2016. http://doi.org/10.1109/SOLI.2016.7551687
[15] Wolfenstetter, T., Bohm, M., Krcmar, H., & Brundl, S. (2015). Why product service systems development is special. International Conference on Industrial Engineering and Systems Management (IESM), (October), 1221–1228. http://doi.org/10.1109/IESM.2015.7380308
[16] Belkadi, F., Zhang, Y., Irazusta, L. U., Maleki, E., Bernard, A., & Koukas, S. (2017). PSS Pattern Concept for Knowledge Representation in Design Process of Industrial Product-service Systems. In Procedia CIRP (Vol. 60, pp. 428–433). http://doi.org/10.1016/j.procir.2017.01.001
[17] Nishino, N., Wang, S., Tsuji, N., Kageyama, K., & Ueda, K. (2012). Categorization and mechanism of platform-type product-service systems in manufacturing. CIRP Annals - Manufacturing Technology, 61(1), 391–394. http://doi.org/10.1016/j.cirp.2012.03.053