DEVELOPMENT OF OEE ERROR-PROOF (OEE-EP) ODEL FOR ...
16
The Journal of Engineering Research (TJER), Vol. 17, No. 2, (2020) 59-74 *Corresponding author’s e-mail: [email protected] DOI:10.24200/tjer.vol17iss2pp59-74 DEVELOPMENT OF OEE ERROR-PROOF (OEE-EP) MODEL FOR PRODUCTION PROCESS IMPROVEMENT B. Kareem a, * , A.S. Alabi a , T.I. Ogedengbea, B.O. Akinnuli a , O.A. Aderoba b , and M.O. Idris c a Mechanical Engineering, Federal University of Technology, Akure, Nigeria b Mechatronics Engineering, Federal University of Oye-Ekiti, Ikole Campus, Nigeria c Mechanical Engineering, Osun State University, Osogbo Campus, Nigeria ABSTRACT: The global demand for effective utilization of both humans and machinery is increasing due to wastage incurred during product manufacturing. Excessive waste generation has made entrepreneurs find it difficult to breakeven. The development of dynamic error-proof Overall Equipment Effectiveness (OEE) model for optimizing a complex production process is targeted at minimizing/eradicating operational wastes/losses. In this study, the error-proof sigma metric was integrated into the extended traditional OEE factors (availability, performance, quality) to include losses due to waste and man-machine relationships. Error-proof sigma statistics enabled continuous corrective measures on unsatisfactory or low-level OEE resulted from process output variations (quantity delivered or expected), which were mapped into sigma statistical standards (one- to six- sigma). Application of the model in a processing company showed that errors of the process were reduced by 78% and 42% respectively for traditional OEE and the new Error-Proof OEE (OEE-EP). The results revealed that the OEE-EP model is better than the other existing schemes in terms of losses elimination in the production process. Keywords: OEE dynamism; Sigma metric; Process integration; Productivity. ﺗﻄﻮﯾﺮ ﻧﻤﻮذج ﺗﺠﻨﺐ اﻷﺧﻄﺎء اﻟﺪﯾﻨﺎﻣﯿﻜﯿﺔ اﻟﻤﺘﻌﻠﻘﺔ ﺑﺎﻟﻔﻌﺎﻟﯿﺔ اﻟﻌﺎﻣﺔ ﻟﻠﻤﻌﺪات ﻟﺘﺤﺴﯿﻦ ﻋﻤﻠﯿﺔ اﻹﻧﺘﺎج ب. ﻛﺮﯾﻢ، أ. أ ﻻﺑﻲ، ت. أوﺟﯿﻨﺠﺒﻲ، ب. أ ﻛﯿﻨﻮﻟﻲ، و. أ دﯾﺮوﺑﺎ و م. إدرﯾﺲ اﻟﻤﻠﺨﺺ: ﻟﻠﮭﺪر اﻟﺬي ﯾﺤﺪث أﺛﻨﺎء ﻋﻤﻠﯿﺔ اﻟﺘﺼﻨﯿﻊ ﺣﯿﺚً ﯾﺘﺰاﯾﺪ اﻟﻄﻠﺐ اﻟﻌﺎﻟﻤﻲ ﻋﻠﻰ اﻻﺳﺘﺨﺪام اﻟﻔﻌﺎل ﻟﻠﻘﻮى اﻟﻌﺎﻣﻠﺔ واﻵﻻت ﺗﺠﻨﺒﺎ ﯾﺼﻌﺐ اﻟﺘﻮﻟﯿﺪ اﻟﻤﻔﺮط ﻟﻠﻨﻔﺎﯾﺎت ﻣﻦ ﻋﻤﻠﯿﺔ ﺗﺤﻘﯿﻖ ﻧﺘﺎﺋﺞ ﺗﺼﻨﯿﻌﯿﺔ ﻣﺮﺿﯿﺔ. ﯾﺴﺘﮭﺪف ﺗﻄﻮﯾﺮ ﻧﻤﻮذج ﺗﺠﻨﺐ اﻷﺧﻄﺎء اﻟﺪﯾﻨﺎﻣﯿﻜﯿﺔ اﻟﻤﺘﻌﻠﻘﺔ ﺑﺎﻟﻔﻌﺎﻟﯿﺔ اﻟﻌﺎﻣﺔ ﻟﻠﻤﻌﺪات ﺗﺤﻘﯿﻖ اﻻﺳﺘﻔﺎدة اﻟﻤﺜﻠﻰ ﻣﻦ ﻋﻤﻠﯿﺔ اﻹﻧﺘﺎج اﻟﻤﻌﻘﺪة ﻋﻦ طﺮﯾﻖ ﺗﻘﻠﯿﻞ اﻟﻨﻔﺎﯾﺎت و اﻟﺨﺴﺎﺋﺮ اﻟﺘﺸﻐﯿﻠﯿﺔ إﻟﻰ أدﻧﻰ ﺣﺪ ﻣﻤﻜﻦ. اﺳﺘﺨﺪم ﻓﻲ ھﺬه اﻟﺪراﺳﺔ ﻗﯿﺎس ﺳﯿﺠﻤﺎ اﻟﻤﻘﺎوم ﻟﻠﺨﻄﺄ ﻻﺧﺘﺒﺎر اﻟﻌﻮاﻣﻞ اﻟﻤﺆﺛﺮة ﻓﻲ ﻧﻈﺎم اﻟﻔﻌﺎﻟﯿﺔ اﻟﻌﺎﻣﺔ ﻟﻠﻤﻌﺪات ﻟﺘﻀﻤﯿﻦ اﻟﺨﺴﺎﺋﺮ اﻟﻨﺎﺟﻤﺔ ﻋﻦ اﻟﻨﻔﺎﯾﺎت واﻟﻌﻼﻗﺔ ﺑﯿﻦ اﻹﻧﺴﺎن واﻵﻟﺔ. أﺗﺎﺣﺖ إﺣﺼﺎﺋﯿﺎت ﺳﯿﺠﻤﺎ اﻟﻤﺘﻌﻠﻘﺔ(اﻟﺘﻮﻓﺮ واﻷداء واﻟﺠﻮدة) أو ﻣﻨﺨﻔﺾ ﻣﻦ ﻧﻈﺎم اﻟﻔﻌﺎﻟﯿﺔ اﻟﻌﺎﻣﺔ ﻟﻠﻤﻌﺪات ﻧﺘﯿﺠﺔٍ ﺮضُ ﺑﺘﺠﻨﺐ اﻷﺧﻄﺎء اﺗﺨﺎذ إﺟﺮاءات ﺗﺼﺤﯿﺤﯿﺔ ﻣﺴﺘﻤﺮة ﻋﻠﻰ ﻣﺴﺘﻮى ﻏﯿﺮ ﻣ ﻟﻼﺧﺘﻼﻓﺎت ﻓ) ، واﻟﺘﻲ ﺗﻢ ﺗﻌﯿﯿﻨﮭﺎ إﻟﻰ ﻣﻌﺎﯾﯿﺮ إﺣﺼﺎﺋﯿﺔ ﻟﻠﺴﯿﺠﻤﺎ(اﻟﻜﻤﯿﺔ اﻟﺘﻲ ﺗﻢ ﺗﺴﻠﯿﻤﮭﺎ أو اﻟﻤﺘﻮﻗﻌﺔ) ﻲ ﻧﺎﺗﺞ اﻟﻌﻤﻠﯿﺔ1 - 6 .( ﺳﯿﺠﻤﺎ وﻗﺪ أظﮭﺮ ﺗﻄﺒﯿﻖ اﻟﻨﻤﻮذج ﻓﻲ إﺣﺪى اﻟﺸﺮﻛﺎت اﻟﻤﻌﺎﻟﺠﺔ أن أﺧﻄﺎء اﻟﻌﻤﻠﯿﺔ اﻧﺨﻔﻀﺖ ﺑﻨﺴﺒﺔ78 و% 42 ﻋﻠﻰ اﻟﺘﻮاﻟﻲ ﺑﺎﻟﻨﺴﺒﺔ% ﻟﻨﻈﺎم اﻟﻔﻌﺎﻟﯿﺔ اﻟﻌﺎﻣﺔ ﻟﻠﻤﻌﺪات اﻟﺘﻘﻠﯿﺪي و اﻟﻨﻤﻮذج اﻟﺠﺪﯾﺪ ﻟﻨﻈﺎم ﺗﺠﻨﺐ اﻷﺧﻄﺎء اﻟﺪﯾﻨﺎﻣﯿﻜﯿﺔ اﻟﻤﺘﻌﻠﻘﺔ ﺑﺎﻟﻔﻌﺎﻟﯿﺔ اﻟﻌﺎﻣﺔ ﻟﻠﻤﻌﺪات. وﻛﺸﻔﺖ اﻟﻨﺘﺎﺋﺞ أن ﻧﻤﻮذج ﺗﺠﻨﺐ اﻷﺧﻄﺎء اﻟﺪﯾﻨﺎﻣﯿﻜﯿﺔ اﻟﻤﺘﻌﻠﻘﺔ ﺑﺎﻟﻔﻌﺎﻟﯿﺔ اﻟﻌﺎﻣﺔ ﻟﻠﻤﻌﺪات أﻓﻀﻞ ﻣﻦ اﻟﻤﺨﻄﻄﺎت اﻷﺧﺮى ﻣﻦ ﺣﯿﺚ اﻟﺘﺨﻠﺺ ﻣﻦ اﻟﺨﺴﺎﺋﺮ ﻓﻲ ﻋﻤﻠﯿﺔ اﻹﻧﺘﺎج. اﻟﻜﻠﻤﺎت اﻟﻤﻔﺘﺎﺣﯿﺔ: دﯾﻨ ﺎﻣﯿﻜﯿﺔ اﻟﻔﻌﺎﻟﯿﺔ اﻟﻌﺎﻣﺔ ﻟﻠﻤﻌﺪات؛ ﻣﻘﯿﺎس ﺳﯿﺠﻤﺎ؛ ﺗﻜﺎﻣﻞ اﻟﻌﻤﻠﯿﺔ ؛ اﻹﻧﺘﺎﺟﯿﺔ.
Transcript of DEVELOPMENT OF OEE ERROR-PROOF (OEE-EP) ODEL FOR ...
The Journal of Engineering Research (TJER), Vol. 17, No. 2, (2020) 59-74
*Corresponding author’s e-mail: [email protected]
DOI:10.24200/tjer.vol17iss2pp59-74
DEVELOPMENT OF OEE ERROR-PROOF (OEE-EP) MODEL FOR PRODUCTION PROCESS IMPROVEMENT
B. Kareema, *
, A.S. Alabia, T.I. Ogedengbea, B.O. Akinnuli
a, O.A. Aderoba
b , and M.O. Idris
c
aMechanical Engineering, Federal University of Technology, Akure, Nigeria b Mechatronics Engineering, Federal University of Oye-Ekiti, Ikole Campus, Nigeria
c Mechanical Engineering, Osun State University, Osogbo Campus, Nigeria
ABSTRACT: The global demand for effective utilization of both humans and machinery is increasing due to wastage incurred during product manufacturing. Excessive waste generation has made entrepreneurs find it difficult to breakeven. The development of dynamic error-proof Overall Equipment Effectiveness (OEE) model for optimizing a complex production process is targeted at minimizing/eradicating operational wastes/losses. In this study, the error-proof sigma metric was integrated into the extended traditional OEE factors (availability, performance, quality) to include losses due to waste and man-machine relationships. Error-proof sigma statistics enabled continuous corrective measures on unsatisfactory or low-level OEE resulted from process output variations (quantity delivered or expected), which were mapped into sigma statistical standards (one- to six-sigma). Application of the model in a processing company showed that errors of the process were reduced by 78% and 42% respectively for traditional OEE and the new Error-Proof OEE (OEE-EP). The results revealed that the OEE-EP model is better than the other existing schemes in terms of losses elimination in the production process.
Keywords: OEE dynamism; Sigma metric; Process integration; Productivity.
تطویر نموذج تجنب الأخطاء الدینامیكیة المتعلقة بالفعالیة العامة للمعدات لتحسین عملیة الإنتاج
دیروبا و م. إدریسأو. ،كینوليأب. ،ت. أوجینجبي ،لابيأ. أ ،ب. كریم
یتزاید الطلب العالمي على الاستخدام الفعال للقوى العاملة والآلات تجنباً للھدر الذي یحدث أثناء عملیة التصنیع حیث :الملخصتجنب الأخطاء الدینامیكیة یستھدف تطویر نموذج .یصعب التولید المفرط للنفایات من عملیة تحقیق نتائج تصنیعیة مرضیة
المتعلقة بالفعالیة العامة للمعدات تحقیق الاستفادة المثلى من عملیة الإنتاج المعقدة عن طریق تقلیل النفایات و الخسائر التشغیلیة العامة للمعدات استخدم في ھذه الدراسة قیاس سیجما المقاوم للخطأ لاختبار العوامل المؤثرة في نظام الفعالیة .إلى أدنى حد ممكن
(التوفر والأداء والجودة) لتضمین الخسائر الناجمة عن النفایات والعلاقة بین الإنسان والآلة. أتاحت إحصائیات سیجما المتعلقة بتجنب الأخطاء اتخاذ إجراءات تصحیحیة مستمرة على مستوى غیر مُرضٍ أو منخفض من نظام الفعالیة العامة للمعدات نتیجة
سیجما). 6-1ي ناتج العملیة (الكمیة التي تم تسلیمھا أو المتوقعة)، والتي تم تعیینھا إلى معاییر إحصائیة للسیجما (للاختلافات ف% على التوالي بالنسبة 42% و78أن أخطاء العملیة انخفضت بنسبة المعالجة وقد أظھر تطبیق النموذج في إحدى الشركات
.و النموذج الجدید لنظام تجنب الأخطاء الدینامیكیة المتعلقة بالفعالیة العامة للمعداتلنظام الفعالیة العامة للمعدات التقلیدي أفضل من المخططات الأخرى من حیث وكشفت النتائج أن نموذج تجنب الأخطاء الدینامیكیة المتعلقة بالفعالیة العامة للمعدات
.التخلص من الخسائر في عملیة الإنتاج
.الإنتاجیة؛ تكامل العملیة الفعالیة العامة للمعدات؛ مقیاس سیجما؛امیكیة دین :المفتاحیة الكلمات
Development of OEE Error-proof (OEE-EP) Model for Production Process Improvement
60
NOMENCLATURE G Quality products delivered per unit time
(year) pG
Total quantity produced per unit time (year)
wG Actual waste generated (%) i Counter for overall equipment effectiveness
factor j Counter for sigma value n Traditional scheme ( n =3), new scheme ( n
=5) OEE Overall Equipment Effectiveness
cOEE Effectiveness improvement factor (%) wP Planned (expected) waste (%)
1t Actual production volume per unit time (year)
2t Planned production volume per unit time (year)
0t Actual system performance per unit time (year)
nt System performance expected per unit time (year)
aT Actual human productivity per unit time (year)
sT Expected human productivity per unit time (year)
x Time (year) iy Equipment effectiveness factor at a given
year, x 'yi Contribution of equip. effectiveness factors
(%) β Performance efficiency of equipment (%) σ Improvement (error-proof) factor α Availability efficiency of production equip.
(%) μ Quality rate (efficiency) of products (output)
(%) ω Waste generation rate (efficiency) of equip.
(%) γ Human/ergonomics-equipment efficiency
(%) EP Error-proof MSE Mean Square Error 1. INTRODUCTION Over the decades, manufacturing industries and organizations concentrated mostly on mass production of goods without paying attention to how best the Overall Equipment Effectiveness (OEE) measures can be integrated into the system to enhance productivity (Muchiri and Pintelon, 2008; Dilworth, 2013). In the recent past, there had been an attitudinal change of
corporate managers towards integrating OEE measures into manufacturing systems (Dilworth, 2013; Martand, 2014; Prinz, 2017). The High cost of operations maintenance was among the reasons responsible for the change (Gharbi and Kennen, 2000). Maintenance in this context is defined as a combination of all technical and associated administrative activities required to keep equipment, installations, and other physical assets in good working condition or restore them to their original condition (Mwanza, 2017). Industrial managers realized that there is a possibility of achieving significant savings in operation costs under proper OEE practice (Godfrey, 2002; Bruce, 2006). OEE measured under resource availability (Kareem and Jewo, 2015) can play a vital role in the performance improvement of industrial operations (Kadiri, 2000; Butlewski et al., 2018). The productivity improvements achieved so far at the industrial operations level from the past studies have been significant (Munoz-Villamizar et al., 2018), but insufficient because of emerging challenges of the working environment and waste generation that the organizations need to address. For the enhancement of sustainable productivity, factors of effectiveness measures (equipment availability, quality of products and plant performance, etc.) should be considered at the design stage of the production process. Overall equipment effectiveness can be sustainable under regular assessment of and improvement on those effectiveness factors (Joshi and Gupta, 1986). Industrial sectors, in compliance with the twenty-first-century development goal, are now moving from the traditional method of measuring productivity to the modern method where conducive working environments and waste elimination strategies are being considered important to maximize profit. Wastes are products of material, man, machine, methods, among other production process factors (Ghazali et al. 2013). On this basis, Value Stream Mapping (VSM) of processes is very important to find out production processes that required improvement or motivation (Meyer and Stewart, 2018). Therefore, the traditional OEE model needs to be improved upon by considering other emerging factors that influence productivity in modern industrial operations to survive the competition. Other challenges such as productivity monitoring, continuous improvement measures, customers’ satisfaction, and environmental dynamism faced by the production companies need to be addressed.
Overall equipment effectiveness measures can be extended to provide a basis for plant materials or overproduction wastes measurement and control. Overproduction is a condition where a company manufactures goods above the planned (expected) quantity. In a smart industrial environment, overproduction is a waste from the use of production resources such as material, manpower, and machines
B. Kareem, A.S. Alabi, T.I. Ogedengbe, B.O. Akinnuli, O.A. Aderoba, and M.O. Idris
61
(Muraa, 2016; Munoz-Villamizar et al., 2018). Poorly planned and worn-out equipment can lead to wastage in terms of worker’s time, material, and other components of the production line. Different techniques for eliminating wastes in production lines have been on the ground (Lennon, 2016). None of them have integrated the error-proof sigma metric tool into OEE, as done in this study, as a continuous improvement method of productivity monitoring, which targets customers’ satisfaction by minimizing process variation.
This study aims to develop an Error-Proof OEE (OEE-EP) model that integrates sigma matric into the modified traditional OEE measures. In the past, OEE was measured based on only three principal factors- availability, performance, and quality efficiencies (AFSC, 2010; Alexanda, 2012; Adams, 2014). This study expands the scope of measuring OEE by including human/ergonomics and waste generation into the effectiveness measure. Besides, the static nature of traditional OEE measure was replaced by a tractable, dynamic OEE which utilized an error-proof sigma metric as a continuous improvement tool. The application of error-proof or process variation (sigma metric) tool has not been popular in manufacturing industries as an improvement tool until recent times. The use of the sigma metric in OEE as an error-proof parameter can be hardly found. Therefore, the integration of the error-proof parameters into the OEE measure has widened its scope for sustainable application in modern and complex industrial systems. The rest of the paper is presented as follows: related works are in section 2; modelling and integration of OEE factors are in section 3; results and discussion are in section 4; and conclusions are given in section 5. 2. LITERATURE REVIEW Literature was reviewed in line with overall equipment effectiveness measure, sigma metric, and improvement tools, and areas of contribution to OEE research. 2.1. Overall Equipment Effectiveness Measure Traditional OEE factors (availability, performance, and quality) performances were optimized using response surface methodology (Kunsch et al., 2012). The model introduced no new input to the traditional OEE factors. A multidimensional view of technology (AMT) in the OEE measure provided by Swamidassa and Kothab (1998) had a direct impact on the performance of large scale firms only. A good OEE measure should be versatile and applicable to small-, medium- and large- scale industrial systems. The lean bundle OEE approach proposed by Shah and Ward (Shah and Ward, 2003), considered plant size only while plant integration and aging were neglected. Waste generation and workspace (ergonomic) condition were neglected in many other studies
related to traditional OEE measures (Wilson, 2010; Ljungberg, 1998; Madhavan et al., 2011; Nachiappan and Anantharaman, 2006; Muchiri and Pintelon, 2008; Wang and Pan, 2011; Andersson and Bellgran, 2015; Binti Aminuddin et al., 2016).
The Overall Equipment Effectiveness of Manufacturing Line (OEEML) scheme was established by Braglia et al., (2009) in an attempt to overcome a limitation of individual equipment over jointly operated machines. The model, however, failed to explain to which extent the effectiveness was supportive to the in-process inventory of spares and workplace management. The application of the traditional OEE metric in a steel company by Almeanazel (2010) led to the realization of 99% in quality factor, 76% in availability factor, and 72% in plant performance without practical implementation. He suggested the application of lean tools such as Single Minutes Exchange of Dies (SMED), Computer Maintenance Management System (CMMS), and Integrated Production Planning (IPP) to the production system to validate the outcome. The relationship between OEE and Process Capability (PC) measures was established which showed that a cutoff point of 1.33 Capability Indices (CI) instead of popular 1.0 was possible (Garza-Reyes et al., 2010). Therefore, the OEE cutoff point can be shifted beyond 1.0 when measured based on process capability. However, OEE greater than 1.0 can be defined as over capability utilisation in a lean manufacturing environment where wastages are not allowed. The efficacy of the OEE measure as a productivity tool was established by Hansen (2002). Productivity can only lead to profitability in an organization if workplace conditions and waste generation rates are considered during OEE evaluation. The challenge of variation of OEE across firms was addressed by creating a system of a dynamic process for OEE evaluation and control over time (Zuashkiani et al., 2011). Traditional actions taken at fixing OEE challenges (reactive maintenance, poor morale) were not sustainable in the long run, due to the emergence of lower OEE. Under good management, risks and challenges of productivity (reactive maintenance, poor worker morale, and hazard control) are transferrable to relevant experts in the production cycle to sustain OEE. 2.2. Sigma metric and improvement tools The improvements by reducing losses can be estimated (represented) in terms of sigma statistical control metric based on a normal distribution. On this metric, six sigma (0.0000034) process variation can perform more efficiently than one (0.69), two (0.31), three (0.067), four (0.0062), or five (0.00023) sigma process variations because it provides the highest and practicable improvement probability (99.99966%) which is close to 100% (Marselli, 2004). The six-sigma metric allows only 3.4 defects in one million products. Six-sigma tool was introduced into a lean
Development of OEE Error-proof (OEE-EP) Model for Production Process Improvement
62
manufacturing strategy recently, and it was classified as blackbelt and greenbelt, based on productivity enhancement (Domingo and Aguado, 2015).
Six-sigma focuses on reducing process variation and enhancing process control, while lean manufacturing seeks to eliminate or reduce wastes (non-value added activities) using teamwork, clean, organized, and well-marked workspaces (Michael, 2015). Lean and six-sigma have the same general purpose of providing the customer with the best possible quality, cost, delivery, and a newer attribute. Lean achieves its goal by using philosophical tools such as Kaizen, Just-in-Time (JIT), workplace organization (5S) and visual controls, Single Minute Exchange of Dies (SMED), 100% sampling (Jidoka), while six-sigma is based on statistical analysis, design of experiment and hypothesis test. There is a need to economize and simplify the OEE improvement process by replacing the conglomerate of lean technologies with a singular sigma metric tool for process variation measure. 2.3. Areas of contribution to OEE research Traditional or basic OEE model as an important metric in Total Productive Maintenance (TPM) has been successfully applied to packaging, chemical, automobile, production, foundry, and pulp product (rayon fiber) industries in the past (Michiri and Pintelon, 2008; Munteanu et al. 2010; Hossain and Sarker, 2016, Bhattacharjee et al. 2019; Sayuti et al., 2019). The traditional OEE has given birth to new OEE models which are either static/deterministic or stochastic in nature. The new static/deterministic OEE measures include: Overall Asset Effectiveness (OAE), Overall Plant Effectiveness (OPE), Total Equipment Effectiveness Performance (TEEP), Production Equipment Effectiveness (PEE) and Overall Factory Effectiveness (OFE) applied in packaging and chemical processing (Muchiri and Pintelon, 2008); Doubly Weighted Grouping Efficiency (DWGE) applied in cellular manufacturing systems (Sarker, 2001); Overall Line Effectiveness (OLE) for automobile industries (Nachiappan and Anantharaman, 2006); Overall Equipment Effectiveness of a Manufacturing Line (OEEML) for automobile firm (Braglia et al., 2009); Global Production Effectiveness (GPE) for global manufacturing system (Lanza et al., 2013); Overall Throughput Effectiveness (OTE) for wafer fab and glass firm (Muthiah et al., 2008); Overall Equipment Effectiveness Market-Based (OEEMB) for iron and steel industry (Anvari et al., 2010); Equipment Performance and Reliability (EPR) model for semiconductor production system (Samat et al., 2012); Rank-Order Centroid (ROC) method in Overall Weighting Equipment Effectiveness (OWEE) for fiber cement roof production system (Wudhikarn, 2010); Overall Equipment and Quality Cost Loss (OEQCL) for fiber cement manufacturing system (Wudhikarn, 2012); OEE and Productivity measure (OEEP) in automobile industry (Andersson and
Bellgran, 2015); and OEE- Total Productive Maintenance (TPM) and Lean Manufacturing (LM) measures in manufacturing systems (Binti Aminuddin et al., 2016). The stochastic OEE models evolved include: Probability density function (Normal and Beta distributions) of OEE applied to waterproofing coatings firm (Zammori et al., 2010); and the simulation-based Taguchi method in weighted OEE for crimping manufacturing line (Yuniawan et al., 2013). Automation of OEE measures has been carried out through: integration of a communication system and Manufacturing Execution System (MES) into the Automated Data Collection (ADC) system to enhance accurate data collection in the manufacturing line to enable accurate estimation of throughput, Unit Per Hour (UPH) machine rate for semiconductor assembly firm (Wang and Pan, 2011); and development of software package to identify losses associated with equipment effectiveness (Singh et al., 2013).
Apart from the established drawbacks from the stated studies which include equally weighted OEE parameters, subjective weights determination, unexplained lowest OEE–loss relationship, insufficient data to obtain the weights, weights probability approximation, inadequate general and quality cost accounting (Hossain and Sarker, 2016), and effectiveness limitation to machine/equipment rate only, it is inferable from the past studies that the traditional and the evolved OEE models have been applied separately to either machine(s)/equipment, plant, production/manufacturing line, or cellular manufacturing system without considering productivity of production line in terms of supply output (delivery) and demand (expectation). Besides, the emerging models only built their measures around the basic OEE three factors-availability, performance and quality. The stated models cannot work in a fast-moving product (beverage) production line where material needed in the production line is supplied as and when due in batches based on planned (expected) output delivery. Therefore, production waste can come from either surplus material supply or overproduction (higher product volume). They failed to also consider issues of: dynamic nature of process variation in a single fast-moving product production line over the years that will enable the manager to plan ahead accurately to meet customers’ delivery as and when required. This will call for a new OEE model with the following peculiarities: the ability to moderate/control yearly OEE variations to enable attainment of improved and balanced effectiveness of a single fast-moving product production line; inclusion of waste (surplus in materials/ overproduction) and human/ergonomic (production floor environment) factors which are critical to the production line; and integration of regression model and error-proof sigma metric parameters to serve as yearly predictive/dynamic OEE improvement tool for management to make the right choice of action. Once
B. Kareem, A.S. Alabi, T.I. Ogedengbe, B.O. Akinnuli, O.A. Aderoba, and M.O. Idris
63
the quality rate is measured based on percentage defective/rework items of output quantity, then it is sensible to consider waste rate as an independent OEE factor which is measurable using percentage leftover material (products) of the total input material (output product), excluding defective material (items).
It is inferable from the literature that the past OEE models are deficient, and hence require improvement to enhance a robust effectiveness measure. New or emerging OEE models should take care of a dynamic industrial environment. Replacement of cumbersome and costly to implement improvement tools (Kaizen, JIT, SMED, VSM, 5S, Automated system, weighting system, Lean bundle, Lean blackbelt & green belt, etc.) with singular error-proof sigma metric will simplify its application in industries. In this study, the OEE model will be made robust to cope with modern production line realities of enhancing competitiveness by integrating workplace conditions and waste generation factors into it. OEE measure will be made dynamic through the introduction of a continuous improvement tool, error-proof sigma metric, and integration of time-dependent predictable OEE parameters. A simplified, tractable OEE error-proof (OEE-EP) model will be provided to serve as a good replacement to the cumbersome and costly implementable past models.
3. INTEGRATION AND MODELLING
OF OEE PARAMETERS The methodology employed entails integration of Overall Equipment Effectiveness (OEE) factors, formulation of the OEE model, and analysis of OEE model parameters. 3.1. Integration of Overall Equipment
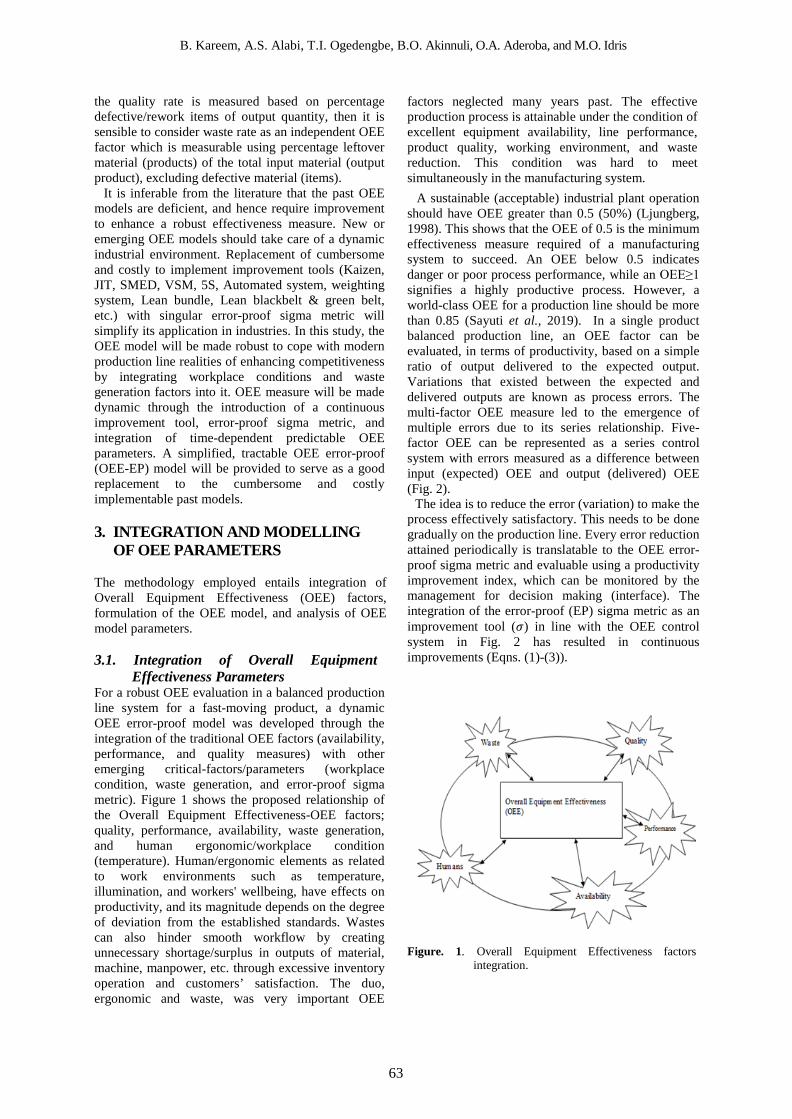
Effectiveness Parameters For a robust OEE evaluation in a balanced production line system for a fast-moving product, a dynamic OEE error-proof model was developed through the integration of the traditional OEE factors (availability, performance, and quality measures) with other emerging critical-factors/parameters (workplace condition, waste generation, and error-proof sigma metric). Figure 1 shows the proposed relationship of the Overall Equipment Effectiveness-OEE factors; quality, performance, availability, waste generation, and human ergonomic/workplace condition (temperature). Human/ergonomic elements as related to work environments such as temperature, illumination, and workers' wellbeing, have effects on productivity, and its magnitude depends on the degree of deviation from the established standards. Wastes can also hinder smooth workflow by creating unnecessary shortage/surplus in outputs of material, machine, manpower, etc. through excessive inventory operation and customers’ satisfaction. The duo, ergonomic and waste, was very important OEE
factors neglected many years past. The effective production process is attainable under the condition of excellent equipment availability, line performance, product quality, working environment, and waste reduction. This condition was hard to meet simultaneously in the manufacturing system.
A sustainable (acceptable) industrial plant operation should have OEE greater than 0.5 (50%) (Ljungberg, 1998). This shows that the OEE of 0.5 is the minimum effectiveness measure required of a manufacturing system to succeed. An OEE below 0.5 indicates danger or poor process performance, while an OEE≥1 signifies a highly productive process. However, a world-class OEE for a production line should be more than 0.85 (Sayuti et al., 2019). In a single product balanced production line, an OEE factor can be evaluated, in terms of productivity, based on a simple ratio of output delivered to the expected output. Variations that existed between the expected and delivered outputs are known as process errors. The multi-factor OEE measure led to the emergence of multiple errors due to its series relationship. Five-factor OEE can be represented as a series control system with errors measured as a difference between input (expected) OEE and output (delivered) OEE (Fig. 2).
The idea is to reduce the error (variation) to make the process effectively satisfactory. This needs to be done gradually on the production line. Every error reduction attained periodically is translatable to the OEE error-proof sigma metric and evaluable using a productivity improvement index, which can be monitored by the management for decision making (interface). The integration of the error-proof (EP) sigma metric as an improvement tool (𝜎𝜎) in line with the OEE control system in Fig. 2 has resulted in continuous improvements (Eqns. (1)-(3)).
Figure. 1. Overall Equipment Effectiveness factors integration.

B. Kareem, A.S. Alabi, T.I. Ogedengbe, B.O. Akinnuli, O.A. Aderoba, M.O. Idris
64
Figure. 2. System Control and Improvement Framework.
x)σ-1(OEE=EPOEE (1) If,
,1≥EPOEE Stop, improvement is satisfactory (2) Otherwise,
,1<EPOEE≤0 Continue (3) The improvement )EPOEE( will continue over time,
x (Eqns. (1) and (3)) in the presence of Error-proof )EP( sigma metric, σ until it attains a satisfactory
value (Eqn.(2)). Power x in Eqn. (1) can also be described as improvement (fading) time. System performance was evaluated based on, if; OEE ≤ 0.5, then productivity is poor; but for OEE > 0.5 means productivity is good, while productivity is described as excellent if OEE ≥ 1.
With reference to Fig. 2, The model relating the traditional OEE factors (availability, performance, and quality) was identified to fall into the family of control model on the basis at which a modified version was developed by integrating emerging OEE factors (waste and human) into it. The arrow shows a series relationship between the OEE factors indicating that a deficiency (error) realized in one factor has multiplying effects on the other OEE factors. This reflection is expressed in Eqns. (4) and (5). The interface served as an OEE outcome error review platform motivated by a sigma metric continuous improvement window that enabled the gradual reduction of process variation to a satisfactory level (Eqns. (1)-(3)). Error-proof (EP) is process variation measured at a given time over actual and expected outputs. The target of any production firm is to make process variation close to zero to sustain productivity. Error-proof (EP) criterion is a strategy of gradual elimination of process variation in a single product production line by the adoption of the sigma metric standards to enhance continuous improvement of the firm’s OEE towards the attainment of OEE-EP
3.2. Overall Equipment Effectiveness Model
Formulation Productivity as a measure of plant effectiveness relating the expected and delivered outputs can be analyzed based on the control diagram given in Fig. 2. Equation (4) in the earlier studies (Bruce, 2006;
Dilworth, 2013) for measuring the traditional (old) Overall Equipment Effectiveness (OEE) was conformed to the established system.
αβμ=OEE (4)
where: α is the availability efficiency of a production equipment β is the performance efficiency of the equipment μ is the quality rate (efficiency) of products (output)
Equation (4), however, did not consider human ergonomic/workplace condition, γ and waste generation, ω factors (shown in Figs 1 and 2), which are also important in determining the overall production line’s effectiveness. Hence, Eqn. (4) was enhanced to include ergonomic and waste (Eqn. (5)),
αβμγω='OEE (5)
Equation (5) is a modification of the traditional OEE model (Bruce, 2006; Dilworth, 2013) in Eqn. (4). The relationship, as stated before, is a resemblance of the control system represented by Fig. 2. The productivity variations in individual or combined OEE factors (in series) are measurable as a ratio of output to input resources. Dynamic sub-models for evaluating productivity contributions 'iy over the year x of each of the OEE
factors iy ( )ω.&γ,μ,β,α were then formulated and evaluated as expressed in Eqns. (6) and (7), respectively.
=)x('yi iy ( )ω.&γ,μ,β,α (6) If
[ ,1≥'iy
,1<'iy≤0 (7)
System availability, )α(yi was determined as the
ratio of actual (delivered) production volume per unit time, )x(t1 and the planned (expected) production volume per unit time, )x(t2 .
stop improvement satisfactory
continue improvement
B. Kareem, A.S. Alabi, T.I. Ogedengbe, B.O. Akinnuli, O.A. Aderoba, and M.O. Idris
65
)x(2t)x(1t=)α(iy (8)
System Performance, )β(yi was measured as the
system performance delivered (in %) per unit time )x(t0 over the system performance expected (in %)
per unit time, )x(tn as shown in (9).
)x(nt
)x(0t=)β(iy (9)
System Quality, )(µiy was measured by the quality products delivered, that is, % difference between total quantity produced and total defective/rework items )(xG (in %) over the total
quantity produced per unit time, )(xGp (in %).
)x(pG)x(G
=)μ(iy (10)
System human factor/ ergonomics, )γ(yi was
estimated using the expression based on the actual (delivered) human working environment contribution to productivity, )x(Ts over the expected contribution,
).x(Ta Eqn. (11) was evaluated based on the production environment (temperature) per unit time, this was found to affected workers’ productivity. The environmental (temperature) change, )x(Ta was a planned (expected) production floor conditioning temperature per unit time while, )x(Ts was the actual (delivered) workplace temperature.
)x(sT)x(aT
=)γ(iy (11)
Ambient temperature was considered a major human
element because it was found that the temperature of the working environment had a critical effect on the machine and the operator’s productivity. A balanced working temperature is needed to enhance simultaneous satisfactory performance in machinery and operator. Unstable environmental conditions and climate change will make this very difficult to achieve. Therefore, the temperature is a critical ergonomic factor to consider.
System Waste )ω(yi was measured based on system percentage waste reduction (% allowable material/product surplus) performance, as the ratio of the planned (expected) waste (in %), )x(Pw and the actual waste generated (in %), )x(Gw
)x(wG
)x(wP=)ω(iy (12)
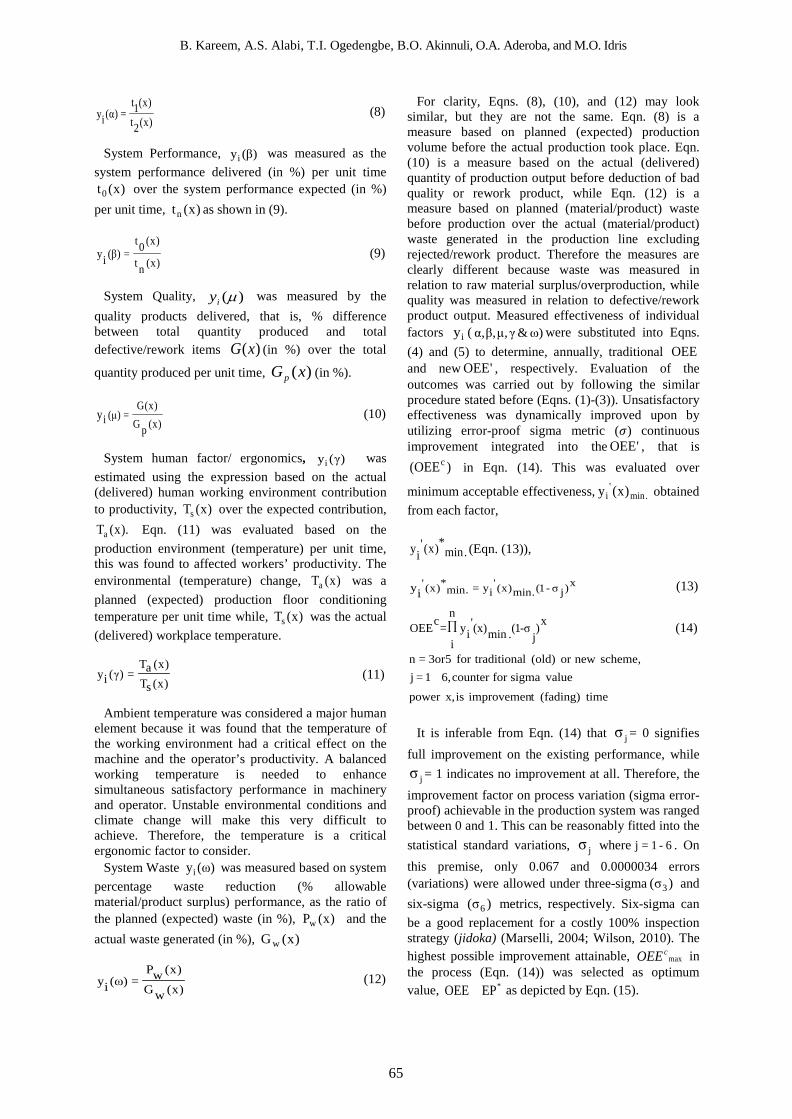
For clarity, Eqns. (8), (10), and (12) may look similar, but they are not the same. Eqn. (8) is a measure based on planned (expected) production volume before the actual production took place. Eqn. (10) is a measure based on the actual (delivered) quantity of production output before deduction of bad quality or rework product, while Eqn. (12) is a measure based on planned (material/product) waste before production over the actual (material/product) waste generated in the production line excluding rejected/rework product. Therefore the measures are clearly different because waste was measured in relation to raw material surplus/overproduction, while quality was measured in relation to defective/rework product output. Measured effectiveness of individual factors iy ( )ω&γ,μ,β,α were substituted into Eqns. (4) and (5) to determine, annually, traditional OEE and new 'OEE , respectively. Evaluation of the outcomes was carried out by following the similar procedure stated before (Eqns. (1)-(3)). Unsatisfactory effectiveness was dynamically improved upon by utilizing error-proof sigma metric (𝜎𝜎) continuous improvement integrated into the 'OEE , that is
)OEE( c in Eqn. (14). This was evaluated over
minimum acceptable effectiveness, .min'
i )x(y obtained from each factor,
.min*)x('iy (Eqn. (13)),
x)jσ-1(.min)x('iy=.min
*)x('iy (13)
x)j
-σ1(∏n
i.min(x)'
iy=cOEE (14)
time(fading)timprovemenisx,powervaluesigmaforcounter6,1=j
scheme,newor(old)ltraditionafor3or5=n
It is inferable from Eqn. (14) that jσ = 0 signifies
full improvement on the existing performance, while
jσ = 1 indicates no improvement at all. Therefore, the improvement factor on process variation (sigma error-proof) achievable in the production system was ranged between 0 and 1. This can be reasonably fitted into the statistical standard variations, jσ where 6-1=j . On this premise, only 0.067 and 0.0000034 errors (variations) were allowed under three-sigma )σ( 3 and six-sigma )σ( 6 metrics, respectively. Six-sigma can be a good replacement for a costly 100% inspection strategy (jidoka) (Marselli, 2004; Wilson, 2010). The highest possible improvement attainable, max
cOEE in the process (Eqn. (14)) was selected as optimum value, *EPOEE as depicted by Eqn. (15).
Development of OEE Error-proof (OEE-EP) Model for Production Process Improvement
66
maxc*c* OEE=OEE=EPOEE (15)
The model as stated is a constrained linear/
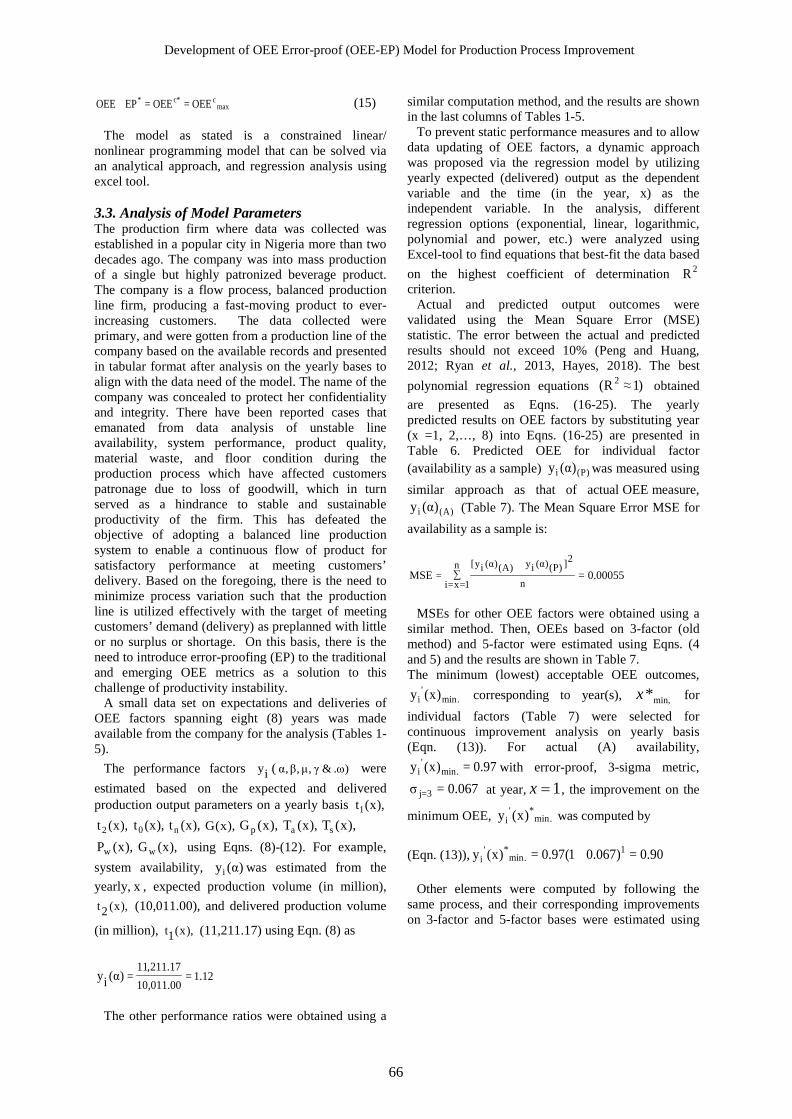
nonlinear programming model that can be solved via an analytical approach, and regression analysis using excel tool. 3.3. Analysis of Model Parameters The production firm where data was collected was established in a popular city in Nigeria more than two decades ago. The company was into mass production of a single but highly patronized beverage product. The company is a flow process, balanced production line firm, producing a fast-moving product to ever-increasing customers. The data collected were primary, and were gotten from a production line of the company based on the available records and presented in tabular format after analysis on the yearly bases to align with the data need of the model. The name of the company was concealed to protect her confidentiality and integrity. There have been reported cases that emanated from data analysis of unstable line availability, system performance, product quality, material waste, and floor condition during the production process which have affected customers patronage due to loss of goodwill, which in turn served as a hindrance to stable and sustainable productivity of the firm. This has defeated the objective of adopting a balanced line production system to enable a continuous flow of product for satisfactory performance at meeting customers’ delivery. Based on the foregoing, there is the need to minimize process variation such that the production line is utilized effectively with the target of meeting customers’ demand (delivery) as preplanned with little or no surplus or shortage. On this basis, there is the need to introduce error-proofing (EP) to the traditional and emerging OEE metrics as a solution to this challenge of productivity instability.
A small data set on expectations and deliveries of OEE factors spanning eight (8) years was made available from the company for the analysis (Tables 1-5).
The performance factors iy ( )ω.&γ,μ,β,α were estimated based on the expected and delivered production output parameters on a yearly basis ),x(t1
),x(t 2 ),x(t0 ),x(t n ),x(G ),x(Gp ),x(Ta ),x(Ts
),x(Pw ),x(G w using Eqns. (8)-(12). For example, system availability, )α(yi was estimated from the yearly, x , expected production volume (in million),
),x(2t (10,011.00), and delivered production volume
(in million), ),x(1t (11,211.17) using Eqn. (8) as
12.1=00.011,1017.211,11
=)α(iy
The other performance ratios were obtained using a
similar computation method, and the results are shown in the last columns of Tables 1-5.
To prevent static performance measures and to allow data updating of OEE factors, a dynamic approach was proposed via the regression model by utilizing yearly expected (delivered) output as the dependent variable and the time (in the year, x) as the independent variable. In the analysis, different regression options (exponential, linear, logarithmic, polynomial and power, etc.) were analyzed using Excel-tool to find equations that best-fit the data based on the highest coefficient of determination 2Rcriterion.
Actual and predicted output outcomes were validated using the Mean Square Error (MSE) statistic. The error between the actual and predicted results should not exceed 10% (Peng and Huang, 2012; Ryan et al., 2013, Hayes, 2018). The best polynomial regression equations )1≈R( 2
obtained are presented as Eqns. (16-25). The yearly predicted results on OEE factors by substituting year (x =1, 2,…, 8) into Eqns. (16-25) are presented in Table 6. Predicted OEE for individual factor (availability as a sample) )P(i )α(y was measured using similar approach as that of actual OEE measure,
)A(i )α(y (Table 7). The Mean Square Error MSE for availability as a sample is:
∑n
1=x=i n
2])P()α(iy)A()α(iy[= 00055.0=MSE
MSEs for other OEE factors were obtained using a
similar method. Then, OEEs based on 3-factor (old method) and 5-factor were estimated using Eqns. (4 and 5) and the results are shown in Table 7. The minimum (lowest) acceptable OEE outcomes,
.min'
i )x(y corresponding to year(s), min,*x for individual factors (Table 7) were selected for continuous improvement analysis on yearly basis (Eqn. (13)). For actual (A) availability,
97.0=)x(y .min'
i with error-proof, 3-sigma metric, 067.0=σ 3=j at year, 1=x , the improvement on the
minimum OEE, .min*'
i )x(y was computed by (Eqn. (13)), 90.0=)067.01(97.0=)x(y 1
.min*'
i
Other elements were computed by following the same process, and their corresponding improvements on 3-factor and 5-factor bases were estimated using
B. Kareem, A.S. Alabi, T.I. Ogedengbe, B.O. Akinnuli, O.A. Aderoba, and M.O. Idris
67
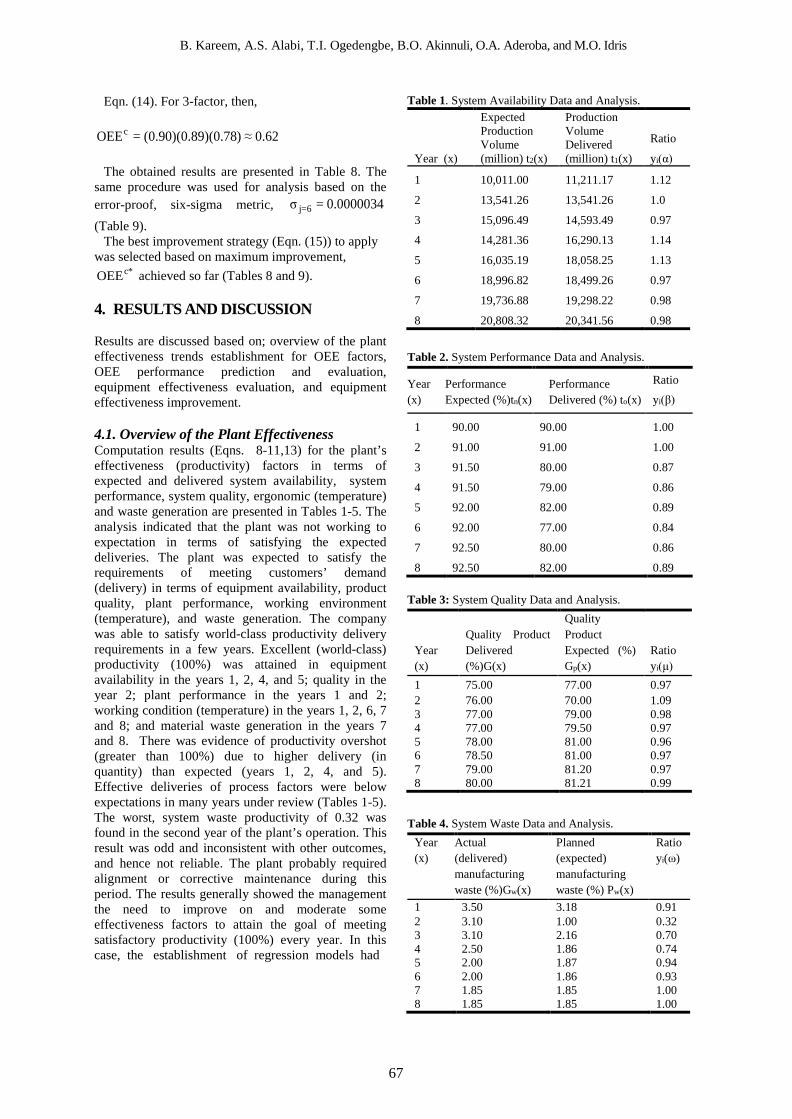
Eqn. (14). For 3-factor, then, 62.0≈)78.0)(89.0)(90.0(=OEEc
The obtained results are presented in Table 8. The same procedure was used for analysis based on the error-proof, six-sigma metric, 0000034.0=σ 6=j
(Table 9). The best improvement strategy (Eqn. (15)) to apply
was selected based on maximum improvement, *cOEE achieved so far (Tables 8 and 9).
4. RESULTS AND DISCUSSION Results are discussed based on; overview of the plant effectiveness trends establishment for OEE factors, OEE performance prediction and evaluation, equipment effectiveness evaluation, and equipment effectiveness improvement.
4.1. Overview of the Plant Effectiveness Computation results (Eqns. 8-11,13) for the plant’s effectiveness (productivity) factors in terms of expected and delivered system availability, system performance, system quality, ergonomic (temperature) and waste generation are presented in Tables 1-5. The analysis indicated that the plant was not working to expectation in terms of satisfying the expected deliveries. The plant was expected to satisfy the requirements of meeting customers’ demand (delivery) in terms of equipment availability, product quality, plant performance, working environment (temperature), and waste generation. The company was able to satisfy world-class productivity delivery requirements in a few years. Excellent (world-class) productivity (100%) was attained in equipment availability in the years 1, 2, 4, and 5; quality in the year 2; plant performance in the years 1 and 2; working condition (temperature) in the years 1, 2, 6, 7 and 8; and material waste generation in the years 7 and 8. There was evidence of productivity overshot (greater than 100%) due to higher delivery (in quantity) than expected (years 1, 2, 4, and 5). Effective deliveries of process factors were below expectations in many years under review (Tables 1-5). The worst, system waste productivity of 0.32 was found in the second year of the plant’s operation. This result was odd and inconsistent with other outcomes, and hence not reliable. The plant probably required alignment or corrective maintenance during this period. The results generally showed the management the need to improve on and moderate some effectiveness factors to attain the goal of meeting satisfactory productivity (100%) every year. In this case, the establishment of regression models had
Table 1. System Availability Data and Analysis.
Year (x)
Expected Production Volume (million) t2(x)
Production Volume Delivered (million) t1(x)
Ratio
yi(α)
1 10,011.00 11,211.17 1.12
2 13,541.26 13,541.26 1.0
3 15,096.49 14,593.49 0.97
4 14,281.36 16,290.13 1.14
5 16,035.19 18,058.25 1.13
6 18,996.82 18,499.26 0.97
7 19,736.88 19,298.22 0.98
8 20,808.32 20,341.56 0.98
Table 2. System Performance Data and Analysis.
Year (x)
Performance Expected (%)tn(x)
Performance Delivered (%) to(x)
Ratio yi(β)
1 90.00 90.00 1.00
2 91.00 91.00 1.00
3 91.50 80.00 0.87
4 91.50 79.00 0.86
5 92.00 82.00 0.89
6 92.00 77.00 0.84
7 92.50 80.00 0.86
8 92.50 82.00 0.89 Table 3: System Quality Data and Analysis.
Year (x)
Quality Product Delivered (%)G(x)
Quality Product Expected (%) Gp(x)
Ratio yi(μ)
1 75.00 77.00 0.97 2 76.00 70.00 1.09 3 77.00 79.00 0.98 4 77.00 79.50 0.97 5 78.00 81.00 0.96 6 78.50 81.00 0.97 7 79.00 81.20 0.97 8 80.00 81.21 0.99
Table 4. System Waste Data and Analysis.
Year (x)
Actual (delivered) manufacturing waste (%)Gw(x)
Planned (expected) manufacturing waste (%) Pw(x)
Ratio yi(ω)
1 3.50 3.18 0.91 2 3.10 1.00 0.32 3 3.10 2.16 0.70 4 2.50 1.86 0.74 5 2.00 1.87 0.94 6 2.00 1.86 0.93 7 1.85 1.85 1.00 8 1.85 1.85 1.00
Development of OEE Error-proof (OEE-EP) Model for Production Process Improvement
68
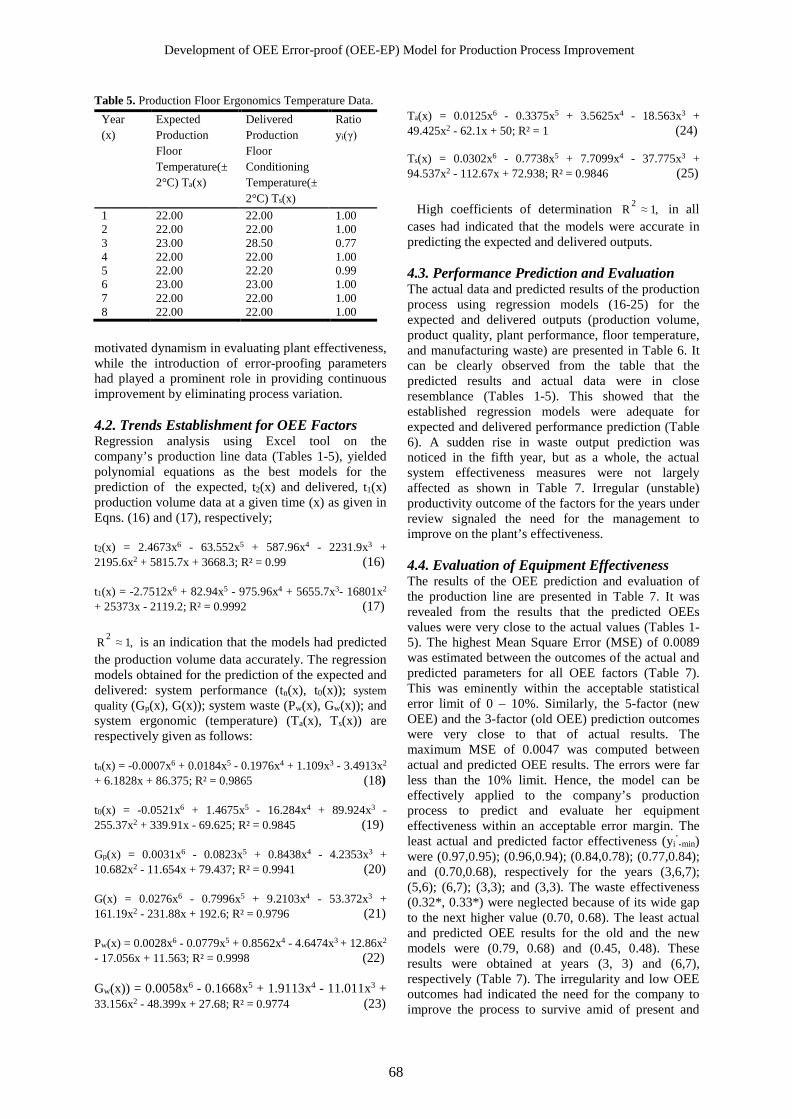
Table 5. Production Floor Ergonomics Temperature Data. Year (x)
Expected Production Floor Temperature(±2°C) Ta(x)
Delivered Production Floor Conditioning Temperature(±2°C) Ts(x)
Ratio yi(γ)
1 22.00 22.00 1.00 2 22.00 22.00 1.00 3 23.00 28.50 0.77 4 22.00 22.00 1.00 5 22.00 22.20 0.99 6 23.00 23.00 1.00 7 22.00 22.00 1.00 8 22.00 22.00 1.00
motivated dynamism in evaluating plant effectiveness, while the introduction of error-proofing parameters had played a prominent role in providing continuous improvement by eliminating process variation.
4.2. Trends Establishment for OEE Factors Regression analysis using Excel tool on the company’s production line data (Tables 1-5), yielded polynomial equations as the best models for the prediction of the expected, t2(x) and delivered, t1(x) production volume data at a given time (x) as given in Eqns. (16) and (17), respectively; t2(x) = 2.4673x6 - 63.552x5 + 587.96x4 - 2231.9x3 + 2195.6x2 + 5815.7x + 3668.3; R² = 0.99 (16) t1(x) = -2.7512x6 + 82.94x5 - 975.96x4 + 5655.7x3- 16801x2 + 25373x - 2119.2; R² = 0.9992 (17)
,1≈R 2 is an indication that the models had predicted the production volume data accurately. The regression models obtained for the prediction of the expected and delivered: system performance (tn(x), t0(x)); system quality (Gp(x), G(x)); system waste (Pw(x), Gw(x)); and system ergonomic (temperature) (Ta(x), Ts(x)) are respectively given as follows: tn(x) = -0.0007x6 + 0.0184x5 - 0.1976x4 + 1.109x3 - 3.4913x2 + 6.1828x + 86.375; R² = 0.9865 (18) t0(x) = -0.0521x6 + 1.4675x5 - 16.284x4 + 89.924x3 - 255.37x2 + 339.91x - 69.625; R² = 0.9845 (19) Gp(x) = 0.0031x6 - 0.0823x5 + 0.8438x4 - 4.2353x3 + 10.682x2 - 11.654x + 79.437; R² = 0.9941 (20) G(x) = 0.0276x6 - 0.7996x5 + 9.2103x4 - 53.372x3 + 161.19x2 - 231.88x + 192.6; R² = 0.9796 (21) Pw(x) = 0.0028x6 - 0.0779x5 + 0.8562x4 - 4.6474x3 + 12.86x2 - 17.056x + 11.563; R² = 0.9998 (22) Gw(x)) = 0.0058x6 - 0.1668x5 + 1.9113x4 - 11.011x3 + 33.156x2 - 48.399x + 27.68; R² = 0.9774 (23)
Ta(x) = 0.0125x6 - 0.3375x5 + 3.5625x4 - 18.563x3 + 49.425x2 - 62.1x + 50; R² = 1 (24) Ts(x) = 0.0302x6 - 0.7738x5 + 7.7099x4 - 37.775x3 + 94.537x2 - 112.67x + 72.938; R² = 0.9846 (25)
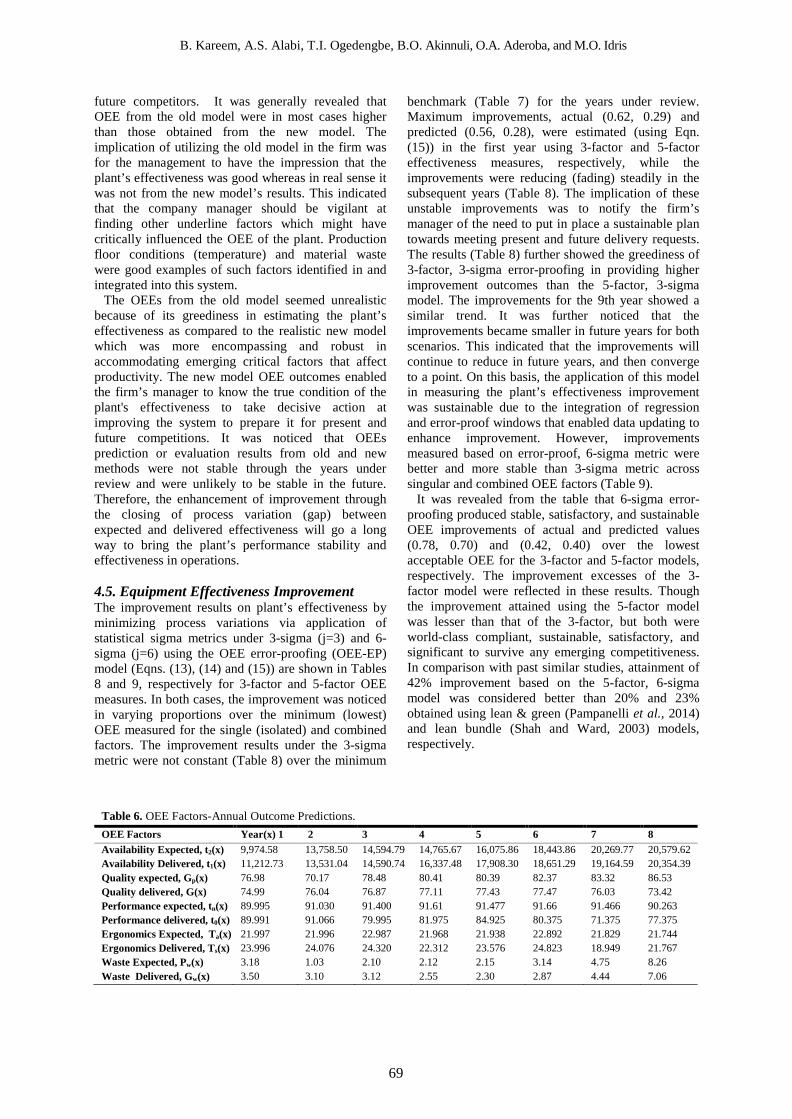
High coefficients of determination ,1≈R 2 in all cases had indicated that the models were accurate in predicting the expected and delivered outputs. 4.3. Performance Prediction and Evaluation The actual data and predicted results of the production process using regression models (16-25) for the expected and delivered outputs (production volume, product quality, plant performance, floor temperature, and manufacturing waste) are presented in Table 6. It can be clearly observed from the table that the predicted results and actual data were in close resemblance (Tables 1-5). This showed that the established regression models were adequate for expected and delivered performance prediction (Table 6). A sudden rise in waste output prediction was noticed in the fifth year, but as a whole, the actual system effectiveness measures were not largely affected as shown in Table 7. Irregular (unstable) productivity outcome of the factors for the years under review signaled the need for the management to improve on the plant’s effectiveness.
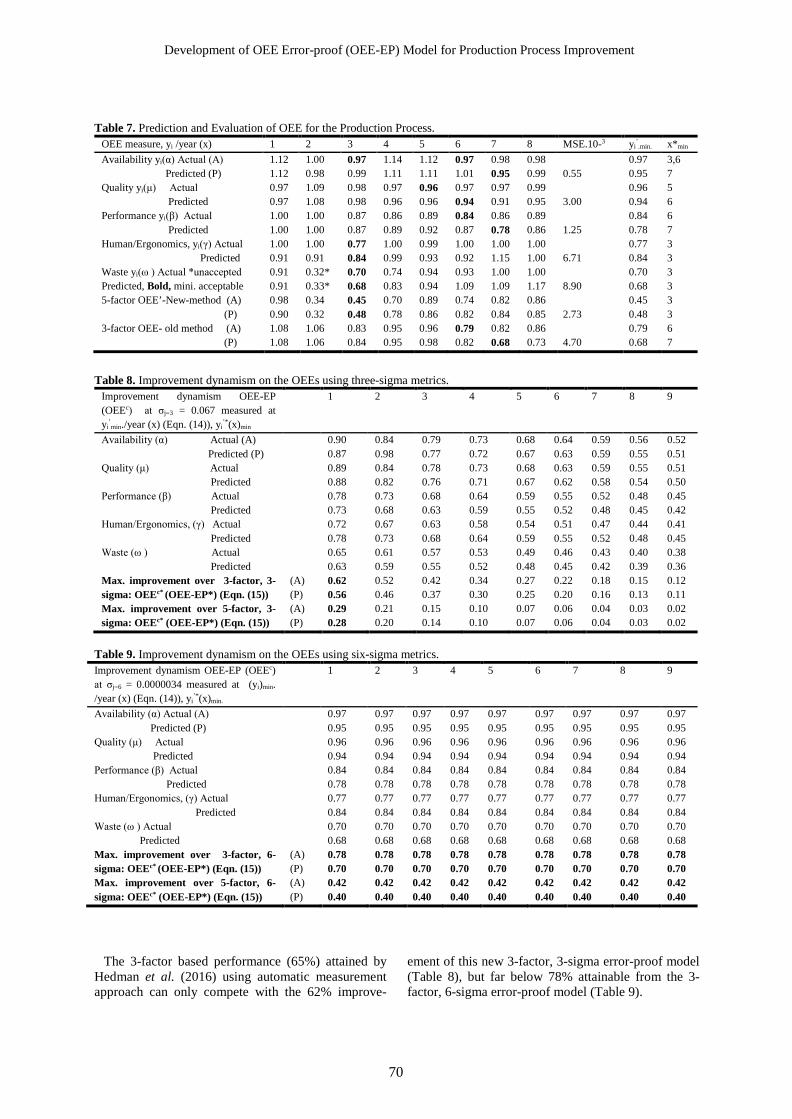
4.4. Evaluation of Equipment Effectiveness The results of the OEE prediction and evaluation of the production line are presented in Table 7. It was revealed from the results that the predicted OEEs values were very close to the actual values (Tables 1-5). The highest Mean Square Error (MSE) of 0.0089 was estimated between the outcomes of the actual and predicted parameters for all OEE factors (Table 7). This was eminently within the acceptable statistical error limit of 0 – 10%. Similarly, the 5-factor (new OEE) and the 3-factor (old OEE) prediction outcomes were very close to that of actual results. The maximum MSE of 0.0047 was computed between actual and predicted OEE results. The errors were far less than the 10% limit. Hence, the model can be effectively applied to the company’s production process to predict and evaluate her equipment effectiveness within an acceptable error margin. The least actual and predicted factor effectiveness (yi
’.min) were (0.97,0.95); (0.96,0.94); (0.84,0.78); (0.77,0.84); and (0.70,0.68), respectively for the years (3,6,7); (5,6); (6,7); (3,3); and (3,3). The waste effectiveness (0.32*, 0.33*) were neglected because of its wide gap to the next higher value (0.70, 0.68). The least actual and predicted OEE results for the old and the new models were (0.79, 0.68) and (0.45, 0.48). These results were obtained at years (3, 3) and (6,7), respectively (Table 7). The irregularity and low OEE outcomes had indicated the need for the company to improve the process to survive amid of present and
B. Kareem, A.S. Alabi, T.I. Ogedengbe, B.O. Akinnuli, O.A. Aderoba, and M.O. Idris
69
future competitors. It was generally revealed that OEE from the old model were in most cases higher than those obtained from the new model. The implication of utilizing the old model in the firm was for the management to have the impression that the plant’s effectiveness was good whereas in real sense it was not from the new model’s results. This indicated that the company manager should be vigilant at finding other underline factors which might have critically influenced the OEE of the plant. Production floor conditions (temperature) and material waste were good examples of such factors identified in and integrated into this system.
The OEEs from the old model seemed unrealistic because of its greediness in estimating the plant’s effectiveness as compared to the realistic new model which was more encompassing and robust in accommodating emerging critical factors that affect productivity. The new model OEE outcomes enabled the firm’s manager to know the true condition of the plant's effectiveness to take decisive action at improving the system to prepare it for present and future competitions. It was noticed that OEEs prediction or evaluation results from old and new methods were not stable through the years under review and were unlikely to be stable in the future. Therefore, the enhancement of improvement through the closing of process variation (gap) between expected and delivered effectiveness will go a long way to bring the plant’s performance stability and effectiveness in operations.
4.5. Equipment Effectiveness Improvement The improvement results on plant’s effectiveness by minimizing process variations via application of statistical sigma metrics under 3-sigma (j=3) and 6-sigma (j=6) using the OEE error-proofing (OEE-EP) model (Eqns. (13), (14) and (15)) are shown in Tables 8 and 9, respectively for 3-factor and 5-factor OEE measures. In both cases, the improvement was noticed in varying proportions over the minimum (lowest) OEE measured for the single (isolated) and combined factors. The improvement results under the 3-sigma metric were not constant (Table 8) over the minimum
benchmark (Table 7) for the years under review. Maximum improvements, actual (0.62, 0.29) and predicted (0.56, 0.28), were estimated (using Eqn. (15)) in the first year using 3-factor and 5-factor effectiveness measures, respectively, while the improvements were reducing (fading) steadily in the subsequent years (Table 8). The implication of these unstable improvements was to notify the firm’s manager of the need to put in place a sustainable plan towards meeting present and future delivery requests. The results (Table 8) further showed the greediness of 3-factor, 3-sigma error-proofing in providing higher improvement outcomes than the 5-factor, 3-sigma model. The improvements for the 9th year showed a similar trend. It was further noticed that the improvements became smaller in future years for both scenarios. This indicated that the improvements will continue to reduce in future years, and then converge to a point. On this basis, the application of this model in measuring the plant’s effectiveness improvement was sustainable due to the integration of regression and error-proof windows that enabled data updating to enhance improvement. However, improvements measured based on error-proof, 6-sigma metric were better and more stable than 3-sigma metric across singular and combined OEE factors (Table 9).
It was revealed from the table that 6-sigma error-proofing produced stable, satisfactory, and sustainable OEE improvements of actual and predicted values (0.78, 0.70) and (0.42, 0.40) over the lowest acceptable OEE for the 3-factor and 5-factor models, respectively. The improvement excesses of the 3-factor model were reflected in these results. Though the improvement attained using the 5-factor model was lesser than that of the 3-factor, but both were world-class compliant, sustainable, satisfactory, and significant to survive any emerging competitiveness. In comparison with past similar studies, attainment of 42% improvement based on the 5-factor, 6-sigma model was considered better than 20% and 23% obtained using lean & green (Pampanelli et al., 2014) and lean bundle (Shah and Ward, 2003) models, respectively.
Table 6. OEE Factors-Annual Outcome Predictions. OEE Factors Year(x) 1 2 3 4 5 6 7 8 Availability Expected, t2(x) 9,974.58 13,758.50 14,594.79 14,765.67 16,075.86 18,443.86 20,269.77 20,579.62 Availability Delivered, t1(x) 11,212.73 13,531.04 14,590.74 16,337.48 17,908.30 18,651.29 19,164.59 20,354.39 Quality expected, Gp(x) 76.98 70.17 78.48 80.41 80.39 82.37 83.32 86.53 Quality delivered, G(x) 74.99 76.04 76.87 77.11 77.43 77.47 76.03 73.42 Performance expected, tn(x) 89.995 91.030 91.400 91.61 91.477 91.66 91.466 90.263 Performance delivered, t0(x) 89.991 91.066 79.995 81.975 84.925 80.375 71.375 77.375 Ergonomics Expected, Ta(x) 21.997 21.996 22.987 21.968 21.938 22.892 21.829 21.744 Ergonomics Delivered, Ts(x) 23.996 24.076 24.320 22.312 23.576 24.823 18.949 21.767 Waste Expected, Pw(x) 3.18 1.03 2.10 2.12 2.15 3.14 4.75 8.26 Waste Delivered, Gw(x) 3.50 3.10 3.12 2.55 2.30 2.87 4.44 7.06
Development of OEE Error-proof (OEE-EP) Model for Production Process Improvement
70
Table 7. Prediction and Evaluation of OEE for the Production Process.
OEE measure, yi /year (x) 1 2 3 4 5 6 7 8 MSE.10-3 yi’.min. x*min
Availability yi(α) Actual (A) Predicted (P)
1.12 1.12
1.00 0.98
0.97 0.99
1.14 1.11
1.12 1.11
0.97 1.01
0.98 0.95
0.98 0.99
0.55
0.97 0.95
3,6 7
Quality yi(μ) Actual Predicted
0.97 0.97
1.09 1.08
0.98 0.98
0.97 0.96
0.96 0.96
0.97 0.94
0.97 0.91
0.99 0.95
3.00
0.96 0.94
5 6
Performance yi(β) Actual Predicted
1.00 1.00
1.00 1.00
0.87 0.87
0.86 0.89
0.89 0.92
0.84 0.87
0.86 0.78
0.89 0.86
1.25
0.84 0.78
6 7
Human/Ergonomics, yi(γ) Actual Predicted
1.00 0.91
1.00 0.91
0.77 0.84
1.00 0.99
0.99 0.93
1.00 0.92
1.00 1.15
1.00 1.00
6.71
0.77 0.84
3 3
Waste yi(ω ) Actual *unaccepted Predicted, Bold, mini. acceptable
0.91 0.91
0.32* 0.33*
0.70 0.68
0.74 0.83
0.94 0.94
0.93 1.09
1.00 1.09
1.00 1.17
8.90
0.70 0.68
3 3
5-factor OEE’-New-method (A) (P)
0.98 0.90
0.34 0.32
0.45 0.48
0.70 0.78
0.89 0.86
0.74 0.82
0.82 0.84
0.86 0.85
2.73
0.45 0.48
3 3
3-factor OEE- old method (A) (P)
1.08 1.08
1.06 1.06
0.83 0.84
0.95 0.95
0.96 0.98
0.79 0.82
0.82 0.68
0.86 0.73
4.70
0.79 0.68
6 7
Table 8. Improvement dynamism on the OEEs using three-sigma metrics.
Improvement dynamism OEE-EP (OEEc) at σj=3 = 0.067 measured at yi
’min./year (x) (Eqn. (14)), yi
’*(x)min
1 2 3 4 5 6 7 8 9
Availability (α) Actual (A) Predicted (P)
0.90 0.87
0.84 0.98
0.79 0.77
0.73 0.72
0.68 0.67
0.64 0.63
0.59 0.59
0.56 0.55
0.52 0.51
Quality (μ) Actual Predicted
0.89 0.88
0.84 0.82
0.78 0.76
0.73 0.71
0.68 0.67
0.63 0.62
0.59 0.58
0.55 0.54
0.51 0.50
Performance (β) Actual Predicted
0.78 0.73
0.73 0.68
0.68 0.63
0.64 0.59
0.59 0.55
0.55 0.52
0.52 0.48
0.48 0.45
0.45 0.42
Human/Ergonomics, (γ) Actual Predicted
0.72 0.78
0.67 0.73
0.63 0.68
0.58 0.64
0.54 0.59
0.51 0.55
0.47 0.52
0.44 0.48
0.41 0.45
Waste (ω ) Actual Predicted
0.65 0.63
0.61 0.59
0.57 0.55
0.53 0.52
0.49 0.48
0.46 0.45
0.43 0.42
0.40 0.39
0.38 0.36
Max. improvement over 3-factor, 3-sigma: OEEc* (OEE-EP*) (Eqn. (15))
(A) (P)
0.62 0.56
0.52 0.46
0.42 0.37
0.34 0.30
0.27 0.25
0.22 0.20
0.18 0.16
0.15 0.13
0.12 0.11
Max. improvement over 5-factor, 3-sigma: OEEc* (OEE-EP*) (Eqn. (15))
(A) (P)
0.29 0.28
0.21 0.20
0.15 0.14
0.10 0.10
0.07 0.07
0.06 0.06
0.04 0.04
0.03 0.03
0.02 0.02
Table 9. Improvement dynamism on the OEEs using six-sigma metrics. Improvement dynamism OEE-EP (OEEc) at σj=6 = 0.0000034 measured at (yi)min. /year (x) (Eqn. (14)), yi
’*(x)min.
1 2 3 4 5 6 7 8 9
Availability (α) Actual (A) Predicted (P)
0.97 0.95
0.97 0.95
0.97 0.95
0.97 0.95
0.97 0.95
0.97 0.95
0.97 0.95
0.97 0.95
0.97 0.95
Quality (μ) Actual Predicted
0.96 0.94
0.96 0.94
0.96 0.94
0.96 0.94
0.96 0.94
0.96 0.94
0.96 0.94
0.96 0.94
0.96 0.94
Performance (β) Actual Predicted
0.84 0.78
0.84 0.78
0.84 0.78
0.84 0.78
0.84 0.78
0.84 0.78
0.84 0.78
0.84 0.78
0.84 0.78
Human/Ergonomics, (γ) Actual Predicted
0.77 0.84
0.77 0.84
0.77 0.84
0.77 0.84
0.77 0.84
0.77 0.84
0.77 0.84
0.77 0.84
0.77 0.84
Waste (ω ) Actual Predicted
0.70 0.68
0.70 0.68
0.70 0.68
0.70 0.68
0.70 0.68
0.70 0.68
0.70 0.68
0.70 0.68
0.70 0.68
Max. improvement over 3-factor, 6-sigma: OEEc* (OEE-EP*) (Eqn. (15))
(A) (P)
0.78 0.70
0.78 0.70
0.78 0.70
0.78 0.70
0.78 0.70
0.78 0.70
0.78 0.70
0.78 0.70
0.78 0.70
Max. improvement over 5-factor, 6-sigma: OEEc* (OEE-EP*) (Eqn. (15))
(A) (P)
0.42 0.40
0.42 0.40
0.42 0.40
0.42 0.40
0.42 0.40
0.42 0.40
0.42 0.40
0.42 0.40
0.42 0.40
The 3-factor based performance (65%) attained by Hedman et al. (2016) using automatic measurement approach can only compete with the 62% improve-
ement of this new 3-factor, 3-sigma error-proof model (Table 8), but far below 78% attainable from the 3-factor, 6-sigma error-proof model (Table 9).

B. Kareem, A.S. Alabi, T.I. Ogedengbe, B.O. Akinnuli, O.A. Aderoba, and M.O. Idris
71
5. CONCLUSION The OEE model has been effectively formulated to plan production, labor utilization, maintenance, and working environment as reflected in the attainment of waste reduction, availability, quality, and performance improvements. The integration of human/ergonomic workplace environment (temperature) and system waste generation factors into the OEE measures has broken new ground in the field of overall equipment effectiveness research. Attainment of dynamism in the system effectiveness measures through the incorporation of best regression models and integration of encompassing error-proof, sigma metric parameter has made the system unique in terms of providing sustainable performance as compared to other popular techniques.
The six-sigma has performed well in system error-proofing and at the same time providing better productivity improvement platforms for the fast-moving goods production process. The models were applied successfully to measure critical equipment effectiveness factors which are availability, performance, quality, workplace condition (temperature), and material waste of a production plant. On this basis, challenges that hindered the effective operation of the plant were mitigated and improved system was sustained.
Results obtained using different scenarios of the model application to a production line showed a low performance which was improved upon using a better improvement program, the new OEE-EP model. The application of the OEE-EP model has made a landmark achievement by providing the highest level of improvements (0.42, 0.78), which are far better than those obtainable from past studies (0.20, 0.23). This landmark achievement can be attributed to excellent accuracy provided by error-proof, six-sigma metric in minimizing process variation. Specific conclusions drawn from this study are enumerated as follows: i. Unstable overall equipment effectiveness
measures were obtained for the company in the years under review. This revealed the need for the company to be evaluating her productivity/overall equipment effectiveness annually for early correction of any ailing process factor before it gets out of control to stabilize the changing firm’s productivity over time.
ii. The continuous improvement of the production process has been achieved for the company using overall equipment effectiveness error-proof strategy without an increase in input resources. This outcome has shown the management of the company the undesirability of increasing input resources before getting the productivity of the production process improved. Proper choice of resources management strategy can sustain and improve productivity. This has been shown by the outcome of this study.
iii. There is a wide gap between traditional 3-factor OEE and new scheme 5-factor OEE results. Therefore, in the presence of uncertainty, it is advisable that the company base its productivity measure on 5-factor which is more robust.
iv. The integration of error-proof sigma metric as a means of continuous improvement in the production process of the company has resulted in sustainable and stable productivity improvement. This lean metric has performed better than other improvement metrics such as lean bundle, lean green, and automation.
v. The data set available for productivity/OEE prediction was small. This can affect prediction accuracy. To improve prediction accuracy, it is advisable that the company has a good record of annual OEE data for timely data updates.
Further study is required in real-time implementation of the process through the application of computer programs to handle large data, to serve as a source of artificial intelligence at enhancing robust decision making in the future as regards the performance of the OEE-EP model. In such a study the null hypothesis shall be; the new OEE-EP model is robust enough to withstand emerging (future) wastes and environmental challenges, while the alternative hypothesis shall be the model cannot withstand future challenges.
Proper identification of processes that required improvement, choice of appropriate improvement methods (tools) required and adequate representation of the process outcomes for good decision making are other areas of further research. The implementation of this scheme will require good experience and deep knowledge of processes identification and analysis with criticality and necessity consideration.
CONFLICT OF INTEREST The authors declare that there are no conflicts of interest as regards this article. FUNDING
Managements of Federal University of Technology, Akure, and Fast Moving Products Industry, Ibadan, Nigeria are acknowledged for providing funds and facilities for the successful completion of this project. ACKNOWLEDGMENT B. Kareem thanks the management and staff of Fast Moving Products Industry for providing relevant information used in this study. The contribution of industrial and production engineering research group leader, Federal University of Technology Akure (FUTA), Nigeria is also acknowledged.
Development of OEE Error-proof (OEE-EP) Model for Production Process Improvement
72
REFERENCES
Adams JA (2014), Human factors engineering. New York: McMillan Publishing.
AFSC-Air Force Systems Command, (2010),Air Force Systems Command Design Handbook, Human Factors Engineering. United Kingdom: McMillan Publishing.
Alexander DC (2012), The practice and management of industrial ergonomics. New York: Englewood Cliffs, NJ: Prentice-Hall.
Almeanazel OTR (2010), Total productive maintenance review and overall equipment effectiveness measurement. Jordan Journal of Mechanical and Industrial Engineering (JJMIE) 4(4): 517 – 522.
Andersson C, Bellgran M (2015), On the complexity of using performance measures: Enhancing sustained production improvement capability by combining OEE and productivity. Journal of Manufacturing Systems, 35: 144-154.
Anvari F, Edwards R, Starr A (2010), Evaluation of overall equipment effectiveness based on market. Journal of Quality in Maintenance Engineering 16(3): 256-270.
Bhattachcharjee A, Roy S, Kundu S, Tiwary M, Chakraborty R (2019), An analytical approach to measure OEE for blast furnaces. Journal Ironmaking & Steelmaking; Processes, Products and Applications, published online: 31Jan 2019.
Binti Aminuddin NA, Garza-Reyes JA, Kumar V, Antony J, Rocha-Lona L (2016), An analysis of managerial factors affecting the implementation and use of overall equipment effectiveness. International Journal of Production Research 54(15): 4430-4447.
Braglia M, Frosolini M, Zammori F (2009), Overall equipment effectiveness of a manufacturing line (OEEML): An integrated approach to assess systems performance. Journal of Manufacturing Technology Management 20(1) 8-29.
Bruce CH (2006), Best Practices in Maintenance, http://www.tpmonline.com/articles_on_total_ productivemaintenance/management.htm, accessed 26:09:2011.
Butlewski M, Dahlke G, Drzewiecka-Dahlke M, G-orny A, Pacholski L (2018), Implementation of TPM methodology in worker fatigue management - a macroergonomic approach. Advanced Intelligence Systems and Computing 605:32-41. Dilworth JB (2013), Production and operations management. New York: McGraw-Hill.
Domingo R, Aguado S (2015), Overall environmental equipment effectiveness as a metric of a lean and green manufacturing system. Sustainability 7(7): 9031-9047.
Garza‐Reyes JA, Eldridge S, Barber KD, Soriano‐Meier H (2010), Overall equipment effectiveness (OEE) and process
capability (PC) measures: A relationship analysis. International Journal of Quality & Reliability Management 27(1): 48-62.
Gharbi A, Kennen JP (2000), Production and preventive maintenance rates control for a manufacturing system: An experimental design approach, International Journals of Production Economics 65: 275-287.
Ghazali A, Adegbola AA, Olaiya KA, Yusuff ON, Kareem B (2013): Evaluation of workers’ perception on safety in selected industries within Ibadan metropolis. SEEM Research and Development Journal 2(1): 82-88.
Godfrey P (2002), How the return on investment and cash flow can be improved by using the overall equipment effectiveness measure. Manufacturing Engineer 81(2): 109-112.
Hansen RC (2002), Overall equipment effectiveness: a powerful production/maintenance tool for increased profits. New York: Industrial Press Inc.
Hayes AF (2018), Introduction to mediation, moderation, and conditional process analysis: A regression-based approach. New York: The Guilford Press.
Hedman R, Subramaniyan M, Almström P (2016), Analysis of critical factors for automatic measurement of OEE. Procedia CIRP 57: 128-133
Hossain MSJ, Sarker BR (2016), Overall equipment effectiveness measures of engineering production systems, Conference paper: 2016 Annual Meeting of the Decision Science Institute, Austin, Texas, USA, accessed at www.researchgate.net/publication/315666207
Joshi S, Gupta R (1986), Scheduling of Routine Maintenance Using Production Schedule and Equipment Failure History. International Journal of Computers and Industrial Engineering 10(1) 11-20.
Kadiri M. A. (2000), “Scheduling of preventive maintenance in a manufacturing company: A computer model approach”, Unpublished M.S. Thesis, Dept. of Ind. and Prod. Eng., University of Ibadan, NG.
Kareem B, Jewo AO (2015), Development of a model for failure prediction on critical equipment in the petrochemical industry. Engineering Failure Analysis 56: 338–347.
Künsch HR, Stefanski LA, Carroll RJ (2012), Conditionally unbiased bounded-influence estimation in general regression models, with applications to generalized linear models. Journal of the American Statistical Association 84 (406): 23-37
Lanza G, Stoll J, Stricker N, Peters S, Lorenz C (2013), Measuring global production effectiveness. Forty Sixth CIRP Conference on Manufacturing Systems 2013, Procedia CIRP, 7 (2013), 31-36.
Lennon P (2016), Root-cause analysis underscores the
B. Kareem, A.S. Alabi, T.I. Ogedengbe, B.O. Akinnuli, O.A. Aderoba, and M.O. Idris
73
importance of understanding, addressing and communicating cold chain equipment failures to improve equipment performance. Technical report, Los Angeles, USA.
Ljungberg O (1998), Measurement of overall equipment effectiveness as a basis for TPM activities. International Journal of Operations & Production Management 18(5): 495-507.
Madhavan E, Paul R, Rajmohan M (2011), Study on the influence of human factors. European Journals, 23: 179-192.
Marselli M (2004), Lean manufacturing and six-sigma, Wire Journal International, http://www.aemconsulting.com/pdf/lean.pdf. accessed 12-10-2018
Martand T (2014), Industrial engineering and production management. New Delhi: S.Chand & Company Ltd.
Meyer FE, Stewart JR (2018), Motion and time study for lean manufacturing, 3rd edition, JS-89867 US, https://rzo0o4khw01.storage.googleapis.com/MDEzMDDMxNjcwOQ==01.pdf accessed 19-05-2018.
Michael JK (2015), Six sigma green belt training manual, Michael JK (UK Based), Lagos, NG.
Muchiri P, Pintelon L (2008), Performance measurement using overall equipment effectiveness (OEE): literature review and practical application discussion. International journal of production research 46(13): 3517-3535.
Muñoz-Villamizar A, Santos J, Montoya-Torres J, Jaca C (2018), Using OEE to evaluate the effectiveness of urban freight transportation systems: A case study. International Journal of Production Economics 197: 232-242.
Munteanu D, Gabor C, Munteanu I, Schreiner A (2010), Possibilities for increasing efficiency of industrial equipment. Bulletin of the Transilvania University of Brasov, Series I: Engineering Sciences 3(52):199-204.
Muraa MD (2016), Worker skills and equipment optimization in assembly line balancing by a Genetic Approach. Technical report, Dept. of Civil and Ind. Eng., Univ. of Pisa, Italy.
Muthiah KMN, Huang SH, Mahadevan S (2008), Automating factory performance diagnostics using overall throughput effectiveness (OTE) metric. International Journal of Advanced Manufacturing Technology 36(8): 11–824.
Mwanza BG (2017), An assessment of the effectiveness of equipment maintenance, practices in public hospitals. Technical report, Univ. of Johannesburg, South Africa.
Nachiappan RM, Anantharaman N (2006), Evaluation of overall line effectiveness (OLE) in a continuous product line manufacturing system. Journal of Manufacturing Technology Management 17(7): 987-1008
Pampanelli AB, Found P, Bernardes AM (2014), A lean & green model for a production cell. Journal of Cleaner Production 85: 19-30
Peng L, Huang Y (2012), Survival analysis with quartile regression models. Journal of the American Statistical Association 103 (482): 637-649
Prinz C (2017): Implementation of a learning environment for an Industrie 4.0 assistance system to improve the overall equipment effectiveness. Technical report, A Ruhr-Universität Bochum, Chair of Production Systems, Bochum, Germany.
Ryan AG, Montegomery DC, Peck EA, Vining GG, Ryan AG (2013), Solution manual to accompany introduction to linear regression analysis. New Jersey: John Wiley & Son Inc.
Samat HA, Kamaruddin S, Azid IA (2012), Integration of overall equipment effectiveness (OEE) and reliability method for measuring machine effectiveness. South African Journal of Industrial Engineering 23(1): 92-113.
Sarker BR (2001), Measures of grouping efficiency in cellular manufacturing systems. European Journal of Operational Research 130(3): 588-611.
Sayuti M, Juliananda, Syarifuddin F (2019), Analysis of the overall equipment effectiveness (OEE) to minimize six big losses of pulp machine: a case study in pulp and paper industries. International Conference on Science and Innovated Engineering (I-COSINE), IOP Conf. Series: Materials Science and Engineering 536 (2019): 012136 doi:10.1088/1757-899X/536/1/012136.
Shah R, Ward PT (2003), Lean manufacturing: context, practice bundles, and performance. Journal of Operations Management 21(2): 129-149
Singh R, Shah DB, Gohil AM, Shah MH (2013), Overall equipment effectiveness (OEE) calculation - automation through hardware & software development. Procedia Engineering 51: 579-584
Swamidassa PM, Kothab S (1998), Explaining manufacturing technology use, firm size and performance using a multidimensional view of technology. Journal of Operations Management 17(1): 23-37
Wang TY, Pan HC (2011), Improving the OEE and UPH data quality by Automated Data Collection for the semiconductor assembly industry. Expert Systems with Applications 38(5): 5764-5773.
Wilson L (2010), How to implement lean manufacturing. New York: McGraw-Hill Inc.
Wudhikarn R (2010), Overall weighting equipment effectiveness. Proceedings of the 2010 IEEE IEEM, 23-27.
Wudhikarn R (2012), Improving overall equipment cost loss adding cost of quality. International Journal of Production Research

Development of OEE Error-proof (OEE-EP) Model for Production Process Improvement
74
50(12): 3434-3449. Yuniawan D, Ito T, Bin ME (2013), Calculation of
overall equipment effectiveness weight by Taguchi method with simulation. Concurrent Engineering 21(4): 296-306. Zammori F, Braglia M, Frosolini M (2011), Stochastic overall equipment effectiveness.
International Journal of Production Research 49(21): 6469-6490.
Zuashkiani A, Rahmandad H, Jardine AKS (2011), Mapping the dynamics of overall equipment effectiveness to enhance asset management practices. Journal of Quality in Maintenance Engineering 17(1): 74-92.