Development of Metastable Solidification Structures … · Development of Metastable Solidification...
10
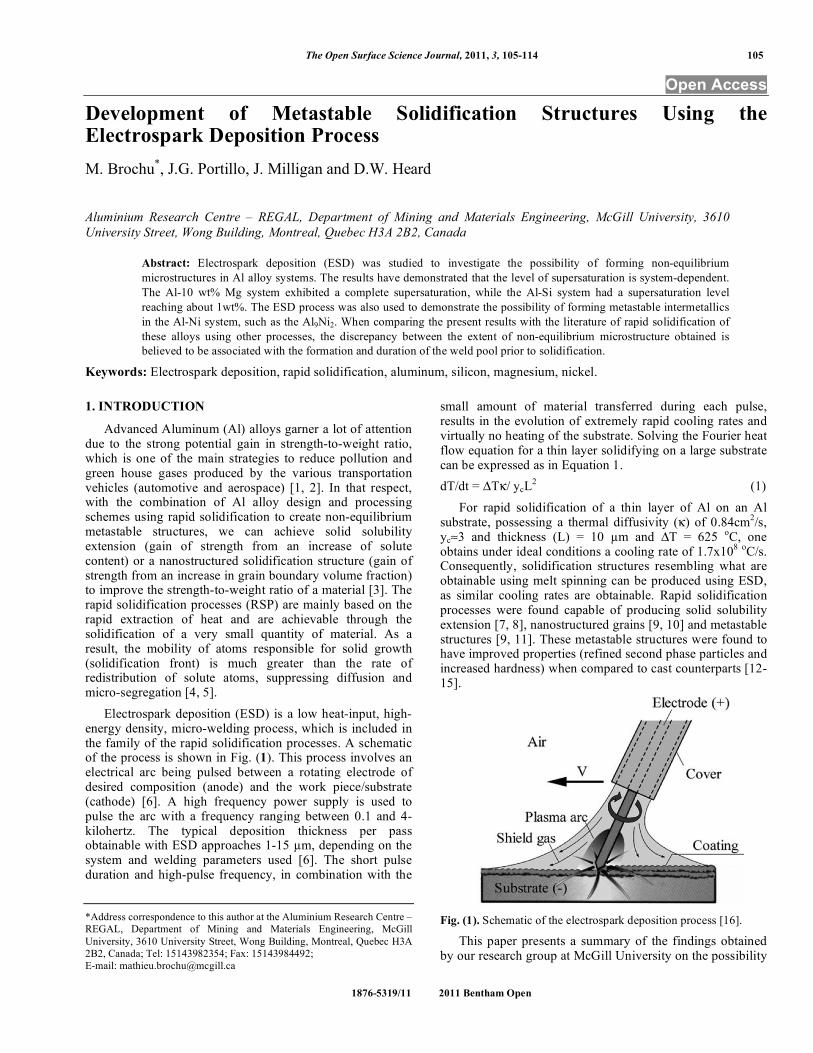
The Open Surface Science Journal, 2011, 3, 105-114 105 1876-5319/11 2011 Bentham Open Open Access Development of Metastable Solidification Structures Using the Electrospark Deposition Process M. Brochu * , J.G. Portillo, J. Milligan and D.W. Heard Aluminium Research Centre – REGAL, Department of Mining and Materials Engineering, McGill University, 3610 University Street, Wong Building, Montreal, Quebec H3A 2B2, Canada Abstract: Electrospark deposition (ESD) was studied to investigate the possibility of forming non-equilibrium microstructures in Al alloy systems. The results have demonstrated that the level of supersaturation is system-dependent. The Al-10 wt% Mg system exhibited a complete supersaturation, while the Al-Si system had a supersaturation level reaching about 1wt%. The ESD process was also used to demonstrate the possibility of forming metastable intermetallics in the Al-Ni system, such as the Al 9 Ni 2 . When comparing the present results with the literature of rapid solidification of these alloys using other processes, the discrepancy between the extent of non-equilibrium microstructure obtained is believed to be associated with the formation and duration of the weld pool prior to solidification. Keywords: Electrospark deposition, rapid solidification, aluminum, silicon, magnesium, nickel. 1. INTRODUCTION Advanced Aluminum (Al) alloys garner a lot of attention due to the strong potential gain in strength-to-weight ratio, which is one of the main strategies to reduce pollution and green house gases produced by the various transportation vehicles (automotive and aerospace) [1, 2]. In that respect, with the combination of Al alloy design and processing schemes using rapid solidification to create non-equilibrium metastable structures, we can achieve solid solubility extension (gain of strength from an increase of solute content) or a nanostructured solidification structure (gain of strength from an increase in grain boundary volume fraction) to improve the strength-to-weight ratio of a material [3]. The rapid solidification processes (RSP) are mainly based on the rapid extraction of heat and are achievable through the solidification of a very small quantity of material. As a result, the mobility of atoms responsible for solid growth (solidification front) is much greater than the rate of redistribution of solute atoms, suppressing diffusion and micro-segregation [4, 5]. Electrospark deposition (ESD) is a low heat-input, high- energy density, micro-welding process, which is included in the family of the rapid solidification processes. A schematic of the process is shown in Fig. (1). This process involves an electrical arc being pulsed between a rotating electrode of desired composition (anode) and the work piece/substrate (cathode) [6]. A high frequency power supply is used to pulse the arc with a frequency ranging between 0.1 and 4- kilohertz. The typical deposition thickness per pass obtainable with ESD approaches 1-15 m, depending on the system and welding parameters used [6]. The short pulse duration and high-pulse frequency, in combination with the *Address correspondence to this author at the Aluminium Research Centre – REGAL, Department of Mining and Materials Engineering, McGill University, 3610 University Street, Wong Building, Montreal, Quebec H3A 2B2, Canada; Tel: 15143982354; Fax: 15143984492; E-mail: [email protected] small amount of material transferred during each pulse, results in the evolution of extremely rapid cooling rates and virtually no heating of the substrate. Solving the Fourier heat flow equation for a thin layer solidifying on a large substrate can be expressed as in Equation 1. dT/dt = T/ y c L 2 (1) For rapid solidification of a thin layer of Al on an Al substrate, possessing a thermal diffusivity () of 0.84cm 2 /s, y c 3 and thickness (L) = 10 m and T = 625 o C, one obtains under ideal conditions a cooling rate of 1.7x10 8 o C/s. Consequently, solidification structures resembling what are obtainable using melt spinning can be produced using ESD, as similar cooling rates are obtainable. Rapid solidification processes were found capable of producing solid solubility extension [7, 8], nanostructured grains [9, 10] and metastable structures [9, 11]. These metastable structures were found to have improved properties (refined second phase particles and increased hardness) when compared to cast counterparts [12- 15]. Fig. (1). Schematic of the electrospark deposition process [16]. This paper presents a summary of the findings obtained by our research group at McGill University on the possibility
Transcript of Development of Metastable Solidification Structures … · Development of Metastable Solidification...
The Open Surface Science Journal, 2011, 3, 105-114 105
1876-5319/11 2011 Bentham Open
Open Access
Development of Metastable Solidification Structures Using the Electrospark Deposition Process
M. Brochu*, J.G. Portillo, J. Milligan and D.W. Heard
Aluminium Research Centre – REGAL, Department of Mining and Materials Engineering, McGill University, 3610
University Street, Wong Building, Montreal, Quebec H3A 2B2, Canada
Abstract: Electrospark deposition (ESD) was studied to investigate the possibility of forming non-equilibrium microstructures in Al alloy systems. The results have demonstrated that the level of supersaturation is system-dependent. The Al-10 wt% Mg system exhibited a complete supersaturation, while the Al-Si system had a supersaturation level reaching about 1wt%. The ESD process was also used to demonstrate the possibility of forming metastable intermetallics in the Al-Ni system, such as the Al9Ni2. When comparing the present results with the literature of rapid solidification of these alloys using other processes, the discrepancy between the extent of non-equilibrium microstructure obtained is believed to be associated with the formation and duration of the weld pool prior to solidification.
Keywords: Electrospark deposition, rapid solidification, aluminum, silicon, magnesium, nickel.
1. INTRODUCTION
Advanced Aluminum (Al) alloys garner a lot of attention due to the strong potential gain in strength-to-weight ratio, which is one of the main strategies to reduce pollution and green house gases produced by the various transportation vehicles (automotive and aerospace) [1, 2]. In that respect, with the combination of Al alloy design and processing schemes using rapid solidification to create non-equilibrium metastable structures, we can achieve solid solubility extension (gain of strength from an increase of solute content) or a nanostructured solidification structure (gain of strength from an increase in grain boundary volume fraction) to improve the strength-to-weight ratio of a material [3]. The rapid solidification processes (RSP) are mainly based on the rapid extraction of heat and are achievable through the solidification of a very small quantity of material. As a result, the mobility of atoms responsible for solid growth (solidification front) is much greater than the rate of redistribution of solute atoms, suppressing diffusion and micro-segregation [4, 5].
Electrospark deposition (ESD) is a low heat-input, high-energy density, micro-welding process, which is included in the family of the rapid solidification processes. A schematic of the process is shown in Fig. (1). This process involves an electrical arc being pulsed between a rotating electrode of desired composition (anode) and the work piece/substrate (cathode) [6]. A high frequency power supply is used to pulse the arc with a frequency ranging between 0.1 and 4-kilohertz. The typical deposition thickness per pass obtainable with ESD approaches 1-15 m, depending on the system and welding parameters used [6]. The short pulse duration and high-pulse frequency, in combination with the
*Address correspondence to this author at the Aluminium Research Centre – REGAL, Department of Mining and Materials Engineering, McGill University, 3610 University Street, Wong Building, Montreal, Quebec H3A 2B2, Canada; Tel: 15143982354; Fax: 15143984492; E-mail: [email protected]
small amount of material transferred during each pulse, results in the evolution of extremely rapid cooling rates and virtually no heating of the substrate. Solving the Fourier heat flow equation for a thin layer solidifying on a large substrate can be expressed as in Equation 1.
dT/dt = T / ycL2 (1)
For rapid solidification of a thin layer of Al on an Al substrate, possessing a thermal diffusivity ( ) of 0.84cm2/s, yc 3 and thickness (L) = 10 m and T = 625 oC, one obtains under ideal conditions a cooling rate of 1.7x10⁸ oC/s. Consequently, solidification structures resembling what are obtainable using melt spinning can be produced using ESD, as similar cooling rates are obtainable. Rapid solidification processes were found capable of producing solid solubility extension [7, 8], nanostructured grains [9, 10] and metastable structures [9, 11]. These metastable structures were found to have improved properties (refined second phase particles and increased hardness) when compared to cast counterparts [12-15].
Fig. (1). Schematic of the electrospark deposition process [16].
This paper presents a summary of the findings obtained by our research group at McGill University on the possibility
106 The Open Surface Science Journal, 2011, Volume 3 Brochu et al.
of obtaining metastable microstructures using ESD. This paper contains experimental results demonstrating the possibility of fabricating extended solid solutions, nanostructured solidification structure, and quasi-crystalline structures. It also contains insight on thermodynamic considerations underlying the solidification structure. The ESD deposits were performed using a ‘‘Technocoat MicroDepo Model 150” and a “SparkDepo 500’’ ESD machine. Since the systems studied are based on Al alloys and to facilitate the deposition, similar electrode/substrate material combination is desired, depositions were performed onto Al substrates. The depositions were performed in an Argon atmosphere, to prevent oxidation of the deposited material. The analysis of the microstructure was performed by conventional analytical techniques, such as Scanning Electron Microscopy (SEM – Hitachi S4700) accompanied by Energy Dispersive X-Ray Spectroscopy (EDS) and X-Ray Diffraction (XRD – Philips 1730 CuKa).
2. THERMODYNAMIC CONSIDERATIONS RELATED TO RAPID SOLIDIFICATION
Equilibrium phase diagrams are often used to explain the resulting microstructure arising from solidification of conventional casting and welding processes. Despite the development of non-equilibrium microstructures, the relatively low solidification rates observed with these processes do not produce large deviations from the thermodynamic predictions, as diffusion in the liquid state and at the solidification front is still occurring. Complications are found when the cooling rate is increased, since the deviations found between the experimental results and the thermodynamic predictions are too large and thus, equilibrium phase diagrams are no longer useful as the material does not have time to reach equilibrium.
Metastable phases and phase diagrams are constructed around the hypothesis that atomic diffusion is suppressed. Rapid solidification limits the time available for melts to nucleate equilibrium phases and often favours the nucleation
of non-equilibrium phases. Two reasons are believed to explain the formation of non-equilibrium phases. Firstly, the composition shift required to nucleate the equilibrium phase may require time-scales longer than what exists during RSP. Secondly, the interfacial tension between the metastable phase-liquid interfaces may be lower than that for the equilibrium phase-liquid interfaces. In either case, the nucleation barrier of the metastable phase becomes lower and completely replaces the equilibrium phases. Analogous to metallic glasses, metastable phases are characterized by an increased enthalpy, when compared to equilibrium compounds and thus, are releasing energy during transformation to equilibrium phases.
Two different types of metastable phases can be obtained during rapid solidification. Firstly, metastable phases can be obtained through a change of chemical composition for a given phase and are often referred to as solid solubility extension. In this case, the chemical composition of the alloy is outside the range of the solid solution as shown by the equilibrium conditions, but still exhibits the characteristics of the solid solution alloy. Secondly, metastable phases are also obtainable through a change in the phases present for a given composition. In such a case, the alloy has a crystal structure and stoichiometry not present on the phase diagram and must be experimentally observed. Thus, rapid solidification processes restrict chemical diffusion and consequently yield deviation from chemical equilibrium.
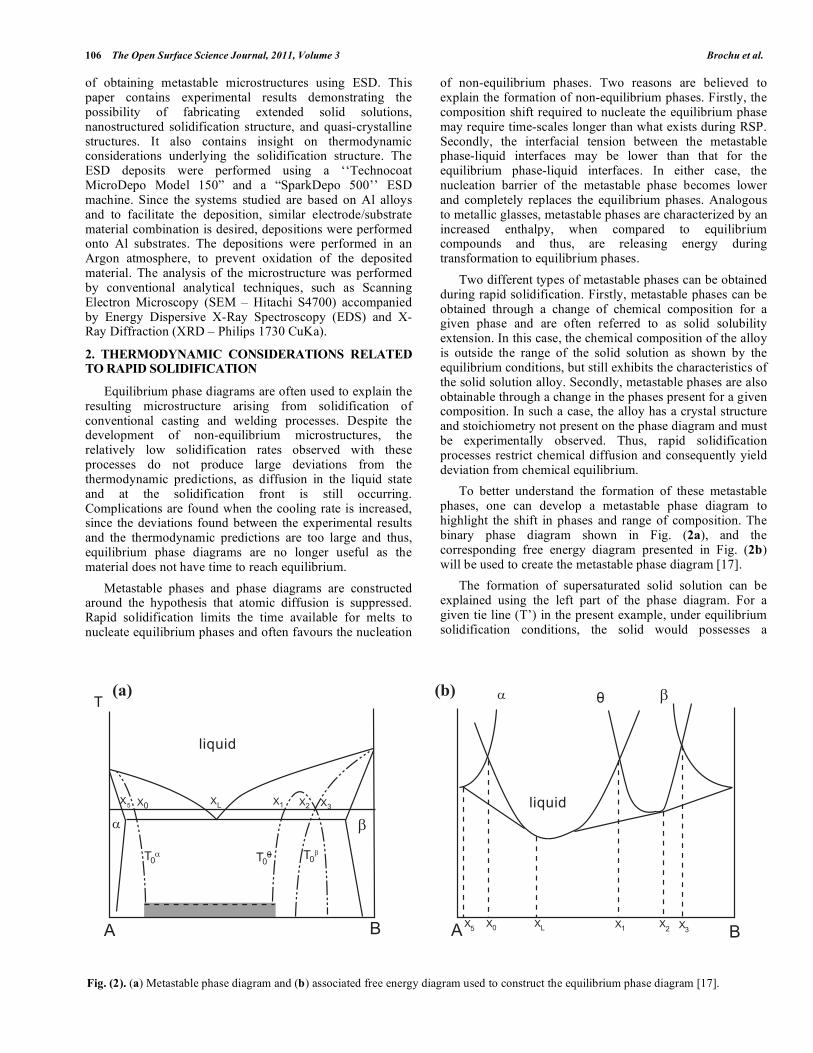
To better understand the formation of these metastable phases, one can develop a metastable phase diagram to highlight the shift in phases and range of composition. The binary phase diagram shown in Fig. (2a), and the corresponding free energy diagram presented in Fig. (2b) will be used to create the metastable phase diagram [17].
The formation of supersaturated solid solution can be explained using the left part of the phase diagram. For a given tie line (T’) in the present example, under equilibrium solidification conditions, the solid would possesses a
Fig. (2). (a) Metastable phase diagram and (b) associated free energy diagram used to construct the equilibrium phase diagram [17].
����
������
��
�
�� �� � ��
�
��� � �
� � � ���� ������
������
�
����
Development of Metastable Solidification Structures The Open Surface Science Journal, 2011, Volume 3 107
chemical composition of XS and the liquid would have the chemical composition XL. This tie line is shown on the free energy diagram between the XS and XL compositions. If rapid solidification is imposed, since diffusion is suppressed, the phase separation between the XS and XL will not occur and the solid phase becomes the most stable phase up to the Xo composition, after which the liquid becomes the most stable phase. This change in stable phase occurring at Xo as a function of temperature is called To, and represents the melting temperature of a homogeneous supersaturated solid solution obtained by rapid solidification. Since this paper will focus on results obtained for Al systems, a survey of the literature was done to build a database of To compositions for such alloys and the results are presented in Table 1. Since the solidification characteristics obtained using ESD are similar to what is obtained using the melt spinning process, it is expected that supersaturated solid solution and/or metastable structures can be formed for solute concentrations below and above this critical composition when process conditions are suitable.
Table 1. Solid Solubilities in Aluminum Achievable Using
Rapid Solidification [18]
Solid Solubility (Weight Percent)
Solute Maximum at
Equilibrium
Maximum Reported by
Rapid Solidification
Mg 17.4 34.4 - 37.5
Si 1.65 10.4 - 16.6
Ni 0.05 2.6 - 15.4
The formation of metastable phases will be explained using the right section of the binary phase and free energy diagrams shown in Fig. (2). As depicted, a metastable phase, named for this example, does not appear on the equilibrium phase diagram, as the free energy of formation is higher than the equilibrium phases XS’ and XL’ linked by the tie line. Similarly to the previous example, since rapid cooling rates are used, phase separation will not occur and as depicted, for a certain composition range, the free energy of the -phase becomes lower than that of the equilibrium -
phase. In such case, the solidification product should be the metastable phase.
The last compositional range of interest in the phase diagram presented in Fig. (2a) ranges between the To of the supersaturated solid solution and the To of the metastable phase . This composition rage is a glass forming range for the given binary alloy. This indeed is translated by the free energy of the liquid used to predict the solidification structure. By doing so, the section of the composition driven by the free energy of the liquid will be assumed to solidify, resulting in a supercooled liquid structure, hence the designation of amorphous phase field in the metastable phase diagram.
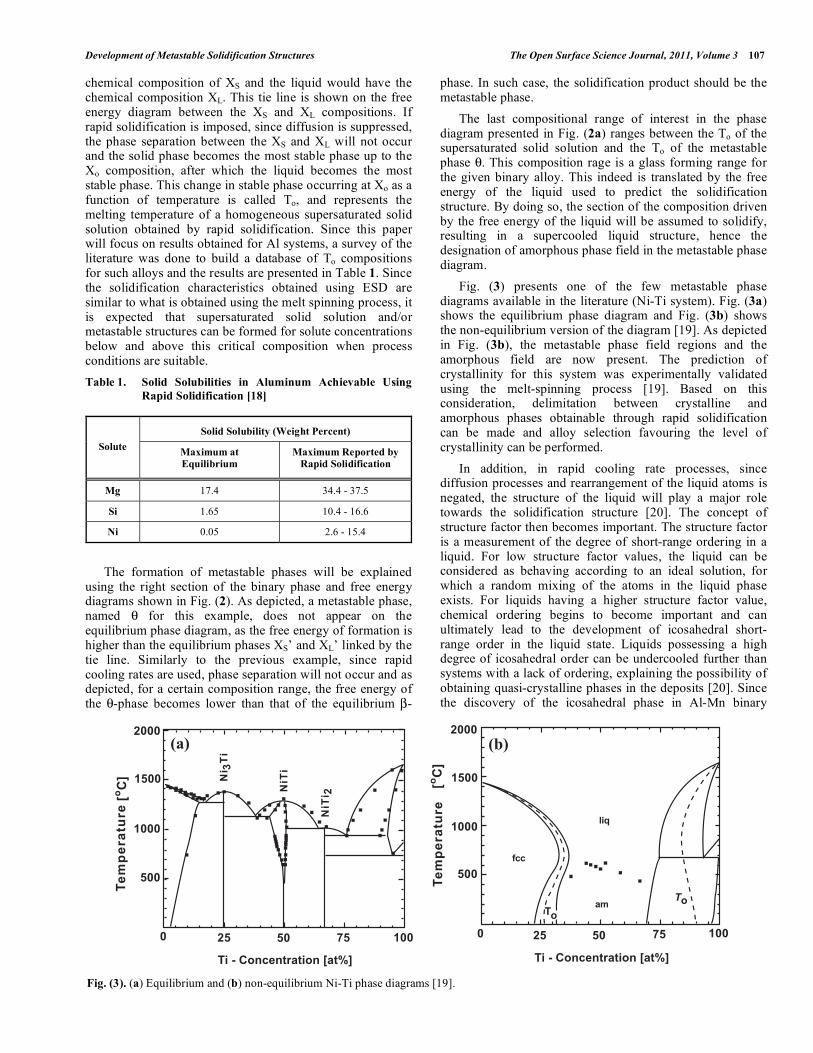
Fig. (3) presents one of the few metastable phase diagrams available in the literature (Ni-Ti system). Fig. (3a) shows the equilibrium phase diagram and Fig. (3b) shows the non-equilibrium version of the diagram [19]. As depicted in Fig. (3b), the metastable phase field regions and the amorphous field are now present. The prediction of crystallinity for this system was experimentally validated using the melt-spinning process [19]. Based on this consideration, delimitation between crystalline and amorphous phases obtainable through rapid solidification can be made and alloy selection favouring the level of crystallinity can be performed.
In addition, in rapid cooling rate processes, since diffusion processes and rearrangement of the liquid atoms is negated, the structure of the liquid will play a major role towards the solidification structure [20]. The concept of structure factor then becomes important. The structure factor is a measurement of the degree of short-range ordering in a liquid. For low structure factor values, the liquid can be considered as behaving according to an ideal solution, for which a random mixing of the atoms in the liquid phase exists. For liquids having a higher structure factor value, chemical ordering begins to become important and can ultimately lead to the development of icosahedral short-range order in the liquid state. Liquids possessing a high degree of icosahedral order can be undercooled further than systems with a lack of ordering, explaining the possibility of obtaining quasi-crystalline phases in the deposits [20]. Since the discovery of the icosahedral phase in Al-Mn binary
Fig. (3). (a) Equilibrium and (b) non-equilibrium Ni-Ti phase diagrams [19].
��� ���
����������� ������ ��� ����������� ������ ���
� �� �� �� ��� � �� �� �� ���
����
����
����
���
����
����
����
���
����
����
������
�
�
���� ���
���� ���
�����
�
�
���
���
��
�����
�
108 The Open Surface Science Journal, 2011, Volume 3 Brochu et al.
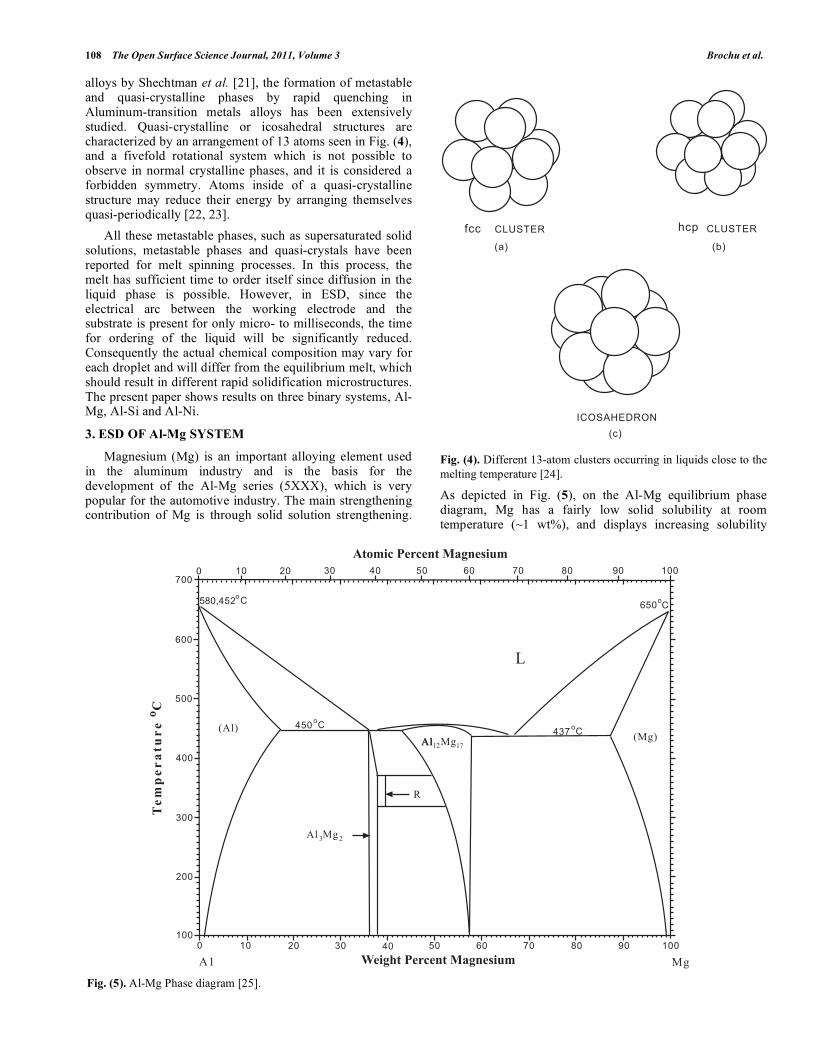
alloys by Shechtman et al. [21], the formation of metastable and quasi-crystalline phases by rapid quenching in Aluminum-transition metals alloys has been extensively studied. Quasi-crystalline or icosahedral structures are characterized by an arrangement of 13 atoms seen in Fig. (4), and a fivefold rotational system which is not possible to observe in normal crystalline phases, and it is considered a forbidden symmetry. Atoms inside of a quasi-crystalline structure may reduce their energy by arranging themselves quasi-periodically [22, 23].
All these metastable phases, such as supersaturated solid solutions, metastable phases and quasi-crystals have been reported for melt spinning processes. In this process, the melt has sufficient time to order itself since diffusion in the liquid phase is possible. However, in ESD, since the electrical arc between the working electrode and the substrate is present for only micro- to milliseconds, the time for ordering of the liquid will be significantly reduced. Consequently the actual chemical composition may vary for each droplet and will differ from the equilibrium melt, which should result in different rapid solidification microstructures. The present paper shows results on three binary systems, Al-Mg, Al-Si and Al-Ni.
3. ESD OF Al-Mg SYSTEM
Magnesium (Mg) is an important alloying element used in the aluminum industry and is the basis for the development of the Al-Mg series (5XXX), which is very popular for the automotive industry. The main strengthening contribution of Mg is through solid solution strengthening.
Fig. (4). Different 13-atom clusters occurring in liquids close to the melting temperature [24].
As depicted in Fig. (5), on the Al-Mg equilibrium phase diagram, Mg has a fairly low solid solubility at room temperature (~1 wt%), and displays increasing solubility
Fig. (5). Al-Mg Phase diagram [25].
��� �������
���
����������
���
����� �!��"
���
����� ��������������
#
$
%
�
� � � % $ # & ' �
���� ������ ��������������
% �(
���� ������
%�# �( ��
�
��
�� ��� �
% �(&) $ �(
��
���
���
����
� � % $ # & ' �
Development of Metastable Solidification Structures The Open Surface Science Journal, 2011, Volume 3 109
with temperature until a maximum solid solubility of ~14.9 wt% at 450 oC. An increase in solid solubility of Mg will have a dual effect on the alloy: a gain in strength due to the increased content of Mg solute in solid solution, and a reduction of the alloy density. Mg is one of the only elements (besides Li and Be) that exhibit this effect of reducing the density of aluminum when alloyed, while maintaining the mechanical properties thus remaining usable for structural applications.
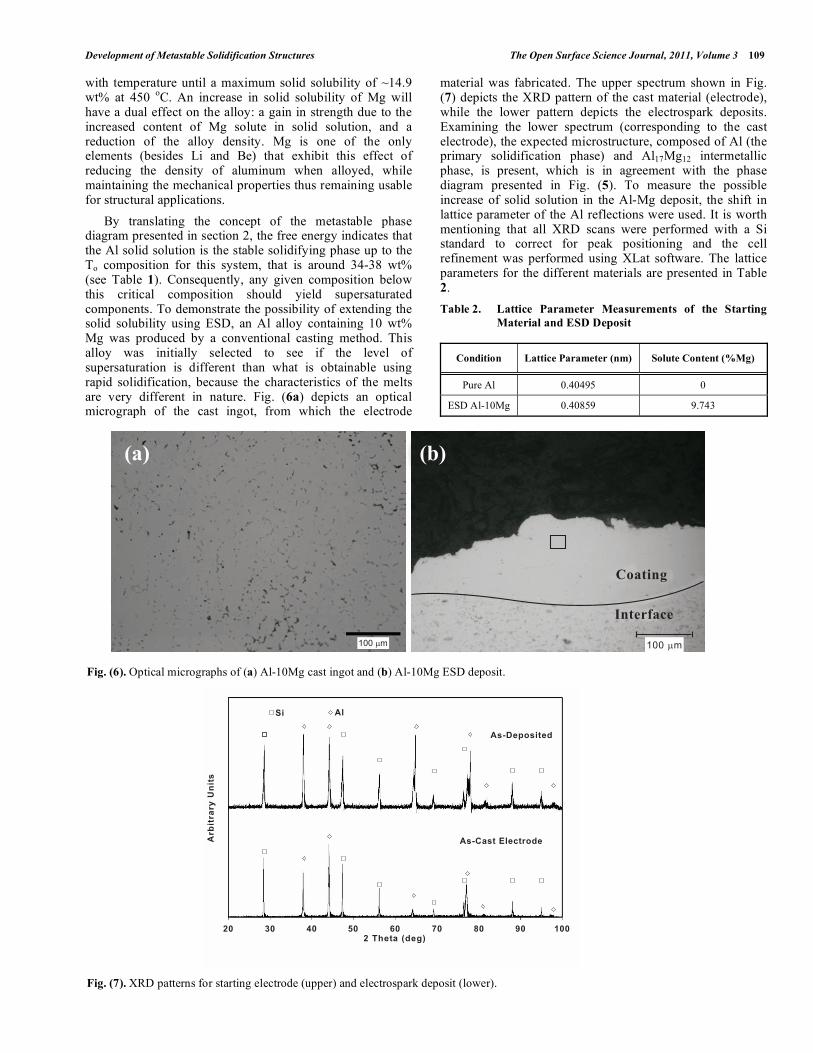
By translating the concept of the metastable phase diagram presented in section 2, the free energy indicates that the Al solid solution is the stable solidifying phase up to the To composition for this system, that is around 34-38 wt% (see Table 1). Consequently, any given composition below this critical composition should yield supersaturated components. To demonstrate the possibility of extending the solid solubility using ESD, an Al alloy containing 10 wt% Mg was produced by a conventional casting method. This alloy was initially selected to see if the level of supersaturation is different than what is obtainable using rapid solidification, because the characteristics of the melts are very different in nature. Fig. (6a) depicts an optical micrograph of the cast ingot, from which the electrode
material was fabricated. The upper spectrum shown in Fig. (7) depicts the XRD pattern of the cast material (electrode), while the lower pattern depicts the electrospark deposits. Examining the lower spectrum (corresponding to the cast electrode), the expected microstructure, composed of Al (the primary solidification phase) and Al17Mg12 intermetallic phase, is present, which is in agreement with the phase diagram presented in Fig. (5). To measure the possible increase of solid solution in the Al-Mg deposit, the shift in lattice parameter of the Al reflections were used. It is worth mentioning that all XRD scans were performed with a Si standard to correct for peak positioning and the cell refinement was performed using XLat software. The lattice parameters for the different materials are presented in Table 2.
Table 2. Lattice Parameter Measurements of the Starting
Material and ESD Deposit
Condition Lattice Parameter (nm) Solute Content (%Mg)
Pure Al 0.40495 0
ESD Al-10Mg 0.40859 9.743
Fig. (6). Optical micrographs of (a) Al-10Mg cast ingot and (b) Al-10Mg ESD deposit.
Fig. (7). XRD patterns for starting electrode (upper) and electrospark deposit (lower).
��� ���
�*�+ �*�+
������
���������
�� ��
� �!�� ��"
� �� ��#����"
���$� �%"&'
��(
��� �)�*
���
�� �� +� �� ,� �� -� .� ���
110 The Open Surface Science Journal, 2011, Volume 3 Brochu et al.
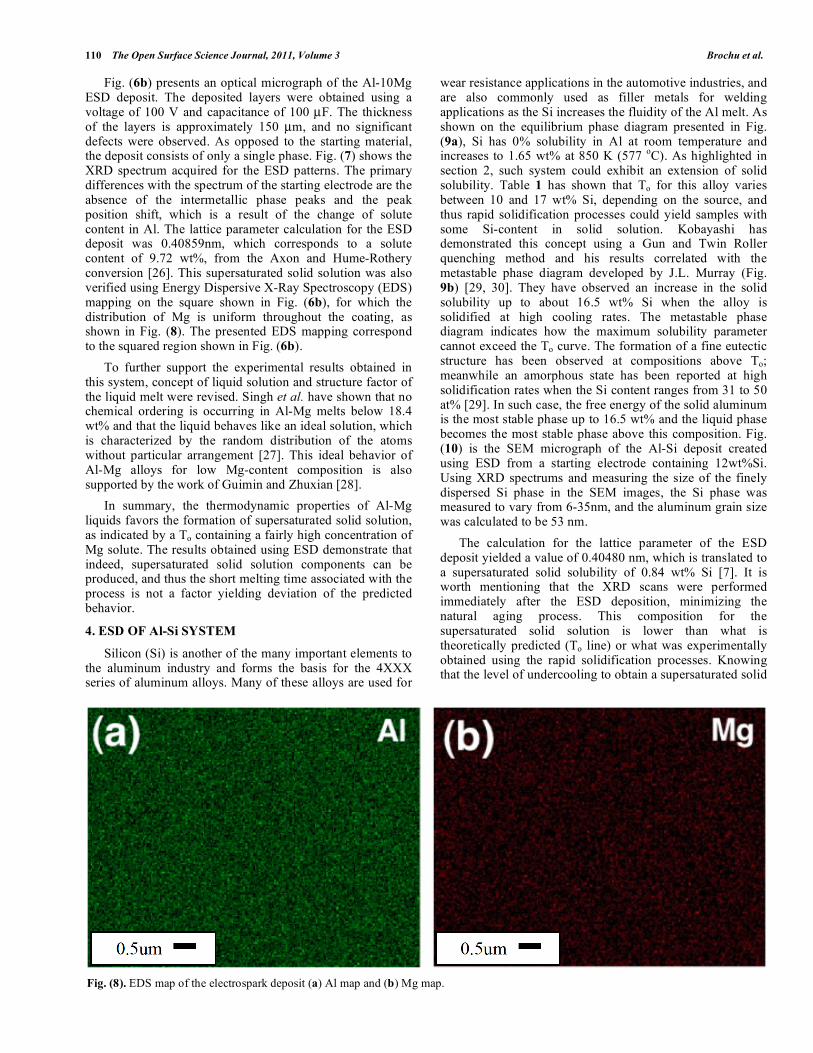
Fig. (6b) presents an optical micrograph of the Al-10Mg ESD deposit. The deposited layers were obtained using a voltage of 100 V and capacitance of 100 μF. The thickness of the layers is approximately 150 μm, and no significant defects were observed. As opposed to the starting material, the deposit consists of only a single phase. Fig. (7) shows the XRD spectrum acquired for the ESD patterns. The primary differences with the spectrum of the starting electrode are the absence of the intermetallic phase peaks and the peak position shift, which is a result of the change of solute content in Al. The lattice parameter calculation for the ESD deposit was 0.40859nm, which corresponds to a solute content of 9.72 wt%, from the Axon and Hume-Rothery conversion [26]. This supersaturated solid solution was also verified using Energy Dispersive X-Ray Spectroscopy (EDS) mapping on the square shown in Fig. (6b), for which the distribution of Mg is uniform throughout the coating, as shown in Fig. (8). The presented EDS mapping correspond to the squared region shown in Fig. (6b).
To further support the experimental results obtained in this system, concept of liquid solution and structure factor of the liquid melt were revised. Singh et al. have shown that no chemical ordering is occurring in Al-Mg melts below 18.4 wt% and that the liquid behaves like an ideal solution, which is characterized by the random distribution of the atoms without particular arrangement [27]. This ideal behavior of Al-Mg alloys for low Mg-content composition is also supported by the work of Guimin and Zhuxian [28].
In summary, the thermodynamic properties of Al-Mg liquids favors the formation of supersaturated solid solution, as indicated by a To containing a fairly high concentration of Mg solute. The results obtained using ESD demonstrate that indeed, supersaturated solid solution components can be produced, and thus the short melting time associated with the process is not a factor yielding deviation of the predicted behavior.
4. ESD OF Al-Si SYSTEM
Silicon (Si) is another of the many important elements to the aluminum industry and forms the basis for the 4XXX series of aluminum alloys. Many of these alloys are used for
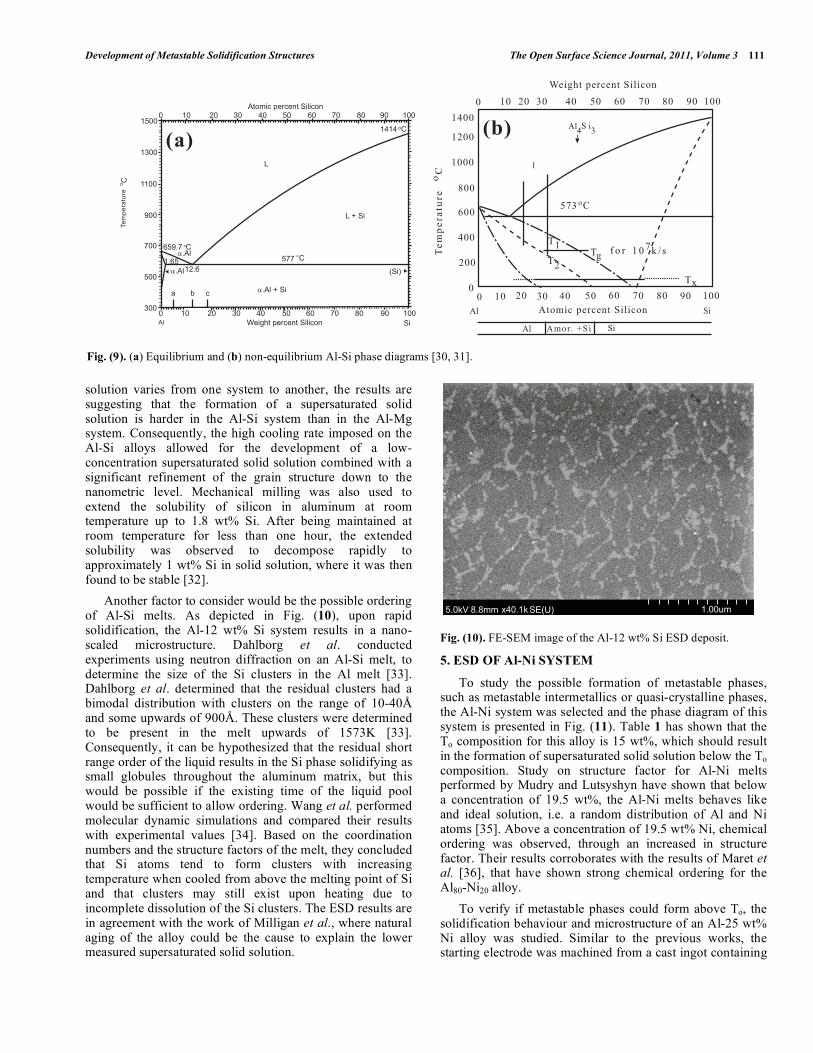
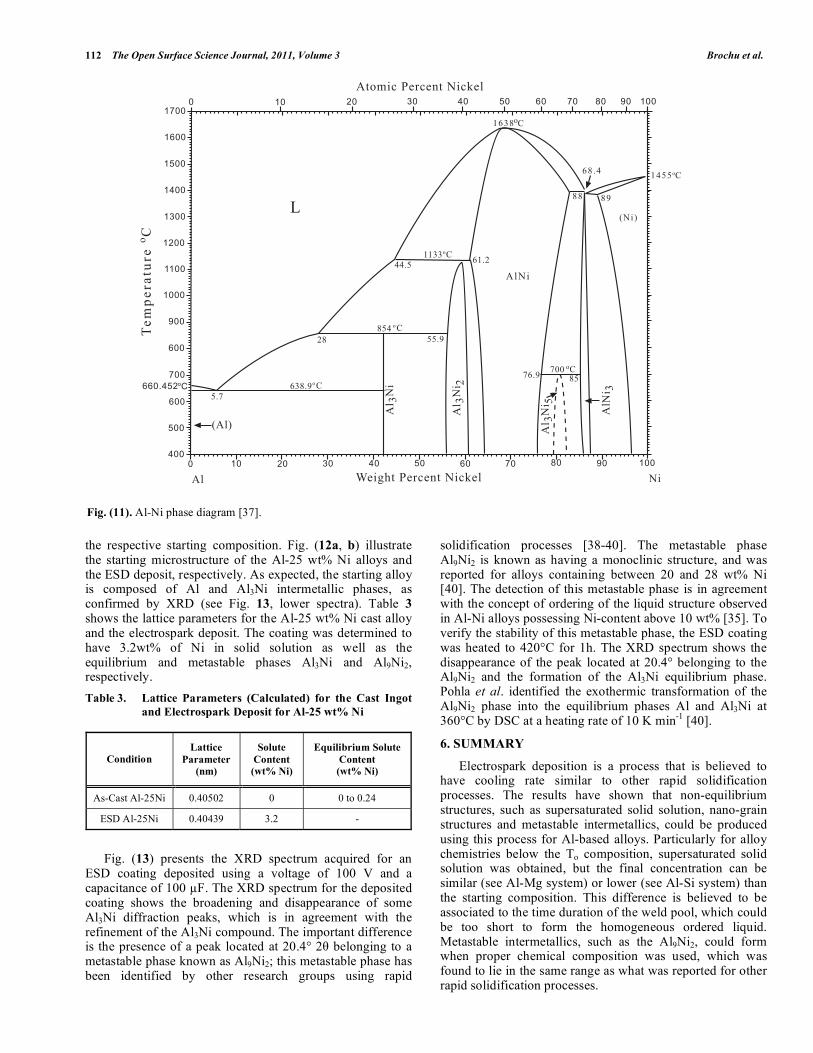
wear resistance applications in the automotive industries, and are also commonly used as filler metals for welding applications as the Si increases the fluidity of the Al melt. As shown on the equilibrium phase diagram presented in Fig. (9a), Si has 0% solubility in Al at room temperature and increases to 1.65 wt% at 850 K (577 oC). As highlighted in section 2, such system could exhibit an extension of solid solubility. Table 1 has shown that To for this alloy varies between 10 and 17 wt% Si, depending on the source, and thus rapid solidification processes could yield samples with some Si-content in solid solution. Kobayashi has demonstrated this concept using a Gun and Twin Roller quenching method and his results correlated with the metastable phase diagram developed by J.L. Murray (Fig. 9b) [29, 30]. They have observed an increase in the solid solubility up to about 16.5 wt% Si when the alloy is solidified at high cooling rates. The metastable phase diagram indicates how the maximum solubility parameter cannot exceed the To curve. The formation of a fine eutectic structure has been observed at compositions above To; meanwhile an amorphous state has been reported at high solidification rates when the Si content ranges from 31 to 50 at% [29]. In such case, the free energy of the solid aluminum is the most stable phase up to 16.5 wt% and the liquid phase becomes the most stable phase above this composition. Fig. (10) is the SEM micrograph of the Al-Si deposit created using ESD from a starting electrode containing 12wt%Si. Using XRD spectrums and measuring the size of the finely dispersed Si phase in the SEM images, the Si phase was measured to vary from 6-35nm, and the aluminum grain size was calculated to be 53 nm.
The calculation for the lattice parameter of the ESD deposit yielded a value of 0.40480 nm, which is translated to a supersaturated solid solubility of 0.84 wt% Si [7]. It is worth mentioning that the XRD scans were performed immediately after the ESD deposition, minimizing the natural aging process. This composition for the supersaturated solid solution is lower than what is theoretically predicted (To line) or what was experimentally obtained using the rapid solidification processes. Knowing that the level of undercooling to obtain a supersaturated solid
Fig. (8). EDS map of the electrospark deposit (a) Al map and (b) Mg map.
Development of Metastable Solidification Structures The Open Surface Science Journal, 2011, Volume 3 111
solution varies from one system to another, the results are suggesting that the formation of a supersaturated solid solution is harder in the Al-Si system than in the Al-Mg system. Consequently, the high cooling rate imposed on the Al-Si alloys allowed for the development of a low-concentration supersaturated solid solution combined with a significant refinement of the grain structure down to the nanometric level. Mechanical milling was also used to extend the solubility of silicon in aluminum at room temperature up to 1.8 wt% Si. After being maintained at room temperature for less than one hour, the extended solubility was observed to decompose rapidly to approximately 1 wt% Si in solid solution, where it was then found to be stable [32].
Another factor to consider would be the possible ordering of Al-Si melts. As depicted in Fig. (10), upon rapid solidification, the Al-12 wt% Si system results in a nano-scaled microstructure. Dahlborg et al. conducted experiments using neutron diffraction on an Al-Si melt, to determine the size of the Si clusters in the Al melt [33]. Dahlborg et al. determined that the residual clusters had a bimodal distribution with clusters on the range of 10-40Å and some upwards of 900Å. These clusters were determined to be present in the melt upwards of 1573K [33]. Consequently, it can be hypothesized that the residual short range order of the liquid results in the Si phase solidifying as small globules throughout the aluminum matrix, but this would be possible if the existing time of the liquid pool would be sufficient to allow ordering. Wang et al. performed molecular dynamic simulations and compared their results with experimental values [34]. Based on the coordination numbers and the structure factors of the melt, they concluded that Si atoms tend to form clusters with increasing temperature when cooled from above the melting point of Si and that clusters may still exist upon heating due to incomplete dissolution of the Si clusters. The ESD results are in agreement with the work of Milligan et al., where natural aging of the alloy could be the cause to explain the lower measured supersaturated solid solution.
Fig. (10). FE-SEM image of the Al-12 wt% Si ESD deposit.
5. ESD OF Al-Ni SYSTEM
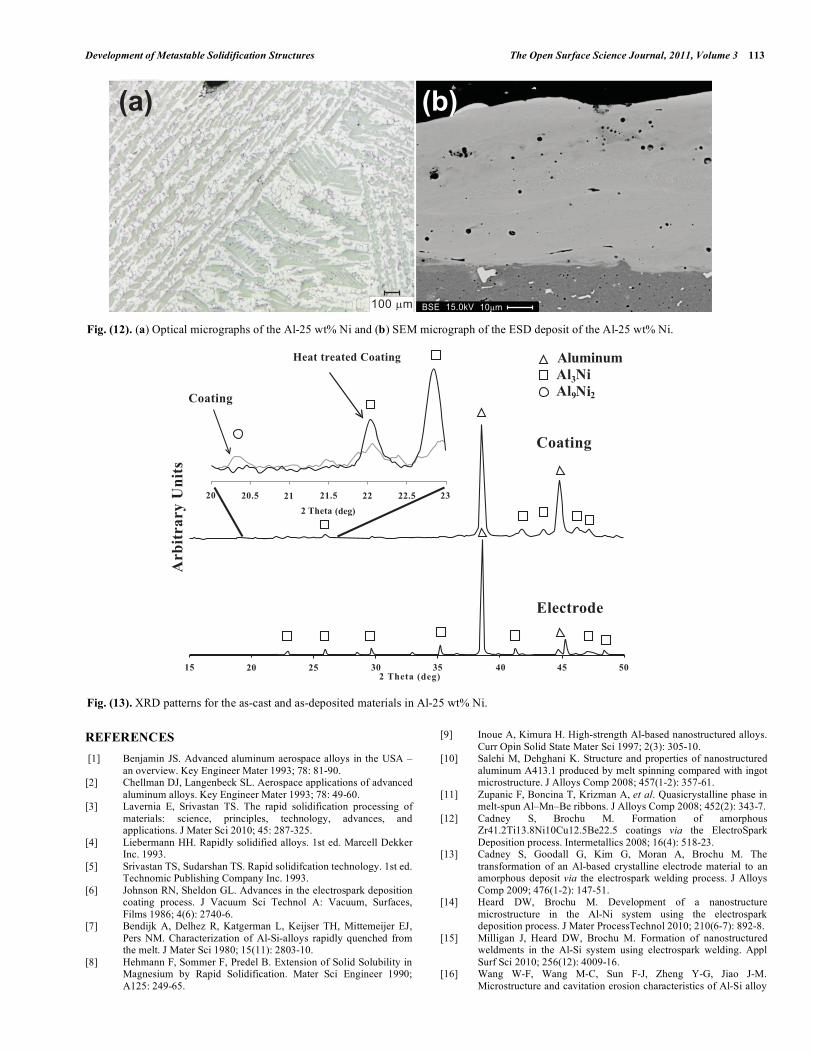
To study the possible formation of metastable phases, such as metastable intermetallics or quasi-crystalline phases, the Al-Ni system was selected and the phase diagram of this system is presented in Fig. (11). Table 1 has shown that the To composition for this alloy is 15 wt%, which should result in the formation of supersaturated solid solution below the To composition. Study on structure factor for Al-Ni melts performed by Mudry and Lutsyshyn have shown that below a concentration of 19.5 wt%, the Al-Ni melts behaves like and ideal solution, i.e. a random distribution of Al and Ni atoms [35]. Above a concentration of 19.5 wt% Ni, chemical ordering was observed, through an increased in structure factor. Their results corroborates with the results of Maret et al. [36], that have shown strong chemical ordering for the Al80-Ni20 alloy.
To verify if metastable phases could form above To, the solidification behaviour and microstructure of an Al-25 wt% Ni alloy was studied. Similar to the previous works, the starting electrode was machined from a cast ingot containing
Fig. (9). (a) Equilibrium and (b) non-equilibrium Al-Si phase diagrams [30, 31].
�
��
��
'
# $',# �(
�,$� ,$�,��
�,��
�
�� ��-.�/�0*�.1�.20*�����(2
�,��*3*��
## �(
�*3*��
�
� � % $ # & ' �
� � % $ # & ' ��0(+��*�.1�.20*�����(2
�.+�.1�0�1.
�(�%�% �(
����
���
� �� �� �� �� �� �� �� �� �� ���
� �� �� �� �� �� �� �� �� �� �������������������������
���� �����������������
�� � ���
�
��� !�
����
����
����
���
���
���
���
�
"�"�
�"# � � � � $% &�
'"
"��
���
(�)��
!�
��� ���
�� ������* �+��
�� ��
,45 &,&++ 6%,�4����� �,�+
112 The Open Surface Science Journal, 2011, Volume 3 Brochu et al.
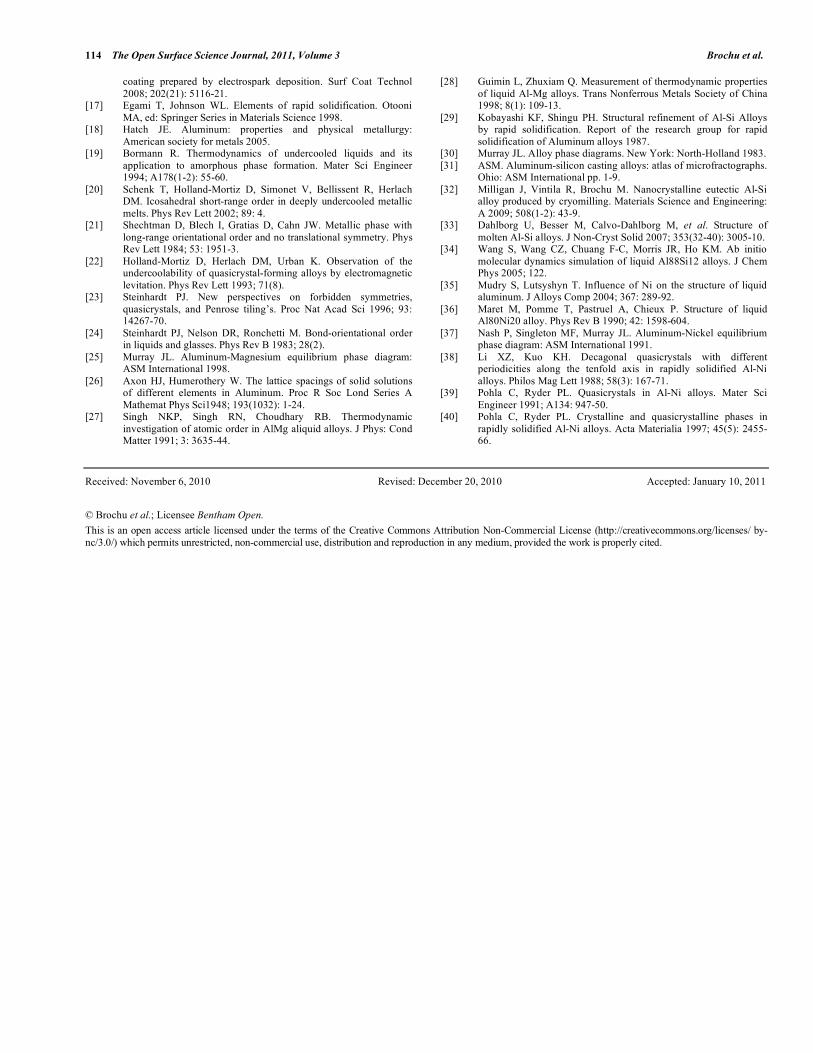
the respective starting composition. Fig. (12a, b) illustrate the starting microstructure of the Al-25 wt% Ni alloys and the ESD deposit, respectively. As expected, the starting alloy is composed of Al and Al3Ni intermetallic phases, as confirmed by XRD (see Fig. 13, lower spectra). Table 3 shows the lattice parameters for the Al-25 wt% Ni cast alloy and the electrospark deposit. The coating was determined to have 3.2wt% of Ni in solid solution as well as the equilibrium and metastable phases Al3Ni and Al9Ni2, respectively.
Table 3. Lattice Parameters (Calculated) for the Cast Ingot
and Electrospark Deposit for Al-25 wt% Ni
Condition
Lattice
Parameter
(nm)
Solute
Content
(wt% Ni)
Equilibrium Solute
Content
(wt% Ni)
As-Cast Al-25Ni 0.40502 0 0 to 0.24
ESD Al-25Ni 0.40439 3.2 -
Fig. (13) presents the XRD spectrum acquired for an ESD coating deposited using a voltage of 100 V and a capacitance of 100 F. The XRD spectrum for the deposited coating shows the broadening and disappearance of some Al3Ni diffraction peaks, which is in agreement with the refinement of the Al3Ni compound. The important difference is the presence of a peak located at 20.4° 2 belonging to a metastable phase known as Al9Ni2; this metastable phase has been identified by other research groups using rapid
solidification processes [38-40]. The metastable phase Al9Ni2 is known as having a monoclinic structure, and was reported for alloys containing between 20 and 28 wt% Ni [40]. The detection of this metastable phase is in agreement with the concept of ordering of the liquid structure observed in Al-Ni alloys possessing Ni-content above 10 wt% [35]. To verify the stability of this metastable phase, the ESD coating was heated to 420°C for 1h. The XRD spectrum shows the disappearance of the peak located at 20.4° belonging to the Al9Ni2 and the formation of the Al3Ni equilibrium phase. Pohla et al. identified the exothermic transformation of the Al9Ni2 phase into the equilibrium phases Al and Al3Ni at 360°C by DSC at a heating rate of 10 K min-1 [40].
6. SUMMARY
Electrospark deposition is a process that is believed to have cooling rate similar to other rapid solidification processes. The results have shown that non-equilibrium structures, such as supersaturated solid solution, nano-grain structures and metastable intermetallics, could be produced using this process for Al-based alloys. Particularly for alloy chemistries below the To composition, supersaturated solid solution was obtained, but the final concentration can be similar (see Al-Mg system) or lower (see Al-Si system) than the starting composition. This difference is believed to be associated to the time duration of the weld pool, which could be too short to form the homogeneous ordered liquid. Metastable intermetallics, such as the Al9Ni2, could form when proper chemical composition was used, which was found to lie in the same range as what was reported for other rapid solidification processes.
Fig. (11). Al-Ni phase diagram [37].
� � % $ # & ' ��#
�$
�
�%
��
�
��
�
'
$
#$$,% �(
$
% � � % $ # & ' �
,��� ���� ��-�������,��%��
�������-�������,��%��
"��
���
(�)��
!�
���� !�
��*�
����
,�
��,�
���� !�
��*� ��*�
��� !�
�� ��*�
���*� !���*�
��� !���
�*�
��
��,�
�
��,�
��
��,�
��
�� ,
� �
�����!
Development of Metastable Solidification Structures The Open Surface Science Journal, 2011, Volume 3 113
REFERENCES
[1] Benjamin JS. Advanced aluminum aerospace alloys in the USA – an overview. Key Engineer Mater 1993; 78: 81-90.
[2] Chellman DJ, Langenbeck SL. Aerospace applications of advanced aluminum alloys. Key Engineer Mater 1993; 78: 49-60.
[3] Lavernia E, Srivastan TS. The rapid solidification processing of materials: science, principles, technology, advances, and applications. J Mater Sci 2010; 45: 287-325.
[4] Liebermann HH. Rapidly solidified alloys. 1st ed. Marcell Dekker Inc. 1993.
[5] Srivastan TS, Sudarshan TS. Rapid solidifcation technology. 1st ed. Technomic Publishing Company Inc. 1993.
[6] Johnson RN, Sheldon GL. Advances in the electrospark deposition coating process. J Vacuum Sci Technol A: Vacuum, Surfaces, Films 1986; 4(6): 2740-6.
[7] Bendijk A, Delhez R, Katgerman L, Keijser TH, Mittemeijer EJ, Pers NM. Characterization of Al-Si-alloys rapidly quenched from the melt. J Mater Sci 1980; 15(11): 2803-10.
[8] Hehmann F, Sommer F, Predel B. Extension of Solid Solubility in Magnesium by Rapid Solidification. Mater Sci Engineer 1990; A125: 249-65.
[9] Inoue A, Kimura H. High-strength Al-based nanostructured alloys. Curr Opin Solid State Mater Sci 1997; 2(3): 305-10.
[10] Salehi M, Dehghani K. Structure and properties of nanostructured aluminum A413.1 produced by melt spinning compared with ingot microstructure. J Alloys Comp 2008; 457(1-2): 357-61.
[11] Zupanic F, Boncina T, Krizman A, et al. Quasicrystalline phase in melt-spun Al–Mn–Be ribbons. J Alloys Comp 2008; 452(2): 343-7.
[12] Cadney S, Brochu M. Formation of amorphous Zr41.2Ti13.8Ni10Cu12.5Be22.5 coatings via the ElectroSpark Deposition process. Intermetallics 2008; 16(4): 518-23.
[13] Cadney S, Goodall G, Kim G, Moran A, Brochu M. The transformation of an Al-based crystalline electrode material to an amorphous deposit via the electrospark welding process. J Alloys Comp 2009; 476(1-2): 147-51.
[14] Heard DW, Brochu M. Development of a nanostructure microstructure in the Al-Ni system using the electrospark deposition process. J Mater ProcessTechnol 2010; 210(6-7): 892-8.
[15] Milligan J, Heard DW, Brochu M. Formation of nanostructured weldments in the Al-Si system using electrospark welding. Appl Surf Sci 2010; 256(12): 4009-16.
[16] Wang W-F, Wang M-C, Sun F-J, Zheng Y-G, Jiao J-M. Microstructure and cavitation erosion characteristics of Al-Si alloy
Fig. (12). (a) Optical micrographs of the Al-25 wt% Ni and (b) SEM micrograph of the ESD deposit of the Al-25 wt% Ni.
Fig. (13). XRD patterns for the as-cast and as-deposited materials in Al-25 wt% Ni.
% ' %('
�*�+ ��� �,45 ��+
�� �� �� � � !� !� ��
�� ��"� �� ��"� �� ��"� �
������� �#���
������� �#���
$%�����#�
������
�%�%�%���
&&
�'
(����������#�������
������
���
����)�*
���
114 The Open Surface Science Journal, 2011, Volume 3 Brochu et al.
coating prepared by electrospark deposition. Surf Coat Technol 2008; 202(21): 5116-21.
[17] Egami T, Johnson WL. Elements of rapid solidification. Otooni MA, ed: Springer Series in Materials Science 1998.
[18] Hatch JE. Aluminum: properties and physical metallurgy: American society for metals 2005.
[19] Bormann R. Thermodynamics of undercooled liquids and its application to amorphous phase formation. Mater Sci Engineer 1994; A178(1-2): 55-60.
[20] Schenk T, Holland-Mortiz D, Simonet V, Bellissent R, Herlach DM. Icosahedral short-range order in deeply undercooled metallic melts. Phys Rev Lett 2002; 89: 4.
[21] Shechtman D, Blech I, Gratias D, Cahn JW. Metallic phase with long-range orientational order and no translational symmetry. Phys Rev Lett 1984; 53: 1951-3.
[22] Holland-Mortiz D, Herlach DM, Urban K. Observation of the undercoolability of quasicrystal-forming alloys by electromagnetic levitation. Phys Rev Lett 1993; 71(8).
[23] Steinhardt PJ. New perspectives on forbidden symmetries, quasicrystals, and Penrose tiling’s. Proc Nat Acad Sci 1996; 93: 14267-70.
[24] Steinhardt PJ, Nelson DR, Ronchetti M. Bond-orientational order in liquids and glasses. Phys Rev B 1983; 28(2).
[25] Murray JL. Aluminum-Magnesium equilibrium phase diagram: ASM International 1998.
[26] Axon HJ, Humerothery W. The lattice spacings of solid solutions of different elements in Aluminum. Proc R Soc Lond Series A Mathemat Phys Sci1948; 193(1032): 1-24.
[27] Singh NKP, Singh RN, Choudhary RB. Thermodynamic investigation of atomic order in AlMg aliquid alloys. J Phys: Cond Matter 1991; 3: 3635-44.
[28] Guimin L, Zhuxiam Q. Measurement of thermodynamic properties of liquid Al-Mg alloys. Trans Nonferrous Metals Society of China 1998; 8(1): 109-13.
[29] Kobayashi KF, Shingu PH. Structural refinement of Al-Si Alloys by rapid solidification. Report of the research group for rapid solidification of Aluminum alloys 1987.
[30] Murray JL. Alloy phase diagrams. New York: North-Holland 1983. [31] ASM. Aluminum-silicon casting alloys: atlas of microfractographs.
Ohio: ASM International pp. 1-9. [32] Milligan J, Vintila R, Brochu M. Nanocrystalline eutectic Al-Si
alloy produced by cryomilling. Materials Science and Engineering: A 2009; 508(1-2): 43-9.
[33] Dahlborg U, Besser M, Calvo-Dahlborg M, et al. Structure of molten Al-Si alloys. J Non-Cryst Solid 2007; 353(32-40): 3005-10.
[34] Wang S, Wang CZ, Chuang F-C, Morris JR, Ho KM. Ab initio molecular dynamics simulation of liquid Al88Si12 alloys. J Chem Phys 2005; 122.
[35] Mudry S, Lutsyshyn T. Influence of Ni on the structure of liquid aluminum. J Alloys Comp 2004; 367: 289-92.
[36] Maret M, Pomme T, Pastruel A, Chieux P. Structure of liquid Al80Ni20 alloy. Phys Rev B 1990; 42: 1598-604.
[37] Nash P, Singleton MF, Murray JL. Aluminum-Nickel equilibrium phase diagram: ASM International 1991.
[38] Li XZ, Kuo KH. Decagonal quasicrystals with different periodicities along the tenfold axis in rapidly solidified Al-Ni alloys. Philos Mag Lett 1988; 58(3): 167-71.
[39] Pohla C, Ryder PL. Quasicrystals in Al-Ni alloys. Mater Sci Engineer 1991; A134: 947-50.
[40] Pohla C, Ryder PL. Crystalline and quasicrystalline phases in rapidly solidified Al-Ni alloys. Acta Materialia 1997; 45(5): 2455-66.
Received: November 6, 2010 Revised: December 20, 2010 Accepted: January 10, 2011
© Brochu et al.; Licensee Bentham Open.
This is an open access article licensed under the terms of the Creative Commons Attribution Non-Commercial License (http://creativecommons.org/licenses/ by-nc/3.0/) which permits unrestricted, non-commercial use, distribution and reproduction in any medium, provided the work is properly cited.