Development of Flexural Vibration Inspection Techniques … · Development of Flexural Vibration...
77
Development of Flexural Vibration Inspection Techniques to Rapidly Assess the Structural Health of Rural Bridge Systems Final Report Prepared by: Brian K. Brashaw Robert Vatalaro Xiping Wang Kevin Sarvela Natural Resources Research Institute University of Minnesota- Duluth Northland Advanced Transportation System Research Laboratories University of Minnesota- Duluth James P. Wacker Forest Products Laboratory USDA Forest Service CTS 08-22
Transcript of Development of Flexural Vibration Inspection Techniques … · Development of Flexural Vibration...
Development of Flexural Vibration Inspection Techniques to Rapidly Assess the Structural Health of Rural Bridge Systems
Final Report
Prepared by:
Brian K. Brashaw Robert Vatalaro
Xiping Wang Kevin Sarvela
Natural Resources Research Institute
University of Minnesota- Duluth
Northland Advanced Transportation System Research Laboratories University of Minnesota- Duluth
James P. Wacker
Forest Products Laboratory
USDA Forest Service
CTS 08-22

Technical Report Documentation Page 1. Report No. 2. 3. Recipients Accession No. CTS 08-22 4. Title and Subtitle 5. Report Date
September 2008 6. Development of Flexural Vibration Inspection Techniques to
Rapidly Assess the Structural Health of Rural Bridge Systems 7. Author(s) 8. Performing Organization Report No. Brian K. Brashaw, Robert Vatalaro, Xiping Wang, Kevin Sarvela, and James P. Wacker
9. Performing Organization Name and Address 10. Project/Task/Work Unit No. CTS Project # 2005011 11. Contract (C) or Grant (G) No.
Natural Resources Research Institute University of Minnesota- Duluth 5013 Miller Trunk Highway Duluth, Minnesota 55811 Northland Advanced Transportation System Research Laboratories University of Minnesota- Duluth 291 Marshall West Alworth Hall 1023 University Drive Duluth, Minnesota 55812
12. Sponsoring Organization Name and Address 13. Type of Report and Period Covered Final Report 14. Sponsoring Agency Code
Intelligent Transportation Systems Institute Center for Transportation Studies University of Minnesota 511 Washington Avenue SE, Suite 200 Minneapolis, Minnesota 55455
15. Supplementary Notes http://www.cts.umn.edu/Publications/ResearchReports/ 16. Abstract (Limit: 200 words) Approximately 4,000 vehicle bridges in the State of Minnesota contain structural timber members. Recent research at the University of Minnesota Duluth Natural Resources Research Institute (UMD NRRI) has been conducted on vibration testing of timber bridges as a means of developing rapid in-place testing techniques for assessing the structural health of bridges. The technique involves measuring the frequency characteristics of the bridge superstructure under forced flexural vibration. The peak frequency of vibration was measured and compared to a set of load testing data for each of 9 bridges. Each bridge was also inspected using commercially available advanced inspection equipment to identify any major structural problems with individual bridge components such as timber pilings, pile caps, and girders. Two bridges were identified that needed immediate maintenance attention. The relationship between the load deflection data and the vibration characteristics showed a useful relationship and the results indicate that forced-vibration methods have potential for quickly assessing timber bridge superstructure stiffness. However, improvements must be made to the measurement system to correctly identify the 1st bending mode frequency of the field bridges. This global vibration technique has potential benefits for routine inspections and long-term health monitoring of timber bridge superstructures.
17. Document Analysis/Descriptors 18. Availability Statement Timber bridge, condition assessment, monitoring, nondestructive evaluation (NDE), stress wave timing, resistance microdrilling
No restrictions. Document available from: National Technical Information Services, Springfield, Virginia 22161
19. Security Class (this report) 20. Security Class (this page) 21. No. of Pages 22. Price Unclassified Unclassified 76

Development of Flexural Vibration Inspection Techniques to Rapidly Assess the Structural Health of Rural Bridge Systems
Final Report
Prepared by:
Brian K. Brashaw Robert Vatalaro Xiping Wang Kevin Sarvela
Natural Resources Research Institute
University of Minnesota- Duluth
Northland Advanced Transportation System Research Laboratories University of Minnesota- Duluth
James P. Wacker
Forest Products Laboratory
USDA Forest Service
September 2008
Published by:
Intelligent Transportation Systems Institute Center for Transportation Studies
University of Minnesota 200 Transportation and Safety Building
511 Washington Ave SE Minneapolis, Minnesota 55455
The contents of this report reflect the views of the authors, who are responsible for the facts and the accuracy of the information presented herein. This document is disseminated under the sponsorship of the Department of Transportation University Transportation Centers Program, in the interest of information exchange. The U.S. Government assumes no liability for the contents or use thereof. This report does not necessarily reflect the official views or policy of the Intelligent Transportation Systems Institute or the University of Minnesota. The authors, the Intelligent Transportation Systems Institute, the University of Minnesota and the U.S. Government do not endorse products or manufacturers. Trade or manufacturers’ names appear herein solely because they are considered essential to this report.

Acknowledgements
This project expands recent research conducted in cooperation with Michigan Technological University and the USDA Forest Products Laboratory. St. Louis County provided key cooperation in the identification of test bridges and load testing. The authors appreciate this cooperation. The assistance of Professor Lihai Wang (University of Harbin, China) with field data collection is appreciated.

Table of Contents
Chapter 1: Introduction ....................................................................................................................1 Analytical Model .......................................................................................................................3 Research Objectives...................................................................................................................4 Chapter 2: Bridges Tested................................................................................................................5 Chapter 3: Procedures ......................................................................................................................6 Visual Inspection .......................................................................................................................6 Moisture Content Determination ...............................................................................................6 Stress Wave Timing...................................................................................................................6 Resistance Microdrilling............................................................................................................8 Vibration Test Procedures for Timber Bridges..........................................................................9 Static Load Testing ..................................................................................................................10 Estimation of Bridge Weight ...................................................................................................13 Chapter 4: Individual Bridge Testing Summary............................................................................14 Bridge 85 Testing Summary ....................................................................................................14 Bridge 153 Testing Summary ..................................................................................................20 Bridge 242 Testing Summary ..................................................................................................23 Bridge 305 Testing Summary ..................................................................................................29 Bridge 357 Testing Summary ..................................................................................................35 Bridge 619 Testing Summary ..................................................................................................41 Bridge 726 Testing Summary ..................................................................................................45 Bridge CR-1 Testing Summary ...............................................................................................51 Bridge CR-2 Testing Summary ...............................................................................................56 Chapter 5: Testing Results .............................................................................................................61 Chapter 6: Conclusions ..................................................................................................................64 References......................................................................................................................................65
List of Tables
Table 2.1. List of bridges tested with brief summary of each bridge .......................................5 Table 3.1. Stress wave transmission times perpendicular to the grain with various levels
degradation using the Fakopp Microsecond Timer .................................................7 Table 4.1. Vibration data collected from Bridge 85 for span 1 ..............................................15 Table 4.2. Vibration data collected from Bridge 85 for span 2 ..............................................15 Table 4.3. Static load data collected from Bridge 85 for span 1.............................................16 Table 4.4. Static load data collected from Bridge 85 for span 2.............................................17 Table 4.5. Vibration data collected from Bridge 153 for span 1 ............................................20 Table 4.6. Static load data collected from Bridge 153 for span 1...........................................21 Table 4.7. Vibration data collected from Bridge 242 for span 1 ............................................24 Table 4.8. Vibration data collected from Bridge 242 for span 2 ............................................24 Table 4.9. Static load data collected from Bridge 242 for span 1...........................................25 Table 4.10. Static load data collected from Bridge 242 for span 2...........................................26 Table 4.11. Vibration data collected from Bridge 305 for span 1 ............................................30 Table 4.12. Vibration data collected from Bridge 305 for span 2 ............................................30 Table 4.13. Static load data collected from Bridge 305 for span 1...........................................31 Table 4.14. Static load data collected from Bridge 305 for span 2...........................................32 Table 4.15. Vibration data collected from Bridge 357 for span 1 ............................................36 Table 4.16. Vibration data collected from Bridge 357 for span 2 ............................................36 Table 4.17. Static load data collected from Bridge 357 for span 1...........................................37 Table 4.18. Static load data collected from Bridge 357 for span 2...........................................38 Table 4.19. Vibration data collected from Bridge 619 for span 1 ............................................41 Table 4.20. Static load data collected from Bridge 619 for span 1...........................................42 Table 4.21. Vibration data collected from Bridge 726 for span 1 ............................................46 Table 4.22. Vibration data collected from Bridge 726 for span 2 ............................................46 Table 4.23. Static load data collected from Bridge 726 for span 1...........................................47 Table 4.24. Static load data collected from Bridge 726 for span 2...........................................48 Table 4.25. Vibration data collected from Bridge CR-1 for span 1..........................................52 Table 4.26. Static load data collected from Bridge CR-1 for span 1 ........................................53 Table 4.27. Vibration data collected from Bridge CR-2 for span 1..........................................57 Table 4.28. Static load data collected from Bridge CR-2 for span 1 ........................................58 Table 5.1. Summary of static and dynamic bridge stiffness values........................................62
List of Figures
Figure 3.1. Fakopp microsecond timer being used on a timber pile ..........................................7 Figure 3.2. Example of resistance drill testing...........................................................................8 Figure 3.3. General test setup for vibration testing ....................................................................9 Figure 3.4. Truck positioned on bridge ....................................................................................11 Figure 3.5. Deflection rulers.....................................................................................................12 Figure 3.6. Optical surveying level ..........................................................................................12 Figure 4.1. Bridge 85................................................................................................................14 Figure 4.2. Bridge 85................................................................................................................14 Figure 4.3. Bridge 85................................................................................................................14 Figure 4.4. Deflection of span 1 of Bridge 85 for center loading ............................................19 Figure 4.5. Deflection of span 2 of Bridge 85 for center loading ............................................19 Figure 4.6. Bridge 153..............................................................................................................20 Figure 4.7. Bridge 153..............................................................................................................20 Figure 4.8. Bridge 153..............................................................................................................20 Figure 4.9. Deflection of span 1 of Bridge 153 for center loading .........................................22 Figure 4.10. Bridge 242..............................................................................................................23 Figure 4.11. Bridge 242..............................................................................................................23 Figure 4.12. Bridge 242..............................................................................................................23 Figure 4.13. Deflection of span 1 of Bridge 242 for center loading ..........................................28 Figure 4.14. Deflection of span 2 of Bridge 242 for center loading ..........................................28 Figure 4.15. Bridge 305..............................................................................................................29 Figure 4.16. Bridge 305..............................................................................................................29 Figure 4.17. Deflection of span 1 of Bridge 305 for center loading ..........................................34 Figure 4.18. Deflection of span 2 of Bridge 305 for center loading ..........................................34 Figure 4.19. Bridge 357..............................................................................................................35 Figure 4.20. Bridge 357..............................................................................................................35 Figure 4.21. Bridge 357..............................................................................................................35 Figure 4.22. Deflection of span 1 of Bridge 357 for center loading ..........................................40 Figure 4.23. Deflection of span 2 of Bridge 357 for center loading ..........................................40 Figure 4.24. Bridge 619..............................................................................................................41 Figure 4.25. Bridge 619..............................................................................................................41 Figure 4.26. Bridge 619..............................................................................................................41 Figure 4.27. Deflection of span 1 of Bridge 619 for center loading ..........................................44 Figure 4.28. Bridge 726..............................................................................................................45 Figure 4.29. Bridge 726..............................................................................................................45 Figure 4.30. Bridge 726..............................................................................................................45
Figure 4.31. Deflection of span 1 of Bridge 726 for center loading ..........................................50 Figure 4.32. Deflection of span 2 of Bridge 726 for center loading ..........................................50 Figure 4.33. Bridge CR-1 ...........................................................................................................51 Figure 4.34. Bridge CR-1 ...........................................................................................................51 Figure 4.35. Deflection of span 1 of Bridge CR-1 for center loading........................................55 Figure 4.36. Bridge CR-2 ...........................................................................................................56 Figure 4.37. Bridge CR-2 ...........................................................................................................56 Figure 4.38. Deflection of span 1 of Bridge CR-2 for center loading........................................60 Figure 5.1. Relationship (y = 0.7007x3.4714) between static-load measured stiffness and
measured frequency ...............................................................................................63

Executive Summary
Approximately 4,000 vehicle bridges in the State of Minnesota contain structural timber members. Current inspection techniques are limited to visual, sounding and coring inspections to assess the quality and performance of individual bridge members. The majority of these bridges are found in rural environments. These techniques are suitable for identifying advanced decay, but have limited effectiveness for early-stage decay that causes substantial structural degrade and decreased safety if not detected. Wood is a naturally occurring engineering material that is prone to deterioration caused by decay fungi and insect attack. For this reason, it is important to conduct frequent inspections of timber bridges with modern inspection equipment.
Recent collaborative research between the University of Minnesota Duluth Natural Resources Research Institute, Michigan Technological University and the USDA Forest Products Laboratory has developed vibration testing techniques for short-span, simply supported timber bridges. In contrast to typical bridge inspections where individual components, such as pilings, girders, etc., have been evaluated, the entire bridge is tested as a system by using free and/or forced vibration. Specifically, the technique involves measuring the frequency characteristics of the bridge superstructure under free or induced flexural vibration. This research showed that both forced and free vibration could be used as rapid inspection techniques to determine the stiffness of the bridge and the corresponding overall condition.
The focus of this research project was to use forced vibration testing techniques and load testing on an additional 12-plus timber bridge spans (from 9 bridges) of varying ages and designs to develop a data set for use in future commercialization and technology transfer activities. At the same time, a comprehensive inspection of each timber bridge was conducted using best practices as a means of understanding the physical health of each bridge tested. These inspections used a combination of visual examinations, physical and mechanical testing, stress wave timing techniques and resistance microdrilling techniques.
Inspection reports were completed for each individual timber bridge tested in this project. The combination of testing methods identified several bridges that required repair to the timber pilings, pile caps and girder beams, including St. Louis County bridges 242 and 53. These repairs were made by the bridge maintenance crew from St. Louis County. The completed repairs significantly increased the service life of these bridges.
The vibration and load testing showed a useful relationship between the peak frequency of vibration and the calculated stiffness of the bridge as determined through load testing. A correlation coefficient squared (R2) of 0.84.
The conclusions of the project were:
• The use of commercially available inspection equipment allowed the research team to identify critical areas of structural deterioration, resulting in completed repairs by St. Louis County. This deterioration typically took place in the bridge substructure, including pilings and pile caps. The use of stress wave timing and resistance microdrilling equipment allowed the inspection team to identify and quantify the decay in these bridges.
• The use of vibration testing allowed inspectors to conduct rapid inspections on bridge sections to identify a peak frequency of vibration. When compared to the bridge stiffness as

measured by load testing, a useful relationship occurred. The frequency of vibration increases with bridge stiffness.
• The vibration approach and equipment developed for this project show potential for assessing rural steel and concrete bridges; however, new techniques and appropriate equipment need to be developed to adequately measure the vibration. The frequency range for the concrete bridges evaluated exceeded the available vibration capacity of the forcing motor used in this testing.
Additional studies should utilize field instrumentation that can clearly identify first bending mode frequencies with real-time data processing tools and include automated control and data acquisition. Testing should also be conducted on dowel laminated bridge structures, which represent over 1,200 bridges in Minnesota.

1
Chapter 1 Introduction
The use of wood in timber bridges has many benefits including the fact that wood is a renewable and sustainable resource, timber bridges are often more economical than steel and concrete bridges, and they can be installed easily in rural environments. There are currently over 41,000 bridges in service with a span of over 20 ft with an average age of 40 years old (FHWA 2002). This represents 7 percent of the bridges reported in the National Bridge Inventory. Recent programs like the USDA Wood In Transportation Program have funded research to develop a new class of timber bridges and associated inspection techniques. Recently the Federal Highway Administration (FHWA 2002) expanded the usage of federal “preventative maintenance” funds to include state and local bridges. Wood is a natural occurring engineering material that is prone to deterioration caused by decay fungi and insect attack. For this reason, it is important to conduct frequent inspections of timber bridges with modern inspection equipment. As noted in the USDA Timber Bridge Manual, “Bridge members infected with decay fungi experience progressive strength loss as the fungi develop and degrade the wood structure. The degree of strength reduction depends on the area of the infection and the stage of decay development, whether advanced, intermediate, or incipient. In the advanced or intermediate stages, wood deterioration has progressed to the point where no strength remains in infected areas. At this stage, suitable detection methods can be used by the inspector to accurately define the affected areas with some degree of certainty. At the incipient or early stages of development, detection is much more difficult and the effect of strength loss varies among types of fungi.” It is important to identify early stage decay to ensure the safety of the structure and allow for treatment in service. Background discussions with Mn/DOT bridge inspection program managers and the St. Louis County bridge engineer revealed that current timber inspection procedures in Minnesota are limited to visual inspection of the wood components, sounding with a hammer, and coring to confirm suspected damage areas. These techniques have proved adequate for advanced decay detection, but are not adequate when the damage is in the early stage or is located internally in the members. All inspections are completed by evaluating individual components of these bridges, including pilings, pile caps, girders, decking, and railings. Use of advanced techniques like stress wave timing, moisture meters, and resistance drills will significantly improve the reliability of the inspections but these inspection techniques are time consuming. Deterioration, one of the most common damage mechanisms in wood structures, often inflicts damage internally, without visible signs appearing on the surface until load bearing capacity of the affected member is greatly reduced. Determining an appropriate load rating for an existing structure and establishing rational rehabilitation, repair, or replacement decisions can be achieved only after an accurate assessment of existing condition. Knowledge of the condition of the structure can reduce repair and replacement costs by minimizing labor and materials and extending service life.

2
In general, structural condition assessment requires the monitoring of some indicating parameters that are sensitive to the damage or deterioration mechanism in question. Current inspection methods for wood structures are limited to evaluating each structural member individually, which is a labor-intensive, time-consuming process. For field assessment of wood structures, a more efficient strategy would be to evaluate structural systems or subsystems in terms of their overall performance and serviceability. From this perspective, examining the dynamic response of a structural system might provide an alternative way to gain insight to the ongoing performance of the system. Deterioration caused by any organism or any type of physical damage to the structure reduces the strength and stiffness of the materials and thus could affect the dynamic behavior of the system. For example, if one structural system or section of the system was found to respond to dynamic loads in a manner significantly different from that observed in previous inspections, then a more extensive inspection of that structure would be warranted. Recent cooperative research efforts of the USDA Forest Products Laboratory, Michigan Technological University, and University of Minnesota Duluth (Morison et al 2002, Morison 2003, Peterson et al 2003, Wang et al 2005) have resulted in significant progress in developing global dynamic testing techniques for nondestructively evaluating the structural integrity of wood structure systems. In particular, a forced vibration response system was developed and used to assess the global stiffness of wood floor systems in buildings (Soltis et al 2002, Ross et al 2002). In these studies, a series of laboratory-constructed wood floor systems and some in-place wood floor structures were examined. An electric motor with an eccentric rotating mass was built and attached to the floor decking to excite the structure. The response of the floor to the forced vibration was measured at the bottom of the joists using a linear variable differential transducer (LVDT). The damped natural frequencies of floor systems were identified by increasing motor speed until the first local maximum deflection response was observed. The period of vibration was then estimated from the cycles of this steady-state vibration. This forced vibration approach was investigated in these studies for two reasons. First, the simplicity of this technique requires less experimental skill to perform field vibration testing. This fits the need of field inspectors who usually do not have much advanced training in structural dynamic testing. Second, the cost of testing a structure using the forced vibration method is very low compared with the use of a modal testing method. Furthermore, because this method is a pure time domain method, it eliminates the need for knowledge of modal analysis. Results from previous experimental studies showed that vibration generated through a forcing function could enable a stronger response in wood floor systems and give consistent frequency measurement. A decrease in natural frequency seems proportionate to the amount of decay, as simulated by progressively cutting the ends of some joists in laboratory floor settings (Soltis et al 2002). It was also found that the analytical model derived from simple beam theory fits the physics of the floor structures and can be used to correlate the natural frequency (first bending mode) to EI product of the floor’s cross section (Wang et al in press). Cooperative research to date has provided a reasonable scientific base upon which to build an engineering application of vibration response as part of a wood structure inspection program. The purpose of this study is to extend global dynamic testing methods, specifically the forced vibration testing technique, to timber bridges in the field. It is to be used as a first pass method, identifying timber bridges that need more thorough inspection. To simplify the method as much

3
as possible (from field application consideration), we focus only on the first bending mode of the bridge vibration. Specifically, we correlate the frequency of the first bending mode to the stiffness characteristics of single-span, girder-type timber bridges. Analytical Model The indicator of global structure stiffness that has been chosen is the fundamental natural frequency. For practical inspection purpose, an analytic model is needed for this method to relate the fundamental natural frequency to the global stiffness properties of a bridge. Continuous system theory has been chosen as the means for developing an analytical model that is based on general physical properties of bridges, such as length, mass, and cross-sectional properties. The superstructures of single-span timber girder bridges are typically constructed of wood beams (stringers), cross bridging, deck boards, and railing systems. It is observed that the stiffness of the stringers predominates over that of the transverse deck sheathing because the thickness of the decking boards is relatively small compared with the height of the stringers. In addition, the deck is not continuous and the deck boards are nailed perpendicular to the stringers, reducing the stiffness that would be provided in the case of simple bridge bending. The cross bridging also does not contribute to the bending stiffness of the bridge because it mainly provides lateral bracing to the beams. Thus, we assumed that a single-span wood girder bridge behaves predominately like a beam with resisting moments in the vertical direction. The total mass of the deck and railing system is distributed into the assumed mass of the stringers. The partial differential equation governing the vertical vibration for a simple flexure beam is
04
4
2
2
=∂∂
⎟⎟⎠
⎞⎜⎜⎝
⎛+
∂∂
xu
AEI
tu
ρ (1)
The solution of this partial differential equation is generally accomplished by means of the separation of variables and is largely dependent on boundary conditions at each end of the beam. (Blevins 1993) showed that a general form for the natural frequency for any mode can be derived as
2/1
2
2
2 ⎟⎟⎠
⎞⎜⎜⎝
⎛=
AEI
Lf i
i ρπλ
(2)
where fi is natural frequency (mode i), λi a factor dependent on the boundary conditions of the beam, L beam span, ρ mass density of the beam, A cross-sectional area of the beam, and EI stiffness (modulus of elasticity E × moment of inertia I) of the beam. Consider the vibration of a beam supported at the ends. If vibration is restricted to the first mode, Equation (2) can be rearranged to obtain an expression for the stiffness
321 WLfkg
EI i⎟⎟⎠
⎞⎜⎜⎝
⎛= (3)

4
where f1 is the fundamental natural frequency (first bending mode), k is defined as a system parameter dependent on the boundary conditions of the beam (pin–pin support: k = 2.46; fix–fix support, k = 12.65), W is weight of the beam (uniformly distributed), and g is acceleration due to gravity. Research Objectives
The objective of this project will be conduct vibration testing of timber, steel and concrete bridges in northeastern Minnesota to determine flexural frequency characteristics. Recent collaborative research between the UMD NRRI, Michigan Technological University, and the USDA Forest Products Laboratory has developed vibration testing techniques for short span, simply supported timber bridges. This research showed that both forced and free vibration could be used as rapid inspection techniques to determine the stiffness of the bridge and the corresponding overall condition.
The focus of this research was to use these vibration testing techniques and load testing on an additional 9+ timber bridges of varying ages and designs to develop a data set for use in future commercialization and technology transfer activities. We plan to critically assess the testing techniques used in Michigan and adapt them for vibration testing in Minnesota. Further, we want to investigate the feasibility of the testing equipment and techniques for use on short span steel and concrete bridges.
5
Chapter 2 Bridges Tested
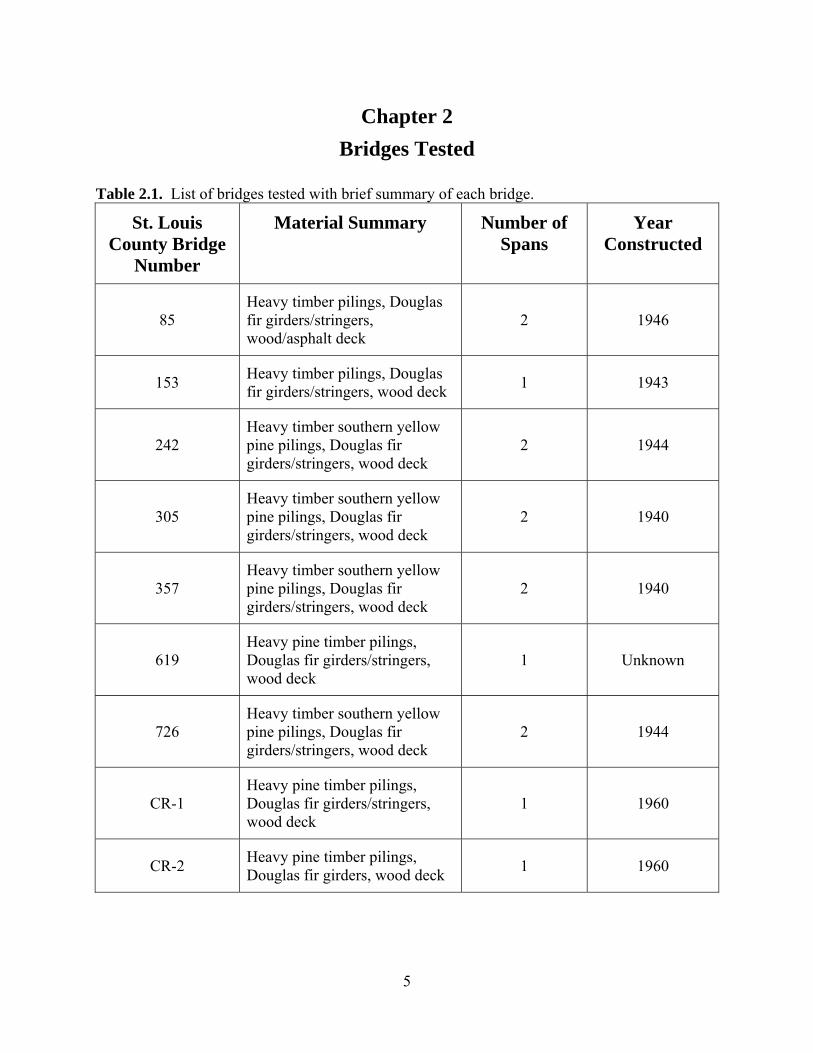
Table 2.1. List of bridges tested with brief summary of each bridge.
St. Louis County Bridge
Number
Material Summary Number of Spans
Year Constructed
85 Heavy timber pilings, Douglas fir girders/stringers, wood/asphalt deck
2 1946
153 Heavy timber pilings, Douglas fir girders/stringers, wood deck 1 1943
242 Heavy timber southern yellow pine pilings, Douglas fir girders/stringers, wood deck
2 1944
305 Heavy timber southern yellow pine pilings, Douglas fir girders/stringers, wood deck
2 1940
357 Heavy timber southern yellow pine pilings, Douglas fir girders/stringers, wood deck
2 1940
619 Heavy pine timber pilings, Douglas fir girders/stringers, wood deck
1 Unknown
726 Heavy timber southern yellow pine pilings, Douglas fir girders/stringers, wood deck
2 1944
CR-1 Heavy pine timber pilings, Douglas fir girders/stringers, wood deck
1 1960
CR-2 Heavy pine timber pilings, Douglas fir girders, wood deck 1 1960

6
Chapter 3 Procedures
Visual Inspection The simplest method for locating deterioration is visual inspection. An inspector observes the structure for signs of actual or potential deterioration, noting areas that require further investigation. When assessing the condition of a structure, visual inspection should never be the sole method used. Visual inspection requires strong light and is useful for detecting intermediate or advanced surface decay, water damage, mechanical damage, or failed members. Visual inspection cannot detect early stage decay, when remedial treatment is most effective. During an inspection the following signs of deterioration were investigated:
• Fruiting bodies • Sunken faces and localized collapse • Staining or discoloration • Insect activity • Plant and moss growth • Missing members • Checks and splits • Alterations • Loose or missing connections
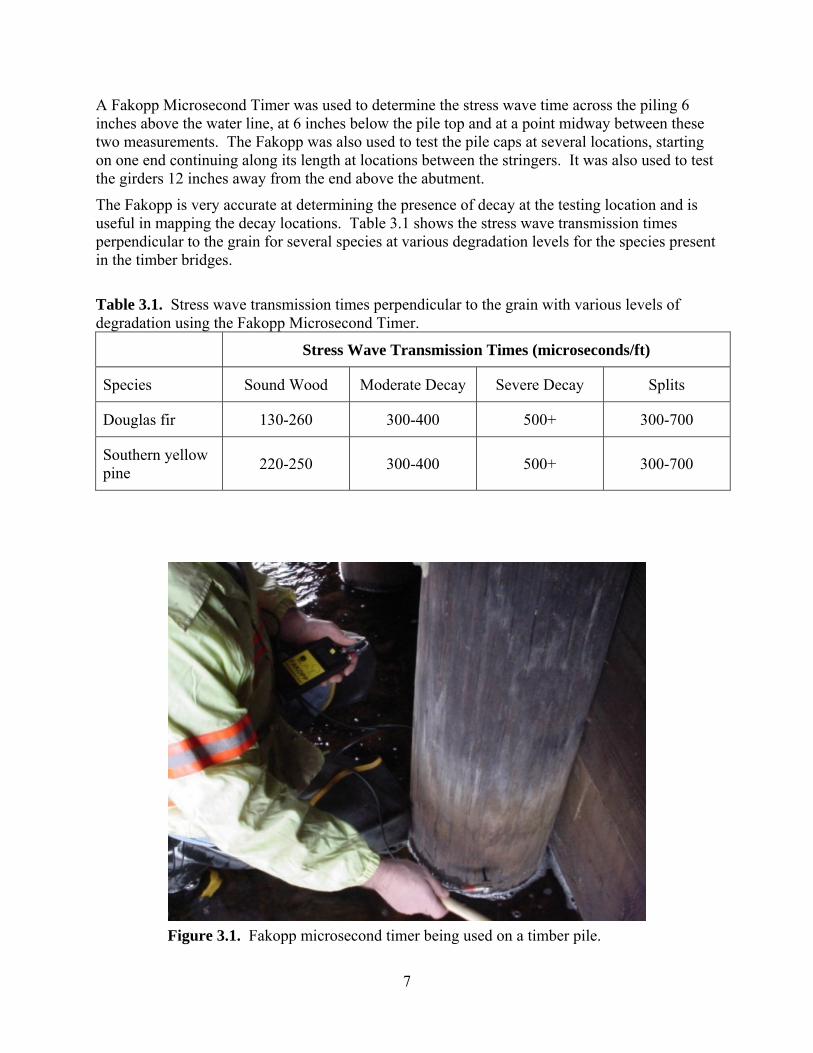
Moisture Content Determination At the time of bridge testing, the moisture content of wood in each bridge was measured with an electrical-resistance-type moisture meter and 3-in. (76-mm) long insulated probe pins in accordance with ASTM D 4444 (ASTM 2000). Moisture content data were collected at pin penetrations of 2 in. (51 mm) from the underside (tension face) of three different timber beam girders at each bridge. All field data were corrected for temperature adjustments in accordance with (Pfaff and Garrahan 1984). Stress Wave Timing An example of the stress wave concept for detecting decay within a rectangular wood member is shown in Figure 3.1. First, a stress wave is induced by striking the specimen with an impact device that is instrumented with an accelerometer that emits a start signal to a timer. A second accelerometer, which is held in contact with the other side of the specimen, serves to the leading edge of the propagating stress wave and sends a stop signal to the timer. The elapsed time for the stress wave to propagate between the accelerometers is displayed on the timer. All commercially available timing units, if calibrated and operated according to the manufacturer’s recommendations, yield comparable results. The use of stress wave velocity to detect wood decay in timber bridges and other structures is limited only by access to the structural members under consideration. It is especially useful on thick timbers 89 mm (3.5 in.) where hammer sounding is not effective. A detailed explanation of the use of stress wave timing and interpretation of the testing is detailed in publications prepared by Brashaw et al (2005).
7
A Fakopp Microsecond Timer was used to determine the stress wave time across the piling 6 inches above the water line, at 6 inches below the pile top and at a point midway between these two measurements. The Fakopp was also used to test the pile caps at several locations, starting on one end continuing along its length at locations between the stringers. It was also used to test the girders 12 inches away from the end above the abutment.
The Fakopp is very accurate at determining the presence of decay at the testing location and is useful in mapping the decay locations. Table 3.1 shows the stress wave transmission times perpendicular to the grain for several species at various degradation levels for the species present in the timber bridges. Table 3.1. Stress wave transmission times perpendicular to the grain with various levels of degradation using the Fakopp Microsecond Timer.
Stress Wave Transmission Times (microseconds/ft)
Species Sound Wood Moderate Decay Severe Decay Splits
Douglas fir 130-260 300-400 500+ 300-700
Southern yellow pine 220-250 300-400 500+ 300-700
Figure 3.1. Fakopp microsecond timer being used on a timber pile.

8
Resistance Microdrilling Resistance microdrilling was used to identify and quantify decay, voids, and insect galleries in wood beams, columns, poles, and piles. The resistance drill system measures the resistance of wood members to a 1.5-mm drill bit with a 3.0-mm head that passes through them. The drill bit is fed at a fixed movement rate allowing the inspector to determine the exact location and extent of the damaged area. This system produces a chart showing the relative resistance over its travel path. This chart can be produced either as a direct printout or can be downloaded to a computer. Areas of sound wood have varying levels of resistance depending on the density of the species and voids show no resistance. The inspector can determine areas of low, mild, and high levels of decay. A detailed explanation of the use of resistance microdrilling and interpretation of the testing is detailed in publications prepared by Brashaw et al (2005).
In areas of concern noted during visual and stress wave inspections, the IML F-300 resistance drill was used to test the cross-section and determine the resistance of the wood to a small diameter drill bit. An example of the Fakopp testing is shown in Figure 3.1 and the resistance drilling testing in Figure 3.2.
The resistance drilling unit was very accurate at determining the presence of decay at the drilling location. It measures the resistance on a 0-100% amplitude scale. Typical measures of resistance for sound softwoods are > 25%, 10-20% for moderate decay and 0-10% for advanced or severe decay.
Figure 3.2. Example of resistance drill testing.

9
Vibration Test Procedures for Timber Bridges A forced vibration technique was used to identify the first bending mode frequency of the bridge structures. This method is a purely time domain method and was used because it eliminates the need for modal analysis. An electric motor with a rotating unbalanced wheel was used to excite the structure, which creates a rotating force vector proportional to the square of the speed of the motor. Placing the motor at midspan ensured that the simple bending mode of structure vibration was excited. Three piezoelectric accelerometers (PCB 626BO2), also at midspan, were used to record the response in the time domain. To locate the first bending mode frequency, the motor speed was slowly increased from rest until the first local maximum response acceleration was located. The period of vibration was then estimated from 10 cycles of this steady-state motion as captured using a Fluke digital scopemeter. The specific testing steps included:
1. Secure a dc motor (1/2 horsepower) with rotating unbalanced wheel to the deck plank at the center of the bridge span and anchor using steel bolt screws.
2. Secure two magnetic metal plates to deck plank, one on each side of the bridge at midspan using steel bolt screws.
3. Attach one piezoelectric accelerometer to each magnetic metal plate to monitor the bridge vibration signals.
4. Start up motor. Slowly increase motor speed to put the bridge into low frequency transverse vibration.
5. Find the first bending mode frequency by locating the first local maximum response acceleration using a digital scopemeter.
6. Record the data and start a second test. Once all of the tests have been completed, the data is reviewed briefly and photographs are taken before leaving the test site. The typical test setup can be seen in Figure 3.3.
Figure 3.3. General test setup for vibration testing.

10
Static Load Testing Because the primary goal of this work is to relate the vibrational characteristics of these timber bridge structures to a measure of structural integrity, the bridges were also evaluated with the established method of load deflection analysis. This provided a more direct measure of the structure’s EI product. Static load tests were conducted at each field bridge using a live load testing method. A test vehicle was placed on each bridge deck and the resulting deflections were measured from calibrated rulers suspended from each timber girder along the midspan cross section using an optical surveying level. The test vehicle consisted of a fully loaded, tri-axle gravel truck. The gross vehicle weight and individual axle weights were measured for each truck used prior to testing. The axle spacing was also measured for each truck. Deflection readings were recorded prior to testing (unloaded), after placement of the test truck for each load case (loaded), and at the conclusion of testing (unloaded). For each load test, the test vehicle was straddling the bridge centerline with the bridge midspan bisecting the real dual truck axles. Measurement precision was ±0.04 in. (±1.0 mm) with no movements detected at the bridge supports. The static EI product of each bridge was then estimated from load deflection data based upon conventional beam theory. The specific static load test steps include:
Initial Assessment of Bridge Condition
1. Look for any signs of major distress in any of the support girders and load carrying beams.
2. Inspect top and bottom of road using visual and (hammer) sounding methods. 3. Look closely at abutments and pier supports to ensure that cap beams should be resting
squarely on piles). 4. Do not conduct bridge test if safety is concern -- Use traffic control as appropriate!
Placement of Optical Surveying Level
1. Look for a suitable location on solid ground, not on soft soils or muck. 2. Ensure that the technician has a good view of all centerspan rulers, including the closest
and farthest sight distances. 3. The height of instrument should be as high as possible, but not higher than 1 foot from
top of deflection rulers. 4. Ensure that the operator has sight of four corners of each span tested to measure for
possible vertical support movements.
Load Test Setup
1. Start with UNDERSIDE measurement of the bridge. 2. Measure (face-face) support span lengths along both edges of bridge, then place mark or
nail at midspan location. 3. Measure beam, plank dimensions, and note any unusual repairs. 4. Measure all support bearing lengths for the abutment cap and pier cap beams. 5. Measure (center-center) spacing of all bridge beams at centerspan x-section. 6. Attach brackets and rulers near the center of each beam along the centerspan x-section. 7. Attach brackets and rulers near the support corners (and near centerline for wide bridges)
of the span and make sure level instrument can read them ok. 8. Using a plumb bob, transfer the midspan x-section to the deck or curbs. 9. Continue with TOPSIDE measurements of the bridge.

11
10. Measure bridge (out-out) width over planks, and note any overhang at edges. 11. Mark the bridge centerline by using ½ of the bridge width (out-out). 12. Measure the bridge length (out-out) at topside, including all support bearings. 13. Mark truck locations (this point will bisect the rear axles and will be directly between the
rear dual wheels) with crayon and paint.
a. For single lane bridge, use center loading (with wheel lines straddling roadway centerline) with marks at 3 ft on each side of centerline.
b. For double lane bridge, position truck in each lane in addition to above center loading. Place additional marks 2 ft on each side of centerline.
14. Measure & record truck axle spacing and weights. 15. Commence load test.
Typical Sequence
1. Position truck. 2. Take photograph. 3. Take deflection readings. 4. Check survey level bubble to ensure level. 5. Repeat sequence until testing is complete.
Once all of the data has been collected, it is reviewed briefly before the truck leaves for home. Photographs of the bridge, both end and side views, are then taken with no people, vehicles, or anything else on the bridge. The main components of the setup for load testing can be seen in Figures 3.4, 3.5, and 3.6.
Figure 3.4. Truck positioned on bridge.

12
Figure 3.6. Optical surveying level.
Figure 3.5. Deflection rulers.

13
Estimation of Bridge Weight As known from the theoretical model shown in Equation (3), bridge weight is needed in predicting the structure stiffness using this vibration response method. In this study, bridge weights were estimated based upon actual dimensions along with an estimated unit weight for the timber components. A conservative unit weight of 50 lb/ft3 (801 kg/m3) is required for computing dead loads in the design of timber bridges according to AASHTO Standard Specifications for Highway Bridges. A less conservative unit weight of 35 lb/ft3 (561 kg/m3), which may more closely represent the actual density of creosote-treated Douglas-fir bridge components, was assumed in computing bridge weights for the field bridges. Douglas-fir was most likely the wood species because visual evidence of incising typically associated with Douglas-fir (and other difficult-to-treat species) was observed at all field bridges.
14
Chapter 4 Individual Bridge Testing Summary
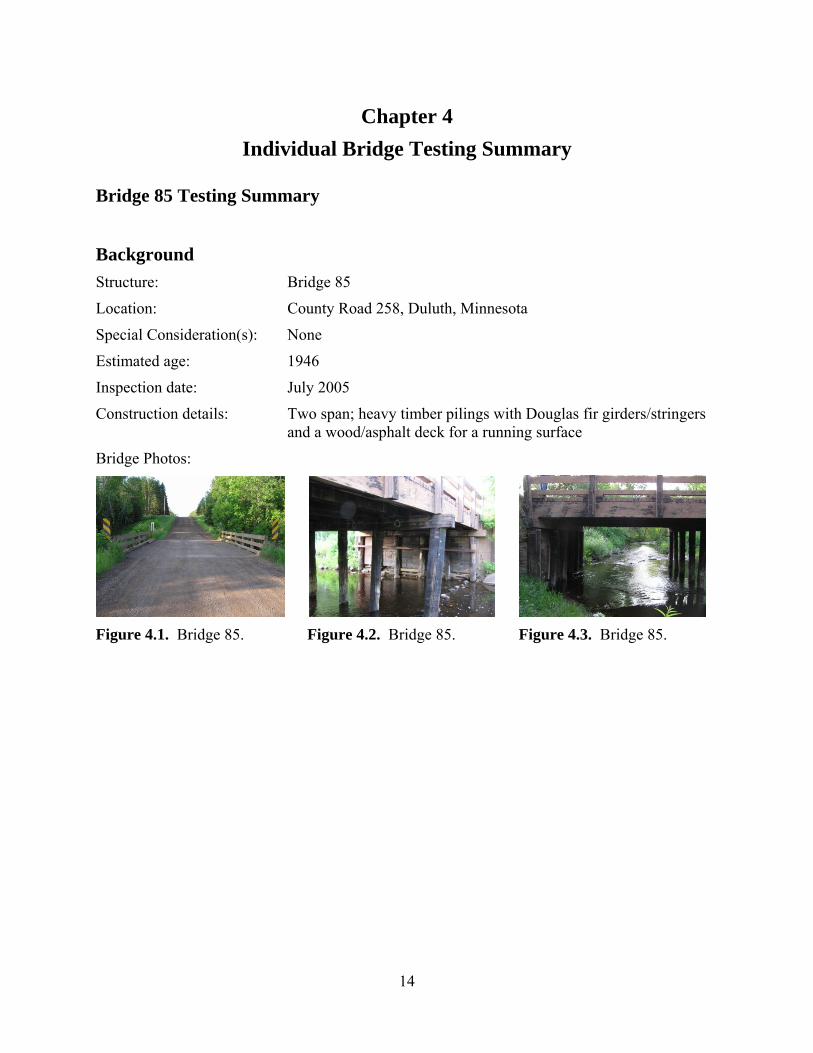
Bridge 85 Testing Summary Background Structure: Bridge 85
Location: County Road 258, Duluth, Minnesota
Special Consideration(s): None
Estimated age: 1946
Inspection date: July 2005
Construction details: Two span; heavy timber pilings with Douglas fir girders/stringers and a wood/asphalt deck for a running surface
Bridge Photos:
Figure 4.1. Bridge 85. Figure 4.2. Bridge 85. Figure 4.3. Bridge 85.

15
Vibration Test Data The vibration testing data for Bridge 85, spans 1 and 2 are shown listed in Tables 4.1 and 4.2.
Table 4.1. Vibration data collected from Bridge 85 for span 1.
Motor Vibration Test
Length Width C-C Span
Dead load Speed Frequency Time/cycle Frequency
(ft) (ft) (ft) (lb) (rpm) (Hz) (ms) (Hz) 39.4 24.35 18.36 0 1519 25.3 40 25
0 1571 26.2 38.8 25.7 Note:
• ft = feet, lb = pounds, rpm = revolutions per minute, Hz = hertz, ms = milliseconds Table 4.2. Vibration data collected from Bridge 85 for span 2.
Motor Vibration Test
Length Width C-C Span
Dead load Speed Frequency Time/cycle Frequency
(ft) (ft) (ft) (lb) (rpm) (Hz) (ms) (Hz) 18.52 24.3 17.52 1694 28.2 36 27.7 0
1659 27.7 36.8 27.2 1000 1706 28.4 35.6 28.1 2000 1767 29.5 34.8 28.7 2000
Note: • ft = feet, lb = pounds, rpm = revolutions per minute, Hz = hertz, ms = milliseconds

16
Static Load Test Data The static load testing data for Bridge 85, spans 1 and 2 are shown listed in Tables 4.3 and 4.4.
Table 4.3. Static load data collected from Bridge 85 for span 1.
Load Case No. 1 Load Case No. 2 Load Case No. 3 Data Point
Initial zero load
(mm)
Final zero load
(mm)
Average zero load
(mm) Reading (mm)
Deflection (mm)
Deflection (in)
Reading (mm)
Deflection (mm)
Deflection (in)
Reading (mm)
Deflection (mm)
Deflection (in)
1 1467 1468 1467.5 1465 -2.5 -0.1 1468 0.5 0.02 1468 0.5 0.02 2 1460 1460 1460 1457 -3 -0.12 1460 0 0 1460 0 0 3 1454 1454 1454 1444 -10 -0.39 1453 -1 -0.04 1451 -3 -0.12 4 1450 1451 1450.5 1442 -8.5 -0.33 1450 -0.5 -0.02 1443 -7.5 -0.3 5 1447 1447 1447 1438 -9 -0.35 1444 -3 -0.12 1438 -9 -0.35 6 1452 1453 1452.5 1448 -4.5 -0.18 1443 -9.5 -0.37 1443 -9.5 -0.37 7 1456 1456 1456 1455 -1 -0.04 1447 -9 -0.35 1447 -9 -0.35 8 1457 1453 1455 1453 -2 -0.08 1443 -12 -0.47 1449 -6 -0.24 9 1457 1457 1457 1457 0 0 1448 -9 -0.35 1456 -1 -0.04
10 1449 1449 1449 1449 0 0 1445 -4 -0.16 1449 0 0 A 1450 1450 1450 1449 -1 -0.04 1450 0 0 1450 0 0 B 1461 1460 1460.5 1462 1.5 0.06 1460 -0.5 -0.02 1462 1.5 0.06 C 1485 1486 1485.5 1485 -0.5 -0.02 1485 -0.5 -0.02 1485 -0.5 -0.02 D 1435 1436 1435.5 1437 1.5 0.06 1435 -0.5 -0.02 1436 0.5 0.02
Note: • mm = millimeters • in = inches • Load Case No. 1 (upstream) and Load Case No. 2 (downstream) was 2 ft centerline, rear axles at midspan, and front axle off span. • Load Case No. 3 was truck straddling centerline, rear axles at midspan, and front axle off span. • Data Point 1 (upstream) and Data Point 10 (downstream) • Truck Weights:
- Gross Vehicle Weight = 64,560 lbs, Rear Axle Vehicle Weight = 45,700 lbs

17
Table 4.4. Static load data collected from Bridge 85 for span 2.
Load Case No. 1 Load Case No. 2 Load Case No. 3 Data Point
Initial zero load
(mm)
Final zero load
(mm)
Average zero load
(mm) Reading (mm)
Deflection (mm)
Deflection (in)
Reading (mm)
Deflection (mm)
Deflection (in)
Reading (mm)
Deflection (mm)
Deflection (in)
1 1475 1475 1475 1472 -3 -0.12 1476 1 0.04 1476 1 0.04 2 1462 1462 1462 1451 -11 -0.43 1462 0 0 1461 -1 -0.04 3 1454 1454 1454 1444 -10 -0.39 1454 0 0 1451 -3 -0.12 4 1449 1449 1449 1438 -11 -0.43 1448 -1 -0.04 1438 -11 -0.43 5 1448 1448 1448 1436 -12 -0.47 1444 -4 -0.16 1437 -11 -0.43 6 1447 1446 1446.5 1443 -3.5 -0.14 1443 -3.5 -0.14 1436 -10.5 -0.41 7 1443 1443 1443 1443 0 0 1434 -9 -0.35 1432 -11 -0.43 8 1448 1447 1447.5 1448 0.5 0.02 1437 -10.5 -0.41 1443 -4.5 -0.18 9 1448 1447 1447.5 1448 0.5 0.02 1438 -9.5 -0.37 1446 -1.5 -0.06
10 1437 1448 1442.5 1438 -4.5 -0.18 1433 -9.5 -0.37 1438 -4.5 -0.18 A 1487 1487 1487 1486 -1 -0.04 1488 1 0.04 1487 0 0 B 1439 1440 1439.5 1439 -0.5 -0.02 1438 -1.5 -0.06 1440 0.5 0.02 C 1470 1469 1469.5 1468 -1.5 -0.06 1469 -0.5 -0.02 1470 0.5 0.02 D 1444 1443 1443.5 1444 0.5 0.02 1441 -2.5 -0.1 1444 0.5 0.02
Note: mm = millimeters
• in = inches • Load Case No. 1 (upstream) and Load Case No. 2 (downstream) was 2 ft centerline, rear axles at midspan, and front axle off span. • Load Case No. 3 was truck straddling centerline, rear axles at midspan, and front axle off span. • Data Point 1 (upstream) and Data Point 10 (downstream) • Truck Weights:
- Gross Vehicle Weight = 64,560 lbs, rear Axle Vehicle Weight = 45,700 lbs

18
Bridge 85 Results Results obtained from the inspection are shown for each component type of the bridge in the following sections.
Decking The decking was inspected from the underside since the running surface was asphalt paved. The deck was noted to be in good condition.
Railings, Rail Posts and Curbs Visual inspection noted these components in good condition. No stress wave timing or resistance drilling was conducted.
Pilings The pilings were in fair condition with numerous splits that have been strapped for added support; the timing data shows no major concerns with the exception of the bottom of piles 3, 7 and 9.
Pile Caps The pile caps were not solid timber but laminated lumber. Therefore, timing data was not performed due to the timbers not being solid timber. Visual inspection noted that pile cap A and C are out of plum due to the abutments pushing inward.
Girders Deterioration was not noted in any of the girders ends.
Vibration Frequency There was an average frequency of vibration of 27.9 Hertz (Hz) for span 1 and 25.3 Hz for span 2.
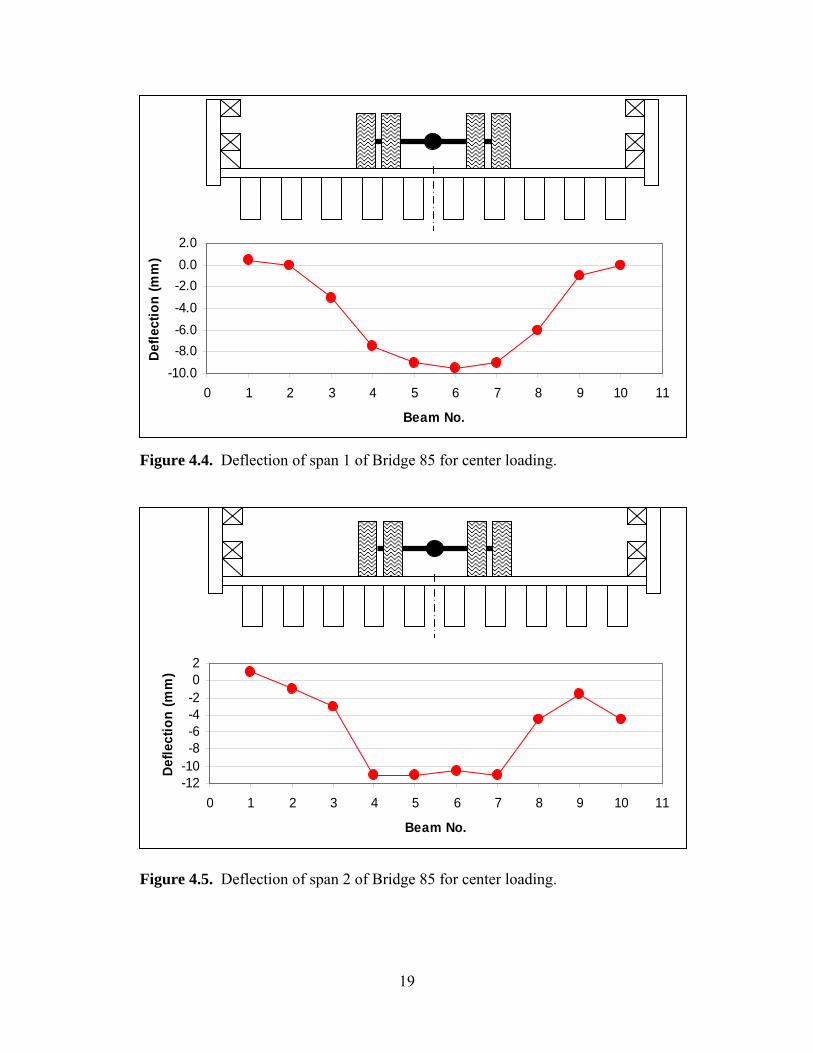
Live Load Figures 4.4 and 4.5 show the deflections of spans 1 and 2 of Bridge 85 for center loading.
19
-10.0-8.0-6.0-4.0-2.00.02.0
0 1 2 3 4 5 6 7 8 9 10 11
Beam No.
Defle
ctio
n (m
m)
Figure 4.5. Deflection of span 2 of Bridge 85 for center loading.
Figure 4.4. Deflection of span 1 of Bridge 85 for center loading.
-12-10-8-6-4-202
0 1 2 3 4 5 6 7 8 9 10 11
Beam No.
Defle
ctio
n (m
m)

20
Bridge 153 Testing Summary Background Structure: Bridge 153
Location: County Road 840, Floodwood, Minnesota
Special Consideration(s): None
Estimated age: 1943
Inspection date: July 2005
Construction details: Single span; heavy timber pilings with Douglas fir girders/stringers and a wood deck for a running surface
Bridge Photos:
Figure 4.6. Bridge 153. Figure 4.7. Bridge 153. Figure 4.8. Bridge 153.
Vibration Test Data The vibration testing data for Bridge 153, span 1 is shown listed in Table 4.5.
Table 4.5. Vibration data collected from Bridge 153 for span 1.
Motor Vibration Test
Length Width C-C Span
Dead load Speed Frequency Time/cycle Frequency
(ft) (ft) (ft) (lb) (rpm) (Hz) (ms) (Hz) 19.83 24.083 0 1710 28.5 35.4 28.2
0 1678 28 36.2 27.6 0 1618 27 37.4 26.7
Note: • ft = feet, lb = pounds, rpm = revolutions per minute, Hz = hertz, ms = milliseconds

21
Static Load Test Data The static load testing data for Bridge 153, span 1 is shown listed in Table 4.6.
Table 4.6. Static load data collected from Bridge 153 for span 1.
Load Case No. 1 Load Case No. 2 Load Case No. 3 Data Point
Initial zero load
(mm)
Final zero load
(mm)
Average zero load
(mm) Reading (mm)
Deflection (mm)
Deflection (in)
Reading (mm)
Deflection (mm)
Deflection (in)
Reading (mm)
Deflection (mm)
Deflection (in)
1 824 823 823.5 821 -2.5 -0.1 824 0.5 0.02 824 0.5 0.02 2 813 813 813 808 -5 -0.2 813 0 0 812 -1 -0.04 3 804 803 803.5 796 -7.5 -0.3 803 -0.5 -0.02 800 -3.5 -0.14 4 804 804 804 798 -6 -0.24 803 -1 -0.04 799 -5 -0.2 5 794 793 793.5 787 -6.5 -0.26 791 -2.5 -0.1 786 -7.5 -0.3 6 774 773 773.5 767 -6.5 -0.26 769 -4.5 -0.18 765 -8.5 -0.33 7 775 774 774.5 771 -3.5 -0.14 767 -7.5 -0.3 766 -8.5 -0.33 8 765 764 764.5 763 -1.5 -0.06 756 -8.5 -0.33 756 -8.5 -0.33 9 765 764 764.5 764 -0.5 -0.02 756 -8.5 -0.33 759 -5.5 -0.22
10 765 764 764.5 764 -0.5 -0.02 757 -7.5 -0.3 761 -3.5 -0.14 11 766 765 765.5 766 0.5 0.02 759 -6.5 -0.26 765 -0.5 -0.02 12 759 758 758.5 759 0.5 0.02 756 -2.5 -0.1 759 0.5 0.02 A 780 780 780 779 -1 -0.04 780 0 0 780 0 0 B 769 768 768.5 769 0.5 0.02 767 -1.5 -0.06 769 0.5 0.02 C 877 876 876.5 874 -2.5 -0.1 877 0.5 0.02 877 0.5 0.02 D 762 762 762 762 0 0 761 -1 -0.04 762 0 0
Note: • mm = millimeters • in = inches • Load Case No. 1 (upstream) and Load Case No. 2 (downstream) was 2 ft centerline, rear axles at midspan, and front axle off span. • Load Case No. 3 was truck straddling centerline, rear axles at midspan, and front axle off span. • Data Point 1 (upstream) and Data Point 12 (downstream) • Data Point A upstream left corner, B downstream left corner, C upstream right corner, D downstream right corner • Truck Weights: Gross Vehicle Weight = 44,340 lbs, Rear Axle Weight = 31, 620 lbs

22
Bridge 153 Results Results obtained from the inspection are shown for each component type of the bridge in the following sections.
Decking The decking appeared to be in good condition. Some of the decking fasteners have become loose and should be replaced. Decay was not evident. No stress wave timing or resistance drilling was conducted.
Railings, Rail Posts, and Curbs Visual inspection noted these components in good condition. No stress wave timing or resistance drilling was conducted.
Pilings Pile numbers 2 and 3 were not measured. The piles all showed high microsecond time data with pile 9 having the highest reading of 1640 microseconds (μs). Piles 9 and 10 were not in contact with the pile cap.
Pile Caps The pile caps both showed acceptable stress time data and moisture content.
Girders Deterioration was not noted in any of the ends of the girders. Girder number 3 showed higher deflection during the live load test.
Vibration Frequency The span had average frequency of vibration of 27.5 Hz with no dead load.
Live Load Figure 4.9 shows the deflection of span 1 of Bridge 153 for center loading.
Figure 4.9. Deflection of span 1 of Bridge 153 for center loading.
23
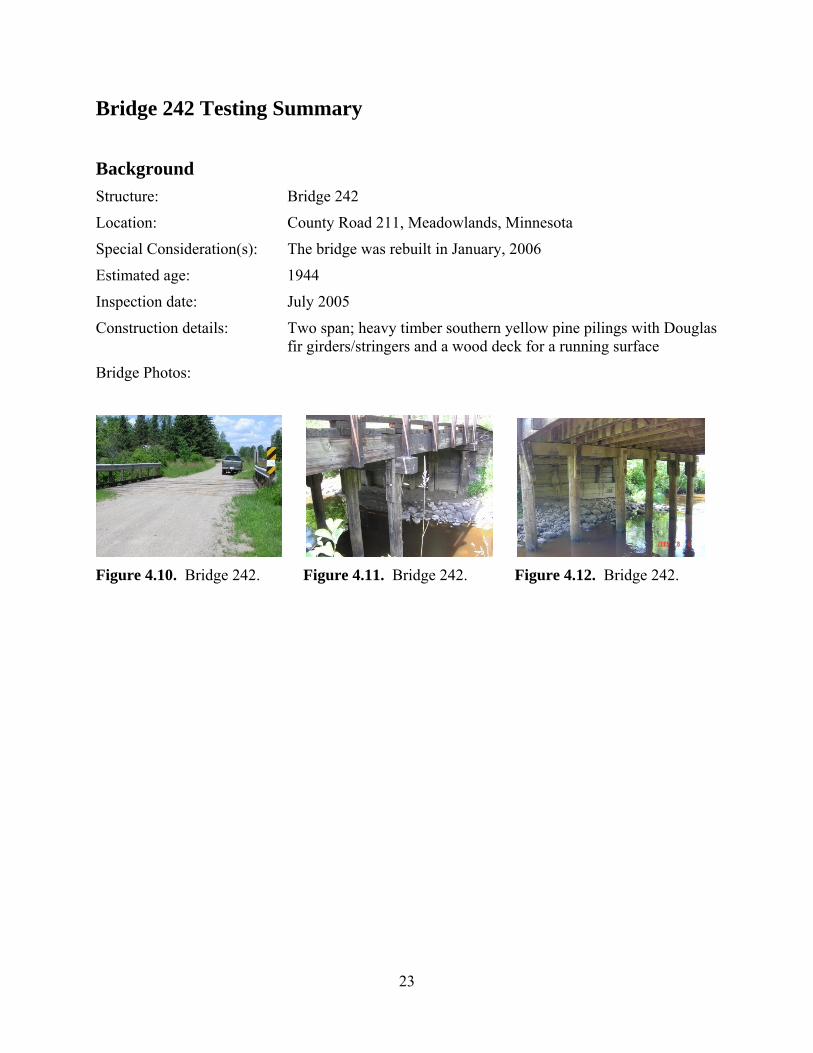
Bridge 242 Testing Summary Background Structure: Bridge 242
Location: County Road 211, Meadowlands, Minnesota
Special Consideration(s): The bridge was rebuilt in January, 2006
Estimated age: 1944
Inspection date: July 2005
Construction details: Two span; heavy timber southern yellow pine pilings with Douglas fir girders/stringers and a wood deck for a running surface
Bridge Photos:
Figure 4.10. Bridge 242. Figure 4.11. Bridge 242. Figure 4.12. Bridge 242.

24
Vibration Test Data The vibration testing data for Bridge 242, spans 1 and 2 are shown listed in Tables 4.7 and 4.8.
Table 4.7. Vibration data collected from Bridge 242 for span 1.
Motor Vibration Test
Length Width C-C Span
Dead load Speed Frequency Time/cycle Frequency
(ft) (ft) (ft) (lb) (rpm) (Hz) (ms) (Hz) 37.95 24.2 17.6 0 1363 22.7 44.8 22.3
0 1323 22.1 45.6 21.9 0 1469 24.5 46 21.7
Note: • ft = feet, lb = pounds, rpm = revolutions per minute, Hz = hertz, ms = milliseconds
Table 4.8. Vibration data collected from Bridge 242 for span 2.
Motor Vibration Test
Length Width C-C Span
Dead load Speed Frequency Time/cycle Frequency
(ft) (ft) (ft) (lb) (rpm) (Hz) (ms) (Hz) 18.52 24.3 17.6 0 1329 22.2 45.6 21.9
0 1298 21.6 46.4 21.6 0 1326 22.1 46 21.7
Note: • ft = feet, lb = pounds, rpm = revolutions per minute, Hz = hertz, ms = milliseconds

25
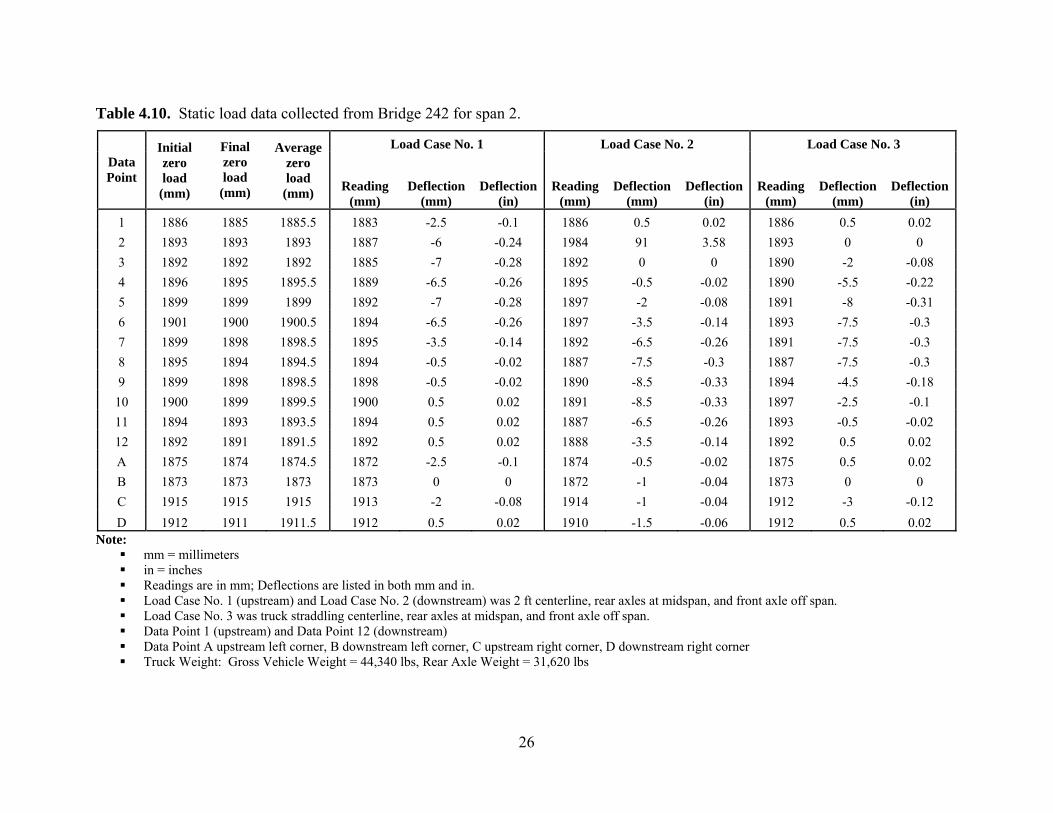
Static Load Test Data The static load testing data for Bridge 242, spans 1 and 2 are shown listed in Tables 4.9 and 4.10.
Table 4.9. Static load data collected from Bridge 242 for span 1.
Load Case No. 1 Load Case No. 2 Load Case No. 3 Data Point
Initial zero load
(mm)
Final zero load
(mm)
Average zero load
(mm) Reading (mm)
Deflection (mm)
Deflection (in)
Reading (mm)
Deflection (mm)
Deflection (in)
Reading (mm)
Deflection (mm)
Deflection (in)
1 1871 1871 1871 1865 -6 -0.24 1871 0 0 1871 0 0 2 1867 1868 1867.5 1859 -8.5 -0.33 1867 -0.5 -0.02 1866 -1.5 -0.06 3 1868 1868 1868 1860 -8 -0.31 1867 -1 -0.04 1864 -4 -0.16 4 1879 1879 1879 1871 -8 -0.31 1878 -1 -0.04 1873 -6 -0.24 5 1872 1872 1872 1865 -7 -0.28 1870 -2 -0.08 1865 -7 -0.28 6 1881 1881 1881 1876 -5 -0.2 1877 -4 -0.16 1874 -7 -0.28 7 1872 1871 1871.5 1869 -2.5 -0.1 1865 -6.5 -0.26 1864 -7.5 -0.3 8 1877 1877 1877 1876 -1 -0.04 1869 -8 -0.31 1870 -7 -0.28 9 1877 1876 1876.5 1876 -0.5 -0.02 1869 -7.5 -0.3 1872 -4.5 -0.18
10 1874 1874 1874 1874 0 0 1866 -8 -0.31 1872 -2 -0.08 11 1864 1864 1864 1864 0 0 1857 -7 -0.28 1863 -1 -0.04 12 1869 1869 1869 1869 0 0 1866 -3 -0.12 1869 0 0 A 1877 1877 1877 1874 -3 -0.12 1877 0 0 1877 0 0 B 1870 1870 1870 1870 0 0 1867 -3 -0.12 1870 0 0 C 1869 1868 1868.5 1865 -3.5 -0.14 1868 -0.5 -0.02 1868 -0.5 -0.02 D 1873 1873 1873 1873 0 0 1872 -1 -0.04 1873 0 0
Note: mm = millimeters, in = inches Readings are in mm; Deflections are listed in both mm and in. Load Case No. 1 (upstream) and Load Case No. 2 (downstream) was 2 ft centerline, rear axles at midspan, and front axle off span. Load Case No. 3 was truck straddling centerline, rear axles at midspan, and front axle off span. Data Point 1 (upstream) and Data Point 12 (downstream) Data Point A upstream left corner, B downstream left corner, C upstream right corner, D downstream right corner Truck Weight: Gross Vehicle Weight = 44,340 lbs, Rear Axle Weight = 31,620 l
26
Table 4.10. Static load data collected from Bridge 242 for span 2.
Load Case No. 1 Load Case No. 2 Load Case No. 3 Data Point
Initial zero load
(mm)
Final zero load
(mm)
Average zero load
(mm) Reading (mm)
Deflection (mm)
Deflection (in)
Reading (mm)
Deflection (mm)
Deflection (in)
Reading (mm)
Deflection (mm)
Deflection (in)
1 1886 1885 1885.5 1883 -2.5 -0.1 1886 0.5 0.02 1886 0.5 0.02 2 1893 1893 1893 1887 -6 -0.24 1984 91 3.58 1893 0 0 3 1892 1892 1892 1885 -7 -0.28 1892 0 0 1890 -2 -0.08 4 1896 1895 1895.5 1889 -6.5 -0.26 1895 -0.5 -0.02 1890 -5.5 -0.22 5 1899 1899 1899 1892 -7 -0.28 1897 -2 -0.08 1891 -8 -0.31 6 1901 1900 1900.5 1894 -6.5 -0.26 1897 -3.5 -0.14 1893 -7.5 -0.3 7 1899 1898 1898.5 1895 -3.5 -0.14 1892 -6.5 -0.26 1891 -7.5 -0.3 8 1895 1894 1894.5 1894 -0.5 -0.02 1887 -7.5 -0.3 1887 -7.5 -0.3 9 1899 1898 1898.5 1898 -0.5 -0.02 1890 -8.5 -0.33 1894 -4.5 -0.18
10 1900 1899 1899.5 1900 0.5 0.02 1891 -8.5 -0.33 1897 -2.5 -0.1 11 1894 1893 1893.5 1894 0.5 0.02 1887 -6.5 -0.26 1893 -0.5 -0.02 12 1892 1891 1891.5 1892 0.5 0.02 1888 -3.5 -0.14 1892 0.5 0.02 A 1875 1874 1874.5 1872 -2.5 -0.1 1874 -0.5 -0.02 1875 0.5 0.02 B 1873 1873 1873 1873 0 0 1872 -1 -0.04 1873 0 0 C 1915 1915 1915 1913 -2 -0.08 1914 -1 -0.04 1912 -3 -0.12 D 1912 1911 1911.5 1912 0.5 0.02 1910 -1.5 -0.06 1912 0.5 0.02
Note: mm = millimeters in = inches Readings are in mm; Deflections are listed in both mm and in. Load Case No. 1 (upstream) and Load Case No. 2 (downstream) was 2 ft centerline, rear axles at midspan, and front axle off span. Load Case No. 3 was truck straddling centerline, rear axles at midspan, and front axle off span. Data Point 1 (upstream) and Data Point 12 (downstream) Data Point A upstream left corner, B downstream left corner, C upstream right corner, D downstream right corner Truck Weight: Gross Vehicle Weight = 44,340 lbs, Rear Axle Weight = 31,620 lbs

27
Bridge 242 Results Results obtained from the inspection are shown for each component type of the bridge in the following sections.
Decking The decking appeared to be in good condition. No major fastener damage was noted. Decay was not evident. No stress wave timing or resistance drilling was conducted.
Railings, Rail Posts and Curbs Visual inspection noted these components in good condition. No stress wave timing or resistance drilling was conducted.
Pilings Pile numbers 5 and 6 showed presence of substantial decay as noted by stress wave timing data. Piling number 6 was visually broken. Pile numbers 7, 8, 10, and 11 appear to have significant decay present at the top of the pile in contact with the pile cap. They should be further investigated on site if the pile cap is removed or repaired.
Pile Caps Pile cap A shows the presence of decay at a distance between 8 and 18 ft from the upstream end. Pile cap B (at bridge center pile support) showed significant decay along the entire length and should be considered for replacement. Resistance drilling data shows that there is severe internal decay present in the pile cap. At the upstream end, there is an internal void present of 4 inches, increasing to 11 inches at 17 ft. At the downstream end, the pile cap is in good condition.
Girders Deterioration was not noted in any of the girders ends. We did not have access to the girders above the center piles and pile cap.
Vibration Frequency There was a frequency of vibration of 21.9 Hertz (Hz) for Span 1 and 21.5 Hz for Span 2.
Live Load
Figures 4.13 and 4.14 show the deflections of spans 1 and 2 of Bridge 242 for center loading.

28
Figure 4.13. Deflection of span 1 of Bridge 242 for center loading.
Figure 4.14. Deflection of span 2 of bridge 242 for center loading.

29
Bridge 305 Testing Summary
Background Structure: Bridge 305
Location: County Road 936, North of Virginia, Minnesota
Special Consideration(s): Bridge is skewed across waterway.
Estimated age: 1940
Inspection date: July 2005
Construction details: Two span; heavy timber southern yellow pine pilings with Douglas fir girders/stringers and a wood deck for a running surface
Bridge Photos:
Figure 4.15. Bridge 305. Figure 4.16. Bridge 305.

30
Vibration Test Data The vibration testing data for Bridge 305, spans 1 and 2 are shown listed in Tables 4.11 and 4.12.
Table 4.11. Vibration data collected from Bridge 305 for span 1.
Motor Vibration Test
Length Width C-C Span
Dead load Speed Frequency Time/cycle Frequency
(ft) (ft) (ft) (lb) (rpm) (Hz) (ms) (Hz) 60 24 20.83 0 1888 31.5 318 31.4
0 1990 30.4 304 32.9 0 1899 31.7 320 31.3
Note: • ft = feet, lb = pounds, rpm = revolutions per minute, Hz = hertz, ms = milliseconds
Table 4.12. Vibration data collected from Bridge 305 for span 2.
Motor Vibration Test
Length Width C-C Span
Dead load Speed Frequency Time/cycle Frequency
(ft) (ft) (ft) (lb) (rpm) (Hz) (ms) (Hz) 60 24 21.33 0 2096 34.9 292 34.2 0 2109 35.2 286 35
Note: • ft = feet, lb = pounds, rpm = revolutions per minute, Hz = hertz, ms = milliseconds

31
Static Load Test Data The static load testing data for Bridge 305, spans 1 and 2 are shown listed in Tables 4.13 and 4.14.
Table 4.13. Static load data collected from Bridge 305 for span 1.
Load Case No. 1 Load Case No. 2 Load Case No. 3 Data Point
Initial zero load
(mm)
Final zero load
(mm)
Average zero load
(mm) Reading (mm)
Deflection (mm)
Deflection (in)
Reading (mm)
Deflection (mm)
Deflection (in)
Reading (mm)
Deflection (mm)
Deflection (in)
1 1161 1160 1160.5 1159 -1.5 -0.06 1160 -0.5 -0.02 1161 0.5 0.02 2 1172 1171 1171.5 1168 -3.5 -0.14 1172 0.5 0.02 1172 0.5 0.02 3 1176 1175 1175.5 1170 -5.5 -0.22 1176 0.5 0.02 1175 -0.5 -0.02 4 1182 1181 1181.5 1175 -6.5 -0.26 1182 0.5 0.02 1180 -1.5 -0.06 5 1192 1192 1192 1186 -6 -0.24 1192 0 0 1188 -4 -0.16 6 1197 1197 1197 1191 -6 -0.24 1196 -1 -0.04 1191 -6 -0.24 7 1212 1211 1211.5 1206 -5.5 -0.22 1210 -1.5 -0.06 1206 -5.5 -0.22 8 1218 1218 1218 1214 -4 -0.16 1215 -3 -0.12 1212 -6 -0.24 9 1226 1226 1226 1224 -2 -0.08 1221 -5 -0.2 1220 -6 -0.24
10 1234 1233 1233.5 1232 -1.5 -0.06 1228 -5.5 -0.22 1228 -5.5 -0.22 11 1246 1246 1246 1246 0 0 1240 -6 -0.24 1242 -4 -0.16 12 1255 1255 1255 1255 0 0 1249 -6 -0.24 1252 -3 -0.12 13 1263 1263 1263 1263 0 0 1256 -7 -0.28 1261 -2 -0.08 14 1275 1274 1274.5 1274 -0.5 -0.02 1269 -5.5 -0.22 1273 -1.5 -0.06 15 1277 1276 1276.5 1276 -0.5 -0.02 1273 -3.5 -0.14 1276 -0.5 -0.02 A 1188 1186 1187 1185 -2 -0.08 1188 1 0.04 1188 1 0.04 B 1340 1340 1340 1340 0 0 1338 -2 -0.08 1340 0 0 C 1142 1142 1142 1141 -1 -0.04 1142 0 0 1142 0 0 D 1217 1216 1216.5 1216 -0.5 -0.02 1214 -2.5 -0.1 1216 -0.5 -0.02 E 1317 1317 1317 1316 -1 -0.04 1313 -4 -0.16 1315 -2 -0.08 F 1282 1282 1282 1280 -2 -0.08 1279 -3 -0.12 1278 -4 -0.16 G 1246 1246 1246 1242 -4 -0.16 1247 1 0.04 1243 -3 -0.12
32
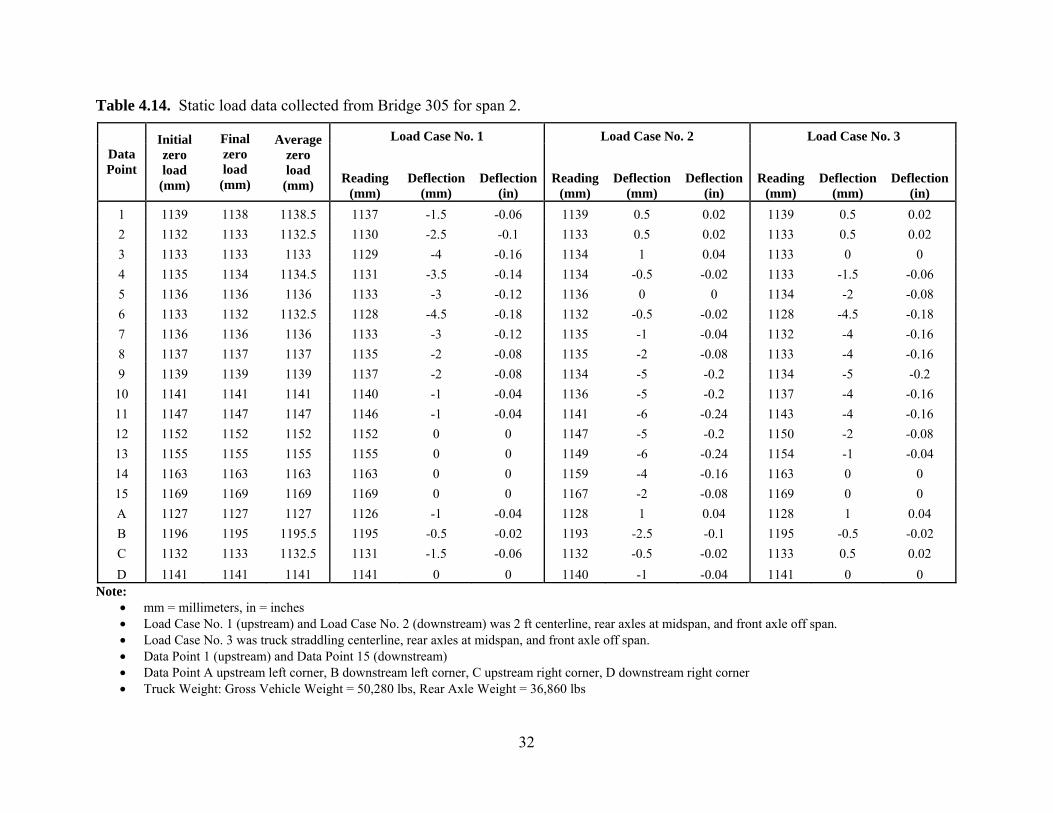
Table 4.14. Static load data collected from Bridge 305 for span 2.
Load Case No. 1 Load Case No. 2 Load Case No. 3 Data Point
Initial zero load
(mm)
Final zero load
(mm)
Average zero load
(mm) Reading (mm)
Deflection (mm)
Deflection (in)
Reading (mm)
Deflection (mm)
Deflection (in)
Reading (mm)
Deflection (mm)
Deflection (in)
1 1139 1138 1138.5 1137 -1.5 -0.06 1139 0.5 0.02 1139 0.5 0.02 2 1132 1133 1132.5 1130 -2.5 -0.1 1133 0.5 0.02 1133 0.5 0.02 3 1133 1133 1133 1129 -4 -0.16 1134 1 0.04 1133 0 0 4 1135 1134 1134.5 1131 -3.5 -0.14 1134 -0.5 -0.02 1133 -1.5 -0.06 5 1136 1136 1136 1133 -3 -0.12 1136 0 0 1134 -2 -0.08 6 1133 1132 1132.5 1128 -4.5 -0.18 1132 -0.5 -0.02 1128 -4.5 -0.18 7 1136 1136 1136 1133 -3 -0.12 1135 -1 -0.04 1132 -4 -0.16 8 1137 1137 1137 1135 -2 -0.08 1135 -2 -0.08 1133 -4 -0.16 9 1139 1139 1139 1137 -2 -0.08 1134 -5 -0.2 1134 -5 -0.2
10 1141 1141 1141 1140 -1 -0.04 1136 -5 -0.2 1137 -4 -0.16 11 1147 1147 1147 1146 -1 -0.04 1141 -6 -0.24 1143 -4 -0.16 12 1152 1152 1152 1152 0 0 1147 -5 -0.2 1150 -2 -0.08 13 1155 1155 1155 1155 0 0 1149 -6 -0.24 1154 -1 -0.04 14 1163 1163 1163 1163 0 0 1159 -4 -0.16 1163 0 0 15 1169 1169 1169 1169 0 0 1167 -2 -0.08 1169 0 0 A 1127 1127 1127 1126 -1 -0.04 1128 1 0.04 1128 1 0.04 B 1196 1195 1195.5 1195 -0.5 -0.02 1193 -2.5 -0.1 1195 -0.5 -0.02 C 1132 1133 1132.5 1131 -1.5 -0.06 1132 -0.5 -0.02 1133 0.5 0.02 D 1141 1141 1141 1141 0 0 1140 -1 -0.04 1141 0 0
Note: • mm = millimeters, in = inches • Load Case No. 1 (upstream) and Load Case No. 2 (downstream) was 2 ft centerline, rear axles at midspan, and front axle off span. • Load Case No. 3 was truck straddling centerline, rear axles at midspan, and front axle off span. • Data Point 1 (upstream) and Data Point 15 (downstream) • Data Point A upstream left corner, B downstream left corner, C upstream right corner, D downstream right corner • Truck Weight: Gross Vehicle Weight = 50,280 lbs, Rear Axle Weight = 36,860 lbs

33
Bridge 305 Results Results obtained from the inspection are shown for each component type of the bridge in the following sections.
Decking The decking appeared to be in good condition. Some fasteners showed damage from snowplowing. Decay was not evident. No stress wave timing or resistance drilling was conducted.
Railings, Rail Posts and Curbs Visual inspection noted these components in good condition. No stress wave timing or resistance drilling was conducted.
Pilings The pilings all showed high microsecond time data with pile numbers 1 and 2 being severely decayed; cross bracing of the pilings have deteriorated to the point where it has no function. Several of the pilings should be further investigated to determine replacement.
Pile Caps Pile cap A showed good microsecond timing data. Pile cap B showed very high timing data beginning at the 4-foot upstream end to the 24-foot mark on the downstream end. Pile cap C showed high timing data on the upstream end for 10 feet and for 6 feet on the downstream end.
Girders Many of the girder ends were not accessible for close inspection, but appeared to be in good condition. The ends above the center support should be inspected while the river is frozen.
Vibration Frequency There was a no load frequency of vibration of 31.8 Hertz (Hz) for span 1 and 34.6 Hz for span 2
Live Load Figures 4.17 and 4.18 show the deflections of spans 1 and 2 of Bridge 305 for center loading.

34
Figure 4.17. Deflection of span 1 of Bridge 305 for center loading.
Figure 4.18. Deflection of span 2 of Bridge 305 for center loading.

35
Bridge 357 Testing Summary Background Structure: Bridge 357
Location: County Road 652, North of Virginia, Minnesota
Special Consideration(s): None
Estimated age: 1940
Inspection date: July 2005
Construction details: Two span; heavy timber southern yellow pine pilings with Douglas fir girders/stringers and a wood deck for a running surface
Bridge Photos:
Figure 4.19. Bridge 357. Figure 4.20. Bridge 357. Figure 4.21. Bridge 357.

36
Vibration Test Data The vibration testing data for Bridge 357, spans 1 and 2 are shown listed in Tables 4.15 and 4.16.
Table 4.15. Vibration data collected from Bridge 357 for span 1.
Motor Vibration Test
Length Width C-C Span
Dead load Speed Frequency Time/cycle Frequency
(ft) (ft) (ft) (lb) (rpm) (Hz) (ms) (Hz) 27 24 12.17 0 1120 18.7 540 18.5
0 1125 18.8 540 18.5 Note:
• ft = feet, lb = pounds, rpm = revolutions per minute, Hz = hertz, ms = milliseconds
Table 4.16. Vibration data collected from Bridge 357 for span 2.
Motor Vibration Test
Length Width C-C Span
Dead load Speed Frequency Time/cycle Frequency
(ft) (ft) (ft) (lb) (rpm) (Hz) (ms) (Hz) 27 24 12.17 0 1069 17.8 568 17.6 0 1096 18.3 552 18.1 0 1042 17.36 584 17.1
Note: • ft = feet, lb = pounds, rpm = revolutions per minute, Hz = hertz, ms = milliseconds

37
Static Load Test Data The static load testing data for Bridge 357, spans 1 and 2 are shown in Tables 4.17 and 4.18.
Table 4.17. Static load data collected from Bridge 357 for span 1.
Center Loading
Data Point
Point
Initial
zero load
(mm)
Final
zero load
(mm)
Average
zero load
(mm)
Reading
(mm)
Deflection
(mm)
Deflection
(in.)
1 849 849 849.0 849 0.0 0.00
2 840 842 841.0 841 0.0 0.00
3 838 837 837.5 838 0.5 0.02
4 836 836 836.0 834 -2.0 -0.08
5 832 832 832.0 828 -4.0 -0.16
6 833 833 833.0 827 -6.0 -0.24
7 834 834 834.0 827 -7.0 -0.28
8 833 833 833.0 827 -6.0 -0.24
9 834 833 833.5 827 -6.5 -0.26
10 834 834 834.0 827 -7.0 -0.28
11 831 831 831.0 825 -6.0 -0.24
12 832 832 832.0 830 -2.0 -0.08
13 833 834 833.5 833 -0.5 -0.02
14 833 833 833.0 832 -1.0 -0.04
15 838 838 838.0 839 1.0 0.04
A 847 847 847.0 847 0.0 0.00
B 831 831 831.0 832 1.0 0.04
C 845 845 845.0 845 0.0 0.00
D 844 845 844.5 845 0.5 0.02
E 829 829 829.0 828 -1.0 -0.04
F 845 845 845.0 849 4.0 0.16

38
Table 4.18. Static load data collected from Bridge 357 for span 2.
Center Loading
Data Point
Point
Initial
zero load
(mm)
Final
zero load
(mm)
Average
zero load
(mm)
Reading
(mm)
Deflection
(mm)
Deflection
(in.)
1 831 831 831.0 832 1.0 0.04
2 838 838 838.0 838 0.0 0.00
3 837 836 836.5 835 -1.5 -0.06
4 838 838 838.0 835 -3.0 -0.12
5 834 834 834.0 830 -4.0 -0.16
6 831 831 831.0 824 -7.0 -0.28
7 836 836 836.0 830 -6.0 -0.24
8 837 837 837.0 830 -7.0 -0.28
9 835 834 834.5 827 -7.5 -0.30
10 832 832 832.0 825 -7.0 -0.28
11 829 829 829.0 824 -5.0 -0.20
12 831 831 831.0 828 -3.0 -0.12
13 835 835 835.0 834 -1.0 -0.04
14 837 837 837.0 838 1.0 0.04
15 830 830 830.0 830 0.0 0.00
A 832 832 832.0 833 1.0 0.04
B 829 829 829.0 829 0.0 0.00
C 846 845 845.5 846 0.5 0.02
D 841 841 841.0 841 0.0 0.00
E 840 837 838.5 839 0.5 0.02
F 837 840 838.5 836 -2.5 -0.10
Note: mm = millimeters in = inches Truck straddling centerline, rear axles at midspan, and front axle off span. Data Point 1 (upstream) and Data Point 15 (downstream) Truck Weight: Gross Vehicle Weight = 50,280 lbs, Rear Axle Weight = 36,860 lbs

39
Bridge 357 Results Results obtained from the inspection are shown for each component type of the bridge in the following sections.
Decking The decking appeared to be in good condition. Some fasteners showed damage from snowplowing. Decay was not evident. No stress wave timing or resistance drilling was conducted.
Railings, Rail Posts and Curbs Visual inspection noted these components in good condition. No stress wave timing or resistance drilling was conducted.
Pilings Piles number 6, 7, 8, and 10 showed the presence of decay as noted by stress wave timing data. Piling number 7 shows very high timing data and should be further investigated.
Pile Caps Pile cap A showed the presence of decay at a distance between 4 and 20 ft from the upstream end. Pile cap B (at bridge center support) showed decay and insect damage in the center section of the pile cap. Pile cap C timing data showed the timber in good condition.
Girders Deterioration was not noted in any of the girders ends and they were noted to be in good condition.
Vibration Frequency Span 1 had a no load frequency of vibration of 18.5 Hertz (Hz) for span 1 and 17.6 Hz for span 2.
Live Load Figures 4.22 and 4.23 show the deflections of spans 1 and 2 of Bridge 357 for center loading.

40
Figure 4.22. Deflection of span 1 of Bridge 357 for center loading.
Figure 4.23. Deflection of span 2 of Bridge 357 for center loading.
41
Bridge 619 Testing Summary
Background Structure: Bridge 619
Location: County Road 66, North of Kinney, Minnesota
Special Consideration(s): None
Estimated age: Unknown
Inspection date: June 2005
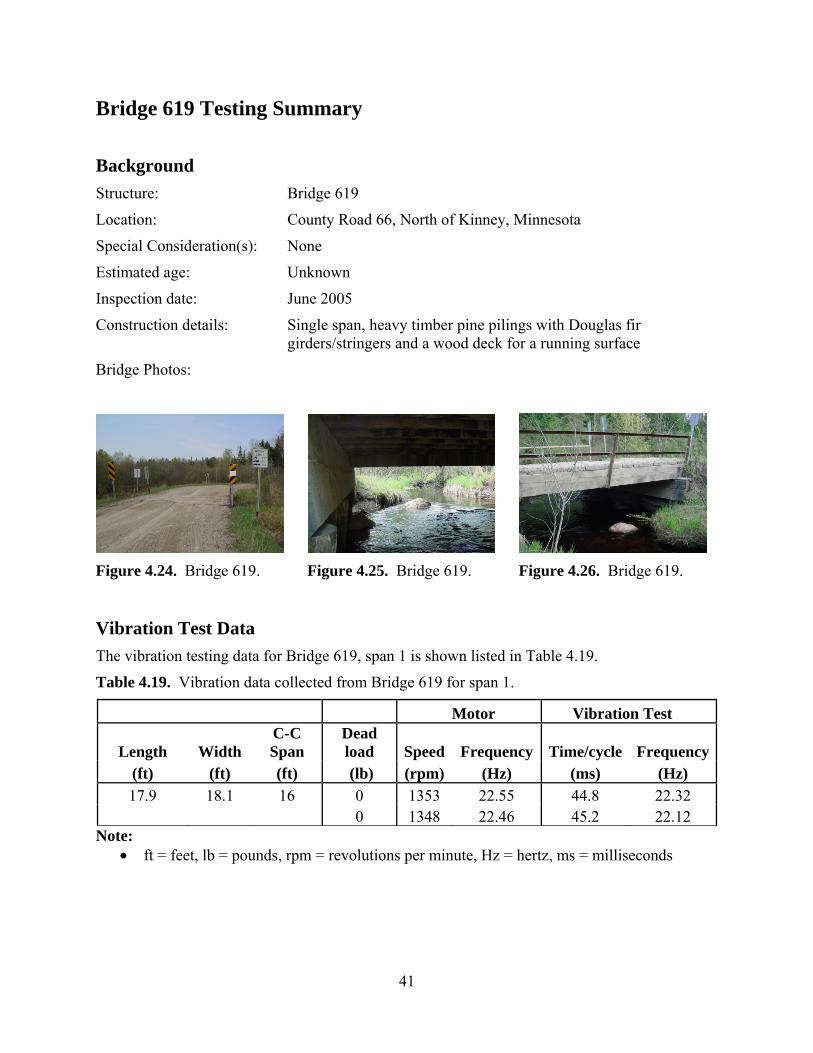
Construction details: Single span, heavy timber pine pilings with Douglas fir girders/stringers and a wood deck for a running surface
Bridge Photos:
Figure 4.24. Bridge 619. Figure 4.25. Bridge 619. Figure 4.26. Bridge 619.
Vibration Test Data The vibration testing data for Bridge 619, span 1 is shown listed in Table 4.19.
Table 4.19. Vibration data collected from Bridge 619 for span 1.
Motor Vibration Test
Length Width C-C Span
Dead load Speed Frequency Time/cycle Frequency
(ft) (ft) (ft) (lb) (rpm) (Hz) (ms) (Hz) 17.9 18.1 16 0 1353 22.55 44.8 22.32
0 1348 22.46 45.2 22.12 Note:
• ft = feet, lb = pounds, rpm = revolutions per minute, Hz = hertz, ms = milliseconds
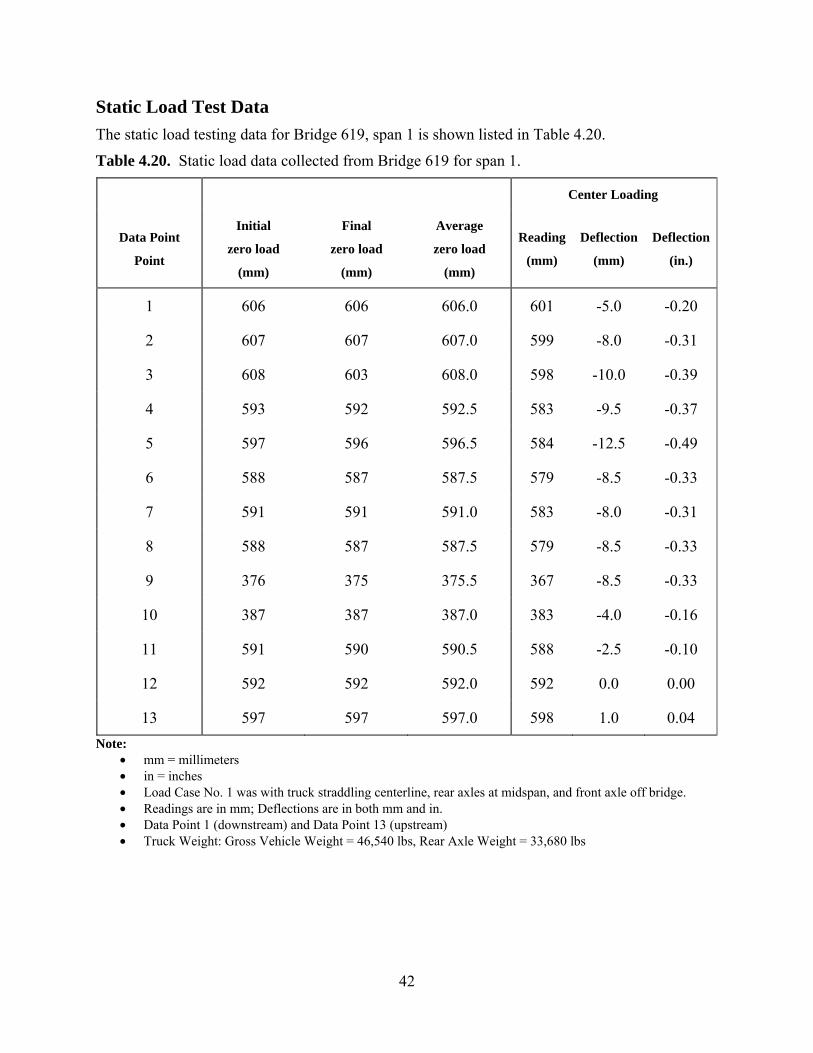
42
Static Load Test Data The static load testing data for Bridge 619, span 1 is shown listed in Table 4.20.
Table 4.20. Static load data collected from Bridge 619 for span 1.
Center Loading
Data Point
Point
Initial
zero load
(mm)
Final
zero load
(mm)
Average
zero load
(mm)
Reading
(mm)
Deflection
(mm)
Deflection
(in.)
1 606 606 606.0 601 -5.0 -0.20
2 607 607 607.0 599 -8.0 -0.31
3 608 603 608.0 598 -10.0 -0.39
4 593 592 592.5 583 -9.5 -0.37
5 597 596 596.5 584 -12.5 -0.49
6 588 587 587.5 579 -8.5 -0.33
7 591 591 591.0 583 -8.0 -0.31
8 588 587 587.5 579 -8.5 -0.33
9 376 375 375.5 367 -8.5 -0.33
10 387 387 387.0 383 -4.0 -0.16
11 591 590 590.5 588 -2.5 -0.10
12 592 592 592.0 592 0.0 0.00
13 597 597 597.0 598 1.0 0.04 Note:
• mm = millimeters • in = inches • Load Case No. 1 was with truck straddling centerline, rear axles at midspan, and front axle off bridge. • Readings are in mm; Deflections are in both mm and in. • Data Point 1 (downstream) and Data Point 13 (upstream) • Truck Weight: Gross Vehicle Weight = 46,540 lbs, Rear Axle Weight = 33,680 lbs

43
Bridge 619 Results Results obtained from the inspection are shown for each component type of the bridge in the following sections.
Decking The decking appeared to be in good condition. Some fasteners showed damaged from snowplowing. Decay was not evident. No stress wave timing or resistance drilling was conducted.
Railings, Rail Posts and Curbs The railings are constructed with 2 ½ inch steel angle.
Pilings Due to the high water at the time of testing, pilings # 1, 2, 3 and 4 were not tested with the microsecond timer but were visually inspected. There is decay and shell damage visible, and pilings 4 through 8 are considered partially decayed with microsecond time readings in the 500 to 600 μs range.
Pile Caps Pile caps A and B could not be measured with the microsecond timer due to the fact that only one side was accessible. They were visually inspected and appeared to be in good condition. Hammer sounding was satisfactory.
Girders Girders 4 and 5 are 24 inches in depth and are notched for proper top side alignment, and are in good condition. Girder # 1 (upstream) has a split along its entire length and decay is present on both ends. Girders 7, 8, and 12 showed high timing data on one end
Vibration Frequency Span 1 had a no load frequency of vibration of 22.2 Hertz (Hz.)
Live Load Figure 4.27 shows the deflection of span 1 of Bridge 619 for center loading.

44
Figure 4.27. Deflection of span 1 of Bridge 619 for center loading.

45
Bridge 726 Testing Summary
Background Structure: Bridge 726
Location: County Road 469, NW of Chisholm, MN.
Special Consideration(s): Bridge was repaired after our testing was completed
Estimated age: 1944
Inspection date: July 2005
Construction details: Two span; heavy timber southern yellow pine pilings with Douglas fir girders/stringers and a wood deck for a running surface
Bridge Photos:
Figure 4.28. Bridge 726. Figure 4.29. Bridge 726. Figure 4.30. Bridge 726.

46
Vibration Test Data The vibration testing data for Bridge 726, spans 1 and 2 are shown listed in Tables 4.21 and 4.22.
Table 4.21. Vibration data collected from Bridge 726 for span 1.
Motor Vibration Test
Length Width C-C Span
Dead load Speed Frequency Time/cycle Frequency
(ft) (ft) (ft) (lb) (rpm) (Hz) (ms) (Hz) 19.36 24.35 18.36 0 1884 31.4 32.4 30.9
0 1804 30.1 33.8 29.6 0 1898 31.6 33 30.3 1000 1786 29.8 34 29.4 1000 1844 30.7 33 30.3 1000 1818 30.3 33.8 29.6
Note: • ft = feet, lb = pounds, rpm = revolutions per minute, Hz = hertz, ms = milliseconds
Table 4.22. Vibration data collected from Bridge 726 for span 2.
Motor Vibration Test
Length Width C-C Span
Dead load Speed Frequency Time/cycle Frequency
(ft) (ft) (ft) (lb) (rpm) (Hz) (ms) (Hz) 18.52 24.3 17.52 0 1935 32.3 31.6 31.6
0 1935 32.3 31.2 32.1 0 31 32.3
Note: • ft = feet, lb = pounds, rpm = revolutions per minute, Hz = hertz, ms = milliseconds

47
Static Load Test Data The static load testing data for Bridge 726, spans 1 and 2 are shown listed in Tables 4.23 and 4.24.
Table 4.23. Static load data collected from Bridge 726 for span 1.
Load Case No. 1 Load Case No. 2 Load Case No. 3 Data Point
Initial zero load
(mm)
Final zero load
(mm)
Average zero load
(mm) Reading (mm)
Deflection (mm)
Deflection (in)
Reading (mm)
Deflection (mm)
Deflection (in)
Reading (mm)
Deflection (mm)
Deflection (in)
1 605 605 605 602 -3 -0.12 606 1 0.04 606 1 0.04 2 606 606 606 600 -6 -0.24 606 0 0 605 -1 -0.04 3 609 608 608.5 600 -8.5 -0.33 608 -0.5 -0.02 605 -3.5 -0.14 4 605 605 605 596 -9 -0.35 604 -1 -0.04 599 -6 -0.24 5 603 603 603 593 -10 -0.39 601 -2 -0.08 594 -9 -0.35 6 610 609 609.5 600 -9.5 -0.37 606 -3.5 -0.14 600 -9.5 -0.37 7 599 598 598.5 592 -6.5 -0.26 593 -5.5 -0.22 590 -8.5 -0.33 8 607 606 606.5 602 -4.5 -0.18 598 -8.5 -0.33 597 -9.5 -0.37 9 615 615 615 613 -2 -0.08 607 -8 -0.31 607 -8 -0.31
10 614 613 613.5 613 -0.5 -0.02 605 -8.5 -0.33 607 -6.5 -0.26 11 620 619 619.5 620 0.5 0.02 611 -8.5 -0.33 616 -3.5 -0.14 12 625 625 625 625 0 0 617 -8 -0.31 622 -3 -0.12 13 624 624 624 624 0 0 619 -5 -0.2 623 -1 -0.04 14 638 637 637.5 638 0.5 0.02 635 -2.5 -0.1 638 0.5 0.02
Note: mm = millimeters in = inches Load Case No. 1 (upstream) and Load Case No. 2 (downstream) was 2 ft centerline, rear axles at midspan, and front axle off span. Load Case No. 3 was truck straddling centerline, rear axles at midspan, and front axle off span. Data Point 1 (upstream) and Data Point 14 (downstream) Truck Weight: Gross Vehicle Weight = 44,860 lbs, Rear Axle Weight = 31,720 lbs

48
Table 4.24. Static load data collected from Bridge 726 for span 2.
Load Case No. 1 Load Case No. 2 Load Case No. 3 Data Point
Initial zero load
(mm)
Final zero load
(mm)
Average zero load
(mm) Reading (mm)
Deflection (mm)
Deflection (in)
Reading (mm)
Deflection (mm)
Deflection (in)
Reading (mm)
Deflection (mm)
Deflection (in)
1 704 703 703.5 700 -3.5 -0.14 704 0.5 0.02 704 0.5 0.02 2 712 712 712 706 -6 -0.24 712 0 0 711 -1 -0.04 3 710 710 710 703 -7 -0.28 710 0 0 709 -1 -0.04 4 709 709 709 702 -7 -0.28 709 0 0 705 -4 -0.16 5 708 708 708 702 -6 -0.24 708 0 0 703 -5 -0.2 6 704 703 703.5 698 -5.5 -0.22 702 -1.5 -0.06 697 -6.5 -0.26 7 711 710 710.5 705 -5.5 -0.22 707 -3.5 -0.14 704 -6.5 -0.26 8 712 712 712 709 -3 -0.12 707 -5 -0.2 706 -6 -0.24 9 716 715 715.5 714 -1.5 -0.06 709 -6.5 -0.26 709 -6.5 -0.26
10 715 715 715 714 -1 -0.04 709 -6 -0.24 710 -5 -0.2 11 725 724 724.5 724 -0.5 -0.02 718 -6.5 -0.26 721 -3.5 -0.14 12 717 717 717 717 0 0 710 -7 -0.28 715 -2 -0.08 13 721 720 720.5 721 0.5 0.02 715 -5.5 -0.22 720 -0.5 -0.02 14 709 709 709 709 0 0 706 -3 -0.12 710 1 0.04
Note: • mm = millimeters • in = inches • Load Case No. 1 (upstream) and Load Case No. 2 (downstream) was 2 ft centerline, rear axles at midspan, and front axle off span. • Load Case No. 3 was truck straddling centerline, rear axles at midspan, and front axle off span. • Data Point 1 (upstream) and Data Point 14 (downstream) • Truck Weight: Gross Vehicle Weight = 44,860 lbs, Rear Axle Weight = 31,720 lbs

49
Bridge 726 Results Results obtained from the inspection are shown for each component type of the bridge in the following sections.
Decking The decking appeared to be in good condition. No major fastener damage was noted. Decay was not evident. No stress wave timing or resistance drilling was conducted.
Railings, Rail Posts and Curbs Visual inspection noted these components in good condition. No stress wave timing or resistance drilling was conducted.
Pilings Piles number 5 and 6 showed presence of substantial decay as noted by stress wave timing data. Piling number 6 is visually broken. Piles number 7, 8, 10, and 11 appear to have significant decay present at the top of the pile in contact with the pile cap. They should be further investigated on site if the pile cap is removed or repaired.
Pile Caps Pile cap A shows the presence of decay at a distance between 8 and 18 ft from the upstream end. Pile cap B (at bridge center pile support) showed significant decay along the entire length. Resistance drilling data shows that there was severe internal decay present in the pile cap. At the upstream end, there is an internal void present of 4 inches, increasing to 11 inches at 17 ft. At the downstream end, the pile cap is in good condition.
Girders Deterioration was not noted in any of the girders ends. We did not have access to the girders above the center piles and pile cap.
Vibration Frequency There was a frequency of vibration of 21.9 Hertz (Hz) for span 1 and 21.5 Hz for span 2.
Live Load
Figures 4.31 and 4.32 show the deflections of spans 1 and 2 of Bridge 726 for center loading.

50
Figure 4.31. Deflection of span 1 of Bridge 726 for center loading.
Figure 4.32. Deflection of span 2 of Bridge 726 for center loading.

51
Bridge CR-1 Testing Summary Background Structure: Cloquet River Bridge (structure # L1950)
Location: USFS Road # 102 13.8 Miles SW of Jct. TH 1
Special Consideration(s): None
Estimated age: 1960
Inspection date: September 2005
Construction details: Single span, heavy pine timber pilings with Douglas fir girders/stringers and a wood deck for a running surface
Bridge Photos:
Figure 4.33. Bridge CR-1. Figure 4.34. Bridge CR-1.

52
Vibration Test Data The vibration testing data for Bridge CR-1, span 1 is shown listed in Table 4.25.
Table 4.25. Vibration data collected from Bridge CR-1 for span 1.
Motor Vibration Test
Length Width C-C Span
Dead load Speed Frequency Time/cycle Frequency
(ft) (ft) (ft) (lb) (rpm) (Hz) (ms) (Hz)
20 15 17.17 0 1289 21.48 472 21.18
17.33 0 1273 21.21 476 21
0 1309 21.81 464 21.55 Note:
• ft = feet, lb = pounds, rpm = revolutions per minute, Hz = hertz, ms = milliseconds

53
Static Load Test Data The static load testing data for Bridge CR-1, span 1 is shown listed in Table 4.26.
Table 4.26. Static load data collected from Bridge CR-1 for span 1.
Center Loading
Data Point
Point
Initial
zero load
(mm)
Final
zero load
(mm)
Average
zero load
(mm)
Reading
(mm)
Deflection
(mm)
Deflection
(in.)
1 503 503 503.0 500 -3.0 -0.12
2 500 500 500.0 495 -5.0 -0.20
3 507 506 506.5 499 -7.5 -0.30
4 495 495 495.0 485 -10.0 -0.39
5 499 499 499.0 491 -8.0 -0.31
6 503 503 503.0 496 -7.0 -0.28
7 505 504 504.5 497 -7.5 -0.30
8 507 507 507.0 500 -7.0 -0.28
9 511 511 511.0 506 -5.0 -0.20
10 514 514 514.0 512 -2.0 -0.08
A 440 440 440.0 438 -2.0 -0.08
B 442 442 442.0 441 -1.0 -0.04
C 567 567 567.0 566 -1.0 -0.04
D 585 585 585.0 584 -1.0 -0.04 Note:
mm = millimeters in = inches Load Case No. 1 was truck straddling centerline, rear axles at midspan, and front axle off span. Data Point 1 (upstream) and Data Point 10 (downstream) Truck Weight: Gross Vehicle Weight = 45,900 lbs, Rear Axle Weight = 29,500 lbs
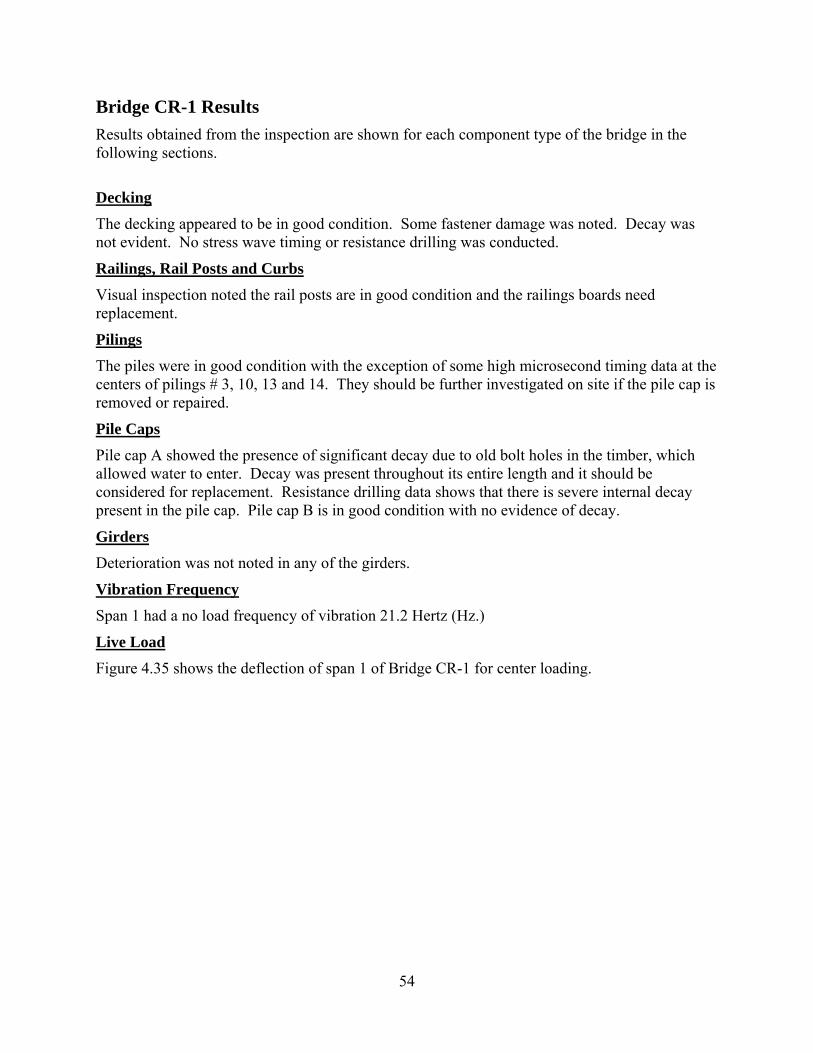
54
Bridge CR-1 Results Results obtained from the inspection are shown for each component type of the bridge in the following sections.
Decking The decking appeared to be in good condition. Some fastener damage was noted. Decay was not evident. No stress wave timing or resistance drilling was conducted.
Railings, Rail Posts and Curbs Visual inspection noted the rail posts are in good condition and the railings boards need replacement.
Pilings The piles were in good condition with the exception of some high microsecond timing data at the centers of pilings # 3, 10, 13 and 14. They should be further investigated on site if the pile cap is removed or repaired.
Pile Caps Pile cap A showed the presence of significant decay due to old bolt holes in the timber, which allowed water to enter. Decay was present throughout its entire length and it should be considered for replacement. Resistance drilling data shows that there is severe internal decay present in the pile cap. Pile cap B is in good condition with no evidence of decay.
Girders Deterioration was not noted in any of the girders.
Vibration Frequency Span 1 had a no load frequency of vibration 21.2 Hertz (Hz.)
Live Load Figure 4.35 shows the deflection of span 1 of Bridge CR-1 for center loading.

55
Figure 4.35. Deflection of span 1 of Bridge CR-1 for center loading.

56
Bridge CR-2 Testing Summary Background Structure: Cloquet River Bridge
Location: 14.2 Miles SW. of JCT. 1 ( Cloquet River Road)
Forest Service Road # 102
Special Consideration(s): None
Estimated age: 1960
Inspection date: September 2005
Construction details: Single span, heavy pine timber pilings with Douglas fir girders and a wood deck for a running surface
Bridge Photos:
Figure 4.36. Bridge CR-2. Figure 4.37. Bridge CR-2.

57
Vibration Test Data
The vibration testing data for Bridge CR-2, span 1 is shown listed in Table 4.27.
Table 4.27. Vibration data collected from Bridge CR-2 for span 1.
Motor Vibration Test
Length Width C-C Span
Dead load Speed Frequency Time/cycle Frequency
(ft) (ft) (ft) (lb) (rpm) (Hz) (ms) (Hz)
20.42 15 16.3 0 1163 19.38 524 19.08
17.0 0 1145 19.08 532 18.79
0 1148 19.13 528 18.93 Note:
• ft = feet, lb = pounds, rpm = revolutions per minute, Hz = hertz, ms = milliseconds

58
Static Load Test Data The static load testing data for Bridge CR-2, span 1 is shown listed in Table 4.28.
Table 4.28. Static load data collected from Bridge CR-2 for span 1.
Center Loading
Data Point
Point
Initial
zero load
(mm)
Final
zero load
(mm)
Average
zero load
(mm)
Reading
(mm)
Deflection
(mm)
Deflection
(in.)
1 830 830 830.0 828 -2.0 -0.08
2 829 825 827.0 821 -6.0 -0.24
3 800 800 800.0 792 -8.0 -0.31
4 825 824 824.5 815 -9.5 -0.37
5 824 823 823.5 815 -8.5 -0.33
6 818 816 817.0 809 -8.0 -0.31
7 818 821 819.5 811 -8.5 -0.33
8 820 820 820.0 813 -7.0 -0.28
9 818 815 816.5 810 -6.5 -0.26
10 821 821 821.0 821 0.0 0.00
A 830 829 829.5 828 -1.5 -0.06
B 822 825 823.5 822 -1.5 -0.06
C 839 835 837.0 833 -4.0 -0.16
D 820 820 820.0 821 1.0 0.04 Note:
• mm = millimeters • in = inches • Load Case No. 1 was truck straddling centerline, rear axles at midspan, and front axle off span. • Data Point 1 (upstream) and Data Point 10 (downstream) • Truck Weight: Gross Vehicle Weight = 45,900 lbs, Rear Axle Weight = 29,500 lbs

59
Bridge CR-2 Results Results obtained from the inspection are shown for each component type of the bridge in the following sections.
Decking The decking appeared to be in good condition. Some fasteners need to be replaced. Decay was not evident. No stress wave timing or resistance drilling was conducted.
Railings, Rail Posts and Curbs Visual inspection noted these components need repair, as the 2 ½” x 7” railing is damaged and should be replaced on both sides of the bridge.
Pilings The pilings are in good condition with the exception of the top section of pile # 1, which had a high microsecond time reading, and the center sections of piles # 4 and 14.
Pile Caps Pile cap A showed the presence of substantial decay near the center of its length due to a split along its length. Resistance drilling could not be done at the time due to the high water level. Pile cap B microsecond timing data showed the timber to be in good condition.
Girders Deterioration was not noted in any of the girders.
Vibration Frequency Span 1 had a no load frequency of vibration of 18.9 Hertz (Hz.)
Live Load Figure 4.38 shows the deflection of span 1 of Bridge CR-2 for center loading.

60
Figure 4.38. Deflection of span 1 of Bridge CR-2 for center loading.
61
Chapter 5 Testing Results
The visual, stress wave timing and resistance drill inspections identified a number of problems with several bridges in St. Louis County. This information was communicated to the County bridge engineer and their bridge crew conducted repairs to bridges 242 and 726. Problems were also noted on other bridges and they are being monitored by the County. Table 5.1 shows the results of the vibration and load testing for each bridge and the measured and predicted EI product. If a bridge had two spans, each span is reported independently. Static midspan deflections ranged from approximately 0.10 in. to 0.25 in. and were all less than the recommended L/360 span –to-deflection criteria. First mode frequencies ranged from 17 to 35 Hz and generally decreased with increasing span length. To correlate the first bending mode frequency of bridges to load testing results, following assumptions were made as an initial attempt to compute the EI product of the bridges: (1) the superstructure of timber bridges is similar to a beam-like structure with symmetrically placed loads; (2) the bridges are close to being simply supported (for the purpose of static deflection analysis only); (3) the average deflection of each bridge is equivalent to the value that characterized the deflections of all stringers if the load had been applied evenly across the width of the bridge. For a beam-like structure with these assumptions, the static beam deflection theory provides following relationship:
)43(24
22 aLPaEI −=δ
(4)
where P is static load of individual axle, δ average midspan deflection, L the span length of the bridge, and a the distance from bridge support to nearest loading point. Based on static load testing results, the measured structure stiffness (EI product) of the field bridges ranged from 11,899 × 106 lb-in. (Bridge 357 span 1) to 154,189 × 106 lb-in. (Bridge 305 span 2). A regression analysis was conducted on the measured stiffness versus the measured frequency of vibration. A correlation coefficient square (R2) of 0.84 resulted. Figure 5.1 shows the relationship between frequency and static load stiffness. Bridge 242 spans 1 and 2 showed the greatest variability from the regression line. It is projected that this is due to the high level of decay found in the substructure pilings and pile cap on 242. It is believed that this decay affected the vibration characteristics of the superstructure. The inspection results for bridge 619 also showed some decay in the bridge pilings that may affect the vibration stiffness relationship. The estimates of first bending mode frequency from forced vibration testing may contain significant errors in some cases. The error is a direct result of the bending mode not being the lowest in natural frequency, so that other modes (typically torsion) were misidentified as the bending mode. The second error source in EI prediction is most likely the inaccurate estimate of bridge weight. Bridge weight information is essential in calculating EI product based on beam theory model. In this study, bridge weights were estimated based upon actual dimensions along

62
bridge weight, which make estimation difficult (such as species and moisture difference, wood deterioration, dirt or debris collected on the deck). Third, in spite of structure similarities, the boundary condition of each field bridge is unique due to the construction variability, load history, and road and soil conditions. The overall system parameter k used for EI prediction here is the average value of the system parameter ki of each bridge, which describes the entire population. Table 5.1. Summary of static and dynamic bridge stiffness values.
Static loading Dynamic vibration
Bridge
No. Midspan
deflection
(in.)
Measured stiffness, EI
(x 106 lb-in.4)
1st mode frequency
(Hz)
Predicted stiffness, EI*
(x 106 lb-in.4)
85-span 1 0.18 56,051 25.4 77,348
85-span 2 0.12 89,107 27.7 97,236
153 0.12 50,768 27.5 62,454
242-span 1 0.12 48,851 22.0 34,222
242-span 2 0.11 56,488 21.7 35,186
305-span 1 0.12 107,745 31.9 164,941
305-span 2 0.09 154,189 34.6 207,704
357-span 1 0.12 15,141 18.5 7,047
357-span 2 0.12 11,899 17.6 5,176
619 0.25 17,906 22.2 14,049
CR1 0.24 24,899 21.2 27,644
CR2 0.24 22,397 18.9 20,265
* based upon beam theory
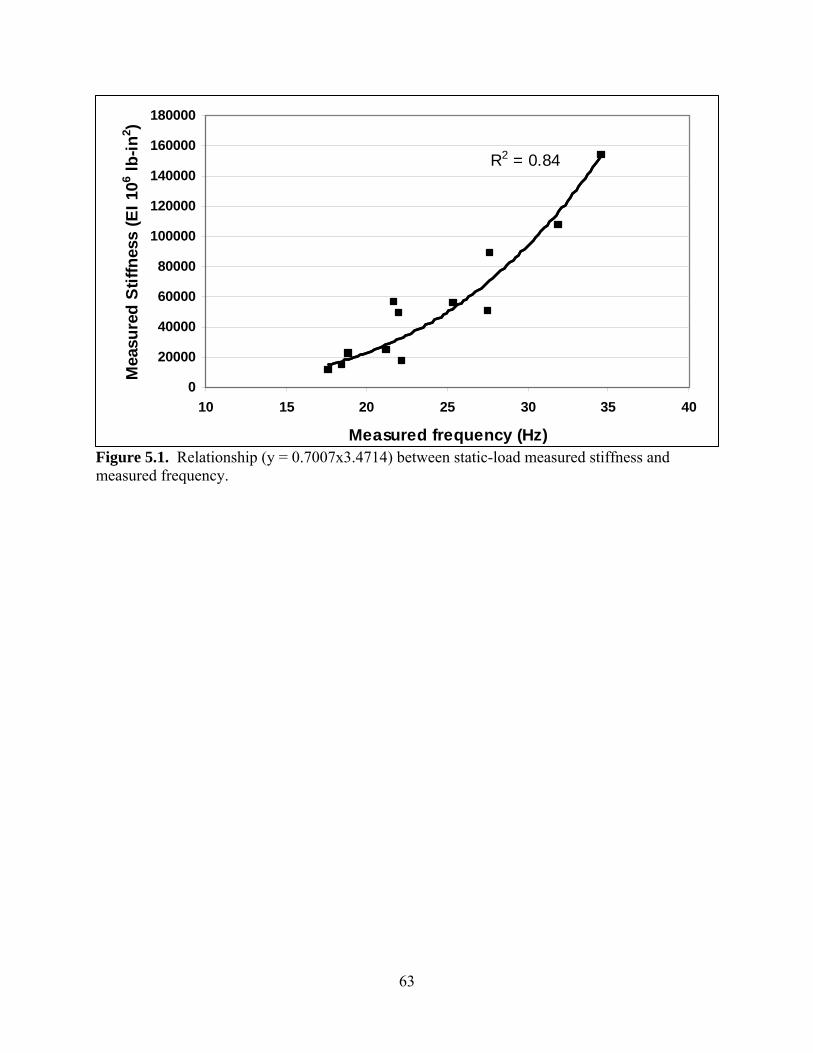
63
Figure 5.1. Relationship (y = 0.7007x3.4714) between static-load measured stiffness and measured frequency.
R2 = 0.84
0
20000
40000
60000
80000
100000
120000
140000
160000
180000
10 15 20 25 30 35 40
Measured frequency (Hz)
Mea
sure
d S
tiffn
ess
(EI 1
06 lb-in
2 )

64
Chapter 6 Conclusions
The results indicate that forced-vibration methods have potential for quickly assessing timber bridge superstructure stiffness. However, further improvements need to be made in identifying 1st bending mode and estimation of bridge weight. The beam theory model matched the physics of the single-span, timber beam superstructures better than plate theory. This global vibration technique has potential benefits for routine inspections and long-term health monitoring of timber bridge superstructures.
Specific conclusions for this project include:
• The use of commercially available inspection equipment allowed the research team to identify critical areas of structural deterioration, resulting in completed repairs by St. Louis County. This deterioration typically took place in the bridge substructure, including pilings and pile caps. The use of stress wave timing and resistance microdrilling equipment allowed the inspection team to identify and quantify the decay in St. Louis County bridges 242 and 726. This information was communicated to the County and appropriate repairs were completed, extending the service life of the bridges.
• The use of vibration testing allowed inspectors to conduct rapid inspections on bridge sections to identify a peak frequency of vibration. When compared to the bridge stiffness as measured by load testing, a useful relationship occurred. The frequency of vibration increases with bridge stiffness.
• The vibration approach and equipment developed for this project show potential for assessing rural steel and concrete bridges, however new techniques and appropriate equipment need to be developed to adequately measure the vibration. The frequency range for the concrete bridges evaluated exceeded the available vibration capacity of the forcing motor used in this testing.
Additional studies should utilize field instrumentation that can clearly identify 1st bending mode frequencies with real time data processing tools and include automated control and data acquisition. Testing should also be conducted on dowel laminated bridge structures, which represent over 1,200 bridges in Minnesota.

65
References
ASTM (2000). Use and calibration of hand-held moisture meters. ASTM D 444492. Philadelphia, PA: American Society for Testing and Materials.
Blevins, R.D. (1993). Formulas for natural frequency and mode shape. Krieger Publishing Company, Malabar, FL.
Brashaw, Brian K.; Vatalaro, Robert J.; Wacker, James P.; Ross, Robert J. 2005. Condition Assessment of Timber Bridges: 1. Evaluation of a Micro-Drilling Resistance Tool. Gen. Tech. Rep. FPL-GTR-159. Madison, WI: U.S. Department of Agriculture, Forest Service, Forest Products Laboratory. 8 p.
Brashaw, Brian K.; Vatalaro, Robert; Wang, X.; Wacker, James P. 2006. Static load and vibration performance of six timber bridges constructed using local species in northern Michigan. Final Report submitted to National Wood In Transportation Information Center, Morgantown, WV.
Crews, K; Samali, B; Bakoss, SL; Champion, C. 2004. “Testing and Assessment Procedures to Facilitate the Management of Timber Bridge Assets.” 3rd CECAR - Civil Engineering Conference in the Asian Region; August 16 - 19, 2004; Seoul, Korea.
FHWA. 2002. Memorandum: HBRRP funds for preventative maintenance. Washington, DC: Federal Highway Administration.
Morison, A.M. (2003). "Nondestructive evaluation of short span timber bridges with impact generated FRFs.” M.S. Thesis. Michigan Technological University. Houghton, MI.
Morison, A.M.; Van Karsen, C.D.; Evensen, H.A.; Ligon, J.B.; Erickson, J.R.; Ross, R.J.; Forsman, J.W. 2002. “Timber bridge evaluation: a global nondestructive approach using impact generated FRFs.” In: Proceedings, 20th International Modal Analysis Conference, pages 1567-1573.
Peterson, S.T.; McLean, D. I.; Pollock, D. G. 2003. Application of dynamic system identification to timber bridges. ASCE Journal of Structural Engineering, 129(1), 116–124.
Pfaff, P.; and Garrahan, P. (1984). Moisture content correction tables for the resistance-type moisture meter. Eastern Species. SP511E. Ottawa, Ontario, Canada: FORINTEK Corporation. 37 p.
Ross, R.J.; Wang, X.; Hunt, M.O.; and Soltis, L.A. (2002). “Transverse vibration technique to identify deteriorated wood floor systems.” Experimental Techniques, 26(4):28-30.
Soltis, Lawrence A.; Wang, X.; Ross, R.J.; and Hunt, H.O. (2002). “Vibration testing of timber floor systems.” Forest Prod. J., 52(10):75-81.
Wang, Xiping; Wacker, James P.; Morison, Angus M.; Forsman, John W.; Erickson, John R.; Ross, Robert J. 2005. Nondestructive assessment of single-span timber bridges using a vibration-based method. Res. Pap. FPL-RP-627. Madison, WI: U.S. Department of Agriculture, Forest Service, Forest Products Laboratory. 15 p.

66
Xiping Wang; James P. Wacker; Robert J. Ross; and Brian K. Brashaw. 2005. “Nondestructive Assessment of Timber Bridges Using a Vibration-Based Method American Society of Civil Engineers,” Proceeding of the 2005 Structures Congress, New York, NY 2005.

Brashaw, Brian K.; Vatalaro, Robert; Wang, Xiping; Sarvela, Kevin. 2008. Development of flexural vibration inspection tec1miques to rapidly assess the structural health of rural bridge systems. Publisher: Intelligent Transportation Systems Institute, Center for Transportation Studies, University of Minnesota, Minneapolis, MN. Final report. CTS 08-22. 66 p.