Development of Digital Microfluidics Platform for 2D and … · · 2017-07-10Development of...
61
Development of Digital Microfluidics Platform for 2D and 3D Chemosensitivity Assays by Haozhong Situ A thesis submitted in conformity with the requirements for the degree of Master of Applied Science Institute of Biomaterials and Biomedical Engineering University of Toronto © Copyright by Haozhong Situ 2017
-
Upload
dangkhuong -
Category
Documents
-
view
219 -
download
0
Transcript of Development of Digital Microfluidics Platform for 2D and … · · 2017-07-10Development of...

Development of Digital Microfluidics Platform for 2D
and 3D Chemosensitivity Assays
by
Haozhong Situ
A thesis submitted in conformity with the requirements
for the degree of Master of Applied Science
Institute of Biomaterials and Biomedical Engineering
University of Toronto
© Copyright by Haozhong Situ 2017

ii
Development of Digital Microfluidics Platform for 2D
and 3D Chemosensitivity Assays
Haozhong Situ
Master of Applied Science
Institute of Biomaterials and Biomedical Engineering
University of Toronto
2017
ABSTRACT
In this project, the potential of digital microfluidics (DMF) platform in
chemosensitivity was explored and evaluated. A new DMF device architecture (laser-cut
PET-ITO top plate) was developed. The fabrication and operation of these devices were
optimized for device performance and lifetime, which may be useful for multiple future
applications. After developing the platform, the responses of one breast cancer cell line,
MDA-MB-231, to two chemotherapeutic drugs, 5-fluorouracil and paclitaxel, were
measured for both 2D culture and 3D culture, respectively, and we demonstrated the
feasibility of the platform to generate credible chemosensitivity curves. Furthermore, the
data shows preliminary evidence that the ratio of cell media volume to cell number should
be considered in future experiments. In sum, this work represents the initial step towards
the establishment of a new chemosensitivity platform.

iii
Acknowledgements
First and foremost, I would like to express my sincerest gratitude towards my supervisor,
Dr. Aaron Wheeler, whose support and guidance throughout my project has been
invaluable.
I would also like to thank the entire Wheeler Microfluidics Lab for their support and
suggestions throughout the duration of my project. I would especially like to thank a
previous lab member, Dr. Alphonsus Ng, for all the training and help with digital
microfluidics and also for all the creative discussions, both inside and outside the lab. I
would also like to thank Dr. Dean Chamberlain for the biological training and the insightful
suggestions throughout my project.
In addition, I sincerely thank Dr. Henry Lee, Dr. Yimin Zhou (ECTI clean room) for all
their help and support in microfabrication.
Finally, I would like to thank my parents and my wife for their support and guidance in all
my endeavors.

iv
Table of Contents
ABSTRACT ................................................................................................................................................ ii
Acknowledgements ................................................................................................................................ iii
Table of Contents ................................................................................................................................... iv
List of Figures ......................................................................................................................................... vi
List of Tables .......................................................................................................................................... vii
Chapter 1. Introduction ........................................................................................................................... 1
1.1 Background information ........................................................................................................... 1
1.1.1 Chemosensitivity testing ................................................................................................ 1
1.1.2 Digital microfluidics ........................................................................................................ 3
1.2 Literature review ....................................................................................................................... 5
1.2.1 Chemosensitivity testing – standard techniques ........................................................... 5
1.2.2 Chemosensitivity testing in microfluidic systems .......................................................... 6
1.2.3 Suitability of DMF for cell culture and cell assays .......................................................... 7
Chapter 2. Comparison between 2D and 3D Chemosensitivity Assays on DMF ..................................... 9
2.1 Introduction .............................................................................................................................. 9
2.2 Materials and Methods ........................................................................................................... 10
2.2.1 Materials ...................................................................................................................... 10
2.2.2 Cell culture ................................................................................................................... 11
2.2.3 DMF device fabrication and operation ........................................................................ 11
2.2.4 Development of laser cut top plates ............................................................................ 15
2.2.5 On-chip drug response assays ...................................................................................... 20
2.2.6 Image acquisition and analysis ..................................................................................... 22
2.2.7 Well plate–based drug response assays ...................................................................... 23
2.2.8 Investigation on the use of Pluronic F68 to reduce biofouling .................................... 25
2.2.9 Statistical analysis ........................................................................................................ 27
2.3 Results and discussion ............................................................................................................. 27
2.3.1 Development of PET-ITO-based top plate.................................................................... 27
2.3.2 Trial to use Pluronic F68 to reduce biofouling ............................................................. 32
2.3.3 Drug response assays for 5-fluorouracil (5FU) ............................................................. 37
2.3.4 Drug response assays for paclitaxel ............................................................................. 41
2.3.5 Comparison between IC50 values ................................................................................. 43

v
2.4 Conclusion ............................................................................................................................... 47
Chapter 4. Future Directions ................................................................................................................. 48
4.1 Automated high-throughput chemosensitivity measurement ............................................... 48
4.2 Establishment of 3D tumor co-culture models ....................................................................... 49
4.3 Application to human samples for personalized medicine ..................................................... 50
References ..................................................................................................................................... 52

vi
List of Figures
Fig. 1. Digital Microfluidics (DMF).
Fig. 2. Schematic of the workflow of DMF bottom plate fabrication.
Fig. 3. Schematic of the general workflow of PET-ITO top plate fabrication.
Fig. 4. Pictures of PET-ITO substrates with laser-cut through-holes. Qualitative scores
illustrating the degree of burning are indicated in red.
Fig. 5. Pictures of PET-ITO substrates after heating at different combinations of temperature and
duration.
Fig. 6. Schematic of the experimental flow of DMF-based 2D and 3D experiments.
Fig. 7. Example of cell identification in a 2D image using the custom CellProfiler protocol.
Fig. 8. Laser-cut PET-ITO top plate.
Fig. 9. The change of velocity vs. time curves over time for the 0.09% F68 group.
Fig. 10. Effects of varied F68 concentrations on droplet performance on DMF devices.
Fig. 11. Effect of different F68 concentrations on MDA-MB-231 cell proliferation measured by
Alamar Blue Viability/Proliferation Assay.
Fig. 12. Representative confocal images of MDA-MB-231 cells seeded into virtual microwells
on laser-cut top plates and exposed to droplets of different concentrations of 5-fluorouracil by
DMF.
Fig. 13. Representative confocal images of DMF-driven 3D cell culture chemosensitivity assay.
Fig. 14. 5-Fluorouracil response curves of MDA-MB-231 cells incubated in (A) 2D DMF culture
(calcein assay), (B) 3D DMF culture (calcein assay), and (C) 2D culture in well plates (Alamar
Blue assay), with IC50 values indicated in pink.
Fig. 15. Paclitaxel response curves of MDA-MB-231 cells incubated in (A) 2D DMF culture
(calcein assay), (B) 3D DMF culture (calcein assay), (C) 2D culture in well plates (Alamar Blue
assay), and (D) 2D culture in well plates (calcein assay), with IC50 values (where applicable)
indicated in pink.
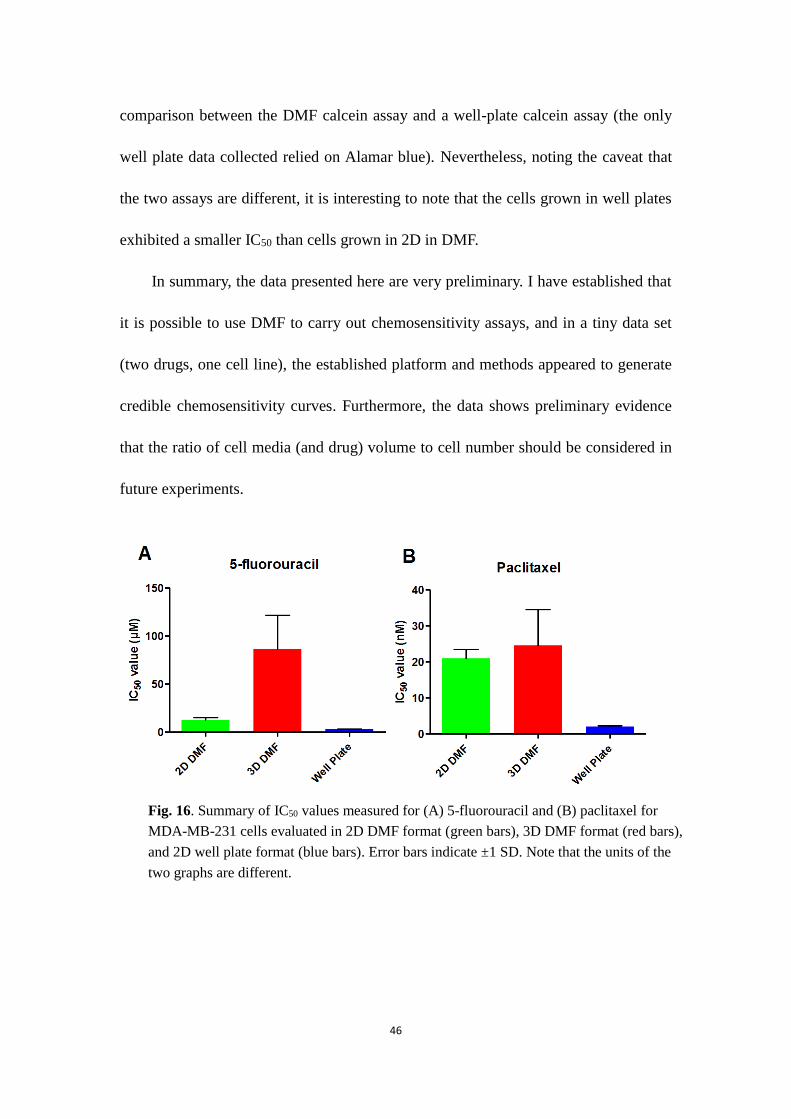
Fig. 16. Summary of IC50 values measured for (A) 5-fluorouracil and (B) paclitaxel for MDA-
MB-231 cells evaluated in 2D DMF format (red bars), 3D DMF format (green bars), and 2D
well plate format (blue bars).

vii
List of Tables
Table 1. List of advantages of the new laser-cut PET-ITO top plates described here.
Table 2. Results of laser setting optimization experiment around (A) Condition A and
(B) Condition B.
Table 3. Results of heating condition optimization experiment.
Table 4. Comparison of the basic parameters in the 2D well plate assay and the 2D DMF
assay.

1
Chapter 1. Introduction
1.1 Background information
This section introduces chemosensitivity testing (1.1.1) and digital microfluidics
(1.1.2), topics that serve as key background information for the work described in this
thesis.
1.1.1 Chemosensitivity testing
By definition, chemosensitivity testing is “an ex vivo measurement of the cytotoxic,
cytostatic, or apoptosis-inducing effects of anticancer drugs.”1 Chemosensitivity testing
plays an important role in the screening of new chemotherapeutic agents. Often, when
new agents are derived or extracted, in vitro chemosensitivity testing is first performed,
followed by tests in tumor-bearing animal models, and eventually clinical trials. In
addition, it has been proposed that chemosensitivity tests can potentially facilitate the
personalization and optimization of treatment schemes.
There are many types of chemosensitivity tests. Based on the underlying
mechanism, chemosensitivity assays can be divided into different categories: assays
based on incorporation of radioactively or chemically tagged precursors, assays based
on loss in membrane integrity, assays based on dye exclusion of viable cells, assays that
measure apoptosis-specific events such as caspase-3 activation, and assays that measure
proliferation. These categories of assays all have their own advantages and

2
disadvantages. It is widely accepted that the clonogenic cell survival assay (or CSA,
which is performed by growing and counting cell colonies upon cytotoxic agent
treatment to evaluate the loss of reproductive integrity) is the “gold standard” because
of its high sensitivity and ability to measure the sum of all modes of cell death.2-4 In
fact, there is experimental evidence that the CSA generates more reliable predictions of
drug efficacy when compared to many other assays.5 Unfortunately, the CSA suffers
from low throughput as well as time and labor intensiveness. Another drawback of the
conventional CSA is its inability to measure the influence of cell-cell communication
on proliferation because of low plating densities.1 Therefore, in recent studies,
researchers have turned to using multi-well plate-based colorimetric or fluorescent
assays (e.g. the MTT proliferation assay) to determine chemosensitivity.
3
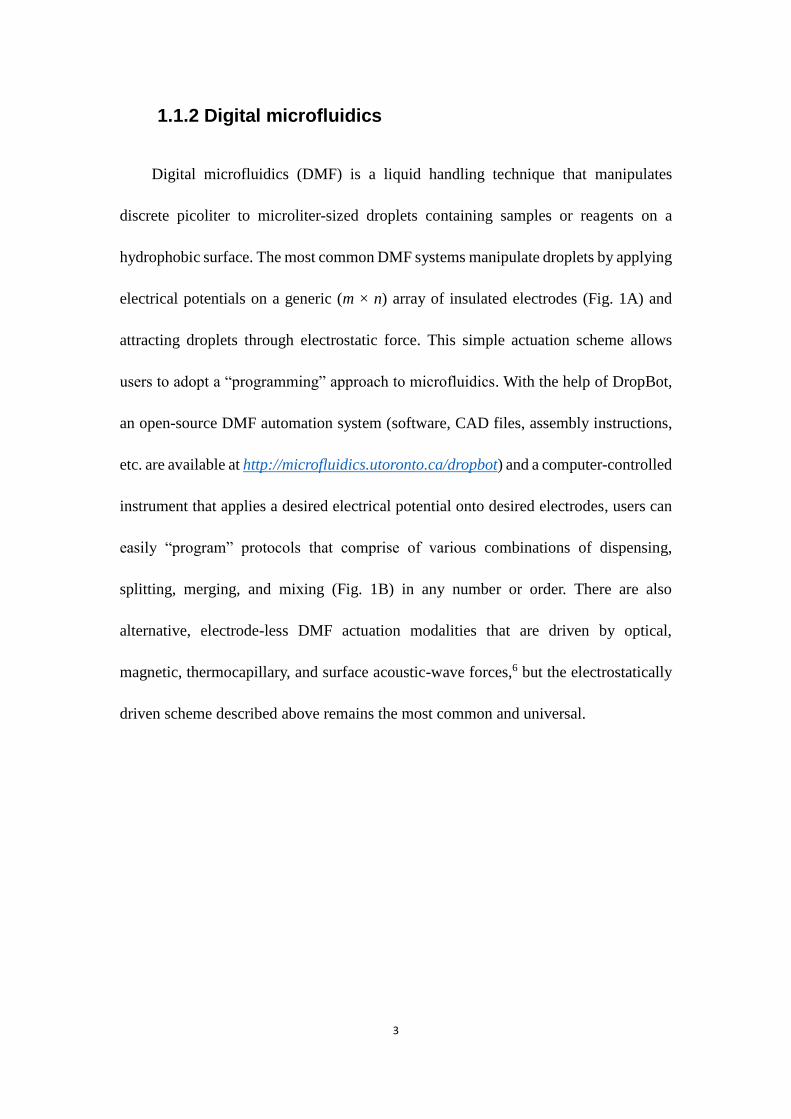
1.1.2 Digital microfluidics
Digital microfluidics (DMF) is a liquid handling technique that manipulates
discrete picoliter to microliter-sized droplets containing samples or reagents on a
hydrophobic surface. The most common DMF systems manipulate droplets by applying
electrical potentials on a generic (m × n) array of insulated electrodes (Fig. 1A) and
attracting droplets through electrostatic force. This simple actuation scheme allows
users to adopt a “programming” approach to microfluidics. With the help of DropBot,
an open-source DMF automation system (software, CAD files, assembly instructions,
etc. are available at http://microfluidics.utoronto.ca/dropbot) and a computer-controlled
instrument that applies a desired electrical potential onto desired electrodes, users can
easily “program” protocols that comprise of various combinations of dispensing,
splitting, merging, and mixing (Fig. 1B) in any number or order. There are also
alternative, electrode-less DMF actuation modalities that are driven by optical,
magnetic, thermocapillary, and surface acoustic-wave forces,6 but the electrostatically
driven scheme described above remains the most common and universal.

4
Fig. 1. Digital Microfluidics (DMF). (a) Top view (left) and side view (right) schematics of
a two-plate DMF device. (b) Graphical representation of the 4 basic modes of droplet
operations (dispensing, merging, splitting, and mixing) on DMF devices.
DMF shares a series of advantages with microchannel-based microfluidic
formats, including small fluid volumes, minimal sample requirement, rapid heat and
gas transfer, high capacity for parallelization and automation, and straightforward
integration with existing analytical techniques.7 In addition, a key advantage of DMF
relative to other microscale techniques is that fluid manipulation in digital microfluidics
does not require networks of channels, pumps or valves. Thus, elaborate, multi-step
applications can be performed with simple, compact and highly universal
instrumentation. These features make it an attractive platform to explore for integration
5
into routine laboratory work-flows.
1.2 Literature review
1.2.1 Chemosensitivity testing – standard techniques
In the past several decades, there has been extensive work evaluating in vitro tests
for tumor chemosensitivity. The majority of these studies were performed on
established cell lines in 2D cell culture dishes or multi-well plates.1,8 Unfortunately,
despite some success stories, these studies have generally failed to predict the in vivo
response of the same type(s) of tumor.8-10 Established cancer cell lines, which are grown
in 2D cell culture dishes or flasks, evolve and change from the original tumor
microenvironment and thus may be an inappropriate model for evaluating drugs. In fact,
in a recent study, it was reported that the expression levels of a series of drug resistance-
related genes in tumor cell lines were very different from their counterparts in the in
vivo tumors.11 It is now widely believed that the tumor microenvironment is a major
factor that causes the difference in drug efficacy observed for conventional cell cultures
compared to in vivo experiments or clinical trials.12
To address the challenge described above, chemosensitivity tests relying on cell
co-culture and three-dimensional (3D) culture have recently been developed. Compared
to conventional 2D monoculture systems, these approaches are more physiologically
relevant. In fact, there is extensive evidence that compared to conventional 2D cultures,
3D tumor cultures are better mimics of their in vivo counterparts in terms of morphology,

6
migration, gene expression and proliferation.13-16 Furthermore, both co-culture systems
and 3D monocultures are believed to be better predictors of tumor chemosensitivity
than 2D monocultures.9,10,17 On the other hand, co-culture and 3D monoculture systems
are more expensive and challenging to implement than 2D monoculture systems; it
remains to be seen which format will be best suited for ex vivo chemosensitivity testing
(perhaps with different formats more appropriate for different applications).
1.2.2 Chemosensitivity testing in microfluidic systems
Recently, there have been efforts to apply microfluidic techniques to
chemosensitivity testing.18-21 The majority of these studies focused on patient-derived
tumour samples, and used poly-dimethylsiloxane (PDMS, or silicone rubber)-based
microchannel systems to culture and maintain tumour cells and deliver
chemotherapeutic agents. For example, Pak et al. collected myeloma cells and bone
marrow stromal cells from patient samples, and co-incubated these 2 types of cells in
interconnected microfluidic chambers.18 This unique design allowed inspection of the
tumour cells while maintaining the interaction between stromal cells and tumour cells.
When predicting the response of a group of 17 patients who received the same
chemotherapeutic drug, this platform achieved a remarkable prediction rate of 100%.
In another example, Astolfi et al. developed methods to maintain animal- or patient-
derived micro-dissected tumour slices in a microchannel system for several days, and
to determine drug sensitivity via on-chip viability assays.19 The authors demonstrated
the ability of this platform to measure the loss of viability after drug treatment. However,

7
there appears to be significant sample-to-sample variation due to the intrinsic
heterogeneity of tumours, which might be confounded with drug effect. In a third
example, using a microchannel platform similar to that of Astolfi et al., Das et al.
incubated and treated preformed spheroids of an ovarian cancer cell line, and analyzed
the spatiotemporal evolution of the mortality fraction on different layers.20 Interestingly,
the authors not only demonstrated the increase in mortality fraction throughout the
spheroids at elevated drug concentrations, but also reported non-uniform cell death
profiles throughout the spheroid (i.e., more deaths at the core). However, the Das et al.
method is largely empirical, and it appears to be potentially challenging to compare the
efficacy of two treatment regimens by their cell death profiles, as different layers have
different weights (i.e. cell numbers), but it is difficult to estimate the cell numbers due
to the compactness of spheroids.
The use of microfluidics in chemosensitivity testing is still in its infancy, but the
examples described above (and others) suggest a potential role for this technology in
enabling rapid, inexpensive testing of small patient samples, which could pave the way
(eventually) to application for personalized medicine.
1.2.3 Suitability of DMF for cell culture and cell assays
Digital microfluidics has never been used before for chemosensitivity testing, but
it has been applied to a number of mammalian cell-culture or cellular assay
applications.22-26 Recent innovations in this area include systems for long-term cell

8
culture,22 culture of primary cells,23 cell signaling transduction analysis,27 and 3D
culture.24,25 For example, Barbulovic-Nad et. al have shown that in the short term, cells
grown on DMF chips and tissue culture flasks resulted in similar cell viability,
proliferation rate, and cellular biochemistry (as analyzed by mass spectrometry), after
several days of culture.28 Furthermore, Au et al. performed a gene microarray analysis
on cells that had been manipulated on a DMF platform, and demonstrated that the
influence of droplet manipulation on cell health and gene expression is minimal.26
I propose that there are multiple advantages of the DMF platform that makes it
attractive as a potential tool for 2D or 3D chemosensitivity testing. The capability of
the DMF platform to culture cells at designated locations and the ease of manipulations
including feeding, starving and staining makes it convenient for cell growth and cell
assays. In addition, Eydelnant et. al demonstrated that microgels can be easily formed
on DMF devices, with highly adjustable geometry, dimensions, and chemical
contents.25 The ability for ‘on-demand’ formation of microgels with diverse contents
and shapes greatly expands the scope of potential applications for 3D cell culture, and
enables the optimization of microgels for each specific situation (e.g. cell type, assay,
etc.).

9
Chapter 2. Comparison between 2D and 3D
Chemosensitivity Assays on DMF
2.1 Introduction
The main goal of my thesis-work was to evaluate the suitability of DMF for
performing 2D and 3D chemosensitivity assays, and to compare and contrast the
chemosensitivity profiles of chemotherapeutic drugs generated in these two modes.
In preliminary trials, it was determined that the DMF device formats and methods
used for previous cell culture and analysis experiments in the lab were not suitable for
the 3D chemosensitivity experiments envisioned here, mainly caused by the limited
device lifetimes. Thus, my thesis work necessarily included significant work towards
improving the DMF platform and protocols for droplet manipulation. For example, as
I worked to improve the top plate, a material called PET-ITO [a polyethylene
terepthalate film with an indium-tin oxide (ITO) coating on one side] drew my attention,
because it can serve as an alternative to the “conventional” DMF top plates (formed
from glass coated with ITO). In my work, I discovered that PET-ITO has a number of
advantages including ease in prototyping, of the capacity to be patterned via laser-
cutting, etc. Thus, my first two tasks were to design a PET-ITO top plate that is
compatible with 3D chemosensitivity assays and to improve protocols to extend device
lifetimes. After achieving these goals, I turned my attention to evaluating 2D and 3D
chemosensitivity assay procedures on the new devices. This chapter summarizes all of
this work.

10
2.2 Materials and Methods
2.2.1 Materials
Reagents and supplies used for cell culture included Dulbecco's Modified Eagle
Medium (DMEM), Dulbecco's Phosphate-Buffered Saline (DPBS), 0.25% trypsin-
EDTA, Fetal Bovine Serum (FBS), Alamar Blue Cell Viability Reagent, PET-ITO film
(catalog number: #639303, surface resistivity: 60 ohm/sq), No. 1 microscope coverslips,
and Live/Dead Cell Viability Assay Kits for Mammalian Cells purchased from Thermo
Fisher Scientific (Mississauga, ON), Pluronic F68 purchased from BASF Canada
(Mississauga, ON), and Ultra Pure Bovine Collagen I and DMSO purchased from
Sigma Chemical (Oakville, ON). ARSeal 8026 adhesive was generously donated by
Adhesive Research Inc. (Glen Rock, PA, United States).
Clean room reagents and supplies included Shipley S1811 photoresist and MF-
321 developer from Rohm and Hass (Marlborough, MA, United States), CR-4
chromium etchant from Cyantek (Fremont, CA, United States), AZ-300T photoresist
stripper from AZ Electronic Materials (Somerville, NJ), Teflon-AF from DuPont
(Wilmington, DE), hydrogen peroxide from Sigma Chemical, Parylene C dimer and
Silane A174 from Thermo Fisher Scientific, dicing tape from Semiconductor
Equipment Corp. (Moorpark, CA, USA), and Fluorinert FC-40 from Sigma-Aldric.
Indium tin oxide (ITO) coated glass slides (50×75×1.1 mm, 8-12 ohm/sq) were
purchased from Riley Supplies (Richmond Hill, ON).
11
2.2.2 Cell culture
Unless specified otherwise, DMEM containing 100 U/mL penicillin G and 100
μg/mL streptomycin supplemented with 10% FBS was used for all cell culture
experiments. To enable on-chip movement, the medium was supplemented with 0.10%
(w/v) Pluronic F68 (as optimized in 2.3.2).
Prior to DMF experiments, MDA-MB-231 (American Type Culture Collection
[ATCC], Manassas, VA, United States) cells were grown in T75 flasks in a humidified
incubator at 37°C with 5% CO2, with passaging by Trypsin-EDTA every 2-3 days. For
2D and 3D DMF experiments, the MDA-MB-231 cells were resuspended at a cell
density of 300,000 cells/ml and 600,000 cells/ml, respectively.
2.2.3 DMF device fabrication and operation
2.2.3.1 Bottom plate fabrication
Fabrication of DMF top and bottom plates was performed in the Toronto
Nanofabrication Centre (TNFC) cleanroom facility. The bottom plates, which bear an
array of driving electrodes, were formed by photolithography and wet etching.
Specifically, glass substrates (50 x 75 x 1.1 mm) bearing 200 nm chromium and 530
nm AZ1500 photoresist coating (Telic Co., Santa Clarita, CA) were exposed to UV
light for 10 seconds through a photomask (printed by Pacific Arts and Designs Inc.,
Markham, ON) using a Suss MicroTec mask aligner. The exposed substrates were then
12
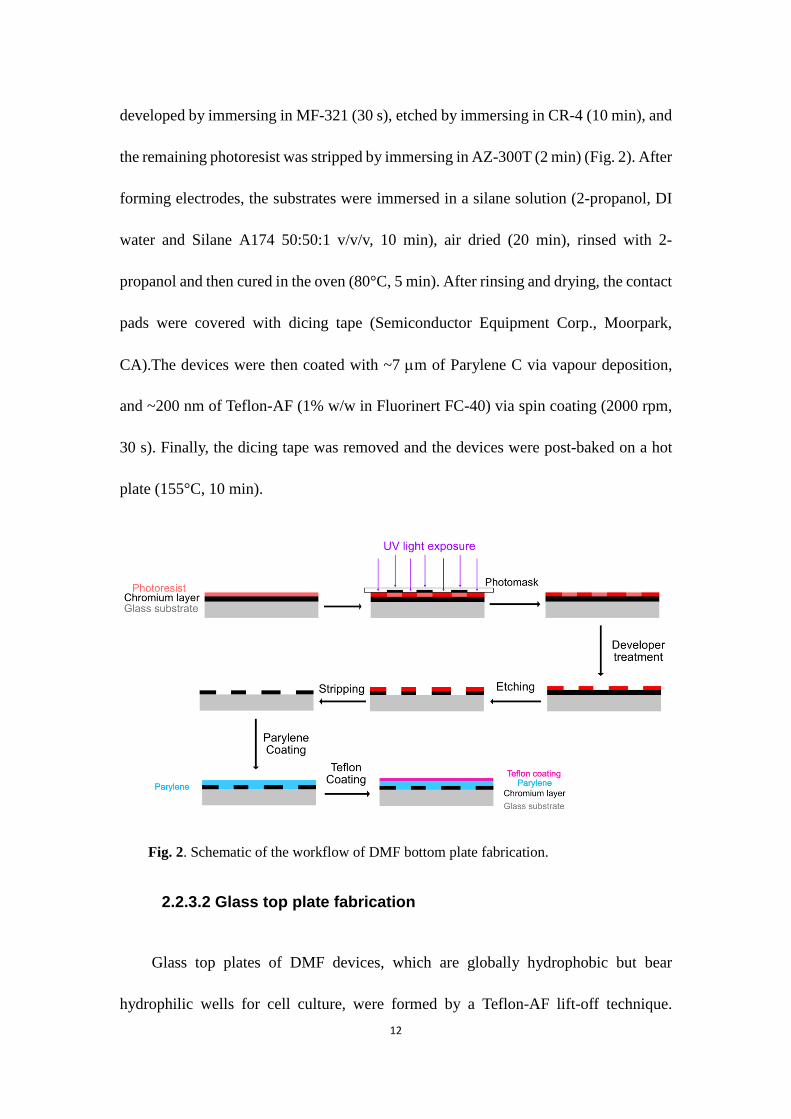
developed by immersing in MF-321 (30 s), etched by immersing in CR-4 (10 min), and
the remaining photoresist was stripped by immersing in AZ-300T (2 min) (Fig. 2). After
forming electrodes, the substrates were immersed in a silane solution (2-propanol, DI
water and Silane A174 50:50:1 v/v/v, 10 min), air dried (20 min), rinsed with 2-
propanol and then cured in the oven (80°C, 5 min). After rinsing and drying, the contact
pads were covered with dicing tape (Semiconductor Equipment Corp., Moorpark,
CA).The devices were then coated with ~7 m of Parylene C via vapour deposition,
and ~200 nm of Teflon-AF (1% w/w in Fluorinert FC-40) via spin coating (2000 rpm,
30 s). Finally, the dicing tape was removed and the devices were post-baked on a hot
plate (155°C, 10 min).
Fig. 2. Schematic of the workflow of DMF bottom plate fabrication.
2.2.3.2 Glass top plate fabrication
Glass top plates of DMF devices, which are globally hydrophobic but bear
hydrophilic wells for cell culture, were formed by a Teflon-AF lift-off technique.
13
Indium-tin oxide (ITO) coated glass substrates were first immersed in a RCA cleaning
solution of DI water, NH4OH, and H2O2 (5:1:1 v/v/v) on a hot plate (30 min, 80°C).
After thorough rinsing with DI water and sufficient drying with nitrogen gas,
photoresist S1811 was spin coated (3000 rpm, 45 s) onto the substrates and baked on a
hot plate (95°C, 2 min). The photoresist-coated ITO substrates were then exposed to
UV light through a photomask (printed by CAD/Art Services Inc., Brandon, OR) using
a Suss MicroTec mask aligner (29.8 Mw/cm2, 10 s). The exposed substrates were
developed in MF-321 (1 min), rinsed thoroughly with DI water and dried with nitrogen
gas. Subsequently, the developed substrates were exposed under UV light (29.8
Mw/cm2, 10 s) without photomask. Next, the substrates were spin coated with Teflon-
AF (1% w/w in FC-40, 4000 rpm, 30 s), baked on a hot plate (155°C, 2 min) and
immersed in acetone until lift-off of Teflon occurred (~10 s), exposing a pattern of eight
ITO spots with 1.75 mm diameters.
2.2.3.3 Device assembly
Prior to assembly of a DMF device, top and bottom plates were sprayed with 70%
ethanol to sterilize them, and then the pieces were air-dried in the biosafety cabinet. For
2D or 3D DMF experiments, each pair of top and bottom plates were joined by 2 or 3
layers of white polyester tape 9965 (3M), forming a total spacer thickness of ~160 or
~240 μm, respectively. The hydrophilic sites on the top plate were aligned to the center
of the electrode array on the bottom plate.
14
2.2.3.4 Droplet operations on chip
The bottom plate contains an array of 80 actuation electrodes (2.2 x 2.2 mm) in
the working area, each of which uniquely corresponds to a contact pad located on the
sides of the device. An in-house designed computer-controlled instrument powered by
DropBot, an open-source DMF automation system (software, CAD files, assembly
instructions, etc. are available at http://microfluidics.utoronto.ca/dropbot), was used to
manage droplet operations. Droplets were actuated by applying a driving voltage (10
kHz sine wave with VRMS = 80-110 V) between the grounded top plate and specific
electrodes on the bottom plate through an array of pogo pins which interfaced with the
contact pads.
Reagents and cell suspensions were loaded onto reservoir electrodes by pipetting
the reagent adjacent to the gap between the bottom and top plates and actuating the
reservoir electrodes. After loading, droplets were manipulated by actuating neighboring
electrodes via the DropBot interface, including the operation of “active dispensing”
(that is, generating a “unit volume” droplet that covers a single driving electrode from
a larger reservoir droplet). In addition, when a droplet was driven under a lift-off spot
on the top plate, a smaller volume is retained on the hydrophilic site; this sub-droplet is
called a “virtual microwell” (and the process is known as “passive dispensing”). Note
that the “top plate” is a bit of a misleading name. During all droplet manipulation
operations, the top plate is indeed at the top of the device. But in all periods other than
droplet manipulation (i.e., 99% of the time), the device is flipped “upside down” and
stored in the incubator, such that the top plate is actually on the bottom. Thus, when

15
devices bearing virtual microwells formed from cell suspensions are incubated, cells
can settle and attach to the lift-off spots on the top plate within a few hours.
Subsequently, the contents of these microwells can be replaced through further passive
dispensing (without removing attached cells), which allows automated feeding and
waste removal.
2.2.4 Development of laser cut top plates
2.2.4.1 Overall workflow of laser cut top plate fabrication
A new type of “laser cut” top plates were designed, optimized, and characterized.
Designs were formed using the open-source Inkscape graphics editor
(https://inkscape.org/) and then printed using a Desktop CO2 Laser System (Full
Spectrum Laser, Las Vegas, NV, United States). The cutting parameters were
programmed in Retina Engrave (the software that accompanies the laser cutter), using
parameters described in section 2.2.4.2. The material to be cut was a PET-ITO film that
has ARseal 8026 adhesive on the plastic (i.e. non-ITO) side. The process of laser cutting
(Fig. 3) generates eight 1.3 mm diameter through-holes in the film; after cutting, Teflon
AF (2% w/w in Fluorinert FC-40) is spin coated (2000 rpm, 30 s) onto the ITO-side of
the film, and then heated in an oven (see section 2.2.4.3 for details) to remove the
solvent. Subsequently, the back of each top plate is attached to a piece of No.1
microscope coverslip (130-160 μm thick) via the adhesive and rolled with a roller to
provide mechanical support.

16
As a final step, to prevent liquid from being retained by the edge of the adhesive
layer during droplet loading, foldable “side wings” were designed and applied to the
top plates (discussed in section 2.3.1.1). To facilitate this step, the PET-ITO films were
designed to have an overhanging wing on each side, with each wing demarked with a
faint laser cut. Specifically, the dividing lines between the main top plate and the
wings were scored (number of cutting cycles = 1, laser power = 8, speed = 50) such that
they can be bent without falling off. Thus, after the attachment of the microscope
coverslip (described above), the wings of the top plate were carefully bent away from
the active side of the top plate, prior to attachment to a bottom plate.
Fig. 3. Schematic of the general workflow of PET-ITO top plate fabrication.
17
2.2.4.2 Optimization experiment of laser cutting settings
An experiment was performed to optimize the laser setting for forming through
holes through the PET-ITO substrate. The vector current was held constant at 35%,
and empirically, “Condition A” (defined by settings: “number of cutting cycles = 1,
laser power = 50, speed = 50”) and “Condition B” (defined by settings: “number of
cutting cycles = 2, laser power = 30, speed = 30”) were both found to cut out the wells,
but also to burn the edges of the wells (observed by discoloration). This burning affects
the resulting well size, but also is a potential source of combustion-products that may
influence cell signaling or proliferation. Therefore, a series of top plates were cut with
small changes in one or two of the above conditions (Condition A or Condition B) to
find the optimal combination of parameters. For example, in one experiment, the laser
power was decreased by 10, but the number of cutting cycles was increased to 3; in
another experiment, both the speed and the laser power were increased by 5. A detailed
list of combinations tested is included in Section 2.3.1.2. After cutting, the resultant
wells were observed under the microscope to evaluate: (1) whether the laser completely
cut through the film; (2) how severely it was burnt. The severity of burning was
qualitatively scored between 0 and 10 (Fig. 4), with 0 being completely clean, and 10
being the most severe burns observed (generated by cutting cycle = 3, laser power = 80,
speed = 50). The results were combined and compared to identify the condition that
generated the least amount of burned material while being able to form the through-
holes as desired.

18
Fig. 4. Pictures of PET-ITO substrates with laser-cut through-holes. Qualitative scores
illustrating the degree of burning are indicated in red.
2.2.4.3 Optimization experiment of heating conditions
In preliminary trials, it was found that the PET-ITO material bends during the
heating/solvent evaporation step (after spin-coating Teflon-AF), which prevents it from
attaching properly to the coverslip. Therefore, an optimization experiment was
performed. Empirically, heating the top plate in the oven at 160°C for 10 min was found
to (sometimes) generate functional top plates. Using this setting as a starting point, a
series of top plates were formed by heating at different temperatures ranging from
130°C to 165°C for different durations (n = 2 per condition, listed in section 2.3.1.3).
The upper limit of this range (165°C) was chosen because the PET material itself bends
and distorts severely above this temperature; the lower limit (130°C) was chosen
because solvent evaporation becomes impractically slow at temperatures much lower
than its boiling point (155°C).
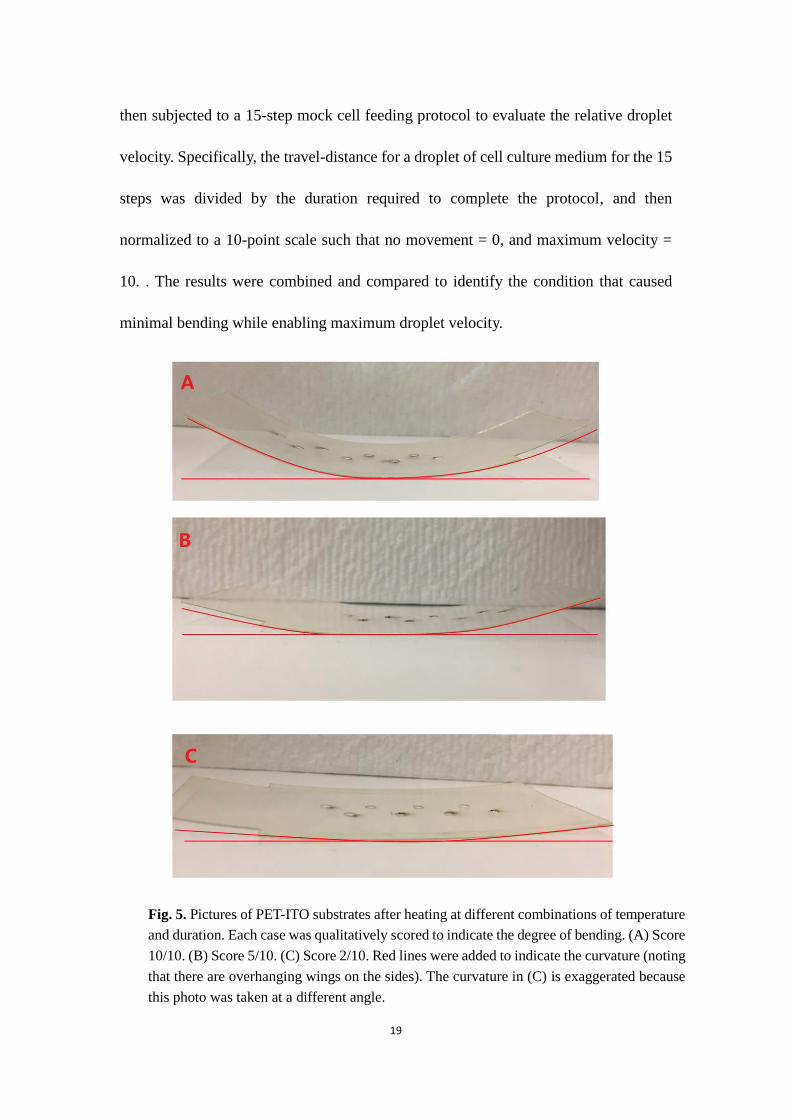
The degree of bending in the resultant top plates was qualitatively scored between
0 and 10, with 0 being completely flat, and 10 being the most severe (defined as the
level of bending of PET-ITO heated at 170°C for 10 min) (Fig. 5). After scoring, top
plated formed using each condition were assembled into complete DMF devices, and
19
then subjected to a 15-step mock cell feeding protocol to evaluate the relative droplet
velocity. Specifically, the travel-distance for a droplet of cell culture medium for the 15
steps was divided by the duration required to complete the protocol, and then
normalized to a 10-point scale such that no movement = 0, and maximum velocity =
10. . The results were combined and compared to identify the condition that caused
minimal bending while enabling maximum droplet velocity.
Fig. 5. Pictures of PET-ITO substrates after heating at different combinations of temperature
and duration. Each case was qualitatively scored to indicate the degree of bending. (A) Score
10/10. (B) Score 5/10. (C) Score 2/10. Red lines were added to indicate the curvature (noting
that there are overhanging wings on the sides). The curvature in (C) is exaggerated because
this photo was taken at a different angle.
20
2.2.5 On-chip drug response assays
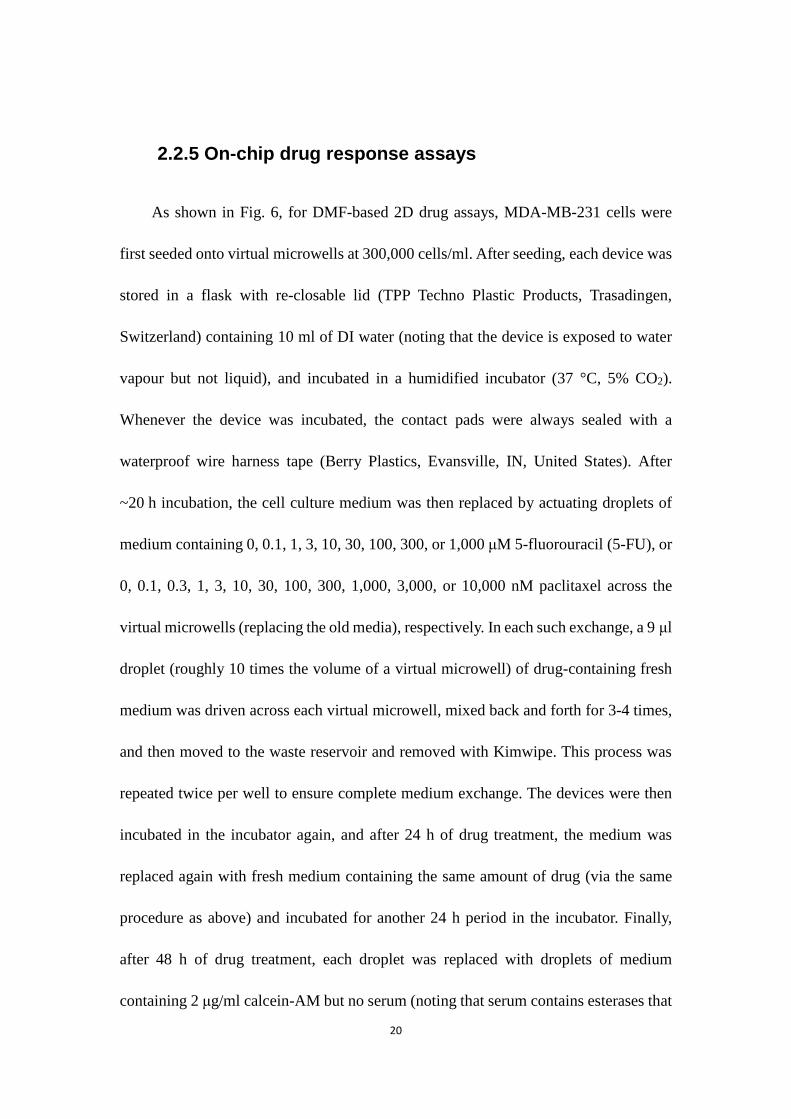
As shown in Fig. 6, for DMF-based 2D drug assays, MDA-MB-231 cells were
first seeded onto virtual microwells at 300,000 cells/ml. After seeding, each device was
stored in a flask with re-closable lid (TPP Techno Plastic Products, Trasadingen,
Switzerland) containing 10 ml of DI water (noting that the device is exposed to water
vapour but not liquid), and incubated in a humidified incubator (37 °C, 5% CO2).
Whenever the device was incubated, the contact pads were always sealed with a
waterproof wire harness tape (Berry Plastics, Evansville, IN, United States). After
~20 h incubation, the cell culture medium was then replaced by actuating droplets of
medium containing 0, 0.1, 1, 3, 10, 30, 100, 300, or 1,000 μM 5-fluorouracil (5-FU), or
0, 0.1, 0.3, 1, 3, 10, 30, 100, 300, 1,000, 3,000, or 10,000 nM paclitaxel across the
virtual microwells (replacing the old media), respectively. In each such exchange, a 9 μl
droplet (roughly 10 times the volume of a virtual microwell) of drug-containing fresh
medium was driven across each virtual microwell, mixed back and forth for 3-4 times,
and then moved to the waste reservoir and removed with Kimwipe. This process was
repeated twice per well to ensure complete medium exchange. The devices were then
incubated in the incubator again, and after 24 h of drug treatment, the medium was
replaced again with fresh medium containing the same amount of drug (via the same
procedure as above) and incubated for another 24 h period in the incubator. Finally,
after 48 h of drug treatment, each droplet was replaced with droplets of medium
containing 2 μg/ml calcein-AM but no serum (noting that serum contains esterases that

21
can increase the background). The devices bearing droplets of this staining solution
were stored in the incubator for 20-30 min, and then imaged with a confocal microscope.
For DMF-based 3D drug assays, cell suspensions in media were first mixed 1:1
with a collagen I hydrogel solution (2.4 mg/ml ultra pure bovine collagen I in 1x PBS,
adjusted to pH 7.0 with 0.25M NaOH solution) to achieve a final density of 300,000
cells/ml. The mixture was then kept on ice until use. When it was loaded onto the device,
droplets were actively dispensed and driven across laser-cut holes in the top plate to
form virtual microwells. Subsequently, each device was sealed with waterproof tape
and incubated at 37°C to allow crosslinking of the gel. During incubation, the device
was flipped (alternately with top plate on “top” or “bottom”) a total of 4 times at 7 min
intervals to allow even distribution of cells within the gel. Upon gel formation, cell
assays were conducted as in the 2D assays (described above); that is, drug treatment
was initiated on Day 2, drug replenishment on Day 3, and calcein-AM staining and
imaging on Day 4 (Fig. 6).

22
Fig. 6. Schematic of the experimental flow of DMF-based 2D and 3D experiments.
2.2.6 Image acquisition and analysis
After staining, microwells on DMF devices were imaged using a Confocal
Microscope A1 system (Nikon Instruments Inc., Melville, NY, United States). Typically,
a 486.8 nm excitation laser and a 525/50 excitation filter were used, with the HV (gain)
set at ~60, offset at -10, and laser power at 5%. These settings were adjusted as needed
to maximize signal without saturation. For 2D cell-culture assays, a single image was
obtained; for 3D cell-culture, z-stacking was performed. Specifically, stacks of images
were generated by incrementally stepping (with a 5 μm step size, which is smaller than
the diameter of most cells [10~20 μm]) through the depth of the gels, such that all the
cells embedded in the gel are imaged.
After acquisition, the resultant images were analyzed with the open-source
CellProfiler software package (available at: http://www.cellprofiler.org/). A custom
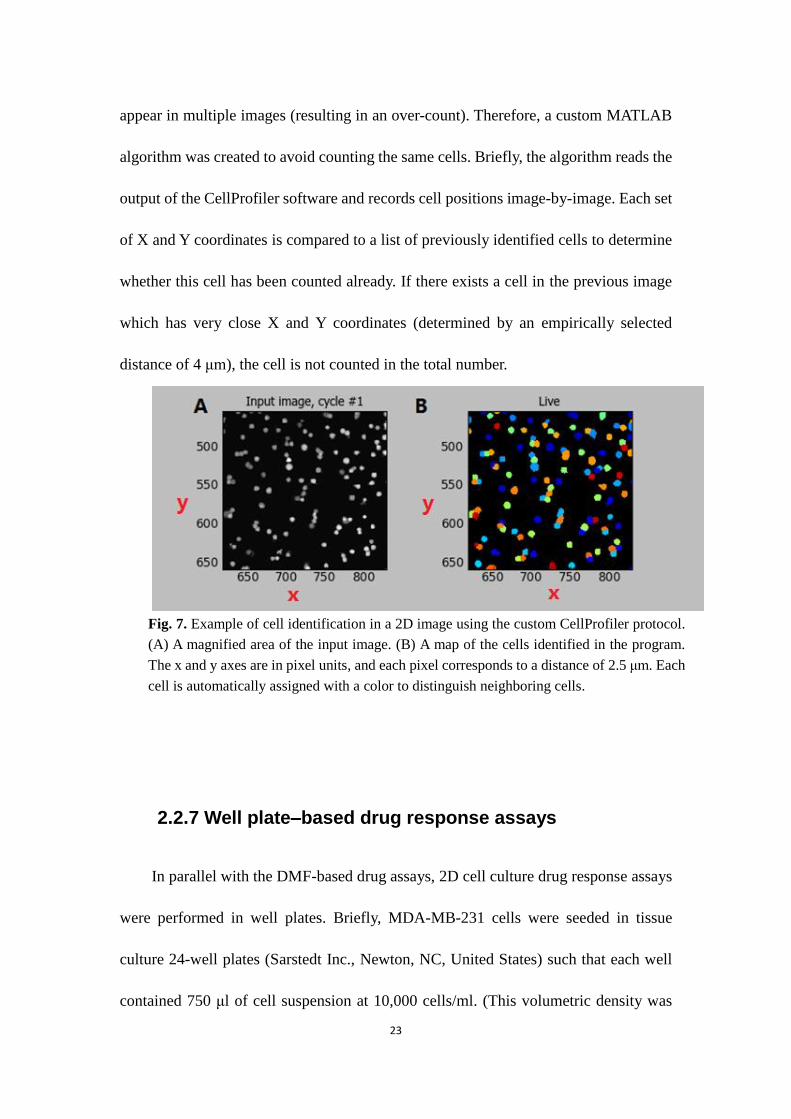
protocol was developed to accurately identify and count the cells from each image. To
identify cells, the software was instructed to detect 8-40 μm diameter objects using the
Otsu Global thresholding method (details of the method was introduced by Otsu et al.
29) with two classes, weighted variance, threshold correction factor = 0.7, and
declumped according to signal intensity. This program (operating with the settings
above, which can be adjusted as needed) was able to identify all of the individual cells
in 2D images (Fig. 7). However, for the DMF-based 3D drug assays, because the step
size of the z-stack is smaller than the diameter of an average cell, the same cells might
23
appear in multiple images (resulting in an over-count). Therefore, a custom MATLAB
algorithm was created to avoid counting the same cells. Briefly, the algorithm reads the
output of the CellProfiler software and records cell positions image-by-image. Each set
of X and Y coordinates is compared to a list of previously identified cells to determine
whether this cell has been counted already. If there exists a cell in the previous image
which has very close X and Y coordinates (determined by an empirically selected
distance of 4 μm), the cell is not counted in the total number.
Fig. 7. Example of cell identification in a 2D image using the custom CellProfiler protocol.
(A) A magnified area of the input image. (B) A map of the cells identified in the program.
The x and y axes are in pixel units, and each pixel corresponds to a distance of 2.5 μm. Each
cell is automatically assigned with a color to distinguish neighboring cells.
2.2.7 Well plate–based drug response assays
In parallel with the DMF-based drug assays, 2D cell culture drug response assays
were performed in well plates. Briefly, MDA-MB-231 cells were seeded in tissue
culture 24-well plates (Sarstedt Inc., Newton, NC, United States) such that each well
contained 750 μl of cell suspension at 10,000 cells/ml. (This volumetric density was

24
selected to give a surface density similar to that of the 2D cell culture DMF assays.)
After ~20 h incubation in the incubator, the cell culture medium was removed (by
pipette) and replaced with 750 μl medium containing 0, 0.1, 1, 3, 10, 30, 100, 300, or
1,000 μM 5-fluorouracil (5-FU), or 0, 0.1, 0.3, 1, 3, 10, 30, 100, 300, 1,000, 3,000, or
10,000 nM paclitaxel, respectively. After 24 h of incubation, the medium was replaced
again with fresh medium containing the same amount of drug.
Two methods were used to measure cell responses in well plates. In the first
method, an Alamar Blue Cell Viability Assay was run: after 44 h of drug treatment, the
media in each well was supplemented with 83.3 μl (10% of the final volume) Alamar
Blue dye solution (from manufacturer), and incubated at 37°C for 4.5 h. Subsequently,
100 μl of medium was transferred from each well in the 24-well plate into a well in a
black 96-well plate with clear bottom (Sarstedt Inc., Newton, NC, United States). The
96-well plate was then evaluated in a PHERAstar plate reader (BMG Labtech, Guelph,
ON). Fluorescence intensities at 530 nm (excitation) and 620 nm (emission) were
measured, with focal height of 5.7 mm and gain of 300. Upon data acquisition, the
intensity measured for a negative control (i.e., a well with media but no cells) was
subtracted from the intensities of all other wells to yield relative fluorescence intensities,
which were used to plot the response curve.
The second method used to evaluate cell response in well plates was an adaptation
of the same technique used for DMF, relying on calcein-AM. Briefly, after 48 h of
exposure to drug, the media in each well was removed and replaced with medium
containing 2 μg/ml calcein-AM. After 20-30 min, the well plate was imaged with a

25
confocal microscope using the 10x objective lens. A region of interest (ROI) in the
center of each well covering ~10% of the total area per well was selected and analyzed
using the stitching function of the NIS-Elements Advanced Research imaging software.
Specifically, 13 consecutive images were collected across the diameter of each well.
Then, the software automatically stitched them by combining the small overlapping
area between images. Subsequently, the resultant images were counted with
CellProfiler software as described in 2.2.6, and the relative live-cell numbers were
calculated by dividing by the average number of cells counted in an untreated control
well.
2.2.8 Investigation on the use of Pluronic F68 to reduce
biofouling
2.2.8.1 Evaluation of the effect of F68 concentration on biofouling
In each experiment, droplets of cell media (including 10% FBS, as above)
containing varied concentrations of Pluronic F68 (0.05%, 0.07%, 0.09%, 0.11%, 0.13%
w/v) were moved on DMF devices to evaluate the extent of biofouling observed.
Specifically, 1.0 μl droplets were loaded and then moved back and forth between two
neighboring electrodes by alternatively actuating these electrodes via DropBot
(actuation voltage VRMS 110V, frequency 10 kHz, max. step duration 1.500 sec). After
extended contact with the DMF device, the droplets fouled the hydrophobic surface and

26
the velocities decreased. Eventually, the droplets failed to complete a movement step
within the step duration, which triggered the end of the experiment. The DropBot
program calculated the droplet velocities from capacitance measurements every few
milliseconds; this data was then analyzed to determine the rate of biofouling and the
point at which device failure is observed.
2.2.8.2 Evaluation of the effect of F68 on cell proliferation
MDA-MB-231 cells were harvested and diluted to 10,000 cells/ml, and then
supplemented with pluronic F68 to reach a final F68 concentration of 0%, 0.05%,
0.075%, or 0.10%. These cell suspensions were seeded in duplicate into a 24-well plate,
with 750 μl of cell suspension in each well. The 24-well plate was incubated for 96 h,
testing for proliferation at t = 24, 48, 72 and 96 h, respectively. Briefly, at each time
point, 83.3 μl of Alamar Blue dye was mixed with the contents of a well and allowed
to incubate for 4.5 h (i.e., dye was added at 19.5 h, 43.5 h, 67.5 h, and 91.5 h). During
each incubation, the well plate was gently rocked; after incubation, 100 μl of medium
was transferred from each well into a well in a black 96-well plate with clear bottom.
The 96-well plate was then evaluated as in Section 2.2.7. After each round of imaging,
the dye-containing medium in each well was replaced with fresh cell culture medium
that contained the same amount of F68.
27
2.2.9 Statistical analysis
Unless otherwise specified, all data analysis was performed with GraphPad Prism
software (GraphPad, La Jolla, CA). All the drug response curves were fitted using the
“inhibitor vs. response” nonlinear regression module. In addition, a two-way analysis
of variance (ANOVA) was applied to compare means of fluorescence intensities
between different F68 concentrations or time points.
2.3 Results and discussion
2.3.1 Development of PET-ITO-based top plate
In initial experiments, it was determined that the device formats used for previous cell
culture and analysis experiments in the lab were not suitable for the 3D
chemosensitivity experiments proposed in my thesis. Thus, I devoted significant time
and resources to developing a new DMF device top-plate design, known as the “laser-
cut PET-ITO top plate.”
2.3.1.1 Design of the laser-cut PET-ITO top plate
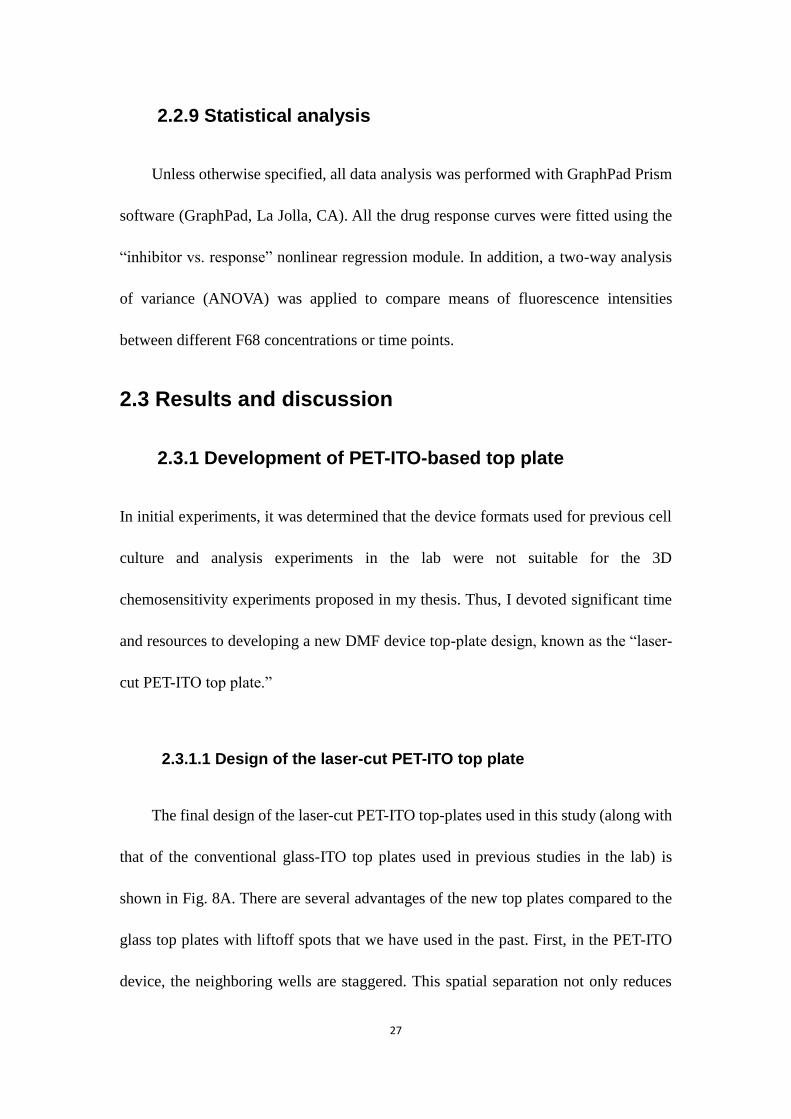
The final design of the laser-cut PET-ITO top-plates used in this study (along with
that of the conventional glass-ITO top plates used in previous studies in the lab) is
shown in Fig. 8A. There are several advantages of the new top plates compared to the
glass top plates with liftoff spots that we have used in the past. First, in the PET-ITO
device, the neighboring wells are staggered. This spatial separation not only reduces
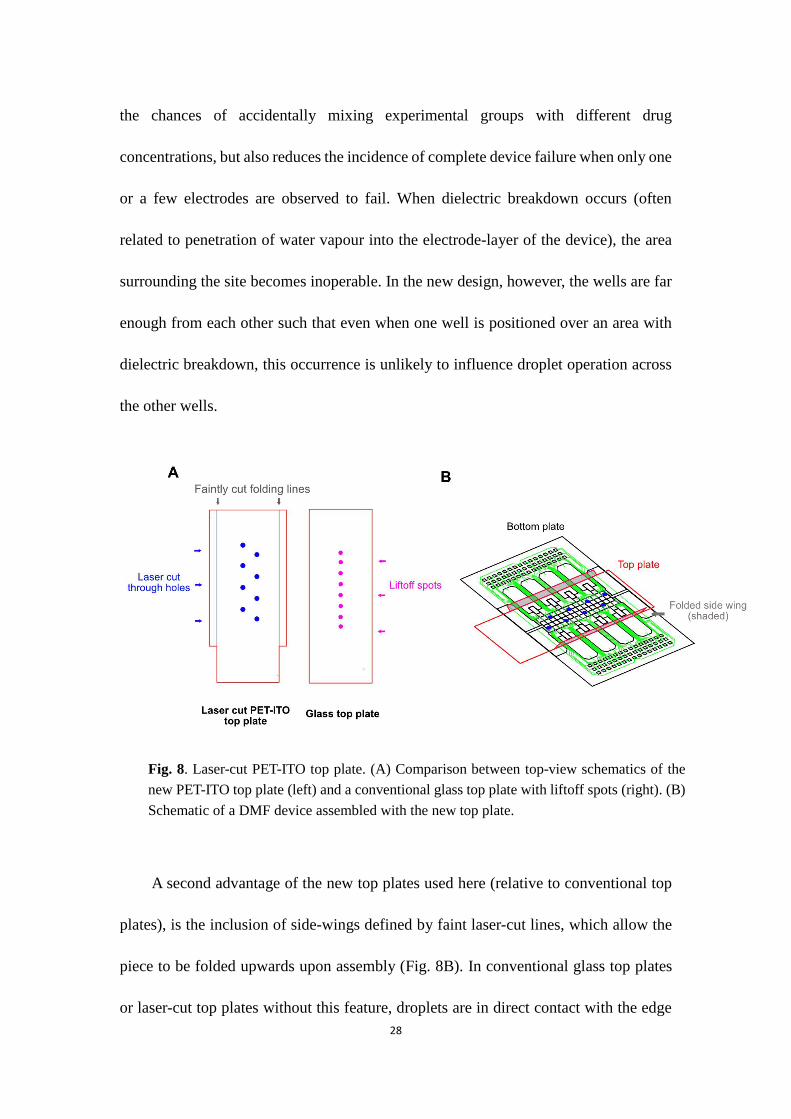
28
the chances of accidentally mixing experimental groups with different drug
concentrations, but also reduces the incidence of complete device failure when only one
or a few electrodes are observed to fail. When dielectric breakdown occurs (often
related to penetration of water vapour into the electrode-layer of the device), the area
surrounding the site becomes inoperable. In the new design, however, the wells are far
enough from each other such that even when one well is positioned over an area with
dielectric breakdown, this occurrence is unlikely to influence droplet operation across
the other wells.
Fig. 8. Laser-cut PET-ITO top plate. (A) Comparison between top-view schematics of the
new PET-ITO top plate (left) and a conventional glass top plate with liftoff spots (right). (B)
Schematic of a DMF device assembled with the new top plate.
A second advantage of the new top plates used here (relative to conventional top
plates), is the inclusion of side-wings defined by faint laser-cut lines, which allow the
piece to be folded upwards upon assembly (Fig. 8B). In conventional glass top plates
or laser-cut top plates without this feature, droplets are in direct contact with the edge
29
of the part before entering the reservoir electrode. The hydrophilic edge occasionally
prevents droplets from being loaded into the device. Thus, an advantage of this “side
wing” design is that droplets are always in contact with the hydrophobic Teflon-AF
surface, significantly reducing occurrence of droplet-loading failures.
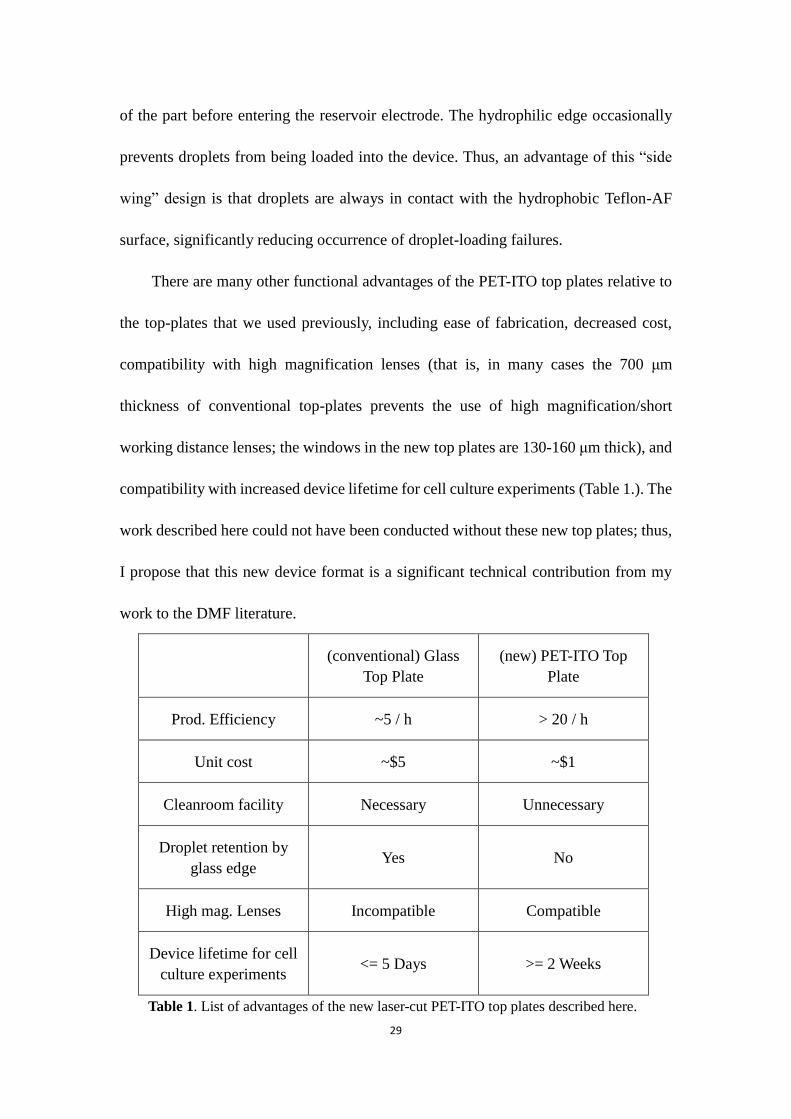
There are many other functional advantages of the PET-ITO top plates relative to
the top-plates that we used previously, including ease of fabrication, decreased cost,
compatibility with high magnification lenses (that is, in many cases the 700 μm
thickness of conventional top-plates prevents the use of high magnification/short
working distance lenses; the windows in the new top plates are 130-160 μm thick), and
compatibility with increased device lifetime for cell culture experiments (Table 1.). The
work described here could not have been conducted without these new top plates; thus,
I propose that this new device format is a significant technical contribution from my
work to the DMF literature.
(conventional) Glass
Top Plate
(new) PET-ITO Top
Plate
Prod. Efficiency ~5 / h > 20 / h
Unit cost ~$5 ~$1
Cleanroom facility Necessary Unnecessary
Droplet retention by
glass edge Yes No
High mag. Lenses Incompatible Compatible
Device lifetime for cell
culture experiments <= 5 Days >= 2 Weeks
Table 1. List of advantages of the new laser-cut PET-ITO top plates described here.
30
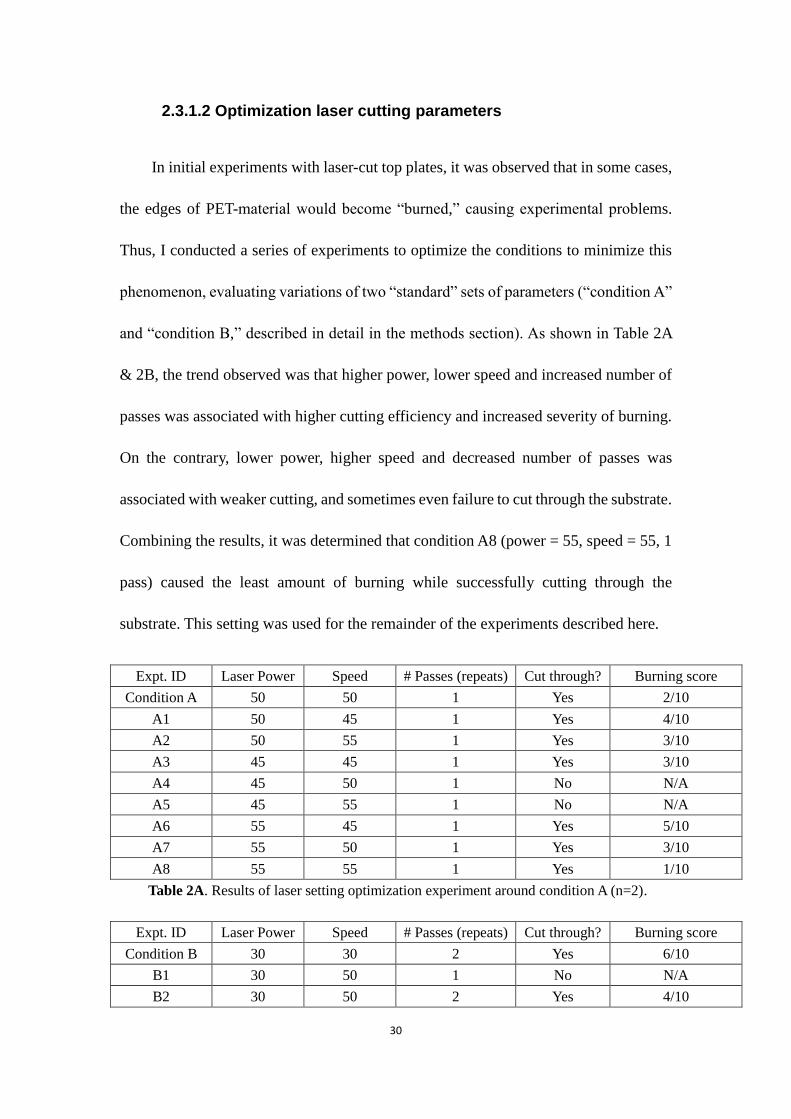
2.3.1.2 Optimization laser cutting parameters
In initial experiments with laser-cut top plates, it was observed that in some cases,
the edges of PET-material would become “burned,” causing experimental problems.
Thus, I conducted a series of experiments to optimize the conditions to minimize this
phenomenon, evaluating variations of two “standard” sets of parameters (“condition A”
and “condition B,” described in detail in the methods section). As shown in Table 2A
& 2B, the trend observed was that higher power, lower speed and increased number of
passes was associated with higher cutting efficiency and increased severity of burning.
On the contrary, lower power, higher speed and decreased number of passes was
associated with weaker cutting, and sometimes even failure to cut through the substrate.
Combining the results, it was determined that condition A8 (power = 55, speed = 55, 1
pass) caused the least amount of burning while successfully cutting through the
substrate. This setting was used for the remainder of the experiments described here.
Expt. ID Laser Power Speed # Passes (repeats) Cut through? Burning score
Condition A 50 50 1 Yes 2/10
A1 50 45 1 Yes 4/10
A2 50 55 1 Yes 3/10
A3 45 45 1 Yes 3/10
A4 45 50 1 No N/A
A5 45 55 1 No N/A
A6 55 45 1 Yes 5/10
A7 55 50 1 Yes 3/10
A8 55 55 1 Yes 1/10
Table 2A. Results of laser setting optimization experiment around condition A (n=2).
Expt. ID Laser Power Speed # Passes (repeats) Cut through? Burning score
Condition B 30 30 2 Yes 6/10
B1 30 50 1 No N/A
B2 30 50 2 Yes 4/10

31
B3 40 40 2 Yes 7/10
B4 20 20 2 No N/A
B5 20 40 2 No N/A
B6 20 40 1 No N/A
B7 35 20 3 Yes 9/10
B8 20 30 3 No N/A
Table 2B. Results of laser setting optimization experiment around condition B (n=2).
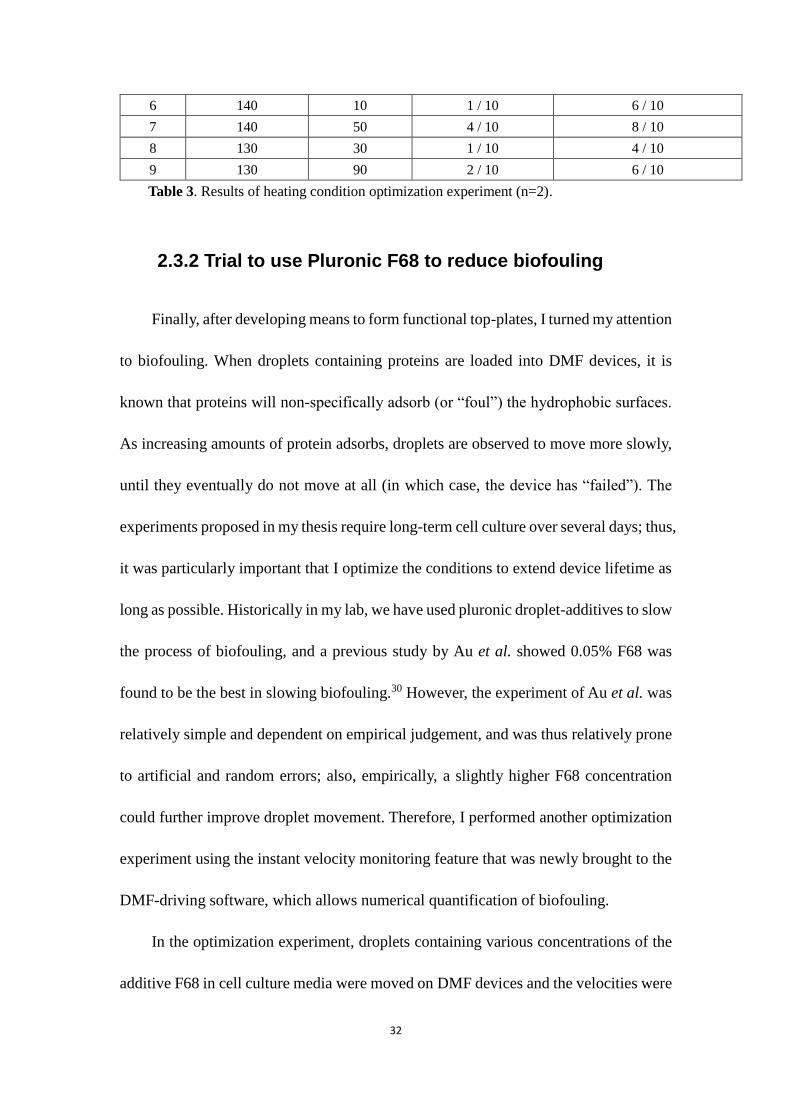
2.3.1.3 Optimization experiment of heating conditions
After determining the optimum conditions for laser-cutting the new PET-ITO top
plates, I turned my attention to developing a heating protocol (needed to evaporate
solvent after spin-coating Teflon-AF) that yielded a high percentage of functional
devices (as excessive heat was found to warp the substrates). As shown in Table 3,
devices were formed by heating in an oven under a number of conditions. As expected,
as the oven temperature decreased, longer heating periods were needed to achieve the
same performance in droplet movement. This is likely caused by the fact that as oven
temperature decreases, more time is required for the FC-40 solvent to evaporate. If there
is residual FC-40 solvent on the top plate after heating, it may change the distribution
of the hydrophobic Teflon-AF layer, making it uneven. From the observations recorded
in Table 3, I concluded that heating at 150°C for 15 min is the optimal condition, and
used this setting for all devices described below.
ID Temperature (°C) Duration (min) Bending score Relative velocity
1 165 10 6 / 10 6 / 10
2 160 10 6 / 10 8 / 10
3 155 10 5 / 10 10 / 10
4 150 10 2 / 10 9 / 10
5 150 15 2 / 10 10 / 10
32
6 140 10 1 / 10 6 / 10
7 140 50 4 / 10 8 / 10
8 130 30 1 / 10 4 / 10
9 130 90 2 / 10 6 / 10
Table 3. Results of heating condition optimization experiment (n=2).
2.3.2 Trial to use Pluronic F68 to reduce biofouling
Finally, after developing means to form functional top-plates, I turned my attention
to biofouling. When droplets containing proteins are loaded into DMF devices, it is
known that proteins will non-specifically adsorb (or “foul”) the hydrophobic surfaces.
As increasing amounts of protein adsorbs, droplets are observed to move more slowly,
until they eventually do not move at all (in which case, the device has “failed”). The
experiments proposed in my thesis require long-term cell culture over several days; thus,
it was particularly important that I optimize the conditions to extend device lifetime as
long as possible. Historically in my lab, we have used pluronic droplet-additives to slow
the process of biofouling, and a previous study by Au et al. showed 0.05% F68 was
found to be the best in slowing biofouling.30 However, the experiment of Au et al. was
relatively simple and dependent on empirical judgement, and was thus relatively prone
to artificial and random errors; also, empirically, a slightly higher F68 concentration
could further improve droplet movement. Therefore, I performed another optimization
experiment using the instant velocity monitoring feature that was newly brought to the
DMF-driving software, which allows numerical quantification of biofouling.
In the optimization experiment, droplets containing various concentrations of the
additive F68 in cell culture media were moved on DMF devices and the velocities were

33
measured as a function of time. Representative data for an experiment (0.09% F68) are
featured in Figure 9A. As shown, in each 1.5 s step, the droplet experiences a maximum
velocity, Vmax, shortly after beginning to move. The first droplet movement is initiated
at time t = 0 s, the second droplet movement at t = 4 s, and so on. As time progresses,
Vmax becomes smaller (presumably an effect of protein accumulation on the surface),
until it reaches 30% of the initial Vmax; we call that time T30. Eventually droplet
movement slows such that droplet does not complete the step (indicating device failure),
with a profile that looks like a plateau; we call that time Tplateau. Droplet steps in each
of the three regimes (i.e., the first step, the step corresponding to T30, and the step
corresponding to Tplateau) are highlighted in Figure 9B.

34
Fig. 9. Droplet velocity vs. time curves over time for cell culture media containing 0.09%
F68 group. (A) Experimental data. Each curve showed how the velocity of the droplet
changed within the full duration of one specific step (1500 ms), and the accumulated
experiment time is indicated on the right. (B) Representations of data from (A) for the first
step (black), the step corresponding to T30, and the step corresponding to Tplateau.
A comparison of highest Vmax, T30. and Tplateau. for different F68 additive
concentrations are shown in Fig. 10. Compared to the 0.05% F68 case (which we have
used previously for DMF cell culture applications25-28), I observed that higher
concentrations of F68 allowed faster droplet movements and longer device lifetimes,
which was compatible with empirical experiences. While the highest Vmax plateaued at
approximately 0.09% F68, both the T30 curve and the Tplateau curve plateaued at

35
approximately 0.12% F68. Based on these results, it seems that 0.12% F68 is consistent
with the best device performance. As a counter-point, higher concentrations of pluronic
additive may be toxic to cells; this motivated a final set of preliminary experiments,
described below.
Fig. 10. Effects of varied F68 concentrations on droplet performance on DMF devices.

36
As a final method-optimization experiment, I conducted an Alamar blue
viability/proliferation test to evaluate potential toxicity of pluronic F68 on the cells used
in the assays described here. As shown in Figure 11, relative proliferation values were
observed and recorded for cells cultured in various concentrations of F68; the highest
concentration evaluated was 0.10% (as anecdotal evidence from previous work in the
lab suggested that 0.12% may have toxic effects on some cells), which is also the
concentration recommended by the supplier for cell culture. A two-way ANOVA test
was performed to analyze the effect of F68 concentration, and differences between F68
concentration on cell proliferation were found to be statistically insignificant (p =
0.1536). This indicated that the MDA-MB-231 cell line is compatible with the tested
range of F68, and that cell proliferation is independent of F68 concentration within this
range. From the assays above, I decided to use an F68 concentration of 0.10% for the
chemosensitivity experiments, described below.

37
Fig. 11. Effect of different F68 concentrations on MDA-MB-231 cell proliferation measured
by Alamar Blue Viability/Proliferation Assay. The groups contained 0 (black), 0.05% (red,
green), 0.075% (blue), and (0.10% (purple) F68 (w/v). One group (green) was supplemented
with 0.03% DMSO as a potential vehicle control for drugs that need to use DMSO vehicle.
Data correspond to a single trial with 1 technical replicate; error bars indicate ±1 SEM.
2.3.3 Drug response assays for 5-fluorouracil (5FU)
After optimizing the devices and operating conditions, I turned my attention to
evaluating the suitability of digital microfluidics for chemosensitivity testing. I first
tested the common anti-cancer model drug, 5-fluorouracil (5FU) in a cancer cell culture
system (MDA-MB-231) grown in 2D and 3D. As described in the methods section,
cells were cultured on DMF devices using the new laser-cut top plates and then exposed
to droplets containing different concentrations of drug. For 2D cell culture one confocal
image was collected for each virtual microwell; representative results are shown in
Figure 12. It is apparent that (as expected), at higher levels of drug, fewer cancer cells
are viable.
For 3D cell culture drug chemosensitivity assays, methods were developed to
culture MDA-MB-231 cells in thermally crosslinked collagen I gels. At the end point
of each assay, a z-stack of confocal images was collected for each condition.
Representative images for one such experiment (0 μM 5FU) are shown in Fig. 13A.
When combined into a 3D image (Fig. 13B), it is apparent that the cells were distributed
relatively evenly in a disk-like volume with a diameter of ~1200 μm and a height of
~300 μm. This is close to the designed dimensions of the laser cut microwell, so we can
38
conclude that the gel was formed as expected and did not show obvious damage or
distortion after 72 h incubation. This analysis was repeated for each concentration of
5FU for quantitative analysis.
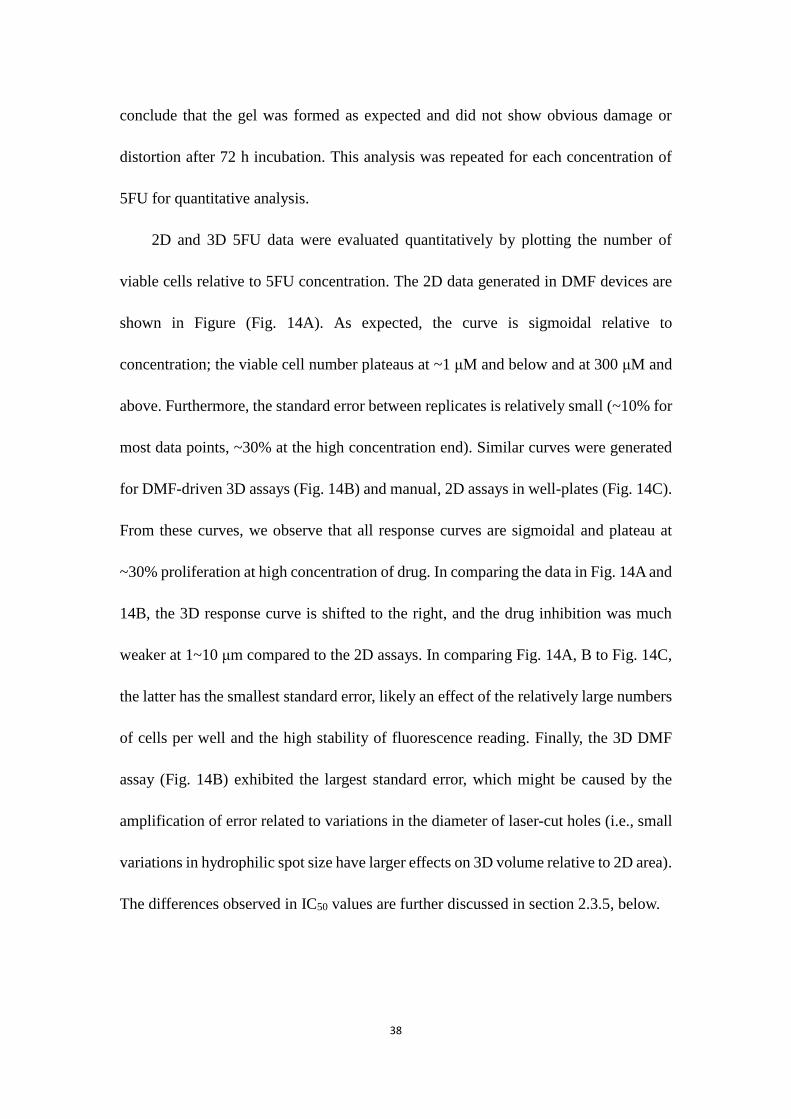
2D and 3D 5FU data were evaluated quantitatively by plotting the number of
viable cells relative to 5FU concentration. The 2D data generated in DMF devices are
shown in Figure (Fig. 14A). As expected, the curve is sigmoidal relative to
concentration; the viable cell number plateaus at ~1 μM and below and at 300 μM and
above. Furthermore, the standard error between replicates is relatively small (~10% for
most data points, ~30% at the high concentration end). Similar curves were generated
for DMF-driven 3D assays (Fig. 14B) and manual, 2D assays in well-plates (Fig. 14C).
From these curves, we observe that all response curves are sigmoidal and plateau at
~30% proliferation at high concentration of drug. In comparing the data in Fig. 14A and
14B, the 3D response curve is shifted to the right, and the drug inhibition was much
weaker at 1~10 μm compared to the 2D assays. In comparing Fig. 14A, B to Fig. 14C,
the latter has the smallest standard error, likely an effect of the relatively large numbers
of cells per well and the high stability of fluorescence reading. Finally, the 3D DMF
assay (Fig. 14B) exhibited the largest standard error, which might be caused by the
amplification of error related to variations in the diameter of laser-cut holes (i.e., small
variations in hydrophilic spot size have larger effects on 3D volume relative to 2D area).
The differences observed in IC50 values are further discussed in section 2.3.5, below.

39
Fig. 12. Representative confocal images of MDA-MB-231 cells (stained green with calcein-
AM) seeded into virtual microwells on laser-cut top plates and exposed to droplets of
different concentrations of 5-fluorouracil by DMF. Color intensities were individually
adjusted to ease cell identification.

40
Fig. 13. Representative confocal images of DMF-driven 3D cell culture chemosensitivity
assay. (A) Selected images (1 out of every 5) from a z-stack of untreated MDA-MB-231 cells
incubated within a thermally crosslinked collagen I microgel for 72 h and then stained with
calcein-AM. The height (z-dimension) measured from the bottom plate is labelled in red. (B)
A complete 3D image constructed from the z-stack used in (A) using the NIS-Elements
Viewer program. The dimensions of this construct are 1247×1247×300 (μm).

41
Fig. 14. 5-Fluorouracil response curves of MDA-MB-231 cells incubated in (A) 2D DMF
culture (calcein assay), (B) 3D DMF culture (calcein assay), and (C) 2D culture in well plates
(Alamar Blue assay), with IC50 values indicated in pink (error bars indicate ± 1 SEM). For
the calcein assays, viable cells were stained, counted and then compared to the untreated
control to yield the relative cell numbers. For Alamar blue assay, the solution fluorescence
signal was compared to that of the untreated control.
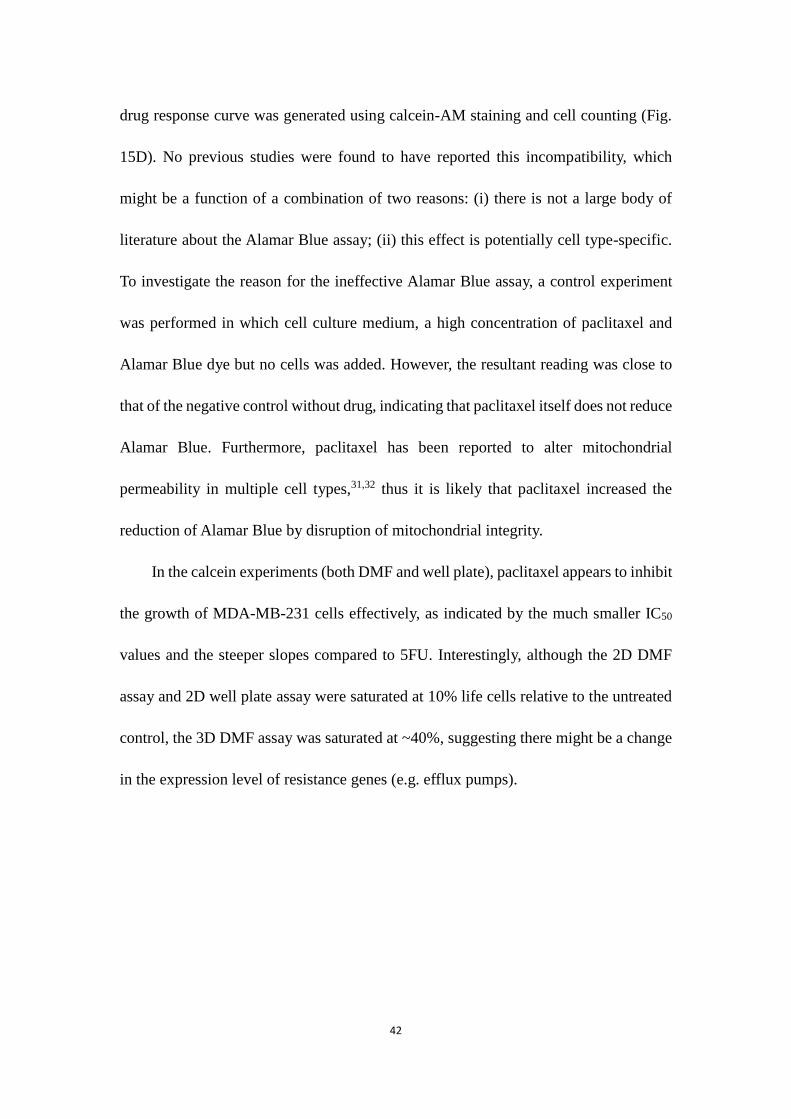
2.3.4 Drug response assays for paclitaxel
As was the case for 5-fluorouracil, sigmoidal drug response curves were obtained
from all paclitaxel experiments (Fig. 15). Interestingly, the Alamar Blue assay (Fig.
15C) appears to be incompatible with paclitaxel. Although the DMF calcein data (Fig.
15A & 15B) and microscope observation on the well plate verifies that high
concentrations of paclitaxel significantly reduce the viability of MDA-MB-231 cells,
in the Alamar Blue assay the fluorescence signal remained to be 70% of the untreated
control even at the highest concentration (Fig. 15C). Thus, another well plate-based
42
drug response curve was generated using calcein-AM staining and cell counting (Fig.
15D). No previous studies were found to have reported this incompatibility, which
might be a function of a combination of two reasons: (i) there is not a large body of
literature about the Alamar Blue assay; (ii) this effect is potentially cell type-specific.
To investigate the reason for the ineffective Alamar Blue assay, a control experiment
was performed in which cell culture medium, a high concentration of paclitaxel and
Alamar Blue dye but no cells was added. However, the resultant reading was close to
that of the negative control without drug, indicating that paclitaxel itself does not reduce
Alamar Blue. Furthermore, paclitaxel has been reported to alter mitochondrial
permeability in multiple cell types,31,32 thus it is likely that paclitaxel increased the
reduction of Alamar Blue by disruption of mitochondrial integrity.
In the calcein experiments (both DMF and well plate), paclitaxel appears to inhibit
the growth of MDA-MB-231 cells effectively, as indicated by the much smaller IC50
values and the steeper slopes compared to 5FU. Interestingly, although the 2D DMF
assay and 2D well plate assay were saturated at 10% life cells relative to the untreated
control, the 3D DMF assay was saturated at ~40%, suggesting there might be a change
in the expression level of resistance genes (e.g. efflux pumps).

43
Fig. 15. Paclitaxel response curves of MDA-MB-231 cells incubated in (A) 2D DMF culture
(calcein assay), (B) 3D DMF culture (calcein assay), (C) 2D culture in well plates (Alamar
Blue assay), and (D) 2D culture in well plates (calcein assay), with IC50 values (where
applicable) indicated in pink (error bars indicate ± 1 SEM). For the calcein assays, viable
cells were stained, counted and then compared to the untreated control to yield the relative
cell numbers. For Alamar Blue assay, the solution fluorescence signal was compared to that
of the untreated control.
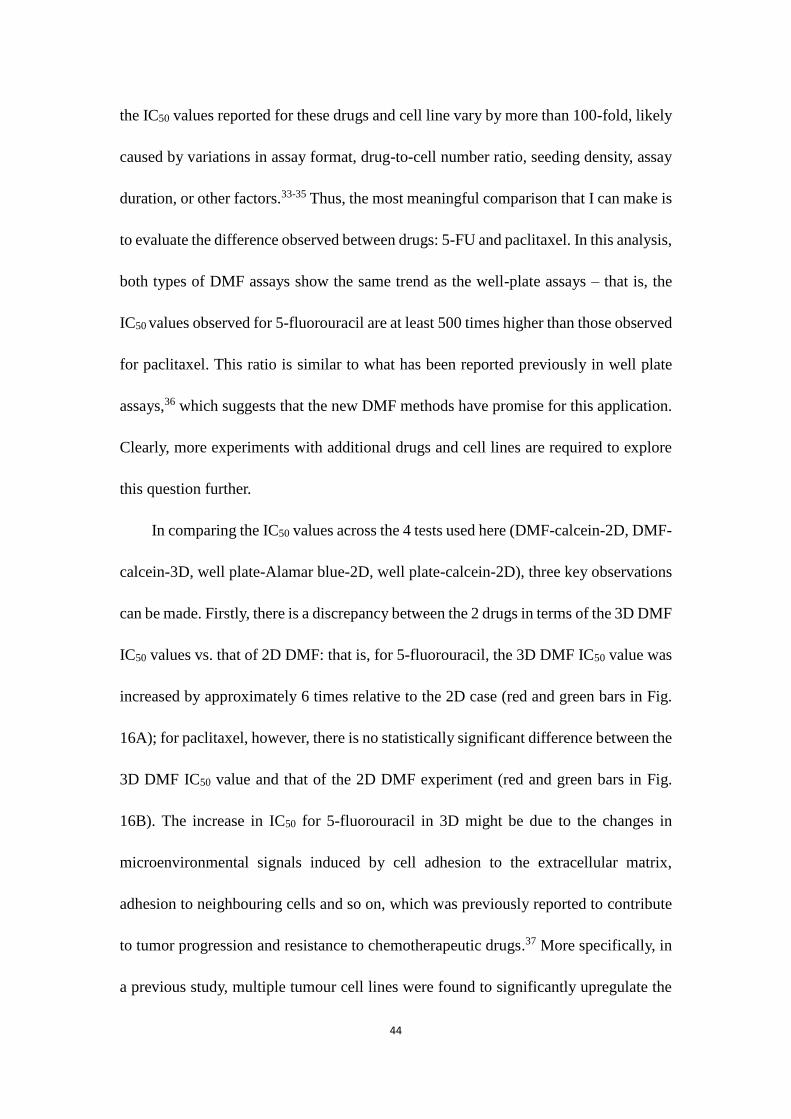
2.3.5 Comparison between IC50 values
The IC50 values determined in the experiments described above are summarized
in Fig. 16. As far as I am aware, these are the first chemosensitivity data ever generated
using digital microfluidics. In developing a new method (as is the case here, for the
DMF 2D and 3D assays), it is common to compare the results to established “gold
standard” values reported in the literature. But interestingly, upon close inspection of
the literature, I discovered that there are no “standard” IC50 values to be found; in fact,
44
the IC50 values reported for these drugs and cell line vary by more than 100-fold, likely
caused by variations in assay format, drug-to-cell number ratio, seeding density, assay
duration, or other factors.33-35 Thus, the most meaningful comparison that I can make is
to evaluate the difference observed between drugs: 5-FU and paclitaxel. In this analysis,
both types of DMF assays show the same trend as the well-plate assays – that is, the
IC50 values observed for 5-fluorouracil are at least 500 times higher than those observed
for paclitaxel. This ratio is similar to what has been reported previously in well plate
assays,36 which suggests that the new DMF methods have promise for this application.
Clearly, more experiments with additional drugs and cell lines are required to explore
this question further.
In comparing the IC50 values across the 4 tests used here (DMF-calcein-2D, DMF-
calcein-3D, well plate-Alamar blue-2D, well plate-calcein-2D), three key observations
can be made. Firstly, there is a discrepancy between the 2 drugs in terms of the 3D DMF
IC50 values vs. that of 2D DMF: that is, for 5-fluorouracil, the 3D DMF IC50 value was
increased by approximately 6 times relative to the 2D case (red and green bars in Fig.
16A); for paclitaxel, however, there is no statistically significant difference between the
3D DMF IC50 value and that of the 2D DMF experiment (red and green bars in Fig.
16B). The increase in IC50 for 5-fluorouracil in 3D might be due to the changes in
microenvironmental signals induced by cell adhesion to the extracellular matrix,
adhesion to neighbouring cells and so on, which was previously reported to contribute
to tumor progression and resistance to chemotherapeutic drugs.37 More specifically, in
a previous study, multiple tumour cell lines were found to significantly upregulate the
45
expression of ABC transporter genes (which are generally positively correlated with
drug resistance) in 3D cultures, which might explain the increase in IC50.38 However,
since 5-fluorouracil and paclitaxel drugs inhibit cell growth via distinct cellular
pathways (and are potentially influenced by different drug efflux pumps due to their
distinct chemical structure), it is reasonable that the change of culture mode may have
different influence on their functioning (i.e. causing different changes to their IC50).
A second observation from the data in Fig. 16, for the closest DMF-well plate
comparison that can be made – that is for the paclitaxel experiments (in which both 2D
DMF and 2D well plate experiments were performed using the same assay), the IC50
value observed for the 2D DMF assay is ~10 times higher that observed for the 2D well
plate assay. At first glance, this might suggest that DMF imparts some sort of protective
effect to the cells relative to standard (well plate) experiments; but a closer look
suggests that drug concentration might not be the most appropriate parameter to use for
this comparison. As shown in Table 4, although the drug concentrations are constant
between the conditions, the ratio of number of drug molecules (and all other molecules
in solution) to cells is quite different (30 times) between the two cases. For long
incubation times (e.g., 48 h, as used here), which allows sufficient time for molecules
to diffuse and for cells to “consume” these molecules, I propose that this ratio may be
more important than absolute concentration. Thus, in the future, I propose that it will
be important to run controls to test for this effect.
Finally, a third observation from the data in Fig. 16 is that the experiments carried
out for 5-FU were not complete. With more time, it would have been best to do a direct
46
comparison between the DMF calcein assay and a well-plate calcein assay (the only
well plate data collected relied on Alamar blue). Nevertheless, noting the caveat that
the two assays are different, it is interesting to note that the cells grown in well plates
exhibited a smaller IC50 than cells grown in 2D in DMF.
In summary, the data presented here are very preliminary. I have established that
it is possible to use DMF to carry out chemosensitivity assays, and in a tiny data set
(two drugs, one cell line), the established platform and methods appeared to generate
credible chemosensitivity curves. Furthermore, the data shows preliminary evidence
that the ratio of cell media (and drug) volume to cell number should be considered in
future experiments.
Fig. 16. Summary of IC50 values measured for (A) 5-fluorouracil and (B) paclitaxel for
MDA-MB-231 cells evaluated in 2D DMF format (green bars), 3D DMF format (red bars),
and 2D well plate format (blue bars). Error bars indicate ±1 SD. Note that the units of the
two graphs are different.

47
24-well Plate Assay 2D DMF Assay
Incubation Volume (μl) 750 0.43
Seeding density (cell/μl) 10 300
Seeding cell number 7500 129
𝐕𝐨𝐥𝐮𝐦𝐞
𝐂𝐞𝐥𝐥 𝐧𝐮𝐦𝐛𝐞𝐫 ratio 0.1 0.00333
Table 4. Comparison of the basic parameters in the 2D well plate assay and the 2D DMF
assay.
2.4 Conclusion
To summarize, in working towards the implementation of chemosensitivity assays
on digital microfluidic systems, I have developed a new DMF device architecture,
known as the laser-cut PET-ITO top plate. The fabrication and operation of devices
using these new parts were optimized for device performance and lifetime. I propose
that this system may be useful for a wide range of applications in my lab and beyond.
After developing the platform, the responses of one breast cancer cell line, MDA-MB-
231, to two chemotherapeutic drugs, 5-fluorouracil and paclitaxel, were measured for
both 2D culture and 3D culture, respectively, and we demonstrated the feasibility of the
platform to generate credible chemosensitivity curves. Furthermore, the data shows
preliminary evidence that the ratio of cell media (and drug) volume to cell number
should be considered in future experiments. In sum, this work represents the initial step
towards the establishment of a new chemosensitivity platform. To further evaluate the
validity of the methods established here, more experiments with extra
chemotherapeutic drugs, more cell lines and careful consideration of the volume-to-cell
number factor will be needed.

48
Chapter 4. Future Directions
The work descried in this thesis was motivated by an interest to determine whether
digital microfluidics is an appropriate technology to perform miniaturized, automated
chemosensitivity assays, perhaps with application (some day) to evaluation of patient-
specific samples for personalized approaches to cancer therapeutics. The results
described in this thesis are promising, but they represent the first of many steps towards
that goal. The next step of this work should focus on investigating a suite of
chemotherapeutic drugs (e.g. cisplatin, doxorubicin, gemcitabine, etc.) and multiple
cell types (e.g. additional breast cancer cell lines like MDA-MB-468, MCF-7, as well
as representative cancer types from other tissues, such as colorectal cancer, lung cancer,
etc.) to fully validate results relative to gold-standard tests in well plates. This will allow
validation of the new platform by the overall chemosensitivity profile (i.e. the relative
effectiveness among a set of drugs), instead of simply comparing the IC50 values
obtained from distinct platforms or settings, which is not necessarily reliable.33-35 This
approach should ultimately be convincing; from the preliminary experiments described
here, I am optimistic about the prospects.
Once validated, there are at least three aspects of long-term goals to consider for
this project:
4.1 Automated high-throughput chemosensitivity
measurement
In the current experimental setup, there are 8 microwells on a DMF chip, which
49
means we can test 8 conditions at the same time, or 4 conditions in duplicates. In the
future, building from the ever-expanding capabilities of DropBot
(http://microfluidics.utoronto.ca/dropbot), devices should be designed to scale up for16
or 24 wells by designing more liftoff spots or laser cut wells on the top plate. It may
even be possible to redesign the electrode patterns in the bottom plate so that we can
test up to ~20 conditions with 2 or 3 replicates simultaneously, without making changes
to the instrumentation. With this type of high throughput, in addition to the platform’s
intrinsic capability of automation, we would be able to quickly and easily determine
chemosensitivity of the drug(s) of interest, making this technique useful in drug
screening.
4.2 Establishment of 3D tumor co-culture models
Another aspect of future application would be to further explore the potential of
DMF platform in the establishment of 3D tumor co-culture models that better
recapitulate the in vivo tumors. In a previous study, a hydrogel-based liver microtissue
was established on the DMF platform for hepatoxicity screening.39 Notably, the authors
found that the liver cell line HepG2 exhibited a fibroblast-dependent contractile
behavior. The HepG2 cells were found to be distributed throughout the hydrogel in
monocultures, but would contract to form solid aggregations called hepatic organoids
when co-cultured with a fibroblast cell line. Interestingly, both their albumin secretion
profiles and cytochrome P450 3A4 activities of hepatic organoids mimicked that of in

50
vivo liver tissue better than comparable two-dimensional cell culture systems. It would
be interesting to try using the more advanced device architectures and methods
described here for similar applications, to establish co-culture systems of tumor cells
with corresponding stromal cells, epithelial cells and/or endothelial cells, etc.
embedded in microgels on DMF devices, making an even better prediction of tumor
chemosensitivity. If such system can be successfully established, it will have additional
advantages including minimal reagent consumption, minimal sample requirement, ease
of automation and so forth.
4.3 Application to human samples for personalized
medicine
Due to the diversity of cancers, cancer patients show highly diverse responses to
the same chemotherapeutic agents, which necessitates the personalization of
chemotherapy regimens. Currently, the two major approaches to personalized
chemotherapy, xenograft chemosensitivity testing and cancer genomics, are limited by
long experiment durations and lack of universality, respectively.
Since DMF is more compatible with samples of small volume (e.g. <= 1~2 μl) or
low cell abundance (e.g. dozens to hundreds of cells in total) compared to many other
microfluidic platforms, considering the large number of drug candidates and the
relatively small volume of (typical) patient-derived samples, it would be worth
exploring the potential of DMF in direct chemosensitivity testing on patient-derived

51
samples. However, it is also worth noting that considering the high intra-tumour
heterogeneity, a sample that contain too few cells might fail to represent the
chemosensitivity of the tumour properly. Therefore, a preliminary test for the minimal
functional sample size might be necessary. A potential solution would be to first
chemically or enzymatically purify cells of interest (cancer cells and perhaps stromal
cells, as performed by Pak et al. 18), and then use the above established methods to
perform on-chip chemosensitivity testing. Although changes to the method might be
necessary (e.g. introducing tumour-specific fluorescent antibodies to distinguish
stromal cells), given the ease and the high degree of freedom in on-demand formation
of microgels in DMF, such approaches appears promising.
52
References
1 Blumenthal, R. D. & Goldenberg, D. M. Methods and goals for the use of in vitro and in vivo
chemosensitivity testing. Molecular biotechnology 35, 185-197 (2007).
2 Mirzayans, R., Andrais, B., Scott, A., Tessier, A. & Murray, D. A sensitive assay for the
evaluation of cytotoxicity and its pharmacologic modulation in human solid tumor-derived
cell lines exposed to cancer-therapeutic agents. J Pharm Pharm Sci 10 (2007).
3 Valiathan, C., McFaline, J. L. & Samson, L. D. A rapid survival assay to measure drug-induced
cytotoxicity and cell cycle effects. DNA repair 11, 92-98 (2012).
4 Franken, N. A., Rodermond, H. M., Stap, J., Haveman, J. & Van Bree, C. Clonogenic assay of
cells in vitro. Nature protocols 1, 2315-2319 (2006).
5 Roper, P. R. & Drewinko, B. Comparison of in vitro methods to determine drug-induced cell
lethality. Cancer research 36, 2182-2188 (1976).
6 Choi, K., Ng, A. H., Fobel, R. & Wheeler, A. R. Digital microfluidics. Annual review of analytical
chemistry 5, 413-440 (2012).
7 Malic, L., Brassard, D., Veres, T. & Tabrizian, M. Integration and detection of biochemical
assays in digital microfluidic LOC devices. Lab Chip 10, 418-431 (2010).
8 Boyd, M. R. in Anticancer Drug Development Guide 23-42 (Springer, 1997).
9 Edmondson, R., Broglie, J. J., Adcock, A. F. & Yang, L. Three-dimensional cell culture systems
and their applications in drug discovery and cell-based biosensors. Assay and drug
development technologies 12, 207-218 (2014).
10 Marx, U. & Sandig, V. Drug testing in vitro: breakthroughs and trends in cell culture
technology. (John Wiley & Sons, 2007).
11 Gillet, J.-P., Varma, S. & Gottesman, M. M. The clinical relevance of cancer cell lines. Journal
of the National Cancer Institute 105, 452-458 (2013).
12 Daenen, L. G. M. Host-Mediated Mechanisms of Resistance to Antitumor Therapies.
(Utrecht University, 2013).
13 Cukierman, E., Pankov, R. & Yamada, K. M. Cell interactions with three-dimensional matrices.
Current opinion in cell biology 14, 633-640 (2002).
14 Pampaloni, F., Reynaud, E. G. & Stelzer, E. H. The third dimension bridges the gap between
cell culture and live tissue. Nature reviews Molecular cell biology 8, 839-845 (2007).
15 Kenny, P. A. et al. The morphologies of breast cancer cell lines in three-dimensional assays
correlate with their profiles of gene expression. Molecular oncology 1, 84-96 (2007).
16 Lee, J. M. et al. A three-dimensional microenvironment alters protein expression and
chemosensitivity of epithelial ovarian cancer cells in vitro. Laboratory investigation 93, 528-
542 (2013).
17 Benton, G., DeGray, G., Kleinman, H. K., George, J. & Arnaoutova, I. In vitro microtumors
provide a physiologically predictive tool for breast cancer therapeutic screening. PloS one 10,
e0123312 (2015).
18 Pak, C. et al. MicroC 3: an ex vivo microfluidic cis-coculture assay to test chemosensitivity and
resistance of patient multiple myeloma cells. Integrative Biology 7, 643-654 (2015).
19 Astolfi, M. et al. Micro-dissected tumor tissues on chip: an ex vivo method for drug testing
and personalized therapy. Lab Chip 16, 312-325 (2016).

53
20 Das, T. et al. Empirical chemosensitivity testing in a spheroid model of ovarian cancer using a
microfluidics-based multiplex platform. Biomicrofluidics 7, 011805 (2013).
21 Ruppen, J. et al. Towards personalized medicine: chemosensitivity assays of patient lung
cancer cell spheroids in a perfused microfluidic platform. Lab Chip 15, 3076-3085 (2015).
22 Barbulovic-Nad, I., Au, S. H. & Wheeler, A. R. A microfluidic platform for complete
mammalian cell culture. Lab Chip 10, -1536-1542, doi:10.1039/c002147d (2010).
23 Srigunapalan, S., Eydelnant, I. A., Simmons, C. A. & Wheeler, A. R. A digital microfluidic
platform for primary cell culture and analysis. Lab Chip 12, 369-375, doi:10.1039/c1lc20844f
(2012).
24 Fiddes, L. K. et al. Hydrogel discs for digital microfluidics. Biomicrofluidics 6, doi:014112
10.1063/1.3687381 (2012).
25 Eydelnant, I. A., Betty Li, B. & Wheeler, A. R. Microgels on-demand. Nature communications
5, 3355 (2014).
26 Au, S. H., Fobel, R., Desai, S. P., Voldman, J. & Wheeler, A. R. Cellular bias on the microscale:
probing the effects of digital microfluidic actuation on mammalian cell health, fitness and
phenotype. Integrative Biology 5, 1014-1025 (2013).
27 Ng, A. H. C., Dean Chamberlain, M., Situ, H., Lee, V. & Wheeler, A. R. Digital microfluidic
immunocytochemistry in single cells. Nature communications 6, doi:10.1038/ncomms8513
(2015).
28 Barbulovic-Nad, I., Yang, H., Park, P. S. & Wheeler, A. R. Digital microfluidics for cell-based
assays. Lab Chip 8, 519-526 (2008).
29 Otsu, N. A threshold selection method from gray-level histograms. Automatica 11, 23-27
(1975).
30 Au, S. H., Kumar, P. & Wheeler, A. R. A new angle on pluronic additives: advancing droplets
and understanding in digital microfluidics. Langmuir 27, 8586-8594 (2011).
31 André, N. et al. Paclitaxel induces release of cytochrome c from mitochondria isolated from
human neuroblastoma cells. Cancer research 60, 5349-5353 (2000).
32 Carré, M. et al. Tubulin is an inherent component of mitochondrial membranes that interacts
with the voltage-dependent anion channel. Journal of Biological Chemistry 277, 33664-33669
(2002).
33 Qu, C. et al. Metformin reverses multidrug resistance and epithelial–mesenchymal transition
(EMT) via activating AMP-activated protein kinase (AMPK) in human breast cancer cells.
Molecular and cellular biochemistry 386, 63-71 (2014).
34 Ciocca, D. R. et al. Response of human breast cancer cells to heat shock and
chemotherapeutic drugs. Cancer research 52, 3648-3654 (1992).
35 Wang, H. et al. Circulating MiR-125b as a marker predicting chemoresistance in breast cancer.
PloS one 7, e34210 (2012).
36 Takahashi, K. et al. Establishment of a 5-fluorouracil-resistant triple-negative breast cancer
cell line. International journal of oncology 43, 1985-1991 (2013).
37 Storch, K. & Cordes, N. Focal adhesion-chromatin linkage controls tumor cell resistance to
radio-and chemotherapy. Chemotherapy research and practice 2012 (2012).
38 Bai, C. et al. Associations of chemo-and radio-resistant phenotypes with the gap junction,
adhesion and extracellular matrix in a three-dimensional culture model of soft sarcoma.
Journal of Experimental & Clinical Cancer Research 34, 1 (2015).

54
39 Au, S. H., Chamberlain, M. D., Mahesh, S., Sefton, M. V. & Wheeler, A. R. Hepatic organoids
for microfluidic drug screening. Lab Chip 14, 3290-3299 (2014).


![Microfluidics-NEW [Compatibility Mode]](https://static.fdocuments.net/doc/165x107/577cdf401a28ab9e78b0c9a6/microfluidics-new-compatibility-mode.jpg)