DEVELOPMENT OF COST-EFFECTIVE VARTM TECHNOLOGY FOR …
194
i DEVELOPMENT OF COST-EFFECTIVE VARTM TECHNOLOGY FOR REPAIR AND HARDENING DESIGN METHOD AND SPECIFICATIONS FOR ALDOT CONTRACTOR PHASE 3 By Dr. Nasim Uddin and Mr. Luis Ramos Department of Civil and Environmental Engineering And Dr. Uday Vaidya Department of Materials Science & Engineering The University of Alabama at Birmingham Birmingham, AL 35294 Prepared for ALDOT Report 930-607B April 2013
Transcript of DEVELOPMENT OF COST-EFFECTIVE VARTM TECHNOLOGY FOR …
i
DEVELOPMENT OF COST-EFFECTIVE VARTM TECHNOLOGY
FOR REPAIR AND HARDENING
DESIGN METHOD AND SPECIFICATIONS FOR ALDOT CONTRACTOR
PHASE 3
By
Dr. Nasim Uddin and Mr. Luis Ramos
Department of Civil and Environmental Engineering
And
Dr. Uday Vaidya
Department of Materials Science & Engineering
The University of Alabama at Birmingham
Birmingham, AL 35294
Prepared for
ALDOT Report 930-607B
April 2013

Technical Report Documentation Page 1. Report No. 2. Government Accession No.
3. Recipient's Catalog No.
4. Title and Subtitle
DEVELOPMENT OF COST-EFFECTIVE VARTM TECHNOLOGY
FOR REPAIR AND HARDENING – DESIGN METHOD AND
SPECIFICATIONS FOR ALDOT CONTRACTOR: PHASE 3
5. Report Date
April 9, 2013
6. Performing Organization Code
7. Author(s)
Dr. Nasim Uddin, Dr. Uday Vaidya, and Luis Ramos 8. Performing Organization Report No.
ALDOT Research Project 930-607B
9. Performing Organization Name and Address
Department of Civil and Environmental Engineering & Department of
Materials Science and Engineering
The University of Alabama at Birmingham
Birmingham, AL 35294
10. Work Unit No. (TRAIS)
11. Contract or Grant No.
ALDOT Research Project 930-607B
12. Sponsoring Agency Name and Address
Alabama Department of Transportation, 1409 Coliseum Boulevard
P.O. Box 303050 Montgomery, Alabama 36130-3050
13. Type of Report and Period Covered
Final Report Aug. 2009- April 2013
14. Sponsoring Agency Code
15. Supplementary Note
16. Abstract Resin infusion, a method of fabricating fiber reinforced polymer (FRP), has been shown to produce a stronger FRP of
more consistent quality than other methods. It is a preferred method of fabrication in industries like automotive,
aerospace, and boat building. In infrastructure, however, FRP is commonly applied by the hand layup method. Hand
layup produces FRP of questionable quality. Vacuum Assisted Resin Transfer Molding (VARTM), a form of resin
infusion, can be used to apply externally bonded FRP to infrastructure to increase structural capacity. Based on
experience and knowledge in other industries, VARTM is expected to produce a better FRP than that currently used
in infrastructure. This report aims to facilitate the transfer of a proven technology for the benefit of this industry.
This report highlights VARTM’s benefits compared to hand layup for infrastructure applications. Shear and flexural
strength and strain are tested and compared to verify the assumption that VARTM can produce a better FRP. FRP
durability is one of the main areas where further research is needed for externally bonded FRP. This report does a
thorough analysis of the performance of both VARTM and hand layup FRP durability. Temperature and humidity
have been identified as the principal drivers of environmental degradation. Accelerated conditioning protocols
(ACP) for both temperature extremes are applied.
Having analyzed VARTM FRP strength and durability, this research will also test a modification to improve the
VARTM application process on concrete structures. Grooves sawed into concrete are believed to be able to
accelerate the VARTM application time without diminishing the capacity of the final product. Both of these
assumptions are tested and verified. Having proven VARTM performance and having found a way to improve the
original application process, it is hoped that this research has facilitated the implementation of VARTM FRP.
17. Key Word
VARTM, hand layup, epoxy, carbon fiber, FRP, CFRP,
repair, rehabilitation, strengthening, durability.
18. Distribution Statement
19. Security Classification (of this report)
20. Security Classification (of this page)
21. No. of Pages
193 22. Price
Form DOT F 1700.7 (8-72) Reproduction of completed page authorized

i
TABLE OF CONTENTS
Page
LIST OF TABLES ............................................................................................................. iv
LIST OF FIGURES .............................................................................................................v
LIST OF ABBREVIATIONS .......................................................................................... viii
EXECUTIVE SUMMARY .................................................................................................1
INTRODUCTION ...............................................................................................................3
Need for Rehabilitation ............................................................................................3
Why Use of FRP over Traditional Materials? .........................................................3
VARTM Compared to Hand Layup ........................................................................4
The Importance of Resin Application ......................................................................5
State of the Art of FRP.............................................................................................6
Research Objectives .................................................................................................6
Manuscript Organization .........................................................................................7
STRENGTHENING OF RC BEAMS WITH FRP APPLIED BY VACUUM ASSISTED
RESIN TRANSFER MOLDING (VARTM).......................................................................9
Abstract ..................................................................................................................10
Introduction ............................................................................................................11
Materials and Specimens .......................................................................................13
FRP Application.....................................................................................................16
Test Program ..........................................................................................................17
Test Results ............................................................................................................18
Flexural Beam Test Result Interpretation ..............................................................20
Shear Beam Test Result Interpretation ..................................................................23
Conclusions ............................................................................................................26
Acknowledgments..................................................................................................27
References ..............................................................................................................28

ii
BENEFITS OF GROOVING ON VACUUM ASSISTED RESIN TRANSFER
MOLDING (VARTM) FRP WET-OUT OF RC BEAMS ................................................32
Abstract ..................................................................................................................33
Introduction ............................................................................................................34
Materials and Specimens .......................................................................................38
VARTM Application Method ................................................................................39
Test Program ..........................................................................................................40
Results and Discussion ..........................................................................................42
Conclusions ............................................................................................................46
Acknowledgements ................................................................................................47
Notations ................................................................................................................47
References ..............................................................................................................48
BENEFITS OF GROOVING ON VACUUM ASSISTED RESIN TRANSFER
MOLDING (VARTM) FRP STRENGTHENING OF RC BEAMS .................................52
Abstract ..................................................................................................................53
Introduction ............................................................................................................54
Materials and Specimens .......................................................................................57
VARTM Application Method ................................................................................59
Test Program ..........................................................................................................60
Results and Discussion ..........................................................................................62
Conclusions ............................................................................................................67
Acknowledgements and Role of the Funding Source ............................................68
References ..............................................................................................................69
DURABILITY OF VACUUM ASSISTED RESIN TRANSFER MOLDING (VARTM)
FRP ON CONCRETE PRISMS ........................................................................................72
Abstract ..................................................................................................................73
Introduction ............................................................................................................74
Materials and Specimens .......................................................................................77
Application Methods ..............................................................................................79
Test Program ..........................................................................................................81
Results and Discussion ..........................................................................................85
Conclusions ............................................................................................................89
Acknowledgements ................................................................................................90
References ..............................................................................................................91

iii
CONCLUSIONS................................................................................................................97
Contributions to the State of the Art ......................................................................98
Recommendations for Future Studies ..................................................................100
Status of Submissions ..........................................................................................101
ACKNOWLEDGEMENTS .............................................................................................102
REFERENCES ................................................................................................................103
APPENDIX A ..................................................................................................................110
APPENDIX B ..................................................................................................................111

iv
LIST OF TABLES
Table Page
STRENGTHENING OF RC BEAMS WITH FRP APPLIED BY VACUUM
ASSISTED RESIN TRANSFER MOLDING (VARTM)
1 Summary of Flexural Beam Capacities .................................................... 19
2 Summary of Shear Beam Capacities ......................................................... 20
BENEFITS OF GROOVING ON VACUUM ASSISTED RESIN TRANSFER
MOLDING (VARTM) FRP WET-OUT OF RC BEAMS
1 Estimated Range of True Average Time for 95% Wet-Out ..................... 45
BENEFITS OF GROOVING ON VACUUM ASSISTED RESIN TRANSFER
MOLDING (VARTM) FRP STRENGTHENING OF RC BEAMS
1 Summary of Theoretical and Actual Capacities ....................................... 67
2 Estimated Range of True Average Ultimate Strengths ............................. 67
DURABILITY OF VACUUM ASSISTED RESIN TRANSFER MOLDING
(VARTM) FRP ON CONCRETE PRISMS
1 Material Properties .................................................................................... 78
2 Residual Mechanical Properties ................................................................ 89

v
LIST OF FIGURES
Figure Page
STRENGTHENING OF RC BEAMS WITH FRP APPLIED BY VACUUM
ASSISTED RESIN TRANSFER MOLDING (VARTM)
1 Flexural Beam Section .......................................................................................... 13
2 Shear Beam Section .............................................................................................. 14
3 Flexural Beam FRP (Bottom Face)....................................................................... 14
4 Shear Beam FRP (Side) ........................................................................................ 15
5 VARTM Method Configuration ........................................................................... 17
6 Beam Support and Load Configuration ................................................................ 17
7 Flexural Beam Load vs. Deflection, Best-fit Line ................................................ 19
8 Shear Beams, Load vs. Deflection, Best-fit Line .................................................. 20
9 Flexural Control Beam .......................................................................................... 21
10 Flexural Hand Layup Beam .................................................................................. 22
11 Flexural VARTM Beam ....................................................................................... 23
12 Shear Control Beam .............................................................................................. 24
13 Shear Hand Layup Beam ...................................................................................... 25
14 Shear VARTM Beam ............................................................................................ 26
BENEFITS OF GROOVING ON VACUUM ASSISTED RESIN TRANSFER
MOLDING (VARTM) FRP WET-OUT OF RC BEAMS
1 Beam Dimensions ................................................................................................. 38
2 Groove Dimensions .............................................................................................. 38

vi
3 VARTM Method Configuration ........................................................................... 40
4 VARTM, Beam 1 with 3.2 mm Grooves, 30 sec .................................................. 41
5 VARTM, Beam 1 with 3.2 mm Grooves, 60 sec .................................................. 41
6 VARTM, Beam 1 with 3.2 mm Grooves, 90 sec .................................................. 41
7 VARTM, Beam 1 with 3.2 mm Grooves, 120 sec ................................................ 42
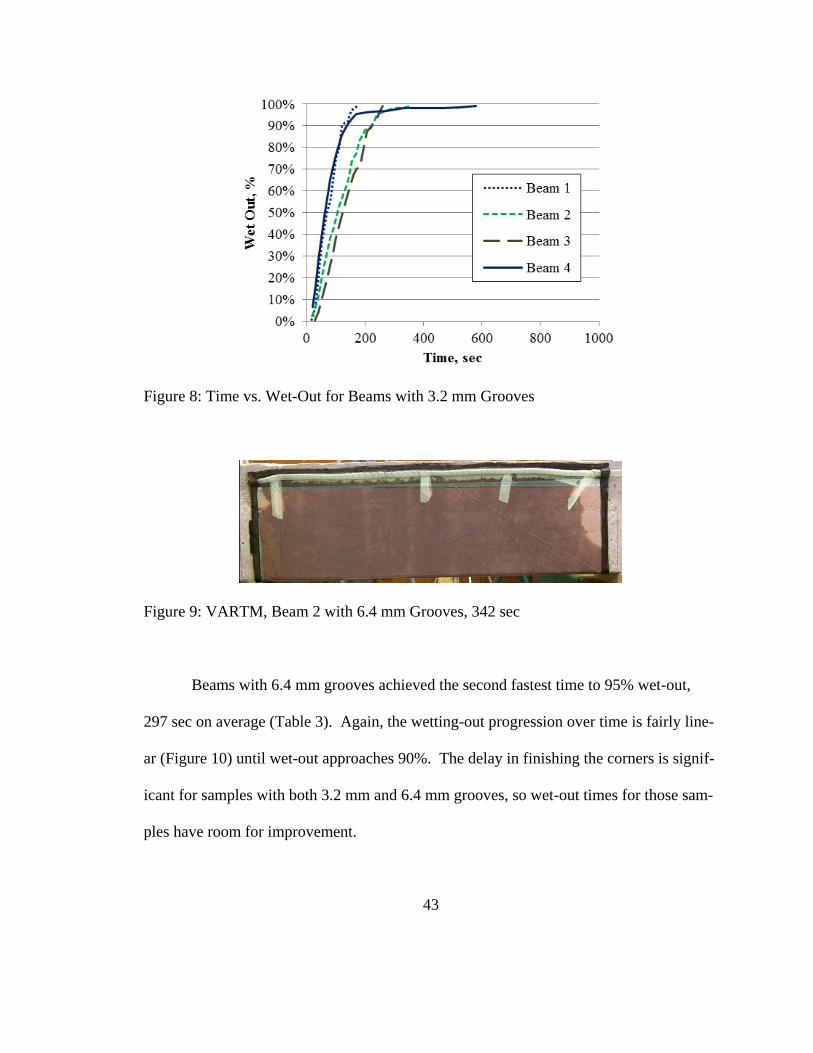
8 Time vs. Wet-Out for Beams with 3.2 mm Grooves ............................................ 43
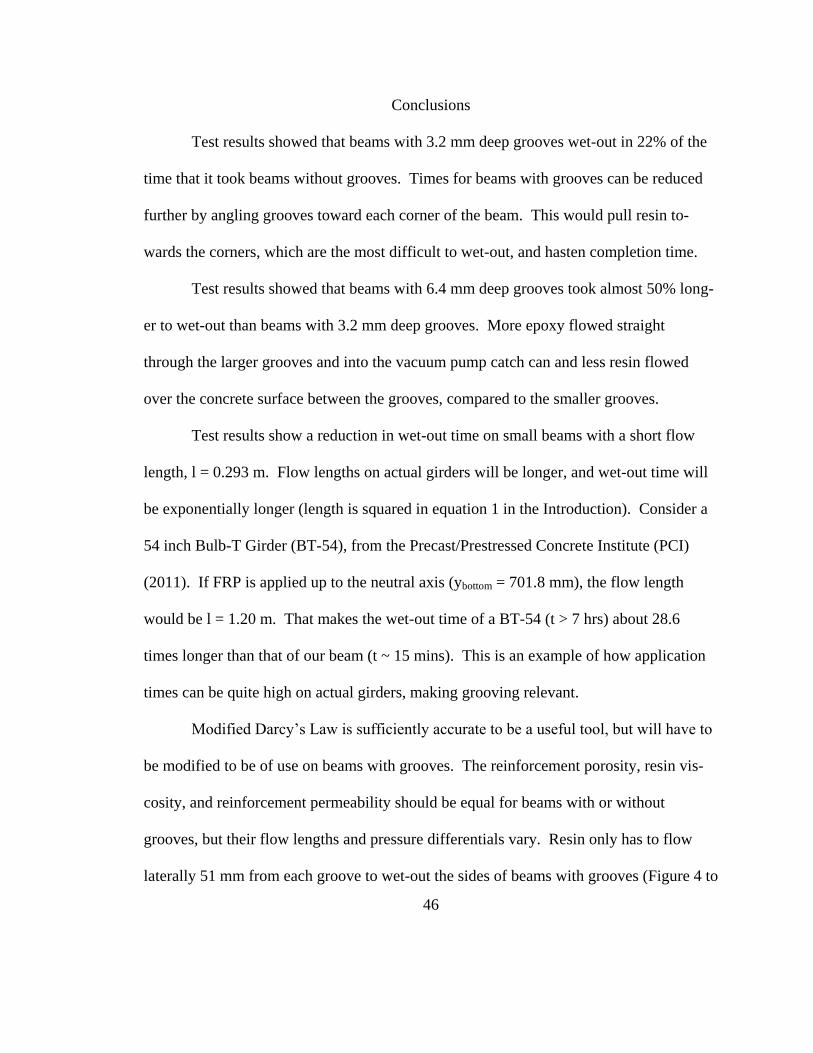
9 VARTM, Beam 2 with 6.4 mm Grooves, 342 sec ................................................ 43
10 Time vs. Wet-Out for Beams with 6.4 mm Grooves ............................................ 44
11 Time vs. Wet-Out for Beams without Grooves .................................................... 45
BENEFITS OF GROOVING ON VACUUM ASSISTED RESIN TRANSFER
MOLD-ING (VARTM) FRP STRENGTHENING OF RC BEAMS
1 Wet Out vs Time of Beams with and without Grooves (Ramos, et al. [18]) ........ 56
2 Beam Dimensions ................................................................................................. 59
3 Groove Dimensions .............................................................................................. 59
4 VARTM Method Configuration ........................................................................... 60
5 Loading Configuration .......................................................................................... 61
6 Strain Gauge Configuration .................................................................................. 62
7 254 mm Deep Beams ............................................................................................ 64
8 254 mm Deep Beam, B2, No Grooves, after Failure ............................................ 64
9 279 mm Deep Beams ............................................................................................ 66
10 279 mm Deep Beam, B1, No Grooves, after Failure ............................................ 66
DURABILITY OF VACUUM ASSISTED RESIN TRANSFER MOLDING (VARTM)
FRP ON CONCRETE PRISMS
1 Specimen Elevation .............................................................................................. 78

vii
2 Specimen Section .................................................................................................. 79
3 VARTM Configuration ......................................................................................... 80
4 Strain Gage Placement .......................................................................................... 83
5 Strength Test Configuration .................................................................................. 84
6 Strength Test - Deflectometer ............................................................................... 85
7 Strength Test - Typical Break ............................................................................... 86
8 Freeze-Thaw Specimen Load Tests ...................................................................... 88
9 Hygrothermal Specimen Load Tests ..................................................................... 88

viii
LIST OF ABBREVIATIONS
ACI American Concrete Institute
ACP accelerated conditioning protocol
ALDOT Alabama Department of Transportation
ASCE American Society of Civil Engineers
ASTM American Society for Testing and Materials
CSP concrete surface profile
CTE coefficient of thermal expansion
DOT Department of Transportation
FEM finite element method
FHWA Federal Highway Administration
FRP fiber reinforced polymer
IC intermediate crack
ICRI International Concrete Repair Institute
NCHRP National Cooperative Highway Research Program
PT prestressing steel
RC reinforced concrete
VARTM vacuum assisted resin transfer molding
VOC volatile organic compound
W/C water to cement ratio

1
EXECUTIVE SUMMARY
Resin infusion, a method of fabricating fiber reinforced polymer (FRP), has been
shown to produce a stronger FRP of more consistent quality than other methods. It is a
preferred method of fabrication in industries like automotive, aerospace, and boat build-
ing. In infrastructure, however, FRP is commonly applied by the hand layup method.
Hand layup is known to produce FRP of questionable quality.
Vacuum Assisted Resin Transfer Molding (VARTM), a form of resin infusion,
can be used to apply externally bonded FRP to infrastructure to increase structural ca-
pacity. Based on experience and knowledge in other industries, VARTM is expected to
produce a better FRP than that currently used in infrastructure. This body of work aims
to facilitate the transfer of a proven technology for the benefit of this industry.
Lack of knowledge about VARTM in infrastructure is an impediment to the adop-
tion of an application method which could produce a better final product. This research
sets out to determine VARTM’s benefits or drawbacks compared to hand layup for infra-
structure applications. Shear and flexural ultimate strength and ultimate strain are tested
and compared to verify the assumption that VARTM can produce a better FRP.
Gap analysis, including that of the American Concrete Institute (ACI) 440R, has
identified FRP durability as one of the main areas where further research is needed for
externally bonded FRP. This research does a thorough analysis of the performance of

2
both VARTM and hand layup FRP durability. Temperature and humidity have been
identified as the principal drivers of environmental degradation. Accelerated condition-
ing protocols (ACP) for both temperature extremes are applied.
Having analyzed VARTM FRP strength and durability, this research will also test
a modification to improve the VARTM application process on concrete structures.
Grooves sawed into concrete are believed to be able to accelerate the VARTM applica-
tion time without diminishing the capacity of the final product. Both of these assump-
tions are tested and verified.
Having proven VARTM performance and having found a way to improve the
original application process, it is hoped that this research has facilitated the implementa-
tion of VARTM FRP.

3
INTRODUCTION
Need for Rehabilitation
Infrastructure in the United States (US) is aging, making the need to improve the
methods of bridge repair and rehabilitation a priority. According to the American Society
of Civil Engineers (ASCE), the average age of bridges in this country is 43 years and
most were designed to last 50 years (ASCE 2009). ASCE estimates that we will have
$930 billion of infrastructure investment needs over the next five years, but estimates that
only $380.5 billion will be available as funds (ASCE 2009). The age of bridges in the
US and lack of funds make the strength of repairs and their durability important consider-
ations when considering the benefit and life cycle cost of a repair.
This demand has led to a recent rapid growth in use of externally applied fiber re-
inforced polymer (FRP) for bridge repair and rehabilitation. The number of projects
worldwide using externally bonded FRP has grown from a few in the mid 1980’s to thou-
sands in 2008 (ACI 2008).
Why Use of FRP over Traditional Materials?
FRP stands out over traditional materials for its high strength-to-weight ratio.
Many traditional methods of rehabilitation use steel or concrete, which add weight and
reduce the net gain in capacity of the structure. Weight is especially critical in seismic
areas, where additional mass causes greater damage to a structure during a seismic event.

4
The traditional methods that add the most weight tend to be the least expensive. Project
priorities must be evaluated individually.
There are many methods used to rehabilitate bridges, including the attachment of
steel plates, enlargement of the current section with concrete, addition of external pre-
stressing (PT) stressed by post-tensioning, and drilling in of additional steel reinforce-
ment. Traditional methods have the benefit of using materials that are common in the
construction industry and can be applied by well-known means. One drawback of these
methods is that they tend to require heavy construction equipment. Equipment can cause
closures of lanes on or below a bridge and access to some areas can be difficult.
VARTM Compared to Hand Layup
Despite increasing adoption, little has been done to improve the FRP application
process. FRP in infrastructure is commonly applied by the hand layup method. Hand
layup is labor intensive and the quality of the final product is sensitive to environmental
conditions and the skill of the installer. Hand layup may be cost effective and easy to ap-
ply, but it creates an FRP that is variable and could contain defects (Delaney 2006).
Hand layup makes it difficult to achieve a uniform wet-out free of pools or voids and a
good fiber compaction without excessive wrinkling (Karbhari 2001).
VARTM is a novel method, relatively unknown in infrastructure rehabilitation.
VARTM shows promise because it eliminates many of the variables that diminish the
quality of hand layup FRP. Resin infusion is capable of achieving uniformity, good fab-
ric compaction, and less unintended deformation (Karbhari 2001). While neither pro-
cess is foolproof, resin infusion is more consistent.

5
The Importance of Resin Application
The key difference in VARTM and hand layup is in how the resin is applied and
how that will affect the final product. There is a general agreement that resin application
is an important factor for the strength and durability of FRP. It is critical that an appro-
priate thickness of resin-rich surface exist (Karbhari 2003) because the resin serves as a
protective layer (ACI 2012). It protects the FRP and may also protect the concrete un-
derneath (Cromwell, et al. 2011). Resin application is also paramount to the FRP bond to
concrete, which is a limiting factor in FRP strength.
Hand layup has been found to result in an inconsistent application of resin. Hand
layup inherently bears the potential for non-uniform wet-out of the fabric (Karbhari
2001). Recent tests found that specimens created by hand layup were not uniform and
produced test results with a high standard deviation (Li, et al. 2012). During the fabrica-
tion of hand layup specimens for these tests, resin-rich areas, bubbles, and other incon-
sistencies are observed. Correcting these defects holds the risk of wrinkling the fiber,
which creates a weakness.
Resin infusion, on the other hand, is capable of achieving uniformity, good fabric
compaction, and less unintended deformation (Karbhari 2001). VARTM has been inves-
tigated and found to develop a more homogenous interface (Uddin 2008). During the
fabrication of VARTM specimens for these tests, the resin is observed creating a thor-
ough resin-to-filament bond without disturbing the fabric. Bubbles are pulled from the
FRP by the vacuum before the resin sets. The wet-out quality that VARTM can achieve
could give FRP greater strength and a more consistent protective surface.

6
A recent study demonstrates that preformed FRP has a clear advantage over hand
layup FRP in durability (Cromwell, et al. 2011). Cromwell points out that manufactured
materials had the advantage of quality control over hand layup and the advantage of
manufactured materials should not be surprising. Preformed FRP can be difficult to con-
form to girders in the field; especially around sectional transitions, diaphragms, inserts,
and other irregularities. Because of this drawback, preformed laminates are not consid-
ered for these tests. VARTM may have the inherent advantage of a manufactured prod-
uct with the flexibility of application.
State of the Art of FRP
Research on externally bonded fiber reinforced polymer (FRP) has matured, lead-
ing to state-of-the-art reports from the American Concrete Institute (ACI 2007) and
guides for design and construction from (ACI 2008) and the National Cooperative High-
way Research Program (NCHRP) (Mirmiran, et al. 2004 and 2008; Zureick, et al. 2010;
Belarbi, et al. 2011). Despite the growing body of knowledge, there are still gaps in our
understanding of FRP. FRP durability and the refinement of FRP fabrication methods
have been identified as research needs for FRP used in infrastructure (Porter 2007).
Research Objectives
The objectives of this work are to respond to the needs identified in gap analysis,
to shed light on FRP durability, and to improve the FRP application process. To satisfy
the first need identified by gap analysis, this research tests the durability of VARTM
specimens and hand layup specimens at both temperature extremes and compares the re-

7
sults of the two methods of application. To meet the second need identified, an im-
provement to the VARTM process will be tested. It is believed that grooving may im-
prove the speed of VARTM application and the strength of the final product. Both of
these possibilities will be tested.
Porter (2007) believes that research aimed at establishing uniform quality control
for external FRP systems have a great likelihood of high return. Previous researchers
have seen improvements to FRP quality from resin transfer application. The broader ob-
jective of this research, by closing gaps in knowledge about it and improving its applica-
tion process, is to facilitate the adoption and implementation of a method of application
which has been shown to produce an FRP of more consistent quality.
Manuscript Organization
The research conducted to meet the objectives stated above has produced tech-
nical papers which were submitted for publication in leading journals of civil engineer-
ing. The work is divided into four technical papers.
The first manuscript is an investigation of the strength gains of RC beams from
externally bonded FRP applied by VARTM. Two types of RC beams are used; one de-
signed to fail in shear and the other in flexure. One VARTM FRP, one hand layup FRP,
and one control sample without FRP of each beam type are tested. Four-point load test-
ing is used to determine ultimate load capacity and deflection. This technical note has
been submitted to the Journal of Composites for Construction, an ASCE publication.
The second manuscript investigates the reduction of VARTM wet-out time
achieved by sawing grooves into the concrete surface. FRP U-jackets are applied by
8
VARTM to beams with vertical grooves. The wet-out of the beams is recorded and
timed. This manuscript has been accepted for publication in the Journal of Composites
for Construction, an ASCE publication.
The third manuscript is a follow-up to the second manuscript. The previous re-
search shows that VARTM’s application time can be reduced by cutting vertical grooves
into the concrete surface to accelerate wet-out. The objective of this research is to deter-
mine if the grooves are a benefit or detriment to the ultimate strength of the beams. The
VARTM method is used to apply FRP U-jackets to beams with vertical grooves. Beams
are tested, half designed to fail in shear and the other half designed to fail in flexure. This
manuscript has been submitted to Composite Structures, an Elsevier publication.
The fourth manuscript evaluates the durability of FRP created by VARTM and
hand layup methods. Prisms wrapped in a single sheet of FRP are conditioned by freeze-
thaw cycling, while others are exposed to hygrothermal conditions combining high heat
and humidity. Half of the specimens are fabricated by VARTM and the other half by
hand layup. The ultimate strength and strain of specimens after conditioning is compared
to that of control specimens. This technical paper has been submitted to the Journal of
Composites for Construction, an ASCE publication.

9
STRENGTHENING OF RC BEAMS WITH FRP APPLIED BY VACUUM ASSISTED
RESIN TRANSFER MOLDING (VARTM)
LUIS RAMOS, NASIM UDDIN, STEPHEN CAUTHEN AND UDDAY VAIDYA
Submitted to Journal of Composites for Construction (ASCE)

10
Abstract
Fiber reinforced polymer (FRP) externally bonded to reinforced concrete (RC)
beams is commonly applied by hand layup, which produces FRP of inconsistent quality
and uniformity. Vacuum Assisted Resin Transfer Molding (VARTM), a novel applica-
tion method in infrastructure, can achieve a more consistent FRP. The purpose of this
research is to investigate the strength gains of RC beams from externally bonded FRP
applied by VARTM. Two types of RC beams are used, one designed to fail in shear and
the other in flexure. One VARTM FRP, one hand layup FRP, and one control sample
without FRP of each beam type are tested. Four-point load testing is used to determine
ultimate load capacity and deflection. Beams in these tests wrapped with VARTM FRP
have 19% more ultimate flexural capacity and 10% more ultimate shear capacity than
beams in these tests using hand layup FRP. VARTM beams also exhibit slightly higher
ductility in flexure. These capacity and ductility results are likely due to an FRP with
high fiber volume ratio, which VARTM is known to produce.
CE Database Subject Headings - Concrete beams; fiber reinforced polymer; vacuum;
flexural strength; shear strength.

11
Introduction
The demand for fiber reinforced polymer (FRP) bridge rehabilitation is high be-
cause many bridges in the United States are in poor condition. 21.9% of bridges in the
National Highway System were deficient in 2009 (FHWA 2010). The number of projects
using externally bonded FRP worldwide has grown from a few in the mid 1980’s to thou-
sands in 2008 (ACI 2008). Research on externally bonded FRP has matured leading to
state-of-the-art reports (ACI 2007) and guides for design and construction from ACI
(ACI 2008) and NCHRP (Mirmiran 2004 and 2008; Zureick 2010; Belarbi 2011). The
demand for rehabilitation, growing project experience, and new standards will further the
adoption of externally bonded FRP.
Despite increasing adoption, little has been done to improve the FRP application
process. Hand layup is the most common method of application. Hand layup may be
cost effective and easy to apply, but it creates an FRP that is variable and could contain
defects (Delaney 2006). Delaney (2006) also found that failure modes were influenced
by minor variations in wet layup application techniques. Hand layup makes it difficult to
achieve a uniform wet-out free of pools or voids and a good fiber compaction without
excessive wrinkling (Karbhari 2001). Resin infusion is capable of achieving uniformity,
good fabric compaction, and less unintended deformation (Karbhari 2001). While nei-
ther process is foolproof, resin infusion is more consistent.
Some hand layup quality control issues, like fiber alignment variation, can be ad-
dressed by using preformed laminate FRP. But some benefits common to hand layup and

12
VARTM, like conforming to complicated shapes, are lost. Therefore, preformed lami-
nates will not be tested.
Resin quantity affects material costs, flexural cracking, and stiffness. Hand layup
produces FRP with up to 30% fiber by weight, while VARTM typically produces FRP
with 60% fiber by weight (JHM 2011). VARTM reduces the quantity of resin needed,
and that has a minor impact on material costs. Although the resin cost is small in portion
to the total cost of the FRP, any reduction in cost is desirable. Poorly reinforced FRP
(too much resin/not enough fiber) is prone to cracking if flexed (JHM 2011). The addi-
tional resin may also cause a minimal, albeit undesirable increase in stiffness/decrease in
ductility.
Despite the benefits of VARTM, the additional steps (pump operation and instal-
lation of additional layers) lengthen application time and increase labor costs. Additional
costs may limit adoption, but VARTM may be the best choice for a project that requires
FRP with higher strength and reliability.
The feasibility of vacuum curing (Stallings 2000) and VARTM (Uddin 2004; Ser-
rano-Perez 2005) has been demonstrated in the field. VARTM bond strength was inves-
tigated and found to develop a more homogenous interface (Uddin 2008).
The objective of this research is to examine the performance of a VARTM FRP
beam and compare it to the performance of a hand layup FRP beam and a control beam
without FRP. The performance of beams in shear and flexure will be tested. Failure
mechanisms will be examined. Findings will be evaluated to determine whether the ad-
vantages expected from the VARTM method are produced.

13
Materials and Specimens
Reinforced concrete beams are fabricated using 27.6 MPa concrete and 414 MPa
steel reinforcement. Each beam is 2.74 meters long and approximately a year old at time
of testing. Two types of beams are being tested. Flexural beams (Figure 1) are designed
to fail in flexure. Shear beams (Figure 2) have stirrups at 305 mm spacing to force a
shear failure. This exceeds the maximum spacing in ACI of half the beam depth (ACI
2008). Test samples will be evaluated to determine if shear cracks engaged stirrups.
Stirrups spacing is constant along the length of the beam for both flexural and shear
beams. Three flexural and three shear beams are tested; each with one VARTM FRP,
one hand layup FRP, and one control.
Figure 1: Flexural Beam Section

14
Figure 2: Shear Beam Section
Flexural beams are reinforced with 3 plies of carbon sheets on the bottom face
(Figure 3). Shear beams are reinforced with 5 plies of carbon sheets on the bottom face
and a single ply FRP U-jacket on both ends (Figure 4).
Figure 3: Flexural Beam FRP (Bottom Face)

15
Figure 4: Shear Beam FRP (Side)
The FRP is made using Sikadur 300 epoxy resin and Sikadur HEX 103C carbon
fiber. Laminate property design values from the manufacturer (Sika 2010) are used to
determine the theoretical capacities of beams with FRP (ACI 2008).
To compare ultimate strengths, it is important to avoid a premature debonding
failure. Debonding should not occur for flexural beams, since the FRPs effective strain is
less than the design strain, as calculated by ACI (2008). Shear beams had flexural FRP
added to ensure a shear failure. FRP used for U-jackets is tall (216 mm) and fully con-
tinuous (not strips) to avoid debonding. For example Cao (2005) found that some U-
jacketed beams fail by FRP rupture, but most fail by FRP debonding. Yalim (2008)
needed many straps or full continuous U-jacketed beams to avoid debonding. FRP with
many plies of fabric is more likely to overcome the adhesion between FRP and concrete
before the FRP ruptures (Alfano 2011). To ensure FRP rupture, a single-ply composite is
used.

16
FRP Application
VARTM has inherent advantages over hand layup. The vacuum creates a uni-
form distribution of resin. Multiple layers can be bonded in one application, saving time
and labor. VARTM also has lower VOC emissions, less FRP exposure to the environ-
ment, high fiber to resin ratio, and consistent results.
VARTM begins with surface preparation to improve bonding. Cracks that are
likely to be encountered during repair should be injected with epoxy, conforming to pro-
cedures in ACI (ACI 2008) or NCHRP (Mirmiran 2004 and 2008). The fabric, the re-
lease film, and the distribution mesh are placed in that order. Infusion lines, which draw
from a resin source, are placed. Vacuum lines, connected to a vacuum pump, are placed.
A vacuum bag is placed and sealed on all edges. Vacuum is applied and resin flows un-
til the fiber is saturated. The resin cures for 24 hours at room temperature under vacuum,
at 27 psi pump gauge pressure, so the resin does not drip or pond. The vacuum bag, re-
lease film, and distribution mesh are then removed. VARTM application for structures
has been detailed by others (Uddin 2004, 2006 and 2008; Serrano-Perez 2005). VARTM
is illustrated below (Figure 5).

17
Figure 5: VARTM Method Configuration
Test Program
Beams are supported and loaded as shown below (Figure 6). Most of the re-
quirements of the ASTM four-point loading test are followed (ASTM 2002), but the test-
ing machine is hand operated and could not provide a continuous load in one stroke.
Figure 6: Beam Support and Load Configuration

18
A single strain gage is bonded to the bottom face of all beams, oriented longitudi-
nally and centered at mid-span. Strain gages are bonded to the sides of each shear beam,
oriented 45 degrees from vertical on both ends of the beam, at mid-height, and centered
longitudinally between load and support. Vishay strain gages are used, and the manufac-
turer’s surface preparation and gage installation instructions are followed (Vishay 2010-
1, 2010-2 and 2011).
Load, deflection, and strain data are recorded. Cracks are noted as they appear
and the load at the time is noted. The failure mode is determined. Theoretical capacities
and test result capacities are summarized in Table 1 and Table 2 at the end of the Test
Results section.
Test Results
Theoretical flexural and shear capacities are calculated for control beams by ACI
318 (2005) and beams with FRP by ACI 440.2R (2008). Theoretical and test result ca-
pacities for flexural beams are summarized in Table 1 and shear beams in Table 2.
High loads were necessary to take the specimens to failure. In order to deliver
these loads, a hand pumped hydraulic jack was necessary. The hand pumping created
jagged load versus deflection charts. A best-fit line is used to present load versus deflec-
tion more clearly for beams in flexure (Figure 7) and shear (Figure 8).

19
Figure 7: Flexural Beam Load vs. Deflection, Best-fit Line
Table 1: Summary of Flexural Beam Capacities
Flexural Capacities (kN) Theoretical
Capacity
Exceeded
by
Theoretical
Steel Yield
(w/o FRP)
Theoretical
Ultimate
(w/ FRP)
Test Result
Steel Yield
(w/o FRP)
Test Result
Ultimate
(w/ FRP)
Control 73a n/a 76
c n/a 4.5%
Hand Layup n/a 121b n/a 135
c 11%
VARTM n/a 121b n/a 160
c 32%
Note: Theoretical shear capacity of all flexural beams is 283 kN (ACI 2005). a
(ACI 2005), b (ACI 2008),
c (Figure 7).

20
Figure 8: Shear Beams, Load vs. Deflection, Best-fit Line
Table 2: Summary of Shear Beam Capacities
Shear Capacities (kN) Theoretical
Capacity
Exceeded
by
Theoretical
Steel Yield
(w/o FRP)
Theoretical
Ultimate
(w/ FRP)
Test Result
Steel Yield
(w/o FRP)
Test Result
Ultimate
(w/ FRP)
Control 156a n/a 146 n/a - 6%
Hand Layup n/a 380b n/a 156
c 0%
VARTM n/a 380b n/a 171
c 10%
Note: Theoretical flexural capacity of all shear beams is 159 kN (ACI 2008). a
(ACI 2005), b (ACI 2008),
c (Figure 8).
Flexural Beam Test Result Interpretation
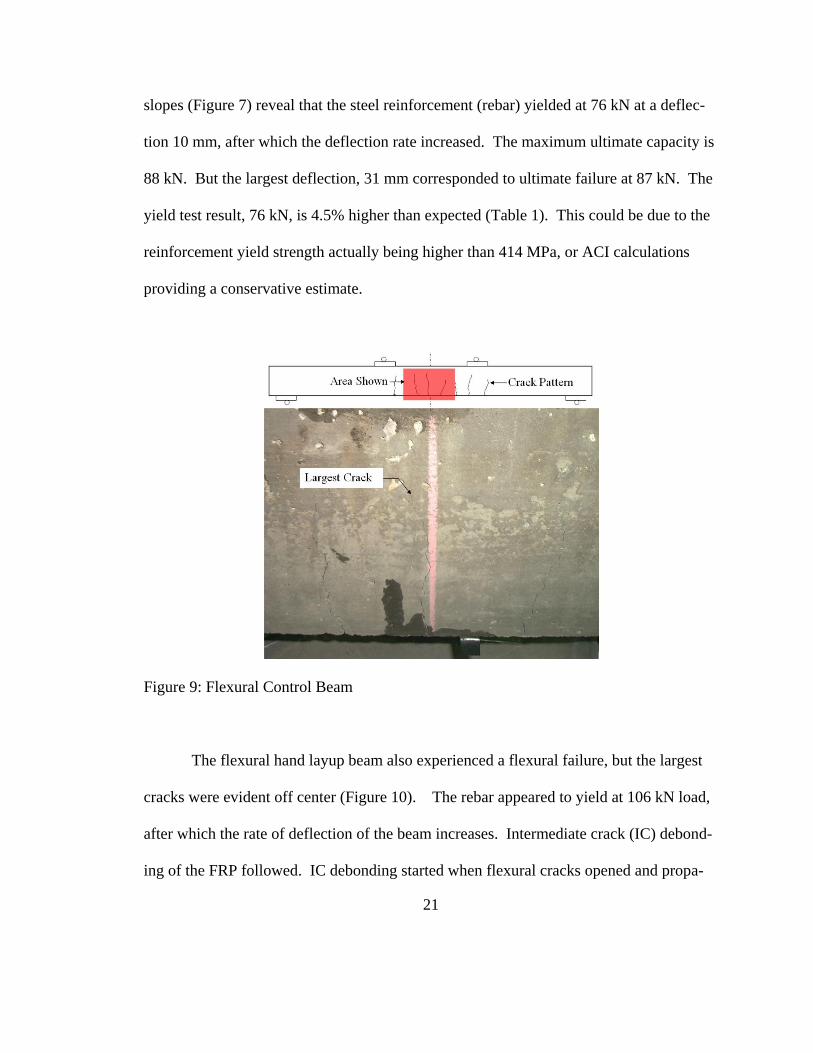
The flexural control beam is expected to fail in flexure, since its theoretical flex-
ural capacity is much lower than its shear capacity (Table 1). Testing resulted in a flex-
ural failure, as expected, at mid-span (Figure 9). The “largest crack” on (Figure 9), rep-
resents the crack which was both widest at the bottom and which propagated further up
vertically. Tensile concrete cracking began at 27 kN load. The load versus deflection
21
slopes (Figure 7) reveal that the steel reinforcement (rebar) yielded at 76 kN at a deflec-
tion 10 mm, after which the deflection rate increased. The maximum ultimate capacity is
88 kN. But the largest deflection, 31 mm corresponded to ultimate failure at 87 kN. The
yield test result, 76 kN, is 4.5% higher than expected (Table 1). This could be due to the
reinforcement yield strength actually being higher than 414 MPa, or ACI calculations
providing a conservative estimate.
Figure 9: Flexural Control Beam
The flexural hand layup beam also experienced a flexural failure, but the largest
cracks were evident off center (Figure 10). The rebar appeared to yield at 106 kN load,
after which the rate of deflection of the beam increases. Intermediate crack (IC) debond-
ing of the FRP followed. IC debonding started when flexural cracks opened and propa-

22
gated toward the FRP ends. Cracks opened and widened as described by Liu (2005). In-
spection revealed that the FRP was damaged, but not ruptured. Failure at a load of 135
kN is observed (Figure 10) and verified by a sudden drop in strain at the same load. The
cracks reach the rebar. Theoretically, the FRP added 67% capacity. But, test results are
11% higher that the theoretical ultimate capacity. This failure compares to a deep con-
crete crack into steel failure mode, which resulted in the highest ultimate strengths in
tests by Delaney (2006). This type of failure is indicative of a strong bond and FRP.
Figure 10: Flexural Hand Layup Beam
The flexural VARTM beam failed in flexure, as expected, at a load of 160 kN.
The VARTM beam had a gradual change in its rate of deflection, so the rebar may have
yielded more gradually. There is no significant strain acceleration in the FRP at any

23
point. At 138 kN, concrete cracking began to occur at mid-span. An abrupt failure oc-
curred in the same location at 160 kN, which spalled the concrete off of the rebar (Figure
11). The spall remained attached to the FRP, and reached the rebar. Test results are 32%
higher that the theoretical ultimate capacity. Again, this failure appears to be a deep con-
crete crack into steel (Delaney 2006), assuring us that the highest possible strength was
reached short of FRP rupture failure mode.
Figure 11: Flexural VARTM Beam
Shear Beam Test Result Interpretation
The shear control beam is expected to fail in shear (Table 2). It experienced a
shear failure at the support, with primary and secondary cracks (Figure 12). Primary
cracking began to appear early in the loading process, at 71 kN. After rebar yielding, the

24
rate of deflection from loading became almost twice the rate prior to yielding. Beam
failure occurred at 146 kN. This is supported by the appearance of the secondary shear
crack and the sudden change of the strain data. The test result capacity is 6% lower than
the theoretical. This deficiency of shear strength appears to be caused by some shear
cracks missing the widely spaced stirrups.
Figure 12: Shear Control Beam
The shear hand layup beam failure occurred just inside of the shear reinforcement
under the load points (Figure 13). Only a slight inclination of some cracks can be seen,
making these appear to be flexural-shear cracks. The vague nature of this failure is not so
surprising because its theoretical shear strength (156 kN) is similar to its flexural strength
(159 kN). Rebar began yielding at about 120 kN (Figure 8) by the increased strain rate.

25
The test result capacity is similar to the theoretical shear value. The area reinforced by
shear FRP is pristine, which is not surprising considering the high ultimate strength im-
parted by shear FRP (Table 2).
Figure 13: Shear Hand Layup Beam
The shear VARTM beam behaved similarly to the hand layup beam, as shown in
(Figure 8), but failure is at 171 kN. The failure is pictured below (Figure 14). Again, re-
bar yielding occurs near 120 kN. The test result is 10% greater than theoretical.

26
Figure 14: Shear VARTM Beam
Conclusions
The goal of this research was to demonstrate that VARTM FRP can be superior to
hand layup FRP. The reasons for this expectation were laid out in the Introduction and
demonstrated by these limited tests. The small number of samples used precludes us
from proving VARTMs performance with any confidence. But these tests can serve as a
proof of concept.
VARTM FRP had a higher flexural and shear capacity than hand layup FRP. The
flexural VARTM beam has a 19% higher flexural capacity (160 kN) than the flexural
hand layup beam (135 kN). The shear VARTM beam has a 10% higher shear capacity
(171 kN) than the shear hand layup beam (156 kN). The same magnitude of flexural and
shear strength gains would be expected in full scale beams with VARTM FRP, but follow

27
up research should be conducted to verify this. The greater capacity of VARTM was ex-
pected because of the uniformity and quality of the resin coating, which prevents surface
bond weakening.
VARTM also produced FRP with higher ductility and lower stiffness than hand
layup produced, as was anticipated. The flexural VARTM beam deflected more than the
flexural hand layup beam at equal loads, until failure was imminent for the hand layup
FRP beam (above 125 kN load). More importantly, for both flexural beams and shear
beams, the VARTM beams achieved higher deflections at ultimate loads than the hand
layup beams.
Test results reflect VARTM FRP expectations, born of experience from other in-
dustries. These initial findings are promising and show that VARTM FRP merits com-
prehensive testing.
Acknowledgments
The authors gratefully acknowledge funding and support provided by Alabama
Department of Transportation (ALDOT) Research Project 930-607B under the guidance
of Bridge Engineers Fred Conway and George Connor.
28
References
1. ACI 318 (2005). “Building Code Requirements for Structural Concrete.” American
Concrete Institute (ACI) Committee 318, Farmington Hills, MI.
2. ACI 440R (2007). “Report on Fiber Reinforced Polymer (FRP) Reinforcement for
Concrete Structures.” American Concrete Institute (ACI) Committee 440R-07, Farm-
ington Hills, MI.
3. ACI 440.2R (2008). “Guide for the Design and Construction of Externally Bonded
FRP Systems for Strengthening Concrete Structures.” ACI Committee 440.2R-08,
Farmington Hills, MI.
4. Alfano, G., De Cicco, F., and Prota, A. (2011). "Intermediate Debonding Failure of
RC Beams Retrofitted in Flexure with FRP: Experimental Results versus Prediction
of Codes of Practice." Journal of Composites for Construction, 16(2), 185-195.
5. ASTM Standard C78 (2002). “Flexural Strength of Concrete (Using Simple Beam
with Third-Point Loading),” ASTM International, West Conshohocken, PA.
6. Belarbi A., Bae S., Ayoub A., Kuchma D., Mirmiran A. and Okeil A. (2011). “De-
sign of FRP Systems for Strengthening Concrete Girders in Shear.” NCHRP Rep. No.
678, Transportation Research Board, Washington, D.C.
7. Cao, S., Chen, J., Teng, J., and Hao, Z. (2005). "Debonding in RC Beams Shear
Strengthened with Complete FRP Wraps." Journal of Composites for Construction,
9(5), 417-428.

29
8. Delaney, J. C., and Karbhari, V. (2006). “The assessment of aspects related to defect
criticality in CFRP strengthened concrete flexural members.” Rep. No. SSRP 06/11,
Dept. of Structural Engineering, Univ. of California-San Diego, La Jolla, CA.
9. FHWA (2010). “2010 Status of the Nation’s Highways, Bridges, and Transit: Condi-
tions & Performance” <www.fhwa.dot.gov/policy/2010cpr/> (July 28, 2012).
10. JHM Technologies (2011). “Vacuum Assisted Resin Transfer Molding: What it is,
What it is Not, What it Can and What it Cannot Do.”
< http://www.rtmcomposites.com/vartm.html> (July 28, 2012).
11. Karbhari, V. (2001). "Materials Considerations in FRP Rehabilitation of Concrete
Structures." Journal of Materials in Civil Engineering, 13(2), 90-97.
12. Liu, I., Oehlers, D., and Seracino, R. (2007). "Study of Intermediate Crack Debond-
ing in Adhesively Plated Beams." Journal of Composites for Construction, 11(2),
175-183.
13. Mirmiran, A., Shahawy, M., Nanni, A., and Karbhari, V. (2004). “Bonded Repair and
Retrofit of Concrete Structures Using FRP Composites - Recommended Construction
Specifications and Process Control Manual.” NCHRP Rep. No. 514, Transportation
Research Board, Washington, D.C.
14. Mirmiran, A., Shahawy, M., Nanni, A., Karbhari, V., Yalim, B., and Kalayci, A. S.
(2008). “Recommended Construction Specifications and Process Control Manual for
Repair and Retrofit of Concrete Structures Using Bonded FRP Composites.” NCHRP
Rep. No. 609, Transportation Research Board, Washington, D.C.

30
15. Serrano-Perez, J. and Vaidya, U. (2005). “Modeling and Implementation of VARTM
for Civil Engineering Applications.” SAMPE Journal, 41(1), 5-22.
16. Sika (2008). “Sikadur 300 Epoxy.” Product Sheet (Edition 7.1.2008),
<http://usa.sika.com/> (July 28, 2012).
17. Sika (2010). “Sikawrap Hex 103C Carbon Fiber.” Product Sheet (Edition 6.23.2010),
<http://usa.sika.com/> (July 28, 2012).
18. Stallings, J., Tedesco, J., El-Mihilmy, M., and McCauley, M. (2000). "Field Perfor-
mance of FRP Bridge Repairs." Journal of Bridge Engineering, 5(2), 107-113.
19. Uddin, N., Vaidya, U., Shohel, M., and Serrano-Perez, J. (2004). "Cost Effective
Bridge Girder Strengthening Using Vacuum Assisted Resin Transfer Molding
(VARTM)." Advanced Composite Materials: The Official Journal of the Japan Socie-
ty of Composite Materials, 13(3-4), 255-281.
20. Uddin, N., Vaidya, U., Shohel, M.S. and Serrano-Perez., J. (2006). “Vacuum-
Assisted Resin Transfer Molding: An Alternative Method for Retrofitting Concrete
Using Fiber Composites.” Concrete International, 28 (11), 53-56.
21. Uddin, N., Shohel, M., Vaidya, U., and Serrano-Perez, J. (2008). "Bond Strength of
Carbon Fiber Sheet on Concrete Substrate Processed by Vacuum Assisted Resin
Transfer Molding." Advanced Composite Materials, 17(3), 277-299.
22. Vishay (2010-1). “Surface Preparation of Composites.” Document No. 11183 (Revi-
sion 09-Apr-10), <http://www.vishaypg.com/> (July 28, 2012).
23. Vishay (2010-2). “Strain Gage Installations for Concrete Structures.” Document No.
11091 (Revision 14-Nov-10), <http://www.vishaypg.com/> (July 28, 2012).

31
24. Vishay (2011). “Surface Preparation for Strain Gage Bonding.” Document No.
11129 (Revision 19-Dec-11), <http://www.vishaypg.com/> (July 28, 2012).
25. Yalim, B., Kalayci, A., and Mirmiran, A. (2008). "Performance of FRP Strengthened
RC Beams with Different Concrete Surface Profiles." Journal of Composites for Con-
struction, 12(6), 626-634.
26. Zureick A., Ellingwood B., Nowak A., Mertz D. and Triantafillou, T. (2010). “Rec-
ommended Guide Specification for the Design of Externally Bonded FRP Systems
for Repair and Strengthening of Concrete Bridge Elements.” NCHRP Rep. No. 655,
Transportation Research Board, Washington, D.C.

32
BENEFITS OF GROOVING ON VACUUM ASSISTED RESIN TRANSFER MOLD-
ING (VARTM) FRP WET-OUT OF RC BEAMS
by
LUIS RAMOS, NASIM UDDIN AND MALCOLM PARRISH
Ramos, L., Uddin, N., and Parrish, M. Benefits of Grooving on Vacuum Assisted Resin
Transfer Molding (VARTM) FRP Wet-Out of RC Beams. J. Compos. Constr.
doi: 10.1061/(ASCE)CC.1943-5614.0000365
Copyright
2013
by
Journal of Composites for Construction (ASCE)
Used by permission

33
Abstract
Fiber reinforced polymer (FRP) externally bonded to reinforced concrete (RC)
beams is commonly applied by hand layup. Vacuum Assisted Resin Transfer Molding
(VARTM), a novel application method in infrastructure, can produce FRP with more
consistent quality and uniformity. Additional steps are required, however, which can in-
crease the application time and cost. This research will investigate the reduction of
VARTM wet-out time achieved by sawing grooves into the concrete surface. FRP U-
jackets are applied by VARTM to beams with vertical grooves. The wet-out of the
beams is recorded and timed. Results indicate that beams with 3.2 mm deep grooves
achieve 95% wet-out in an average of 200 sec. This is only 22% of the time it takes to
wet-out a beam with no grooves, an average of 911 sec. A wet-out mechanism based on
a modified Darcy’s Law is presented to verify the results. Darcy’s Law predicts that time
savings increase exponentially with the length that the epoxy has to travel. This means
that a significant amount of time could be saved on actual girders.
CE Database Subject Headings - Concrete beams; fiber reinforced polymer; vacuum;
epoxy; pressurized flow; flow measurement.

34
Introduction
The demand for fiber reinforced polymer (FRP) bridge rehabilitation is high be-
cause many bridges in the United States are in poor condition. According to the Federal
Highway Administration (FHWA), 21.9% of bridges in the National Highway System
were deficient in 2009 (FHWA 2010). The American Concrete Institute (ACI) reports
that the number of projects using externally bonded FRP worldwide has grown from a
few in the mid 1980’s to thousands in 2008 (ACI 2008). Research on externally bonded
FRP has matured, leading to state-of-the-art reports (ACI 2007) and guides for design and
construction from ACI (ACI 2008) and the National Cooperative Highway Research Pro-
gram (NCHRP) (Mirmiran, et al. 2004 and 2008; Zureick, et al. 2010; Belarbi, et al.
2011). The demand for rehabilitation, growing project experience, and new standards
will further the adoption of externally bonded FRP.
Despite increasing adoption, little has been done to improve the FRP application
process. Hand layup is the most common application method. Hand layup may be cost
effective and easy to apply, but it creates a final product that is variable and could contain
defects (Delaney 2006). Hand layup makes it difficult to achieve a uniform wet-out free
of pools or voids and a good fiber compaction without excessive wrinkling (Karbhari
2001). Resin infusion is capable of achieving uniformity, good fabric compaction, and
less unintended deformation (Karbhari 2001). Vacuum Assisted Resin Transfer Molding
(VARTM) is a resin infusion application method that is expected to achieve these bene-
fits on infrastructure applications. While neither process is foolproof, Delaney and
Karbhari found resin infusion to be more consistent in quality.

35
Some hand layup quality control issues, like fiber alignment variation, can be ad-
dressed by using preformed laminate FRP. Preformed laminate can be difficult to con-
form to girders in the field; especially around sectional transitions, diaphragms, inserts,
and other irregularities. For this reason, preformed laminates are not considered for these
tests.
The feasibility of vacuum curing (Stallings, et al. 2000) and VARTM (Uddin, et
al. 2004 and 2006) has been demonstrated on full size field applications. VARTM bond
strength was investigated and found to develop a more homogenous interface (Uddin, et
al. 2008).
Grooving meets the criteria at which a defect is considered critical by ACI (ACI
2008) and NCHRP (Mirmiran, et al. 2004 and 2008), which raises the question whether
performance is diminished. Kalayci, et al. (2009) cut slits in concrete before applying
FRP and found no significant impact in the overall structural performance. Micro-
cracking caused by sawing is not a concern either, as Arduni (1997) has found that the
performance of FRP strengthened pre-cracked specimens is not significantly different
from that of un-cracked specimens. Delaney (2006) found that beams with added defects
performed nearly the same as beams without added defects. In Delaney’s studies (2006),
even large unbounded sections, comprising 7% to 15% of the total laminate area, seem to
reduce beam capacity by less than 5%. Delaney (2006) believed that some aspects of
critical defect criteria in those guides are conservative and arbitrary (Delaney 2006).
These researchers have demonstrated that concerns from ACI (ACI 2008) and NCHRP
(Mirmiran, et al. 2004 and 2008) over sawing defects are unfounded.

36
Concerns over diminished bond performance due to grooves are further assuaged
by recent research showing that grooves actually postpone, and sometimes eliminate,
debonding as a failure mode (Mostofinejad 2010; 2013-1; and 2013-2). Mostofinejad
(2010) found that transverse grooving increased ultimate strength by 10% over specimens
with traditional surface preparation. Transverse grooving is used in samples tested here.
In flexural tests, Mostofinejad (2011-1 and 2013-1) found that FRP externally bonded on
concrete beams with grooves had higher ultimate capacity than FRP on concrete with
conventional surface preparation. In shear tests, grooving essentially eliminated debond-
ing failure in FRP strips (Mostofinejad 2011-2). Mostofinejad’s tests consistently indi-
cate that grooving produces a stronger bond than traditional surface preparation.
These tests are conducted on new specimens. Girders in the field are likely to ex-
hibit some surface damage, but they are expected to be repaired. Deep cracks are re-
quired to be injected with epoxy and rough surfaces are required to be ground to an ac-
ceptable surface profile, according to ACI (ACI 2008) and NCHRP (Mirmiran, et al.
2004 and 2008).
The objective of this research is to determine if there is a reduction in wet-out
time attributed to grooving. In order to achieve this, FRP is applied to twelve RC beams
using VARTM application and timed. A reduction in wet-out time is anticipated because
grooves shorten wet-out lengths. Wet-out is modeled by a modified Darcy’s Law (Serra-
no-Perez 2005):

37
t = l2/2P (1)
The porosity of the reinforcement, is commonly in the range of 0.5 to 0.85 de-
pending on volume fraction, Vf (Serrano-Perez 2005). We expect Vf = 0.5, based on past
experiments, so we use = 0.675. Resin viscosity, = 500 mPa sec, according to the
epoxy manufacturer (Sika 2008). Flow length, l = 0.293 m, which is the side FRP height
(0.229 m) plus half of the base width (0.152 m) minus ½ the internal diameter of the 2
lines (0.012 m). The reinforcement permeability, = 2.8 x 10⁻¹⁰
m2, is the longitudinal
permeability determined by strip infusion experiments (Serrano-Perez 2005). Note that
accounts for the use of a distribution mesh, without which flow would have been too slow
to finish before the resin reactivity began (Sika 2008). The pressure differential, ΔP =
85,000 Pa, is the difference between the vacuum pump gauge pressure (185 kPa) and at-
mospheric pressure (100 kPa). Wet-out time calculates to t = 610 sec, which we expect
to see from beams without grooves.
The pump used for these tests is small and can be transported by hand. It was
chosen to demonstrate that VARTM implementation is feasible with restricted access in
the field. Larger pumps should be used if they can be accommodated because they can
achieve higher gauge pressures and result in a linearly proportional reduction in wet-out
time.

38
Materials and Specimens
Samples are made of RC beams wrapped in a single layer of U-jacketed FRP.
Twelve 914 mm long RC beams were cast. A 7 1/2” circular saw was used to cut vertical
3.2 mm wide grooves: four without grooves, four with 3.2 mm deep grooves, and four
with 6.4 mm deep grooves. Groove spacing was kept constant at 102 mm. The beam and
FRP dimensions (Figure 1) and groove dimensions (Figure 2) are illustrated in elevation
views below. Beams are 152 mm wide.
Figure 1: Beam Dimensions
Figure 2: Groove Dimensions

39
The FRP laminate is made of Sikadur 300 low viscosity epoxy resin and Sikadur
HEX 103C carbon fiber. VARTM typically produces best results using resins with vis-
cosities between 100 and 500 mPa (Serrano-Perez 2005). Sikadur 300 is chosen for:
1. adequate viscosity, 500 mPa
2. long pot life, which allows time for VARTM application
3. no volatile organic compounds (VOCs)
4. and high adhesive strength (Sika 2008).
VARTM Application Method
VARTM begins with surface preparation to improve bonding. Fabric is placed
first on the prepared surface, then the release film, then the distribution mesh. One end of
the infusion line is attached to the beam at its low point and the other end placed in the
resin source. One end of each vacuum line is attached at the top edge of the FRP on both
sides of the beam, and the other end is connected to a vacuum pump. Finally, a vacuum
bag is placed and all edges and seams are vacuum sealed. The VARTM method is illus-
trated below (Figure 3). Additional details of VARTM application on infrastructure have
been published (Uddin, et al. 2004, 2006 and 2008; Serrano-Perez 2005).

40
Figure 3: VARTM Method Configuration
Test Program
To begin fabrication, vacuum is applied and resin is forced to flow until the fiber
sheet is saturated. Infusion can be visually examined through the vacuum bag. A video
recording was made of both sides of the specimen during resin flow from start to finish.
Frames of the video were extracted at short time intervals. MicroStation V8 software is
used to measure the area of wet fiber and total area of fiber in each frame. The percent-
age of wet-out is the wet area divided by total area. A sampling of frames is presented
below (Figure 4 to Figure 7). The epoxy flows up grooves quickly, and then travels out-
ward from the grooves more slowly. The distance the epoxy has to travel is much shorter
on a grooved beam compared to one without grooves.

41
Figure 4: VARTM, Beam 1 with 3.2 mm Grooves, 30 sec
Figure 5: VARTM, Beam 1 with 3.2 mm Grooves, 60 sec
Figure 6: VARTM, Beam 1 with 3.2 mm Grooves, 90 sec

42
Figure 7: VARTM, Beam 1 with 3.2 mm Grooves, 120 sec
Results and Discussion
Beams with 3.2 mm grooves achieved the fastest time to 95% wet-out, 200 sec on
average (Table 3). The rate of wet-out over time is fairly linear (Figure 8), but slows as
wet-out approaches 90%. Two reasons were observed for this. First, there may be a leak
in the vacuum bag, which causes a loss of vacuum. This can be easily fixed with a patch,
like the small diamond patch that can be seen near beam mid-span in (Figure 4 to Figure
7). Second, most samples take too much time to wet-out the corners, where vacuum can
be low. Beam 2 (Figure 9) is an example of a beam with difficult corners. No solution
for this could be found that could be implemented during the VARTM process. Better
results are expected if grooves are cut angling towards each upper corner of the beam.
This would pull resin towards the area which is most difficult to wet-out and hasten com-
pletion time.
43
Figure 8: Time vs. Wet-Out for Beams with 3.2 mm Grooves
Figure 9: VARTM, Beam 2 with 6.4 mm Grooves, 342 sec
Beams with 6.4 mm grooves achieved the second fastest time to 95% wet-out,
297 sec on average (Table 3). Again, the wetting-out progression over time is fairly line-
ar (Figure 10) until wet-out approaches 90%. The delay in finishing the corners is signif-
icant for samples with both 3.2 mm and 6.4 mm grooves, so wet-out times for those sam-
ples have room for improvement.

44
Figure 10: Time vs. Wet-Out for Beams with 6.4 mm Grooves
Beams without grooves had noticeably slower times to 95% wet-out, 911 sec on
average (Table 3). In addition, these beams showed the greatest variability in wet-out
rates (Figure 11). Note, from our calculations at the end of the Introduction, we expected
to see a wet-out time of 610 sec. This is a reasonable estimate for Beams 1 and 2. It
would have been reasonable for Beam 4 as well, but the corners delayed the last 15% of
wet-out. Beam 3 was excessively delayed, and may be an outlier or a reflection of varia-
bility in beams without grooves. The modified Darcy’s Law calculations will be consid-
ered a useful planning tool, but cannot predict samples that suffer from delays. Note that
beams without grooves experienced far fewer and less severe delays, which we expect
could be eliminated by cutting grooves to the corners.

45
Figure 11: Time vs. Wet-Out for Beams without Grooves
There is a broad range for the true average wet-out times estimated for each sam-
ple type because there was only four of each sample type. Despite this, there was a clear
separation between time ranges.
Table 3: Estimated Range of True Average Time for 95% Wet-Out
Groove Depth, d 3.2 mm 6.4 mm No Grooves
Sample Size, n 4 4 4
Sample Average a, As 200 sec 297 sec 911 sec
Spread of Values, b-a 99 sec 211 sec 889 sec
Standard Deviation b, 16 sec 35 sec 148 sec
Exceedance Factor c 1.96 1.96 1.96
Maximum Error, E 16 sec 34 sec 145 sec
Estimated Range of
True Average, At
184 sec –
216 sec
263 sec –
332 sec
766 sec –
1056 sec
Note: Calculations Conform to American Society for Testing and Materials (ASTM)
Standard Practice ASTM E122, Example 4 (ASTM 2000). a for 95% Wet-Out,
b for Normal Distribution,
c 1 in 20 Probability of Exceedance.
46
Conclusions
Test results showed that beams with 3.2 mm deep grooves wet-out in 22% of the
time that it took beams without grooves. Times for beams with grooves can be reduced
further by angling grooves toward each corner of the beam. This would pull resin to-
wards the corners, which are the most difficult to wet-out, and hasten completion time.
Test results showed that beams with 6.4 mm deep grooves took almost 50% long-
er to wet-out than beams with 3.2 mm deep grooves. More epoxy flowed straight
through the larger grooves and into the vacuum pump catch can and less resin flowed
over the concrete surface between the grooves, compared to the smaller grooves.
Test results show a reduction in wet-out time on small beams with a short flow
length, l = 0.293 m. Flow lengths on actual girders will be longer, and wet-out time will
be exponentially longer (length is squared in equation 1 in the Introduction). Consider a
54 inch Bulb-T Girder (BT-54), from the Precast/Prestressed Concrete Institute (PCI)
(2011). If FRP is applied up to the neutral axis (ybottom = 701.8 mm), the flow length
would be l = 1.20 m. That makes the wet-out time of a BT-54 (t > 7 hrs) about 28.6
times longer than that of our beam (t ~ 15 mins). This is an example of how application
times can be quite high on actual girders, making grooving relevant.
Modified Darcy’s Law is sufficiently accurate to be a useful tool, but will have to
be modified to be of use on beams with grooves. The reinforcement porosity, resin vis-
cosity, and reinforcement permeability should be equal for beams with or without
grooves, but their flow lengths and pressure differentials vary. Resin only has to flow
laterally 51 mm from each groove to wet-out the sides of beams with grooves (Figure 4 to

47
Figure 7), compared to 229 mm vertically for beams without grooves. The pressure dif-
ferential of the surface between grooves likely differs from that of the surface with no
grooves. These two variables make a direct comparison impossible. Follow-up research
could determine the adjustments appropriate to the modified Darcy’s Law to account for
grooves.
Acknowledgements
The authors gratefully acknowledge funding and support provided by Alabama
Department of Transportation (ALDOT) Research Project 930-607B under the guidance
of Bridge Engineers Fred Conway and George Connor.
Notations
The following symbols are used in this paper:
t = wet-out time
= reinforcement porosity
= resin viscosity
l = flow length
= reinforcement permeability
P = pressure differential

48
References
1. ACI 440R (2007). “Report on Fiber Reinforced Polymer (FRP) Reinforcement for
Concrete Structures.” American Concrete Institute (ACI) Committee 440R-07, Farm-
ington Hills, MI.
2. ACI 440.2R (2008). “Guide for the Design and Construction of Externally Bonded
FRP Systems for Strengthening Concrete Structures.” ACI Committee 440.2R-08,
Farmington Hills, MI.
3. Arduini, M., and Nanni, A. (1997). "Behavior of Precracked RC Beams Strengthened
with Carbon FRP Sheets." Journal of Composites for Construction, 1(2), 63-70.
4. ASTM Standard E122, 2000, "Calculating Sample Size to Estimate, With a Specified
Tolerable Error, the Average for a Characteristic of a Lot or Process," ASTM Interna-
tional, West Conshohocken, PA.
5. Belarbi A., Bae S., Ayoub A., Kuchma D., Mirmiran A. and Okeil A. (2011). “De-
sign of FRP Systems for Strengthening Concrete Girders in Shear.” NCHRP Rep. No.
678, Transportation Research Board, Washington, D.C.
6. Delaney, J. C., and Karbhari, V. (2006). “The assessment of aspects related to defect
criticality in CFRP strengthened concrete flexural members.” Rep. No. SSRP 06/11,
Dept. of Structural Engineering, Univ. of California-San Diego, La Jolla, CA.

49
7. FHWA (2010). “2010 Status of the Nation’s Highways, Bridges, and Transit: Condi-
tions & Performance” <www.fhwa.dot.gov/policy/2010cpr/> (July 28, 2012).
8. Karbhari, V. (2001). "Materials Considerations in FRP Rehabilitation of Concrete
Structures." Journal of Materials in Civil Engineering, 13(2), 90-97.
9. Kalayci, A., Yalim, B., and Mirmiran, A. (2009). "Effect of Untreated Surface Dis-
bonds on Performance of FRP-Retrofitted Concrete Beams." Journal of Composites
for Construction, 13(6), 476-485.
10. Mirmiran, A., Shahawy, M., Nanni, A., and Karbhari, V. (2004). “Bonded Repair
and Retrofit of Concrete Structures Using FRP Composites - Recommended Con-
struction Specifications and Process Control Manual.” NCHRP Rep. No. 514, Trans-
portation Research Board, Washington, D.C.
11. Mirmiran, A., Shahawy, M., Nanni, A., Karbhari, V., Yalim, B., and Kalayci, A. S.
(2008). “Recommended Construction Specifications and Process Control Manual for
Repair and Retrofit of Concrete Structures Using Bonded FRP Composites.” NCHRP
Rep. No. 609, Transportation Research Board, Washington, D.C.
12. Mostofinejad, D., and Mahmoudabadi, E. (2010). "Grooving as Alternative Method
of Surface Preparation to Postpone Debonding of FRP Laminates in Concrete
Beams." Journal of Composites for Construction, 14(6), 804-811.
13. Mostofinejad, D., and Shameli, M. (2011, 1). "Performance of EBROG Method un-
der Multilayer FRP Sheets for Flexural Strengthening of Concrete Beams." Procedia
Engineering, 14(0), 3176-3182.

50
14. Mostofinejad, D., and Kashani, A. (2011, 2). "Elimination of Debonding of FRP
Strips in Shear Strengthened Beams using Grooving Method." Proc., 1st International
Conference on Civil Engineering, Architecture and Building Materials, Trans Tech
Publications, 1077-1081.
15. Mostofinejad, D., and Shameli, M. (2013, 1). "Externally Bonded Reinforcement in
Grooves (EBRIG) Technique to Postpone Debonding of FRP Sheets in Strengthened
Concrete Beams." Construction and Building Materials, 38, 751-758.
16. Mostofinejad, D., and Kashani, A. (2013, 2). "Experimental Study on Effect of EBR
and EBROG Methods on Debonding of FRP Sheets Used for Shear Strengthening of
RC Beams." Journal of Composites Part B: Engineering, 40(1), 1704-1713.
17. PCI (2011). “PCI Bridge Design Manual, 3rd Edition, Appendix B.” Pre-
cast/Prestressed Concrete Institute (PCI) Chicago, IL.
18. Serrano-Perez, J. and Vaidya, U. (2005). “Modeling and Implementation of VARTM
for Civil Engineering Applications.” SAMPE Journal, 41(1), 5-22.
19. Sika (2008). “Sikadur 300 Epoxy.” Product Sheet (Edition 7.1.2008),
<http://usa.sika.com/> (July 28, 2012).
20. Stallings, J., Tedesco, J., El-Mihilmy, M., and McCauley, M. (2000). "Field Perfor-
mance of FRP Bridge Repairs." Journal of Bridge Engineering, 5(2), 107-113.
21. Uddin, N., Vaidya, U., Shohel, M., and Serrano-Perez, J. (2004). "Cost Effective
Bridge Girder Strengthening Using Vacuum Assisted Resin Transfer Molding
(VARTM)." Advanced Composite Materials: The Official Journal of the Japan Socie-
ty of Composite Materials, 13(3-4), 255-281.

51
22. Uddin, N., Vaidya, U., Shohel, M. and Serrano-Perez., J. (2006). “Vacuum-Assisted
Resin Transfer Molding: An Alternative Method for Retrofitting Concrete Using Fi-
ber Composites.” Concrete International, 28 (11), 53-56.
23. Uddin, N., Shohel, M., Vaidya, U., and Serrano-Perez, J. (2008). "Bond Strength of
Carbon Fiber Sheet on Concrete Substrate Processed by Vacuum Assisted Resin
Transfer Molding." Advanced Composite Materials, 17(3), 277-299.
24. Zureick A., Ellingwood B., Nowak A., Mertz D. and Triantafillou, T. (2010). “Rec-
ommended Guide Specification for the Design of Externally Bonded FRP Systems
for Repair and Strengthening of Concrete Bridge Elements.” NCHRP Rep. No. 655,
Transportation Research Board, Washington, D.C.

52
BENEFITS OF GROOVING ON VACUUM ASSISTED RESIN TRANSFER MOLD-
ING (VARTM) FRP STRENGTHENING OF RC BEAMS
LUIS RAMOS, NASIM UDDIN AND MALCOLM PARRISH
Submitted to Composite Structures (Elsevier)

53
Abstract
Fiber reinforced polymer (FRP) externally bonded to reinforced concrete (RC)
beams is commonly applied by hand layup. Vacuum Assisted Resin Transfer Molding
(VARTM), a novel application method, can achieve more consistent quality and uni-
formity. VARTM’s application time can be reduced by cutting vertical grooves into the
concrete surface to accelerate wet-out. The objective of this research is to determine if
the grooves are a benefit or detriment to the ultimate strength of the beams. The
VARTM method is used to apply FRP U-jackets to beams with vertical grooves. Ten
beams are tested, half designed to fail in shear and the other half designed to fail in flex-
ure. Results show no statistically significant difference between the strength of beams
with or without grooves. Therefore, the benefit of accelerating wet-out in VARTM
beams can be achieved without sacrificing the ultimate strength of the final product.
CE Database Subject Headings - Concrete beams; fiber reinforced polymer; vacuum;
flexural strength; shear strength.

54
Introduction
The demand for fiber reinforced polymer (FRP) bridge rehabilitation is high be-
cause many bridges in the United States are in poor condition. According to the Federal
Highway Administration (FHWA), 21.9% of the National Highway System’s bridges
were deficient in 2009 (FHWA [8]). The American Concrete Institute (ACI) reports that
the number of projects using externally bonded FRP worldwide has grown from a few in
the mid 1980’s to thousands in 2008 (ACI [2]). The soon to be released ACI document
verifies that FRP use continues to grow and is increasingly being used in civil infrastruc-
ture applications (“Accelerated Conditioning Protocols for Durability Assessment of In-
ternal and External Fiber Reinforced Polymer (FRP) Reinforcement of Concrete” 440L –
FRP Durability Subcommittee, unpublished – draft document, March 14, 2012).
Research on externally bonded FRP has matured, leading to state-of-the-art re-
ports (ACI [1]) and guides for design and construction from ACI (ACI [2]) and the Na-
tional Cooperative Highway Research Program (NCHRP) (Mirmiran, et al. [11] and [12];
Zureick, et al. [29]; Belarbi, et al. [6]). The demand for rehabilitation, growing project
experience, and new standards will further the adoption of externally bonded FRP.
Despite increasing adoption, little has been done to improve the FRP application
process. Hand layup is the most common application method. Hand layup may be cost
effective and easy to apply, but it creates a final product that is variable and could contain
defects (Delaney [7]). Hand layup makes it difficult to achieve a uniform wet-out free of
pools or voids and a good fiber compaction without excessive wrinkling (Karbhari [10]).

55
Resin infusion is capable of achieving uniformity, good fabric compaction, and less unin-
tended deformation (Karbhari [10]). Vacuum Assisted Resin Transfer Molding
(VARTM) is a resin infusion application method that is expected to achieve these bene-
fits on infrastructure applications. While neither process is foolproof, resin infusion is
more consistent.
Some hand layup quality control issues, like fiber alignment variation, can be ad-
dressed by using preformed laminate FRP. Preformed laminate can be difficult to con-
form to RC beams in the field; especially around sectional transitions, diaphragms, in-
serts, and other irregularities. Therefore, preformed laminates are not considered for
these tests.
Vacuum Assisted Resin Transfer Molding (VARTM) is a resin infusion applica-
tion method that has been shown to achieve these benefits on infrastructure applications
(Ramos, et al. [18]). The improved quality and uniformity of VARTM FRP has been
shown to achieve an 18.6% higher capacity in flexure and 10.0% higher capacity in shear
over hand layup FRP (Ramos, et al. [18]).
The feasibility of vacuum curing (Stallings, et al. [21]) and VARTM (Uddin, et al.
[22] and [23]) has been demonstrated on full size field applications. VARTM bond
strength was investigated and found to develop a more homogenous interface (Uddin, et
al. [24]).
Grooving has been shown to reduce VARTM’s application time, by accelerating
wet-out (Ramos, et al. [18]). Tests results showed that beams with 3.2 mm deep grooves
achieved 95% wet-out in 22% of the time as beams without grooves (Ramos, et al. [18]).

56
Wet-out is not only faster with grooves, but also more consistent. Note the variability in
wet-out time of beams without grooves in (Figure 1).
Figure 1: Wet Out vs. Time of Beams with and without Grooves (Ramos, et al. [18])
In other configurations, grooving has been found to raise ultimate strength, be an
improvement over traditional surface preparation (sand blasting, abrasion or water jet),
and help eliminate debonding. Mostofinejad [13] found that transverse grooving in-
creased ultimate strength by 10% over specimens with traditional surface preparation. In
flexural tests, Mostofinejad [14] found that FRP bonded on beams with grooves had a

57
higher ultimate capacity than beams with conventional surface preparation. In shear
tests, grooving essentially eliminated debonding failure in FRP strips (Mostofinejad
[15]). Mostofinejad’s various tests indicate that grooving can increase strength.
The objective of this study is to determine if grooves cut into RC beams config-
ured to accelerate VARTM FRP wet-out improve on the ultimate strength of those
beams. To achieve this objective, tests were conducted to collect ultimate load capacity
and strain data of beams under third-point loading.
Some concern may be raised about grooving, since its dimensions qualify as criti-
cal defects by ACI (ACI [2]) and NCHRP (Mirmiran, et al. [11] and [12]) criteria. Some
aspects of critical defect criteria in those guides are believed to be very conservative and
arbitrary (Delaney [7]). Kalayci, et al. [9] cut slits in concrete before applying FRP and
found no significant impact in the overall structural performance. Delaney [7] found that
beams to which they added defects showed performance very nearly the same as beams
without added defects. Concerns from ACI (ACI 2008) and NCHRP (Mirmiran, et al.
2004 and 2008) over defects they consider critical may be unfounded.
Materials and Specimens
Beams are made of RC wrapped in a single layer of U-jacketed FRP applied by
VARTM. The FRP laminate is made of Sikadur 300 low viscosity epoxy resin and Si-
kadur HEX 103C carbon fiber. Laminate property design values from the manufacturer
(Sika [20]) are used to determine the theoretical capacities of beams with FRP.

58
To compare ultimate strengths, it is important to avoid a premature debonding
failure. Debonding should not occur for flexural beams, since the FRPs effective strain is
less than the design strain, as calculated by ACI [2]. FRP used for U-jackets is tall (216
mm) and fully continuous (not strips), as some previous researchers had found that to be
necessary to avoid debonding. For example, Yalim, et al. [28] needed many straps or full
continuous U-jacketed beams to avoid debonding. Thick FRP is more likely to overcome
the adhesion between FRP and concrete (Alfano, et al. [3]). To ensure the FRP is weaker
than the FRP’s bond to concrete, a thin (single-ply) composite is used.
Two types of beams are used, 254 mm deep beams meant to fail in flexure and
279 mm deep beams meant to fail in shear. According to calculations conforming to ACI
440.2R (ACI [2]), 254 mm deep beams have a theoretical ultimate capacity of 372 kN in
flexure and 415 kN in shear. 279 mm deep beams have a theoretical ultimate capacity of
433 kN in flexure and 364 kN in shear. A Summary of Theoretical and Actual Capacities
are presented in Table 1.
Ten 914 mm long RC beams will be tested. three have no grooves, four have 3.2
mm deep grooves, and three have 6.4 mm deep grooves. Groove spacing is 102 mm, and
groove width is 3.2 mm. The beam and FRP dimensions (Figure 2) and groove dimen-
sions (Figure 3) are illustrated below.

59
Figure 2: Beam Dimensions
Figure 3: Groove Dimensions
VARTM Application Method
VARTM set-up begins with surface preparation to improve bonding. As was
mentioned in the introduction, grooving has been found to be an acceptable alternative to
traditional surface preparation. Fabric is placed first on the prepared surface, then the
release film, then the distribution mesh. One end of the infusion line is attached to the

60
beam at its low point, and the other end placed in the resin source. One end of each vac-
uum line is attached at the top edge of FRP on either side of the beam, and the other end
connected to a vacuum pump. Finally, a vacuum bag is placed and all edges and seams
are vacuum sealed.
VARTM fabrication begins when vacuum is applied and the resin is forced to
flow until the fiber is saturated. Infusion can be visually examined through the vacuum
plastic. The resin is allowed to cure for 24 hours under vacuum before the vacuum bag,
release film, and distribution mesh are removed. Finally, samples are allowed to age.
The VARTM method is illustrated below (Figure 4). Additional details of VARTM ap-
plication on infrastructure have been published (Uddin, et al. [20], [21] and [22]; Serrano-
Perez [19]).
Figure 4: VARTM Method Configuration
Test Program

61
The ultimate strength of each beam is determined while beams are supported and
loaded as shown below (Figure 5). Most of the requirements of ASTM’s third-point
loading test are followed (ASTM [5]), but the testing machine is hand operated and could
not provide a continuous load in one stroke.
Strain gauges are bonded to the beams as shown below (Figure 6). Vishay strain
gauges are used, and the manufacturer’s surface preparation and gauge installation in-
structions are followed (Vishay [25], [26] and [27]). Two strain gauges were applied to
one side, one at 45 degrees and one at 135 degrees from vertical, where shear was ex-
pected. One strain gauge was applied at the center of the bottom face, longitudinally,
where the maximum flexural strain was expected. After several different samples were
tested, it was found that shear strain was insignificant and that flexural strain governed
failure on all samples. Subsequently, shear strain gauges were no longer placed on sam-
ples with FRP. Only longitudinal strain gauge results are presented here.
Figure 5: Loading Configuration

62
Figure 6: Strain Gauge Configuration
Results and Discussion
254 mm deep beams (Figure 8) and 279 mm deep beams (Figure 10) both broke
with a single vertical crack very close to mid-span, clearly indicating a flexural FRP rup-
ture. Shear strain gauge readings were very low, and longitudinal strain gauge readings
were high and escalated noticeably before failure, confirming a flexural failure for all
cases. The FRP did not peel far from the vertical crack, so intermediate crack (IC)
debonding did not occur. No other form of debonding was evident. Thus, there is no in-
dication that cutting grooves in either of the beam types led to any delamination prob-
lems.
Note that the 279 mm deep beams are designed to fail in shear, but actually failed
in flexure. It is possible that the shear stirrups are spaced closer than the design specified,
leading to a higher shear strength than intended.

63
254 mm deep beam results are shown below, including a chart of load vs. longitu-
dinal strain (Figure 7), a picture of the typical flexural failure (Figure 8), and a Summary
of Theoretical and Actual Capacities (Table 4). 254 mm deep beams failed in flexure, as
they were designed to do. Actual ultimate capacities were on average 10% greater than
the theoretical predicted. This could be due to the reinforcement yield strength actually
being higher than 414 MPa, or ACI calculations providing a conservative estimate. Re-
sults were similar for all beams regardless of whether the beams had 3.2 mm deep
grooves, 6.4 mm deep grooves, or no grooves, as is evident visually in (Figure 7) and by
the low (4.72 kN) standard deviation calculated in (Table 5). Thus, there is no indication
that cutting grooves in 254 mm deep beams reduces their ultimate flexural strength.
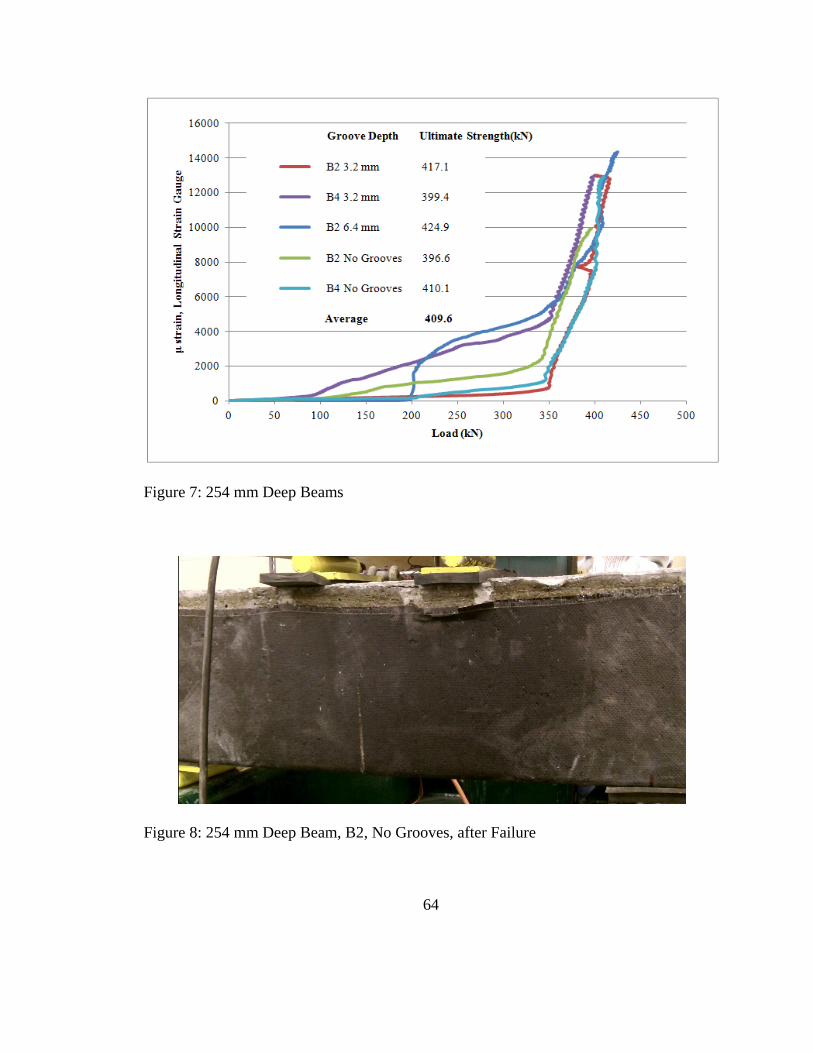
64
Figure 7: 254 mm Deep Beams
Figure 8: 254 mm Deep Beam, B2, No Grooves, after Failure
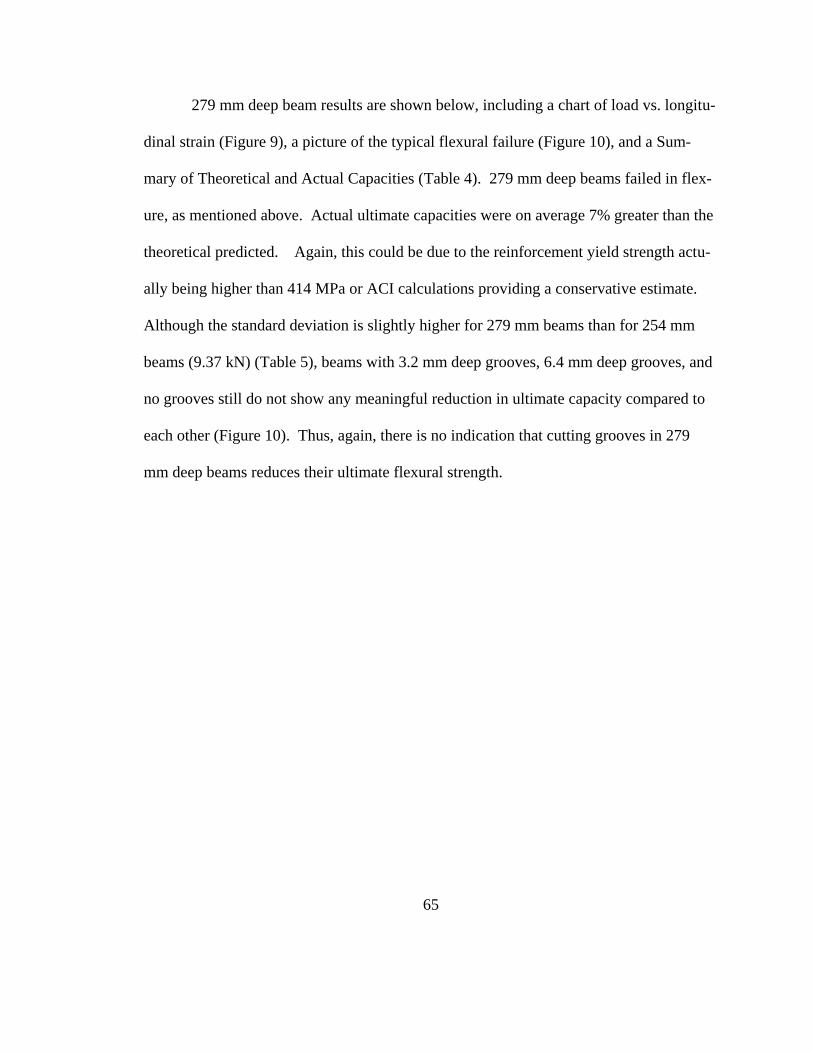
65
279 mm deep beam results are shown below, including a chart of load vs. longitu-
dinal strain (Figure 9), a picture of the typical flexural failure (Figure 10), and a Sum-
mary of Theoretical and Actual Capacities (Table 4). 279 mm deep beams failed in flex-
ure, as mentioned above. Actual ultimate capacities were on average 7% greater than the
theoretical predicted. Again, this could be due to the reinforcement yield strength actu-
ally being higher than 414 MPa or ACI calculations providing a conservative estimate.
Although the standard deviation is slightly higher for 279 mm beams than for 254 mm
beams (9.37 kN) (Table 5), beams with 3.2 mm deep grooves, 6.4 mm deep grooves, and
no grooves still do not show any meaningful reduction in ultimate capacity compared to
each other (Figure 10). Thus, again, there is no indication that cutting grooves in 279
mm deep beams reduces their ultimate flexural strength.

66
Figure 9: 279 mm Deep Beams
Figure 10: 279 mm Deep Beam, B1, No Grooves, after Failure

67
Table 4: Summary of Theoretical and Actual Capacities
Theoretical
Flexural
Capacity
Theoretical
Shear
Capacity (kN)
Average Actual
Ultimate
Capacity (kN)
Theoretical Flex-
ural Capacity Ex-
ceeded by
254 mm 372 kN a
415 kN a 410 kN
b 10%
279 mm 433 kN a
364 kN a 463 kN
c 7%
a
(ACI [2]), b see (Figure 7),
c see (Figure 9).
Table 5: Estimated Range of True Average Ultimate Strengths
Beam Depth, d 254 mm 279 mm
Sample Size, n 5 5
Average Ultimate Strength, As 410 kN a 463 kN
b
Spread of Values, b-a 28.3 kN a 56.2 kN
b
Standard Deviation c, 4.72 kN 9.37 kN
Exceedance Factor d 1.96 1.96
Maximum Error, E 6.3 kN 12.6 kN
Estimated Range of True Aver-
age Ultimate Strength, At
416 kN –
403 kN
476 kN –
451 kN
Note: Calculations Conform to ASTM E122, Example 4 (ASTM [4]). a see (Figure 7),
b see (Figure 9),
c Normal Distribution,
d 1 in 20 Probability of Exceed-
ance.
Conclusions
Although there was only five of each beam type, there was a tight group of results
with low standard deviations (Table 5). There is no indication that cutting grooves in ei-
ther of the beam types led to any delamination problems. Grooves were not found to be
defects, even though they are classified as such by ACI (ACI 2008) and NCHRP (Mirmi-
ran, et al. 2004 and 2008). There is also no indication that cutting grooves in either of the
beam types increases their ultimate flexural strength as previous research has found with
other groove configurations. Results of these tests indicate that cutting grooves, config-

68
ured to accelerate wet-out times in VARTM FRP application is neither a benefit nor a
detriment to the ultimate strength of the beam. This does not mean that grooving is not a
benefit worth studying.
Previous research has revealed several other benefits to grooving. Primarily,
grooving allows a faster and more consistent wet-out time for VARTM application.
Grooving can replace traditional surface preparation and help eliminate debonding. In
addition, grooving has been found to increase ultimate strength when grooves are cut in
other configurations. Additional research could be conducted to determine and optimize
a configuration of grooves that accelerates flow of VARTM FRP and increases its ulti-
mate strength.
Acknowledgements and Role of the Funding Source
The authors gratefully acknowledge funding and support provided by Alabama
Department of Transportation (ALDOT) Research Project 930-607B under the guidance
of Bridge Engineers Fred Conway and George Connor. The funding source had no in-
volvement in the study design; in the collection, analysis and interpretation of data; in the
wording of the report; or in the decision to submit the article for publication.

69
References
1. ACI 440R. Report on Fiber Reinforced Polymer (FRP) Reinforcement for Concrete
Structures. American Concrete Institute (ACI) Committee 440R-07, 2007, Farming-
ton Hills, MI.
2. ACI 440.2R. Guide for the Design and Construction of Externally Bonded FRP Sys-
tems for Strengthening Concrete Structures. ACI Committee 440.2R-08 2008, Farm-
ington Hills, MI.
3. Alfano, G., De Cicco, F., and Prota, A.. Intermediate Debonding Failure of RC
Beams Retrofitted in Flexure with FRP: Experimental Results versus Prediction of
Codes of Practice. Journal of Composites for Construction, 2011, 16(2), 185-195.
4. ASTM Standard E122. Calculating Sample Size to Estimate, With a Specified Toler-
able Error, the Average for a Characteristic of a Lot or Process, ASTM International,
West Conshohocken, PA. 2000.
5. ASTM Standard C78. Flexural Strength of Concrete (Using Simple Beam with
Third-Point Loading), ASTM International, West Conshohocken, PA. 2002.
6. Belarbi A., Bae S., Ayoub A., Kuchma D., Mirmiran A. and Okeil A.. Design of
FRP Systems for Strengthening Concrete Girders in Shear. NCHRP Rep. No. 678,
Transportation Research Board, Washington, D.C. 2011.
7. Delaney, J. C., and Karbhari, V.. The assessment of aspects related to defect criticali-
ty in CFRP strengthened concrete flexural members. Rep. No. SSRP 06/11, Dept. of
Structural Engineering, Univ. of California-San Diego, La Jolla, CA. 2006.

70
8. FHWA. 2010 Status of the Nation’s Highways, Bridges, and Transit: Conditions &
Performance <www.fhwa.dot.gov/policy/2010cpr/> July 28, 2012.
9. Kalayci, A., Yalim, B., and Mirmiran, A.. Effect of Untreated Surface Disbonds on
Performance of FRP-Retrofitted Concrete Beams. Journal of Composites for Con-
struction, 2009, 13(6), 476-485.
10. Karbhari, V.. Materials Considerations in FRP Rehabilitation of Concrete Structures.
Journal of Materials in Civil Engineering, 2001, 13(2), 90-97.
11. Mirmiran, A., Shahawy, M., Nanni, A., and Karbhari, V.. Bonded Repair and Retro-
fit of Concrete Structures Using FRP Composites - Recommended Construction
Specifications and Process Control Manual. NCHRP Rep. No. 514, Transportation
Research Board, Washington, D.C. 2004.
12. Mirmiran, A., Shahawy, M., Nanni, A., Karbhari, V., Yalim, B., and Kalayci, A. S..
Recommended Construction Specifications and Process Control Manual for Repair
and Retrofit of Concrete Structures Using Bonded FRP Composites. NCHRP Rep.
No. 609, Transportation Research Board, Washington, D.C. 2008.
13. Mostofinejad, D., and Mahmoudabadi, E.. Grooving as Alternative Method of Sur-
face Preparation to Postpone Debonding of FRP Laminates in Concrete Beams.
Journal of Composites for Construction, 2010, 14(6), 804-811.
14. Mostofinejad, D., and Shameli, M.. Performance of EBROG Method under Multi-
layer FRP Sheets for Flexural Strengthening of Concrete Beams. Procedia Engineer-
ing, 2011, 14(0), 3176-3182.

71
15. Mostofinejad, D., and Kashani, A.. Elimination of Debonding of FRP Strips in Shear
Strengthened Beams using Grooving Method. Proc., 1st International Conference on
Civil Engineering, Architecture and Building Materials, Trans Tech Publications,
2011, 1077-1081.
16. Mostofinejad, D., and Shameli, M.. Externally Bonded Reinforcement in Grooves
(EBRIG) Technique to Postpone Debonding of FRP Sheets in Strengthened Concrete
Beams. Construction and Building Materials, 2013, 38, 751-758.
17. Mostofinejad, D., and Kashani, A.. Experimental Study on Effect of EBR and
EBROG Methods on Debonding of FRP Sheets Used for Shear Strengthening of RC
Beams. Journal of Composites Part B: Engineering, 2013, 40(1), 1704-1713.
18. Ramos, L., Uddin, N. and Parrish, M.. Benefits of Grooving on Vacuum Assisted
Resin Transfer Molding (VARTM) FRP Wet-Out of RC Beams. Journal of Compo-
sites for Construction, 2013, Accepted for Publication.
19. Serrano-Perez, J. and Vaidya, U.. Modeling and Implementation of VARTM for Civ-
il Engineering Applications. SAMPE Journal, 2005, 41(1), 5-22.
20. Sika. Sikawrap Hex 103C Carbon Fiber. Product Sheet (Edition 6.23.2010),
<http://usa.sika.com/> July 28, 2012.

72
DURABILITY OF VACUUM ASSISTED RESIN TRANSFER MOLDING (VARTM)
FRP ON CONCRETE PRISMS
LUIS RAMOS AND NASIM UDDIN
Submitted to Journal of Composites for Construction (ASCE)

73
Abstract
Externally bonded fiber reinforced polymer (FRP) is increasingly being used for
concrete repair. Hand layup is the most common method of application. Vacuum Assist-
ed Resin Transfer Molding (VARTM), an alternate method of application, can produce
FRP with more consistent quality. This research evaluates the durability of FRP created
by both methods. Prisms wrapped in a single sheet of FRP are conditioned by freeze-
thaw cycling, while others are exposed to hygrothermal conditions combining high heat
and humidity. Half of the specimens are fabricated by VARTM and the other half by
hand layup. The ultimate strength and strain of specimens after conditioning is compared
to that of control specimens.
VARTM specimens are 12% stronger than hand layup specimens before condi-
tioning. After conditioning, however, VARTM specimens lose 3% to 4% more of their
strength, compared to hand layup specimens. VARTM specimens are stronger at first,
likely due to a more consistent application of resin; but lose more strength from condi-
tioning, probably because VARTM FRP has less resin to serve as a protective layer.
CE Database Subject Headings - Concrete beams; fiber reinforced polymer; vacuum;
epoxy; durability; thermal factors; freeze and thaw.

74
Introduction
Infrastructure in the United States is aging, making it a priority to improve meth-
ods of repair. According to the American Society of Civil Engineers (ASCE), the aver-
age age of bridges in this country is 43 years and most were designed to last 50 years
(ASCE 2009). ASCE estimates that we will have $930 billion of infrastructure invest-
ment needs over five years, but only estimate that $380.5 billion will be available as
funds (ASCE 2009). Given the age of our bridges and the lack of funds, the durability of
repairs should be an important consideration when deciding between repair options.
Research on externally bonded fiber reinforced polymer (FRP) has matured, lead-
ing to state-of-the-art reports from the American Concrete Institute (ACI 2007) and
guides for design and construction from (ACI 2008) and the National Cooperative High-
way Research Program (NCHRP) (Mirmiran, et al. 2004 and 2008; Zureick, et al. 2010;
Belarbi, et al. 2011). Despite the growing body of knowledge, durability and the refine-
ment of fabrication methods have been identified as research needs for FRP used in infra-
structure (Porter 2007).
There has been a lack of consensus on specimen specifications, accelerated condi-
tioning protocols (ACP) and mechanical test methods for durability studies (Porter 2007)
(ACI 2012). This research uses the latest guides for FRP durability testing (Dolan, et al.
2010) (ACI 2012).

75
Moisture and temperature are two of the most important factors affecting FRP du-
rability (Dolan, et al. 2010). An accelerated conditioning protocol (ACP) will be used for
each temperature extreme. Specimens are exposed to freeze-thaw conforming to the
American Society for Testing and Materials (ASTM) Standard C666 (ASTM 2008).
Other specimens are exposed to a hygrothermal ACP from an ACI Committee 440-L
draft document, “Accelerated Conditioning Protocols for Durability Assessment of Inter-
nal and External Fiber Reinforced Polymer (FRP) Reinforcement of Concrete” (440L –
FRP Durability Subcommittee, unpublished – draft document, March 14, 2012).
There is a general agreement that resin application is an important factor for the
durability of FRP. It is critical that an appropriate thickness of resin rich surface exist
(Karbhari 2003) because the resin serves as a protective layer (ACI 2012). It protects the
FRP and may also protect the concrete underneath (Cromwell, et al. 2011). Dolan found
that a set of specimens retained more strength after conditioning than another set and at-
tributed that in part to higher epoxy coverage (Dolan, et al. 2010). Hand layup produces
FRP with 70% or more resin by weight, while VARTM can produce FRP with just 40%
fiber by weight (JHM 2011). A thinner coat of resin may leave VARM FRP with less
protection from the elements.
On the other hand, VARTM FRP can achieve a more consistent application of
resin. The method of application of FRP makes a difference in the quality of the final
product. Hand layup inherently bears the potential for non-uniform wet-out of the fabric
(Karbhari 2001). Recent tests found that specimens created by hand layup were not uni-
form and produced test results with a high standard deviation (Li, et al. 2012). During

76
the fabrication of hand layup specimens for these tests, resin rich areas, bubbles, and oth-
er inconsistencies could be observed. Correcting these defects held the risk of wrinkling
the fiber.
Resin infusion, on the other hand, is capable of achieving uniformity, good fabric
compaction, and less unintended deformation (Karbhari 2001). VARTM has been inves-
tigated and found to develop a more homogenous interface (Uddin 2008). During the
fabrication of VARTM specimens for these tests, the resin could be observed creating a
thorough resin to filament bond without disturbing the fabric. Bubbles are pulled from
the FRP by the vacuum before the resin sets. The wet-out quality that VARTM can
achieve could give FRP greater strength and a more consistent protective surface.
A recent study demonstrated that preformed FRP had a clear advantage over hand
layup FRP in durability (Cromwell, et al. 2011). Cromwell pointed out that manufac-
tured materials had the advantage of quality control over hand layup and the advantage of
manufactured materials should not be surprising. Preformed FRP can be difficult to con-
form to girders in the field; especially around sectional transitions, diaphragms, inserts,
and other irregularities. Because of this drawback, preformed laminates are not consid-
ered for these tests. VARTM may have the inherent advantage of a manufactured prod-
uct with the flexibility of application.
The focus of this research is to compare the durability of VARTM specimens with
that of hand layup specimens. Porter (2007) believes that research aimed at establishing
uniform quality control for external FRP systems have a great likelihood of high return.
Improving the quality of external FRP is the broader objective of this research.

77
Materials and Specimens
Specimens are made of un-reinforced concrete prisms wrapped in a single sheet of
FRP. Specimens are identical, except for the method of FRP application. Five of each
(VARTM and hand layup) specimens are used as controls, another five of each is ex-
posed to hygrothermal ACP, and six of each is exposed to freeze-thaw ACP.
Un-damaged specimens are tested. Although concrete in the field is likely to ex-
hibit some damage, the concrete surface is expected to be repaired. Deep cracks are re-
quired to be injected with epoxy and rough surfaces are required to be ground to an ac-
ceptable surface profile (ACI 2008) (Mirmiran, et al. 2004 and 2008). New specimens
can be considered representative of concrete subject to repair.
The concrete is made of Quikrete 5000 (Quikrete 2000). No admixtures are add-
ed. A minimal amount of water is used, resulting in a slump of zero according to ASTM
C143 (ASTM 2005). The concrete has an average strength of 37.2 MPa and a standard
deviation of 1.0 MPa, determined using 11 cylinders tested by ASTM C39 (ASTM 2004).
Cylinder strength is determined after conditioning of test specimens, not at 28 days. Cyl-
inder strength is less than the 46 MPa minimum that (ACI 2012) specifies, but the aver-
age strength of these specimens may be more representative of older concrete typically in
need of repair. The average compressive strength of the concrete and the derived con-
crete properties are listed in (Table 6).

78
Table 6: Material Properties
Material Property Value Unit
Concrete Strength, f’c a
37.2 MPa
Concrete Modulus, Ec b 65132 MPa
Concrete Factor, 1 b
0.78
FRP Ply Thickness, tf c 1.016 mm
FRP Tensile Strength, ffu c 849 MPa
FRP Tensile Modulus, Ef c 70,552 MPa
FRP Rupture Strain, fu c 0.0112
a ASTM C39 (ASTM 2004),
b ACI 318 (ASTM 2011),
c Average Values (Sika 2010)
The concrete prisms are 76mm x 102 mm in section and 356 mm long to conform to
ASTM C666 (ASTM 2008). Prisms are removed from their molds 24 hours after casting
and cured according to ASTM C192 (ASTM 2000-1). Prism edges are rounded to a
radius of 13 mm and surfaces are ground to a concrete surface profile (CSP) 3 to conform
to ACI 440.2R (ACI 2008). The prism and FRP dimensions are illustrated in elevation (
Figure 1) and section (Figure 2) below. Specimens cannot conform to the config-
urations in (ACI 2012) Figure 5, as small FRP is impractical with VARTM and saw cuts
are not possible with vacuum pressure.
Figure 1: Specimen Elevation

79
Figure 2: Specimen Section
The FRP laminate is made of Sikadur 300 low viscosity epoxy resin (Sika 2008)
and Sikadur HEX 103C carbon fiber (Sika 2010). The carbon fiber is a cross-ply (0/90
type) reinforcement. Delamination can be a concern with externally bonded FRP appli-
cation. Delamination is a premature failure that does not reveal the ultimate strength of
the FRP material. In order to avoid delamination, specimens are completely wrapped
with FRP and the FRP is overlapped 25.4 mm. FRP properties are listed in (Table 6)
above.
Application Methods
Hand layup application is common, so the method will not be described in detail.
Instructions from the manufacturer were followed (Sika 2010). The epoxy was applied
by brush.
VARTM application starts by priming the concrete surface using Sikadur 300.
Fabric is placed first on the prepared surface, then the release film, then the distribution
mesh. One end of the infusion line is attached to the beam at its bottom and the other end

80
placed in the resin source. One end of the vacuum line is attached at the beam at its top,
and the other end is connected to a vacuum pump. Finally, a vacuum bag is placed and
all edges and seams are vacuum sealed. The resin is kept under vacuum, at 185 kPa
pump gauge pressure, for 24 hours so the resin does not drip or pond.
The VARTM method configuration is illustrated below (Figure 3). Additional de-
tails of VARTM application on infrastructure have been published (Uddin, et al. 2004,
2006 and 2008; Serrano-Perez 2005). The feasibility of vacuum curing (Stallings, et al.
2000) and Vacuum Assisted Resin Transfer Molding (VARTM) (Uddin, et al. 2004 and
2006) has been demonstrated on full size field applications.
Figure 3: VARTM Configuration
Specimens are fabricated, stored and tested in a laboratory where the temperature
set at 24°C and humidity is typically near 50%. Karbhari (2000 and 2002) points out that
FRP durability may be compromised by using ambient-cure systems, which intrinsically

81
have a lower glass transition temperature and may not reach full conversion at an early
age. Cromwell, et al. (2011) recorded some strength gains when initiating elevated tem-
perature protocols before subsequent degradation and speculated that the beneficial ef-
fects of post-cure offset the degradation. Lavorgna, et al. (2012) also found that hydro-
thermal aging caused specimens to reach their complete cure. Choi, et al. (2012) ob-
served an increase of physical properties of epoxy resins with hygrothermal exposure due
to reactivation of cross-linking reactions. The time required to complete the cross-linking
reaction of epoxy at ambient temperatures has been verified to be up to four or five
months (Sciolti, et al. 2010). Since epoxy being used is ambient-cured, specimens are
allowed to age for six months to ensure the FRP is fully cured before ACP is initiated.
Post-cure was not used because as Cromwell, et al. (2011) points out, the specimens
would no longer be representative of actual field implementation.
Test Program
Six of each (VARTM and hand layup) specimens are immersed in water in indi-
vidual trays and placed in a freeze-thaw chamber. The freeze thaw chamber cycles the
temperature between -18°C and 4°C, in conformance to ASTM C666 (ASTM 2003).
Specimens are exposed to 123 freeze-thaw cycles, then post cured before testing as speci-
fied in § 6.3.2 of (ACI 2012).
When conducting environmental tests, it is important to choose a fiber and matrix
that flex and expand at a similar rate. As Karbhari (2001) explains, “care must be taken
to ensure that the adhesive is chosen to match as closely as possible both the concrete and

82
composite in relation to their elastic moduli and coefficients of thermal expansion (CTE),
while providing an interlayer to reduce mismatch induced stresses.” Freeze-thaw tests of
glass, basalt, and carbon FRP have had negligible effects on glass and basalt FRP while
causing carbon FRP to lose 16% of its strength in 90 freeze-thaw cycles (Li, et al. 2012).
The CTE of carbon fiber is typically -0.6 to 0 x 10-6
(ACI 2008) and that of this epoxy is
60 x 10-6
(Sika 2008), and this differential rate of expansion is expected to be the cause of
degradation to the FRP from freeze-thaw cycling.
Five of each specimen is placed in an environmental chamber that circulates air at
a constant 100% relative humidity and 60°C. 60°C is the maximum service temperature
specified by the manufacturer for the epoxy and its glass transition temperature, Tg, is
79°C (Sika 2008). When ambient cured epoxy is exposed to hygrothermal conditioning,
the Tg has been shown to decrease and reduce the capacity of the epoxy to transfer loads
(Lavorgna, et al. 2012). Specimens are being exposed to their temperature limit and that
limit will decrease with time in the environmental chamber. Specimens are placed up-
right, spaced out, and elevated from the base by a grill so all surfaces are exposed. This
ACP conforms to § 6.3.2 of the draft ACI standards (ACI 2012) for protected service
conditions. ACP lasts 1500 hours, and then specimens are post cured and tested.
A single strain gage is bonded to the bottom face of all specimens, oriented longi-
tudinally and centered at mid-span as shown in (Figure 4). Vishay strain gages are used,
and the manufacturer’s surface preparation and gage installation instructions are followed
(Vishay 2010-1, 2010-2 and 2011).

83
Figure 4: Strain Gage Placement
The ultimate strength and corresponding strain is then tested. A test with two
load points, ASTM C78 (ASTM 2002), is used since it is more conservative and con-
sistent than the single load point test used in recent research (ACI 2012) (Dolan, et al.
2010).
The distance between supports is 228.6 mm. The distance from support to load
point, to next load point, to next support is 76.2 mm each. The strength test set up is
shown below (Figure 5). In this picture, there is a strain gage placed on the top and bot-
tom face of the beam. This was done for many samples and compressive as well as ten-
sile strain was recorded. Compressive strain data was inconsistent and did not provide

84
any insights, so the top strain gage was omitted from later specimens. Compressive strain
data will not be presented. The side with the 25.4 mm FRP overlap always faced up.
Figure 5: Strength Test Configuration
Various attempts were made to record deflection during ultimate strength tests.
Since specimens do not contain steel reinforcement, failure is sudden and violent. The
brittle failure put the deflectometer at risk, and it was decided to omit deflection meas-
urements. An early attempt at deflection measurement is shown below (Figure 6).

85
Figure 6: Strength Test - Deflectometer
Results and Discussion
Calculations are made following the method on Section 15.3 of ACI 400.2R (ACI
2008), to set expectations of the performance of specimens. The values in (Table 6)
above are used. The FRP on the bottom face and 25.4 mm up either side is counted as
tensile reinforcement. Specimens are tested with the 76 mm side vertical. Supports are
spaced 228.6 mm apart; one is a pin and one a roller. Loads are at third points from sup-
ports, so loading is at 76.2 mm spacing. The ultimate load capacity of a specimen calcu-
lated with an environmental-reduction factor CE for interior exposure is 39.7 kN and the
rupture strain is 0.86 x 10⁻⁶
(ACI 2008).

86
Specimens all failed in a similar fashion, which has been described as cohesive
failure (Choi, et al. 2012). Tension cracks initiated in and propagated through the con-
crete specimen without damaging or debonding from the FRP. Ultimately, the FRP rup-
tured in a brittle fashion with a clean vertical break down mid-span (Figure 7). Using
ASTM C78 creates the risk of a flexure-shear failure, but this was not the case with any
specimen tested (ASTM 2002). Concrete crushing was not evident.
Figure 7: Strength Test - Typical Break
Control Specimens had an average ultimate strength of 50.0 kN for VARTM
specimens and 44.5 kN for hand layup specimens. VARTM and hand layup specimens
were both stronger than the 39.7 kN anticipated from calculations. VARTM is 12.4%
stronger than hand layup on average. Both had an average of rupture strain of 1.1 x 10⁻⁶
,
which is also higher than calculations anticipated.

87
The average ultimate strength of specimens exposed to freeze-thaw is 36.5 kN for
VARTM specimens and 33.9 kN for hand layup specimens. VARTM retained 73% of its
strength, but hand layup did slightly better by retaining 76%. VARTM specimens ex-
posed to hygrothermal ACP retained 67% of their strength, and again hand layup did a
little better with 71% retained. Residual mechanical properties are shown in (Table 7).
The ultimate strength and strain are shown as well as retention, which represents the ratio
of strength or strain retained by specimens exposed to ACPs compared to control speci-
mens.
Average test data is presented in (Figure 8) and (Figure 9). Control specimen re-
sults are the same for both Figures, since they are from the same set of specimens. Con-
trol specimens are the first tested. The load is gradually applied and strain is noted at
predetermined load points. In order to create the plot, the average strain for all specimens
at each predetermined load point is calculated. Each data series ends at the average ulti-
mate strength for that set of specimens. Data for control specimens, once plotted, reveals
that data was collected too infrequently and creates an angular data series. More data
points are collected for freeze-thaw and hygrothermal specimens, which create smoother
plots.
Specimens have negligible strain until the concrete cracks, at which point there is
a jump in FRP strain. FRP has little delamination and shows no other sign of damage
when the concrete cracks. The FRP begins to make cracking sounds and small jumps in
strain can be detected, as loads approach ultimate. Failure is brittle.

88
Figure 8: Freeze-Thaw Specimen Load Tests
Figure 9: Hygrothermal Specimen Load Tests

89
Table 7: Residual Mechanical Properties
FRP Method of Application VARTM Hand Layup VARTM Hand Layup
ACP Freeze-Thaw Freeze-Thaw Hygrothermal Hygrothermal
Control Avg Ult Strength, Pb1 50.0 kN 44.5 kN 50.0 kN 44.5 kN
ACP Avg. Ult. Strength, Pb2 36.5 kN 33.9 kN 33.7 kN 31.4 kN
Ult. Strength Retention, Reb 73% 76% 67% 71%
Control Avg. Ult. Strain, b1 0.0113 0.0113 0.0113 0.0113
ACP Avg. Ult. Strain, b2 0.0102 0.0103 0.0105 0.0097
Ult. Strain Retention, Reb 90% 91% 93% 86%
Conclusions
There was a clear advantage, 12%, in the ultimate strength of the VARTM control
specimens over hand layup control specimens. Test results confirm what was seen in
fabrication and observed by previous researchers; that VARTM can produce an FRP of
better quality. This advantage diminishes as specimens are subject to ACP. VARTM
specimens continue to be stronger after exposure, but lose a little more of their initial
strength than hand layup specimens. Hand layup specimens retain 3% to 4% more of
their strength, compared to VARTM specimens.
The magnitude of strength loss is consistent with previous research. These tests
resulted in at least 70% strength retention for all conditions except VARTM under hygro-
thermal ACP, at 67%. Retention limits of 70% or more are recommended for carbon fi-
ber FRP to be considered to have improved resistance to moist environments (ACI 2012).
VARTM is known to produce an FRP with less resin. VARTM may promote bet-
ter wet-out of concrete and fibers and provide better strength if not exposed to the ele-
ments, but it leaves less resin to insulate and protect the FRP from exposure. VARTM
specimens could have performed better if less vacuum pressure was applied in fabrica-

90
tion, allowing more resin to remain and protect the FRP. Follow up research could ex-
plore the durability of FRP fabricated with greater amounts of resin.
Acknowledgements
The authors gratefully acknowledge funding and support provided by Alabama
Department of Transportation (ALDOT) Research Project 930-607B under the guidance
of Bridge Engineers Fred Conway and George Connor.

91
References
1. ACI 318 (2011). “Building Code Requirements for Structural Concrete and Com-
mentary.” American Concrete Institute (ACI) Committee 318, Farmington Hills, MI.
2. ACI 440R (2007). “Report on Fiber Reinforced Polymer (FRP) Reinforcement for
Concrete Structures.” American Concrete Institute (ACI) Committee 440R-07, Farm-
ington Hills, MI.
3. ACI 440.2R (2008). “Guide for the Design and Construction of Externally Bonded
FRP Systems for Strengthening Concrete Structures.” ACI Committee 440.2R-08,
Farmington Hills, MI.
4. ACI 440-0L (2012). “Accelerated Conditioning Protocols for Durability Assessment
of Internal and External Fiber Reinforced Polymer (FRP) Reinforcement of Con-
crete.” unpublished – draft document, ACI Committee 440-0L, Farmington Hills, MI.
5. ASCE (2009). “2009 Report Card for America's Infrastructure, Bridges”
<http://www.infrastructurereportcard.org/fact-sheet/bridges#conditions> (January 20,
2013)
6. ASTM Standard C39 (2004). “Standard Test Method for Compressive Strength of
Cylindrical Concrete Specimens.” ASTM International, West Conshohocken, PA.
7. ASTM Standard C78 (2002). “Flexural Strength of Concrete (Using Simple Beam
with Third-Point Loading).” ASTM International, West Conshohocken, PA.
8. ASTM Standard C143 (2005). “Standard Test Method for Slump of Hydraulic-
Cement Concrete.” ASTM International, West Conshohocken, PA.

92
9. ASTM Standard C192 (2000-1). “Standard Practice for Making and Curing Concrete
Test Specimens in the Laboratory.” ASTM International, West Conshohocken, PA.
10. ASTM Standard C666 (2003). “Standard Test Method for Resistance of Concrete to
Rapid Freezing and Thawing.” ASTM International, West Conshohocken, PA.
11. ASTM Standard E122 (2000-2). "Calculating Sample Size to Estimate, With a Speci-
fied Tolerable Error, the Average for a Characteristic of a Lot or Process," ASTM In-
ternational, West Conshohocken, PA.
12. Belarbi A., Bae S., Ayoub A., Kuchma D., Mirmiran A. and Okeil A. (2011). “De-
sign of FRP Systems for Strengthening Concrete Girders in Shear.” NCHRP Rep. No.
678, Transportation Research Board, Washington, D.C.
13. Choi, S., Gartner, A., Etten, N., Hamilton, H., and Douglas, E (2012). “Durability of
Concrete Beams Externally Reinforced with CFRP Composites Exposed to Various
Environments.” J. Compos. Constr., 16 (1), 10-20.
14. Cromwell, J., Harries, K., and Shahrooz, B. (2011). “Environmental Durability of Ex-
ternally Bonded FRP Materials Intended for Repair of Concrete Structures.” Con-
struction and Building Materials, 25(5), 2528.
15. Delaney, J., and Karbhari, V. (2006). “The assessment of aspects related to defect
criticality in CFRP strengthened concrete flexural members.” Rep. No. SSRP 06/11,
Dept. of Structural Engineering, Univ. of California-San Diego, La Jolla, CA.
16. Dolan, C., Tanner, J., Mukai, D., Hamilton, H., Douglas, E. (2010). “Evaluating Du-
rability of Bonded CFRP Repair/Strengthening of Concrete Beams.” NCHRP Web-

93
only document 155, <http://onlinepubs.trb.org/onlinepubs/nchrp/nchrp_w155.pdf>
(July 28, 2012).
17. FHWA (2010). “2010 Status of the Nation’s Highways, Bridges, and Transit: Condi-
tions & Performance.” <www.fhwa.dot.gov/policy/2010cpr/> (July 28, 2012).
18. JHM Technologies (2011). “Vacuum Assisted Resin Transfer Molding: What it is,
What it is Not, What it Can and What it Cannot Do.” <
http://www.rtmcomposites.com/vartm.html> (July 28, 2012).
19. Karbhari, V., Rivera, J., and Dutta, P. (2000). ”Effect of Short-Term Freeze-Thaw
Cycling on Composite Confined Concrete.” J. Compos. Constr., 4(4), 191–197.
20. Karbhari, V. (2001). "Materials Considerations in FRP Rehabilitation of Concrete
Structures." Journal of Materials in Civil Engineering, 13(2), 90-97.
21. Karbhari, V. (2002). ”Response of Fiber Reinforced Polymer Confined Concrete Ex-
posed to Freeze and Freeze-Thaw Regimes.” J. Compos. Constr., 6(1), 35–40.
22. Karbhari, V., Chin, J., Hunston, D., Benmokrane, B., Juska, T., Morgan, R., Lesko, J.,
Sorathia, U., and Reynaud, D. (2003). ”Durability Gap Analysis for Fiber-Reinforced
Polymer Composites in Civil Infrastructure.” J. Compos. Constr., 7(3), 238–247.
23. Lavorgna, M., Ludovico, M., Manfredi, G., Mensitieri, G., Piscitelli, F., and Prota, A.
(2012). "Improved mechanical properties of CFRP laminates at elevated temperatures
and freeze-thaw cycling." Construction and Building Materials, 31(1), 273.
24. Li, H., Xian, G., Lin, Q., and Zhang, H. (2012). "Freeze-Thaw Resistance of Unidi-
rectional-Fiber-Reinforced Epoxy Composites." J. of Applied Polymer Science, 123
(6), 3781-3788.

94
25. Mirmiran, A., Shahawy, M., Nanni, A., and Karbhari, V. (2004). “Bonded Repair and
Retrofit of Concrete Structures Using FRP Composites - Recommended Construction
Specifications and Process Control Manual.” NCHRP Rep. No. 514, Transportation
Research Board, Washington, D.C.
26. Mirmiran, A., Shahawy, M., Nanni, A., Karbhari, V., Yalim, B., and Kalayci, A. S.
(2008). “Recommended Construction Specifications and Process Control Manual for
Repair and Retrofit of Concrete Structures Using Bonded FRP Composites.” NCHRP
Rep. No. 609, Transportation Research Board, Washington, D.C.
27. PCI (2011). “PCI Bridge Design Manual, 3rd Edition, Appendix B.” Pre-
cast/Prestressed Concrete Institute (PCI) Chicago, IL.
28. Porter, M. and Harries, K. (2007). “Future Directions for Research in FRP Compo-
sites in Concrete Construction.” J. Compos. Constr., 11(3), 252-257.
29. Quikrete (2000). “Quikrete 5000 Concrete Mix”, Data Sheet (Edition 3.31.2000)
<http://www.quikrete.com/ProductLines/Quikrete5000ConcreteMix.asp> (February
27, 2013)
30. Sciolti MS, Frigione M, Aiello MA (2010). “Wet lay-up manufactured FRPs for Con-
crete and Masonry Repair: Influence of Water on the Properties of Composites and on
Their Epoxy Components.” J. Compos. Constr., 14(6), 823-33.
31. Serrano-Perez, J. and Vaidya, U. (2005). “Modeling and Implementation of VARTM
for Civil Engineering Applications.” SAMPE Journal, 41(1), 5-22.
32. Sika (2008). “Sikadur 300 Epoxy.” Product Sheet (Edition 7.1.2008),
<http://usa.sika.com/> (July 28, 2012).

95
33. Sika (2010). “Sikawrap Hex 103C Carbon Fiber.” Product Sheet (Edition 6.23.2010
Identification no. 332-30), <http://usa.sika.com/> (July 28, 2012).
34. Stallings, J., Tedesco, J., El-Mihilmy, M., and McCauley, M. (2000). "Field Perfor-
mance of FRP Bridge Repairs." Journal of Bridge Engineering, 5(2), 107-113.
35. Uddin, N., Vaidya, U., Shohel, M., and Serrano-Perez, J. (2004). "Cost Effective
Bridge Girder Strengthening Using Vacuum Assisted Resin Transfer Molding
(VARTM)." Advanced Composite Materials: The Official Journal of the Japan Socie-
ty of Composite Materials, 13(3-4), 255-281.
36. Uddin, N., Vaidya, U., Shohel, M. and Serrano-Perez., J. (2006). “Vacuum-Assisted
Resin Transfer Molding: An Alternative Method for Retrofitting Concrete Using Fi-
ber Composites.” Concrete International, 28 (11), 53-56.
37. Uddin, N., Shohel, M., Vaidya, U., and Serrano-Perez, J. (2008). "Bond Strength of
Carbon Fiber Sheet on Concrete Substrate Processed by Vacuum Assisted Resin
Transfer Molding." Advanced Composite Materials, 17(3), 277-299.
38. Vishay (2010-1). “Surface Preparation of Composites.” Document No. 11183 (Revi-
sion 09-Apr-10), <http://www.vishaypg.com/> (July 28, 2012).
39. Vishay (2010-2). “Strain Gage Installations for Concrete Structures.” Document No.
11091 (Revision 14-Nov-10), <http://www.vishaypg.com/> (July 28, 2012).
40. Vishay (2011). “Surface Preparation for Strain Gage Bonding.” Document No.
11129 (Revision 19-Dec-11), <http://www.vishaypg.com/> (July 28, 2012).
41. Zureick A., Ellingwood B., Nowak A., Mertz D. and Triantafillou, T. (2010). “Rec-
ommended Guide Specification for the Design of Externally Bonded FRP Systems

96
for Repair and Strengthening of Concrete Bridge Elements.” NCHRP Rep. No. 655,
Transportation Research Board, Washington, D.C.

97
CONCLUSIONS
This research has demonstrated that VARTM FRP can be a superior alternative to
hand layup FRP. The reasons for this expectation presented in the introduction are prov-
en by the test results.
VARTM FRP has a higher flexural and shear capacity than hand layup FRP, be-
cause of the uniformity and quality of the resin coating, which prevents surface bond
weakening.. The flexural VARTM beam has a 19% higher capacity than the flexural
hand layup beam. The shear VARTM beam has a 10% higher capacity than the shear
hand layup beam. Benefits should scale linearly, so the same magnitude of flexural and
shear strength gains would be expected in full scale beams with VARTM FRP. Test re-
sults reflect VARTM FRP expectations, born of experience from other industries.
Groove tests show them to be an effective way to hasten the VARTM application
process. Test results show that beams with 3.2 mm deep grooves wet-out in 22% of the
time that it takes beams without grooves. Times for beams with grooves can be reduced
further by angling grooves toward each corner of the beam. This will pull resin towards
the corners, which are the most difficult to wet-out.
There is no indication that cutting grooves leads to any delamination problems.
Results of these tests indicate that cutting grooves configured to accelerate wet-out times
in VARTM FRP application is neither a benefit nor a detriment to the ultimate strength of

98
the beam. This means that grooving is a benefit to the application time without any det-
riment to the performance of the finished product.
In durability testing, VARTM has noticeably better strength before exposure but
loses slightly more strength when exposed to the elements. VARTM control specimens
have a 12% greater ultimate strength over hand layup control specimens. Test results
confirm what was seen in fabrication and observed by previous researchers; that VARTM
can produce an FRP of better quality. This advantage diminishes as specimens are sub-
ject to ACP. VARTM specimens continue to be stronger after exposure, but lose 3% to
4% more of their initial strength than hand layup specimens.
VARTM is known to produce an FRP with less resin. VARTM may promote bet-
ter wet-out of concrete and fibers and provide better strength if not exposed to the ele-
ments, but it leaves less resin to insulate and protect the FRP from exposure. VARTM
specimens may perform better if less vacuum pressure was applied in fabrication, allow-
ing more resin to remain and protect the FRP.
Contributions to the State of the Art
For the first time, this work demonstrated conclusively the superior performance
of VARTM over the current state of the art, hand layup. By defining the relative perfor-
mance of hand layup and VARTM FRP, designers and owners can have a reasonable ex-
pectation of the strength to expect from VARTM retrofits. The ACI and NCHRP design
guides do not currently distinguish the strength of FRP based on its construction method.

99
This research reveals that the distinction bears inclusion in the codes, perhaps with differ-
ent factors to reflect their true performance.
I demonstrated the concept of grooving for the purpose of speeding the applica-
tion time of VARTM FRP on infrastructure, and demonstrated the efficiency of this novel
approach over the current state of the art for VARTM FRP application. This improve-
ment of the VARTM application process is a benefit to contractors and owners who wish
to speed up construction times. For contractors and owners alike, time is money. The
decrease in construction time will make the VARTM option more attractive to the parties
that decide what to build and how, and this can only increase the adoption of an duse of
VARTM FRP.
I attempted to fill the gap in FRP codes for both hand layup and VARTM FRP du-
rability. Tests were performed at both temperature extremes, namely freeze-thaw and
hygrothermal. There is a dearth of information on all aspects of durability, so using two
types of FRP exposed to two types of accelerated conditioning protocol does much to
shed light on a little known subject. Designers and owners now know what to expect in
the long term from FRP strengthening. This is an important consideration for designers
to provide overcapacity now in order for the rehabilitation to stand the test of time.
Owners will have a sense of the length of time over which the repairs and strengthening
will be functionally adequate. This will help owners see the cost and benefit over the life
of a project, helping owners choose the rehabilitation option that is most suitable over the
long term.

100
As a whole, each aspect of this project helped the three parties that decide on, de-
sign, and implement VARTM FRP. The body of knowledge presented here will give
these parties the confidence that results are defined, expectations are proven by research,
and decisions are knowledge based. The transfer of knowledge from the aerospace, ma-
rine and automotive fields should be facilitated by the verification that the benefit those
industries enjoy can also be taken advantage of in civil infrastructure.
Recommendations for Future Studies
The flexural and shear strength gains can be expected to be the same in full scale
beams, and in other structural applications. Tests should be conducted to verify these ex-
pectations on large scale specimens.
The flow of VARTM behaved differently depending on groove size. Unlike
strength testing, results for groove testing were specific to the beam size tested. Deeper
grooves, it turns out, take 50% longer to wet-out the face of beams tested. A variety of
groove depths and widths should be tested to determine the optimum groove.
Groove spacing is another variable that should optimized. Darcy’s Law was used
to predict the wet-out time. Darcy’s Law tells us that the time to wet-out is relative to the
square of the distance the resin has to flow. Thus, we can anticipate that tighter groove
spacing would lead to faster wet-out time. Tests should be done to confirm this expecta-
tion
Durability studies revealed that the resin coating the FRP acts to protect the FRP
from structural degradation. The amount of resin content in VARTM should be varied

101
for future durability studies. The amount of resin can be varied by adjusting the vacuum
pressure used to cure the FRP. One can reasonably expect VARTM to retain more of its
strength after exposure, if more resin is left on the final product.
VARTM FRP application on steel structures should be explored. Grooving is
much more practical on concrete, than on steel. A 5 ¼ inch rotary saw, which are rea-
sonably cheap and commonly available in many home improvement stores was used to
cut the grooves in concrete. Cuts were easy to make and cutting progressed quickly.
Grooving on steel beams would not be as convenient and quick. Some thought and test-
ing should be put into how to improve VARTM application on steel beams.
Innovative application of VARTM in other infrastructures should be explored in-
cluding water tanks, runways, buildings. There is no limit to what VARTM can be ap-
plied to, since it conforms to any shape. The performance in these other applications is
not known and may not mirror that on beams.
Status of Submissions
“Strengthening of RC Beams with FRP Applied by Vacuum Assisted Resin
Transfer Molding (VARTM)”, was submitted as a “technical paper” to ASCE’s Journal
of Composites for Construction. A reviewer recommended that it be submitted as a
“technical note”. Efforts to publish are still under way.
“Benefits of Grooving on Vacuum Assisted Resin Transfer Molding (VARTM)
FRP Wet-out of RC Beams”, was also submitted as a “technical paper” to ASCE’s Jour-
nal of Composites for Construction. It was well received. After revisions, ASCE accept-

102
ed the paper for publication on January 18, 2013. It has not been published in print, yet,
but it is posted online. The paper can be viewed at the following Permalink:
http://dx.doi.org/10.1061/(ASCE)CC.1943-5614.0000365.
“Benefits of Grooving on Vacuum Assisted Resin Transfer Molding (VARTM)
FRP Strengthening of RC Beams”, was submitted to Elsevier’s Journal called Composite
Structures. Efforts to publish it continue.
“Durability of Vacuum Assisted Resin Transfer Molding (VARTM) FRP on Con-
crete Prisms was recently submitted to ASCE’s Journal of Composites for Construction.
Review comments have not been received yet.
ACKNOWLEDGEMENTS
The authors gratefully acknowledge funding and support provided by Alabama
Department of Transportation (ALDOT) Research Project 930-607B under the guidance
of Bridge Engineers Fred Conway and George Connor.
103
REFERENCES
1. ACI 318 (2011). “Building Code Requirements for Structural Concrete and Com-
mentary.” ACI Committee 318, Farmington Hills, MI.
2. ACI 440R (2007). “Report on Fiber Reinforced Polymer (FRP) Reinforcement for
Concrete Structures.” ACI Committee 440R-07, Farmington Hills, MI.
3. ACI 440.2R (2008). “Guide for the Design and Construction of Externally Bonded
FRP Systems for Strengthening Concrete Structures.” ACI Committee 440.2R-08,
Farmington Hills, MI.
4. ACI 440-0L (2012). “Accelerated Conditioning Protocols for Durability Assessment
of Internal and External Fiber Reinforced Polymer (FRP) Reinforcement of Con-
crete.” unpublished – draft document, ACI Committee 440-0L, Farmington Hills, MI.
5. Alfano, G., De Cicco, F., and Prota, A. (2011). “Intermediate Debonding Failure of
RC Beams Retrofitted in Flexure with FRP: Experimental Results versus Prediction
of Codes of Practice.” Journal of Composites for Construction, 16(2), 185-195.
6. Arduini, M., and Nanni, A. (1997). “Behavior of Precracked RC Beams Strengthened
with Carbon FRP Sheets.” Journal of Composites for Construction, 1(2), 63-70.
7. ASCE (2009). “2009 Report Card for America's Infrastructure, Bridges”
<http://www.infrastructurereportcard.org/fact-sheet/bridges#conditions> (January 20,
2013)

104
8. ASTM Standard C39 (2004). “Standard Test Method for Compressive Strength of
Cylindrical Concrete Specimens.” ASTM International, West Conshohocken, PA.
9. ASTM Standard C78 (2002). “Flexural Strength of Concrete (Using Simple Beam
with Third-Point Loading).” ASTM International, West Conshohocken, PA.
10. ASTM Standard C143 (2005). “Standard Test Method for Slump of Hydraulic-
Cement Concrete.” ASTM International, West Conshohocken, PA.
11. ASTM Standard C192 (2000-1). “Standard Practice for Making and Curing Concrete
Test Specimens in the Laboratory.” ASTM International, West Conshohocken, PA.
12. ASTM Standard C666 (2003). “Standard Test Method for Resistance of Concrete to
Rapid Freezing and Thawing.” ASTM International, West Conshohocken, PA.
13. ASTM Standard E122 (2000-2). “Calculating Sample Size to Estimate, With a Speci-
fied Tolerable Error, the Average for a Characteristic of a Lot or Process.” ASTM In-
ternational, West Conshohocken, PA.
14. Belarbi A., Bae S., Ayoub A., Kuchma D., Mirmiran A. and Okeil A. (2011). “De-
sign of FRP Systems for Strengthening Concrete Girders in Shear.” NCHRP Rep. No.
678, Transportation Research Board, Washington, D.C.
15. Cao, S., Chen, J., Teng, J., and Hao, Z. (2005). “Debonding in RC Beams Shear
Strengthened with Complete FRP Wraps.” Journal of Composites for Construction,
9(5), 417-428.
16. Choi, S., Gartner, A., Etten, N., Hamilton, H., and Douglas, E (2012). “Durability of
Concrete Beams Externally Reinforced with CFRP Composites Exposed to Various
Environments.” Journal of Composites for Construction, 16 (1), 10-20.

105
17. Cromwell, J., Harries, K., and Shahrooz, B. (2011). “Environmental Durability of Ex-
ternally Bonded FRP Materials Intended for Repair of Concrete Structures.” Con-
struction and Building Materials, 25(5), 2528.
18. Delaney, J., and Karbhari, V. (2006). “The assessment of aspects related to defect
criticality in CFRP strengthened concrete flexural members.” Rep. No. SSRP 06/11,
Dept. of Structural Engineering, Univ. of California-San Diego, La Jolla, CA.
19. Dolan, C., Tanner, J., Mukai, D., Hamilton, H., Douglas, E. (2010). “Evaluating Du-
rability of Bonded CFRP Repair/Strengthening of Concrete Beams.” NCHRP Web-
only document 155, <http://onlinepubs.trb.org/onlinepubs/nchrp/nchrp_w155.pdf>
(July 28, 2012).
20. FHWA (2010). “2010 Status of the Nation’s Highways, Bridges, and Transit: Condi-
tions & Performance.” <www.fhwa.dot.gov/policy/2010cpr/> (July 28, 2012).
21. JHM Technologies (2011). “Vacuum Assisted Resin Transfer Molding: What it is,
What it is Not, What it Can and What it Cannot Do.”
<http://www.rtmcomposites.com/vartm.html> (July 28, 2012).
22. Kalayci, A., Yalim, B., and Mirmiran, A. (2009). “Effect of Untreated Surface Dis-
bonds on Performance of FRP-Retrofitted Concrete Beams.” Journal of Composites
for Construction, 13(6), 476-485.
23. Karbhari, V., Rivera, J., and Dutta, P. (2000). “Effect of Short-Term Freeze-Thaw
Cycling on Composite Confined Concrete.” Journal of Composites for Construction,
4(4), 191–197.

106
24. Karbhari, V. (2001). “Materials Considerations in FRP Rehabilitation of Concrete
Structures.” Journal of Materials in Civil Engineering, 13(2), 90-97.
25. Karbhari, V. (2002). “Response of Fiber Reinforced Polymer Confined Concrete Ex-
posed to Freeze and Freeze-Thaw Regimes.” Journal of Composites for Construction,
6(1), 35–40.
26. Karbhari, V., Chin, J., Hunston, D., Benmokrane, B., Juska, T., Morgan, R., Lesko, J.,
Sorathia, U., and Reynaud, D. (2003). “Durability Gap Analysis for Fiber-Reinforced
Polymer Composites in Civil Infrastructure.” Journal of Composites for Construction,
7(3), 238–247.
27. Lavorgna, M., Ludovico, M., Manfredi, G., Mensitieri, G., Piscitelli, F., and Prota, A.
(2012). “Improved mechanical properties of CFRP laminates at elevated temperatures
and freeze-thaw cycling.” Construction and Building Materials, 31(1), 273.
28. Li, H., Xian, G., Lin, Q., and Zhang, H. (2012). “Freeze-Thaw Resistance of Unidi-
rectional-Fiber-Reinforced Epoxy Composites.” Journal of Applied Polymer Science,
123 (6), 3781-3788.
29. Liu, I., Oehlers, D., and Seracino, R. (2007). “Study of Intermediate Crack Debond-
ing in Adhesively Plated Beams.” Journal of Composites for Construction, 11(2),
175-183.
30. Mirmiran, A., Shahawy, M., Nanni, A., and Karbhari, V. (2004). “Bonded Repair and
Retrofit of Concrete Structures Using FRP Composites - Recommended Construction
Specifications and Process Control Manual.” NCHRP Rep. No. 514, Transportation
Research Board, Washington, D.C.

107
31. Mirmiran, A., Shahawy, M., Nanni, A., Karbhari, V., Yalim, B., and Kalayci, A. S.
(2008). “Recommended Construction Specifications and Process Control Manual for
Repair and Retrofit of Concrete Structures Using Bonded FRP Composites.” NCHRP
Rep. No. 609, Transportation Research Board, Washington, D.C.
32. Mostofinejad, D., and Mahmoudabadi, E. (2010). “Grooving as Alternative Method
of Surface Preparation to Postpone Debonding of FRP Laminates in Concrete
Beams.” Journal of Composites for Construction, 14(6), 804-811.
33. Mostofinejad, D., and Shameli, M. (2011-1). “Performance of EBROG Method un-
der Multilayer FRP Sheets for Flexural Strengthening of Concrete Beams.” Procedia
Engineering, 14(0), 3176-3182.
34. Mostofinejad, D., and Kashani, A. (2011-2). “Elimination of Debonding of FRP
Strips in Shear Strengthened Beams using Grooving Method.” Proc., 1st Interna-
tional Conference on Civil Engineering, Architecture and Building Materials, Trans
Tech Publications, 1077-1081.
35. Mostofinejad, D., and Shameli, M. (2013-1). “Externally Bonded Reinforcement in
Grooves (EBRIG) Technique to Postpone Debonding of FRP Sheets in Strengthened
Concrete Beams.” Construction and Building Materials, 38, 751-758.
36. Mostofinejad, D., and Kashani, A.(2013-2). “Experimental Study on Effect of EBR
and EBROG Methods on Debonding of FRP Sheets Used for Shear Strengthening of
RC Beams.” Journal of Composites Part B: Engineering, 40(1), 1704-1713.
37. PCI (2011). “PCI Bridge Design Manual, 3rd
Edition, Appendix B.” Pre-
cast/Prestressed Concrete Institute (PCI), Chicago, IL.

108
38. Porter, M. and Harries, K. (2007). “Future Directions for Research in FRP Compo-
sites in Concrete Construction.” Journal of Composites for Construction, 11(3), 252-
257.
39. Quikrete (2000). “Quikrete 5000 Concrete Mix”, Data Sheet (Edition 3.31.2000)
<http://www.quikrete.com/ProductLines/Quikrete5000ConcreteMix.asp> (February
27, 2013)
40. Ramos, L., Uddin, N., and Parrish, M. (2013). “Benefits of Grooving on Vacuum
Assisted Resin Transfer Molding (VARTM) FRP Wet-Out of RC Beams.” Journal
of Composites for Construction, doi: 10.1061/(ASCE)CC.1943-5614.0000365.
41. Sciolti MS, Frigione M, Aiello MA (2010). “Wet lay-up manufactured FRPs for Con-
crete and Masonry Repair: Influence of Water on the Properties of Composites and on
Their Epoxy Components.” Journal of Composites for Construction, 14(6), 823-33.
42. Serrano-Perez, J. and Vaidya, U. (2005). “Modeling and Implementation of VARTM
for Civil Engineering Applications.” SAMPE Journal, 41(1), 5-22.
43. Sika (2008). “Sikadur 300 Epoxy.” Product Sheet (Edition 7.1.2008),
<http://usa.sika.com/> (July 28, 2012).
44. Sika (2010). “Sikawrap Hex 103C Carbon Fiber.” Product Sheet (Edition 6.23.2010
Identification no. 332-30), <http://usa.sika.com/> (July 28, 2012).
45. Stallings, J., Tedesco, J., El-Mihilmy, M., and McCauley, M. (2000). “Field Perfor-
mance of FRP Bridge Repairs.” Journal of Bridge Engineering, 5(2), 107-113.
46. Uddin, N., Vaidya, U., Shohel, M., and Serrano-Perez, J. (2004). “Cost Effective
Bridge Girder Strengthening Using Vacuum Assisted Resin Transfer Molding

109
(VARTM).” Advanced Composite Materials: The Official Journal of the Japan So-
ciety of Composite Materials, 13(3-4), 255-281.
47. Uddin, N., Vaidya, U., Shohel, M. and Serrano-Perez., J. (2006). “Vacuum-Assisted
Resin Transfer Molding: An Alternative Method for Retrofitting Concrete Using Fi-
ber Composites.” Concrete International, 28 (11), 53-56.
48. Uddin, N., Shohel, M., Vaidya, U., and Serrano-Perez, J. (2008). “Bond Strength of
Carbon Fiber Sheet on Concrete Substrate Processed by Vacuum Assisted Resin
Transfer Molding.” Advanced Composite Materials, 17(3), 277-299.
49. Vishay (2010-1). “Surface Preparation of Composites.” Document No. 11183 (Revi-
sion 09-Apr-10), <http://www.vishaypg.com/> (July 28, 2012).
50. Vishay (2010-2). “Strain Gage Installations for Concrete Structures.” Document No.
11091 (Revision 14-Nov-10), <http://www.vishaypg.com/> (July 28, 2012).
51. Vishay (2011). “Surface Preparation for Strain Gage Bonding.” Document No.
11129 (Revision 19-Dec-11), <http://www.vishaypg.com/> (July 28, 2012).
52. Yalim, B., Kalayci, A., and Mirmiran, A. (2008). “Performance of FRP Strengthened
RC Beams with Different Concrete Surface Profiles.” Journal of Composites for Con-
struction, 12(6), 626-634.
53. Zureick A., Ellingwood B., Nowak A., Mertz D. and Triantafillou, T. (2010). “Rec-
ommended Guide Specification for the Design of Externally Bonded FRP Systems
for Repair and Strengthening of Concrete Bridge Elements.” NCHRP Rep. No. 655,
Transportation Research Board, Washington, D.C.

110
APPENDIX A
A GUIDE TO VARTM

PRACTICAL IMPLEMENTATION OF VACUUM ASSISTED RESIN TRANSFER MOLDING (VARTM) FOR
BRIDGE STRENGTHENING
by
MARTIN WARUINGE
NASSIM UDDIN , COMMITTEE CHAIR ROBERT W. PETERS
IAN HOSCH
A NON THESIS
Submitted to the graduate faculty of The University of Alabama at Birmingham, in partial fulfillment of the requirements for the degree of Master of Science
BIRMINGHAM, ALABAMA 2012

ii
PRACTICAL IMPLEMENTATION OF VACUUM ASSISTED RESIN TRANSFER MOLDING (VARTM) FOR BRIDGE STRENGTHENING
MARTIN WARUINGE
CIVIL ENGINEERING
ABSTRACT
Deterioration of concrete in bridges is a challenge today to many transportation
departments around the world and is a result of structural cracks on the concrete, steel
corrosion, and loss of bond between the concrete and reinforcing bars. In many places
where winter is characterized by snow and ice, de-icing agents and freeze-thaw cycle
play a major role in this deterioration. Bridges and roadways have been deteriorating at
a faster rate than that for which they were originally designed. For this reason a
dependable, high-quality repair method is necessary for enhancing the service life of
bridge structures. To prevent this deterioration a cost-effective method that is easier to
implement in the field is necessary for bridge structures. Vacuum Assisted Resin
Transfer Molding (VARTM), a method that involves application of fiber reinforced
polymer sheets to the bridge to improve its capacity using epoxy resin, has proved to be
a success in concrete repair. An effective application of this process is described in detail
in this report. The task has been divided into five sections, and the first section deals
with determining the deficient in capacity. To reinstall this capacity, one has to
determine the Fiber Reinforced Polymers (FRP) sheets needed, and this is discussed in

iii
the second section. Application of the FRP sheets involves moving epoxy resin through
the permeable membrane using a vacuum suction, and how to place the tubes is
discussed in the following section. The later sections involve developing a model that
can be used in similar girders and the cost of the entire process.

iv
ACKNOWLEDGEMENTS
The author is greatly indebted to Dr. Nasim Uddin, professor of Structural
Engineering at the University of Alabama at Birmingham Department of Construction
and Environmental Engineering, who gave me this practical opportunity to learn the
subject and who believed in my abilities for the development of this project; his
support, advice, and expertise will be forever remembered. I also wish to thank my
committee members, Dr. Hosch, and Dr. Peters, for their input, time, collaboration and
constructive criticism to this project.
Last but definitely not least I wish to thank a fellow student in the civil
engineering department, Luis Ramos, for the assistance he gave me in learning this
subject.

v
TABLE OF CONTENTS Page
ABSTRACT .........................................................................................................................ii
ACKNOWLEDGEMENTS ....................................................................................................iv
LIST OF TABLES ................................................................................................................viii
LIST OF FIGURES ...............................................................................................................ix
CHAPTER
1. INTRODUCTION ....................................................................................................1
1.1 General Background ......................................................................................1
1.2 Objectives.......................................................................................................3
2. DETERMINING MOMENT AND SHEAR CAPACITY ................................................4
2.1 Introduction ...................................................................................................4
2.2 Design or Nominal Moment Capacity ............................................................4
2.3 Factored Moment Mu and Shear Vu .............................................................6
2.3.1 Moment Calculation .............................................................................7 2.3.2 Shear Calculation ..................................................................................8
2.4 Moment/ Shear Comparison .........................................................................9
3. DETERMINING FRP LAYERS NEEDED FOR REINFORCEMENT ...............................10
3.1 Introduction ...................................................................................................10
3.2 Flexural Strengthening ...................................................................................11
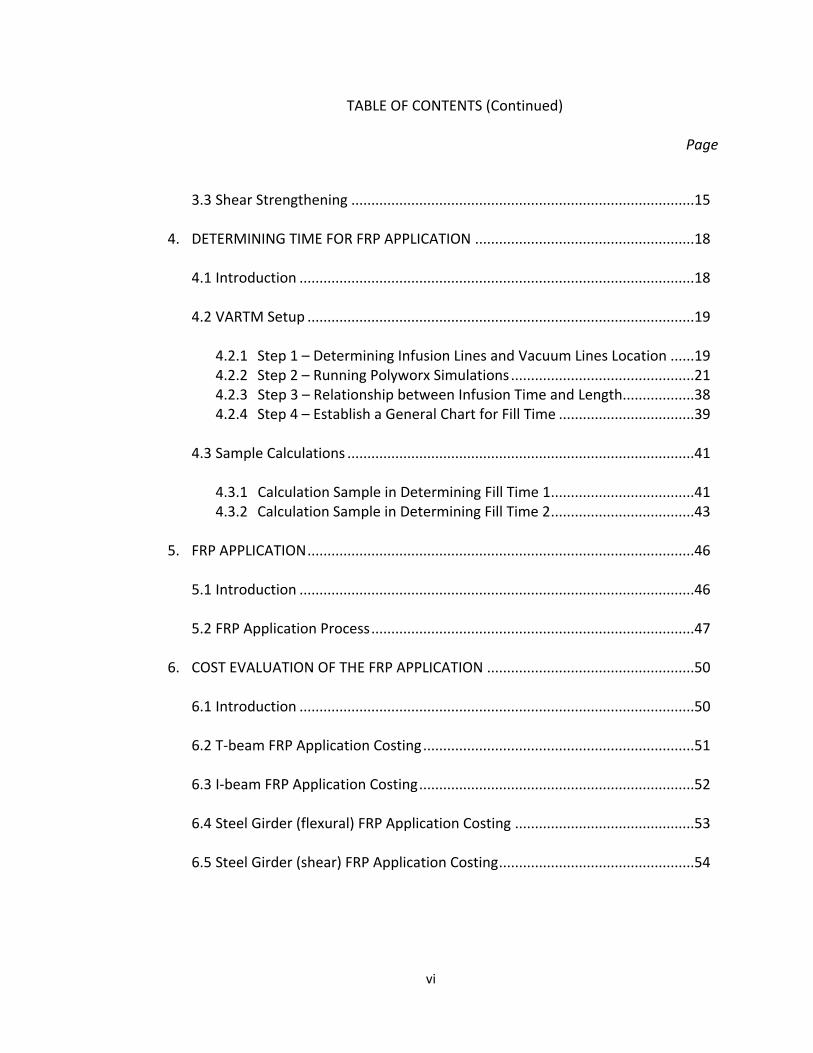
vi
TABLE OF CONTENTS (Continued)
Page
3.3 Shear Strengthening ......................................................................................15
4. DETERMINING TIME FOR FRP APPLICATION .......................................................18
4.1 Introduction ...................................................................................................18
4.2 VARTM Setup .................................................................................................19
4.2.1 Step 1 – Determining Infusion Lines and Vacuum Lines Location ......19 4.2.2 Step 2 – Running Polyworx Simulations ..............................................21 4.2.3 Step 3 – Relationship between Infusion Time and Length..................38 4.2.4 Step 4 – Establish a General Chart for Fill Time ..................................39
4.3 Sample Calculations .......................................................................................41
4.3.1 Calculation Sample in Determining Fill Time 1 ....................................41 4.3.2 Calculation Sample in Determining Fill Time 2 ....................................43
5. FRP APPLICATION .................................................................................................46
5.1 Introduction ...................................................................................................46
5.2 FRP Application Process .................................................................................47
6. COST EVALUATION OF THE FRP APPLICATION ....................................................50
6.1 Introduction ...................................................................................................50
6.2 T-beam FRP Application Costing ....................................................................51
6.3 I-beam FRP Application Costing .....................................................................52
6.4 Steel Girder (flexural) FRP Application Costing .............................................53
6.5 Steel Girder (shear) FRP Application Costing .................................................54

vii
TABLE OF CONTENTS (Continued)
Page
6.6 Cost Discussion ..............................................................................................55
7. CONCLUSION PERTAINING TO FIELD IMPLEMENTATION OF VARTM IN BRIDGE STRUCTURES .......................................................................................56
LIST OF REFERENCES ...............................................................................................59
APPENDIX
A. RESIN AND FIBER PROPERTIES .......................................................................61
B. T-BEAM MOMENT AND SHEAR CALCULATION ..............................................63
C. FLEXURAL STRENGTHENING ..........................................................................71
D. SHEAR STRENGTHENING ................................................................................76

viii
LIST OF TABLES
Table Page
3.1 Environmental reduction factors for various FRP systems ........................................11
4.1 Polyworx parameters .................................................................................................22
4.2 Infusion times for plexiglas trials ...............................................................................39
4.3 Unit length fill times ..................................................................................................40
4.4 Placement and fill time for a 20-ft. standard girder ..................................................43
4.5 Placement and fill time for a 50-ft. standard girder ..................................................45
6.1 Variable costs for T-beam FRP application process ...................................................51
6.2 Fixed costs for T-beam FRP application process ........................................................51
6.3 Variable costs for I-beam FRP application process ....................................................52
6.4 Fixed costs for I-beam FRP application process .........................................................52
6.5 Variable costs for steel girder (flexural) FRP Application process .............................53
6.6 Fixed costs for steel girder (flexural) FRP application process ..................................53
6.7 Variable costs for steel girder (shear) FRP application process ................................54
6.8 Fixed costs for steel girder (shear) FRP application process .....................................54

ix
LIST OF FIGURES
Figure Page 2.1 Determining φMn of a rectangular beam..................................................................5
2.2 Additional reinforcement required ............................................................................9
4.1 Summarized process for VARTM application ............................................................19
4.2 Proposed placement of infusion and vacuum lines – Rectangular section ...............20
4.3 Proposed placement of infusion and vacuum lines – I-girder section ......................20
4.4 Proposed placement of infusion and vacuum lines – Steel girder section ................20
4.5 Infusion by series of applications ...............................................................................21
4.6 Rectangular case 1-1 ..................................................................................................23
4.7 A-E: 20%, 40%, 60%, 80%, and 100% at various minutes ..........................................24
4.8 Rectangular case 1-2 ..................................................................................................25
4.9 A-E 20%, 40%, 60%, 80%, and 100% at various minutes ...........................................26
4.10 I-beam case 2-1 ........................................................................................................28
4.11A-E 20%, 40%, 60%, 80%, and 100% at various minutes ..........................................29
4.12 I-beam case 2-2 ........................................................................................................30
4.13A-E: 20%, 40%, 60%, 80%, and 100% at various minutes .........................................31
4.14 Steel girder case 3-1 .................................................................................................33
4.15A-E: 20%, 40%, 60%, 80%, and 100% at various minutes .........................................34
4.16 Steel girder case 3-2 .................................................................................................35
4.17A-E: 20%, 40%, 60%, 80%, and 100% at various minutes .........................................36

x
LIST OF FIGURES (Continued)
Figure Page
4.18 Experiential setup for plexiglas ................................................................................38
4.19 Infusion by series of applications for a 20-ft. T-girder .............................................42
4.20 Infusion by series of applications for a 50-ft. T-girder .............................................44
5.1 VARTM process (Simplified) .......................................................................................46
5.2 Alternating layers of FRP ............................................................................................47
5.3 Release fabric .............................................................................................................48
5.4 Distribution mesh .......................................................................................................48
6.1 Cost of repairing a 50-ft. girder with FRP using four different approaches ..............55

1
CHAPTER 1
INTRODUCTION
1.1 General Background
Good quality infrastructure in transportation is a key mover in the sustainable
development of any nation. The United States and others economies around the world
have shown a significant, continual growth during the past century. With this growth, a
demand for an efficient transportation infrastructure to connect the commerce hubs
remains high. Over the last half a century, a vast array of arterial highway systems was
constructed, making current bridges structurally inefficient due to the extra traffic
emanating from these highways. Civil engineering is seeing a remarkable growth in the
rehabilitation and repair of the bridge infrastructure, which is mainly done through
bolting or adhesive bonding of steel plates or the FRP to the reinforced concrete beams.
In the article “Composites in Civil Applications,” (Wu, 1999), it is estimated that it
would cost $617 billion just to repair the roads and bridges that have deteriorated to
below minimum acceptable standards. Another 238,000 less than sufficient bridges will
require an additional $90,000,000 to repair. These figures were 1999 estimates and
when inflation is taken into account, the cost has tripled by 2012. Many roads and
bridges were designed to carry less service load than they are carrying now, which has
contributed to faster deterioration, making 40% of them either structurally deficient or

2
obsolete according to( Wu, 1999). Seismic activities contribute to structural damage,
and hence there is a demand to quickly retrofit the damaged girders, columns, and
other structural components.
Fiber Reinforced Polymers (FRP) may be the answer to the growing number of
structural problems. According to (Wu, 1999), FRP composites have been extensively
developed and used in the aerospace industry due to their ability to deter deterioration
caused by contact with salt and a weight-to-strength ratio 50 times that of concrete and
18 times that of steel. It can be used for confinement, flexural strengthening, seismic
strengthening impact strengthening, and shear strengthening, according to Sika’s Global
Brochures Structural Strengthening (Sika Group, 2007). However utilizing FRP in
structural applications has shortfalls such as bonding issues, material processing and
ultimately the cost. Lack of design and also well-trained manpower to apply the FRP to
the civil structure is another drawback. More research is being conducted by the
American Concrete Institute (ACI), and ACI Committee 440 has published a journal on
FRP placement “Guide for the Design and Construction of Externally Bonded FRP Systems
for Strengthening Concrete Structures”.(ACI, 2008).
Vacuum Assisted Resin Transfer Molding (VARTM) is a method that is proving to
be a success in externally reinforcing FRP to concrete structures. It’s a process where
the FRP fabric is attached to a civil surface by vacuum infusion of resin.
Prior to the VARTM process, FRP was most commonly applied to the civil surface
through the method of hand lay-up. This method involves applying epoxy resin by hand.
In using this method to apply FRP, there are several drawbacks, which include lack of

3
well-trained personnel, uneven wetting of fabric, and difficulties in applying to tall and
long structures, such as girders and columns. Due to these shortcomings, weak bonds
form which make the entire process ineffective. Also this method is labor-intensive,
tedious and costly (Oehlers, 2001).
VARTM reduces hand labor to a minimum. Fabrics are wetted by vacuuming
resin over the FRP surface, infiltrating the pore spaces evenly and thoroughly. The
vacuum environment also allows for even, dust-free curing. These simple adjustments
to a hand lay-up method allow for strong bond between the fabric and the attached
surface.
1.2 Objectives
The main objective of this project is to develop a step by step guide, for practical
implementation of VARTM for bridge strengthening. In order to accomplish this goal,
the following tasks are identified:
1. Determination of original moment capacity;
2. Determination of factored moment and shear capacity;
3. Calculation of the required FRP to restore the design’s original moment and
shear capacity;
4. Determination of the time required for VARTM process;
5. Application of FRP through VARTM;
6. Calculating the cost of the application of FRP through VARTM process.

4
CHAPTER 2
DETERMINING MOMENT AND SHEAR CAPACITY
2.1 Introduction
Beams must be sufficiently strong to carry the applied bending moments and
shear forces. Due to factors such as increase in load, structural cracks on the concrete,
steel corrosion and loss of bond between the concrete and reinforcing bars, many
bridges have lost their original moment and shear capacity. The VARTM method can be
used to reinstall the lost capacity. The first step in the VARTM strengthening process is
to determine the actual moment or shear capacity of a beam through analytical
calculations. Comparison is then drawn for both allowable and predicted moments and
shears of the girder or beam loadings. In the event that nominal values or allowable
values are less than that of the predicted loading, reinforcement of the girder or beam
system is required. In this report, four types of girders will be analyzed for
strengthening. They are T-beam (concrete), I-beam (concrete), steel beams (flexural),
and steel beams (flexural).
2.2 Design or Nominal Moment Capacity
The nominal or theoretical moment strength of a girder, φMn , must be equal or
greater than the calculated factored moment, Mu, caused by factored loads.

5
φMn≥Mu (2.1)
To obtain the design or nominal moment φMn, the following steps should be adopted.
It should be noted that a rectangular beam is used for the analysis but the neutral axis
can be adjusted to fit a particular girder. Figure 2.1 is used for the analysis (Wang, Chu-
Kia & Charles G, 1993).
Figure 2.1: Determining φMn of a rectangular beam.
Step 1 — Compute total tensile force.
(2.2)
Step 2 — Equate total compression force C= 0.85f’c ab to Asfy to maintain
equilibrium and solve for a. ab is assumed to be stressed in compression at
0.85f’c..
(2.3)

6
Step 3 — Calculate the distance between center of gravity of T and C. For a
rectangular section its equal to
.
Step 4 — Determine Mn which is equal to T or C multiplied by the distance
between their centers of gravity. A factor of safety φ=0.9 is also added to the
equation.
(2.4)
where:
As is the area of steel,
fy is the steel yielding strength,
f’c is the concrete strength,
d is the distance from top of beam to the reinforcement.
A worked example can be located in Appendix C.
2.3 Factored Moment Mu and Shear Vu Determination
Calculation of Mu depends on the load that a girder receives. The load on a bridge is
divided into two categories, the live load and dead load. To calculate moment and
shear, HL-93 truck loading, design lane loading and design tandem loading are used. HL-
93 truck is defined by individual state department of transportation. An impact factor of
1.33 is used for calculating live load. For a simply supported bridge, follow the following
steps;

7
2.3.1 Moment Calculation
Calculate bending moment at mid span - axle loads.
o Calculate moment due to HL-93 truck loading MTrc.
(
)
(2.5)
o Calculate moment due to lane loading MLnc.
(
)
(2.6)
o Calculate moment due to tandem loading MTac.
(
) (2.7)
Choose the larger one between truck and tandem and multiply with an
impact factor “IM” and add moment due to lane to get the total moment
due to axle loads.
MLL+IM = max(MTrc, M
Tac)(IM) + MLn
c (2.8)
Moment due to other Loads
o Calculate moment due to dead load from concrete MDC.
(2.9)
o Calculate moment due to wearing surface using the above approach.
Select applicable load combination sum up all the calculated moments to get
Mu.

8
2.3.2 Shear Calculation
Calculate maximum shear force - axle loads.
o Calculate shear due to HL-93 truck loading VTrc.
(2.10)
o Calculate shear due to lane loading VLnc.
(2.11)
o Calculate shear due to tandem loading VTac.
(2.12)
o Choose the larger shear between truck and tandem and multiply with an
impact factor “IM” and add shear due to lane to get the total shear due
to axle loads.
VLL+IM = max(VTrc, V
Tac) (IM) + VLn
c (2.13)
Shear due to other Loads.
o Calculate moment due to dead load from concrete VDC.
(2.14)
o Calculate shear due to wearing surface using the above approach.
Sum up all the calculated shear to get Vu.
where:
is the lane load,
is the dead load provided by concrete,

9
L is the span length,
IM is the impact factor.
A worked example can be found in Appendix B.
2.4 Moment/ Shear Comparison
As discussed earlier the nominal moment φMn should be greater than factored
or used moment Mu. In the event that Mu is greater than φMn, then FRP reinforcement is
required. FRP fiber should be placed anywhere the actual moment or shear exceeds
nominal moment. The area requiring FRP reinforcement is highlighted in yellow in
figure 2.2.
Figure 2.2: Additional reinforcement required.

10
CHAPTER 3
DETERMINING FRP LAYERS NEEDED FOR REINFORCEMENT
3.1 Introduction
Determination of the reinforcement needed is governed by the moment and
shear deficit described in the previous section. Analytical calculation, by either a
developed spreadsheet or design software application, can be used to determine the
number of FRP layers required. Theoretically, the amount of reinforcement required can
be determined by the difference between the nominal and actual capacity. Since fiber
itself and fiber placement is not perfect, a factor of safety of 1.5 or greater should be
included in the calculations (ACI, 2008). Consideration should be put to infusion time
when calculating the number of layers required, because it has been noted that adding a
layer of FRP doubles the infusion time required. Infusion time is the time for the epoxy
resin to fully cover the surface. It will be discussed in detail in the next section. ACI’s
“Guide for the Design and Construction of Externally Bonded FRP Systems for
Strengthening Concrete Structures”(2008) provides guidance for the selection, design,
and installation of FRP systems for externally strengthened concrete structures.
ACI440.2R-08 part 5, section 15.3, provides a systematic way of determining FRP layers
required for flexural strengthening, while section 15.6 determines the FRP layers
required for shear strengthening. The following steps describe the process of
determining the FRP layers needed for flexural and shear reinforcement.

11
3.2 Flexural Strengthening
To determine the amount of reinforcement needed for flexural strengthening,
one must calculate the girder’s moment capacity. The nominal or design moment
should be greater than required factored moment as discussed earlier.
If the factored moment, Mu is greater than design moment φMn, then FRP
reinforcement can be applied.
The following steps should be followed to determine the FRP layers needed:
Step 1 —Calculate the FRP system design material properties. Environmental
exposure can reduce the tensile properties of the FRP material therefore the
reported properties by the manufacture should be reduced by a factor. Table 3.2
shows the reduction factors of various FRP systems.
Table 3.2– Environmental reduction factors for various FRP system and exposure condition (ACI, 2008)
Exposure conditions
Fiber type
Environmental reduction factor CE
Interior exposure
Carbon 0.95
Glass 0.75
Aramid 0.85
Exterior Exposure (bridges, piers, and unenclosed parking garages)
Carbon 0.85
Glass 0.65
Aramid 0.75
Aggressive environment (chemical plants and wastewater treatment plants)
Carbon 0.85
Glass 0.50
Aramid 0.70

12
The environmental reduction factor should be included in the design tensile
strength, as shown in Eq. (3.1).
ffu = CEffu* (3.1)
Where CE is the environmental reduction factor, and ffu* is the design tensile
stress provided by the manufacturer. Likewise, the design rupture strain should
be reduced for environmental exposure conditions as shown in Eq. (3.2).
Ɛfu =CEƐfu* (3.2)
Ɛfu is the design rupture strain provided by the manufacturer.
Step 2 — Perform preliminary calculations to determine the properties of
concrete, existing reinforcing steel, and the externally bonded FRP
reinforcement.
Calculate for concrete, as shown in ACI 318-05, section 10.2.7.3
(3.3)
Also, calculate Young modulus of elasticity of concrete Ec from the following
equation.
(3.4)
Determine the area of FRP Af
Af = ntfwf (3.5)
Where n is number of layers needed, tf is the thickness, and wf is the width of
the FRP reinforcement.

13
Step 3 —Determine the existing state of strain on the soffit. The girder is
assumed to be cracked, and the load acting on it is only the dead weight. The
following formula is used.
(3.6)
where:
is moment due to dead load,
h is the height of beam,
d is height to the rebar,
k is a neutral axis depth ratio,
Icr is the cracked moment of inertia,
f’c is the concrete strength.
Step 4 — Determine the design strain of the FRP system, which is governed by
the following equation.
( √
) (3.7)
Step 5 — Estimate c , the depth to the neutral axis. Assume c= 0.2d
Step 6 — Determine the effective level of strain (Ɛfe) in the FRP reinforcement.
[
]- ) (3.8)

14
Step 7 — Calculate strain in the existing concrete and reinforcing steel.
(3.9)
(3.10)
Step 8 — Calculate the stress level in the reinforcement steel and FRP.
Stress in steel reinforcement
(3.11)
Stress in FRP reinforcement
(3.12)
Step 9 — Calculate internal force and check equilibrium.
(3.13)
(3.14)
(3.15)
(3.16)
Adjust c until the force equilibrium is satisfied.
Step 10 — Calculate the flexural strength of components.
Steel contributing to bending
(3.17)
FRP contributing to bending
(3.18)

15
where:
As is the area of steel,
Af is the area of FRP.
Step 11 — Calculate design flexural strength of the section.
(3.19)
is the factor of safety for the FRP
Step 12 — Check the service stress in the reinforcing steel and the FRP.
An example to calculate the number of FRP layers needed for flexural reinforcement can
be found in Appendix C. In this example, step 12 is elaborated.
3.3 Shear Strengthening
VARTM provides excellence in adhering fiber material to concrete substructures. A
number of bridges in the United States require shear reinforcement as well as flexural
reinforcement. The previous section discussed how to calculate the number of FRP
layers needed for flexural reinforcement. In this section, the process of determining the
number of FRP layers needed for shear reinforcement will be highlighted. It is
imperative to perform the shear strength check for a bridge girder as stipulated in ACI-
08 EQN 11-3 and EQN 11-15 for capacity. If the factored shear exceeds the design or
nominal shear capacity, then FRP reinforcement can be utilized. The following steps
should be followed to determine the FRP layers needed for shear reinforcement:

16
Step 1 — Compute the design material properties. This step is similar to step 1 of
the previous section.
Step 2 — Calculate the effective strain level in the FRP shear reinforcement using
the following equation;
(3.20)
(3.21)
(3.22)
(3.22)
(3.23)
where;
is the bond reduction coefficient
is the active bond length
k1and k2 are modification factors for concrete strength and wrapping scheme.
is the effective level of strain.
Step 3 — Calculate the FRP reinforcement shear strength contribution using the
following equation.
(3.26)
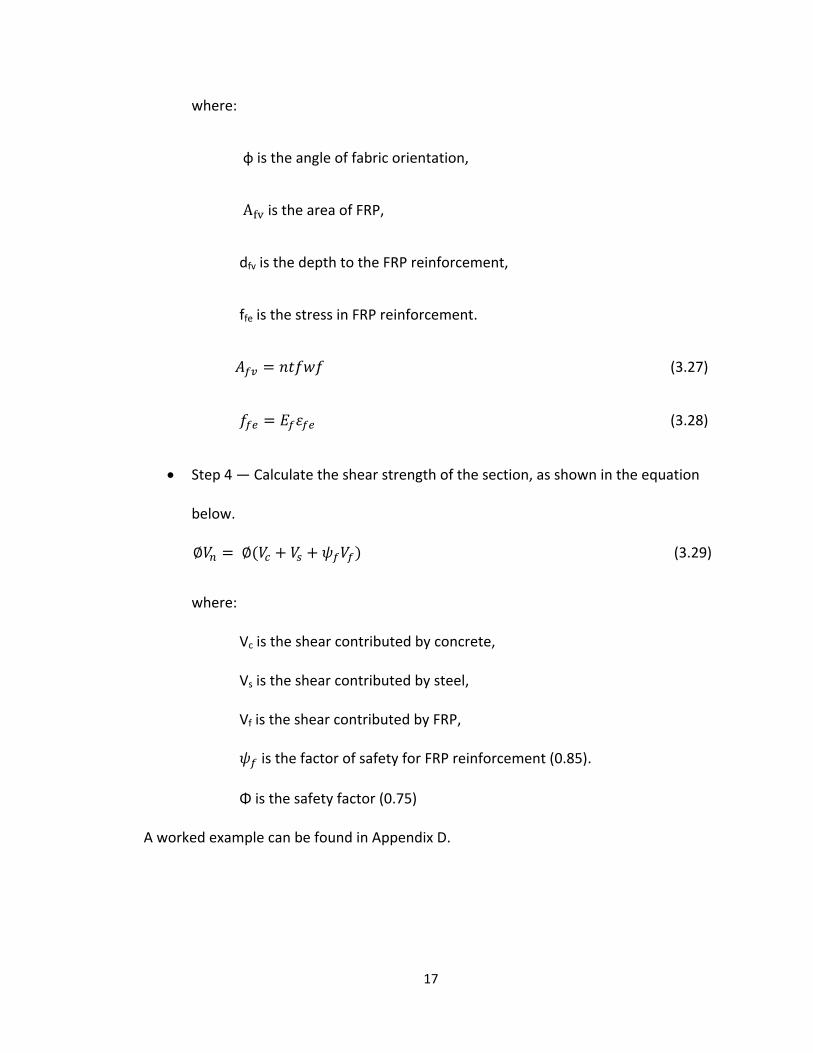
17
where:
φ is the angle of fabric orientation,
is the area of FRP,
dfv is the depth to the FRP reinforcement,
ffe is the stress in FRP reinforcement.
(3.27)
(3.28)
Step 4 — Calculate the shear strength of the section, as shown in the equation
below.
(3.29)
where: Vc is the shear contributed by concrete,
Vs is the shear contributed by steel,
Vf is the shear contributed by FRP,
is the factor of safety for FRP reinforcement (0.85).
Φ is the safety factor (0.75)
A worked example can be found in Appendix D.

18
CHAPTER 4
DETERMINING TIME FOR FRP APPLICATION
4.1 Introduction
VARTM process success depends on a variety of factors that include resin pot
life, infusion time and application process. In order for the FRP fabric to adhere to the
girder surface, epoxy resin is used through vacuum and infusion lines. Epoxy resin has a
defined pot life and, it is very important to determine the fill time, which can be defined
as the time taken for resin to enter the infusion line and travel to the vacuum line.
Vacuum lines and infusion lines positions play a vital role in the success of VARTM;
therefore, it is important to determine their position before any work commences. This
can be done easily by a simulation software.
There are a number of software packages that can be used and in this report,
Polyworx RTM-Worx software was used to determine the best location of vacuum and
infusion lines which yielded the shortest infusion time. Figure 4.1 summarizes the
process of determining FRP application time.

19
Figure 4.1 Summarized process for VARTM application.
4.2 VARTM Setup
4.2.1 Step 1 – Determining Infusion Lines and Vacuum Lines Location
As mentioned earlier, the location of vacuum/infusion lines is the key to the
VARTM application process. Before simulations are performed in Polyworx RTM-Worx
software, one must decide on the locations of these lines. Several scenarios can be
proposed. It should be noted, the location of both infusion and vacuum lines relies
directly on the fabric and resin utilized, as well as the conditions of the surface to which
the fabric will be bonded. Different surfaces require different fill time; for instance,
different lines configuration is needed in areas where bridges are exposed to deicing
agents compared to areas where bridges have a smooth surface. Figures 4.2 – 4.4 show
the proposed location for the three types of girders to be used for Polyworx simulations.
1.Determine Infusion , vacuum lines location
2.Run Polyworx simulations
3. Establish relationship between infusion time and length
4. Develop an infusion Time/Unit chart based on Resin pot life ,step and step 5
5. Use chart as a guide to get infusion time

20
Figure 4.2: Proposed placement of infusion and vacuum lines – Rectangular section.
Figure 4.3: Proposed placement of infusion and vacuum lines – I-girder section.
Figure 4.4: Proposed placement of infusion and vacuum lines – Steel girder section.

21
It may not be possible to apply resin in a single placement when considering long
girders, due to the fact that infusion time is strictly controlled by the pot life of the resin.
This can be resolved either by using a resin with low viscosity or applying the fabric in
stages as shown in Figure 4.5
Figure 4.5: Infusion by series of applications.
4.2.2 Step 2- Running Polyworx Simulations
Three scenarios were analyzed; a rectangular beam, a bulb girder, and a steel
plate girder. Multiple placements of infusion and vacuum lines were analyzed. Polyworx
RTM-Worx is an easy-to-use simulation code that uses the finite element and control
volume methods to solve the physical equations that govern flow of a resin through a
porous medium.
Certain parameters must be defined and input correctly into the application in
order for RTM-Worx to work correctly and are listed in Table 4.1. Accurate resin flow
models can be generated after defining proper model layout using information in Table
4.1 which is included in the RTM-Worx interface. Several placements were made as
illustrated in the following cases which include a detailed systematic graphical output.
The ultimate fill time was determined for each placement.

22
Table 4.1— Polyworx parameters.
Fabric Properties
Porosity of the fabric
Major and minor in-plane permeability.
Orientation of the fabric reinforcement
Resin Properties
Viscosity of the resin
Infusion and Vacuum Properties
Fraction of fill at which the port opens (fA);
Fraction of fill at which the port closes (fC).
Prescribed (maximum) pressure (Pi);
Prescribed (maximum) flow rate (Qi).
Case 1-1: Rectangular beam
The first simulation to be run was a rectangular beam. It should be noted that U-wrap
was used to wrap the beam and, therefore, can be used the same way to estimate the
time for a T-beam. When reinforcing a T-beam with FRP, the web is used therefore in
this report the rectangular beam is the same as a T-beam. Figure 4.6 shows the lines
configuration.

23
Figure 4.6: Rectangular case 1-1.
In this case, the fill time was determined to be 104 minutes, and the flow simulations at
different stages are illustrated in the following figures 4.7-A to 4.7-E.

24
Case 1-1: Rectangular beam — flow simulations at different stages
Figure 4.7-A: 20% at 4 minutes. Figure 4.7-B: 40% at 17 minutes.
Figure 4.7-C: 60% at 38 minutes. Figure 4.7-D: 80% at 67 minutes.

25
Figure 4.7-E: 100% at 104 minutes.
Case 1-2: Rectangular beam
The rectangular beam was defined as shown in Figure 4.8.
Figure 4.8: Rectangular case 1-2.

26
The fill time was determined to be 68 minutes for rectangular case 1-2. The
decrease in fill time was a result of an additional infusion line and an additional vacuum
line shown in Figure 4.8. Also the position of the lines is vital in determining the time in
which the resin flows; therefore, the field crew should utilize the fastest model.
Case 1-2: Rectangular beam — flow simulations at different stages
Figure 4.9-A: 20% at 1.2 minutes. Figure 4.9-B: 40% at 4.7 minutes.

27
Figure 4.9-C: 60% at 17.5 minutes. Figure 4.9-D: 80% at 38.5 minutes.
Figure 4.9-E: 100% at 68 minutes.

28
Case 2-1: I-girder (bulb girder)
The I-beam girder was defined, as shown in Figure 4.10.
Figure 4.10: I-beam case 2-1.
In I-beam case 2-1, the fill time was determined to be 35 minutes. The flow simulation is
depicted in Figures 4.11-A thru E.

29
Case 2-1: I-beam — flow simulations at different stages
Figure 4.11-A: 20% at 1 minute. Figure 4.11-B: 40% at 2.5 minutes.
Figure 4.11-C: 60% at 5.3 minutes. Figure 4.11-D: 80% at 13.5 minutes.

30
Figure 4.11-E: 100% at 35 minutes.
Case 2-2: I-girder (bulb girder)
The I-beam girder was defined, as shown in Figure 4.12.
Figure 4.12: I-beam case 2-2.

31
In I-beam case 2-2, the placement was revised, and the inclusion of additional
infusion and vacuum lines decreased the time required to fill the defined profile. The fill
time was determined to be 7 minutes. The flow simulation is depicted in Figures 4.9-A
thru E.
Case 2-2: I-beam — flow simulations at different stages
Figure 4.13-A: 20% at 0.25 minutes. Figure 4.13-B: 40% at 1 minute.

32
Figure 4.13-C: 60% at 2 minutes. Figure 4.13-D: 80% at 3.5 minutes.
Figure 4.13-E: 100% at 7 minutes.

33
Case 3-1: Steel girder (moment failure)
The steel girder was defined as shown in figure 4.14.
Figure 4.14: Steel girder case 3-1.
In Steel girder case 3-1, the time is required to vacuum resin only to the bottom
flange and was determined to be 36 minutes. The flow simulation is depicted in Figures
4.15-A thru E.

34
Case 3-1: Steel girder — flow simulations at different stages
Figure 4.15-A: 20% at 1.5 minutes. Figure 4.15-B: 40% at 6 minutes.
Figure 4.15-C: 60% at 13 minutes. Figure 4.15-D: 80% at 23 minutes.
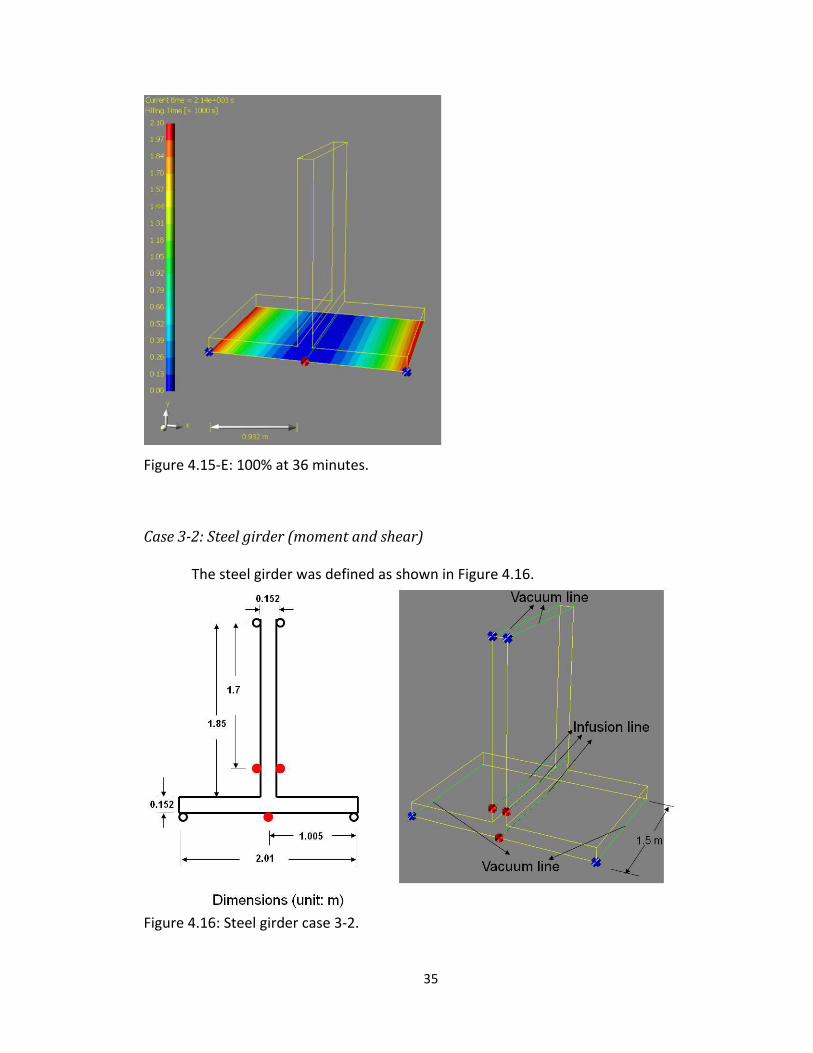
35
Figure 4.15-E: 100% at 36 minutes.
Case 3-2: Steel girder (moment and shear)
The steel girder was defined as shown in Figure 4.16.
Figure 4.16: Steel girder case 3-2.

36
In steel girder case 3-2, the time is required to vacuum resin over the flange and
web and the fill time was determined to be 100 minutes. The flow simulation is depicted
in Figures 4.17-A thru E.
case 3-2: Steel girder — flow simulations at different stages
Figure 4.17-A: 20% at 2.6 minutes. Figure 4.17-B: 40% at 10 minutes.

37
Figure 4.17-C: 60% at 22 minutes. Figure 4.17-D: 80% at 39 minutes.
Figure 4.17-E: 100% at 100 minutes.

38
Five millimeters of fabric was considered as the thickness for all of the analysis
cases and the time for general infusion was determined and the values derived can
assist in constructing a general-purpose chart that can be used as a guide in determining
infusion of members.
4.2.3 Step 3 — Relationship between Infusion Time and Length
All the models run with Polyworx had a definite length of 1.5 meters (4.92 feet).
To develop a relationship between infusion time and length, two experimental VARTM
runs were conducted. The purpose of this exercise, together with Polyworx simulations,
was to develop a general formula that can be used to calculate the time required to
apply the VARTM process in similar situations. Lengths and heights of fabric placement
vary based upon the specific situation for reinforcement and to accommodate these,
runs were performed by placing the fabric on a sheet of Plexiglas, as shown in Figure
4.18.
Figure 4.18: Experiential setup for Plexiglas.
The variable length “L” from figure 4.18 was varied to account for the case when
fabric is applied in a direction longer in length than in height. Two sample cases were
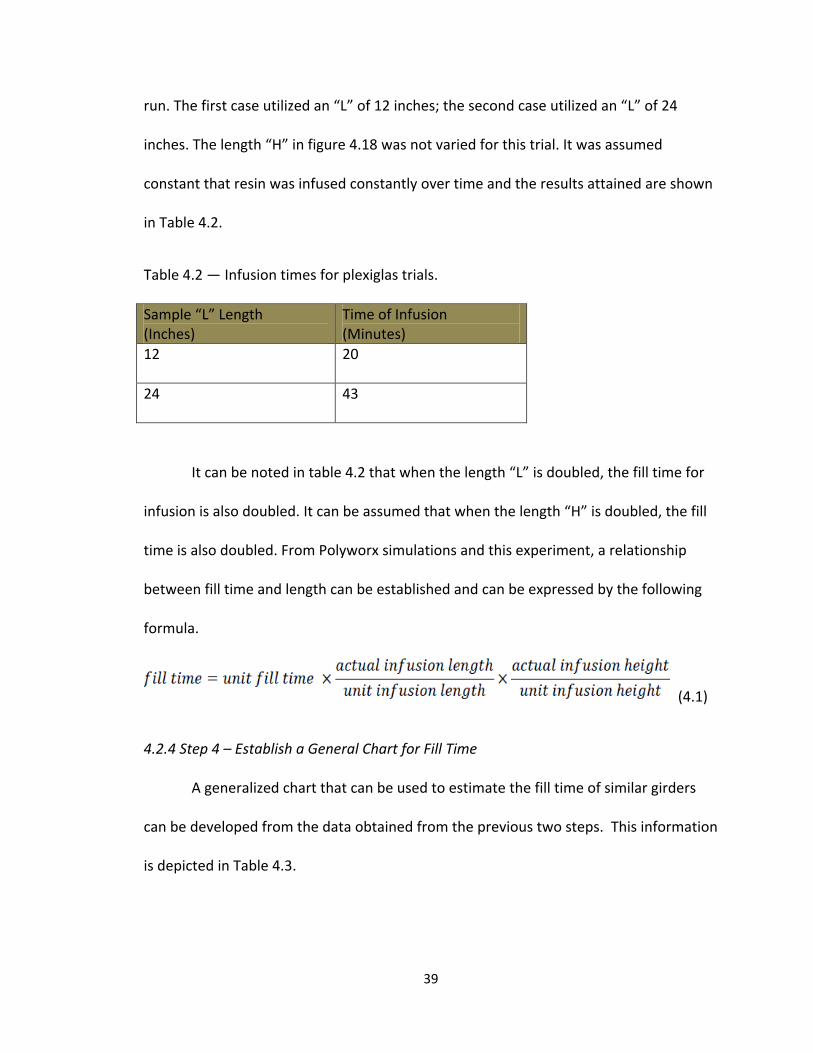
39
run. The first case utilized an “L” of 12 inches; the second case utilized an “L” of 24
inches. The length “H” in figure 4.18 was not varied for this trial. It was assumed
constant that resin was infused constantly over time and the results attained are shown
in Table 4.2.
Table 4.2 — Infusion times for plexiglas trials.
Sample “L” Length (Inches)
Time of Infusion (Minutes)
12 20
24 43
It can be noted in table 4.2 that when the length “L” is doubled, the fill time for
infusion is also doubled. It can be assumed that when the length “H” is doubled, the fill
time is also doubled. From Polyworx simulations and this experiment, a relationship
between fill time and length can be established and can be expressed by the following
formula.
(4.1)
4.2.4 Step 4 – Establish a General Chart for Fill Time
A generalized chart that can be used to estimate the fill time of similar girders
can be developed from the data obtained from the previous two steps. This information
is depicted in Table 4.3.

40
Table 4.3— Unit length fill times.
Bridge Type
Line Placement
Infusion Visual Picture
Infusion Time (min) / Unit Length [UIT]
Concrete T-Girder
Case 1-2
13.82
I-Girder
Case 2-2
1.42
Steel Flange (Flexural)
Case 3-1
7.32
Web (Shear)
Case 3-2
20.33
NOTES: ML based upon usage of Sika300 resin with a 2-hour pot life and parameters in table 4.1. If these parameters are not met, this value cannot be utilized for total length.
Infusion time/ unit length was obtained from the lowest time achieved during
Polyworx simulations while maximum length is derived from infusion time and resin pot
life. Safety factor 𝜂 = 1.25 and 𝜖=1.5 are recommended due to the differences in
material, fabric, placement, and vacuum, among other inconsistencies. The following
formula should then be used for estimating the fill time.
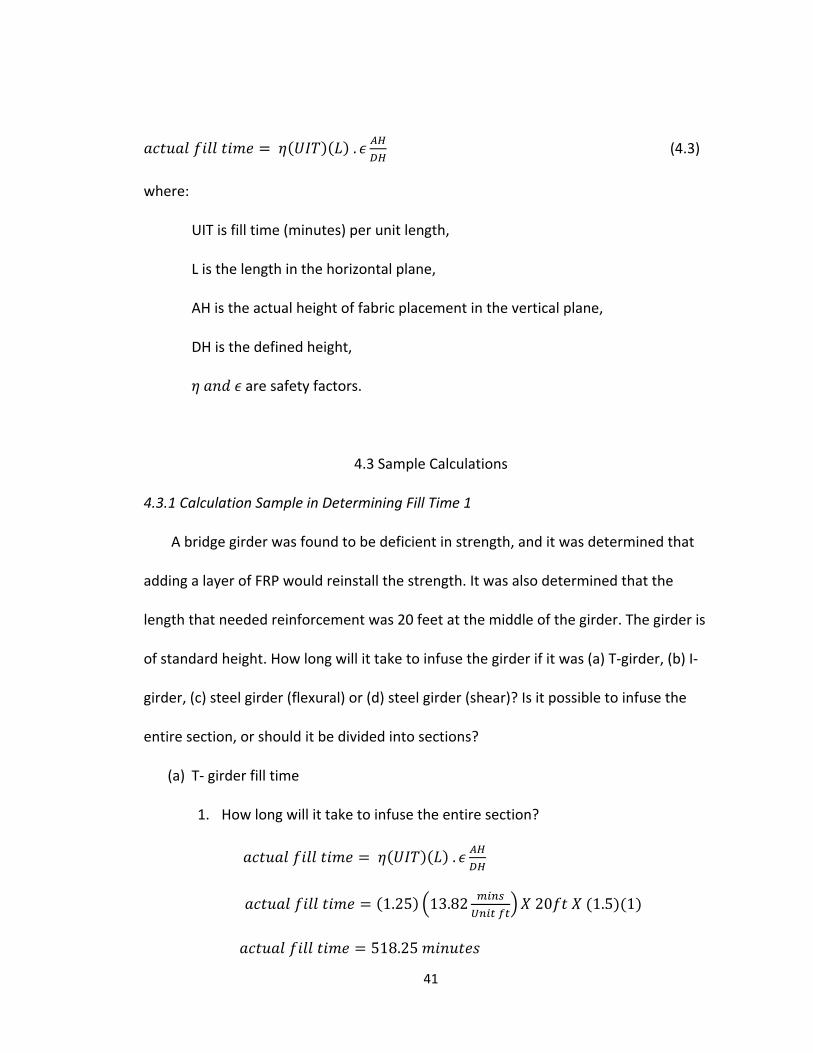
41
𝜂 𝜖
(4.3)
where:
UIT is fill time (minutes) per unit length,
L is the length in the horizontal plane,
AH is the actual height of fabric placement in the vertical plane,
DH is the defined height,
𝜂 𝜖 are safety factors.
4.3 Sample Calculations
4.3.1 Calculation Sample in Determining Fill Time 1
A bridge girder was found to be deficient in strength, and it was determined that
adding a layer of FRP would reinstall the strength. It was also determined that the
length that needed reinforcement was 20 feet at the middle of the girder. The girder is
of standard height. How long will it take to infuse the girder if it was (a) T-girder, (b) I-
girder, (c) steel girder (flexural) or (d) steel girder (shear)? Is it possible to infuse the
entire section, or should it be divided into sections?
(a) T- girder fill time
1. How long will it take to infuse the entire section?
𝜂 𝜖
(
)

42
2. Is it possible to infuse the entire section, or should it be divided into
sections? The resin pot life used to generate table 4.3 is 2 hours, which is 4½
times less than the calculated fill time. In this case, it is not possible to
infuse the entire section in a single instance. It can be divided into five
sections as shown in Figure 4.18.
Figure 4.19—Infusion by series of applications for a 20-ft. T-girder.
(b) ) I-girder fill time
1. How long will it take to infuse the entire section?
𝜂 𝜖
(
)
2. Is it possible to infuse the entire section? Yes. From table 4.3, the maximum
length that can be infused is 67.7 ft.
Calculations of the other 2 girder followed the same procedure and the solutions are in
Table 4.4.
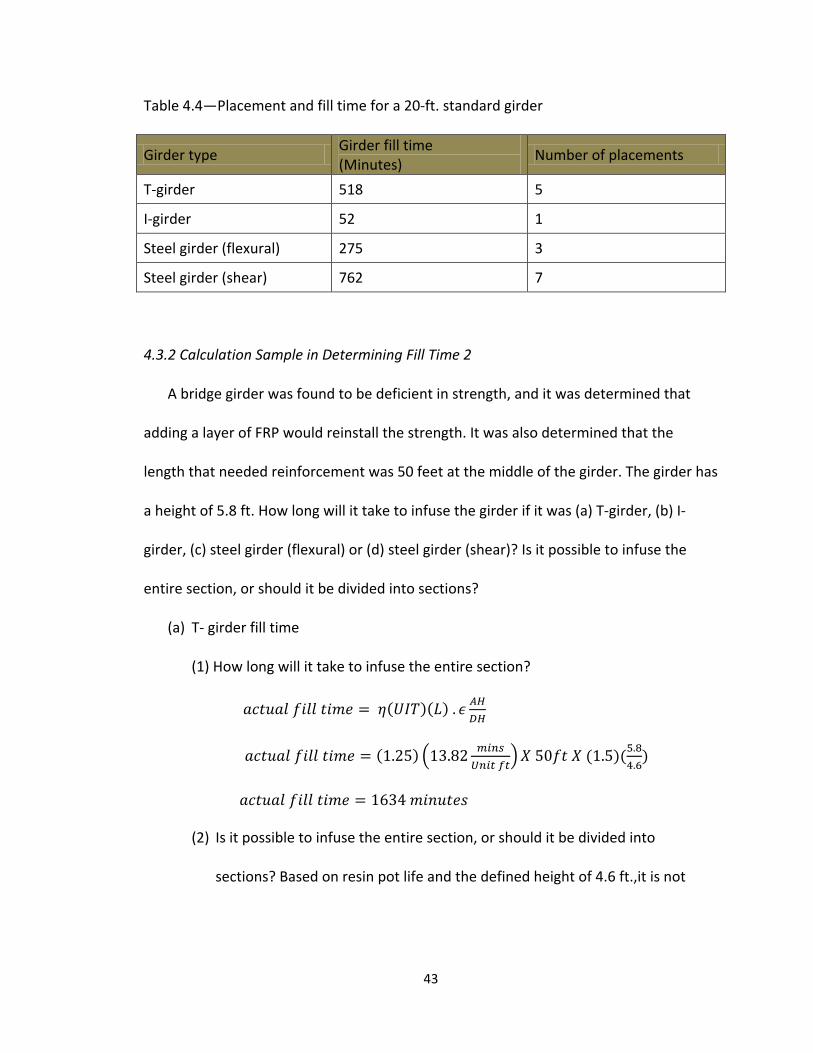
43
Table 4.4—Placement and fill time for a 20-ft. standard girder
Girder type Girder fill time (Minutes)
Number of placements
T-girder 518 5
I-girder 52 1
Steel girder (flexural) 275 3
Steel girder (shear) 762 7
4.3.2 Calculation Sample in Determining Fill Time 2
A bridge girder was found to be deficient in strength, and it was determined that
adding a layer of FRP would reinstall the strength. It was also determined that the
length that needed reinforcement was 50 feet at the middle of the girder. The girder has
a height of 5.8 ft. How long will it take to infuse the girder if it was (a) T-girder, (b) I-
girder, (c) steel girder (flexural) or (d) steel girder (shear)? Is it possible to infuse the
entire section, or should it be divided into sections?
(a) T- girder fill time
(1) How long will it take to infuse the entire section?
𝜂 𝜖
(
)
(2) Is it possible to infuse the entire section, or should it be divided into
sections? Based on resin pot life and the defined height of 4.6 ft.,it is not

44
possible to infuse the entire section in a single instance. It can be divided into
14 sections, as shown in Figure 4.19
Figure 4.20: Infusion by series of applications for a 50-ft. T-girder.
(b) I-girder fill time
1. How long will it take to infuse the entire section?
𝜂 𝜖
(
)
2. Is it possible to infuse the entire section? No. The fill time is longer than
the resin pot life of two hours and can only be infused in two sections.
Calculations of the other two girders followed the same procedure, and the solutions
are in Table 4.5.
It is important to note that when the actual height of the girder is greater or less
than that defined, DH, special consideration must be taken in determining the
placement of the infusion lines.

45
Table 4.5—Placement and fill time for a 50-ft. girder
Girder type Girder fill time (Minutes)
Number of placements
T-girder 1634 14
I-girder 168 2
Steel girder (flexural) 458 4
Steel girder (shear) 2403 20
It is recommended that a proportion be used between the total height and
heights of the infusion/vacuum lines. The following equations can be used to determine
the new height of the lines.
(4.4)
(4.5)

46
CHAPTER 5
FRP APPLICATION
5.1 Introduction
Once the calculations to configure the infusion/vacuum lines are complete, then
the actual fabric placement can commence. The discussion below is based on the
application of the FRP fabric to a general surface. It can be modified to suit any girder
type. One vacuum line and one infusion line is assumed in this discussion. A summary of
the process is defined in Figure 5.1.
Figure 5.1: VARTM process (Simplified)
1 Surface preparation
2. Primer application
3. Apply Sealant Tape, prepare bagging
4. Apply FRP fiber to surface
5. Apply release film and distribution mesh
6. place lines and attach vaccum
bagging
7. Apply vacuum to de-bulk the
bag 8. Resin Infusion
9. Resin curing 10. debagging 11. Protection from Moisture

47
5.2 FRP Application Process
The following steps should be followed when applying the FRP fabric to the surface:
Step 1 — Prepare the surface where the FRP will be bonded by sand blasting.
Step 2 — Apply a layer of the chosen epoxy resin (primer) to the surface to
ensure an adequate seal between the concrete and the vacuum sealant tape.
Step 3 — Mark a line along the outline of the area to be repaired. Apply a row of
sealant tape along the outline. Cut a layer of plastic to a size exceeding the area
defined by the sealant tape.
Step 4 — Cut the FRP fabric on a level, clean surface to the dimensions required
for the repair. Loose, stray fabric should be gently removed from the edges so
that a clean, well-defined edge is achieved. When layering fabrics for both
flexural and shear repair, layer fabric as shown in Figure 5.2 using a “lay-up
sequence of [0, 90… repeating]”( Uddin et al. ,2004)
Figure 5.2: Alternating layers of FRP.
Use aids such 3M adhesive spray when applying sheets on a vertical plane.

48
Step 5 – Place a layer of porous bleeder release film made of tightly woven
silicone coated polyester on top of the fabric. This is to ensure the release of
plastic bagging from the FRP fiber after curing occurs. The release fabric is shown
in Figure 5.3.
Figure 5.3: Release fabric, (a) square mesh and (b) magnified section.
Also apply a distribution mesh due to the tightness of the fibers in the weave. A
sample of distribution mesh is shown in Figure 5.4.
Figure 5.4: Distribution mesh.

49
Step 6 – Place the infusion and vacuum lines, and bagging in the entire FRP area.
Infusion and vacuum tubes should be placed so they lie along the top and
bottom edge of the distribution mesh. In the case of vertical members, the
infusion line should always be placed along a path lower than the vacuum line to
avoid creation of air bubbles and pockets during vacuuming.
Step 7 – Remove all air from within the constraints of the bagged area (de-
bulking). Perform audible/visual inspection around the bagging edge to ensure
no leakage.
Step 8 – Infuse the resin to the fabric via infusion lines attached after the de-
bulking process is complete. Resin flow should be homogeneous and, for the
best results, should be monitored during the entire process.
Step 9 – Resin curing. The fully wetted, bagged area should be left under at least
635-mmHg vacuum pressure for 12 hours or the duration of the cure time for
the resin utilized.
Step 10 – Remove the plastic bagging from the cured FRP layer.
Step 11 – Apply certified water retardant. A coat of latex-based paint can be
applied on the surface of the finished part to act as a seal against any
environmental attack, such as moisture, dust or particles.

50
CHAPTER 6
COST EVALUATION OF THE FRP APPLICATION
6.1 Introduction
A total cost for the initial stage of the field implementation of the project can be
estimated for the four girder types. A generalized analysis approach of the factors that
influence the cost will be adopted. In any economic analysis, variables costs and fixed
costs are usually separated, as variable costs are those that vary depending on a
company's production volume; they rise as production increases and fall as production
decreases. Fixed costs are those that do not change with an increase or decrease in the
amount of goods or services produced.
In order to effectively estimate the cost of applying FRP to the bridge girders, a
girder with a FRP application length of 50 ft. will be used for all the scenarios. To
estimate the total cost of VARTM for each case, a similar model of Resin Transfer
Molding (Haffner 2002) was used with the cost related to tooling and machinery
adjusted to the particular bridge girder case. The equipment needed for the
implementation of VARTM included the use of a portable sandblaster, a 5000-W
portable generator, and a vacuum pump with the pricing ranges. Labor costing is based
on a crew of four people working for the duration of the project. In Alabama, average
compensation of a construction worker, based on the report of Daniels and Grogan

51
(2002), is $38 per hour.
6.2 T-girder FRP Application Costing
Table 6.1 shows the variable cost for the VARTM process, and Table 6.2 shows
the fixed cost. The total cost of FRP application to a standard T- girder 50 ft. long was
$25,558.03
Table 6.1— Variable costs for T-girder FRP application process.
Description of Variable Cost
Quantity/ No. of Workers
$/Day or $/hour
Days used
Hours used
Cost ($)
Machinery
Vacuum pump 1 50 4 - 200.00
Portable generator 1 55 4 - 220.00
Man lift 1 195 4 - 780.00
Sand blaster 1 50 1 - 50.00
Portable compressor 1 60 2 - 60.00
Direct Labor Construction worker 4 38 - 96 14592.00
Total 15902.00
Table 6.2 — Fixed costs for T-girder FRP application process.
Description of Fixed Cost Quantity/Type Unit price ($) Total price ($)
Material
Sikadur 300 epoxy resin 6 Drum - 4 gal 194.67 1168.02
SikaWrap HEX 103C carbon fabric
6 Roll - 50 ft. 1,332.00 7992.00
Coating-latex based paint (4)2 gal 20.00 80.00
Tooling
Bleeder lease G Roll-91 698.00 104.00
Vacuum bag sealant tape GS-95 dark gray
Case-40 rolls 95.02 48.00
Distribution mesh Roll-200 m 200.00 30.00
Vacuum bagging film DPT 1000, 0.003 in gauge
Roll-100 m 1,216.29 182.44
PVC tubing 3 Roll-30 m 17.19 51.57
Total 9656.03

52
6.3 I-girder FRP Application Costing
Table 6.3 shows the variable cost for the I-girder, and Table 6.4 shows the fixed
cost. The total cost of FRP application to a standard I-girder 50 ft. long was $15,890.27.
Table 6.3 — Variable costs for I-girder FRP application process.
Description of Variable Cost
Quantity/ No. of Workers
$/Day or $/hour
Days used
Hours used Cost ($)
Machinery
Vacuum pump 1 50 2 - 100.00
Portable generator 1 55 3 - 165.00
Man lift 1 195 3 - 585.00
Sand blaster 1 50 1 - 50.00
Portable compressor 1 60 1 - 60.00
Direct Labor Construction worker 4 38 - 24 3648.00
Total 4608.00
Table 6.4 — Fixed costs for I-girder FRP application process.
Description of Fixed Cost Quantity/Type Unit price ($) Total price ($)
Material
Sikadur 300 epoxy resin 7 Drum-4 gal 194.67 1362.69
SikaWrap HEX 103C carbon fabric
7 Roll-15m 1,332.00 9324.00
Coating-latex based paint (5)2 gal 20.00 100.00
Tooling
Bleeder lease G Roll-91 698.00 104.00
Vacuum bag sealant tape GS-95 dark gray
Case-40 rolls 95.02 48.00
Distribution mesh Roll-200 m 200.00 40.00
Vacuum bagging film DPT 1000, 0.003 in gauge
Roll-100m 1,216.29 200.44
PVC tubing 6 Roll-30 m 17.19 103.14
Total 11282.27
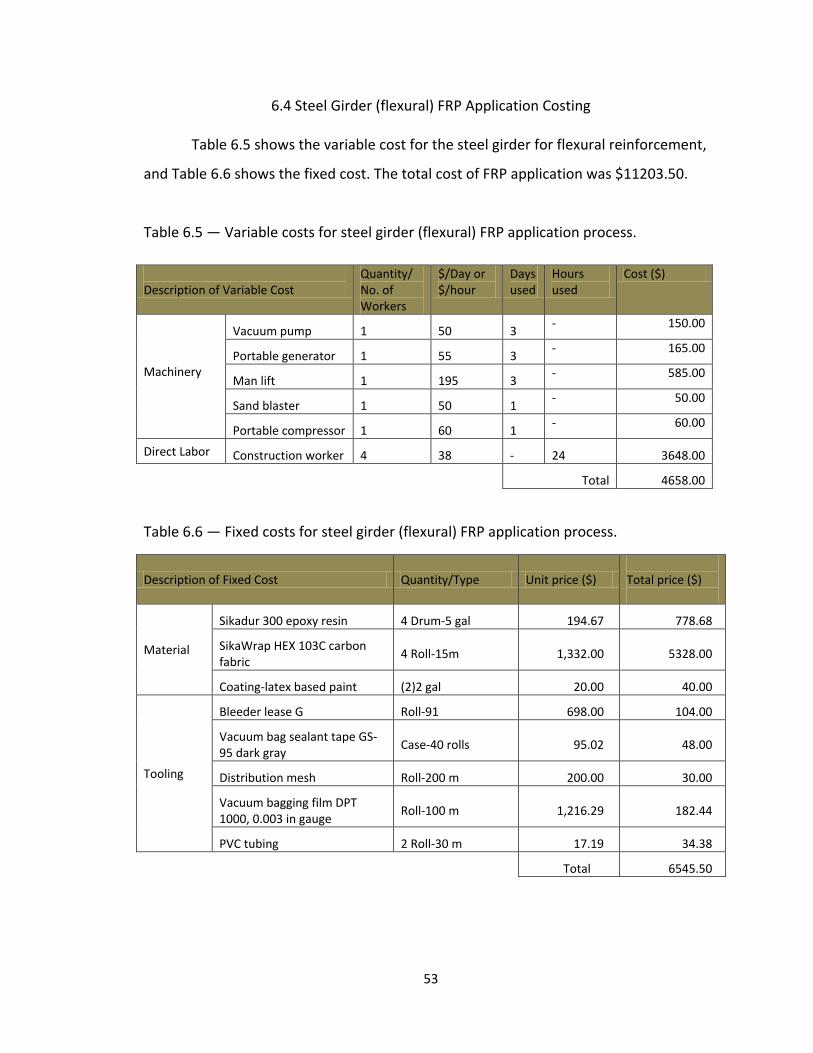
53
6.4 Steel Girder (flexural) FRP Application Costing
Table 6.5 shows the variable cost for the steel girder for flexural reinforcement,
and Table 6.6 shows the fixed cost. The total cost of FRP application was $11203.50.
Table 6.5 — Variable costs for steel girder (flexural) FRP application process.
Description of Variable Cost
Quantity/ No. of Workers
$/Day or $/hour
Days used
Hours used
Cost ($)
Machinery
Vacuum pump 1 50 3 - 150.00
Portable generator 1 55 3 - 165.00
Man lift 1 195 3 - 585.00
Sand blaster 1 50 1 - 50.00
Portable compressor 1 60 1 - 60.00
Direct Labor Construction worker 4 38 - 24 3648.00
Total 4658.00
Table 6.6 — Fixed costs for steel girder (flexural) FRP application process.
Description of Fixed Cost Quantity/Type Unit price ($) Total price ($)
Material
Sikadur 300 epoxy resin 4 Drum-5 gal 194.67 778.68
SikaWrap HEX 103C carbon fabric
4 Roll-15m 1,332.00 5328.00
Coating-latex based paint (2)2 gal 20.00 40.00
Tooling
Bleeder lease G Roll-91 698.00 104.00
Vacuum bag sealant tape GS-95 dark gray
Case-40 rolls 95.02 48.00
Distribution mesh Roll-200 m 200.00 30.00
Vacuum bagging film DPT 1000, 0.003 in gauge
Roll-100 m 1,216.29 182.44
PVC tubing 2 Roll-30 m 17.19 34.38
Total 6545.50

54
6.5 Steel Girder (shear) FRP Application Costing
Table 6.7 shows the variable cost for steel girder (shear) and Table 6.8 shows the
fixed cost. The total cost of FRP was $40,856.67.
Table 6.7 — Variable costs for steel girder (shear) FRP application process.
Description of Variable Cost
Quantity/ No. of Workers
$/Day or $/hour
Days used Hours used
Cost ($)
Machinery
Vacuum pump 1 50 6 - 300.00
Portable generator 1 55 6 - 330.00
Man lift 1 195 6 - 1170.00
Sand blaster 1 50 1 - 50.00
Portable compressor 1 60 1 - 60.00
Direct Labor Construction worker 4 38 - 120 18240.00
Total 20150.00
Table 6.8 — Fixed costs for Steel girder (shear) FRP application process.
Description of Fixed Cost Quantity/Type Unit price ($) Total price ($)
Material
Sikadur 300 epoxy resin 13 Drum-5 gal 194.67 2530.71
SikaWrap HEX 103C carbon fabric
13 Roll-15m 1,332.00 17316.00
Coating-latex based paint (5)2 gal 20.00 100.00
Tooling
Bleeder lease G Roll-91 698.00 320
Vacuum bag sealant tape GS-95 dark gray
Case-40 rolls 95.02 48.00
Distribution mesh Roll-200 m 200.00 80.00
Vacuum bagging film DPT 1000, 0.003 in gauge
Roll 100 m 1,216.29 243.20
PVC tubing 4 Roll-30 m 17.19 68.76
Total 20706.67

55
6.6 Cost Discussion
Steel girder for shear had the highest cost, because the FRP fabric had to cover a
larger area therefore, it used more material and more labor compared to the other
cases. This is understandable because it uses twice the material to wrap the girder
compared to the I-girder. Steel girder for flexural had the lowest cost due to less
material used and it required less labor. This comparison is graphically represented in
Figure 6.1.
Figure 6.1: Cost of repairing a 50-ft. girder with FRP using four different approaches.
$0.00
$5,000.00
$10,000.00
$15,000.00
$20,000.00
$25,000.00
$30,000.00
$35,000.00
$40,000.00
$45,000.00
T-girder I-girder Steel girder(flexural)
steel girder(shear)
Initial Project Cost

56
CHAPTER 7
CONCLUSION PERTAINING TO FIELD IMPLEMENTATION OF VARTM IN BRIDGE STRUCTURES
With the aging bridge infrastructure, there is a need to develop a cost-effective
method of re-installing their capacity. Many transportation departments are unable to
cope with the rising cost of replacing or repairing bridges. When applied externally to
the structurally deficient structure, FRP reinforcement has proved to be a cost-effective
method of repair. This report has shown that external FRP reinforcement can be used to
increase the strength of a beam. It has focused on VARTM technology and the process
involved. Application procedures and wrapping schemes, including both shear and shear
flexural, were detailed. The report also focused on how to determine where a structure
needs external FRP reinforcement.
The use of externally bonded FRP to add shear and flexural strength to concrete
structures is becoming more and more popular, and its use has risen exponentially over
the past few years (O’Connor and Hooks, 2003). FRP applied through the VARTM process
offer a variety of advantages. As documented in numerous journals relating to the use
of FRP in multi-disciplinary applications, VARTM can increase the overall capacity of a
beam for flexural or shear between 99% and 113% over that of a traditional customary
reinforced beam (Bonacci and Maalej, 2001; Thomsen et al. ,2004). As mentioned
earlier, the use of external FRP reinforcement is on the rise, and there is a need to come
up with a standard guide for the application of FRP reinforcement to the concrete

57
structure. For an effective FRP operation through VARTM, factors such as resin pot life
and application time must be considered.
To develop a guide to determine the application time required, simulations were
ran using Polyworx on three different types of girders, and a relationship of fill time and
length developed. A table was developed for this relationship, and it can be used as a
reference when a similar girder needs FRP reinforcement. The VARTM method provides
a high bond ratio of the FRP to the concrete, and it’s safer during application to high
columns or beams. VARTM provides an economical method of repair, though not due to
materials but because of its application process as noted in the economic analysis
section in this report.
Majority of highway arterials in the United States were constructed during the
building boom of the 1960s and 1970s and as discussed earlier, most of them are
becoming obsolete. The U.S. economy is growing and to sustain it, a good
transportation infrastructure is a must for a thriving interstate commerce and
innovation. In 2007, 12% of U.S. bridges were termed as structurally deficient, which
raises a great concern (Carson, 2007). Though not cost-effective to replace all these
structures, vital repairs must be made to maintain a level of acceptable safety for the
user. VARTM has proven to be a cost-effective method for bridge infrastructure repair
all transportation departments should adopt.
Although VARTM has proved to be a success in repairing bridge structures,
additional research is required to obtain conclusive evidence as to the effectiveness of

58
VARTM in the long-term. Also more research should be conducted in other civil
engineering structures, such as buildings, parking decks and pavements.

59
LIST OF REFERENCES
ACI Committee 440. (2008). Guide for the Design and Construction of Externally Bonded FRP Systems for Strengthening Concrete Structures. American Concrete Institute. Carson, Jodi L. (2007). Bridge Infrastructure Preservation. Retrieved September 15, 2012, from Transportation Research Board Website: http://onlinepubs.trb.org/onlinepubs/archive/NotesDocs/20-07(254)_BridgePreservation.pdf
Wu, H. Felix. (1999). Composites in Civil Applications. Retrieved October 10, 2012, from National Institute of Standards and Technology Web Site: http://www.atp.nist.gov/focus/99wp-ci.htm.
Bonacci, J.F. & Maalej, M. (2001). Behavioral Trends of RC Beams Strengthened with Externally Bonded FRP. Journal of Composites for Construction, 5(2), May 2001, 102-113. O’Connor, Jerome S. and Hooks, John M. (2003). U.S.A’s Experience Using Fiber Reinforced Polymer (FRP) Composite Bridge Decks to Extend Bridge Service Life. Technical Memorandum of Public Works Research Institute, 3920, 237-249. Oehlers, Deric J. (2001). Development of design rules for retrofitting by adhesive bonding or bolting either FRP or steel plates to RC beams or slabs in bridges and buildings. Composites Part A: applied science and manufacturing, 32, 1345-1355. Polyworx. (1997-2007). Products and Services, Resin Transfer Moulding. Retrieved August 22, 2012, from RTM-Worx FEM/CV Flow Simulation Software Controlled Vacuum Infusion technology Web site: http://www.polyworx.com Sika Group. (2007). Structural Strengthening. Retrieved August 22, 2012, from http://www.sika.com/en/solutions_products/Sika%20Construction%20Business/Structural-Bonding/02a013sa06.html.
60
Thomsen, Henrik, Spacone, Enrico, Limkatanyu, Suchart, & Camata, Guido. (2004). Failure Mode Analysis of Reinforced Concrete Beams Strengthened in Flexural with Externally Bonded Fiber-Reinforced Polymers. Journal of Composites for Construction, 8(2), March/April 2004, 123 - 131. Uddin, Nasim, Vaidya, Uday, Shohel, Muhammad, and Serrano-Perex, J.C. (2004). Cost-Effective Bridge Girder Strengthening Using Vacuum-Assisted Resin Transfer Molding (VARTM). Advanced Composite Materials, 13(3-4), 255-281. Wang, Chu-Kia and Salmon, Charles G. (1993). Reinforced Concrete Design 6th Edition. California: Addison-Wesley Longman. Williams, Tamara, Nozik, Linda, Sansalone, Mary and Poston, Randall. (2006). Sampling Techniques for Evaluation of Large Concrete Structures: Part 1. ACI Structural Journal, 103(3), May/June 2006, 399-408. 122 Daniels H and Grogan T. (2002). Third quarterly cost report. Insurance: Workers compensation rates ready to take off. Business & labor. Engineering News Record. http://www.enr.com/features/bizLabor/archives/020930c.asp. Retrieved September 30 2012.

61
RESIN AND FIBER PROPERTIES

62
Table A1: Sikadur 300 Epoxy Resin Properties (Sika Group, 2007)
Mixing Ratio 3:01
Color Clear
Viscosity 300 - 500 mPa.s.
Service Temperature Range -40 to 60 deg C
Tensile Strength 9.4 ksi
Tensile Modulus 298.8 ksi
Elongation at break 3.9 %
Flexural Strength 12.5 ksi
Shear Modulus 107.1 ksi
Poisson's Ratio 0.4
Density 0.036 lb/in3
Tack Free Time 15 hrs
Shelf Life 2 years
Table A2: Sikawrap Hex 103C Unidirectional Carbon Fabrics (FRP)
Properties (Sika Group, 2007)
Color black
Tensile Strength 550 ksi
Tensile Modulus 33.7 ksi
Elongation 1.5 %
Density 0.065 lb/in3

111
APPENDIX B
COPYRIGHT PERMISSION STATEMENT

112