Development of an Expeller Extraction for -carotene from ...
97
Development of an Expeller Extraction for -carotene from Carrot Pomace via Lecithin-Linkers Microemulsions by Shuting Lin A thesis submitted in conformity with the requirements for the degree of Master of Applied Science Department of Chemical Engineering and Applied Science University of Toronto © Copyright by Shuting Lin, 2018
Transcript of Development of an Expeller Extraction for -carotene from ...
Development of an Expeller Extraction for -carotene from Carrot Pomace via Lecithin-Linkers Microemulsions
by
Shuting Lin
A thesis submitted in conformity with the requirements for the degree of Master of Applied Science
Department of Chemical Engineering and Applied Science University of Toronto
© Copyright by Shuting Lin, 2018
ii
Development of an Expeller Extraction for -carotene from Carrot
Pomace via Lecithin-Linkers Microemulsions
Shuting Lin
Master of Applied Science
Department of Chemical Engineering and Applied Science University of Toronto
2018
Abstract
This work introduces a new green extraction solvent, based on fully dilutable lecithin-linkers
microemulsions (LLMs), that is used in a continuous expeller to recover -carotene from carrot
pomace obtained after carrot juice production. The optimal LLMs for the extraction was identified
via the HLD-NAC framework, and the predicted formulations confirmed via phase behavior
studies. An expeller extraction method was developed and optimized for -carotene yield, with
respect to LLMs. The results suggest that the combination of expeller and LLMs extraction have
3-6 fold increase in -carotene extraction as compared to other extraction methods. The optimal
extraction is obtained with highly diluted LLMs, that lead to the lowest extraction costs. The LLMs
containing extracted -carotene were microencapsulated via spray-drying to extend shelf life and
prevent the release of -carotene at the stomach’s pH. The encapsulated product is a free-flowing
powder that can be incorporated into a variety of products.

iii
Acknowledgments
Foremost, I would like to express my sincere gratitude to my supervisor, Professor Edgar J.
Acosta whose motivation, enthusiasm, continuous support, and immense knowledge have helped
me throughout the research. This opportunity has advanced my knowledge and enriched my
research experience.
I would like to thank the members in the Laboratory of Colloids and Formulation Engineering
(LCFE), and special thanks to Mehdi Nouraei for providing valuable comments in this study.
I am thankful to CGEN and NSERC for their financial support in this study.
I am thankful to Leonard Shen (summer student) for the contribution in developing alternative
extraction methods in Chapter 3 and Han Qin (4th-year thesis student) for the hard work in
microencapsulation in Chapter 4.
I would also like to thank Professor Levente L. Diosady and the supportive team at his lab.
Finally, I am indebted to my family and friends for providing me with unfailing support and
continuous encouragement throughout my years of study.
iv
Table of Contents
ACKNOWLEDGMENTS ..................................................................................................................................... III
LIST OF TABLES ............................................................................................................................................... VI
LIST OF FIGURES ............................................................................................................................................ VII
CHAPTER 1 INTRODUCTION ............................................................................................................................. 1
1.1 OVERVIEW.......................................................................................................................................................1
1.2 OBJECTIVES .....................................................................................................................................................3
1.3 THESIS OUTLINE ................................................................................................................................................3
CHAPTER 2 DEVELOPMENT OF LECITHIN-LINKERS MICROEMULSIONS FOR -CAROTENE EXTRACTION ................ 5
2.1 LECITHIN-LINKERS MICROEMULSIONS ...................................................................................................................5
2.2 MATERIALS AND METHODS ............................................................................................................................. 12
2.2.1 Materials .............................................................................................................................................. 12
2.2.2 Methods ............................................................................................................................................... 12
2.3 RESULTS ....................................................................................................................................................... 14
2.3.1 Determination of HLD parameters for HLD calculation ....................................................................... 14
2.3.2 HLD calculations for the LLMs systems ................................................................................................ 16
2.3.3 HLD-NAC calculation ............................................................................................................................ 17
2.3.4 HLD-NAC predicted solubilisation boundary ........................................................................................ 20
2.4 CONCLUSION ................................................................................................................................................ 23
2.5 APPENDICES.................................................................................................................................................. 24
APPENDIX 2A: HLD CALCULATION FOR 70/15/15 AND 60/20/20 SYSTEM ........................................................................... 24
APPENDIX 2B: REPLACING EO WITH COMMERCIALLY AVAILABLE FISH OIL ................................................................................ 25
CHAPTER 3 DEVELOPMENT OF A CONTINUOUS EXTRACTION MECHANISM .......................................................27
3.1 EXPELLER EXTRACTION .................................................................................................................................... 27
3.2 MATERIALS AND METHODS ............................................................................................................................. 34
3.2.1 Materials .............................................................................................................................................. 34
3.2.2 Methods ............................................................................................................................................... 34
3.3 RESULTS ....................................................................................................................................................... 38
3.3.1 Fixed extraction conditions .................................................................................................................. 38
3.3.2 Optimized extraction conditions .......................................................................................................... 38
3.3.3 Properties of diluted LLMs for extraction............................................................................................. 47
v
3.3.4 Preliminary economic analysis ............................................................................................................. 50
3.4 CONCLUSION ................................................................................................................................................ 53
3.5 APPENDICES.................................................................................................................................................. 54
APPENDIX 3A: INVESTIGATION ON ALTERNATIVE FOR CONTINUOUS EXTRACTION ...................................................................... 54
APPENDIX 3B: HPLC SAMPLING PROTOCOL ...................................................................................................................... 55
APPENDIX 3C: REMOVAL EFFICIENCY CALCULATIONS ........................................................................................................... 56
APPENDIX 3D: RHEOMETER SAMPLING PROTOCOL ............................................................................................................. 58
APPENDIX 3E: PRICE OF CHEMICALS ................................................................................................................................ 59
CHAPTER 4 MICROENCAPSULATION OF CAROTENOIDS CONTAINING LLMS .......................................................60
4.1 MICROENCAPSULATION BY SPRAY DRYING........................................................................................................... 60
4.2 MATERIAL AND METHODS ............................................................................................................................... 66
4.2.1 Materials .............................................................................................................................................. 66
4.2.2 Methods ............................................................................................................................................... 66
4.3 RESULTS ....................................................................................................................................................... 69
4.3.1 Spray dryer operating parameters ....................................................................................................... 69
4.3.2 Characteristics of microcapsules .......................................................................................................... 69
4.3.3 Surface structure of the microcapsules by SEM ................................................................................... 70
4.3.4 Powder recovery .................................................................................................................................. 72
4.3.5 Disintegration assessment ................................................................................................................... 73
4.4 CONCLUSION ................................................................................................................................................ 73
4.5 APPENDICES.................................................................................................................................................. 75
APPENDIX 4A: SAMPLE CALCULATION FOR A MICROENCAPSULATION MIXTURE ......................................................................... 75
APPENDIX 4B: SPRAY DRYER INSTALLATION AND OPERATING PROCEDURE ............................................................................... 76
APPENDIX 4C: CALCULATION FOR -CAROTENE IN POWDER ................................................................................................. 77
CHAPTER 5 CONCLUSIONS ..............................................................................................................................78
CHAPTER 6 RECOMMENDATIONS ....................................................................................................................79
REFERENCES ...................................................................................................................................................80
vi
List of Tables
Table 2.1: Composition of FeSSIF ................................................................................................................................14
Table 2.2: Parameters of lecithin-linkers microemulsions .............................................................................................16
Table 2.3: HLD calculation parameters and HLD values (calculation in Appendix 2A) .................................................17
Table 3.1: Comparison of three alternatives for -carotene extraction..........................................................................54
Table 3.2: Mass balance of extraction experiments. Three different carrot sources were used in the experiments. The
samples were run in triplicates.............................................................................................................................57
Table 3.3: Price of chemicals for -carotene extraction via LLMs .................................................................................59
Table 4.1: Composition of chemicals in microencapsulation mixture ............................................................................67
Table 4.2: Powder recovery from the spray drying ........................................................................................................72
Table 4.3: Concentration of -carotene in dried Sh-Alg coated powders ......................................................................77
Table 4.4: Concentration of -carotene in FeSSIF after the disintegration test.............................................................77

vii
List of Figures
Figure 1.1: Microscopic picture of -carotene in carrot pomace. The red spots are -carotene in the carrot cells and
the average size is between 25 to 50 m. The molecular structure of -carotene is shown on the right. .............1
Figure 2.1: Chemical structure of ethyl oleate (EO) and ethyl caprate (EC). Both chemicals are fatty acid esters,
except that EO has a longer and unsaturated fatty acid chain while EC has a saturated fatty acid chain. ...........5
Figure 2.2: A surfactant molecule generally consists of a hydrophilic head group and a hydrophobic tail. The charge
of a surfactant is determined by the charge of the head group: ionic (positive, negative), zwitterionic, and non-
ionic........................................................................................................................................................................6
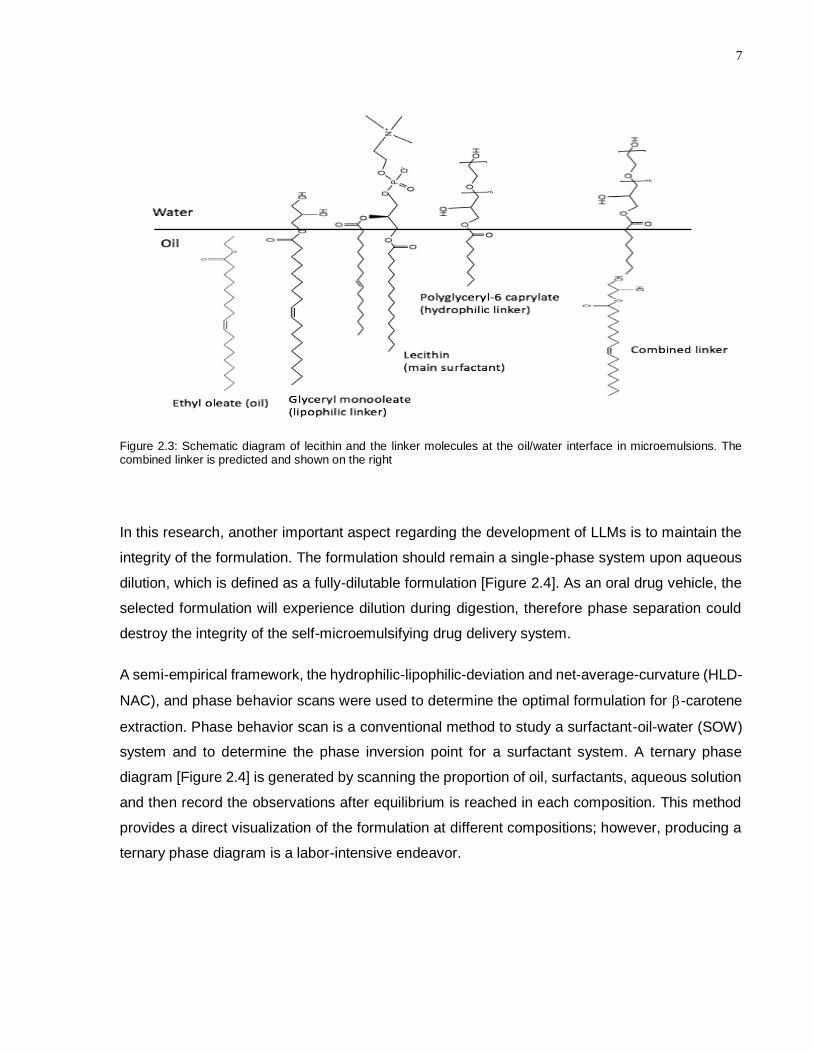
Figure 2.3: Schematic diagram of lecithin and the linker molecules at the oil/water interface in microemulsions. The
combined linker is predicted and shown on the right .............................................................................................7
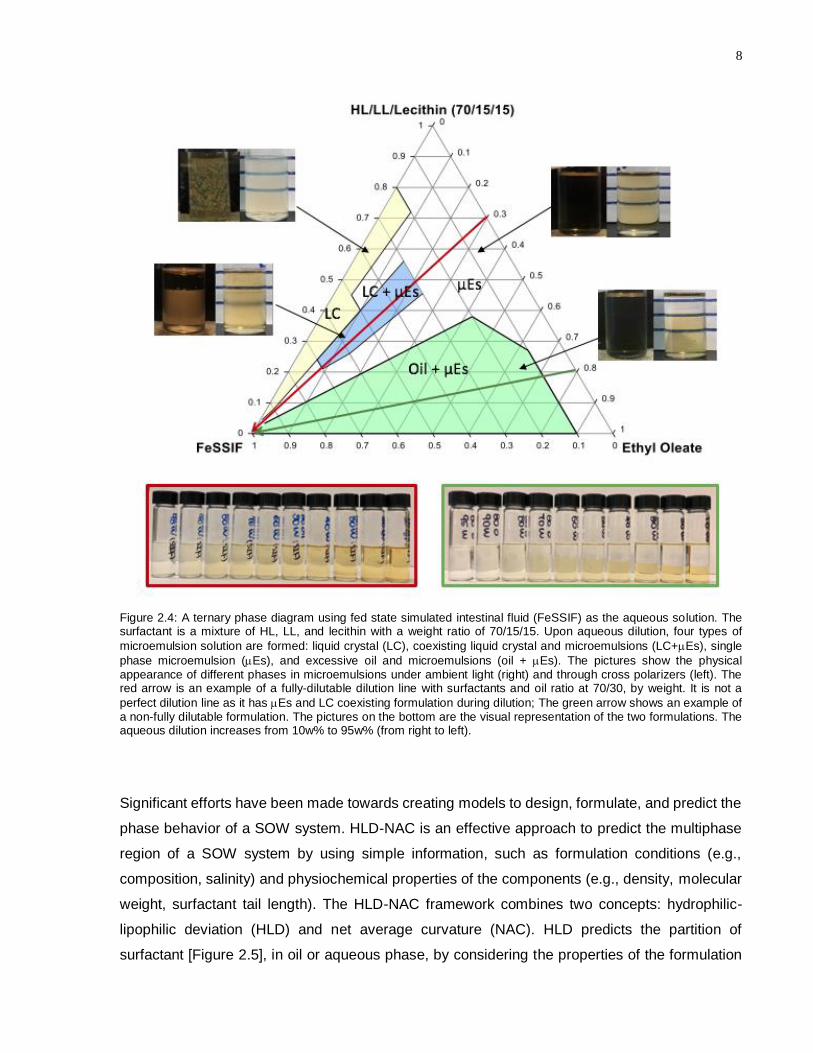
Figure 2.4: A ternary phase diagram using fed state simulated intestinal fluid (FeSSIF) as the aqueous solution. The
surfactant is a mixture of HL, LL, and lecithin with a weight ratio of 70/15/15. Upon aqueous dilution, four types
of microemulsion solution are formed: liquid crystal (LC), coexisting liquid crystal and microemulsions
(LC+Es), single phase microemulsion (Es), and excessive oil and microemulsions (oil + Es). The pictures
show the physical appearance of different phases in microemulsions under ambient light (right) and through
cross polarizers (left). The red arrow is an example of a fully-dilutable dilution line with surfactants and oil ratio
at 70/30, by weight. It is not a perfect dilution line as it has Es and LC coexisting formulation during dilution;
The green arrow shows an example of a non-fully dilutable formulation. The pictures on the bottom are the
visual representation of the two formulations. The aqueous dilution increases from 10w% to 95w% (from right to
left). ........................................................................................................................................................................8
Figure 2.5: Representation of HLD value and microemulsions. At negative HLD, oil in water (o/w) micelles are
formed; for positive HLD, water in oil (w/o) micelles are formed. While the HLD is close to zero, the system
forms interconnected channels that are made up of both oil and water, surfactant molecules are presented at
the interface. The Winsor classification Identifies four general types of microemulsions: type I (O/W micelles),
type III (bicontinuous), type II (W/O micelles), type IV (single-phase microemulsion) (not shown in the figure). ..9
Figure 2.6: a) EACN determination of EO. Salinity from 11% to 19% (w/v) from left to right. b) salinity (0 – 30w/v%)
versus solubility parameter for ethyl oleate. The intercept of the two solubility parameters is the optimal salinity
of the system where the system is able to solubilize equal volume of oil and water. ..........................................15
Figure 2.7: Salinity scan of the LLMs with 70/15/15 (HL/LL/lecithin) surfactant mixture. The picture shows the scan
with a constant 10v% surfactant mixture, and with 10%, 15%, 20%, 25%, 30%w/v NaCl in DI water. The
scattered line represents HLD-NAC phase volumes obtained using L= 90 Å, =120 Å. .....................................18
Figure 2.8: Summary of HLD-NAC calculation for the prediction of solubilisation features of a SOW system. The
green dotted line represents the predicted solubilisation boundary. The water discontinuity line suggests that a
SOW system will not have o/w microemulsions if the system has less than 12.5% water because it is
insufficient to form a water continuous phase, therefore water will be discontinuous phase even though the
system has a negative HLD value; similarly, the oil discontinuity line suggests that a SOW system having a
positive HLD value but less than 12.5% oil will not be able to form an oil continuous phase. .............................19
Figure 2.9: Ternary phase diagram and HLD-NAC predicted phase boundary for the SOW with surfactants at
70/15/15 (HL/LL/lecithin). The green dome is the phase separation region observed from experiments, while
the orange line represents the multiphase region predicted by the HLD-NAC framework. The red line is the
solubilisation boundary determined experimentally. The blue line represents the minimum volume fraction of
viii
surfactant for fully dilutable Es predicted by HLD-NAC. The black dots represent the actual scans in the
experiment. The two dotted lines are oil discontinuity (left) and water discontinuity (right). ................................21
Figure 2.10: Predicted phase boundary by HLD-NAC model for 60/20/20 SOW system. The green dome is the
experimental phase separation region, while the orange line represents the multiphase region predicted by the
HLD-NAC framework. The red line is the solubilisation boundary determined experimentally. The blue line
represents the minimum volume fraction of surfactant for fully dilutable Es predicted by HLD-NAC. The black
dots represent the actual scans in the experiment. The two dotted lines are oil discontinuity (left) and water
discontinuity (right). ..............................................................................................................................................22
Figure 3.1: Schematic process diagram of organic solvent extraction (WFMed, 2018). ...............................................28
Figure 3.2: Main components of an expeller extractor, extruder, and barrel. The pictures show the experimental
orientation of the extruder and the barrel. There three main stages of the extraction: feeding, exudation,
expansion.............................................................................................................................................................30
Figure 3.3: Picture of a shaft (extruder) of an expeller extractor. The red line indicates the diameter of the root
increasing towards the expanding zone. The right picture is the top view of the barrel from the feeding zone.
The inner diameter of the barrel decreases from the inlet to the outlet. ..............................................................30
Figure 3.4: Physical appearance of NutriChef digital electronic oil press: front view (left) and side view (right). The
motorized pressing powder is 550 watts. The dimension of the oil press extractor is 30.48cm x 21.59cm x
36.58cm. The maximum operating temperature is 220C. ..................................................................................32
Figure 3.5: Ternary phase diagram of LLMs system with surfactant mixture ratio at 70/15/15, w/w. ............................33
Figure 3.6: Sample preparation process diagram for -carotene analysis using HPLC ................................................35
Figure 3.7: Calibration curve of -carotene ...................................................................................................................35
Figure 3.8: Chromatography of a -carotene standard. The first peak on the left is Fluorescein acting as an internal
standard with a retention time of 0.84min. ...........................................................................................................37
Figure 3.9: -carotene recovery from two extractions using water as the solvent: batch extraction (left) and expeller
extraction (right). The carrot/LLMs ratio is 1/15 in batch extraction and 1.5 in expeller extraction. .....................39
Figure 3.10: Percentage of LLMs recovery at the various carrot/LLMs ratio. The water dilution in LLMs was kept
constant at 90w%. The experiment was repeated at a 10g, 15g, 30g 90%w LLMs basis. ..................................40
Figure 3.11: -carotene efficiency from different carrot/LLMs ratios. The LLMs contain 90%wt water. ........................41
Figure 3.12: -carotene yield from different carrot/LLMs ratios in terms of the amount concentrated LLMs used (oil
and surfactants). The LLMs contain 90%wt water. ..............................................................................................41
Figure 3.13: The carrot/LLMs ratio was kept at 1.5, by weight. a) carrot pomace without extraction, from extraction
with 95%wt water LLMs, extraction with 90%wt water LLMs, and extraction with 80%wt water LLMs (from left to
right); b) liquid collected after extraction by 95%wt, 90%wt, 80%wt water LLMs (from left to right); c) fresh carrot
pomace, liquid collected after extraction by 99%wt water LLMs and the carrot pomace after extraction, liquid
collected after extraction by 98%wt water LLMs and the carrot pomace after extraction, liquid collected after
extraction by 95%wt water LLMs and the carrot pomace after extraction (from left to right). ..............................42
Figure 3.14: Extraction efficiency of LLMs with various surfactant concentration (by varying water dilution). The
carrot/LLMs ratio is 3/2. 100% represents pure DI water. The experiments were not from the same carrot
source. .................................................................................................................................................................43
Figure 3.15: LLMs extraction yield with various water dilutions. Concentrated LLMs refer to the LLMs with only oil and
surfactants (HL, LL, and lecithin). The concentration of surfactant in the LLMs is 13%, 6.5%, 3.25%, 1.3%,
0.65% from 80w% to 99w% water dilution. ..........................................................................................................44
ix
Figure 3.16: Comparison of different carotenoids extraction methods (Amiri-Rigi, Abbasi and Scanlon, 2016)
(Roohinejad et al., 2014) (Pacheco et al., 2014) (Cortes et al., 2004) ................................................................45
Figure 3.17a: LLMs with 90w% water after expeller extraction and then centrifuge at 2500rpm for 5min (left). The
arrow is pointing to the top layer. On the right is the microscopic picture of the top phase. The circles highlight
the spots of concentrated -carotene particles extracted from carrot pomace. The black fibers are believed to
be carrot pomace fibers. ......................................................................................................................................46
Figure 3.17b: Microscopic pictures of fresh carrot pomace under ambient light (left) and cross-polarized lenses (right).
The red particles on the left and the lighting spot on the right indicates -carotene solid in the carrot cell. ........46
Figure 3.18: -carotene removal rate of LLMs with different water dilutions [experimental data in Appendix 3C]. The
carrot/LLMs ratio is 1.5. .......................................................................................................................................47
Figure 3.19: Viscosity and density of LLMs with 80% to 99% water at room temperature ............................................48
Figure 3.20: Surface tension of LLMs with 90w%, 95w%, 98w%, 99w% water at 22C. 100% represents pure DI
water. ...................................................................................................................................................................48
49
Figure 3.21: pH value of 80%wt – 99%wt water LLMs after extraction at room temperature. 100% means the
extraction was done by using DI water. ...............................................................................................................49
Figure 3.22: Effect of salt in -carotene extraction in LLMs with 95% aqueous dilution. The ratio of carrot/LLMs was
1.5. The LLMs and carrot pomace after extraction are shown on the right .........................................................50
Figure 3.23: -carotene extraction process. a) is fresh carrot pomace picture and b) is a picture of carrot pomace after
expeller extraction. The schematics of o/w micelles, -carotene particles, and oil droplets are not to scale and
they are for demonstrative purpose. ....................................................................................................................51
Figure 3.24: Chromatography of -carotene extraction from carrot pomace. The first peak on the left at 0.8min is
fluorescein (internal standard); the second peak on the left is -carotene at around 39.6min; the last peak from
the left is -carotene at around 43min. ................................................................................................................52
Figure 4.1: Type of microcapsules ................................................................................................................................60
Figure 4.2: Chemical structure of shellac (left) and sodium alginate (right). Shellac is composed of polyesters and
single esters that contain large amount of carboxylic and hydroxyl groups .........................................................61
Figure 4.3: Process schematic of a bench scale spray dryer ........................................................................................63
Figure 4.4: Film formation from a polymer solution. As solvent evaporation occurs (a), polymeric chemical forms an
intermediate gel-like material (b). Further evaporation increases the polymer concentration and a solid
polymeric film is obtained with constant heat supply (c). .....................................................................................64
Figure 4.5: Film formation from an aqueous dispersion. As the solvent evaporates from the system (a), a close-
packed structure is formed due to the increasing polymer concentration (b). Further solvent evaporation leads
to particle deformation due to capillary pressure and interfacial tension (c). The solid polymeric film is formed by
the coalescence of the particles above glass transition temperature. .................................................................64
Figure 4.6: Process for calculating the mass of each chemical in the microencapsulation mixture ..............................67
Figure 4.8: Microscopic pictures of liquid LLMs after -carotene extraction. Large oil aggregates are observed under
polarized lens with increasing magnifications. .....................................................................................................70
Figure 4.7: Dry LLMs powders with increasing wall/core ratio from left to right, 90/10, 70/30, 60/40, 50/50 (w/w), from
left to right ............................................................................................................................................................70

x
Figure 4.9: SEM images of the dry microemulsion powders. a-c is powder with 90/10 wall/core ratio; d-f is powder
with 70/30 wall/core ratio; g-I is powder with 80/20 wall/core ratio, j-l is powder with 50/50 wall/core ratio.
Samples were evaluated with three different magnifications, increasing from left to right. .................................71
Figure 4.10: Pictures of the powder sticking on the glass of the spray dryer, drying chamber (left) and outside the
cyclone (right). .....................................................................................................................................................72
Figure 4.11: 50/50 wall/core powders of LLMs containing extracted -carotene in FeSSIF (left) and 0.1N HCl (right).
Both tests were evaluated at five solid/liquid ratios: 1/500, 1/400, 1/300, 1/200, and 1/100 (w/v), from left to
right. .....................................................................................................................................................................73

1
Chapter 1 Introduction
1.1 Overview
While the worldwide production of food should be enough to feed the world’s population, hunger
and malnutrition are still urgent global issues (UNEP, 2011). The Food and Agriculture
Organization of the United Nations (FAO) estimates that 1/3 of the food produced for human
consumption is lost or wasted, which amounts to approximately 1.3 billion tons per year (UNEP,
2011). According to FAO, 45% of fresh fruit and vegetables was wasted during food processing
(UNEP, 2011). In fact, lots of food waste still contain valuable nutrients that can be recovered
(Van Dyk et al., 2013). In juicing carrots, up to 80% of β-carotene remains in the carrot pomace,
which is often regarded as waste (Singh, Panesar and Nanda, 2006).
Phytochemicals, such as -carotene (notably as vitamin A precursor), are chemicals produced by
plants that normally have some value as nutrients, pharmaceutical actives, or food additives,
[Figure 1.1] (Tyagi et al., 2010). Phytochemicals, and carotenoids, in particular, have gained
increasing attention due to their potential in disease protection and health promoters. Therefore,
efforts have been made to develop effective methods to increase nutritional intake of carotenoids
and other phytochemicals (e.g., supplements, food fortification). However, carotenoids,
phytosterols, and other hydrophobic phytochemicals tend to have low bioavailability due to their
poor solubility in gastrointestinal (GI) fluid. The human body can only convert 1/6 of β-carotene
intake into an active form of vitamin A (Haskell, 2012a). In fact, bioavailability becomes the most
important parameter as it measures the actual absorption of a bioactive during digestion, which
is directly related to the effectiveness of the nutrient.
Figure 1.1: Microscopic picture of -carotene in carrot pomace. The red spots are -carotene in the carrot cells and the
average size is between 25 to 50 m. The molecular structure of -carotene is shown on the right.

2
The applications of microemulsions (Es) in oil recovery and drug delivery (oral and transdermal)
have gained prominence (Gadhave and Waghmare, 2014) due to their desired physiochemical
properties and ease of preparation. Es are thermodynamically stable, isotropic liquid mixtures
with drop sizes of 10 to 100nm that are small enough to penetrate plant tissue for extraction. On
the other hand, using microemulsions as the drug carrier can promote absorption of the active
ingredients by improving the solubility of GI fluids (Nouraei, 2012) (Chu, 2010). Commercially
available Puerarin, Self-Microemulsifying Drug Delivery System (SMEDDS) pellets developed for
oral delivery provided a sustained drug release while simultaneously improving the bioavailability
of Puerarin (Zhang et al., 2012). Another important feature is the self-emulsification of lipids in the
formulation. The natural lipid digestive process is facilitated by the formation of a crude emulsion
(comprised of aqueous gastric fluid and lipid digestion products). Later, the dietary lipids are
further broken down into smaller molecules by pancreatic lipase and its cofactors for adsorption
in the small intestine (Kalepu, Manthina and Padavala, 2013).
There is then an opportunity to help minimize food wastage by extracting phytochemicals from
fruit pomace and other food byproduct streams and turn them into bioavailable and stable
products that could be used as food additives, likely in some form of food fortification program.
However, a suitable extraction medium and extraction process is required. From a process point
of view, the economics and the large volume of food byproduct likely requires a continuous
extraction process. Various extraction technologies have been developed to increase the
extraction efficiency in a batch condition, e.g., ultrasound-assisted extraction (UAE), enzyme-
assisted extraction (EAE), microwave-assisted extraction (MAE), and pulsed electric field
extraction (PEF) (Azmir et al., 2013). Current solvent extraction methods for lipophilic substances
are continuous processes but use volatile organic solvents (VOCs), such as hexane, which is
harmful to human health and are of great environmental concern (Luc et al., 2015).
This research explores the possibility of developing a green and efficient extraction method using
food-grade microemulsions as the extracting solvent to extract -carotene from carrot pomace.
The ultimate goal of the project is to introduce the extracts back into food products for
consumption. To ensure stability and bioactivity of the active, the -carotene extracted with
microemulsion systems will be microencapsulated with enteric coating agents. The coating will
serve as a protective barrier against the external environment (i.e., water, oxygen, light), and it
will be resistant to acidic pH of the stomach and to release the active in the small intestine.

3
1.2 Objectives
• Develop fully dilutable food-grade microemulsions for β-carotene extraction from carrot
pomace. Full dilutiability means that the addition of water or simulated intestinal fluid would
not produce a separate second phase.
• Design a continuous β-carotene extraction process and to examine the different operating
factors (e.g., solid/liquid ratio, surfactant concentration in LLMs) for maximal -carotene
yield and economic optimization;
• Encapsulate the -carotene containing microemulsion extracts (liquid) with an enteric
coating to prevent nutritional loss and to prevent release at stomach pH while ensuring
release at intestine pH.
1.3 Thesis outline
The thesis is presented in six chapters:
Chapter 1 provides the motivations and goals of the research. Due to the vast production of
valuable food waste and the concerns about using VOCs in conventional lipid extraction, LLMs is
proposed as a green and effective substitute for lipid extraction from food waste. This chapter
also describes the need for the development of a continuous process that is effective in extraction
and has a potential to be applied in the industrial-scale process.
Chapter 2 presents the principles and results of lecithin-linkers microemulsions development. The
optimal formulation for -carotene extraction was identified by two methods: HLD-NAC framework
and phase behavior scans.
Chapter 3 focuses on the development of a continuous process. The expeller extraction was
selected for β-carotene extraction due to its desired features for large-scale production. The
extraction mechanism was characterized with various operating conditions in order to maximize
-carotene yields, such as carrot/LLMs ratio and surfactant concentration in LLMs.
Chapter 4 describes the investigation the microencapsulation of the LLMs with extracted β-
carotene for food applications. The liquid LLMs were microencapsulated by enteric coating
(shellac and sodium alginate) and then spray dried into its powder form to promote shelf life.
4
Multiple experiments were conducted to maximize the loading of β-carotene in the dried powders.
To confirm the proper release during digestion, disintegration tests were conducted on the
powders in both neutral and acidic solution at different composition. The surface structure of the
powders was examined by scanning electron microscope (SEM).
Chapter 5 summaries the key findings and conclusions of the study and chapter 6 provides
recommendations for future research on similar topics.

5
Chapter 2 Development of Lecithin-Linkers Microemulsions for -carotene
Extraction
2.1 Lecithin-Linkers Microemulsions
Linkers-based lecithin microemulsions developed by Yuan and Acosta have a promising potential
for transdermal delivery of a lipophilic drug (Yuan et al., 2010). A previous study has demonstrated
that the linker-based microemulsions were better at extracting lipids from lyophilized microalgae
than hexane and ethyl caprate (Chan, 2012). Due to the generally recognized as safe (GRAS),
food-grade status of the ingredients, this work explores the use of lecithin-linkers microemulsions
(LLMs) for -carotene extraction from carrot pomace, which could be used as a delivery system
for the extracted -carotene. The LLMs in this work are mixtures that contain ethyl oleate (EO) as
the oil, lecithin as the main surfactant, glyceryl monooleate as the lipophilic linker (LL) and
polyglyceryl-6 caprylate as the hydrophilic linker (HL).
Ethyl caprate (EC) as the oil phase in LLMs has been used to formulate effective drug delivery
systems for -carotene (Chu et al., 2014). EC is a product of fermentation during winemaking,
and it is often present in various food and beverages as a flavoring agent. Chu, et al. (2014)
selected EC for nutraceutical drug delivery due to its ability to dissolve numerous nutraceuticals.
However, there are limitations associated with using EC (Chu et al., 2014). First, EC has a much
higher cost than EO (Alibaba, 2018), which will be challenging for industrial-scale production; and
second, EC is often used as a food additive with a concentration range in parts per billion (ppb)
(Curwin, Deddens, and McKernan, 2015). Due to the similarity in chemical structure [Figure 2.1],
the replacement of EC with EO in the formulation should be possible using a framework that
considers the impact of oil hydrophobicity on the formulation.
Figure 2.1: Chemical structure of ethyl oleate (EO) and ethyl caprate (EC). Both chemicals are fatty acid esters, except that EO has a longer and unsaturated fatty acid chain while EC has a saturated fatty acid chain.

6
There are various challenges in microemulsion formulation, one of the critical aspects is the
selection of surfactant (Rao and McClements, 2011). The selection of surfactant is crucial in
making an effective microemulsion formulation as well as making it safe for human consumption.
Most useful surfactants are synthetic, which are not ideal for food and drug delivery.
Phospholipids are naturally occurring surfactant molecules in human and animal tissues and they
can self-assemble to form cell walls (Acosta et al., 2005). Lecithin is a zwitterionic surfactant found
in natural food products [Figure 2.2], such as egg yolk, soybean, milk, and marine sources.
Lecithin has a GRAS status, approved by the food and drug administration (FDA), which is
desirable for food applications (Acosta et al., 2005).
Figure 2.2: A surfactant molecule generally consists of a hydrophilic head group and a hydrophobic tail. The charge of a surfactant is determined by the charge of the head group: ionic (positive, negative), zwitterionic, and non-ionic.
The purpose of using lipophilic linker molecules is to enhance the solubilization capacity, which
is also known as the linker effect, was first introduced by Salager (2005) (Sabatini, Acosta and
Harwell, 2003). Lecithin molecules as a sole surfactant in microemulsions tend to form liquid
crystals (LC). In this case, the main purpose is to overcome the strong lecithin-lecithin interaction
that leads to the formation of gels and/or liquid crystals. The addition of the linkers enhances the
interaction between surfactant and oil (lipophilic linker) and surfactant and water (hydrophilic
linker) [Figure 2.3] (Salager, 2005) (Chu et al., 2014) (Acosta et al., 2002). The lipophilic and
hydrophilic linker molecules have shown a special synergistic effect as evidenced by the formation
of ‘a self-assembled surfactant’ at the oil/water interface [Figure 2.3] (Sabatini, Acosta and
Harwell, 2003).
7
Figure 2.3: Schematic diagram of lecithin and the linker molecules at the oil/water interface in microemulsions. The combined linker is predicted and shown on the right
In this research, another important aspect regarding the development of LLMs is to maintain the
integrity of the formulation. The formulation should remain a single-phase system upon aqueous
dilution, which is defined as a fully-dilutable formulation [Figure 2.4]. As an oral drug vehicle, the
selected formulation will experience dilution during digestion, therefore phase separation could
destroy the integrity of the self-microemulsifying drug delivery system.
A semi-empirical framework, the hydrophilic-lipophilic-deviation and net-average-curvature (HLD-
NAC), and phase behavior scans were used to determine the optimal formulation for -carotene
extraction. Phase behavior scan is a conventional method to study a surfactant-oil-water (SOW)
system and to determine the phase inversion point for a surfactant system. A ternary phase
diagram [Figure 2.4] is generated by scanning the proportion of oil, surfactants, aqueous solution
and then record the observations after equilibrium is reached in each composition. This method
provides a direct visualization of the formulation at different compositions; however, producing a
ternary phase diagram is a labor-intensive endeavor.
8
Figure 2.4: A ternary phase diagram using fed state simulated intestinal fluid (FeSSIF) as the aqueous solution. The surfactant is a mixture of HL, LL, and lecithin with a weight ratio of 70/15/15. Upon aqueous dilution, four types of
microemulsion solution are formed: liquid crystal (LC), coexisting liquid crystal and microemulsions (LC+Es), single
phase microemulsion (Es), and excessive oil and microemulsions (oil + Es). The pictures show the physical appearance of different phases in microemulsions under ambient light (right) and through cross polarizers (left). The red arrow is an example of a fully-dilutable dilution line with surfactants and oil ratio at 70/30, by weight. It is not a
perfect dilution line as it has Es and LC coexisting formulation during dilution; The green arrow shows an example of a non-fully dilutable formulation. The pictures on the bottom are the visual representation of the two formulations. The aqueous dilution increases from 10w% to 95w% (from right to left).
Significant efforts have been made towards creating models to design, formulate, and predict the
phase behavior of a SOW system. HLD-NAC is an effective approach to predict the multiphase
region of a SOW system by using simple information, such as formulation conditions (e.g.,
composition, salinity) and physiochemical properties of the components (e.g., density, molecular
weight, surfactant tail length). The HLD-NAC framework combines two concepts: hydrophilic-
lipophilic deviation (HLD) and net average curvature (NAC). HLD predicts the partition of
surfactant [Figure 2.5], in oil or aqueous phase, by considering the properties of the formulation

9
(i.e., oil, surfactant, salinity, temperature, and cosolvent). For a negative value of HLD, surfactants
tend to be in the aqueous phase. That is generally known as Winsor type I microemulsions, in
which oil swollen (o/w) micelles are formed. Conversely, the surfactants favor the oil phase when
HLD is greater than zero (Winsor type II, w/o microemulsions). At the transition region where HLD
equals to zero, Winsor type III microemulsions are formed, containing interpenetrating channels
of oil and aqueous phases, producing a bicontinuous phase.
Figure 2.5: Representation of HLD value and microemulsions. At negative HLD, oil in water (o/w) micelles are formed; for positive HLD, water in oil (w/o) micelles are formed. While the HLD is close to zero, the system forms interconnected channels that are made up of both oil and water, surfactant molecules are presented at the interface. The Winsor classification Identifies four general types of microemulsions: type I (O/W micelles), type III (bicontinuous), type II (W/O micelles), type IV (single-phase microemulsion) (not shown in the figure).
Depending on the charge of the surfactant head group, there are two HLD equations (Nouraei
and Acosta, 2017).
For ionic surfactants:
HLD = ln(S) - K∙EACN - αT∙(T-25) + Cc Eq.2.1
For non-ionic surfactants:
HLD = b∙(S) - K∙EACN + CT∙(T-25) + Cc Eq.2.2
where S is the salinity in g NaCl/100mL; EACN is the equivalent alkane carbon number which
indicates the hydrophobicity of oil; T is the temperature of the system, in Celsius; Cc is the
characteristic curvature of the surfactants that represents the hydrophilic nature of the surfactants.
K, αT, b, CT are empirical constants for a given system.
10
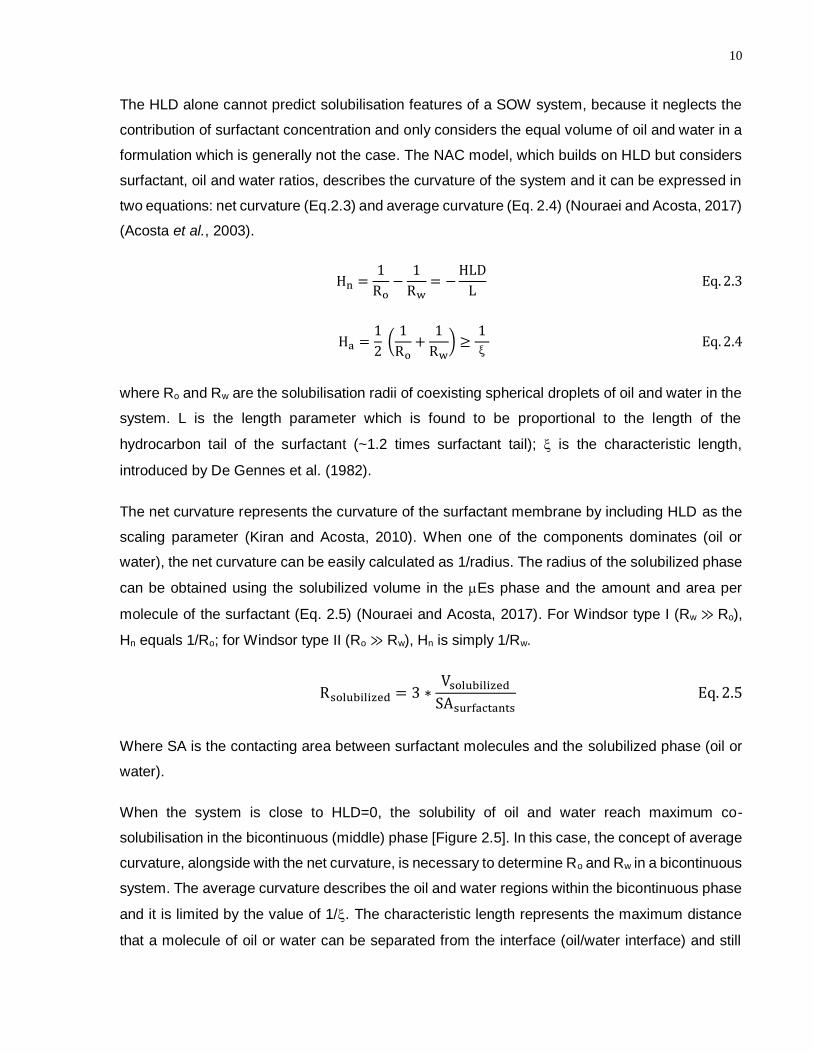
The HLD alone cannot predict solubilisation features of a SOW system, because it neglects the
contribution of surfactant concentration and only considers the equal volume of oil and water in a
formulation which is generally not the case. The NAC model, which builds on HLD but considers
surfactant, oil and water ratios, describes the curvature of the system and it can be expressed in
two equations: net curvature (Eq.2.3) and average curvature (Eq. 2.4) (Nouraei and Acosta, 2017)
(Acosta et al., 2003).
Hn =1
Ro−
1
Rw= −
HLD
L Eq. 2.3
Ha =1
2 (
1
Ro+
1
Rw) ≥
1
ξ Eq. 2.4
where Ro and Rw are the solubilisation radii of coexisting spherical droplets of oil and water in the
system. L is the length parameter which is found to be proportional to the length of the
hydrocarbon tail of the surfactant (~1.2 times surfactant tail); is the characteristic length,
introduced by De Gennes et al. (1982).
The net curvature represents the curvature of the surfactant membrane by including HLD as the
scaling parameter (Kiran and Acosta, 2010). When one of the components dominates (oil or
water), the net curvature can be easily calculated as 1/radius. The radius of the solubilized phase
can be obtained using the solubilized volume in the Es phase and the amount and area per
molecule of the surfactant (Eq. 2.5) (Nouraei and Acosta, 2017). For Windsor type I (Rw ≫ Ro),
Hn equals 1/Ro; for Windsor type II (Ro ≫ Rw), Hn is simply 1/Rw.
Rsolubilized = 3 ∗Vsolubilized
SAsurfactants Eq. 2.5
Where SA is the contacting area between surfactant molecules and the solubilized phase (oil or
water).
When the system is close to HLD=0, the solubility of oil and water reach maximum co-
solubilisation in the bicontinuous (middle) phase [Figure 2.5]. In this case, the concept of average
curvature, alongside with the net curvature, is necessary to determine Ro and Rw in a bicontinuous
system. The average curvature describes the oil and water regions within the bicontinuous phase
and it is limited by the value of 1/. The characteristic length represents the maximum distance
that a molecule of oil or water can be separated from the interface (oil/water interface) and still

11
interact with the surfactant molecules. It can be calculated by measuring phase volumes or via
neutron scattering (Abbott, 2017).
In this research, the HLD-NAC framework will serve as a guideline for the lecithin-linkers
microemulsions (LLMs) formulation. The most important property for the formulations of this work
is being fully dilutable. The selected LLMs formulation will be used for -carotene extraction
(chapter 3) and then spray-dried to increase product stability (chapter 4). The dried powder will
eventually be introduced into food products that will again experience dilution during digestion.
The fully-dilutability of the LLMs formulation is essential for an effective drug delivery system
because it ensures the integrity of formulation throughout the entire process. In addition,
experimental phase behavior scans will be conducted to evaluate the accuracy of the HLD-NAC
prediction.
12
2.2 Materials and Methods
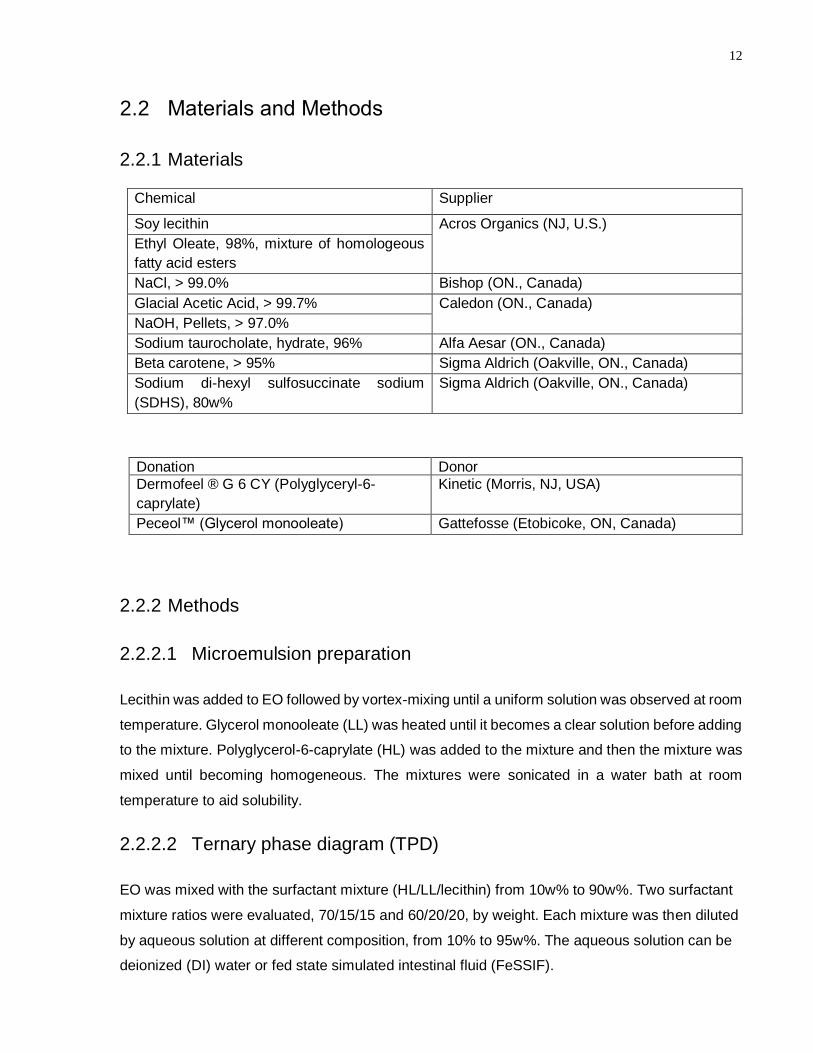
2.2.1 Materials
Chemical Supplier
Soy lecithin Acros Organics (NJ, U.S.)
Ethyl Oleate, 98%, mixture of homologeous
fatty acid esters
NaCl, > 99.0% Bishop (ON., Canada)
Glacial Acetic Acid, > 99.7% Caledon (ON., Canada)
NaOH, Pellets, > 97.0%
Sodium taurocholate, hydrate, 96% Alfa Aesar (ON., Canada)
Beta carotene, > 95% Sigma Aldrich (Oakville, ON., Canada)
Sodium di-hexyl sulfosuccinate sodium
(SDHS), 80w%
Sigma Aldrich (Oakville, ON., Canada)
Donation Donor
Dermofeel ® G 6 CY (Polyglyceryl-6-
caprylate)
Kinetic (Morris, NJ, USA)
Peceol™ (Glycerol monooleate) Gattefosse (Etobicoke, ON, Canada)
2.2.2 Methods
2.2.2.1 Microemulsion preparation
Lecithin was added to EO followed by vortex-mixing until a uniform solution was observed at room
temperature. Glycerol monooleate (LL) was heated until it becomes a clear solution before adding
to the mixture. Polyglycerol-6-caprylate (HL) was added to the mixture and then the mixture was
mixed until becoming homogeneous. The mixtures were sonicated in a water bath at room
temperature to aid solubility.
2.2.2.2 Ternary phase diagram (TPD)
EO was mixed with the surfactant mixture (HL/LL/lecithin) from 10w% to 90w%. Two surfactant
mixture ratios were evaluated, 70/15/15 and 60/20/20, by weight. Each mixture was then diluted
by aqueous solution at different composition, from 10% to 95w%. The aqueous solution can be
deionized (DI) water or fed state simulated intestinal fluid (FeSSIF).

13
2.2.2.3 EACN scans for ethyl oleate (Nouraei and Acosta, 2017)
10 vol% sodium dihexyl sulfosuccinate sodium (SDHS) was added into solutions with increasing
salinity (0, 5, 10, 15, 20, 25 and 30 g NaCl/100mL DI water). The mixture was then mixed with an
equal volume of EO.
The solubility parameter (SP) method was used to obtain the optimal salinity (S*), involving the
measurement of the volume of water (Vw) and oil (VO) solubilized per mass of added surfactant
(MSDHS). Vw and VO can be estimated by the height of each phase in the vial. The SP of oil and
water can be calculated using the following equations:
SPO = VO
MSDHS Eq. 2.5
SPw = Vw
MSDHS Eq. 2.6
The optimal salinity occurs when SPO and SPW are the same, in other words, the same volume of
the aqueous phase and oil phase solubilized in the bicontinuous microemulsion. The EACN of
EO can be determined by using the simplified HLD equation for ionic surfactant (Eq. 2.1). At HLD
= 0 (bicontinuous microemulsion), the equation can be rearranged to:
EACN = ln(S∗)+ CC
K Eq. 2.7
where the CC of SDHS is -0.92 and K is 0.17 (Nouraei and Acosta, 2017).
2.2.2.4 Phase scan of the LLMs system
The phase scan of the system is identical as the phase scan EACN experiment described in
2.2.2.3, instead, the surfactant was the surfactant mixture (HL/LL/lecithin) with a weight ratio of
70/15/15.

14
2.3 Results
2.3.1 Determination of HLD parameters for HLD calculation
The research studied LLMs systems with two surfactant mixture ratios (HL/LL/lecithin), 70/15/15
and 60/20/20, by weight. To obtain the HLD value of a SOW system, one will need to determine
several parameters beforehand, the salinity of the system, EACN of the oil, the characteristic
curvature of the surfactant(s). All experiments were conducted at room temperature without the
introduction of co-solvents, the effect of temperature is negligible.
2.3.1.1 Salinity of the LLMs system
The preconcentrated microemulsions (oil and surfactants) were diluted by fed state simulated
intestinal fluid (FeSSIF) in the phase scan experiments. The composition of FeSSIF is listed in
Table 2.1. The salinity of the system is 1.87 g NaCl/100 mL and is calculated by summing the
total moles of sodium ions and converted into an equivalent NaCl concentration (NaOH, NaCl,
and Sodium taurocholate).
Table 2.1: Composition of FeSSIF
Concentration, mM
NaOH 101.0
NaCl 203.2
Acetic acid 144.1
Sodium taurocholate 15.0
Lecithin 3.8
pH Adjusted to 6.8
2.3.1.2 EACN measurement for EO
The hydrophobicity of EO can be indicated by the value of EACN. The EACN reflects the effective
carbon number of an oil molecule that is equivalent to a molecule with linear carbon chain (e.g.,
EACN of hexane is 6, because it has 6 carbon atoms in the hydrocarbon chain; EACN of benzene
is 0 even though it has 6 carbon atoms). The experiment scanned salinity from 0-30w% and the

15
optimal salinity (equal volume of oil and water solubilized in microemulsions phase) was found to
be at 13w/v% salt [Figure 2.6]. The EACN of EO is 9.8, and the calculation via Eq. 2.7 is shown
below. The EACN of EC was calculated as 5.1 by Nouraei and Acosta (2017). The greater the
EACN value indicates the more hydrophobic of the oil. The result is expected because EO has
longer fatty acid chain than EC.
EACN = ln(13)−0.92
0.17 = 9.8
Figure 2.6: a) EACN determination of EO. Salinity from 11% to 19% (w/v) from left to right. b) salinity (0 – 30w/v%) versus solubility parameter for ethyl oleate. The intercept of the two solubility parameters is the optimal salinity of the system where the system is able to solubilize equal volume of oil and water.
2.3.1.3 Characteristic curvature (Cc) calculation
This research investigated two HL/LL/lecithin ratios, 70/15/15 and 60/20/20, by weight. The ratios
were suggested by a previous study on similar microemulsion systems. Chu et al. conducted
00.5
11.5
22.5
33.5
44.5
5
0 5 10 15 20 25 30
solu
bili
ty p
aram
eter
w% NaCl
SPo
SPw
(a)
(b)

16
preliminary scans and found that 4w% lecithin and 7w% LL are the minimum amounts required in
a formulation to avoid liquid crystal formation. Furthermore, it is shown that lecithin-linkers
microemulsions with 13-20w% HL were able to form isotropic systems (Chu et al., 2014). Nouraei
further investigated the optimal composition of HL in surfactant mixture. The result shows that the
composition of HL in surfactant mixture (HL, LL, lecithin) has to excess 66.7w% in order to avoid
gel and/or liquid crystal formation in various aqueous dilution (up to 10 times dilution). The
surfactant mixture contains equal amount of lecithin and LL. The increasing composition of HL in
the formulation can reduce the droplet size and the turbidity of the dispersion which are desired
properties for formulation (Nouraei, 2012).
The individual characteristic curvature (Cc) of the hydrophilic linker, lipophilic linker, and lecithin
was determined by Nouraei and Acosta (2017) and listed in Table 2.2. The Cc of the surfactant
mixture was calculated using the linear mixing rule which is expressed as:
Cc = xi* Cc,i Eq.2.8
Where xi is the molar fraction of component i in the surfactant mixture; Cc,I is the Cc of component
i.
Table 2.2: Parameters of lecithin-linkers microemulsions
Lecithin Glyceryl
monooleate (LL)
Polyglycerol-6-
caprylate (HL)
MW, g/mol 750a 452a 593a
Area per molecule, ac (Å^2/molec) 90a 0a,b 65a
Characteristic curvature, Cc 5.5a 6.6a -3.0a
a: values are obtained from Nouraei and Acosta (2017).
b: LL has a negligible contacting area at the oil/water interface due to neutron scattering studies (Nouraei and Acosta, 2017)
2.3.2 HLD calculations for the LLMs systems
The value of HLD was calculated using Eq. 2.2 since lecithin is a zwitterionic surfactant. The
constant b and K were reported in the literature for a similar SOW system (Nouraei and Acosta,
2017). In this research, the value b and k are approximated to be 0.1 and 0.17 in the calculations.
The suitability is discussed in Figure 2.7. The procedure to calculate HLD is identical for the two
systems and the parameters were summarized in Table 2.3. The HLD of the two systems is
negative which indicates Winsor type I (o/w) microemulsions was formed. The 70/15/15 system
17
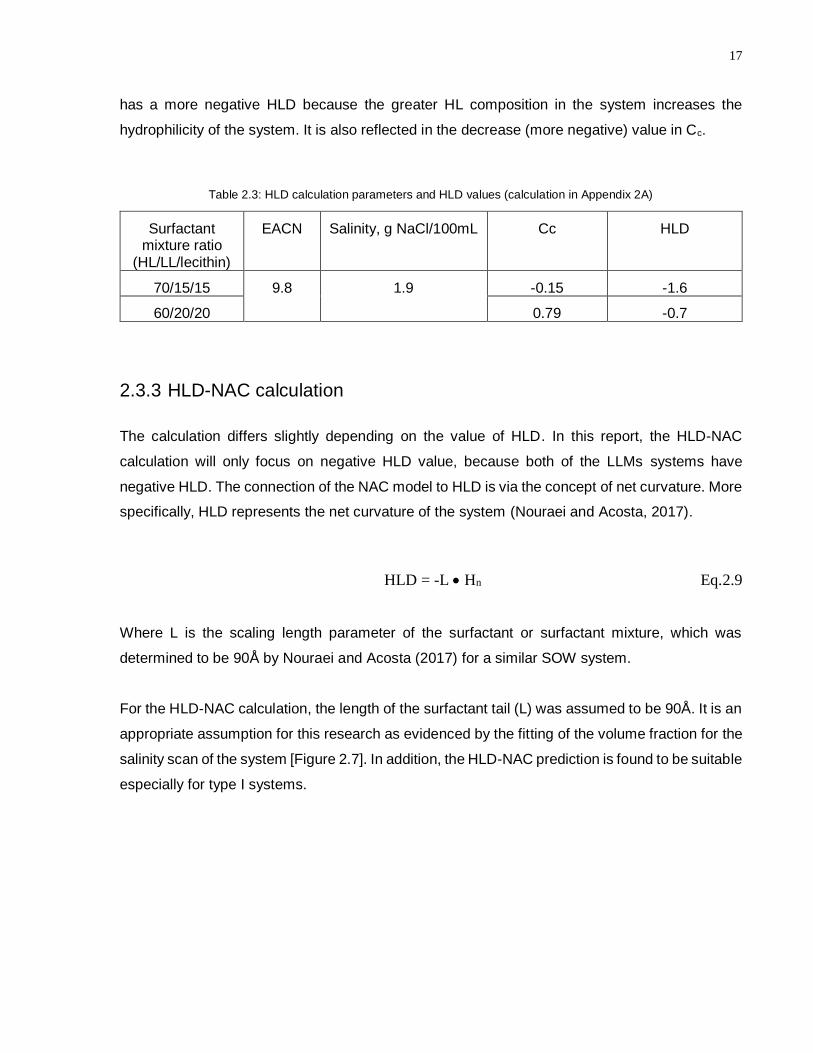
has a more negative HLD because the greater HL composition in the system increases the
hydrophilicity of the system. It is also reflected in the decrease (more negative) value in Cc.
Table 2.3: HLD calculation parameters and HLD values (calculation in Appendix 2A)
Surfactant mixture ratio
(HL/LL/lecithin)
EACN Salinity, g NaCl/100mL Cc HLD
70/15/15 9.8 1.9 -0.15 -1.6
60/20/20 0.79 -0.7
2.3.3 HLD-NAC calculation
The calculation differs slightly depending on the value of HLD. In this report, the HLD-NAC
calculation will only focus on negative HLD value, because both of the LLMs systems have
negative HLD. The connection of the NAC model to HLD is via the concept of net curvature. More
specifically, HLD represents the net curvature of the system (Nouraei and Acosta, 2017).
HLD = -L • Hn Eq.2.9
Where L is the scaling length parameter of the surfactant or surfactant mixture, which was
determined to be 90Å by Nouraei and Acosta (2017) for a similar SOW system.
For the HLD-NAC calculation, the length of the surfactant tail (L) was assumed to be 90Å. It is an
appropriate assumption for this research as evidenced by the fitting of the volume fraction for the
salinity scan of the system [Figure 2.7]. In addition, the HLD-NAC prediction is found to be suitable
especially for type I systems.

18
Figure 2.7: Salinity scan of the LLMs with 70/15/15 (HL/LL/lecithin) surfactant mixture. The picture shows the scan with a constant 10v% surfactant mixture, and with 10%, 15%, 20%, 25%, 30%w/v NaCl in DI water. The scattered line
represents HLD-NAC phase volumes obtained using L= 90 Å, =120 Å.
Using Eq. 2.3 (and/or Eq. 2.9) allows one to calculate the value of Ro for o/w microemulsions.
Recall Eq. 2.5, the ratio of the volume of oil solubilized (Vo) in the µE phase and the surface area
(As) can be obtained using the following equation:
Ro = 3 ∗Vo
As Eq. 2.10
and it can also be written as:
Ro = 3 ∗Vo
Vs∗
Vs
As Eq. 2.11
As = ∑ns,i* as,i Eq. 2.12
where Vs is the volume of surfactants solubilized in the continuous phase (aqueous phase),
calculated as the molecular weight divided by the density of the surfactant mixture (1.0g/mL)
(Nouraei and Acosta, 2017); As is the oil-surfactants contact area of a o/w micelle, ns,i is the
number of molecules and as,i is the area per molecule. Therefore, Vo /Vs can be calculated using
Eq.2.11.
There are four main steps in using the HLD-NAC framework to construct the solubilization
boundary of a SOW system [Figure 2.8] (Nouraei and Acosta, 2017). The first step is to set a
value of surfactant fraction in the water-surfactant continuous phase (s,ws) from 0.1 to 0.99. Then
Rw,w and Rw,ws can be calculated using the ratio of Vs/As (calculated from Eq. 2.11) and s,ws. Rw,w

19
and Rw,ws both represent the radius of water solubilized in microemulsion phase, the former
assumes the continuous phase is only water while the latter considers the surfactant
concentration in the continuous phase. The only difference in the calculation is just to include the
volume of surfactant in the calculation [Figure 2.8, step 2]. In addition, to calculate Rw,ws, it is
assumed that all the surfactant is partitioned in the continuous aqueous phase (fs,ws = 1). The third
step is to determine Ro,ws using a modified net curvature equation (recall Eq. 2.3). By obtaining
these three values at a given s,ws, it allows one to calculate the minimum surfactant composition
in the oil-surfactant continuum without causing phase separation (s,os). Then the point of s,ws is
connected with the oil apex (orange line) and the point of s,os is connected with the aqueous apex
(blue line). The intersection of the two lines is a point on the boundary line (green point). The
calculation is repeated to obtain a complete solubilisation boundary (dotted green line).
Figure 2.8: Summary of HLD-NAC calculation for the prediction of solubilisation features of a SOW system. The green dotted line represents the predicted solubilisation boundary. The water discontinuity line suggests that a SOW system will not have o/w microemulsions if the system has less than 12.5% water because it is insufficient to form a water continuous phase, therefore water will be discontinuous phase even though the system has a negative HLD value; similarly, the oil discontinuity line suggests that a SOW system having a positive HLD value but less than 12.5% oil will not be able to form an oil continuous phase.

20
2.3.4 HLD-NAC predicted solubilisation boundary
Phase behavior scans were conducted to compare with the prediction from HLD-NAC. Figure 2.9
and Figure 2.10 show both the ternary phase diagram (TPD) and the HLD-NAC predicted
solubilisation features of the two systems, 70/15/15 and 60/20/20. The colored regions are
experimental observations. FeSSIF was used as the aqueous dilution in both TPDs. From the
phase scans, the fully-dilutable LLMs were observed in preconcentrates with 65-100w%
surfactants for the 70/15/15 system. The value of fs,min represents the minimum surfactant
concentration in a mixture of oil and surfactants in order to prevent phase separation during
dilution. In the 70/15/15 system, fs,min was found to be 65w% surfactants (sum of HL, LL, and
lecithin) while the value of that for the 60/20/20 system was 45w% surfactants (sum of HL, LL,
and lecithin). The decrease of hydrophobicity leads to an increase in the oil solubilisation capacity.
The LLMs system with 60/20/20 surfactant mixture has fully-dilutable formulations in the
concentrates with 45-80w% surfactants. In the 70/15/15 SOW system, the behavior of the
formulations with 35% - 40w% surfactant in preconcentrated LLMs was assumed to be Es,
however, no experiments were conducted at those compositions. Due to the decrease in
composition of the hydrophilic linker in the 60/20/20 system, the oil and microemulsions region is
shrank significantly comparing to that of the 70/15/15 system. Conversely, it results in the growth
of the liquid crystal and microemulsions domain in the 60/20/20 system which agrees with the
observation reported by Nouraei (2012).
As illustrated in Figure 2.9, the HLD-NAC framework effectively predicts the multiphase region for
the 70/15/15 system. The orange curve is the predicted two-phase boundary which
underestimates the multiphase region. The blue line represents the minimum surfactant volume
fraction for solubilisation (fs,min, HLD-NAC), and it is calculated using Eq.2.13. It is a simplified HLD-
NAC method that assumes dilute surfactant concentration, in other words, it excludes the
surfactant fraction in the continuous phase.
s,min = 1
1+VoVs
Eq. 2.13
As shown, using the simplified calculation provides a good estimation of the multiphase (E+oil)
region. The value of fs,min, HLD-NAC suggests that the area under the line is the multiphase region.
However, the HLD-NAC suggests that the at least 48w% of surfactants is required to form a fully
dilutable line while the actual phase separation occurred at surfactant concentration less than

21
65w%. The black dots in the Figure 2.9 represent the actual experimental data points. At
surfactant and oil ratio of 40/60, phase separation occurred between 10w% and 20w% FeSSIF,
but the actual point of separation was uncertain, and it was approximated as the midpoint between
the two compositions.
Figure 2.9: Ternary phase diagram and HLD-NAC predicted phase boundary for the SOW with surfactants at 70/15/15 (HL/LL/lecithin). The green dome is the phase separation region observed from experiments, while the orange line represents the multiphase region predicted by the HLD-NAC framework. The red line is the solubilisation boundary
determined experimentally. The blue line represents the minimum volume fraction of surfactant for fully dilutable Es predicted by HLD-NAC. The black dots represent the actual scans in the experiment. The two dotted lines are oil discontinuity (left) and water discontinuity (right).
The same methodology was used to predict the solubilisation boundary of the 60/20/20 SOW
system [Figure 2.10]. Even though the composition of the surfactants in surfactant mixture was
different, the length parameter (L) of the system was assumed to be the same because it is
independent of the mass. The HLD-NAC framework has a great estimation of the solubilisation
region (orange curve) for the 60/20/20 system. The similar trend was observed. The prediction on
the minimum amount of surfactant required to prevent phase separation was different than the
experimental behaviors. The blue line predicts fs,min to be around 48w% while the experimental
result is 45w% (represented by the red line).

22
Figure 2.10: Predicted phase boundary by HLD-NAC model for 60/20/20 SOW system. The green dome is the experimental phase separation region, while the orange line represents the multiphase region predicted by the HLD-NAC framework. The red line is the solubilisation boundary determined experimentally. The blue line represents the
minimum volume fraction of surfactant for fully dilutable Es predicted by HLD-NAC. The black dots represent the
actual scans in the experiment. The two dotted lines are oil discontinuity (left) and water discontinuity (right).
Based on the two HLD-NAC predictions, neither of the two methods (full and simplified HLD-NAC)
can fully predict the solubilisation features. The simplified HLD-NAC has a great ability to predict
the phase boundary at moderate surfactant concentration. One of the key assumptions is to
neglect the effect surfactant concentration in the system which is not real. The HLD-NAC is good
at estimating the majority of the polyphase region. The discrepancy might be due to nonlinear
change in surfactant partition and interaction with oil and/or water phase for different surfactant
ratios.
23
2.4 Conclusion
The SOW system with a surfactant mixture at 70/15/15 (HL/LL/lecithin) is selected for -carotene
extraction because it produces a relatively wider window for fully-dilutable formulations. According
to phase behavior scans, the selected formulations for -carotene extraction are LLMs with
surfactant/EO at 65/35, by weight. The formulations are fully-dilutable which are desirable for
extraction. Chapter 3 will focus on the evaluation of 65/35 (Surfactants/EO) LLMs with water
dilution, 80%-99%wt, for -carotene extraction. The HLD-NAC framework is effective in providing
guidelines for the development of a SOW system, however, it still requires further investigation in
order to precisely predict the solubilisation features of a SOW system.

24
2.5 Appendices
Appendix 2A: HLD calculation for 70/15/15 and 60/20/20 system
Salinity calculation
salt in aqueous solution g/100mL MW, g/mol mol/100mL
NaOH 0.404 39.997 0.0101
NaCl 1.187 58.44 0.0203
Na-Taurocholate hydrate 0.834 537.68 0.00155
Total salinity in the mixture, gNaCl/100mL 1.87
Characteristic curvature calculation (70/15/15 system)
Surfactant %wt MW %mol Xi Cc, i Cc
HL 70 593 0.118 0.69 -3
-0.15 LL 15 452 0.033 0.19 6.6
Lecithin 15 750 0.020 0.12 5.5
Total 0.171 1.0
b S, g NaCl/100mL K EACN Cc
0.1 1.87 0.17 9.8 -0.15
HLD of 70/15/15 system -1.6
Characteristic curvature calculation (60/20/20 system)
Surfactant %wt MW %mol Xi Cc, i Cc
HL 60 593 0.101 0.59 -3
0.79 LL 20 452 0.044 0.26 6.6
Lecithin 20 750 0.027 0.15 5.5
Total 0.172 1.0
b S, g NaCl/100mL K EACN Cc
0.1 1.87 0.17 9.8 0.79
HLD of 60/20/20 system -0.7

25
Appendix 2B: Replacing EO with commercially available fish oil
The objective of replacing EO with commercially available fish oil (Webber fish oil) is to increase
customer acceptance of the microemulsion formulations. As the result of the phase behavior
scans [Figure 2.14], there is a narrow window for fully-dilutable formulations using this commercial
oil for the application of extraction and drug delivery. Only LLMs with the weight ratio of surfactant
to oil at 90/10 are able to form fully-dilutable formulations. An extensive amount of surfactant is
not ideal for oral drug delivery since it might cause irritation. Interestingly, a four-phase region
was formed which was not observed from previous studies. This might be due to the fact that the
commercial fish oil contains multiple compounds [Figure 2.15], so there are complex interactions
with the surfactants and aqueous solution. On the other hand, the optimal salinity of Webber fish
oil is shifted to 22%w/v salt [Figure 2.16] and the EACN of Webber fish oil was calculated using
Eq. 2.7. The value of EACN is 17.6 which is more hydrophobic than EO used in LLMs formulation.
So far, the possibility of replacing EO with commercially available fish oil remains unknown.
Further investigation on the formulation will be required to develop microemulsions using
commercial fish oil (e.g., change surfactant ratio (HL/LL/lecithin), introduce co-solvents in the
formulations).
LC + Es
Four-phase region
Oil+Es
LC
Single phase Es
Figure 2.14: Ternary phase diagram of SOW system with Webber fish oil and surfactant mixture (HL, LL, lecithin, 70/15/15)

26
Figure 2.16: EACN determination of webber fish oil. Vials contain equal volume of webber fish oil and aqueous solution with salinity from 15%-25%, wt/v, and 10%vol SDHS (surfactant)
Figure 2.15: According to ingredient list, the Webber oil contains docosahexaenoic acid (DHA) and eicosapentaenoic
acid (EPA), and it might contain alpha-linolenic acid (ALA) and gamma-linolenic acid (GLA).
Chapter 3 Development of a Continuous Extraction Process
3.1 Expeller Extraction
The use of hexane in edible vegetable oil extraction has been constrained by the stricter hexane
emission regulation issued by the U.S. Environmental Protection Agency (EPA) in 2001
(Witthayapanyanon and Do, 2011). Therefore, it provides a great incentive for manufacturers and
companies to seek for alternatives. As the result of the formulation development in chapter 2, the
LLMs can be used in nutraceutical extraction to resolve the issue of using VOCs in food extraction.
Approximately 2 million tons of food processing waste was generated annually in the U.S. from
2000 to 2009 (USEPA, 2012). A large amount of food waste requires a scalable extraction
mechanism alongside the LLMs to recover valuable bioactive from waste. A tremendous amount
of effort has been invested in the innovation of extraction technologies to develop an
environmentally-friendly extraction mechanism that can efficiently recover valuable nutrients from
food waste while maintaining the simplicity of the process. Nowadays, more than 80% of β-
carotene is synthesized. The trans-stereoisomers of -carotene have a significant reduction in the
ability to act as an antioxidant compared to natural -carotene (Puri, 2017).
There are two types of extraction methods for lipophilic compounds: solvent extraction and
mechanical pressing. Solvent extraction is the most common method for extracting lipophilic
nutrients from plant materials because it is able to extract more, quicker and cheaper (Azmir et
al., 2013). The extraction principle is that volatile organic (VOCs) solvent dissolve out the lipophilic
compounds upon mixing and steaming. The solvents are then evaporated easily by heating to
produce the final products [Figure 3.1]. However, some solvents, such as chloroform (a
carcinogen), cannot be used in large-scale production due to their volatile and sometimes harmful
nature. Another drawback of the solvent extraction is the potential emission of VOCs into the
atmosphere (Vallero, 2014).
28
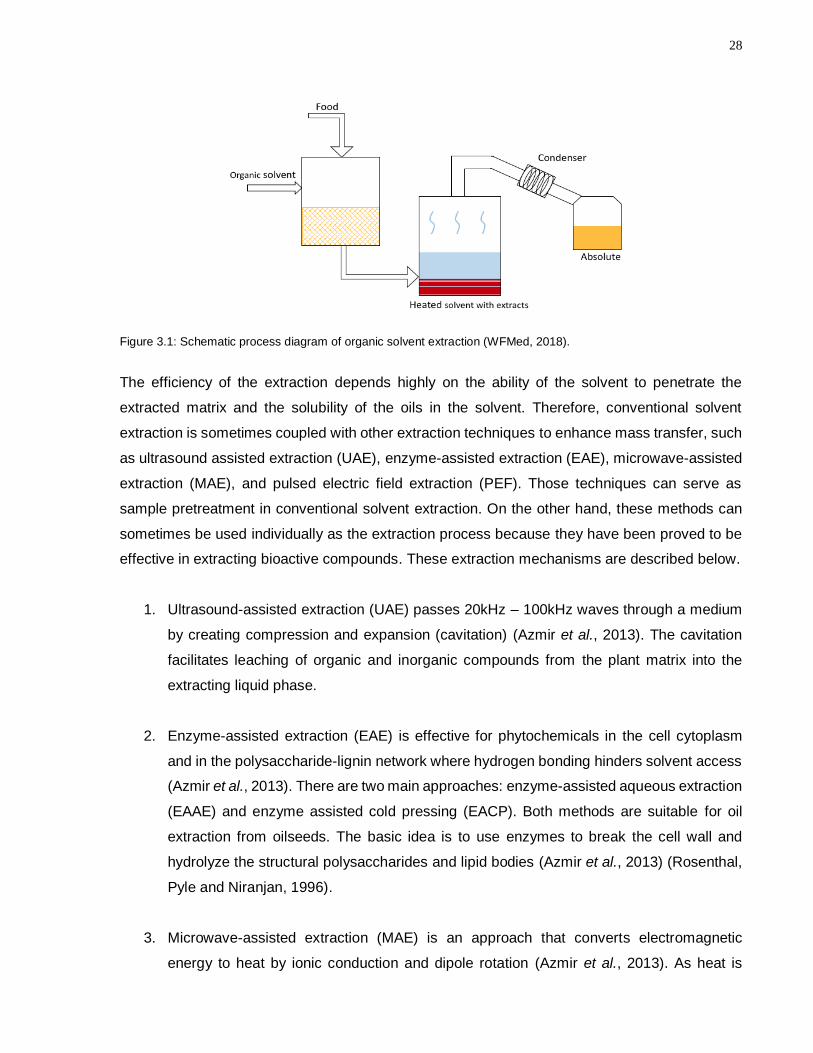
Figure 3.1: Schematic process diagram of organic solvent extraction (WFMed, 2018).
The efficiency of the extraction depends highly on the ability of the solvent to penetrate the
extracted matrix and the solubility of the oils in the solvent. Therefore, conventional solvent
extraction is sometimes coupled with other extraction techniques to enhance mass transfer, such
as ultrasound assisted extraction (UAE), enzyme-assisted extraction (EAE), microwave-assisted
extraction (MAE), and pulsed electric field extraction (PEF). Those techniques can serve as
sample pretreatment in conventional solvent extraction. On the other hand, these methods can
sometimes be used individually as the extraction process because they have been proved to be
effective in extracting bioactive compounds. These extraction mechanisms are described below.
1. Ultrasound-assisted extraction (UAE) passes 20kHz – 100kHz waves through a medium
by creating compression and expansion (cavitation) (Azmir et al., 2013). The cavitation
facilitates leaching of organic and inorganic compounds from the plant matrix into the
extracting liquid phase.
2. Enzyme-assisted extraction (EAE) is effective for phytochemicals in the cell cytoplasm
and in the polysaccharide-lignin network where hydrogen bonding hinders solvent access
(Azmir et al., 2013). There are two main approaches: enzyme-assisted aqueous extraction
(EAAE) and enzyme assisted cold pressing (EACP). Both methods are suitable for oil
extraction from oilseeds. The basic idea is to use enzymes to break the cell wall and
hydrolyze the structural polysaccharides and lipid bodies (Azmir et al., 2013) (Rosenthal,
Pyle and Niranjan, 1996).
3. Microwave-assisted extraction (MAE) is an approach that converts electromagnetic
energy to heat by ionic conduction and dipole rotation (Azmir et al., 2013). As heat is

29
constantly generated by molecular collisions, the desired bioactive can be released and
diffused across the plant matrix (Azmir et al., 2013).
4. Pulsed electric field extraction (PEF) is achieved by applying sufficient transmembrane
potential to the plant materials. The process aims at destroying cell membrane structure
to facilitate intracellular permeability (Azmir et al., 2013).
However, the main problems associated with these extraction mechanisms are high-risk
equipment and insufficient knowledge in handling the machines at an industrial scale. For
example, large-scale ultrasound processing has a non-linear transmission power of ultrasound
into an acoustic cavitation (Azmir et al., 2013). Press extraction is preferred because the process
does not involve the use of VOCs solvents and it can produce a high quality of the oil. Other
advantages of press extraction include the low capital cost of equipment and low energy
consumption compared to solvent extraction or supercritical extraction. The biggest concern of
the press extraction is the low oil yield (<85% oil recovery) (Ariçanu and Rus, 2017).
There are two main approaches to mechanical extraction: hydraulic press (cold press) and
expeller press (screw press). In principle, they are similar because the separation of oil from the
oleaginous material is accomplished by external force. The distinction between the two methods
is the presence of heat supply. The objective of hydraulic pressing is to gradually increase
compression on the material in the pressing chamber by a piston or screw. The process ends
when no oil production is observed. This is an ancient method and yields the best quality of the
oil. However, from experience, this method is more suitable for oil extraction from sesame and
olives (Paul Hawken, 1971).
The expeller press works by squeezing oil out from a constantly rotating worm-like shaft in a tightly
fitted barrel. As depicted in Figure 3.2, the oleaginous material enters into the machine and is put
under continuous pressure until discharged. Oil and cake are discharged at different outlets.
Frictional forces created by rotation and the pressure built up along the channel are the main
driver for moving the materials forward in a stationary barrel (Mount, 2016). The shaft has a cone-
shaped rod designed as the carrier and to provide more pressure on the material as it travels
along the process. The barrel is a hollow rod with a slope complementary to that of the shaft
[Figure 3.3]. The design of screw flights varies for different purposes. Flight design is described
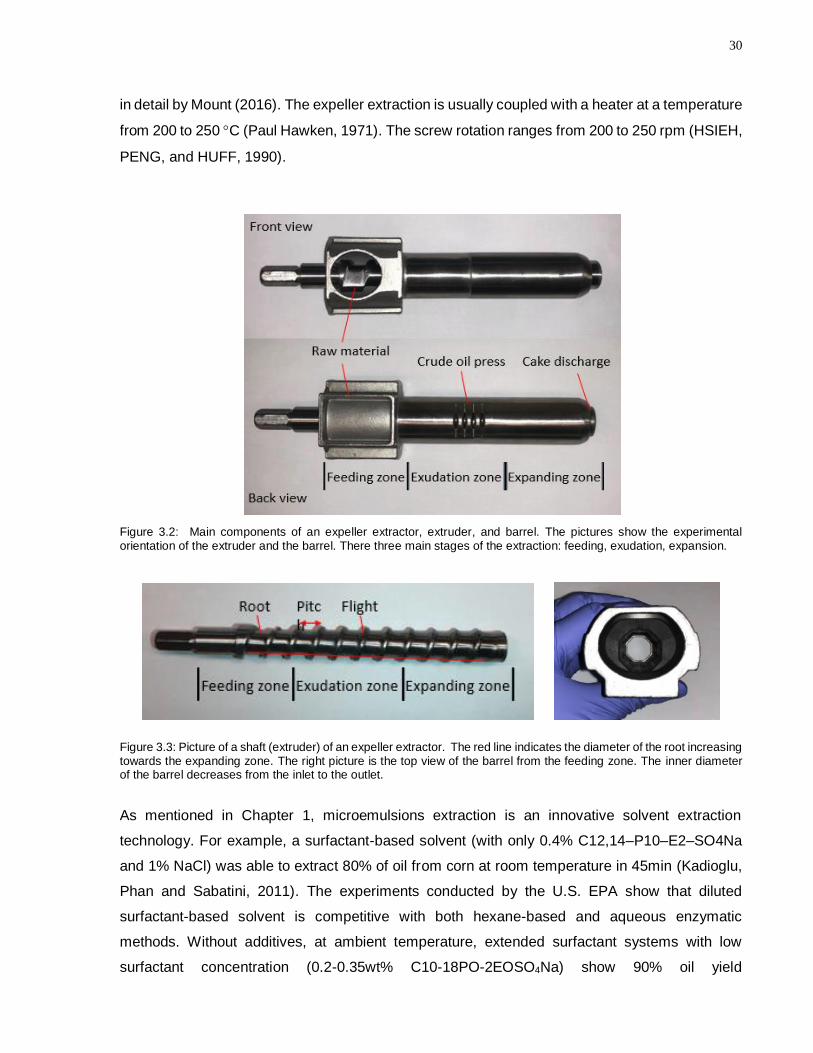
30
in detail by Mount (2016). The expeller extraction is usually coupled with a heater at a temperature
from 200 to 250 C (Paul Hawken, 1971). The screw rotation ranges from 200 to 250 rpm (HSIEH,
PENG, and HUFF, 1990).
Figure 3.2: Main components of an expeller extractor, extruder, and barrel. The pictures show the experimental orientation of the extruder and the barrel. There three main stages of the extraction: feeding, exudation, expansion.
Figure 3.3: Picture of a shaft (extruder) of an expeller extractor. The red line indicates the diameter of the root increasing towards the expanding zone. The right picture is the top view of the barrel from the feeding zone. The inner diameter of the barrel decreases from the inlet to the outlet.
As mentioned in Chapter 1, microemulsions extraction is an innovative solvent extraction
technology. For example, a surfactant-based solvent (with only 0.4% C12,14–P10–E2–SO4Na
and 1% NaCl) was able to extract 80% of oil from corn at room temperature in 45min (Kadioglu,
Phan and Sabatini, 2011). The experiments conducted by the U.S. EPA show that diluted
surfactant-based solvent is competitive with both hexane-based and aqueous enzymatic
methods. Without additives, at ambient temperature, extended surfactant systems with low
surfactant concentration (0.2-0.35wt% C10-18PO-2EOSO4Na) show 90% oil yield
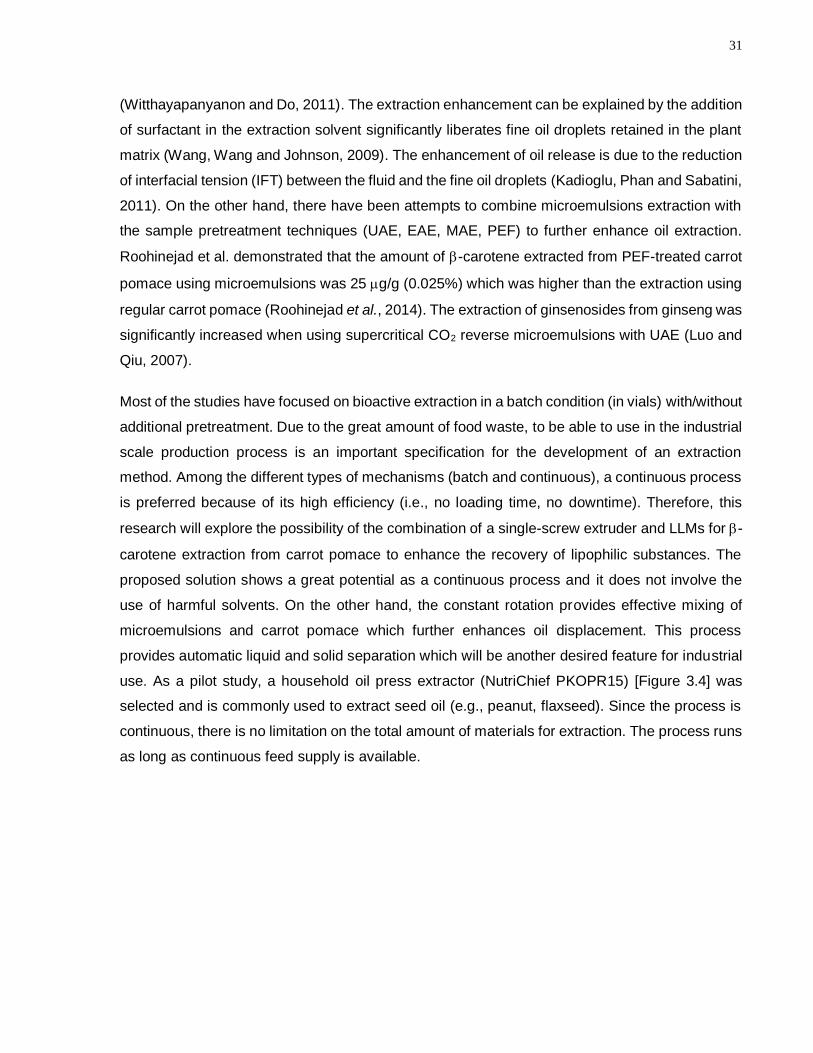
31
(Witthayapanyanon and Do, 2011). The extraction enhancement can be explained by the addition
of surfactant in the extraction solvent significantly liberates fine oil droplets retained in the plant
matrix (Wang, Wang and Johnson, 2009). The enhancement of oil release is due to the reduction
of interfacial tension (IFT) between the fluid and the fine oil droplets (Kadioglu, Phan and Sabatini,
2011). On the other hand, there have been attempts to combine microemulsions extraction with
the sample pretreatment techniques (UAE, EAE, MAE, PEF) to further enhance oil extraction.
Roohinejad et al. demonstrated that the amount of -carotene extracted from PEF-treated carrot
pomace using microemulsions was 25 g/g (0.025%) which was higher than the extraction using
regular carrot pomace (Roohinejad et al., 2014). The extraction of ginsenosides from ginseng was
significantly increased when using supercritical CO2 reverse microemulsions with UAE (Luo and
Qiu, 2007).
Most of the studies have focused on bioactive extraction in a batch condition (in vials) with/without
additional pretreatment. Due to the great amount of food waste, to be able to use in the industrial
scale production process is an important specification for the development of an extraction
method. Among the different types of mechanisms (batch and continuous), a continuous process
is preferred because of its high efficiency (i.e., no loading time, no downtime). Therefore, this
research will explore the possibility of the combination of a single-screw extruder and LLMs for -
carotene extraction from carrot pomace to enhance the recovery of lipophilic substances. The
proposed solution shows a great potential as a continuous process and it does not involve the
use of harmful solvents. On the other hand, the constant rotation provides effective mixing of
microemulsions and carrot pomace which further enhances oil displacement. This process
provides automatic liquid and solid separation which will be another desired feature for industrial
use. As a pilot study, a household oil press extractor (NutriChief PKOPR15) [Figure 3.4] was
selected and is commonly used to extract seed oil (e.g., peanut, flaxseed). Since the process is
continuous, there is no limitation on the total amount of materials for extraction. The process runs
as long as continuous feed supply is available.
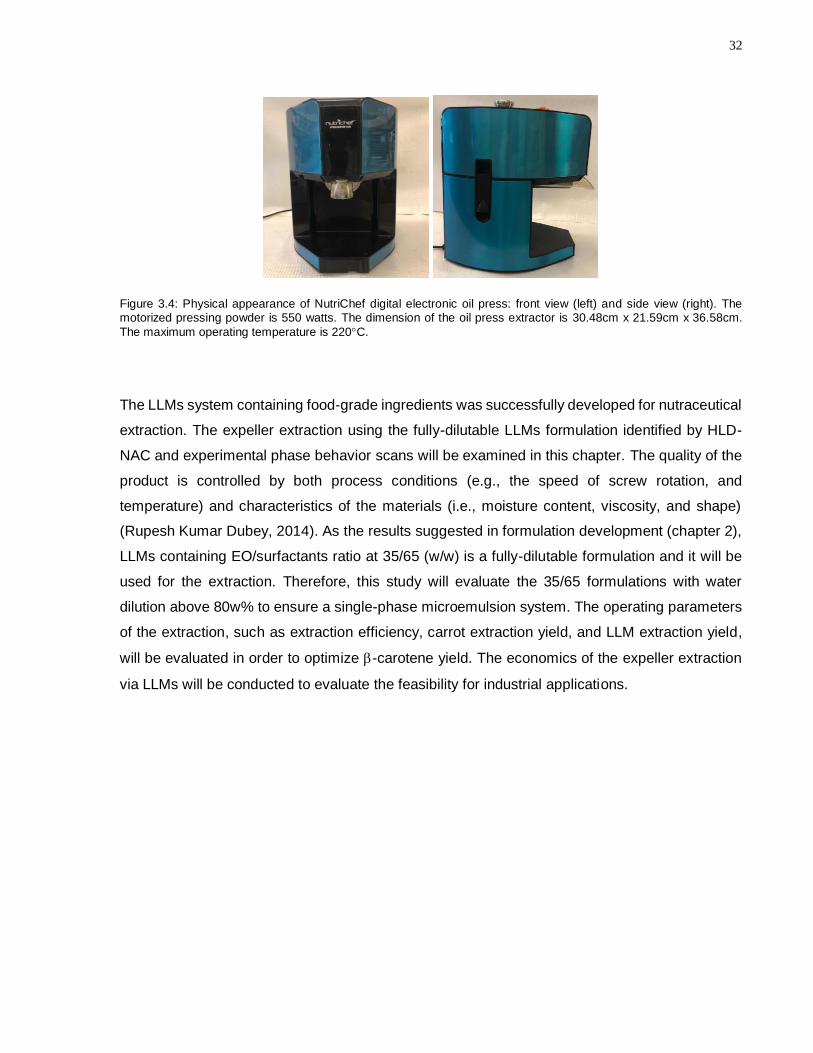
32
Figure 3.4: Physical appearance of NutriChef digital electronic oil press: front view (left) and side view (right). The motorized pressing powder is 550 watts. The dimension of the oil press extractor is 30.48cm x 21.59cm x 36.58cm.
The maximum operating temperature is 220C.
The LLMs system containing food-grade ingredients was successfully developed for nutraceutical
extraction. The expeller extraction using the fully-dilutable LLMs formulation identified by HLD-
NAC and experimental phase behavior scans will be examined in this chapter. The quality of the
product is controlled by both process conditions (e.g., the speed of screw rotation, and
temperature) and characteristics of the materials (i.e., moisture content, viscosity, and shape)
(Rupesh Kumar Dubey, 2014). As the results suggested in formulation development (chapter 2),
LLMs containing EO/surfactants ratio at 35/65 (w/w) is a fully-dilutable formulation and it will be
used for the extraction. Therefore, this study will evaluate the 35/65 formulations with water
dilution above 80w% to ensure a single-phase microemulsion system. The operating parameters
of the extraction, such as extraction efficiency, carrot extraction yield, and LLM extraction yield,
will be evaluated in order to optimize -carotene yield. The economics of the expeller extraction
via LLMs will be conducted to evaluate the feasibility for industrial applications.

33
Figure 5: Ternary phase diagram of LLMs system with surfactant mixture ratio at 70/15/15, w/w.
Figure 3.5: Ternary phase diagram of LLMs system with surfactant mixture ratio at 70/15/15, w/w.
34
3.2 Materials and Methods
3.2.1 Materials
The table below lists the chemicals used to conduct experiments in chapter 3.
Chemical Supplier
Soy lecithin
ACROS Organics (NJ., U.S.) Ethyl Oleate, 98%, mixture of homologous fatty
acid esters
NaCl, > 99.0% Bishop (ON., Canada)
Beta-carotene, > 95% Sigma Aldrich (ON., Canada)
Hexane, HPLC grade VWR (ON., Canada)
Ethyl alcohols anhydrous Commercial Alcohols (MedStore UofT,
ON., Canada)
Acetone, reagent Caledon (ON., Canada)
Methanol, HPLC grade
Acetonitrile, HPLC grade
Donation Donor
Fluorescein Food engineering laboratory, University of
Toronto
Triethylamine, HPLC grade ANALEST facility, University of Toronto
Dermofeel ® G 6 CY (Polyglycerol-6-caprylate) Kinetic (Morris, NJ, USA)
Peceol™ (Glycerol monooleate) Gattefosse (Etobicoke, ON, Canada)
3.2.2 Methods
3.2.2.1 Oil press extraction
The carrot was purchased from local markets (Toronto, ON., Canada). The carrot pomace was
prepared using a household juicer (Hamilton-beach 67608A, ON., Canada) and was stored at
5°C until the day of the experiment. The carrot pomace was mixed with diluted LLMs and then
introduced into the oil press machine. The carrot/LLMs ratios tested were 0.5, 1, 1.5, 2. LLMs
containing at 80w%, 90w%, 95w%, 98w%, 99w% water, were used for the extraction experiments.
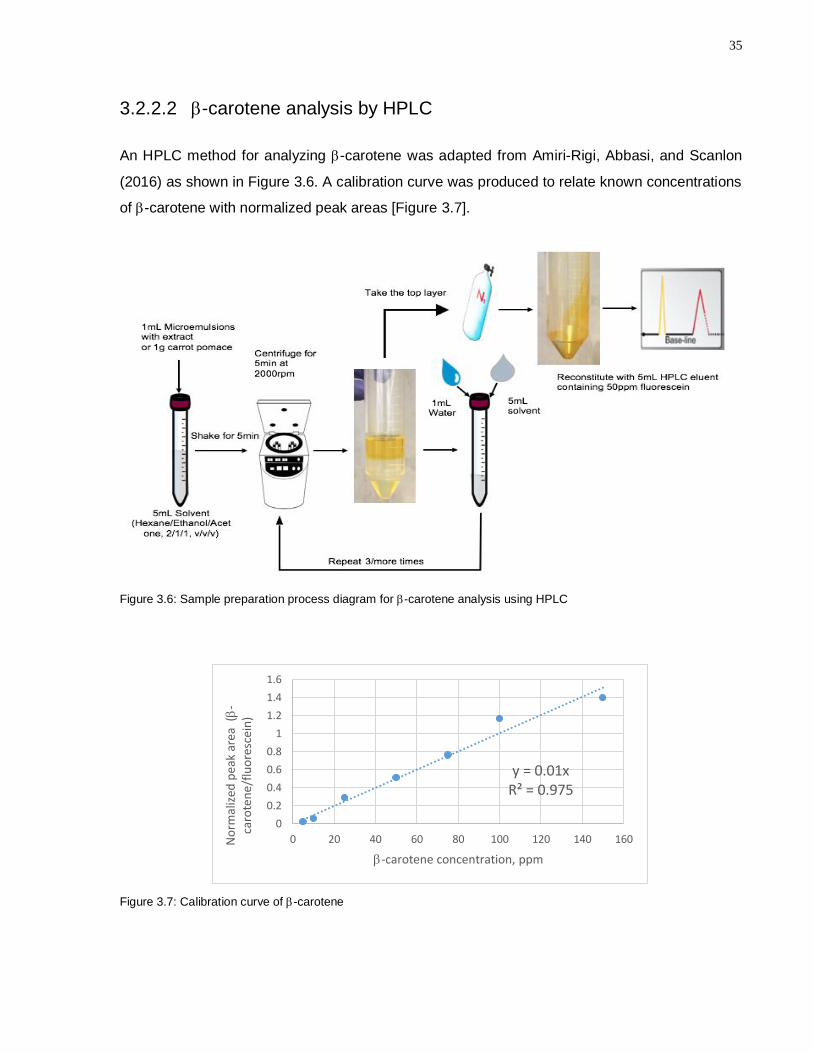
35
3.2.2.2 -carotene analysis by HPLC
An HPLC method for analyzing -carotene was adapted from Amiri-Rigi, Abbasi, and Scanlon
(2016) as shown in Figure 3.6. A calibration curve was produced to relate known concentrations
of -carotene with normalized peak areas [Figure 3.7].
Figure 3.6: Sample preparation process diagram for -carotene analysis using HPLC
Figure 3.7: Calibration curve of -carotene
y = 0.01xR² = 0.975
0
0.2
0.4
0.6
0.8
1
1.2
1.4
1.6
0 20 40 60 80 100 120 140 160No
rmal
ized
pea
k ar
ea (
-ca
rote
ne
/flu
ore
sce
in)
-carotene concentration, ppm

36
Microemulsion samples:
For HPLC analysis, 1mL of liquid sample after extraction (collected from the expeller) was mixed
with 5mL solvent mixture of hexane/ethanol/acetone at a ratio of 2:1:1 (v/v) and 1mL of distilled
deionized (DI) water in a conical centrifuge tube (FroggaBio, TB50-500). The mixture was shaken
for 5 min before being centrifuged at 2000 rpm for 5 min. The hexane phase (top) was withdrawn
and transferred to a separate test tube. The solvent extraction was repeated for two/three more
times until the bottom phase was clear. The top phase from each trial was collected in the same
tube.
Fresh carrot pomace samples:
Instead of using microemulsions, 1 g of wet carrot (collected after juicing) was used as the sample
and was added to 5mL solvent mixture and 1mL distilled DI water. The remaining extraction
procedure is identical to the microemulsion sample analysis.
Prior to the HPLC quantification, the dried β-carotene samples in the test tube were cooled down
to room temperature. 5mL of eluent solution (Methanol/Acetonitrile/Triethylamine, 800/200/1, v/v)
was added with 50ppm fluorescein as an internal standard. To ensure full dissolution, vortex
mixing was used as needed. The samples were transferred into HPLC vials using 0.2 µm syringe
filters (Acrodisc* Sterile Syringe Filters).
For the HPLC experiment (Autosampler and pump: Series 200, Perkin Elmer; UV-VIS detector:
SPD-10A, SHIMADZU, Canada; Column: C18, 150mmx4.6mm, Grace Davison, IL, U.S.; Guard
holder: KJ0-4282, Phenomenex, U.S.; Guard cartridges: AJ0-4287, Phenomenex, U.S.), 20μL of
sample was injected for each run and the runtime was set to 50min. The eluent solution flow was
set to 1.2 mL/min. The UV spectrometer was set at 450nm [Appendix 3B for HPLC sampling
procedure]. The retention time of -carotene was found at 43min [Figure 3.8].
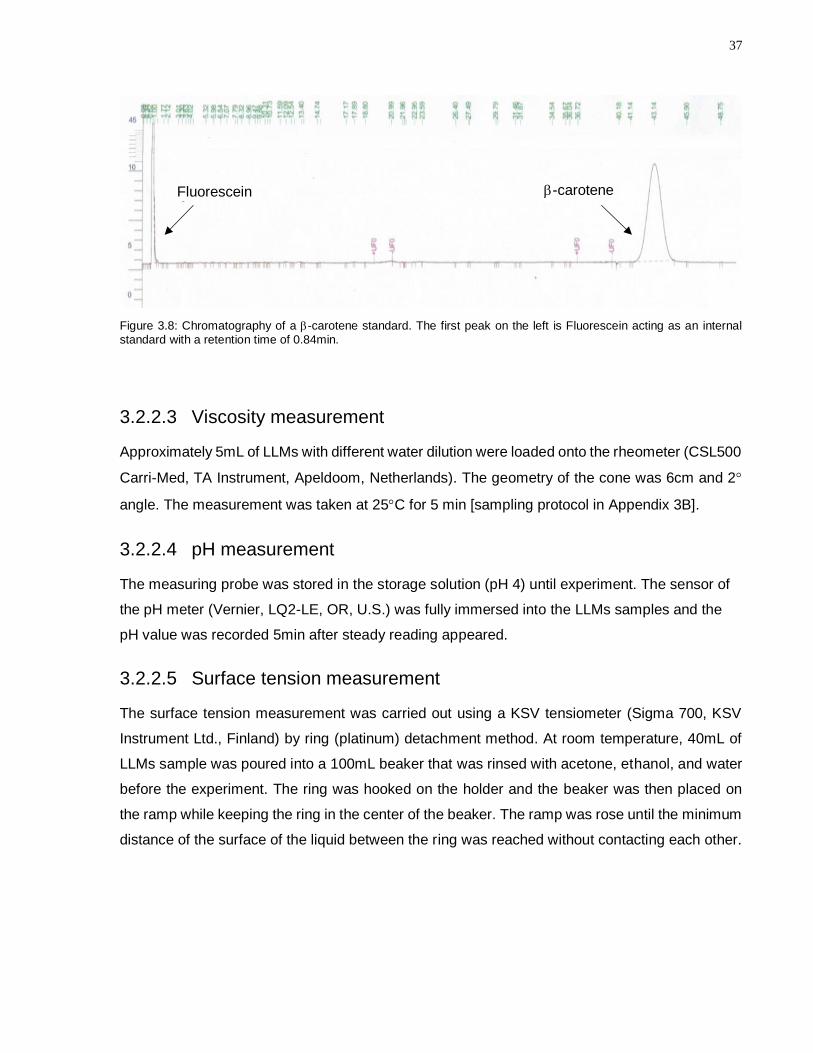
37
Figure 3.8: Chromatography of a -carotene standard. The first peak on the left is Fluorescein acting as an internal standard with a retention time of 0.84min.
3.2.2.3 Viscosity measurement
Approximately 5mL of LLMs with different water dilution were loaded onto the rheometer (CSL500
Carri-Med, TA Instrument, Apeldoom, Netherlands). The geometry of the cone was 6cm and 2
angle. The measurement was taken at 25C for 5 min [sampling protocol in Appendix 3B].
3.2.2.4 pH measurement
The measuring probe was stored in the storage solution (pH 4) until experiment. The sensor of
the pH meter (Vernier, LQ2-LE, OR, U.S.) was fully immersed into the LLMs samples and the
pH value was recorded 5min after steady reading appeared.
3.2.2.5 Surface tension measurement
The surface tension measurement was carried out using a KSV tensiometer (Sigma 700, KSV
Instrument Ltd., Finland) by ring (platinum) detachment method. At room temperature, 40mL of
LLMs sample was poured into a 100mL beaker that was rinsed with acetone, ethanol, and water
before the experiment. The ring was hooked on the holder and the beaker was then placed on
the ramp while keeping the ring in the center of the beaker. The ramp was rose until the minimum
distance of the surface of the liquid between the ring was reached without contacting each other.
Fluorescein -carotene
Fluorescein -carotene

38
3.3 Results
3.3.1 Fixed extraction conditions
The oil press machine requires a fixed start-up time of 6min to heat up the machine for extraction.
The temperature effect is negligible to both the carrot pomace and LLMs, because -carotene
and LLMs are not heat sensitive. -carotene is bioactive until 170 C (Dutra-de-oliveira et al.,
1998). The extractor operates at approximately 60C, measured using an infrared thermometer
(LASERGRIP 800, ETEKCITY, CA., U.S.). The carrot feed was processed at approximately
3g/min. This is a continuous process and an unlimited amount of materials can be processed as
long as constant feed is available. The minimum amount of LLMs and carrot required for an
extraction are both around 10g.
3.3.2 Optimized extraction conditions
This section investigates multiple operating conditions in order to optimize the expeller extraction.
The goal is to extract maximal -carotene with a minimal amount of materials (mainly oil and
surfactants). The extraction efficiency was evaluated based on liquid recovery, solid/liquid ratio,
and aqueous dilutions on -carotene yield respectively.
3.3.2.1 Water vs. LLMs as extraction media
Before investigating the effect of surfactants in extraction, water was used as the solvent to extract
-carotene extraction under two conditions: batch extraction and expeller extraction. The purpose
is to examine the effect of using expeller on -carotene extraction. Both experiments were
conducted using the same carrot source and with the same extraction time. Based on the orange
color after extraction, the extractor seems to be more effective than the batch experiment [Figure
3.9]. From the HPLC analysis, the amount of -carotene extracted from the two experiments was
significantly different. Approximately 0.175mg -carotene was extracted from 1 gram of carrot
using the extractor, while water was only able to extract 0.0174mg -carotene. Without the
addition of surfactants, the expeller extraction increases the extraction efficiency by 10 times
compared to batch extraction. Faulks and Southon (2005) found that carotenoids can only be

39
released during processing and/or mastication, not during digestion. The friction forces generated
during the process provides some degree of grinding of the fibers, in which creates more surface
area to allow the greater release of -carotene from the matrix. In addition, greater pressure is
generated on the fiber as it travels down the barrel which prompts the extractability of carrot
pomace due to macromolecular change (Butz et al., 2002).
Figure 3.9: -carotene recovery from two extractions using water as the solvent: batch extraction (left) and expeller extraction (right). The carrot/LLMs ratio is 1/15 in batch extraction and 1.5 in expeller extraction.
3.3.2.2 Effect of carrot/LLMs ratio on the recovery of liquid and -carotene
As mentioned in the introduction (Ariçanu and Rus, 2017), the liquid yield is the biggest concern
for expeller extraction, because it determines the total yield of -carotene in the final product. To
better understand the process, the liquid recovery was studied at 5 different carrot/LLMs ratios
(0.5, 1, 1.5, 2), by weight. A 10g LLMs basis means the extraction used 10g of 90%w water LLMs
and varied the amount of carrot pomace according to the ratio. As shown in Figure 3.10, more
liquid was collected from the extractor with increasing carrot/LLMs ratio until the ratio reaches 1.5.
Further increase in carrot/LLMs ratio leads to a decrease in liquid recovery. At carrot/LLMs ratio
of 1.5, the system reaches the highest liquid recovery among the other carrot/LLMs ratios. For
the extraction with 15g basis and 30g basis LLMs at the ratio of 1.5, around 90w% of the water-
diluted LLMs was collected after the process. More solid generates greater pressure as the
materials move down the barrel. The extractor is able to squeeze more liquid from carrot pomace.
On the other hand, when too much carrot is presented, the carrot fibers absorb more LLMs.
0
0.05
0.1
0.15
0.2
0.25
Batch Extractor
Car
rot
extr
acti
on
yie
ld
mg
β-c
aro
ten
e/g
car
rot

40
Figure 3.10: Percentage of LLMs recovery at the various carrot/LLMs ratio. The water dilution in LLMs was kept constant at 90w%. The experiment was repeated at a 10g, 15g, 30g 90%w LLMs basis.
On top of the liquid recovery rate, the ability of LLMs to extract -carotene is another important
attribute. The carrot extraction yield using the four carrot/LLMs ratios is shown in Figure 3.11. As
the ratio of carrot and LLMs increases, the yield of -carotene reaches the maximum at
carrot/LLMs ratio of 1 where a yield of 0.487mg -carotene/g carrot is achieved. Further increase
of carrot/LLMs ratio leads to a reduction of -carotene extraction efficiency. This might be due to
an insufficient amount of surfactants to release -carotene from carrot pomace.
From the LLMs extraction yield point of view [Figure 3.11], carrot/LLMs ratio at 2 has the highest
-carotene concentration, at which it requires 0.108g surfactants (sum of HL, LL and, lecithin,
70/15/15, w/w) to extract 1mg of -carotene from carrot pomace. In the study of Roohinejad, the
optimal condition needs 8g Tween 80 (surfactant) to extract 1mg of -carotene after PEF
(Roohinejad et al., 2014). Amiri-Rigi suggested that the optimal lycopene (a carotenoid in tomato)
extraction was obtained at the surfactant and lycopene ratio of 30:1, which means 0.03g
surfactant is required to extract 1mg of lycopene (Amiri-Rigi, Abbasi and Scanlon, 2016).
However, the extraction efficiency of lycopene using that formulation is limited, and it is compared
in Figure 3.16. The dramatic enhancement of -carotene extraction via LLMs is a result of the
combination of extrusion and surfactant effect. The friction and pressure generated on carrot
pomace enhance the release of -carotene from carrot pomace, while the presence of HL and LL
increases the solubility of oil and aqueous solution. The overall trend suggests that the increase
of solid to liquid ratio (decrease of surfactant and carrot pomace ratio) prompts the LLMs
0
10
20
30
40
50
60
70
80
90
100
0.5 1 1.5 2
% li
qu
id r
eco
very
carrot/LLMs ratio, w/w
10g LLMs basis
15g LLMs basis
30g LLMs basis

41
extraction yield whereas excessive surfactant concentration might not be beneficial for releasing
-carotene. The effect of surfactant concentration will be further investigated in the next section.
Figure 3.11: -carotene efficiency from different carrot/LLMs ratios. The LLMs contain 90%wt water.
Figure 3.12: -carotene yield from different carrot/LLMs ratios in terms of the amount concentrated LLMs used (oil and surfactants). The LLMs contain 90%wt water.
3.3.2.3 Effect of surfactant concentration on -carotene yield
The effect of surfactant concentration on the extraction efficiency was investigated by diluting
LLMs with 80%, 90%, 95%, 98%, 99% water, by weight. The carrot/LLMs ratio was fixed at 1.5.
The extraction efficiency of -carotene is not distinguishable based on the color of the LLMs
collected after extraction [Figure 3.13]. However, it is obvious that a portion of -carotene was
extracted based on the color of the carrot pomace before and after extraction.
0.2
0.25
0.3
0.35
0.4
0.45
0.5
0.55
0.5 1 1.5 2
Car
rot
extr
acti
on
yie
ldm
g β
-car
ote
ne
/g c
arro
t
carrot/LMs ratio, w/w
1.5
2.5
3.5
4.5
5.5
6.5
0.5 1 1.5 2
LLM
s ex
trac
tio
n y
ield
m
g β
-car
ote
ne
/g L
LMs
carrot/LLMs ratio, w/w
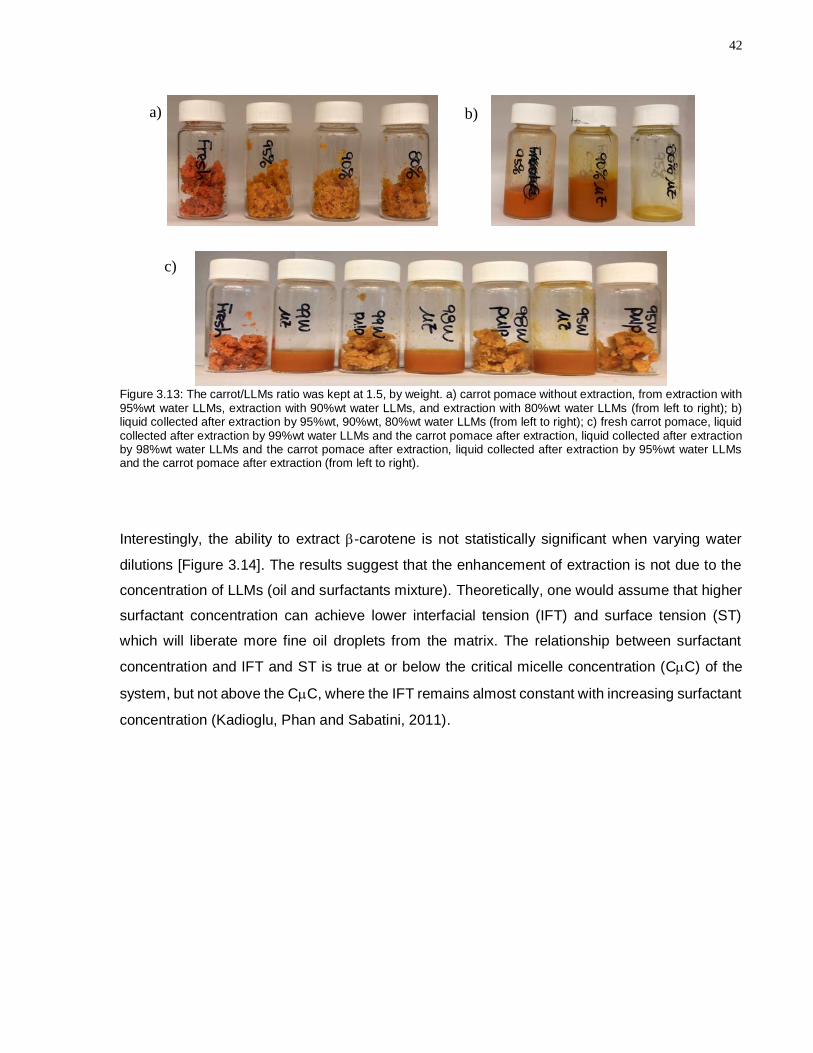
42
Figure 3.13: The carrot/LLMs ratio was kept at 1.5, by weight. a) carrot pomace without extraction, from extraction with 95%wt water LLMs, extraction with 90%wt water LLMs, and extraction with 80%wt water LLMs (from left to right); b) liquid collected after extraction by 95%wt, 90%wt, 80%wt water LLMs (from left to right); c) fresh carrot pomace, liquid collected after extraction by 99%wt water LLMs and the carrot pomace after extraction, liquid collected after extraction by 98%wt water LLMs and the carrot pomace after extraction, liquid collected after extraction by 95%wt water LLMs and the carrot pomace after extraction (from left to right).
Interestingly, the ability to extract -carotene is not statistically significant when varying water
dilutions [Figure 3.14]. The results suggest that the enhancement of extraction is not due to the
concentration of LLMs (oil and surfactants mixture). Theoretically, one would assume that higher
surfactant concentration can achieve lower interfacial tension (IFT) and surface tension (ST)
which will liberate more fine oil droplets from the matrix. The relationship between surfactant
concentration and IFT and ST is true at or below the critical micelle concentration (CC) of the
system, but not above the CC, where the IFT remains almost constant with increasing surfactant
concentration (Kadioglu, Phan and Sabatini, 2011).
a) b)
c)

43
Figure 3.14: Extraction efficiency of LLMs with various surfactant concentration (by varying water dilution). The carrot/LLMs ratio is 3/2. 100% represents pure DI water. The experiments were not from the same carrot source.
Kaidioglu et al. have demonstrated that the surfactant concentration does not have a
linear relationship with its extraction efficiency (higher surfactant concentration yields
higher oil recovery). In fact, the maximum extraction efficiency occurs at diluted surfactant
concentration when the system excesses 0.1w% surfactant concentration of its CC
value. In the same study, Kaidioglu et al. (2011) also showed that the further addition of
surfactant leads to a decrease in extraction efficiency due to over-reduction of IFT. The
oil droplets tend to spread on the fibers. Amiri-Rigi et al. also observed the same trend in
lycopene extraction via microemulsions, the extractability decreases when keep
increasing surfactant to lycopene ratio (Amiri-Rigi, Abbasi and Scanlon, 2016).
A similar trend is observed in the LLMs system. The overall extraction efficiency seems
to be independent of the surfactant concentration as shown in Figure 3.14. The LLMs with
five different dilutions were able to extract 0.3-0.4mg -carotene/g carrot. However, the
presence of surfactant can increase the extraction yield of -carotene. The 99w% water
LLMs with a surfactant concentration of 0.65w% can extract 2 times more -carotene than
expeller extraction using DI water.
Interesting results were observed when comparing the LLMs extraction yield (-carotene
extracted per gram of concentrated LLMs that contain only oil and surfactants) with different water
dilutions. 99w% water LLMs exhibited a much better extraction efficiency compared to other
dilutions [Figure 3.15]. It can extract 53.8mg/g concentrated LLMs while 98w% water LLMs can
0
0.1
0.2
0.3
0.4
0.5
0.6
80 90 95 98 99 100
carr
ot
extr
acti
on
yie
ld
mg
-car
ote
ne/
g ca
rro
t
w% water dilution
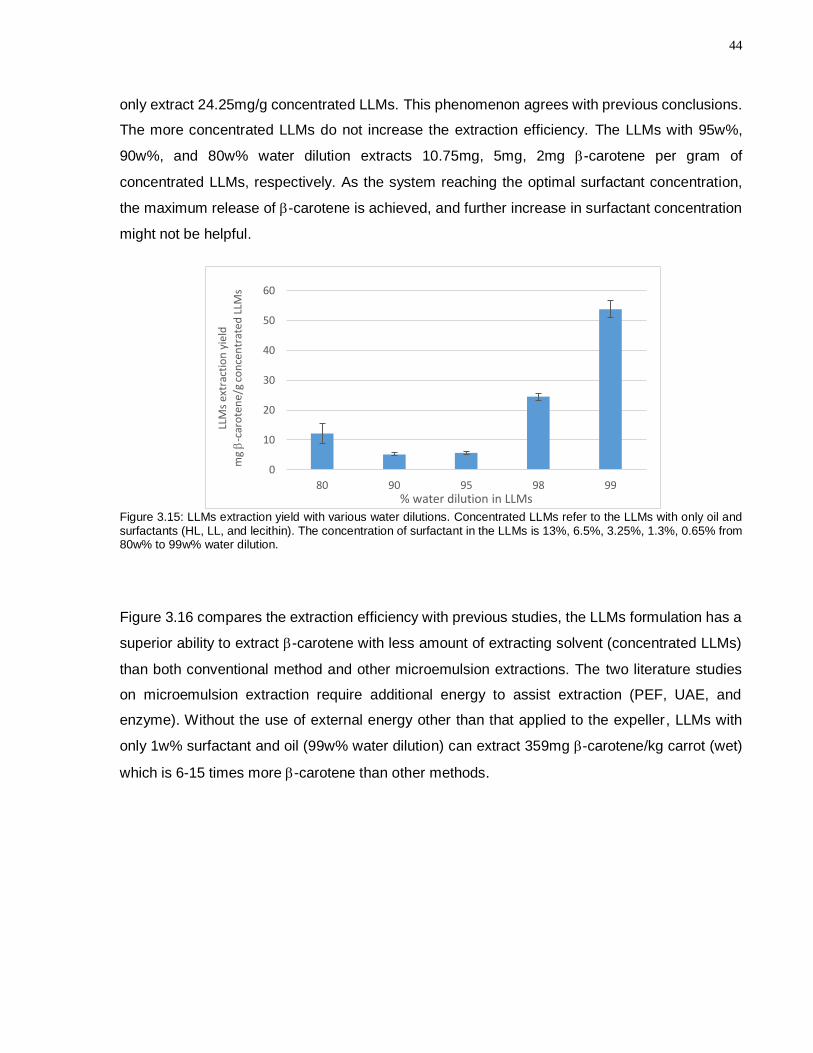
44
only extract 24.25mg/g concentrated LLMs. This phenomenon agrees with previous conclusions.
The more concentrated LLMs do not increase the extraction efficiency. The LLMs with 95w%,
90w%, and 80w% water dilution extracts 10.75mg, 5mg, 2mg -carotene per gram of
concentrated LLMs, respectively. As the system reaching the optimal surfactant concentration,
the maximum release of -carotene is achieved, and further increase in surfactant concentration
might not be helpful.
Figure 3.15: LLMs extraction yield with various water dilutions. Concentrated LLMs refer to the LLMs with only oil and surfactants (HL, LL, and lecithin). The concentration of surfactant in the LLMs is 13%, 6.5%, 3.25%, 1.3%, 0.65% from 80w% to 99w% water dilution.
Figure 3.16 compares the extraction efficiency with previous studies, the LLMs formulation has a
superior ability to extract -carotene with less amount of extracting solvent (concentrated LLMs)
than both conventional method and other microemulsion extractions. The two literature studies
on microemulsion extraction require additional energy to assist extraction (PEF, UAE, and
enzyme). Without the use of external energy other than that applied to the expeller, LLMs with
only 1w% surfactant and oil (99w% water dilution) can extract 359mg -carotene/kg carrot (wet)
which is 6-15 times more -carotene than other methods.
0
10
20
30
40
50
60
80 90 95 98 99
LLM
s ex
trac
tio
n y
ield
mg
-car
ote
ne/
g co
nce
ntr
ated
LLM
s
% water dilution in LLMs

45
Figure 3.16: Comparison of different carotenoids extraction methods (Amiri-Rigi, Abbasi and Scanlon, 2016) (Roohinejad et al., 2014) (Pacheco et al., 2014) (Cortes et al., 2004)
Another interesting feature, the -carotene concentration in diluted LLMs exceeds its solubility.
The maximum -carotene concentration in 90w% water LLMs is about 39.5ppm and it was
determined by measuring the supernatant of that LLMs with supersaturated -carotene
concentration after centrifugation (2500rpm, 5min). The -carotene concentration in that
formulation (90w% water LLMs) after extraction is found to be around 519ppm. Figure 3.17a
shows a less dense phase appeared on the diluted LLMs after centrifugation, which is an
indication of -carotene displacement instead of dissolution in the LLMs. The β-carotene
dispersed in the top phase has a size less than 10µm, mostly less than 5µm. In general, the
extracted β-carotene particles have a smaller size than that in fresh carrot pomace (large
aggregate about 25m) (Figure 3.17b). The reduction in surface tension (Figure 3.20) not only
enhances the release of β-carotene in carrot pomace but also reduces the particle size of β-
carotene which will, at some degree, help to prompt the absorption in small intestine.

46
Figure 3.17a: LLMs with 90w% water after expeller extraction and then centrifuge at 2500rpm for 5min (left). The arrow is pointing to the top layer. On the right is the microscopic picture of the top phase. The circles highlight the spots of
concentrated -carotene particles extracted from carrot pomace. The black fibers are believed to be carrot pomace fibers.
Figure 3.17b: Microscopic pictures of fresh carrot pomace under ambient light (left) and cross-polarized lenses (right).
The red particles on the left and the lighting spot on the right indicates -carotene solid in the carrot cell.
Removal efficiency is another specification to determine the optimal extraction condition. It is
measured as the ability to release -carotene from carrot pomace and presented in Eq. 3.1.
% removal efficiency = Mextracted
Mextracted + Mresidued Eq. 3.1
Where Mextracted is the mass of -carotene extracted by LLMs; Mresidued represents the mass of -
carotene remained in carrot pomace after extraction.
50 µm
50 µm 50 µm

47
As the results of the dilution experiment [Figure 3.18], the LLMs with 99w% water have a great
ability to recover -carotene among other water dilutions. With 0.65w% surfactants, the LLMs was
able to extract more than 40% of -carotene in a given amount of carrot pomace. It is almost 3
times more efficient than water (expeller) extraction. The results match with previous experiments
in the study, the increase of surfactant concentration in LLMs reduces -carotene recovery. This
phenomenon is consistent with the study of Kadioglu (2011). Maintaining low surface tension
using low surfactant concentration can ensure the penetration of the LLMs into the porous media
where the oil in LLMs can dissolve and dislodge the -carotene from the fiber matrix.
Figure 3.18: -carotene removal rate of LLMs with different water dilutions [experimental data in Appendix 3C]. The carrot/LLMs ratio is 1.5.
3.3.3 Properties of diluted LLMs for extraction
3.3.3.1 Viscosity and density of LLMs with various dilution
The high viscosity of the LLMs is a limitation in the expeller extraction. According to the
experiments, the extractor was not capable of separating carrot and LLMs with a viscosity higher
than 0.012 Pa•s, which is approximated to 80w% water LLMs. The viscosity and density of the
LLMs with various water dilutions is shown in Figure 3.19. A significant decrease in viscosity was
observed when LLMs contain more than 80w% water. As the water dilution increases, the
viscosity and density of the LLMs are closer to the property of water (0.001 Pa•s, 1g/mL). The big
0.00
5.00
10.00
15.00
20.00
25.00
30.00
35.00
40.00
45.00
50.00
80 90 95 98 99 100 (expeller) 100 (batch)
% r
emo
val
mg
β-c
aro
ten
e ex
trac
ted
/mg
β-
caro
ten
ein
car
rot

48
drop in viscosity occurred at 80w% LLMs suggests that the extractor does not provide enough
shear to separate the viscous liquid (>0.012 Pa•s) from carrot pomace.
Figure 3.19: Viscosity and density of LLMs with 80% to 99% water at room temperature
3.3.3.2 Surface tension
With only 1w% LLMs in water (99w% water dilution), the surface tension of the LLMs significantly
decreases from 71mN/m (pure water) to 29.5mN/m at 22C [Figure 3.20]. As the surfactant
concentration increases (less water dilution), the surface tension is further reduced to 26.6mN/m
at 90w% water LLMs. The decrease in surface tension explains the great release of -carotene
from carrot pomace as suggested by previous studies. An interfacial tension test was performed
to determine the CC of the system, the turbidity of the LLMs solution was the limitation in the
0
0.002
0.004
0.006
0.008
0.01
0.012
0.014
70 75 80 85 90 95 100
0.94
0.95
0.96
0.97
0.98
0.99
1
1.01
Vis
cosi
ty, P
a.s
%wt water in LLMs
Den
sity
, g/m
L
Density viscosity
Figure 3.20: Surface tension of LLMs with 90w%, 95w%, 98w%, 99w% water at 22C. 100% represents pure DI water.
0
10
20
30
40
50
60
70
90 92 94 96 98 100
Surf
ace
ten
sio
n, m
N/m
%wt water in LLMs

49
use of a spinning drop tensiometer. However, the relatively steady surface tension is an indication
of the system at or above the CMC value.
3.3.3.3 pH of the LLMs
The research investigated the relationship between pH value and water diluted LLMs after
extraction. There is a slight decrease in acidity as the increase in water dilution in LLMs. The
value of pH increases from 6.16 for 99w% water LLMs to 5.88 at 80w% water LLMs [Figure 3.21].
The measurements suggest that there is no linear relationship between pH and water dilution in
the LLMs containing extracted -carotene.
Figure 3.21: pH value of 80%wt – 99%wt water LLMs after extraction at room temperature. 100% means the extraction was done by using DI water.
3.3.3.4 Effect of diluting media
The effect of salt concentration was examined by diluting LLMs with 95w% FeSSIF. The salt
concentration in FeSSIF was 1.87w/v%. As shown in Figure 3.22, the addition of salts in LLMs
diluted with 95w% aqueous solution does not have a statistical influence on the -carotene
extraction. The LLMs with 95w% FeSSIF and with 95w% water extracts 0.37 and 0.42 mg -
carotene/g carrot, respectively.
123456789
1011121314
80 85 90 95 100
pH
w% water in LLMs

50
Figure 3.22: Effect of salt in -carotene extraction in LLMs with 95% aqueous dilution. The ratio of carrot/LLMs was 1.5. The LLMs and carrot pomace after extraction are shown on the right
3.3.4 Enhancement of -carotene extraction
The enhancement of beta-carotene extraction with LLMs in the expeller is likely a combination
of the mechanical grinding of the carrot pulp, leading to the breakup of cell walls as illustrated
in Figure 3.23b, and the detergent-like action of the diluted LLM. The low surface tension
obtained with the LLM (Figure 3.20) allows rapid penetration of the liquid into porous media
that might have some trapped air (similar to the penetration of detergents into fabric).
Furthermore, the low viscosity of the LLM obtained at high dilutions (Figure 3.19) is also
another contributing factor to the penetration of the diluted LLM into the fractured cell
network. As illustrated in Figures 3.17b and 3.23a, carotenoids are initially present in the cell
in form of crystals within the cell cytoplasm. The penetration of the diluted LLM allows the
partial dissolution of the surface of the crystals, likely aiding in their detachment from the cell
matrix. The surfactants in LLM can also adsorb on the surface of the detached crystals,
suspending them in the aqueous media. A related mechanism was proposed by Baglioni et
al. (2010) where the solvent-carrying micelles released their solvent in a polymer, causing
swelling and detachment from the surface. In this case, we do not believe swelling is possible
because of the crystalline structure of carotenoids, but certainly, the dissolution of the surface
of the particles could help explain the relative ease of removal of beta-carotene, without the
need for additional energy input beyond that provided by the expeller press.
0
0.1
0.2
0.3
0.4
0.5
0.6
95%FeSSIF 95%W
mg
β-c
aro
ten
e/g
car
rot

51
Figure 3.23: -carotene extraction process. a) is fresh carrot pomace picture and b) is a picture of carrot pomace after
expeller extraction. The schematics of o/w micelles, -carotene particles, and oil droplets are not to scale and they are for demonstrative purpose.
3.3.5 Preliminary economic analysis
For the large-scale process, economic feasibility is an important criterion for bringing a pilot study
to real-life application. There are several advantages associated with the expeller extraction via
LLMs that has demonstrated its viability as an alternative technology. Using water-rich LLMs will
substantially reduce the cost of raw materials (i.e., surfactants and oil). Dealing with low viscosity
fluids (similar to water) will be easier to pipe and pump. Secondly, the process is simple and does
not involve high-risk process (e.g., ultrasound and microwave).

52
-carotene powder can be purchased from US$100-300/kg (Alibaba, 2018). By using the
proposed LLMs formulation for extraction, 0.54mg -carotene is extracted in every gram of 99w%
water LLMs. To extract one kilogram of -carotene from carrot pomace, 1851.9kg of 99w% water
LLMs is required and that equals to 18.5kg of concentrated LLMs. The weight ratio of EO to
surfactants is 35/65 and the surfactant mixture has 70% HL, 15% LL and lecithin, by weight. The
required amount of individual chemical is 6.5kg ethyl oleate and 12kg surfactants (8.4kg
hydrophilic linker, 1.8kg lecithin, and lipophilic linker). The cost for -carotene extraction via LLMs
is around US$556/kg -carotene [chemical pricing in Appendix 3E]. The cost of water and carrot
pomace is negligible. In addition, the cost for microencapsulation will be added to the final
consumer products. Additionally, it is worth to mention that the extraction also extracts other
carotenoids in carrot (e.g., -carotene) which increases the value of the final product [Figure 3.24].
Figure 3.24: Chromatography of -carotene extraction from carrot pomace. The first peak on the left at 0.8min is
fluorescein (internal standard); the second peak on the left is -carotene at around 39.6min; the last peak from the left
is -carotene at around 43min.
The production cost of using LLMs for -carotene extraction is higher than commercially available
-carotene powder. However, from the biological perspective, pure carotenoids (without drug
carrier) cannot be absorbed by the human body which means it will not have the expected
therapeutic or health benefits. The nature digestion for carotenoids requires co-consumption of
triglycerides, serve as carriers, in order to form bile salt micelles for absorption in the small
intestine (Acosta, 2009). Even though one consumes carotenoids with sufficient dietary fats, only
1/6 of the -carotene intake can be converted to functional vitamin A in the human body due to
its poor solubility in digestive fluids (Haskell, 2012b). Various studies have shown that the use of
o/w micelles for -carotene delivery can prompt the adsorption. The mechanism of the
enhancement by formulating nanostructured drug carrier is not well understood yet. The possible
-carotene

53
mechanisms were summarized by Acosta (2009). The cost of extracting -carotene using this
novel method costs 2 or 3 times higher than synthetic -carotene, however it can be several times
more bioavailable which is the determining criterion to measure its function for health benefits. It
is worth to mention that the 99.5w% or higher dilutions are yet to be evaluated and it might result
in a more attractive economic scenario.
In the actual production, more cost will be added to the final products because of the capital
expenditures (CE) and operational cost (OC). CE are fixed costs that are associated with
purchasing bulk machines (extractor, spray dryer), pipes, pumps, and other equipment. On the
other side, OC is costs that need to be invested constantly in order to make the process running,
such as, chemicals, electricity, labor, and maintenance. The real cost of the complete process will
require an in-depth economic analysis with a detailed plant design.
3.4 Conclusion
To summarize the highlights from the experiments in this chapter, 1.5 carrot/LLMs ratio has the
highest liquid recovery rate and it is able to recapture 90w% of the liquid LLMs introduced. The 1
to 1 carrot/LLMs ratio can extract 0.487mg/g carrot which is the greatest among the tests. The
LLMs -carotene extraction yield is inversely proportional to the concentration of LLMs (free of
aqueous). The maximum removal rate occurs at 99w% water dilution, at which more than 40w/w%
-carotene was recovered. More importantly, LLMs with 99w% water can extract 53.8mg -
carotene from carrot pomace for every 1g of concentrated LLMs (oil and surfactants).
From an economic perspective, the expeller extraction using LLMs as the extracting solvents
costs 2 to 3 times more than the current -carotene extraction method. However, the use of LLMs
as a nutrient delivery system will likely enhance the bioavailability of -carotene which is an
important marker for measuring health benefit. As the result, the usage of -carotene can be
reduced in final products (e.g., food products, nutraceuticals) compared to the products
formulated with pure -carotene powder but can also achieve the desired level of health effect.
Higher water dilution (e.g., 99.5w%) in LLMs should be investigated as it has a high potential to
result in a more economical appealing scenario.

54
3.5 Appendices
Appendix 3A: Investigation of alternatives for continuous extraction
Two other continuous extraction mechanisms were evaluated as the alternative of expeller
extraction. They are column extraction and reactor extraction with constant stirring, and their
advantages and disadvantages were listed in Table 3.1. The main disadvantage of the column
extraction is, as liquid pumping liquid into the column, carrot pomace becomes a paste that
prevents liquid flow. Second, the reactor extraction requires downtime between experiments
which is not ideal in industrial production. Therefore, the oil press extraction still remains as the
optimal candidate for -carotene extraction, because it is an ideal continuous process and it also
provides automatic solid and liquid separation.
Table 3.1: Comparison of three alternatives for -carotene extraction
Mechanism Column extraction Reactor extraction Oil press extraction
Advantage Perfect for
continuous
extraction
Perfect for batch
extraction
Perfect for continuous
extraction
Disadvantage No flow in the
column
Hard to achieve a
continuous process;
Inconsistency in
results
Requires a minimum
amount of carrot for
extraction (carrot > 10g)

55
Appendix 3B: HPLC sampling protocol
1. Install the HPLC column and column guard onto the autosampler
2. Degas mobile phase solvent by helium for 10min before the experiment
3. Set the UV-VIS spectrophotometer at 450nm, detection range of 0.001
4. Purge pump with mobile phase at 10ml/min for 1min
5. Equilibrate the pump and column at 1.2mL/min for 30min
6. Set up sampling methods in TCL software and in the autosampler and sample injection
volume is 20µL
7. Place sample vials onto autosampler
8. Start sampling once a flat baseline is observed from the monitor

56
Appendix 3C: Removal efficiency calculations
The overall mass balance of the extraction process can be used to calculate the removal efficiency
and to validate the analytical methodology. The sum of -carotene extracted by LLMs and
collected from carrot pomace after oil press extraction should equal to the amount of -carotene
in fresh carrot pomace. The mathematical representation is shown as:
T = L + S Eq. 3.2
where T represents the total amount of -carotene in fresh carrot pomace; L is the amount of -
carotene extracted by LLMs; S is the amount of -carotene remained in carrot pomace after an
extraction.
The mass balances of multiple experiments are shown in Table 3.2 and the -carotene recovery
ratio is calculated using Eq. 3.2. The -carotene recovery rate is mostly around 1 which confirms
the suitability of the HPLC analysis. The total amount of -carotene in fresh carrot is the sum of
-carotene in LLMs and in carrot pomace after extraction. The concentration of -carotene in the
different carrot sources used in the experiments ranges from 0.679-1.275mg/g carrot. From
previous reports, carrot contains 0.48-0.96 mg -carotene/g carrot which equals to 80% of the
carotenoids content, and the concentration of -carotene is sometimes up to 2.4 mg/g carrot. The
amount of -carotene in carrot determined in this experiment match with the findings of Fikselova
et al. (2008).

57
Table 3.2: Mass balance of extraction experiments. Three different carrot sources were used in the experiments. The
samples were run in triplicates.
w%
water
dilution
-carotene
extracted by
LLMs in gram of
carrot pomace,
mg/g (L)
-carotene in
pomace after
extraction in gram
of carrot pomace,
mg/g (S)
Experimental
sum of b-
carotene
(L+S), mg/g
-carotene in
fresh carrot
pomace,
mg/g (T)
-carotene
recovery
ratio,
(L+S)/T
100
(batch) 0.0187 0.598 0.617 0.679 0.908
100
(expeller) 0.175 1.14 1.32
0.865
1.53
99 0.359 0.593 0.952 1.10
98 0.326 0.595 0.921 1.07
95 0.311 0.666 0.977 1.13
95' 0.405 1.33 1.74
1.28
1.36
90 0.346 1.29 1.63 1.28
80 0.268 1.14 1.41 1.11

58
Appendix 3D: Rheometer sampling protocol
1. Turn on air compressor (5510SE, California air tools) and wait for gauge reading at
around 50psi
2. Turn on the water pump for water supply
3. Turn on the rheometer
4. Attach the desired geometry for measurement
5. Program the operating parameter in the software (i.e., calibrate geometry inertia, enter
zero gap)
6. Place the sample in the center of the ramp and the sample should be able to cover the
geometry (shown in the following schematic)
7. Press the ramp up to zero gap position to be ready for measurement

59
Appendix 3E: Price of chemicals
The primary economic analysis of the LLMS for expeller extraction is conducted based on the
prices listed in Table 3.3.
Table 3.3: Price of chemicals for -carotene extraction via LLMs
Chemicals Price before tax per
1kg (US$)
Supplier
Ethyl oleate (98% purity) 10 Alibaba
Soy lecithin 15 Alibaba
Glyceryl monooleate 1 Alibaba
Polyglycerol-6 caprylate 55 Alibaba
Sodium alginate 2 Alibaba
Protect Enteric coating, Shellac
28% solution
22.26 Sensient
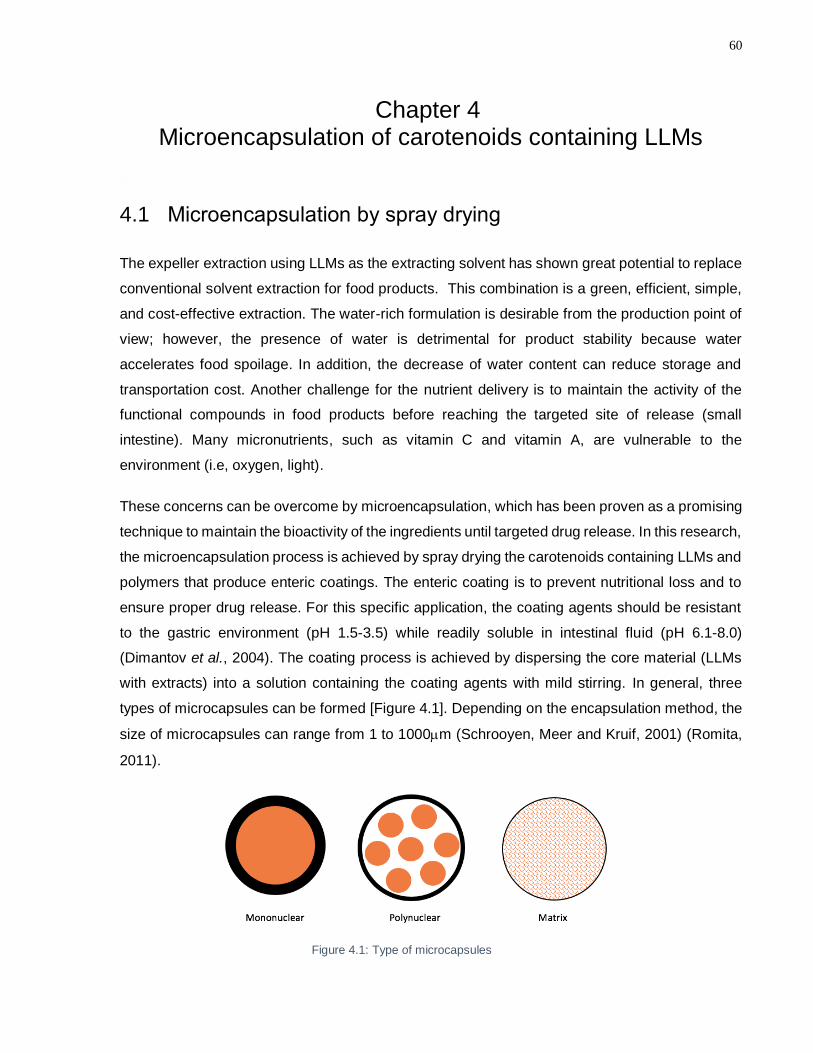
60
Chapter 4 Microencapsulation of carotenoids containing LLMs
4.1 Microencapsulation by spray drying
The expeller extraction using LLMs as the extracting solvent has shown great potential to replace
conventional solvent extraction for food products. This combination is a green, efficient, simple,
and cost-effective extraction. The water-rich formulation is desirable from the production point of
view; however, the presence of water is detrimental for product stability because water
accelerates food spoilage. In addition, the decrease of water content can reduce storage and
transportation cost. Another challenge for the nutrient delivery is to maintain the activity of the
functional compounds in food products before reaching the targeted site of release (small
intestine). Many micronutrients, such as vitamin C and vitamin A, are vulnerable to the
environment (i.e, oxygen, light).
These concerns can be overcome by microencapsulation, which has been proven as a promising
technique to maintain the bioactivity of the ingredients until targeted drug release. In this research,
the microencapsulation process is achieved by spray drying the carotenoids containing LLMs and
polymers that produce enteric coatings. The enteric coating is to prevent nutritional loss and to
ensure proper drug release. For this specific application, the coating agents should be resistant
to the gastric environment (pH 1.5-3.5) while readily soluble in intestinal fluid (pH 6.1-8.0)
(Dimantov et al., 2004). The coating process is achieved by dispersing the core material (LLMs
with extracts) into a solution containing the coating agents with mild stirring. In general, three
types of microcapsules can be formed [Figure 4.1]. Depending on the encapsulation method, the
size of microcapsules can range from 1 to 1000m (Schrooyen, Meer and Kruif, 2001) (Romita,
2011).
Figure 4.1: Type of microcapsules
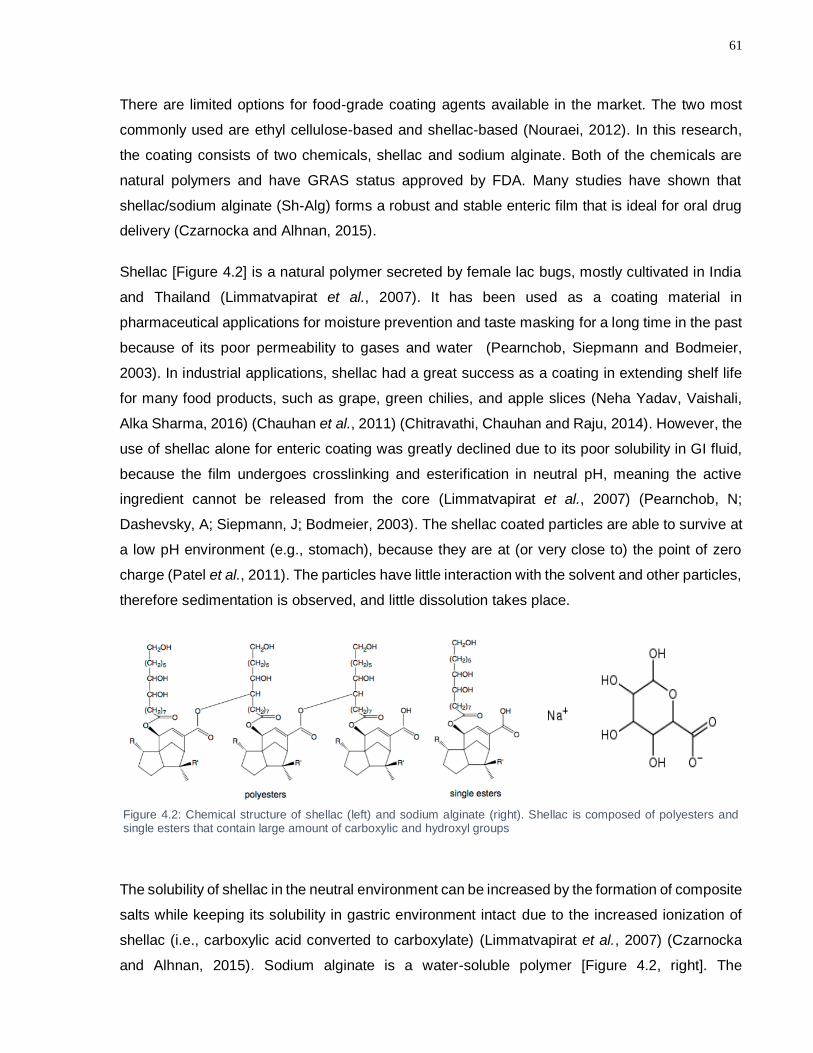
61
There are limited options for food-grade coating agents available in the market. The two most
commonly used are ethyl cellulose-based and shellac-based (Nouraei, 2012). In this research,
the coating consists of two chemicals, shellac and sodium alginate. Both of the chemicals are
natural polymers and have GRAS status approved by FDA. Many studies have shown that
shellac/sodium alginate (Sh-Alg) forms a robust and stable enteric film that is ideal for oral drug
delivery (Czarnocka and Alhnan, 2015).
Shellac [Figure 4.2] is a natural polymer secreted by female lac bugs, mostly cultivated in India
and Thailand (Limmatvapirat et al., 2007). It has been used as a coating material in
pharmaceutical applications for moisture prevention and taste masking for a long time in the past
because of its poor permeability to gases and water (Pearnchob, Siepmann and Bodmeier,
2003). In industrial applications, shellac had a great success as a coating in extending shelf life
for many food products, such as grape, green chilies, and apple slices (Neha Yadav, Vaishali,
Alka Sharma, 2016) (Chauhan et al., 2011) (Chitravathi, Chauhan and Raju, 2014). However, the
use of shellac alone for enteric coating was greatly declined due to its poor solubility in GI fluid,
because the film undergoes crosslinking and esterification in neutral pH, meaning the active
ingredient cannot be released from the core (Limmatvapirat et al., 2007) (Pearnchob, N;
Dashevsky, A; Siepmann, J; Bodmeier, 2003). The shellac coated particles are able to survive at
a low pH environment (e.g., stomach), because they are at (or very close to) the point of zero
charge (Patel et al., 2011). The particles have little interaction with the solvent and other particles,
therefore sedimentation is observed, and little dissolution takes place.
The solubility of shellac in the neutral environment can be increased by the formation of composite
salts while keeping its solubility in gastric environment intact due to the increased ionization of
shellac (i.e., carboxylic acid converted to carboxylate) (Limmatvapirat et al., 2007) (Czarnocka
and Alhnan, 2015). Sodium alginate is a water-soluble polymer [Figure 4.2, right]. The
Figure 4.2: Chemical structure of shellac (left) and sodium alginate (right). Shellac is composed of polyesters and single esters that contain large amount of carboxylic and hydroxyl groups
62
combination of shellac and sodium alginate has demonstrated a promising performance as an
enteric coating material. More than 80% of the core material is able to be released in a neutral
environment (Sensient Pharma, no date). The composition of sodium alginate in the coating was
recommended to be 30w/w% by Sensient Pharma., in which it is line with the original patent
(15w/w%-30w/w%) (Durig and Zong, 2009).
Various microencapsulation techniques have been developed for the formation of the
microcapsules for a variety of applications, such as masking or preserving flavors, targeted drug
release, and transform liquid to solid formulation (Desai and Park, 2005). The microencapsulation
techniques can be categorized into two groups: one uses a liquid as suspending medium and it
can be achieved by complex coacervation, in situ polymerization, or solvent evaporation; the other
one uses a gas as a suspending medium in which a liquid phase is sprayed into (e.g., spray-
drying, spray-cooling, fluidized-bed coating or coextrusion) (Schrooyen, Meer and Kruif, 2001).
Spray drying is the most popular drying method in the food processing industry because it is a
continuous, cost-effective, one-step operation (Murugesan and Orsat, 2012). Spray drying usually
produces matrix-type microcapsules in which the active ingredients are evenly distributed
throughout the capsules (Romita, 2011). In current food application, carotenoids powder is
produced by spray drying (Schrooyen, Meer and Kruif, 2001)(Van Dyk et al., 2013) (Kowalski et
al., 2000).
Basically, spray drying is a technology that converts a liquid into its powder form [Figure 4.3].
Depending on the feed and operating conditions, fine powder (10-50m) and/or relatively large
particles (2-3mm) can be produced (Murugesan and Orsat, 2012). There are three main stages
in a spray drying process: atomization, heat transfer, and mass transfer.
1. Atomization: the liquid sample is fed into the drying chamber with continuous hot air and
nitrogen supply. The process of atomization sprays the liquid feed into droplets. The main
purpose of this stage is to create a large surface area for maximum heat and mass
transfer. The higher the operating power of the atomizer, the finer powder can be
produced. However, large droplets make heat and mass transfer more difficult, because
they need hotter air which might cause damage to the core material; small droplets have
a greater chance for core exposure and result in degradation of the core. For the same
atomization energy, the size of the particles usually increases with the increase of
viscosity, feed rate, and surface tension in the liquid feed (Murugesan and Orsat, 2012).

63
2. Heat transfer: heat is transferred from the droplet surface to the core due to the
temperature difference. The process is operated with co-current hot air which means the
liquid feed is sprayed in the same direction (Murugesan and Orsat, 2012). According to
Nouraei’s microencapsulation research (2012), the inlet temperature at 80C is sufficient
to form dry Sh-Alg coated particles.
3. Mass transfer: as the droplets fall down the drying chamber, the water content keeps
decreasing as the result of heat and mass transfer. Due to the difference of vaporization
pressure of water, solvent (usually water) is transferred from the droplet core to its surface
and then the evaporation of water is carried out at a constant temperature until water
content reaches a critical value in the droplets. The drying process is finished when the
particle temperature matches the hot air temperature (Murugesan and Orsat, 2012).
In the presence of vacuum in the process, the fine particles are collected at the base of the cyclone
outside the drying chamber, while larger particles can be found at the bottom collector of the
drying chamber. Film formation is a critical process in order to achieve effective
Figure 4.3: Process schematic of a bench scale spray dryer

64
microencapsulation (Farag, 2010), which occurs during the heat and mass transfer stage. There
are two main mechanisms: formation from polymer solutions [Figure 4.4] and formation from
aqueous dispersions [Figure 4.5]. For both cases, film formation only happens when the
temperature is above the glass transition temperature (Tg) of the coating material. The Tg of
shellac is 37-49C (Pearnchob, Dashevsky and Bodmeier, 2004) (Farag and Leopold, 2009), and
in this research the spray drying process will be operated at 80C which is sufficient for Sh-Alg
film formation.
Figure 4.4: Film formation from a polymer solution. As solvent evaporation occurs (a), polymeric chemical forms an intermediate gel-like material (b). Further evaporation increases the polymer concentration and a solid polymeric film is obtained with constant heat supply (c).
Figure 4.5: Film formation from an aqueous dispersion. As the solvent evaporates from the system (a), a close-packed structure is formed due to the increasing polymer concentration (b). Further solvent evaporation leads to particle deformation due to capillary pressure and interfacial tension (c). The solid polymeric film is formed by the coalescence of the particles above glass transition temperature.
This chapter investigates the microencapsulation of the LLMs with extracts from the expeller
extraction. The main focus of this research is to maximize the loading capacity of carotenoids in
the dried powders while to maintain the integrity of the microcapsules. The Sh-Alg is used as the
enteric coating agents for the LLMs with extracted -carotene to ensure proper drug release and

65
to prevent degradation. Four different wall/core ratios will be examined (90/10, 70/30, 60/40,
50/50, w/w). The inlet temperature of the spray dryer will be 70-80C which is suggested by
Nouraei (2012). Other operational parameters (e.g., feed rate, atomizer pressure, aspirator) will
be adjusted according to the properties of the feed. The optimal performance of the spray drying
is a consequence of appropriate setting on all of the operating parameters. Improper operating
conditions will result in a hollow, shriveled, disintegrated, or porous particles (Nouraei, 2012).
Details summary on process optimization is discussed in Nouraei’s thesis (2012). The morphology
and surface characteristics will be evaluated using an SEM.
66
4.2 Material and Methods
4.2.1 Materials
Chemical Supplier
Soy lecithin Fisher Scientific (Canada)
Sodium taurocholate, hydrate, 96%
Ethyl Oleate, 98% ACROS Organics (NJ., U.S.)
NaCl, > 99.0% Bishop (ON., Canada)
Glacial Acetic Acid, > 99.7% Caledon (ON., Canada)
NaOH, Pellets, > 97.0%
Acetone, reagent
Methanol, HPLC grade
Acetonitrile, HPLC grade
Beta carotene, > 95% Sigma Aldrich (ON., Canada)
6.0N Hydrochloric acid
Hexane, HPLC grade VWR (ON., Canada)
Ethyl alcohols anhydrous Commercial Alcohols
Donation Donor
Fluorescein Food engineering laboratory, University
of Toronto
Triethylamine, HPLC grade ANALEST facility, University of Toronto
(Canada)
Dermofeel ® G 6 CY (Polyglycerol-6-caprylate) Kinetic (Morris, NJ, USA)
Peceol™ (Glycerol monooleate) Gattefosse (Etobicoke, ON, Canada)
Sodium alginate FMC biopolymers (Canada)
Protect™ (Shellac-based coating agent, 28w%) Sensient (U.S.)
4.2.2 Methods
4.2.2.1 Microencapsulation and spray drying
The microencapsulation is prepared following the recommended procedure by Sensient Pharma.
(2014). The expeller extraction was conducted with 90w% water LLMs and at the carrot/LLMs of
1.5. Sodium alginate and DI water were added to the LLMs containing extracted -carotene from
the expeller with mixing. When a uniform mixture was formed, shellac solution was gently added
to the mixture with stirring. The mixture was then stored at 5°C until the experiment.
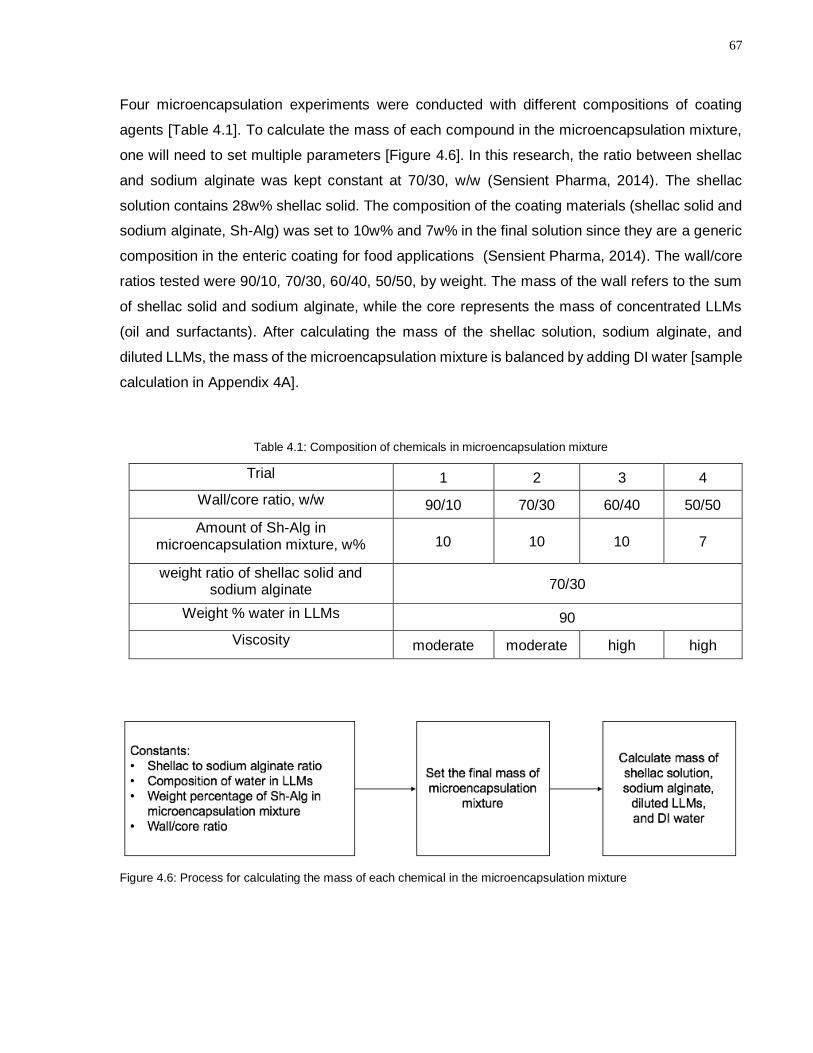
67
Four microencapsulation experiments were conducted with different compositions of coating
agents [Table 4.1]. To calculate the mass of each compound in the microencapsulation mixture,
one will need to set multiple parameters [Figure 4.6]. In this research, the ratio between shellac
and sodium alginate was kept constant at 70/30, w/w (Sensient Pharma, 2014). The shellac
solution contains 28w% shellac solid. The composition of the coating materials (shellac solid and
sodium alginate, Sh-Alg) was set to 10w% and 7w% in the final solution since they are a generic
composition in the enteric coating for food applications (Sensient Pharma, 2014). The wall/core
ratios tested were 90/10, 70/30, 60/40, 50/50, by weight. The mass of the wall refers to the sum
of shellac solid and sodium alginate, while the core represents the mass of concentrated LLMs
(oil and surfactants). After calculating the mass of the shellac solution, sodium alginate, and
diluted LLMs, the mass of the microencapsulation mixture is balanced by adding DI water [sample
calculation in Appendix 4A].
Table 4.1: Composition of chemicals in microencapsulation mixture
Trial 1 2 3 4
Wall/core ratio, w/w 90/10 70/30 60/40 50/50
Amount of Sh-Alg in microencapsulation mixture, w% 10 10 10 7
weight ratio of shellac solid and sodium alginate 70/30
Weight % water in LLMs 90
Viscosity moderate moderate high high
Figure 4.6: Process for calculating the mass of each chemical in the microencapsulation mixture
68
Due to the absence of the sterilizing agent in the shellac solution, the samples were prepared
within 12 hours prior to the spray drying experiment. The spray dryer (Buchi B290 mini spray
dryer) was operated at 80°C with a feed rate ranging from 1.16 to 2.3 g/min (depending on the
viscosity of the sample). The operation temperature was recommended by Nouraei (2012)
[operating procedure in Appendix 4B].
4.2.2.2 SEM for surface characteristics
The dried -carotene microemulsion powders were mounted on SEM stubs with carbon tapes.
Loose powders were blow off using compressed air in a fume hood. The samples were gold
coated for 90s and stored in dark before the analysis. The SEM (Hitachi S-2500 Scanning Electron
Microscope) was operated with an accelerating voltage of 10kV, the working distance of 10mm,
and at a tilt angle of 15.
4.2.2.3 In vitro drug release assessment
a) Neutral solution
The dried LLMs powders with β-carotene were dissolved in fed state simulated intestinal fluid
(FeSSIF) to mimic the release in the human small intestine. The powders were added to 10mL of
FeSSIF at the mass ratio of 1/100, 1/200, 1/300, and 1/500 (w/w). Then the solutions were placed
in the shaker at 120rpm at 37°C until full dissolution. The -carotene content was then analyzed
using the method mentioned in Chapter 3 3.2.2.2.
b) Acidic condition
6.0N hydrochloric acid (HCl) solution was diluted to 0.1N with DI water. The pH of the HCl solution
was 1.5, which was appropriate to predict the release in the human stomach. The dry powders
were added to 10mL of FeSSIF at the mass ratio of 1/100, 1/200, 1/300, and 1/500 (w/w). Then
the solutions were placed in the shaker at 120rpm at 37°C until full dissolution.
69
4.3 Results
4.3.1 Spray dryer operating parameters
The experimental setup was adapted from Nouraei’s study on microencapsulation of food-grade
microemulsions that also used Sh-Alg as the enteric coating materials (Nouraei, 2012). The spray
drying process was operated at 80C. The water in the sample was completely evaporated even
though the operating temperature was below the boiling temperature. The resulting outlet
temperature was around 55C. Nouraei suggested using 100% aspirator capacity to generate
maximum negative pressure to increase the yield of fine powder. However, the aspirator can only
be operated at 90% capacity since the system has a vacuum pressure of 70psia . The further
increase would cause damage to the machine. Four experiments were conducted with increasing
core loading. No large particles were found at the bottom of the drying chamber. The operating
conditions (inlet temperature, aspirator) were identical in the experiments, except the feed rate. It
needs to be adjusted according to the viscosity of the sample solution. As the core loading
increased from 1w/w% to 4w/w% in microencapsulation solution, the feed rate decreased from
2.3 – 1.16 g/min. The more viscous the sample, more time required to dry the particles.
4.3.2 Characteristics of microcapsules
Four experiments were conducted to maximize the -carotene loading in microencapsulated
particles. The rationale is to minimize the amount of coating materials (mainly shellac) for
economic efficacy as well as reducing the composition of excipients in drug formulation. The main
limitation would be core exposure when increasing core loading. Figure 4.7 shows the powders
from the four microencapsulation experiments. The powder has a more intensive yellow color as
core (-carotene) loading increases. Variability in size is observed in all of the samples, a mix of
clumps and fine powders. The main cause might be a result of polydispersity of excessive oil
droplets in LLMs containing extracted -carotene [Figure 4.8].

70
4.3.3 Surface structure of the microcapsules by SEM
The size of the microcapsules has a wild range of distribution confirmed by an SEM. The size of
powder ranges from 5-130 m from the four experiments. The variation of size might also be due
to the polydispersity of the excessive oil droplet in LLMs after -carotene extraction. However, it
does not affect the target release profile (further discussion in 4.3.4). As the loading of -carotene
increases, the size of the powders also increases as shown in Figure 4.9 (c, f, i, l). On the other
hand, the shape of the microcapsules is also affected by the core concentration. At the 90/10
wall/core ratio (a-c), the microcapsules have more regular spherical shape whereas the powders
with increasing core loading tended to form irregular shape and to grow in size. The SEM analysis
indicates that the microencapsulation formulation and spray drying operation is appropriate for
the LLMs with extracted -carotene. Dry shell formation was likely to occur because the
microcapsules are spheroids. No hollow and shriveled capsules were observed (images can be
found in Romita’s thesis, 2011). Sufficient amount of time was given to dry the materials inside
0.05mm 0.05 mm 0.05mm
Figure 4.8: Microscopic pictures of liquid LLMs after -carotene extraction. Large oil aggregates are observed under polarized lens with increasing magnifications.
Figure 4.7: Dry LLMs powders with increasing wall/core ratio from left to right, 90/10, 70/30, 60/40, 50/50 (w/w), from left to right

71
the capsules after the film formation (Romita, 2011). They maintain relatively smooth surfaces
and no significant core exposure was observed.
Figure 4.9: SEM images of the dry microemulsion powders. a-c is powder with 90/10 wall/core ratio; d-f is powder with 70/30 wall/core ratio; g-I is powder with 80/20 wall/core ratio, j-l is powder with 50/50 wall/core ratio. Samples were evaluated with three different magnifications, increasing from left to right.
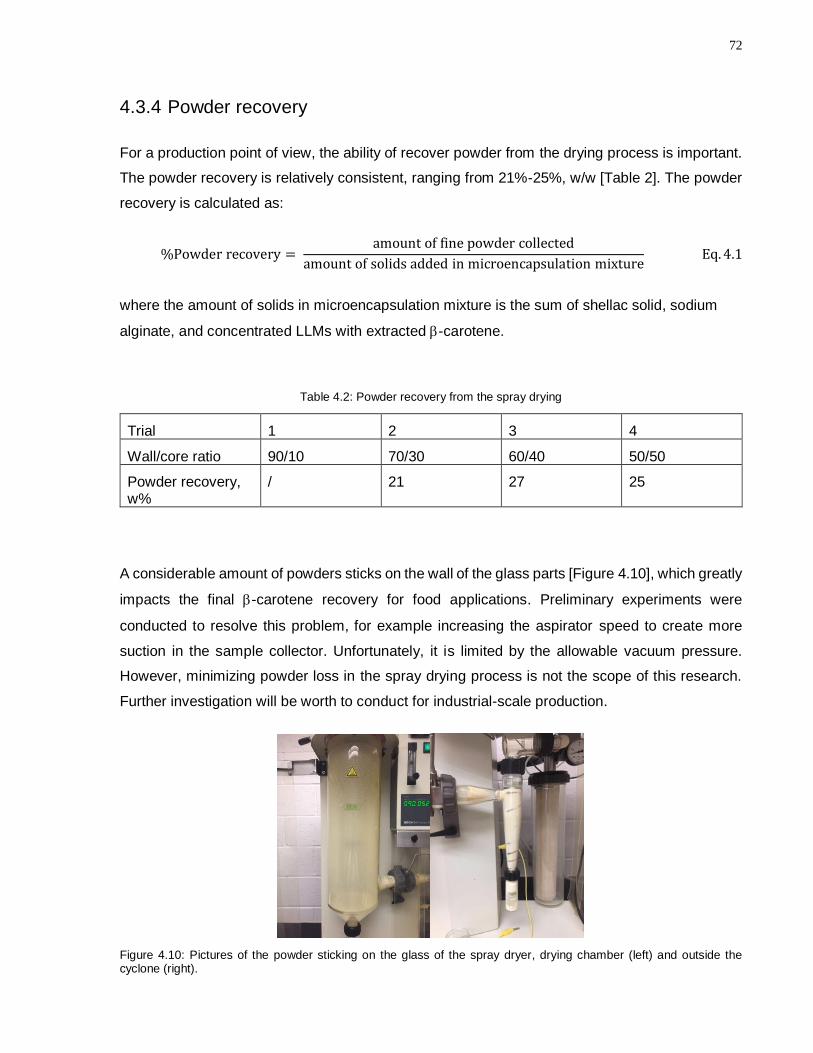
72
4.3.4 Powder recovery
For a production point of view, the ability of recover powder from the drying process is important.
The powder recovery is relatively consistent, ranging from 21%-25%, w/w [Table 2]. The powder
recovery is calculated as:
%Powder recovery = amount of fine powder collected
amount of solids added in microencapsulation mixture Eq. 4.1
where the amount of solids in microencapsulation mixture is the sum of shellac solid, sodium
alginate, and concentrated LLMs with extracted -carotene.
Table 4.2: Powder recovery from the spray drying
Trial 1 2 3 4
Wall/core ratio 90/10 70/30 60/40 50/50
Powder recovery, w%
/ 21 27 25
A considerable amount of powders sticks on the wall of the glass parts [Figure 4.10], which greatly
impacts the final -carotene recovery for food applications. Preliminary experiments were
conducted to resolve this problem, for example increasing the aspirator speed to create more
suction in the sample collector. Unfortunately, it is limited by the allowable vacuum pressure.
However, minimizing powder loss in the spray drying process is not the scope of this research.
Further investigation will be worth to conduct for industrial-scale production.
Figure 4.10: Pictures of the powder sticking on the glass of the spray dryer, drying chamber (left) and outside the cyclone (right).
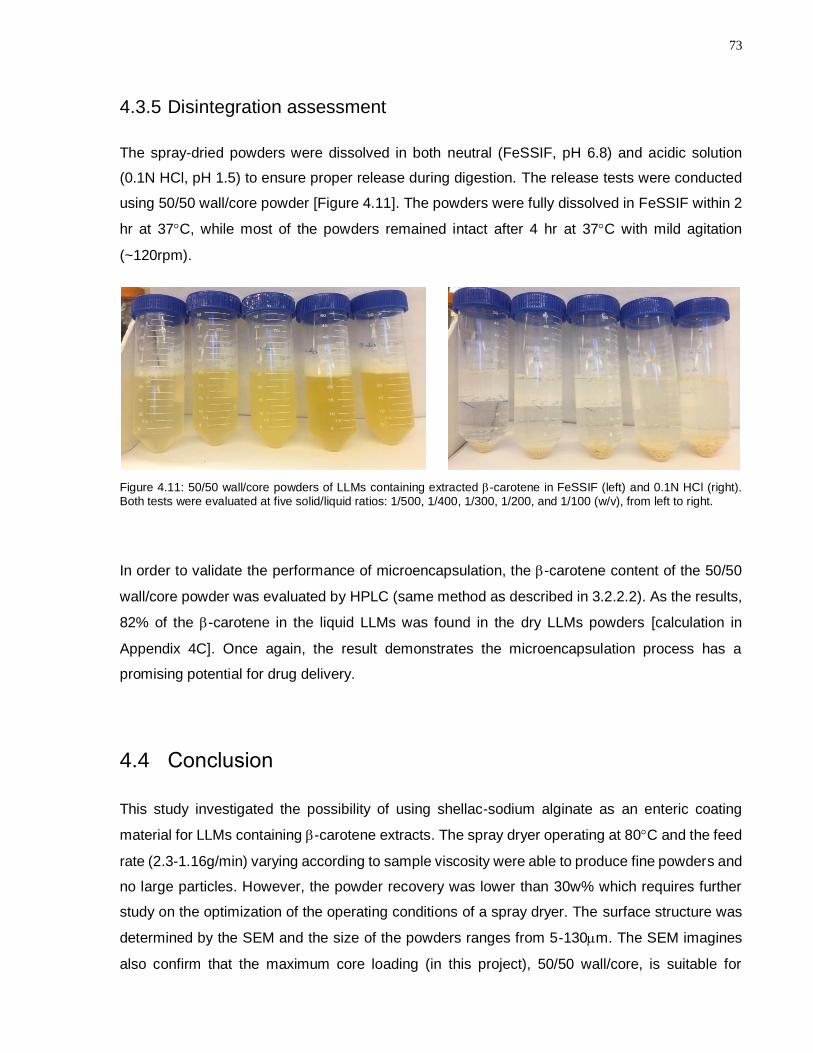
73
4.3.5 Disintegration assessment
The spray-dried powders were dissolved in both neutral (FeSSIF, pH 6.8) and acidic solution
(0.1N HCl, pH 1.5) to ensure proper release during digestion. The release tests were conducted
using 50/50 wall/core powder [Figure 4.11]. The powders were fully dissolved in FeSSIF within 2
hr at 37C, while most of the powders remained intact after 4 hr at 37C with mild agitation
(~120rpm).
Figure 4.11: 50/50 wall/core powders of LLMs containing extracted -carotene in FeSSIF (left) and 0.1N HCl (right). Both tests were evaluated at five solid/liquid ratios: 1/500, 1/400, 1/300, 1/200, and 1/100 (w/v), from left to right.
In order to validate the performance of microencapsulation, the -carotene content of the 50/50
wall/core powder was evaluated by HPLC (same method as described in 3.2.2.2). As the results,
82% of the -carotene in the liquid LLMs was found in the dry LLMs powders [calculation in
Appendix 4C]. Once again, the result demonstrates the microencapsulation process has a
promising potential for drug delivery.
4.4 Conclusion
This study investigated the possibility of using shellac-sodium alginate as an enteric coating
material for LLMs containing -carotene extracts. The spray dryer operating at 80C and the feed
rate (2.3-1.16g/min) varying according to sample viscosity were able to produce fine powders and
no large particles. However, the powder recovery was lower than 30w% which requires further
study on the optimization of the operating conditions of a spray dryer. The surface structure was
determined by the SEM and the size of the powders ranges from 5-130m. The SEM imagines
also confirm that the maximum core loading (in this project), 50/50 wall/core, is suitable for
74
potential food application. The powder is able to maintain its integrity in an acidic environment
(gastric condition) while to release -carotene in neutral pH (intestinal condition), and this is an
important characteristic to ensure proper release during digestion.
75
4.5 Appendices
Appendix 4A: Sample calculation for a microencapsulation mixture
Parameters:
Final mass of microencapsulation mixture: 200g
Amount of Sh-Alg in microencapsulation mixture: 10w%
Shellac/alginate ratio: 70/30, w/w
Shellac solution contains 28w% shellac solid
Water dilution in LLMs: 90w%
Calculation:
• Mass of shellac solution and sodium alginate
Total amount of Sh-Alg in mixture = 200g *10% = 20g
Amount of shellac solid = 20g*70% = 14g, amount of shellac solution required = 14g/28% =
50g
Amount of sodium alginate = 20g*30% = 6g
• Mass of 90w% LLMs
Amount of core = 20g*(10/90) = 2.22g
Amount of 90w% LLMs = 2.22g/90% = 22.2g
• Mass of DI water
Amount of DI water = 200-50-6-22.2 = 121.8g

76
Appendix 4B: Spray dryer installation and operating procedure
Spray dryer Installation procedure
1. Place an O-ring inside the drying chamber holder, then fix the holder with the screw 2. Assemble the connection piece, position the o-rings in it, mount it on spray dryer cylinder 3. Mount cylinder on the holder, fix cylinder with handles. 4. Mount the screw cap with o-rings and then mount the separator 5. Mount the separator on the cylinder 6. Installation of the cyclone: position the sealing, mount the product collection vessel and then
mount the screw cap with seal. Finally, mount the cyclone to the connection piece 7. Install the angle piece and connect it to the gas outlet tubing 8. Connect the grounding cable 9. Installation of the temperature indicating sensor: install the metal piece, o ring, and metal
ring 10. And install the outlet temperature sensor to at the connection piece 11. Installation of the two-fluid nozzle: install the nozzle tip, screw in the nozzle cap, screw in the
nozzle cleaning at the other end, then install the nozzle into the spray dryer 12. Connect the feed tubing, spray gas tubing and nozzle cleaner gas tubing 13. Use Allen key to adjust pump bed 14. Install the exhaust gas tubing, fix the tube with a hose clamp 15. Plug in heat cable, Connect the main cord and connect the compressed gas
Spray dryer Operation procedure
1. Close the peristaltic pump, check connections at the nozzle, check all joints of glass parts are tightly sealed.
2. Switch on the instrument and wait for the automatic check prior to the start. 3. Set aspirator rate to 100% (90-100%) and turn on the aspirator 4. Pre-select the desired inlet temperature (70-80ºC). 5. Turn on the heating and wait until the system has reached steady conditions. If necessary,
turn on the nozzle cooling. 6. Set the air flow to about 40 mm with the rotary valve. 7. Switch on the peristaltic pump, select pump speed (5-10%). 8. Set the automatic nozzle cleaning frequency in case of clogging substance. 9. Pure solvent, e.g. distilled water, is now sprayed in. 10. Change the spray quantity of pure solvent by changing peristaltic pump speed to adjust the
outlet temperature to the desired value. 11. As soon as the desired operating conditions have been achieved and are stable, change the
feed tube from a pure solvent to the prepared feed solution. 12. After the solution is completely spray dried, remove the feed tube from the container and
switch the valve back to the pure solvent for cleaning. Remove the tube from the pure solvent after cleaning.
13. Turn off the peristaltic pump, nozzle cleaner, heater, and aspirator. 14. Turn off the spray gas and shut down the device. 15. Remove the product collection vessel with the product and close it with a plastic coat.
Note: do not remove the product collection vessel when the aspirator is still on as the air stream
might blow the product out of the vessel into the surrounding area

77
Appendix 4C: Calculation for -carotene in powder
Table 4.3: Concentration of -carotene in dried Sh-Alg coated powders
Sample -carotene
concentration, ppm Average -carotene concentration in
FeSSIF, ppm
0.5hr 7.34
1hr,a 6.12
6.36 1hr,b 6.37
1hr,c 6.60
Table 4.4: Concentration of -carotene in FeSSIF after the disintegration test
-carotene concentration in LLMs after expeller extraction 93 ppm
amount of LLMs used in microencapsulation 70 g
amount of -carotene added 6.51 mg
total amount of feed for spray drying 100 g
Weight fraction of solid in microencapsulation solution 0.07
total amount of solid added 7 g
-carotene concentration in powder 0.93 mg BC/g powder
Powder added into FeSSIF 0.25 g
-carotene in FeSSIF 0.23 mg
amount FeSSIF used 30 mL
-carotene concentration in
FeSSIF 7.75 ppm

78
Chapter 5 Conclusions
This research developed an approach to minimize food byproduct waste and maximize food value
by developing food-grade microemulsions to extract -carotene from carrot pomace, designing a
simple expeller extraction mechanism to handle the large volumes, and microencapsulating the
microemulsions with extracts to produce dry powders for food applications (e.g., supplements,
fortification). First, an empirical framework, HLD-NAC, has shown a great ability in predicting the
multiphase region for the lecithin-linkers microemulsions systems. The optimal microemulsion
formulations identified by both the HLD-NAC and experimental phase behavior scans contain
35w% ethyl oleate and 65w% surfactants (70w% polyglyceryl-6 caprylate, 15w% glycerol
monooleate, 15w% lecithin). The fully-dilutability is a unique characteristic of the formulation,
because the formulation is expected to experience dilution during extraction (from the carrot
pomace), and release (of the encapsulated material) and also concentration during the spray-
drying cycle.
The expeller extraction was carried out using the optimal LLMs formulations. Various water
dilutions (from 80w% to 99w%) and carrot/LLMs ratio (0.5, 1, 1.5, 2) were studied to optimize the
extraction mechanism, technically and economically. The optimum extraction condition occurs at
99w% water dilution with 1.5 carrot/LLM ratio. 53.8mg of -carotene was extracted from carrot
pomace for 1 gram of concentrated LLMs, containing 0.35g oil and 0.65g surfactants. In terms of
carrot extraction yield, the optimal formulation extracts 0.36mg -carotene per gram of carrot. The
extraction efficiency is reduced with excessive surfactants in the extracting solvent (LLMs). A
primary economic analysis was conducted, and it shows this extraction technique has potential,
particularly when compared to current extraction methods.
To prompt the stability and bioactivity of -carotene, the LLMs containing extracted -carotene
were coated with shellac and sodium alginate before spray drying. The enteric coating has
exhibited a great resistance to the gastric environment while is soluble in the intestinal fluid. To
maximize the core (concentrated LLMs) loading, four different wall/core ratios were studied
(90/10, 70/30, 60/40, 50/50, by weight). The morphology of the dried particles was investigated
by a scanning electron microscope (SEM). The size of dried carotenoids containing LLMs powder
is 5-130 m. The dried powder, at all wall/core ratios, is able to maintain its integrity (no core
exposure) which is desirable for food applications.

79
Chapter 6 Recommendations
This study has demonstrated the benefits and feasibility of using expeller extraction via food-
grade lecithin-linkers microemulsions (LLMs) for food applications. Some suggestions for future
research in related topics are summarized below.
1. A multi-stage expeller extraction will be a potential to further increase -carotene yield
using diluted LLMs. The carrot pomace after extraction will be extracted again with fresh
diluted LLMs.
2. From an economic perspective, it is important to quantify the -carotene content in the
LLMs after extraction.
3. Polyglceride-6 Caprylate (HL) is the most expensive chemical in this extraction process.
It will be economically favorable to seek for a low-cost alternative that has the same
performance in the formulation.
4. To conduct research on maximizing core loading in microcapsules is another potential to
greatly reduce the cost of coating materials since shellac is also expensive in the process.
5. A more in-depth research on using commercially available oil in microemulsion
formulations to replace ethyl oleate might be worth to research for commercialization
because it will help to increase the public acceptance of the formulation.
6. The pharmacokinetic profile, stability, and toxicity of the microcapsules containing
extracted -carotene should be fully studied to ensure health and safety
7. For food applications, geographic difference and compatibility of dried LLMs powder in the
food products should be considered. The major energy intake varies significantly in
different part of the world. In addition, more focus can be invested into for women and
children related to food products, because they are more likely to have insufficient
nutritional intake regardless of geographic location.

80
References
Abbott, P. S. (2017) ‘Surfactant Science: Principles & Practice’. Available at:
https://books.google.co.in/books?id=1CBYswEACAAJ.
Acosta, E. et al. (2002) ‘The role of hydrophilic linkers’, Journal of Surfactants and Detergents,
5(2), pp. 151–157. doi: 10.1007/s11743-002-0215-z.
Acosta, E. et al. (2003) ‘Net-average curvature model for solubilization and supersolubilization
in surfactant microemulsions’, Langmuir, 19(1), pp. 186–195. doi: 10.1021/la026168a.
Acosta, E. (2009) ‘Bioavailability of nanoparticles in nutrient and nutraceutical delivery’,
Current Opinion in Colloid and Interface Science. Elsevier Ltd, 14(1), pp. 3–15. doi:
10.1016/j.cocis.2008.01.002.
Acosta, E. J. et al. (2005) ‘Linker-based bio-compatible microemulsions’, Environmental
Science and Technology, 39(5), pp. 1275–1282. doi: 10.1021/es049010g.
Alibaba. 2018. beta-carotene. [ONLINE] Available at:
https://www.alibaba.com/trade/search?fsb=y&IndexArea=product_en&CatId=&SearchText=bet
a+carotene. [Accessed 20 July 2018].
Alibaba. 2018. Ethyl oleate. [ONLINE] Available at:
https://www.alibaba.com/trade/search?fsb=y&IndexArea=product_en&CatId=&SearchText=eth
yl+oleate. [Accessed 16 July 2018].
Alibaba. 2018. Ethyl caprylate. [ONLINE] Available at:
https://www.alibaba.com/trade/search?fsb=y&IndexArea=product_en&CatId=&SearchText=eth
yl+caprylate&viewtype=. [Accessed 16 July 2018].
Amiri-Rigi, A., Abbasi, S. and Scanlon, M. G. (2016) ‘Enhanced lycopene extraction from
tomato industrial waste using microemulsion technique: Optimization of enzymatic and
ultrasound pre-treatments’, Innovative Food Science and Emerging Technologies. Elsevier Ltd,
35, pp. 160–167. doi: 10.1016/j.ifset.2016.05.004.
Ariçanu, A. O. and Rus, F. (2017) ‘Current techniques and processes for vegetable oil extraction

81
from oilseed crops’, Bulletin of the Transilvania University of Brasov, Series II: Forestry, Wood
Industry, Agricultural Food Engineering, 10(1), pp. 65–70.
Azmir, J. et al. (2013) ‘Techniques for extraction of bioactive compounds from plant materials:
A review’, Journal of Food Engineering. Elsevier Ltd, 117(4), pp. 426–436. doi:
10.1016/j.jfoodeng.2013.01.014.
Baglioni, M. et al. (2010) ‘Removal of acrylic coatings from works of art by means of
nanofluids: Understanding the mechanism at the nanoscale’, Nanoscale, 2(9), pp. 1723–1732.
doi: 10.1039/c0nr00255k.
Butz, P. et al. (2002) ‘Changes in functional properties of vegetables induced by high pressure
treatment’, Food Research International, 35(2–3), pp. 295–300.
Chan, J. (2012) ‘Extracting Lipid and Carotenoids from Microalgae with Lecithin- Linker
Microemulsions’.
Chauhan, O. P. et al. (2011) ‘Shellac and aloe-gel-based surface coatings for maintaining
keeping quality of apple slices’, Food Chemistry. Elsevier Ltd, 126(3), pp. 961–966. doi:
10.1016/j.foodchem.2010.11.095.
Chitravathi, K., Chauhan, O. P. and Raju, P. S. (2014) ‘Postharvest shelf-life extension of green
chillies (Capsicum annuum L.) using shellac-based edible surface coatings’, Postharvest Biology
and Technology. Elsevier B.V., 92, pp. 146–148. doi: 10.1016/j.postharvbio.2014.01.021.
Chu, J. et al. (2014) ‘Lecithin-linker formulations for self-emulsifying delivery of
nutraceuticals’, International Journal of Pharmaceutics. Elsevier B.V., 471(1–2), pp. 92–102.
doi: 10.1016/j.ijpharm.2014.05.001.
Chu, J. P. (2010) Linker-based Lecithin Oral Drug Delivery Systems Linker-based Lecithin Oral
Drug Delivery Systems.
Cortes, C. et al. (2004) ‘Identification and Quantification of Carotenoids Including Geometrical
Isomers in Fruit and Vegetable Juices by Liquid Chromatography with Ultraviolet-Diode Array
Detection’, Journal of Agricultural and Food Chemistry, 52(8), pp. 2203–2212. doi:
10.1021/jf035505y.

82
Curwin, B. D., Deddens, J. A. and McKernan, L. T. (2015) ‘Flavoring exposure in food
manufacturing.’, Journal of exposure science & environmental epidemiology, 25(3), pp. 324–33.
doi: 10.1038/jes.2014.52.
Czarnocka, J. K. and Alhnan, M. A. (2015) ‘Gastro-resistant characteristics of GRAS-grade
enteric coatings for pharmaceutical and nutraceutical products’, International Journal of
Pharmaceutics, 486(1–2), pp. 157–174. doi: 10.1016/j.ijpharm.2015.03.039.
Denglin luo, Taiqiu Qiu, Q. L. (2007) ‘Ultrasound-assisted extraction of ginsenosides in
supercritical CO2 reverse microemulsions’, Journal of the Science of Food and Agriculture,
87(2), pp. 431–436. doi: 10.1002/jsfa.
Desai, K. G. H. and Park, H. J. (2005) Recent developments in microencapsulation of food
ingredients, Drying Technology. doi: 10.1081/DRT-200063478.
Dimantov, A. et al. (2004) ‘Study of high amylose corn starch as food grade enteric coating in a
microcapsule model system’, Innovative Food Science and Emerging Technologies, 5(1), pp.
93–100. doi: 10.1016/j.ifset.2003.11.003.
Durig, T. and Zong, Y. (2009) ‘Patents Stable shellac enteric coating formulation for
nutraceutical and pharmaceutical dosage forms’. Available at:
https://patents.google.com/patent/EP2448566A2/en.
Dutra-de-oliveira, J. E. et al. (1998) ‘Effect of heat treatment on the biological value of beta-
carotene added to soybean cooking oil in rats’, pp. 205–210.
Van Dyk, J. S. et al. (2013) ‘Food processing waste: Problems, current management and
prospects for utilisation of the lignocellulose component through enzyme synergistic
degradation’, Renewable and Sustainable Energy Reviews. Elsevier, 26, pp. 521–531. doi:
10.1016/j.rser.2013.06.016.
Farag, Y. (2010) Characterization of different shellac types and development of shellac coated
dosage forms, Dissertation. University of Hamburg. Available at: http://ediss.sub.uni-
hamburg.de/volltexte/2010/4814/.
Farag, Y. and Leopold, C. S. (2009) ‘Physicochemical properties of various shellac types’,

83
Dissolution Technologies, 16(2), pp. 33–39. doi: 10.14227/DT160209P33.
Faulks, R. M. and Southon, S. (2005) ‘Challenges to understanding and measuring carotenoid
bioavailability’, Biochimica et Biophysica Acta - Molecular Basis of Disease, 1740(2), pp. 95–
100. doi: 10.1016/j.bbadis.2004.11.012.
Fikselova, M. et al. (2008) ‘Extraction of carrot (Daucus carota L.) carotenes under different
conditions’, Czech Journal of Food Sciences, 26(4), pp. 268–274. doi: 10.17221/9/2008-CJFS.
Gadhave, A. D. and Waghmare, J. T. (2014) ‘A Short Review On Microemulsion And Its
Application In Extraction Of Vegetable Oil’, IJRET: International Journal of Research in
Engineering and Technology, 03(9), pp. 147–158. Available at:
http://ijret.org/Volumes/V03/I09/IJRET_110309022.pdf.
De Gennes, P. G. and Taupin, C. (1982) ‘Microemulsions and the flexibility of oil/water
interfaces’, Journal of Physical Chemistry, 86(13), pp. 2294–2304. doi: 10.1021/j100210a011.
Haskell, M. J. (2012a) ‘The challenge to reach nutritional adequacy for vitamin A: b-carotene
bioavailability and conversion—evidence in humans 1–4’, Am J Clin Nutr, 96, pp. 1193–203.
doi: 10.3945/ajcn.112.034850.
Haskell, M. J. (2012b) ‘The challenge to reach nutritional adequacy for vitamin A: b-carotene
bioavailability and conversion—evidence in humans 1–4’, Am J Clin Nutr, 96(August), pp.
1193–203. doi: 10.3945/ajcn.112.034850.
HSIEH, F., PENG, I. C. and HUFF, H. E. (1990) ‘Effects of Salt, Sugar and Screw Speed on
Processing and Product Variables of Corn Meal Extruded with a Twin‐Screw Extruder’, Journal
of Food Science, 55(1), pp. 224–227. doi: 10.1111/j.1365-2621.1990.tb06057.x.
Kadioglu, S. I., Phan, T. T. and Sabatini, D. A. (2011) ‘Surfactant-based oil extraction of corn
germ’, JAOCS, Journal of the American Oil Chemists’ Society, 88(6), pp. 863–869. doi:
10.1007/s11746-010-1719-2.
Kalepu, S., Manthina, M. and Padavala, V. (2013) ‘Oral lipid-based drug delivery systems – an
overview’, Acta Pharmaceutica Sinica B. Elsevier, 3(6), pp. 361–372. doi:
10.1016/j.apsb.2013.10.001.

84
Kiran, S. K. and Acosta, E. J. (2010) ‘Predicting the Morphology and Viscosity of
Microemulsions Using the HLD-NAC Mode’, Ind. Eng. Chem. Res., (4), pp. 3424–3432.
Kowalski, R. E. et al. (2000) ‘United States Patent (19) 54: Process for manufacture of
carotenoid compositions’. doi: US005485919A.
Limmatvapirat, S. et al. (2007) ‘Enhanced enteric properties and stability of shellac films
through composite salts formation’, European Journal of Pharmaceutics and Biopharmaceutics,
67(3), pp. 690–698. doi: 10.1016/j.ejpb.2007.04.008.
Luc, A. et al. (2015) Air Pollutant Emission Inventory Report - CANADA 2015.PDF, Public
Inquiries Centre. Available at: https://www.ec.gc.ca/pollution/A17452DA-CFC0-4222-985F-
36B12FCBAA0B/APEI2017-E-Feb 15 2017.pdf.
Mount, E. M. (2016) Extrusion Processes, Applied Plastics Engineering Handbook: Processing,
Materials, and Applications: Second Edition. Elsevier. doi: 10.1016/B978-0-323-39040-
8.00012-2.
Murugesan, R. and Orsat, V. (2012) ‘Spray Drying for the Production of Nutraceutical
Ingredients-A Review’, Food and Bioprocess Technology, 5(1), pp. 3–14. doi: 10.1007/s11947-
011-0638-z.
Neha Yadav, Vaishali, Alka Sharma, T. A. (2016) ‘Food & Beverage Packaging’, in, p. 7110.
Nouraei, M. (2012) Microencapsulated Self-microemulsifying Nutrient Delivery System ( Me-
SMeNDS ). University of Toronto.
Nouraei, M. and Acosta, E. J. (2017) ‘Predicting solubilisation features of ternary phase
diagrams of fully dilutable lecithin linker microemulsions’, Journal of Colloid and Interface
Science. Elsevier Inc., 495, pp. 178–190. doi: 10.1016/j.jcis.2017.01.114.
Pacheco, S. et al. (2014) ‘Microscale extraction method for HPLC carotenoid analysis in
vegetable matrices’, Scientia Agricola, 71(5), pp. 416–419. doi: 10.1590/0103-9016-2013-0402.
Patel, A. et al. (2011) ‘Stabilisation and controlled release of silibinin from pH responsive
shellac colloidal particles’, Soft Matter, 7(18), pp. 8549–8555. doi: 10.1039/c1sm05853c.

85
Paul Hawken, F. R. (1971) ‘The Dangers of Vegetable Oil Extraction and Processing’. Available
at: https://www.motherearthnews.com/renewable-energy/vegetable-oil-extraction-processing-
zmaz71ndzgoe#axzz34pTvds2k.
Pearnchob, N; Dashevsky, A; Siepmann, J; Bodmeier, R. (2003) ‘Shellac used as coating
material for solid pharmaceutical dosage forms: understanding the effects of formulation and
processing variables’, S.T.P. Pharma Sciences, 13(6), pp. 387–396.
Pearnchob, N., Dashevsky, A. and Bodmeier, R. (2004) ‘Improvement in the disintegration of
shellac-coated soft gelatin capsules in simulated intestinal fluid’, Journal of Controlled Release,
94(2–3), pp. 313–321. doi: 10.1016/j.jconrel.2003.10.004.
Pearnchob, N., Siepmann, J. and Bodmeier, R. (2003) ‘Pharmaceutical applications of shellac:
Moisture-protective and taste-masking coatings and extended-release matrix tablets’, Drug
Development and Industrial Pharmacy, 29(8), pp. 925–938. doi: 10.1081/DDC-120024188.
Puri, M. (2017) ‘Extraction of Lipids and Carotenoids from Algal Sources’, Food Bioactives:
Extraction and Biotechnology Applications, pp. 1–326. doi: 10.1007/978-3-319-51639-4.
Rao, J. and McClements, D. J. (2011) ‘Food-grade microemulsions, nanoemulsions and
emulsions: Fabrication from sucrose monopalmitate & lemon oil’, Food Hydrocolloids. Elsevier
Ltd, 25(6), pp. 1413–1423. doi: 10.1016/j.foodhyd.2011.02.004.
Romita, D. (2011) Spray Drying Based Technologies for the Double Fortification of Salt with
Iron and Iodine. University of Toronto. Available at:
https://tspace.library.utoronto.ca/handle/1807/29607.
Roohinejad, S. et al. (2014) ‘Evaluating the Effectiveness of β-Carotene Extraction from Pulsed
Electric Field-Treated Carrot Pomace Using Oil-in-Water Microemulsion’, Food and Bioprocess
Technology, 7(11), pp. 3336–3348. doi: 10.1007/s11947-014-1334-6.
Rosenthal, A., Pyle, D. L. and Niranjan, K. (1996) ‘Aqueous and enzymatic processes for edible
oil extraction’, Enzyme and Microbial Technology, pp. 402–420. doi: 10.1016/S0141-
0229(96)80004-F.
Rupesh Kumar Dubey, S. B. (2014) ‘Conventional and food processing technologies’, Wiley &

86
sons, pp. 175–178.
Sabatini, D. A., Acosta, E. and Harwell, J. H. (2003) ‘Linker molecules in surfactant mixtures’,
Current Opinion in Colloid and Interface Science, 8(4–5), pp. 316–326. doi: 10.1016/S1359-
0294(03)00082-7.
Salager, J. (2005) ‘Enhancing Solubilization in Microemulsions—State of the Art and Current
Trends’, Journal of Surfactants and Detergents, 8(1), pp. 3–21. doi: 10.1007/s11743-005-0328-
4.
Schrooyen, P. M. M., Meer, R. van der and Kruif, C. G. De (2001) ‘Microencapsulation: its
application in nutrition’, Proceedings of the Nutrition Society, 60(04), pp. 475–479. doi:
10.1079/PNS2001112.
Sensient Pharma (2014) ‘Protect Enteric Coating Technical Bulletin’.
Sensient Pharma (no date) ‘Protect Enteric Coating’. Available at: SENSIENTPHARMA.COM.
Singh, B., Panesar, P. S. and Nanda, V. (2006) ‘Utilization of Carrot Pomace for the Preparation
of a Value Added Product’, World Journal of Dairy & Food Sciences, 1(1), pp. 22–27. Available
at: https://pdfs.semanticscholar.org/4c6e/c5dceed5d10dc93248ed2c2756a529fc9a0d.pdf.
Tyagi, S. et al. (2010) ‘Phytochemicals as candidates therapeutics: an overview’, Intl J Pharm.
Sci. Rev. and Res., 3(1), pp. 53–55.
UNEP (2011) ‘Global Food losses and Food waste’, Unep, (May), p. 1. doi:
10.1098/rstb.2010.0126.
USEPA (2012) ‘Industrial food processing waste analyses’, (April 1997), p. 11. Available at:
https://www.epa.gov/sites/production/files/2016-
01/documents/msw_task9_industrialfoodprocessingwasteanalyses_508_fnl_2.pdf.
Vallero, D. (2014) Air Pollutant Emissions, Fundamentals of Air Pollution. doi: 10.1016/B978-
0-12-401733-7.00029-3.
Wang, H., Wang, T. and Johnson, L. A. (2009) ‘Effect of low-shear extrusion on corn
87
Fermentation and oil partition’, Journal of Agricultural and Food Chemistry, 57(6), pp. 2302–
2307. doi: 10.1021/jf802907q.
WFMed. 2018. Organic solvent extraction. [ONLINE] Available at:
https://www.wfmed.com/organic-solvent-extraction. [Accessed 10 July 2018].
Witthayapanyanon, A. and Do, L. (2011) Nanostructured Microemulsions as Alternative
Solvents to VOCs in Cleaning Technologies and Vegetable Oil Extraction Description : Norman,
OK.
Yuan, J. S. et al. (2010) ‘Effect of surfactant concentration on transdermal lidocaine delivery
with linker microemulsions’, International Journal of Pharmaceutics. Elsevier B.V., 392(1–2),
pp. 274–284. doi: 10.1016/j.ijpharm.2010.03.051.
Zhang, Y. et al. (2012) ‘Characterization and evaluation of self-microemulsifying sustained-
release pellet formulation of puerarin for oral delivery’, International Journal of Pharmaceutics.
Elsevier B.V., 427(2), pp. 337–344. doi: 10.1016/j.ijpharm.2012.02.013.