Development of an Automated Handheld Immunoaffinity ...
9
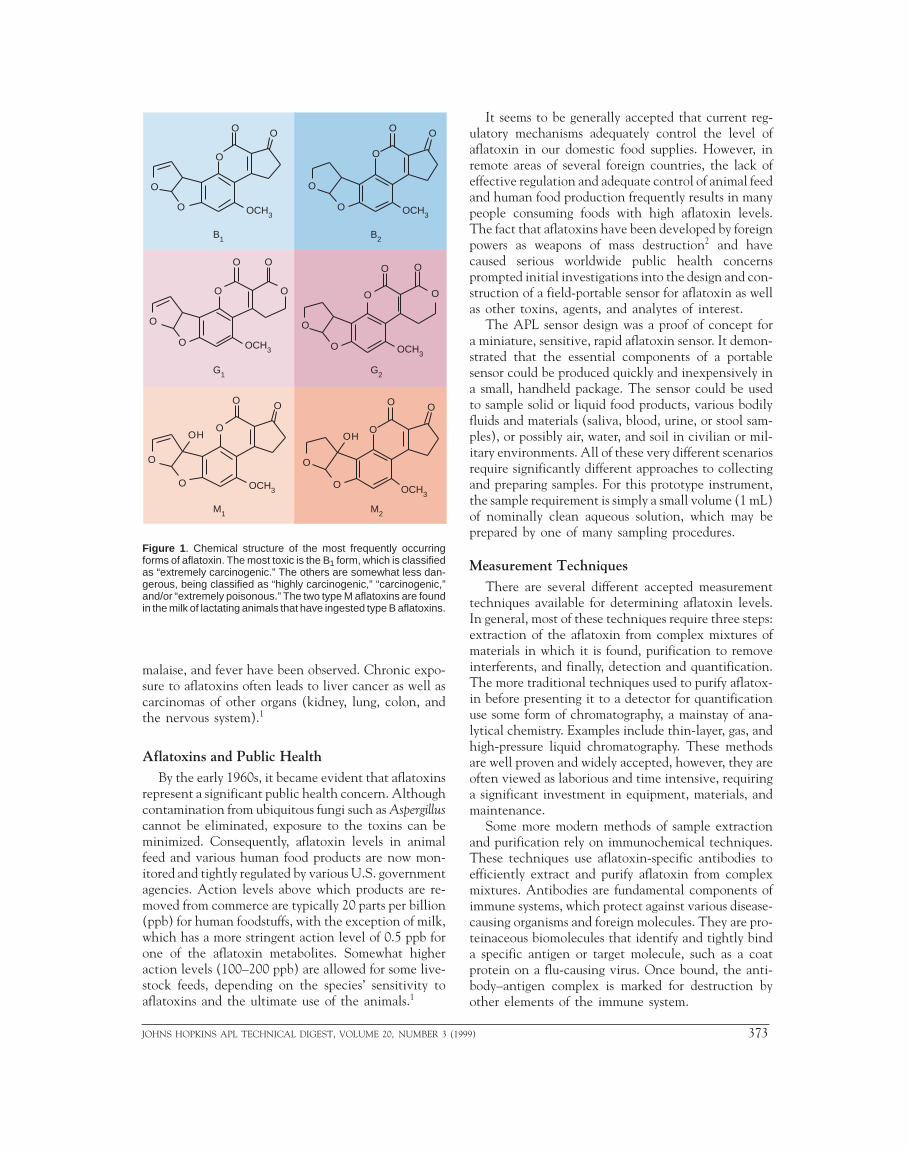
372 JOHNS HOPKINS APL TECHNICAL DIGEST, VOLUME 20, NUMBER 3 (1999) A Development of an Automated Handheld Immunoaffinity Fluorometric Biosensor Micah A. Carlson, C. Brent Bargeron, Richard C. Benson, Allan B. Fraser, John D. Groopman, Harvey W. Ko, Terry E. Phillips, Paul T. Strickland, and James T. Velky new immunoaffinity fluorometric biosensor has been developed for detecting and quantifying aflatoxins, a family of potent fungi-produced carcinogens that are commonly found in a variety of agricultural products. They have also been cited as biological agents under weapons development. The handheld, self-contained biosensor is fully automatic, highly sensitive, quick, quantitative, and requires no special storage. Concentrations from 0.1 to 50 parts per billion can be determined in less than 2 min with a 1-mL sample volume. The device operates on the principles of immunoaffinity for specificity and fluorescence for a quantitative assay. The analytic procedure is flexible so that other chemical and biological analytes can be detected with minor modifications to the current device. Advances in electro-optical components, electron- ics, and miniaturized fluidics were combined to produce this reliable, small, and versatile instrument. (Keywords: Aflatoxin, Automated, Biosensor, Fluorescence, Handheld, Immunoaffinity.) INTRODUCTION Aflatoxins are a group of chemically related my- cotoxins formed by common fungi (Aspergillus flavus, A. parasiticus, and A. nomius) found in corn, cotton- seed, peanuts, and other nuts, grains, and spices. 1 Fun- gal infection and aflatoxin production can occur at any stage of plant growth, harvesting, drying, processing, and storage. Both the infection process and aflatoxin accumulation are strongly affected by environmental conditions such as insect damage, temperature, and humidity. The molecular structures of the four most frequently occurring aflatoxins, B 1 , B 2 , G 1 , and G 2 , are shown in Fig. 1, along with two common metabolic by-products, M 1 and M 2 , which are secreted in the milk of lactating animals that have consumed feed contam- inated with aflatoxin. Exposure by ingestion or inhalation of aflatoxins may lead to the development of serious medical con- ditions that vary considerably depending on the animal species, dose, diet, age, and gender. Acute effects are primarily observed in structural and functional liver damage, including liver cell necrosis, hemorrhage, lesions, fibrosis, and cirrhosis. Additionally, hepatic en- cephalopathy, immunosuppression, lower respiratory infections, gastrointestinal hemorrhage, anorexia,
Transcript of Development of an Automated Handheld Immunoaffinity ...

M. A. CARLSON ET AL.
A
Development of an Automated Handheld ImmunoaffinityFluorometric Biosensor
Micah A. Carlson, C. Brent Bargeron, Richard C. Benson, Allan B. Fraser, John D.Groopman, Harvey W. Ko, Terry E. Phillips, Paul T. Strickland, and James T. Velky
new immunoaffinity fluorometric biosensor has been developed for detectingand quantifying aflatoxins, a family of potent fungi-produced carcinogens that arecommonly found in a variety of agricultural products. They have also been cited asbiological agents under weapons development. The handheld, self-contained biosensoris fully automatic, highly sensitive, quick, quantitative, and requires no special storage.Concentrations from 0.1 to 50 parts per billion can be determined in less than 2 minwith a 1-mL sample volume. The device operates on the principles of immunoaffinityfor specificity and fluorescence for a quantitative assay. The analytic procedure isflexible so that other chemical and biological analytes can be detected with minormodifications to the current device. Advances in electro-optical components, electron-ics, and miniaturized fluidics were combined to produce this reliable, small, andversatile instrument. (Keywords: Aflatoxin, Automated, Biosensor, Fluorescence,Handheld, Immunoaffinity.)
INTRODUCTIONAflatoxins are a group of chemically related my-
cotoxins formed by common fungi (Aspergillus flavus,A. parasiticus, and A. nomius) found in corn, cotton-seed, peanuts, and other nuts, grains, and spices.1 Fun-gal infection and aflatoxin production can occur at anystage of plant growth, harvesting, drying, processing,and storage. Both the infection process and aflatoxinaccumulation are strongly affected by environmentalconditions such as insect damage, temperature, andhumidity. The molecular structures of the four mostfrequently occurring aflatoxins, B1, B2, G1, and G2, areshown in Fig. 1, along with two common metabolic
372 JOH
by-products, M1 and M2, which are secreted in the milkof lactating animals that have consumed feed contam-inated with aflatoxin.
Exposure by ingestion or inhalation of aflatoxinsmay lead to the development of serious medical con-ditions that vary considerably depending on the animalspecies, dose, diet, age, and gender. Acute effects areprimarily observed in structural and functional liverdamage, including liver cell necrosis, hemorrhage,lesions, fibrosis, and cirrhosis. Additionally, hepatic en-cephalopathy, immunosuppression, lower respiratoryinfections, gastrointestinal hemorrhage, anorexia,
NS HOPKINS APL TECHNICAL DIGEST, VOLUME 20, NUMBER 3 (1999)
HANDHELD IMMUNOAFFINITY FLUOROMETRIC BIOSENSOR
malaise, and fever have been observed. Chronic expo-sure to aflatoxins often leads to liver cancer as well ascarcinomas of other organs (kidney, lung, colon, andthe nervous system).1
Aflatoxins and Public HealthBy the early 1960s, it became evident that aflatoxins
represent a significant public health concern. Althoughcontamination from ubiquitous fungi such as Aspergilluscannot be eliminated, exposure to the toxins can beminimized. Consequently, aflatoxin levels in animalfeed and various human food products are now mon-itored and tightly regulated by various U.S. governmentagencies. Action levels above which products are re-moved from commerce are typically 20 parts per billion(ppb) for human foodstuffs, with the exception of milk,which has a more stringent action level of 0.5 ppb forone of the aflatoxin metabolites. Somewhat higheraction levels (100–200 ppb) are allowed for some live-stock feeds, depending on the species’ sensitivity toaflatoxins and the ultimate use of the animals.1
O
O
O
O O
O O
O
O
O O
O
O
O
O
O O
O
O
O O
O
O
O
O O
O
O
O O
OH OH
OCH3 OCH3
OCH3 OCH3
OCH3 OCH3
B1 B2
G1 G2
M1 M2
O
O
Figure 1 . Chemical structure of the most frequently occurringforms of aflatoxin. The most toxic is the B1 form, which is classifiedas “extremely carcinogenic.” The others are somewhat less dan-gerous, being classified as “highly carcinogenic,” “carcinogenic,”and/or “extremely poisonous.” The two type M aflatoxins are foundin the milk of lactating animals that have ingested type B aflatoxins.
JOHNS HOPKINS APL TECHNICAL DIGEST, VOLUME 20, NUMBER 3 (1
It seems to be generally accepted that current reg-ulatory mechanisms adequately control the level ofaflatoxin in our domestic food supplies. However, inremote areas of several foreign countries, the lack ofeffective regulation and adequate control of animal feedand human food production frequently results in manypeople consuming foods with high aflatoxin levels.The fact that aflatoxins have been developed by foreignpowers as weapons of mass destruction2 and havecaused serious worldwide public health concernsprompted initial investigations into the design and con-struction of a field-portable sensor for aflatoxin as wellas other toxins, agents, and analytes of interest.
The APL sensor design was a proof of concept fora miniature, sensitive, rapid aflatoxin sensor. It demon-strated that the essential components of a portablesensor could be produced quickly and inexpensively ina small, handheld package. The sensor could be usedto sample solid or liquid food products, various bodilyfluids and materials (saliva, blood, urine, or stool sam-ples), or possibly air, water, and soil in civilian or mil-itary environments. All of these very different scenariosrequire significantly different approaches to collectingand preparing samples. For this prototype instrument,the sample requirement is simply a small volume (1 mL)of nominally clean aqueous solution, which may beprepared by one of many sampling procedures.
Measurement TechniquesThere are several different accepted measurement
techniques available for determining aflatoxin levels.In general, most of these techniques require three steps:extraction of the aflatoxin from complex mixtures ofmaterials in which it is found, purification to removeinterferents, and finally, detection and quantification.The more traditional techniques used to purify aflatox-in before presenting it to a detector for quantificationuse some form of chromatography, a mainstay of ana-lytical chemistry. Examples include thin-layer, gas, andhigh-pressure liquid chromatography. These methodsare well proven and widely accepted, however, they areoften viewed as laborious and time intensive, requiringa significant investment in equipment, materials, andmaintenance.
Some more modern methods of sample extractionand purification rely on immunochemical techniques.These techniques use aflatoxin-specific antibodies toefficiently extract and purify aflatoxin from complexmixtures. Antibodies are fundamental components ofimmune systems, which protect against various disease-causing organisms and foreign molecules. They are pro-teinaceous biomolecules that identify and tightly binda specific antigen or target molecule, such as a coatprotein on a flu-causing virus. Once bound, the anti-body–antigen complex is marked for destruction byother elements of the immune system.
999) 373

M. A. CARLSON ET AL.
Outside the body, this same antibody specificity hasbeen exploited by microbiologists to enable faster sam-ple preparation and to provide for very sensitive anti-gen identification schemes. Whereas the target antigenis typically some foreign protein on the surface of abacterium or virus, it is also relatively easy to growantibodies that are specific for many other chemicalcompounds, including aflatoxin. There are a number ofimmunochemical-based assays that are used for detect-ing aflatoxin3: radioimmunoassay, enzyme-linked im-munosorbent assay, and immunoaffinity column assay(ICA), which is used in the APL aflatoxin sensor andwill be described in the following section.
Some immunochemical techniques require relative-ly little equipment, materials, and maintenance, butthey are still labor intensive. Our intent in designingand building the prototype instrument was to use thebest immunochemical techniques while minimizing therequired manual manipulations. The result was a hand-held, self-contained, automated sensor that can replacethe “bench chemistry” methods along with their large,cumbersome, chemical laboratory analysis systems. Thesensor also provides a quick, cost-effective means fordetermining the presence of aflatoxin in remote loca-tions. We also intended to incorporate a modular de-sign that would permit the rapid substitution of otherreagents to detect various toxins within the same sensorplatform. The sensor could be used to measure othertoxins of agricultural, public health, and defense inter-ests as well.
APPROACHAfter many of the accepted test methods were eval-
uated, such as the ones mentioned previously, it wasdecided that the ICA was most suited to automationin a small, inexpensive, and field-able instrument. A diagram of anICA is shown on the far left-handside of Fig. 2. To the right of this,the analysis steps are presented. Inan ICA, the antibodies are at-tached to small (10- to 100-µm-dia.) beads of agarose, sepharose,other organic polymers, or mem-branes. The analysis begins by forc-ing a filtered, unknown liquidsample through a volume of thesesmall antibody-coated beads (Fig.2, Step A). Because of the largesurface area and tortuous fluid pathintrinsic to the packed beads, theaflatoxin can be captured in a muchshorter time than that required bymany other immunochemical tech-niques. The beads with the bound
Elution
Detection
Sample flow
Figure 2 . The imm
374 JO
aflatoxin are subsequently rinsed (Fig. 2, Step B) toremove any unbound or nonspecifically bound impuri-ties and interferents (labeled “junk” in the figure).After the rinse, an eluant solution, in this case consist-ing of about 50% phosphate-buffered saline and 50%methanol, is passed through the beads (Fig. 2, Step C),causing the antibodies to release the bound aflatoxin.The released aflatoxin is then collected and placed ina fluorometer, where its intrinsic fluorescence is mea-sured and used to quantify the concentration.
To automate this intensive manual operation, thesample preparation and analysis procedures currentlyused in the ICA operation were refined and modifiedaccording to the size limitations and the complexityenvisioned for the instrument. The techniques imple-mented in the automatic sensor replicate the steps thatwould normally be performed by a skilled laboratorytechnician. Thus, by following a standardized protocol,the sensor will determine toxin levels reliably andautomatically by implementing well-tested and accept-ed analysis techniques. Since antibodies can be pro-duced that recognize many different analytes, there aremany potential applications for the technology to de-tect and measure a variety of substances such as pro-teins, toxins, viruses, bacteria, or other substancescontained in a complex mixture.
SENSOR DESCRIPTIONIn Fig. 3, the instrument is shown with its cover
removed and its various components are identified.There are essentially two subsystems within this instru-ment: a fluidics subsystem, which performs mechanicalsample-handling and processing, and an electro-opticalsystem incorporating a miniature fluorometer thatmeasures and reports the toxin level to the user. The
Impurities
Antigen
Support beadMonoclonal antibody
Step A
Insertsample
Antigen–antibodybinding
Step B
Bufferrinse
“Junk” washed away
Elution
Step C
Antigen–antibodyseparation
Flow tocuvette
Antigen detection
unochemical-based capture, purification, and detection process.
HNS HOPKINS APL TECHNICAL DIGEST, VOLUME 20, NUMBER 3 (1999)

two systems are controlled by a microprocessor thatdirects the systems to perform the sequential steps inthe analysis, which would normally be performed by alaboratory technician.
Fluidics SystemIn the initial development of the fluidics system, a
flow-through cuvette was selected as the best interfacebetween the fluidics and electro-optical systems. Thisstyle of cuvette allows for easy cleaning of the fluid pathin the sensor, thereby eliminating potential contami-nation between samples.
A pumping system drives various fluids at differingtimes through portions of the system. Because of its lowpower consumption, small size, cleanliness, accuracy,and flexibility, a small peristaltic pump (INSTECModel P625) was selected to provide adequate fluidmovement in a small, low-power package.
The valve design was developed to provide thenumerous fluidic switching sequences required duringan analysis. The need to perform multiple analysesbefore servicing was a major driver in this design. Thisrequirement resulted in a setup that is small and usesminimal fluid. Presently, the instrument can hold about500 mL (total) of reagents, which is enough for about100 analyses before replacement is necessary. A second,more important driver was the need for cleanliness. Itwas essential that the fluidics system not allow anyliquids remaining from a previous measurement to mixwith the current sample. The design shown in Fig. 4awas selected to use a minimum number of valves whilereducing the required fluid volumes for sample process-ing, and still maintain the required cleanliness.
The valves facilitate the fluid sequence that is re-quired to prepare the sample for the fluorescencemeasurement in the sampling cuvette. After the sampleis introduced into the chamber, approximately 0.05 mL
Sample input Optics Flashlamp
Fluorometercuvette
Batteries
Fluid valves
Optics
Photomultiplier
Outputdisplay
On/offswitch
Fluidicspump
Controllerboard
Statuslights
Microcontroller
8 in.
Figure 3 . The interior of the sensor. Not visible are the liquidreagent bags and peristaltic pump located beneath the controllerboard at the bottom right of the instrument.
JOHNS HOPKINS APL TECHNICAL DIGEST, VOLUME 20, NUMBER 3 (19
HANDHELD IMMUNOAFFINITY FLUOROMETRIC BIOSENSOR
of fluid in the syringe is drawn through the bubblerelease valve into the waste chamber to eliminate anybubbles that may adversely affect the final measure-ment. A volume of sample, ranging from 0.05 to 10 mL,is then drawn through the affinity column containing100-µm sephorose beads to which the aflatoxin-specificantibodies are attached. As the liquid moves over thebeads, any aflatoxin in the sample is tightly bound tothe antibodies, removing it from the liquid flow. Thevolume of sample selected is determined by the rangeof aflatoxin concentrations in which the analyst isinterested. High concentrations (ppm) require smallsample volumes, and low concentrations (ppb) requirelarger sample volumes.
Phosphate-bufferedsaline
Elutionfluid
Waste
Samplesyringe
Bubblereleasevalve
Peristalticpump
Affinitycolumn
Valves
Fluorometrycuvette
Fluorometrycuvette
Track/holdamplifier
Lenssystem
Transimpedanceamplifier
Arclamp
UVfilter
Bluefilter
Lens
Photomultipliertube (PMT)
Display
(a)
(b)
Figure 4 . (a) Schematic diagram of the fluidics system. Theprimary fluid flow is counterclockwise from the valve manifold at thetop left, through the affinity column, the fluorometry cuvette, thepump, and ending in the waste chamber. When the sample is firstinjected, a small amount (0.05 mL) of liquid is moved clockwisethrough the bubble release valve direction into the waste chamberto remove any inadvertently added air bubbles. (b) The electro-optics system contained within the instrument. A focused andfiltered light pulse (365 nm) from the lamp is directed into thefluorometry cuvette, where the aflatoxin absorbs this energy andre-emits some of it in the blue region of the spectrum (445 nm). ThePMT and associated electronics measure the amount of emittedblue light, which is proportional to the concentration of aflatoxin inthe fluorometry cuvette.
99) 375

M. A. CARLSON ET AL.
Next, the affinity column is washed with phosphate-buffered saline to remove any nonspecifically bound,dissolved, or suspended materials that may later inter-fere with the fluorometric assay. After the toxin hasbeen concentrated and purified on the column, a smallquantity of elution fluid is passed through the affinitycolumn. The elution fluid causes the toxin to be re-leased quickly from the antibodies and redissolve. Thefluid with antibodies moves into the fluorometric cu-vette for analysis. The total volume of reagents (bufferand elution fluid) required to get the purified sampleto the fluorometric cuvette is on the order of 2 mL.After the electro-optical system measures the fluores-cence of the aflatoxin, another 2 mL of reagents isrequired to flush away the old sample and prepare theinstrument for the next sample.
Electro-optical SystemThe fluorometer is similar to standard crossed-beam
laboratory instruments, but the size and power require-ments were reduced significantly for its use in a hand-held sensor. The system shown in Fig. 4b uses a xenonarc lamp to generate a microsecond flash and a lens tofocus the radiation onto the cuvette. A filter passes onlythe radiation in the near-ultraviolet band centeredaround 365 nm that optically excites the aflatoxin flu-orescence. The optically excited aflatoxin fluoresces inproportion to its concentration by emitting blue lightcentered on 445 nm. A second lens captures some ofthis emitted light and focuses it through a second blue-transmitting filter onto the photomultiplier tube(PMT) detector. The PMT produces a microsecond-long electrical pulse having a totalcharge that is proportional to thelight input and therefore to theaflatoxin concentration. A voltageproportional to this charge is cap-tured by the transimpedance andtrack/hold amplifiers in a way thatmakes timing noncritical and re-duces electrical noise. The voltageis then digitized and presented onthe sensor’s display.
MicroprocessorAn onboard microprocessor
controls all of the fluid movementand fluorometric analysis sequenc-es. It acts as the technician in theoperation of the system, but withmore reproducibility. The sequenceof events is the same as thatperformed by laboratory techni-cians for the commercial fluoro-metric analysis process. The various Figure 5
Manual switch
A/D power
Xenon power supply
Xenon trigger
Photomultiplier supp
Track/hold
Piezo buzzer
Inject LED
Background LED
Sample LED
Ready input
Sample valve
Eluant valve
Buffer valve
Bubble valve
Motor forward
Motor reverse
Turn
on
376 J
processes controlled by the processor are illustrated inFig. 5. The steps indicated in the diagram include thesample injection, washing, eluting, injection into thecuvette, various power supplies being cycled on and offto conserve power from the system’s lithium batterypack, ultraviolet lamp pulse initiation, amplifier con-trol, PMT measurement, display of results, and cleaningsequences. Empirical testing of the system was used todetermine the actual times required by each of thesequences.
SYSTEM TESTINGLimited testing was done on the instrument to
measure sensitivity, column viability, and interferencerejection, and to answer design questions. All plumbingmaterials were selected primarily for their leachingcharacteristics and manufacturability. The materials incontact with liquid were required to exhibit minimalleaching to minimize the background fluorescence.Structural materials investigated included aluminum,stainless steel, titanium, Scotch 3031 epoxy, buna-n,delrin, Teflon, isoplast, nylon, polyolefin, zellite, andPVC. Isoplast and platinum-cured silicone were usedfor their low leaching characteristics and for theirmanufacturability. The column (glass) and the chamber(quartz) do not leach appreciably. Background levels onthe fluids were also minimal (all were within the 0.1-ppb equivalent aflatoxin concentration range).
An example of the sensitivity as well as theoperation of the instrument is shown in Fig. 6. In anormal operating mode, the instrument measures the
. Sensor processes occurring during a measurement cycle.
ly
Display final value0.1 s
Displaybackground
User initiated
0.1 s
Elu
te c
olum
n
Inje
ct s
ampl
e
Load
and
clea
n co
lum
n
Mea
sure
back
grou
nd
Wai
t for
next
sam
ple
or p
ower
dow
n
Mea
sure
fluor
esce
nce
Per
form
final
elu
tion
and
was
hC
lean
sys
tem
and
prep
are
for
next
sam
ple
Cle
ar b
ubbl
e
OHNS HOPKINS APL TECHNICAL DIGEST, VOLUME 20, NUMBER 3 (1999)

fluorescent signal only twice during a single measure-ment cycle: once to get a background measurement andagain when the maximum aflatoxin fluorescence signalis present. However, in Fig. 6, the data were obtainedas the instrument was being operated in a diagnosticmode, where the fluorescent signal is monitoredcontinuously every 4 to 5 s as the instrument proceedsthrough its normal sequences. The data are presentedas “units,” which are just the readings taken from theonboard 3.5-digit voltmeter. They represent theamount of charge generated by the PMT in responseto a light pulse, and are therefore proportional to theaflatoxin concentration in the fluorometer chamber.
At 0 time in Fig. 6, 1 mL of a 1.44-ppb aflatoxinsample had already been loaded into the fluidics system.From 0 to 30 s, the buffer fluid was being pumpedthrough the column and fluorometer chamber. Thissequence completes the loading of the sample onto thecolumn and the rinsing away of nonbound material. Italso corresponds to the final stage of Steps A and B ofFig. 2. Note that the background signal was on the orderof 5 to 6 units, indicating that very little fluorescentmaterial is in the fluorometer chamber, and both opticaland electrical leakage are low. At 30 s, the buffer fluidflow was switched off and replaced with an eluant flow,which is used to release the bound aflatoxin from thecolumn (see Step C of Fig. 2). About 10 s into thiselution phase, the fluorescent signal intensity begins toclimb, reaching a maximum at around 60 s, as the afla-toxin is released from the antibodies in the column and
Figure 6 . The operation of the sensor in the diagnostic mode inresponse to the introduction of 1.44 ng (equivalent to 1 mL of a1.44-ppb solution) of aflatoxin B2 at 0 s. The signal level on theabscissa is proportional to the amount of light striking the PMT ateach measurement point. From 0 to 33 s, the buffer liquid is flowing,loading the sample onto the column and cleaning any impuritiesfrom the system. At 33 s the buffer flow is replaced by elution fluid,releasing the aflatoxin into the solution, as evidenced by theincreased signal level. In the normal mode of operation, only thesesignal values occurring at the peak (around 60–70 s) would bereported to the user. At 80 s, the buffer flow is reestablished,purging the aflatoxin and preparing for the next sample.
0
5
10
15
20
25
0 20 40 60 80 100 120
Sig
nal l
evel
(ar
bitr
ary
units
)
Bufferflowing
Eluantflowing
Bufferflowing
Time (s)
JOHNS HOPKINS APL TECHNICAL DIGEST, VOLUME 20, NUMBER 3 (1
HANDHELD IMMUNOAFFINITY FLUOROMETRIC BIOSENSOR
flows into the fluorometer chamber. At this point in thenormal operating mode of the instrument, the fluorom-eter would have been turned on, with the measuredvalue being reported to the user. At 80 s, the buffer fluidflow is reestablished, purging the system of aflatoxin (asevidenced by the fluorescent signal level dropping backto the background levels), and thus preparing the instru-ment for another measurement cycle.
SUMMARYThe aflatoxin sensor provides portable multisample
measurement and rapid sample throughput with min-imal sample handling and consumables. It uses accept-ed testing procedures in a simple, one-button-operationunit. It provides very high sensitivity to aflatoxin,below 1 ppb, and can make over 100 measurementswith one installation of fluids, batteries, and an immu-noassay column.
The experience gained from integrating the variousfluidics, optics, electronics, and biological subsystemsinto a successful sensor has revealed several furtherrefinements and adaptations that may be applied to thesensor platform. First, the present instrument could besignificantly reduced in size, possibly by 50 to 60%.Additionally, this basic platform design can be easilymodified or extended to detect and measure many otherchemical and biological substances of importance inthe areas of chemical and biological warfare, environ-mental or agricultural science, law enforcement, andclinical medicine and health care. Because there is anobvious need for such measurement capabilities, APLis actively working on the modifications that will ex-tend the application of this platform to a broader col-lection of substances. Some potential analytes beingconsidered are as follows.
• Chemical/biological warfare threats (botulism toxin,nerve gases, sarin, sabun, ricin toxin, saxotoxin)
• Bacterial spore agents (anthrax, botulism, Campylo-bacter, F. tularensis, Heliobactor pylori, hemolytic E.coli, Listeria, Pfiesteria, V. cholera, Y. pestus)
• Drugs of abuse (amphetamines, cocaine, heroin/mor-phine, LSD, PCP, THC)
• Environmental/agricultural substances (aflatoxins,ochratoxins, fumonisins, heterocyclic amines, pesti-cides, polycyclic aromatic hydrocarbons)
• Health/medical interests (metabolites of agents, tox-ins, threats, metabolites of therapeutic drugs to setdose, pathogens)
REFERENCES1Eaton, D. L., and Groopman, J. D. (eds.), The Toxicology of Aflatoxins,Academic Press, Inc., New York, pp. 521–523 (1994).
2Presidential Advisory Committee on Gulf War Veterans’ Illnesses: Final Report,U.S. Government Printing Office, Washington, DC (Dec 1996).
3Chu, F. S., “Immunoassays for Mycotoxins: Current State of Art, Commercialand Epidemiological Applications,” Vet. Hum. Toxicol. (Suppl.) 32, 42–50(1990).
999) 377

M. A. CARLSON ET AL.
ACKNOWLEDGMENTS: The authors would like to acknowledge David R.Kohler and Charles W. Anderson for their valued involvement with initial aspectsof the electro-optics and fluidics systems, A. E. Skip Colvin and R. William Lynn
for providing valuable guidance as we worked to formulate the initial concept of thissensor design, and Mildred Donlon for her program support. This work was fundedby DARPA and the Nonproliferation Center under contract MDA 972-96-D-002.
MICAH A. CARLSON is a mechanical engineer in the APL SubmarineTechnology Department’s Engineering and Test Group. He received a B.S. inmechanical engineering and a B.A. in music from the University of Colorado in1996. Mr. Carlson’s specialties include structural design and analysis, materialsengineering, system integration, and the development and application ofminiaturized fluidics handling systems. His current work areas include thedevelopment of coastal monitoring buoy systems and an aerosol collection systemfor use in a field-portable miniature mass spectrometer. Mr. Carlson is currentlypursuing his M.S. in mechanical engineering from The Johns Hopkins Universityand is also a member of ASME. His e-mail address is [email protected].
THE AUTHORS
C. BRENT BARGERON earned a Ph.D. degree in physics at the University ofIllinois in 1971 and joined APL that year as a member of the Milton S.Eisenhower Research Center, now the Research and Technology DevelopmentCenter. He is currently a member of the Sensor Science Group. Since joiningAPL, Dr. Bargeron has focused on solid-state physics, light scattering, chemicallasers, arterial geometry, corneal damage from infrared radiation, quality controland failure analysis of microelectronic components, electron physics, surfacescience, and sensor science. His e-mail address is [email protected].
RICHARD C. BENSON was educated at Michigan State University (B.S. inphysical chemistry, 1966) and the University of Illinois (Ph.D. in physicalchemistry, 1972). Since joining APL in 1972, he has been a member of theMilton S. Eisenhower Research and Technology Development Center and iscurrently supervisor of the Sensor Science Group. Dr. Benson’s technicalbackground is in physical chemistry, sensors, materials science, and lasers. He iscurrently involved in research and development on miniature sensors, counterfeitdeterrence features for U.S. currency, the properties of materials used inmicroelectronics and spacecraft, and the application of optical techniques tosurface science. He is a member of the IEEE, American Physical Society,American Vacuum Society, and the Materials Research Society. Hise-mail address is [email protected].
378 JOHNS HOPKINS APL TECHNICAL DIGEST, VOLUME 20, NUMBER 3 (1999)

HANDHELD IMMUNOAFFINITY FLUOROMETRIC BIOSENSOR
ALLAN B. FRASER was an engineering science student at the PennsylvaniaState University and completed his Ph.D. in biophysics at JHU in 1970. Afterjoining APL in 1975, he worked in the Milton S. Eisenhower Research Centerand in biomedical programs. Most of his career at APL involved nonacousticsubmarine detection as the Chief Engineer of the Submarine TechnologyDepartment. Mr. Fraser is now retired, consults at APL and elsewhere, and is amember of the Society of Vertebrate Paleontology. His e-mail address [email protected].
JOHN D. GROOPMAN is the Anna M. Baetjer Professor and Chair of theDepartment of Environmental Health Sciences at the JHU School of Hygieneand Public Health. He is also Professor of Oncology at the JHU School ofMedicine and is the Associate Director of the Oncology Center for CancerPrevention and Control. Dr. Groopman received his Ph.D. from the Massachu-setts Institute of Technology in 1979. He joined the School of Public Health atBoston University in 1981, and in 1984 was promoted to Associate Professor. Hebecame the Associate Dean at the school in 1987. In 1989, Dr. Groopman joinedthe faculty at the JHU School of Hygiene and Public Health. His main researchinterests have been in the development of biomarkers reflective of exposureand risk from environmental carcinogens. Dr. Groopman’s e-mail address [email protected].
HARVEY W. KO is the Chief Scientist in APL’s Submarine TechnologyDepartment. He obtained a B.S. in electrical engineering in 1967 and a Ph.D. inelectrophysics in 1973, both from Drexel University. Since joining APL in 1973,he has been active in nonacoustic antisubmarine warfare, ocean electro-magnetics, radar propagation, and biomedical engineering. He holds severalpatents in biomedical engineering for technology methods in brain edema,osteoporosis, and magnetoencephalography. His current research interestsinclude bio-impedance, low-frequency electromagnetic holography, and chemicaland biological detection. As manager of the counterproliferation efforts at APL,he is involved in the development of mass spectrometers and miniatureelectronic biosensor systems. He is a member of the IEEE and the Associationfor the Advancement of Medical Instrumentation. His e-mail address [email protected].
JOHNS HOPKINS APL TECHNICAL DIGEST, VOLUME 20, NUMBER 3 (1999) 379
M. A. CARLSON ET AL.
380 JOHNS HOPKINS APL TECHNICAL DIGEST, VOLUME 20, NUMBER 3 (1999)
TERRY E. PHILLIPS is a chemist in the Sensor Science Group of the Milton S.Eisenhower Research and Technology Development Center at APL. He receiveda B.A. from Susquehanna University in 1970 and a Ph.D. in organic chemistryfrom JHU in 1976. After completing postgraduate studies at NorthwesternUniversity in low-dimensional organic conductors, he joined APL in 1979. Hehas studied photoelectrochemical energy conversion; inorganic optical andelectrical phase transition compounds; high-temperature superconductors; andmaterial characterization with X rays, nuclear magnetic resonance, massspectroscopy, and optical spectroscopic techniques. His e-mail address [email protected].
PAUL T. STRICKLAND received a Ph.D. in environmental health sciencesfrom New York University (1978) and received postdoctoral training at thePaterson Laboratories of the Christie Hospital and Holt Radium Institute inManchester, England. He is currently Professor of Environmental HealthSciences in the JHU School of Hygiene and Public Health, and AssociateProfessor of Oncology in the JHU School of Medicine, Comprehensive CancerCenter. He was awarded National Institutes of Health and IARC ResearchFellowships. His research interests include mechanisms of human carcinogenesis,monitoring exposure and risk in human populations, biomarkers of environmen-tal exposure and individual susceptibility, and development of rapid biosensorsfor environmental toxins. He has published over 90 research papers, reviews,and chapters on these and related topics. Dr. Strickland’s e-mail address [email protected].
JAMES T. VELKY is an associate engineer in the Engineering and Test Groupof APL’s Submarine Technology Department (STD). He received an associate’sdegree in electronics from Catonsville Community College in 1974. He joinedAPL in 1975 as a group leader of the Technical Support Department. In 1979,he transferred to the Submarine Test Team where he assisted with the develop-ment of sensors for towed oceanographic systems. Since joining the STDEngineering and Test Group (STE), his primary interests have included fluoro-metry, power management, and engineering of grounding and shielding tech-niques. He is currently involved with the development of the Tiny-TOF MassSpectrometer. Mr. Velky is a member of the Design Review Committee for STEGroup projects. His e-mail address is [email protected].