
DEVELOPMENT OF AN AUTOMATED BRIQUETTING MACHINE …paes.org.ph/Downloadable/3- Development of...
149
DEVELOPMENT OF AN AUTOMATED BRIQUETTING MACHINE Proponents: GATMAITAN, Rey Andrew A. GUANLAO, Tristan Joseph L. GUTING, Robert John B. JANAIRO, Caroline Mae J. Adviser: Dr. Alvin Y. Chua DE LA SALLE UNIVERSITY July 2012
-
Upload
trinhhuong -
Category
Documents
-
view
229 -
download
5
Transcript of DEVELOPMENT OF AN AUTOMATED BRIQUETTING MACHINE …paes.org.ph/Downloadable/3- Development of...

DEVELOPMENT OF AN AUTOMATED
BRIQUETTING MACHINE
Proponents:
GATMAITAN, Rey Andrew A.
GUANLAO, Tristan Joseph L.
GUTING, Robert John B.
JANAIRO, Caroline Mae J.
Adviser:
Dr. Alvin Y. Chua
DE LA SALLE UNIVERSITY
July 2012

i
ABSTRACT
Briquetting technology is one of the renewable sources of energy that was devised to
address problems regarding global warming, energy crisis, as well as solid waste management.
Studies like that of Kaliyan and Morey (2009) show that varying the compression parameters
during briquetting such as temperature and pressure affects the characteristics of the output
briquettes such as combustion performance and durability. On that note, the proponents of this
research made that as their motivation which eventually led to the development of an automated
briquetting machine prototype for experimentation purposes that could bridge the gap between
compression parameters and briquette characteristics.
The fabricated machine used a pressure switch and a band heater for its pressure and
temperature variation mechanisms respectively while a PLC was utilized to make the machine’s
operation automated. Moreover, the machine is composed of a mixing chamber intended for
thorough mixing of the feedstock, a cylindrical mold where the feedstock would be briquetted,
and a hydraulic system which is responsible for the mold’s movements as well as the
compression mechanism of the machine. Based on the data collected, the machine demonstrated
a tolerance of less than 10% and a return of investment of about 2 years when retrofitted for mass
production. Furthermore, the machine is safe to use because it can be operated by simply using
the buttons provided in its control panel and has an emergency stop button when emergency
arises. In the end, the machine was able to form briquettes at varied pressure and temperature and
could be used for future studies regarding briquetting parameters optimization.

ii
TABLE OF CONTENTS
ABSTRACT / EXECUTIVE SUMMARY i
TABLE OF CONTENTS ii
Chapter Page Number
1 Introduction
1.1 Background of the Study 1
1.2 Statement of the Problem 4
1.3 Objectives of the Study 5
1.4 Significance of the Study 6
1.5 Scope and Limitations 7
2 Theoretical Considerations
2.1 Hydraulic System 8
2.1.1 Hydraulic Cylinder 8
2.1.2 Hydraulic Pump 10
2.1.3 Hydraulic Motor 12
2.2 Control System 14
2.2.1 Programmable Logic Controller 14
2.2.2 Ladder Programming 17
2.3 Sample Computations 20
2.3.1 Force 20
2.3.2 Volumetric Flow Rate 20
2.3.3 Power 20
2.3.4 Fluid Motor Torque 20
2.3.5 Fluid Motor Displacament 21
2.3.6 Number of windings in the 21
motor poles
3 Methodology
3.1 Conceptual Design 22
3.2 Phase 1: Briquetting Machine Design Phase 26
3.2.1 Mechanical System 26
3.2.2 Control System 33
3.3 Phase 2: Briquetting Machine Fabrication 35
and Assembly
3.4 Phase 3: Features Testing and Verification 39
of the Briquetting Machine
3.4.1 Testing and Verification Overview 39
3.4.2 Verification of the Accuracy of the 41
Band Heater
3.4.3 Verification of the Accuracy of the 42
Pressure Switch
3.4.4 Verification of the Control System Circuitry 44
3.5 Phase 4: Briquette Press Operation Testing 46
3.5.1 Preparation of the Feedstock 48
3.5.2 Briquetting Operation Proper 52

iii
4 Results, Analysis, and Conclusion
4.1 Results 57
4.1.1 Simulations 58
4.1.2 Machine Operation 60
4.1.3 Economic Evaluation 70
4.2 Analysis of the Data 76
4.2.1 Simulations 76
4.2.2 Machine Operation 77
4.2.3 Economic Evaluation 80
4.2.4 Overall Performance 81
4.3 Conclusion 82
Bibliography 84
Appendices
A Actual Machine Photos 87
B Machine Drawing Files 94
C Briquette Machine – Framework Simulation 97
D Briquette Machine – Vertical Cylinder Mounting Simulation 114
E Briquette Machine – Vertical Cylinder Casing Simulation 125
F Electrical Diagram 139
G Hydraulic Circuit 141
H PLC Spec Sheets 143

1
Chapter 1
INTRODUCTION
This chapter discusses the brief background of biomass briquetting including related
topics to it. Itis also in this chapter where the problem that was addressed in the research is
stated. Furthermore, the objectives to be attained, the significance of the study, as well asits
scope and limitations can be seen in this part of the paper.
1.1 Background of the Study
The need for alternative sources of energy has been a sensitive issue for the past years. In
the Philippines, the harnessing and utilization of renewable energy has been a significant part of
the government’s strategy to supply the energy needs of the country (Department of Energy
2011a). To minimize the dependence on imported fuel and to solve problems on energy
shortage, considerable efforts have been made to utilize the country’s available resources. The
use of the several forms of renewable energy such as the geothermal, wind, and solar are studied
and researched upon to maximize the benefits that can be harnessed for the country.
As discussed by Cheremisinoff et al. (1980), biomass is essentially a plant material,
ranging from algae to wood, in form. However, agricultural residues such as manures, straws,
cornstalks, and other by-farming products, are considered to be one of the chief sources of
biomass for energy production. The energy content of biomass is relatively uniform, on the
order of 9000 Btu/lb (20,890.188 kJ/kg), which is roughly half to two-thirds of coal’s heating
value. Moreover, there are major advantages of biomass as fuelwhich are as follows: biomass

2
contains negligible sulfur, generates little ash, and most importantly, is continually renewable.
These advantages make it more appropriate to use biomasses as fuel.
As projected by the Department of Energy or DOE (2011b), the biomass supply in the
Philippines is expected to reach 323.1 MMBFOE by 2012. These abundant supplies of waste
products (coconut husks, corn husks, saw dust, etc.) can undergo processes such as direct
combustion, gasification, or liquefication, for energy production. As the world’s biggest rice
consumers, the increase in rice production in the Philippines went from 5.32 million tons to
12.39 million tons in just thirty years. Accounting 20% of the rice production, rice husk is a
processing by-product of the milling processes (Baconguis 2007). However, the physical
features of the rice husks make it difficult to store. Also, high volume transportation of this
biomass yield high transportation costs, resulting toan uneconomic usage at a place other than
the source (i.e., rice mills). With these concerns, new methods for storing, handling, and
transporting rice husks have been developed. One of which is in the form of briquettes (Singh
&Kasyhap 1985).
Briquetting is the process of transforming a granular or powdery substance into a larger,
more convenient size. As discussed by Maglaya&Biona (2010), briquetting increases the
homogeneity of the mixture, allowing a more uniform and controlled combustion performance.
Also, it greatly helps in the transportation and storage of the fuel. Briquetting can be done using
several techniques. One of which is through pressure agglomeration wherein within a confined
volume, high forces are applied to a mass of particulate materials to increase its density.

3
However, before entering the briquette machine, the feedstock must be grinded and be subjected
to pre-treatment processes such as the addition of the binding agent (Kaliyan& Morey 2009).
As discussed by Kaliyan& Morey (2009), binders can be a liquid or a solid that forms a
bridge, film, matrix, or initiates a chemical reaction to create strong inter-particle bonding. With
this, pre-heating or steam conditioning is needed to provide the required heat and moisture that
will activate the inherent or added binders. There are different kinds of binders: molasses, starch,
phenolic resin, coal tar and others, each with varying binding properties. Their selection is
mainly based on the cost, environment friendliness, and on the material of the briquette. The
higher the amount of binders added, the higher the briquette durability.
Another factor that is essential and affects the production of the briquettes is pressure and
temperature. Under high pressure and temperature, the natural binding components in the
biomass (starch, protein, lignin, and pectin) materials are squeezed out of the particles, aiding in
the inter-particle bonding. In the case of rice husks, when pressure is increased from 7.8 to 31.2
MPa together with 25% molasses, the durability of the rice husk briquettes also increased from
80 to 95%. One more aspect that is affected by pressure is the shear strength of the biomass
briquettes. As the pressure increases, shear strength also increases (Kaliyan& Morey 2009).
The current briquetting industry in the other countries has gone a long way. In Germany,
a plantation is situated wherein their machines are automated and can be easily operated. Their
production is of large-scale basis and supplies the country with briquettes for energy
consumption (RUF Briquetting Machinery 2008). Unfortunately, the briquetting technology in

4
the Philippines still needs to undergo several improvements. In a research done by Daiwey et al.
(2010), a briquette machine was supplied in the Aurora province for their usage. This machine
transforms coconut husks into charcoal briquettes and uses cassava or corn starch as the binder.
However, all the processes needed in the briquetting such as mixing and molding, are done
manually. Also, on another study done by Martin et al. (2008), the briquette machine that they
mentioned molds 12 cylinder-shaped briquettes in every extrusion period. To supply the power
needed at high pressure compaction, additional manpower may pull down the lever arm.
The automated machines used by the large plantations in the other countries can be made
into small-scale and can create a big leap in the current briquetting industry of the Philippines.
With automated machines, the variation of process parameters such as the pressure and
temperature, will be easier and be more accurate. Also, the briquetting processes will be done in
a simpler manner which can result tofewer accidents related to briquetting.
1.2 Statement of the Problem
Variation of the parameters such as temperature and pressure, affects the performance of
the briquettes produced. Along with that, the amount of the binding agent used in the production
can also be a factor that affects the performance of the briquettes (Kaliyan& Morey 2009). In
order to be able to adjust and achieve the parameters and proportions that will yield optimum
efficiency and favorable characteristics for the briquette, a machine that allows the alteration of
the said factors is needed.

5
In the Philippines, the briquetting industry is not yet matured compared to the other
countries. The Philippines only has manually operated briquette machines that are found in a
few areas of the archipelago. Briquette machines are not widely available and those available are
not at par with the technology exhibited in foreign regions.
The production of a prototype for anautomated briquette machine can address the
problem stated. This prototype can be used for experimentations in order to obtain the optimal
parameter settings for a certain biomass briquette. It can be used for the forming and production
of several briquettes, utilizing the desired process parameters and using the necessary amount of
the binding agent.
1.3 Objectives of the Study
General Objective:
The main objective of the group is to design a small-scale (i.e., for experimentation
purposes and not for mass production of briquettes)automated briquette machine.The pressure
range will be around 55 kgf / cm2 (5MPa) to 95 kgf / cm
2 (9MPa) and the temperature range is
30°C to 300°C.
Specific Objectives:
1. To implement a controller that will be able to control and adjust the briquetting
2. To implement a monitoring system that displays the status of the critical parameters
of the briquetting machine such as the temperature and the pressure

6
3. To incorporate a sensor in the raw materials’ compartment that will monitor the
amount or level of raw materials and the binding agent
4. To be able to create rice husk briquettes based on the process parameters determined
5. To be able to include an economic evaluation of the machine
1.4 Significance of the Study
Due to the increasing demand for energy and the constant importation of fuel from other
countries, the need for optimization of the use of local energy sources should be given much
effort. Production and utilization of alternative energy sources such as briquettes can be of help
to address the rising energy needs of the country.
With an automated machine, the control and variation of the parameters of the briquetting
processes can be done more accurately and with ease. With that, experimentations for identifying
the parameters needed to yield optimum performance of briquettes can be done in the
Philippines, not just relying on studies done by other countries. Moreover, with the use of the
machine, there will be better homogeneity in the mixture of the biomass and the binding agent,
and the safety will be reassured through the monitoring system. Also, with less human
interaction, accidents can be minimized.
Using this prototype, further researches on other biomass briquettes can be done. The
data obtained in the experiments using this automated machine can be utilized in the industry to
create briquettes of high efficiency and quality. This study can also be a head start for the use of
automated machines in the country. Other experiments which aim to produce automated

7
machines appropriate for mass production of briquettes and suited for local use, specifically in
rural areas, may soon be initialized.
1.5 Scope and Limitations of the Study
In this research, the automated briquette machine will operate on the pressure range of
around 55 kgf / cm2 to 95 kgf / cm
2 and a temperature range of 30°C to 300°C. With that,
pressure and temperature ranges aside from the one specified, will not be used. The accuracy of
the parameters will be tested through external tools wherein a tolerance of ±10%will be
observed. The machine is used mainly for experimental purposes and not for large production of
briquettes or for employment in urban or rural areas. The shape of the rice husk briquettes that
will be formed are hollow cylinders, accordingly, other forms will not be considered. This shape
is chosen because cylinders with a concentric hole gives better combustion characteristics
brought about by larger specific area, as discussed by Grover & Mishra (1996).The raw materials
that will be used should be properly crushed, sifted, and ready for compression; the thorough
mixing of the raw materials and the binding agent will be done by the machine. Except for the
manual restocking of raw materials and the harvesting of finished products, the production of the
briquettes will be automated. In case of jamming of the raw materials, manual removal and
repair must be done.

8
Chapter 2
THEORETICAL CONSIDERATIONS
In this chapter, the equations which were used for the duration of the research are listed.
These equations were used to determine the basic parameters and initial specifications for the
design and fabrication of the parts of the briquetting machine.
2.1 Hydraulic System
2.1.1. Hydraulic Cylinder
There are several factors that need to be considered when selecting pre-manufactured and
standardized hydraulic cylinders. Such factors include but are not limited to the following:
operating pressure of the system, force needed by the cylinder to extend (forward force), force
needed by the cylinder to retract (return force), and volumetric flow rate of the hydraulic fluid
needed by the cylinder to move forward and to retract. Enumerated below are the equations to be
used for calculating some of the said factors.
2.1.1.1 Force
The fluid which pushes the face of the piston produces a force against it. This force is
generally equivalent to the force being produced by the hydraulic cylinder and to determine such
force, equation 2.1was used (Ramsdale 2006).
𝐹 = 𝑃 ∙ 𝐴 Eqn. 2.1
where:
𝐹 = Force, pound (lb)
𝑃 = Pressure, pounds per square inch (psi)

9
𝐴 = Cross − sectional area of the piston of the cylinder, square inch (in2)
2.1.1.2 Piston Rod Speed, Hydraulic Fluid Volume, and Volumetric Flow Rate
The speed of the piston depends on the volumetric flow rate of the hydraulic fluid
flowing through the cylinder. Moreover, the volumetric flow rate of the hydraulic fluid entering
the piston cylinder is equivalent to the change in volume of the hydraulic fluid per unit time
inside it as stated by Industrial Hydraulic Services, Inc. (2007). The mathematical models shown
below are the equations that were used to calculate the said parameters.
𝑉 =𝜋 ∙ 𝑟2 ∙ 𝑙
231 (Eqn. 2.2)
𝑣 =231 ∙ 𝑄
12 ∙ 60 ∙ 𝐴 (Eqn. 2.3)
𝑄 =12 ∙ 60 ∙ 𝑣 ∙ 𝐴
231 (Eqn. 2.4)
where:
𝑄 = Volumetric flow rate, gallons per minute (gpm)
𝑉 = Volume, gallons (gal)
𝑣 = Velocity of the piston rod, feet per second fps
𝐴 = Cross − sectional area of the piston of the cylinder, square inch (in2)
𝑙 = Cylinder stroke, inch (in)
𝑟 = Cylinder inside radius, inch (in)
2.1.1.3 Power
There are two kinds of power to be considered in a hydraulic cylinder namely fluid power
and mechanical power. Fluid power refers to the power that a hydraulic fluid can produce or

10
deliver to the hydraulic cylinder while mechanical power refers to the overall power that was
transmitted from the fluid to the cylinder. In general, fluid power is greater than mechanical
power because of the friction losses occurring inside the cylinder. Equation 2.5 was used to
determine the power that the hydraulic fluid could produce (Industrial Hydraulic Services, Inc.
2007).
𝐻𝑃 =𝑃 ∙ 𝑄
1714 (Eqn. 2.5)
where:
𝐻𝑃 = Power, horsepower (hp)
𝑃 = Pressure, pounds per square inch (psi)
𝑄 = Volumetric flow rate, gallons per minute (gpm)
2.1.2 Hydraulic Pump
Inchoosing the appropriate kind of pump to be used in a certain hydraulic system, the
following characteristics should be determined: pump outlet flow, pump input power, and pump
overall efficiency.
2.1.2.1 Pump Outlet Flow
Equation 2.6 was used to determine the volumetric flow rate that a pump could deliver
(Industrial Hydraulic Services, Inc. 2007).
𝑄 =𝑛 ∙ 𝑑
231 (Eqn. 2.6)
where:
𝑄 = Volumetric flow rate, gallons per minute (gpm)
𝑛 = rotative speed, revolutions per minute (rpm)

11
𝑑 = Pump Displacement, cubic inch per revolution (in3 rev)
2.1.2.2 Pump Input Power
Equation 2.7 was used to determine the input power needed by the pump for it to operate
(Industrial Hydraulic Services, Inc. 2007).
𝐻𝑃𝐼𝑁 =𝑄 ∙ 𝑃
1714 ∙ 𝐸𝑓𝑓𝑂𝑉 (Eqn. 2.7)
where:
𝐻𝑃𝐼𝑁 = Pump input power, horsepower (hp)
𝑄 = Volumetric flow rate, gallons per minute (gpm)
𝑃 = Pressure, pounds per square inch (psi)
𝐸𝑓𝑓𝑂𝑉 = Pump overall efficiency, unitless
2.1.2.3 Pump Overall Efficiency
Equation 2.8 was used to calculate the overall efficiency of the pump (Industrial
Hydraulic Services, Inc. 2007).
𝐸𝑓𝑓𝑂𝑉 =𝐻𝑃𝑂𝑈𝑇
𝐻𝑃𝐼𝑁× 100 (Eqn. 2.8)
where:
𝐸𝑓𝑓𝑂𝑉 = Pump overall efficiency, unitless
𝐻𝑃𝑂𝑈𝑇 = Output power, horsepower (hp)
𝐻𝑃𝐼𝑁 = Input power, horsepower (hp)
12
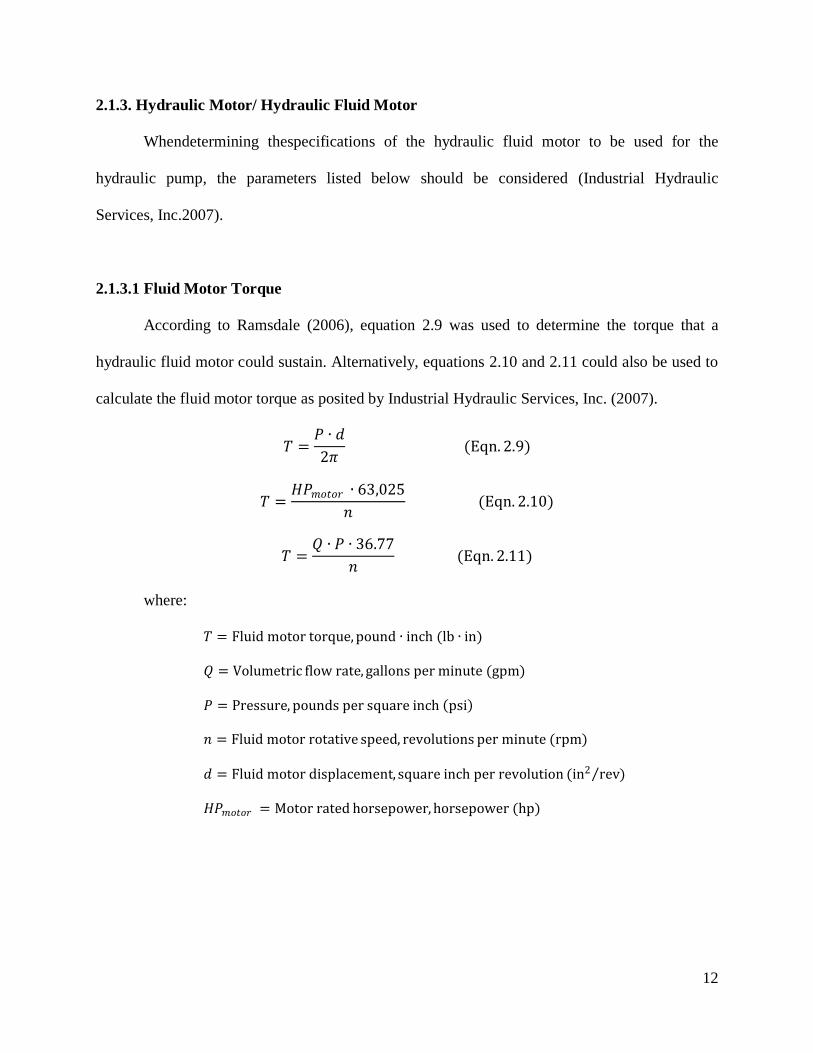
2.1.3. Hydraulic Motor/ Hydraulic Fluid Motor
Whendetermining thespecifications of the hydraulic fluid motor to be used for the
hydraulic pump, the parameters listed below should be considered (Industrial Hydraulic
Services, Inc.2007).
2.1.3.1 Fluid Motor Torque
According to Ramsdale (2006), equation 2.9 was used to determine the torque that a
hydraulic fluid motor could sustain. Alternatively, equations 2.10 and 2.11 could also be used to
calculate the fluid motor torque as posited by Industrial Hydraulic Services, Inc. (2007).
𝑇 =𝑃 ∙ 𝑑
2𝜋 (Eqn. 2.9)
𝑇 =𝐻𝑃𝑚𝑜𝑡𝑜𝑟 ∙ 63,025
𝑛 (Eqn. 2.10)
𝑇 =𝑄 ∙ 𝑃 ∙ 36.77
𝑛 (Eqn. 2.11)
where:
𝑇 = Fluid motor torque, pound ∙ inch (lb ∙ in)
𝑄 = Volumetric flow rate, gallons per minute (gpm)
𝑃 = Pressure, pounds per square inch psi
𝑛 = Fluid motor rotative speed, revolutions per minute (rpm)
𝑑 = Fluid motor displacement, square inch per revolution (in2 rev )
𝐻𝑃𝑚𝑜𝑡𝑜𝑟 = Motor rated horsepower, horsepower (hp)

13
2.1.3.2 Fluid Motor Rotative Speed
Equation 2.12 was used to determine the fluid motor rotative speed as a function of
hydraulic fluid volumetric flow rate and fluid motor displacement (Industrial Hydraulic Services,
Inc. 2007). Alternatively, equation 2.13 could also be used to determine the fluid motor rotative
speed but in this case as a function of frequency and number of windings in the motor poles
(Rockis& Mazur 2007).
𝑛 =𝑄 ∙ 231
𝑑 (Eqn. 2.12)
𝑛 =120 ∙ 𝐹
𝑛𝑤 (Eqn. 2.13)
where:
𝑛 = Fluid motor rotative speed, revolutions per minute (rpm)
𝑄 = Volumetric flow rate, gallons per minute (gpm)
𝑑 = Fluid motor displacement, square inch per revolution (in2 rev )
𝐹 = Frequency, hertz (Hz)
𝑛𝑤 = Number of windings in the motor poles, poles
2.1.3.3 Fluid Motor Power
Equation 2.14 was used to determine the power that the fluid motor could produce
(Industrial Hydraulic Services, Inc. 2007).
𝑃 =𝑇 ∙ 𝑛
63,025 (Eqn. 2.14)
where:
𝑃 = Output fluid motor power, horsepower (hp)
𝑇 = Fluid motor torque, pound ∙ inch (lb ∙ in)
𝑛 = Fluid motor rotative speed, revolutions per minute (rpm)

14
2.2 Control System
2.2.1 Programmable Logic Controller (PLC)
One of the many types of controllers used in automating various systems (mechanical,
electrical, etc.) is a programmable logic controller (PLC). Compared to other controllers, PLCs
have an advantage of being able to use the same basic controller for a wide range of control
systems. Furthermore, control system modification can be done by modifying the program on the
PLC - no need for rewiring, as long as the same inputs and outputs are involved. The result,
therefore, is a flexible, cost-effective system that can be used with control systems, which vary
quite widely in their nature and complexity (Bolton 2009).
In the case of this research, a PLC acquired from Delta Electronics, Inc. with model
number of DVP 32EH00T2 was used. All the inputs in this PLC basically serve as the trigger for
the movement of various briquetting machine components. These inputs include three proximity
sensors which control the position of the mold, a pressure switch which controls the pressure
given by the hydraulic cylinder to the biomass-binder mixture when pressing, and switches
which serve as additional control to various steps in briquette production.
Then, the PLC is downloaded with a ladder program that will manage the relationship
between the inputs and outputs of the PLC. The outputs of the PLC control the solenoid valves
that in turn control the hydraulic cylinder’s movement. The electrical diagram and the hydraulic
circuit of the briquette machine are show inAppendix A and B, respectively.

15
2.2.1.1 Input External Wiring
The wiring for the inputs of the PLC is based on the manual. The two types of DC
inputs, namely sink and source, differ on how the S/S is connected. The type is determined by
the field device or the sensor used. If the field device is a sourcing output (PNP), the PLC input
will be a source type and if the field device is a sinking output (NPN), the PLC input will be a
sinking type. However, if the type of field device does not match with the PLC input type, the
PLC will not be able to read the signal from the field device. The proper wirings according to the
field device type are shown below.
Figure 2.1. PLC input wiring depending on the field device type
(Source: Delta Electronics, Inc, 2006)

16
2.2.1.2 Output External Wiring
For Delta PLCs, two types of output can be present, relay type outputs or transistor type
outputs. Each type has its own wiring diagram that should be strictly followed to avoid damage
on the PLC. For the PLC used on this study, the wiring for a transistor type was utilized, as
shown on Figure 2.2.
Figure 2.2. Wiring diagram for a transistor type PLC
(Source: Delta Electronics, Inc, 2006)
2.2.1.3 PLC to Solenoid Valve External Wiring
For the PLC connection to the solenoid valves, solid state relays were used. Since the
PLC cannot provide the needed current to operate the solenoid valves, relay switches were
utilized to “trigger” the usage of an external power supply. The connections of the solid state
relay are shown in Figure 2.3.

17
Figure 2.3. Solid state relay wiring diagram (Source: Omron Corporation, 2008)
2.2.2 Ladder Programming
In using the PLC, a number of terms and symbols were used. These drivers and
structures used by the group are shown below.
Table 2.1
Devices Functions
Input Relay
It is an internal memory or storage unit in the PLC corresponding to an
external input point. Input relay is used for connecting to the external input
signals, making a “0” or “1”.
Output Relay
It is also an internal memory or storage unit in the PLC corresponding to an
external output point. Output relay is used for connecting to the external load.
The output relay is driven by the contact of an input relay, contacts of other
internal devices and the contacts on itself.
Internal Relay
An internal relay does not have any connection with the external. It is an
auxiliary relay inside the PLC. Its function is similar with those of the
auxiliary relay in the electric control circuit. Every internal relay is similar to
a basic internal storage unit and can be driven by the contacts of the input
relay, output relay and contacts of other internal devices.
Step
STL instruction controls the transfer of step S, making the writing of the
control program easy. If the step program is not in use, Step S can be used as
realy M or an alarm point.

18
Timer
The timer is utilized for timing and has coils, contact and register on it. Whenever the coil is on and the given time is reached, its contact will be
enabled. Every timer can have a fixed timing period. Once the coil is turned
off, the contact will be disabled, making the present value “0”.
Counter
The counter is utilized for counting. Giving the counter a set of values is
needed before using it. The counter also has coil, contact and registers. Once
the coil goes from off to on, the counter will consider it as an input of 1 pulse
and the present value on the counter will add up or plus “1”.
Data Register
Data Register is used for storing values or all kinds of factors. Every register
is able to store a word. On the other hand, double words occupy 2 adjacent
data registers.
File Register
File register is utilized for storing data or all kinds of parameters. This is
usually used when the data register required for processing the data and value
operations are insufficient.
Index Register
This are also 16-bit data registers as other data registers. Index registers can
be read and written and can be used in word devices, as a constant for index
indication or bit devices.

19
Figure 2.4. Ladder programming structure
(Source: DVP – PLC Application Manual)

20
2.3. Sample Computations
2.3.1 Force
𝐹 = 𝑃 ∙ 𝐴
𝑃 = 1000 psi
𝐴 = 19.6852𝜋
4= 304.342 in2
𝐹 = 1000 304.342 = 304242.397 lbs
2.3.2 Volumetric Flow Rate
𝑇 =𝑄 ∙ 𝑃 ∙ 36.77
𝑛
Where: 𝑄 = Volumetric flow rate, gallons per minute (gpm)
𝑄 =𝑇 ∙ 𝑛
𝑃 ∙ 36.77=
108.664 ∙ 1740
1000 ∙ 36.77
𝑄 = 5.14 gpm
2.3.3 Power
𝐻𝑃 =𝑃 ∙ 𝑄
1714
𝑃 = 1000 psi 𝑄 = 5.14 gpm
𝐻𝑃 = 1000 𝑥 5.14
1714
𝐻𝑃 = 3 ℎ𝑝
2.3.4 Fluid Motor Torque
𝑇 =𝐻𝑃𝑚𝑜𝑡𝑜𝑟 ∙ 63,025
𝑛
𝐻𝑃𝑚𝑜𝑡𝑜𝑟 = 3 𝑛 = 1740

21
𝑇 =3 ∙ 63,025
1740
𝑇 = 108.664 lb ∙ in
2.3.5 Fluid Motor Displacement
𝑇 =𝑃 ∙ 𝑑
2𝜋
𝑃 =1000 psi
𝑑 =2𝜋𝑇
𝑃=
2𝜋 108.664
1000
𝑑 = 0.6828in2
rev
2.3.6 Number of windings in the motor poles
𝑛 =120 ∙ 𝐹
𝑛𝑤
𝐹 = 60 Hertz for Philippines
𝑛𝑤 =120 ∙ 𝐹
𝑛=
120 ∙ 60
1740
𝑛𝑤 = 4.13 poles ~ 5 poles

22
Chapter 3
METHODOLOGY
The research is comprised of 4 essential phases or stages namely the designing of the
briquette machine, the fabrication of the briquetting machine, the testing and verification of the
briquetting machine‟s features such as temperature and pressure control, and testing of the
operation of the briquetting press using rice husk agro-waste with cassava starch binder as the
feedstock.
3.1 Conceptual Design
Figure 3.1shows the conceptual framework that has been developed for the research. The
briquette making process begins with the feeding of the raw materials of the to-be-formed
briquette in the machine‟s mixing chamber. In the case of this research, rice husk agro-residue
will be used as the feedstock. The mixing chamber will be monitored with the use of a sensor
and will have an indicator light that indicates when the biomass level is low.
Inside the mixing chamber, rice husk will be mixed with cassava starch which is the
binding agent to be used in the research. It is very important that the rice husk be mixed
thoroughly with the starch for it will affect the characteristics of the output briquette.
Furthermore, when the feedstock remains stationary inside the chamber, the feedstock will
solidify making it unfit for operation. For the design of the mixing chamber, the motor to be
installed should be able to handle the weight of the mixing blade plus the weight of the rice husk.

23
Furthermore, the mixing blade is to be designed such that it can perform thorough mixingof the
feedstock and the binding agent.
After passing through the mixing chamber, the mixed rice husk will be transferred to the
cylindrical mold or die. While it is accumulating inside the mold, it will be heated up through an
installed heater so that the raw materials will become easy-to-compress. A heater display panel
will be used to monitor the temperature in the cylindrical mold while a heater control panel will
be used to regulate the temperature of the heater (Penton 2011a). The operating temperature that
will be employed in the research would range from 30°C up to 300°C.
Subsequent to the heating of the feedstock, the preheated rice husk will now be conveyed
to the position directly below the piston that will compress the mixed rice husk into a rice husk
briquette. To be specific, the rice husk inside the die will be pressed into briquettes by a
hydraulic cylinder with a pressure switch connected to it. The function of the pressure switch is
to redirect the hydraulic fluid back to the system‟s reservoir when the cut off pressure that was
set to it is reached. Once the cut off pressure is reached, the pressure switch will signal the PLC
to signal the solenoid valve to redirect the hydraulic fluid back to the reservoir. To monitor the
amount of pressure being produced by the piston against the feedstock, an analog pressure gauge
is connected to it. To vary the amount of pressure that it gives to the feedstock, the control knob
of the pressure switch is used. With this, the briquetting machine is given with additional
flexibility in terms of processing different raw materials at different pressures. The hydraulic
cylinder that was used in the study is a single action piston type with a maximum working
pressure of 95 kgf/cm2
(approximately 1000 psi or 9 MPa). The other components of the

24
hydraulic system such as the hydraulic pump, hydraulic fluid, actuators, and reservoir will also
be considered in the design of the machine‟s hydraulic system (Khan n.d.).
The die or mold of the briquetting machine is to be designed in such a way that it is
replaceable with different mold sizes and shapes. The machine, which is specifically a prototype,
is to be used as an experimental machine, thus it is supposed to have a mold with changeable
output briquette shapes and sizes. Upon having compressed the rice husk, the final step is the
discharging of the pressed briquette.
Overall, the actual mechanical parts of the briquetting machine will either be designed
using computer software programs or a manufacturer‟s catalogue, or be designed based on
consultations from experts. Simultaneous with the designing process, the search for
manufacturers of the needed machine components is going on. Those needed machine parts that
are readily available in the market will be purchased while those that are not readily available
will be asked to be fabricated. Sensors, logic controls, and computerized monitoring will be
integrated in almost every component of the briquetting machine so that the user is able to
witness what is happening inside the machine and is able to manipulate easily the briquetting
operation parameters based on his/ her preference.

25
Figure 3.1. Conceptual Framework of the Study
Inp
ut
Bio
mas
s
Bin
der
Mix
ing C
ham
ber
Hyd
rau
lic
Syst
em
(Com
pre
ssio
n)
Ou
tpu
t
Bri
qu
ette
s
AC
Mo
tor
Die
or
Mold
Hydra
uli
c
Cyli
nder
Moto
r
Pro
gra
mm
able
Logic
Contr
oll
erS
enso
rs
Para
met
ers
Tem
per
ature
Pre
ssure
Pro
xim
ity
Sole
noid
Val
ve
Hea
ting S
yst
em

26
3.2Phase 1: Briquetting Machine Design Phase
This phase of the research is further divided into two sub-phases which are the design of
the mechanical system and the design of the control system. On one hand, the mechanical system
of the machine is composed of its mechanical framework, hydraulic system, and heating system.
On the other hand, the control system of the machine is composed of mainly of sensors,
switches, wiring, and ladder program. On that note, commercially and readily available
computer-aided design, simulation, and programming software programs were used during this
design phase.
To be specific, Solidworks 2012 was used to design and simulate the mechanical
framework of the briquette press while WPLSoft 2.20 was used for the control system. However,
as for the hydraulic system as well as the heating system, the design process simply involved
simple calculations of the technical parameters that would be used to define or describe the
systems mentioned.
Fundamentally, a particular design or automation plan will be approved or appraised
acceptable based on cost, (relative) ease of fabrication, load handling capacity, factor of safety,
feedback time, (relative) ease of programming, size, and design practicality.
3.2.1 Mechanical System
This section includes the design process of the mechanical system of the briquette press
under study which includes the following: [1] mechanical framework (i.e. stand, mixing
chamber, mixing blade, mold, etc.), [2] hydraulic system (i.e. solenoid valve, relief valve, pump,

27
pump motor, piston cylinder, etc.), and [3] heating system (i.e. band heater, thermocouple,
temperature controller, etc.).
3.2.1.1Mechanical Framework
First, the individual mechanical parts of the machine‟s framework such as the mixing
chamber, cylindrical mold,die, and ram, etc. were designed using Solidworks 2012. Some of
these mechanical parts were patterned based on the paper of Fule et al. (2010) entitled,
“Automated Briquetting Machine”. Nevertheless, in general, the designs of the individual parts
were designed based on the reference materials obtained through research.
Afterwards, the initial design for each of the briquetting machine parts were subjected to
stress simulations and other essential machine design simulations such as factor of safety,
variable loading, and strain simulations. Designs were reviewed and eventually were accepted
based on the aforementioned rubric.
If a certain part does not meet the set design standards, it will undergo a redesigning
process and the redesigned part will then undergo the same set of stress and machine design
simulations. When all the individual designs of the machine‟s framework have passed all the
simulations and were regarded as up-to-standard, the assembly of the individual mechanical parts
of the machine‟s mechanical framework will then proceed.
Upon having completed the assembly of the framework, stress and machine design
simulations were again made but this time the loading was intended for the whole assembly

28
(combined loading). If the assembly is seen to possess any form of flaw during the combined
loading simulations, the assembly will undergo modification until it becomes an acceptable
assembly design. Once all simulations have been done to the assembly of the mechanical
framework of the to-be-fabricated briquetting machine and have passed the set rubric, the design
of the hydraulic system of the machine will be next.
The figure below, Figure 3.2, shows the course of the design process of the mechanical
framework of the briquette press including its assembly. Furthermore, the approved mechanical
framework assembly of the to-be-fabricated machine is shown in Figure 3.3 while the
illustrations of the individual parts can be seen in Appendices A & B.

29
START OF DESIGN
PHASE A
Design Mixing
Chamber
Design
Cylindrical Mold
Design of Other
Mechanical
Parts
Stress and
Other
Simulations
Stress and
Other
Simulations
Design
Acceptable?
Stress and
Other
Simulations
NO NO NO
Mechanical
Framework
Assembly
Stress and
Other
Simulations
A
YES
A
B
YES
B
C
YES
C
END OF DESIGN
PHASE AModify Parts
Design
Acceptable?
Design
Acceptable?
Design
Acceptable?NO YES
Figure 3.2. Briquette Press Mechanical Part Design

30
Figure 3.3. Approved Mechanical Framework Assembly
3.2.1.2 Hydraulic System
Aside from the mechanical framework of the briquette press, the machine‟s mechanical
system is also comprised of a hydraulic system which is responsible primarily for the movement
of the cylindrical mold as well as the application of the required pressure against the biomass, in
other words, the pressing proper itself.

31
Thedesign process of the hydraulic system of the briquetting machine is very much
different from that of the design process of its mechanical framework.At one point, the design of
the hydraulic system no longer underwent any computer-aided designing and
simulation.Basically, the design processinvolvedtwo main considerations: [1]theselection of
appropriate hydraulics equipment for the system such as the pump, solenoid valve, piston
cylinder, hoses, etc. based on the(a) calculations made, (b) design of pre-existingmanually-
operated briquette machines, and (c) availability of supplies, and [2]the mounting and connection
of these equipment in accordance with the machine‟s overall operation. Furthermore, the design
of the briquette press‟ hydraulic systemwas based on the two primary sources which are
published reference materials (i.e.journals, books, manufacturer‟s catalogues, and user‟s
manuals)and consultations from experts in hydraulics (i.e. thesis adviser, professors, and
manufacturers).Nonetheless, the approved hydraulic system circuitry of the machine is depicted
in Appendix G.
3.2.1.3 Heating System
Another component of the briquette machine which is under the mechanical system
bracket is the heating system. As the temperature aspect of briquetting is an indispensable factor,
it is of great importance to choose the right device to attain the desired temperature for the
machine‟s operations. With that in mind, potential manufacturers were looked into the internet,
directories, and catalogues, taking into consideration the different heaters they offer. After
having identified the manufacturer with the most versatile list of the needed equipment, the
proponents of the research consulted with themaiming to identify the most suitable design of
heaterthat is in line with their objectives.

32
Having said that, the band heater-type of heater was chosen for the research primarily
because it can be attached to the system easily without risking too much heat loss. With its
cylindrical hollow shape, it envelops the mold and transfers heat to the feedstock through
conduction. A thermocouple is attached to the band heater to monitor its temperature, ensuring
that what is being given off by the heater is within the threshold of the preferred parameter.
With the desired maximum temperature of 300°C, the wattage and voltage of the heating system
was determinedand was eventually manufactured by the chosen supplier which was RKRS
Industrial Heater. Figure 3.4 is a picture showing the chosen and manufactured heater that was
utilized in the study.
Figure 3.4 Band Heater
Following the heating system, the planning, design, and programming of the controls
components and the monitoring system of the machine will be next inline.

33
3.2.2 Control System
The initial step in the design of the control system that was employed in the briquetting
machine is to establish what parameters or analog signalsare to be monitored and controlled.
Such scheme may be referred to as Control SystemAlgorithm Planning.
At this point, logic operationsof the machine are to be defined. For example, when the
pressure exerted by the hydraulic cylinder against the feedstock is too highor when the mixing
chamber runs out of feedstock,what should be the response of the machine.The design of the
control system waslikewise evaluated using the same rubric aforementioned.
Selectionof the sensors to be used for the actual machine will go after the planning of the
control system. In this regard, it is important to know what type of sensors should be used with
different forms of analog signals. A pressure sensor which senses pressure signals, for example,
is different from a temperature sensor which senses temperature signals. Moreover, sensors used
for solids (e.g. piezoelectric sensors) are different from sensors used for fluids (e.g. digital air
pressure sensors).
Subsequent to the selection of sensors is the identification of the external wiring of the
controls components of the press based in their manuals. As have been mentioned earlier, the
PLC that was used in this paper was a Delta PLC with model number of DVP 3200EHT2. Its
wiring requirements, along with the inputs and outputs, can be found in its manual which is in
effect can be seen in Appendix H of this paper.

34
Moving on, the planned algorithm of the control system was converted into a machine
code and was then programmed into the PLC using the WPLSoft 2.20 software.However, before
engaging the controls into actual practice, computer simulations using the said software were
carried out in this step mainly for the purpose of verification and debugging.After having
verified and debugged the program, the control system wasthen tested whether rit is responding
according to the desired response of the study. In the event when the control system does not
responding as per the standard set in the study, reconfigurations are to be done to it until such
time that it works with an acceptable quality.After accomplishing such test, Sub-Phase B of the
briquette press‟design phase is already done.
To be more visual, Figure 3.5 below portray the control system of the machine was
designed as well as programmed.

35
START
Control System
Algorithm Planning
Selection of Sensors
Programming with
WPLSoft 2.20
Re-configure
Control System
Working?ENDYES
NO
Design
Acceptable?
NO
YES
Wiring Diagram
Figure 3.5. Briquette Press Digital Part Design
3.3Phase 2: Briquetting Machine Fabrication and Assembly
This stage of the research marks the start of the construction of the briquetting machine
prototype. Depending on the accepted blueprint, the materials with their corresponding quantities
and dimensions will either be purchased or will be obtained throughoutsourcing (i.e. by
recycling, by borrowing, or by having the materials becustom-built by a certified manufacturer).
Essentially, all the accepted designs that have been generated from the previous steps will
now be realized into actual parts which will then be assembled later on. All the important
components of the machine such as the mechanical framework, hydraulics system,

36
heatingsystem, control system, and electrical parts will be actualized and later on be integrated
all together to form the overall prototype of the automated hydraulic briquette press.The table
below, Table 3.1, shows how the proponents of this study outsourced or actualized the individual
parts of the machine to form the overall prototype.
Table 3.1. Method of Acquisition per Machine Component
Qty. Component Method of Acquisition
1 1) Machine Package 1) Purchased from Tipontipon Welding Shop
1 2) Heating System 2) Purchased from RKRS Industrial Heater
1 3) Pressure Switch 3) Purchased from Ace Hydraulics
Enterprises
3 4) Proximity Sensors (Metal) 4) Borrowed from DLSU
1 5) Proximity Sensor (Presence) 5) Purchased from E-Gizmo
1 6) Dial-Type 10 MPa Pressure Gauge 6) Purchased from Sky Electrical and
Pneumatic Control Center
1 7) Programmable Logic Controller 7) Borrowed from DLSU
4 8) Solid-State Relay Switches 8) Purchased from E-Gizmo
4 9) Switches (Push Button, Toggle, etc.) 9) Purchased from RodcellElectrical Control
Center and Deeco
5 L 10) Hydraulic Oil 10) Purchased from Jomac‟s Trading
1 11) Solenoid Valve 11) Borrowed from DLSU‟s previous thesis
n/a 12) Other Electrical Auxiliaries 12) Purchased from E-Gizmo and Deeco
Note that the machine package from above includes primarily of the following: machine
framework, hydraulic system, mixing chamber, guide tube, dial-type 15 MPa (150kgf/cm2)

37
pressure gauge, pump, 3-hp pump motor, ½-hp mixing blade motor, belt, pulleys, hoses, bolts,
nuts, etc.
When the briquettingmachine has already been constructed, a test run without the
feedstock yet will be done.The machine will be noted if it is working or not. In the event that the
prototype does not work, troubleshooting will be done to the briquetting machine until such time
that it operates. In terms of the acceptability of the fabricated prototype, a new determinant will
be used to verifywhetheritis acceptable or not.Basically, the prototype will be accepted if the
technical specifications that it manifestssuch as maximum operating pressure, tolerance, input
power requirement, briquette diameter, weight, etc. (with tolerance being the core determinant)
meet tolerably or is at par with the computed or expected technical specifications of the
prototype based on either computations or ratings of the individual parts.
The following figure, Figure 3.6, is the step-by-step procedure of the second phase of the
research which is fabrication and assembly.The output of this phase of the research is basically
the actual machine prototype.

38
Design Approval
START
Materials Acquisition
Assembly OK?
Materials
Complete?
Assemble Machine
Framework
YES
NO
Do adjustment/s
Integration of
Controls
Intergration of
Sensors
Integration of the
Electricals
Prototype
working?
Integration of
Actuators and
Electromechanicals
Troubleshoot
Prototype
acceptable?
Integration of Other
Auxiliary Parts
NO
YES
Do adjustment/s
NO YESNO
YES
END
Figure 3.6.Flow of the Briquette Press Fabrication and Assembly

39
3.4 Phase 3: FeaturesTesting and Verification of the Briquetting Machine
Aside from the to-be-conducted test run in the 2nd
phase of the researchwhich is intended
to merely check whether the prototype is working or not, testing and verification of the
machine‟s functionalities will be carried out in this 3rd
phase of the research.In this step, the
features of the automated briquetting machine such as pressure and temperature control and
monitoring were validated manually using appropriate tools and measuring instruments. Also,
experiments to determine the value of the machine tolerance which is, as have been mentioned,
the core determinant for the acceptance of the prototype were performed.
3.4.1 Testing and Verification Overview
The testing scheme primarily involved the measurement of directly measureable analog
signals (e.g. temperature and fluid pressure) through manual means and computing for the values
of the parameters (e.g. horsepower requirement and pressure exerted on the mold) through
equations. In due course, this testing scheme would be able to determine some of the technical
specifications of the fabricated prototype.
On the verification part, the directly measured (or calculated) values of some parameters
such as temperature and pressure were compared with the values of those parameters displayed
on the built-in gauges of the machine or measuring instruments. For an instance, the temperature
monitoring of the machine will be verified by comparing the displayed value of the temperature
to the manually and directly measured temperature of the machine part where the heater is
situated. If any inconsistency in the machine is seen, adjustment/s will be made as well as

40
verification/s. Evidently, the parameters that are being displayed on the gauges are the ones to
undergo verification process.
Through statistical analysis of the data generated from the tests, the tolerance of the
machine features was then defined. Overall, a machine tolerance of ±10% would be observed. In
the event that the computed tolerance is not at par with the set tolerance, adjustment/s will be
made for it is considered to be a form of inconsistency. The general overview on how phase 3 of
the research will go about is demonstrated in Figure 3.8. As can be seen, Figure 3.8 is a simple
example of the features testing and verification phase with pressure and temperature being the
analog signals to be measured, compared, and analyzed.

41
START
T = Tinput
P = Pinput
T and P valid?
Operate Machine
Measure T
and P
Compare
measured data to
data from built-in
gauges
Machine
Tolerance
Analyze Data
YES
NO
END
Data from
manual
measurement
Figure 3.8. Sample Run of the Features Testing and Verification Phase
3.4.2 Verification of the Accuracy of the Band Heater
To manually test whether the temperature that is said to be being supplied by the band
heater to the cylindrical mold is accurate, a K-type pocket thermocouple was used. The
thermocouple was attached to the band heater as illustrated in Figure 3.9.The readings from the

42
pocket thermocouple as well as the built-in thermocouple of the band heater were taken
simultaneously and were recorded for further analysis. The experimentation was done three
times, wherein for each trial, the temperature readings were taken every 10°C. The initial setting
of the band heater was the one closest to the room temperature which is 30°C, while the peak
temperature setting was 300°C, which is also the maximum operating temperature of the band
heater. Despite that there were noticeable differences between the values of the readings of the
built-in thermocouple and pocket thermocouple, these differences were kept under ±5% margin
of error.
Figure 3.9. External thermocouple attached to the band heater
3.4.3 Verification of the Accuracy of the Pressure Switch
To begin with, the pressure switch that has been acquired for the study has a vague
metrological graduation which cannot be understood even with the aid of the proponents‟

43
consultation with its vendor since there is no available user manual for the said component.
Hence, the proponents of this research eventually decided to set their own convention for the
pressure switch based on the minimum and maximum operating pressure of their machine. With
that, the circumference of the pressure switch was divided into 4 quarters, namelythe north, east,
west, and south quarters as shown in the Figure 3.10 underneath. After a few trials, it has been
found out that each quadrant or quarterof the pressure switch signifies an increase of around 5
kgf/cm2.
Figure 3.10. Pressure Switch Convention

44
To proceed with the manual verification of the pressure switch‟s accuracy, two Bourdon
gauges were used.Pressure gauge 1 (PG1) has a maximum pressure of 150 kgf/cm2 and islocated
or mounted before the solenoid valve while pressure gauge 2 (PG2) has a maximum pressure
capacity of 100 kgf/cm2 and is located or mountedright before the vertical hydraulic cylinder.The
experiment is done by recording the readings of the two pressure gauges for every trial of the
pressure switch while increasingthe compression pressure by an increment of 5 kgf/cm2per trial.
This implies that the dial of the pressure switch is being rotated from quadrant to another in a
clockwise direction, until it reaches the „north four‟ quadrant (N4) which is the maximum
pressure of in the study with an equivalent numerical value of 95 kgf/cm2.
3.4.4 Verification of the Control System Circuitry
The external wiring of the PLC as well as its inputs and outputs needs to be verified
before engaging into operation because errors in external wiring could critically destroy the PLC
or worse, the whole control system itself. Thus, to avoid such scenario, all components of the
control circuit were tested to ensure that they are working properly prior toactual experiments.
The verification of the control circuit starts with double-checking physically the actual
wiring that has been done to the controls component of the system with the indicated correct
wiring written in the manual. The moment when the external wiring has been verified as correct,
another test is still to be carried out but this time with the PLC turned on.
To be a little bit more concrete, take the proximity sensors used in the study as an
example. The proximity sensors that were used in the study are sink-type sensors. With that, the

45
PLC hasto be set to a sink-type DC input configuration as well. Therefore, the S/S port of the
PLC should be connected to its +24V portwhile the 24G port should be connected to the input
ports (X‟s). To verify whether the wiring is correct, a multimeter, also called a VOM, was used
to measure the voltage between the 24G port and the input ports. If the reading in the VOM (in
voltmeter mode) flashes a value of approximately 24 VDC, then the connection is deemed to
becorrect; otherwise, it is considered incorrect. Likewise, the connection of the sensors was also
verified using this method.
The next thing to verify after the input external wiring iswhether the output port detects
an input signal, or in other words whether the output signal is triggered by input ones.To do so, a
very simple input-output ladder program, as shown on Figure 3.11, was downloaded to the PLC.
Figure 3.11. Program used in verifying the output signal
The test for the output goes as follows. While maintaining a signal on the output port Y0,
the voltage across the common port and the output ports (Y‟s) was measured. Similar to that of
the input, if the voltmeter reading acrossthe common port and output ports flashes a value of
approximately 24 VDC, then the connection is considered to be correct, otherwise, it needs
rewiring for it is incorrect. Further verification was done to the control system by repeatedly

46
turning on and off the inputs on the program while simultaneously taking note if the output port
will behave as programmed.
3.5Phase 4: Briquette Press OperationTesting
Prior to the operation and performance testing of the fabricated briquette press, the rice
husk agro-waste and cassava starch binding agentwere obtained. More importantly, preparation
of the rice husk agro-waste and cassava starch as feedstockwas done before it was fed into the
machine.According to Grover and Mishra (1996), for agro-residues and mill-residues, the unit
pre-processing or pre-treatmentto be done prior to densification or briquetting include sieving
and crushing of the dried agro-waste. Displayed in the diagram of Figure 3.12 is the process flow
diagram developed in the study on how to compact rice husk biomass into briquettes.

47
Binder Rice husk
Mixing
Chamber /
Hopper
Mold Heater
Pressed by
cylinder
After 20 minutes
Removed from
mold
After 1 minute
Sun or air dried
for 2 days
End
Start
Prepare
Figure 3.12. Briquetting Process Flow Diagram

48
3.5.1 Preparation of the Feedstock
The feedstock that will be loaded into the mixing chamber of the fabricated briquetting
machine is a mixture of ground rice husk biomass and cassava starch that was made into a paste.
To prepare this, both the rice husk biomass as well as the cassava starch needs toundergo a pre-
processing before they could be mixed together as a feedstock.
First in the line is the pre-processing of the raw rice husk agro-waste into ground state.
To do so, it involves grinding of the raw rice husk into smaller particles with the help of a
household blender.Physically, the ground state of the rice husk is supposed to appear as nearly
pulverized but not exactly pulverized. The reason for grinding is fundamentally for better and
easier compaction. More often than not, the rice husk biomass which can be obtained from the
local market has a low bulk density.In the case of this research, one briquette sample contains
about 36.65 % rice husk biomass by weight which is approximately equal to 70 grams. The
images below, Figure3.13, illustrate the „before grinding‟ and „after grinding‟of the rice husk.
Figure 3.13. Rice Husk Agro-Waste Pre-Processing
49
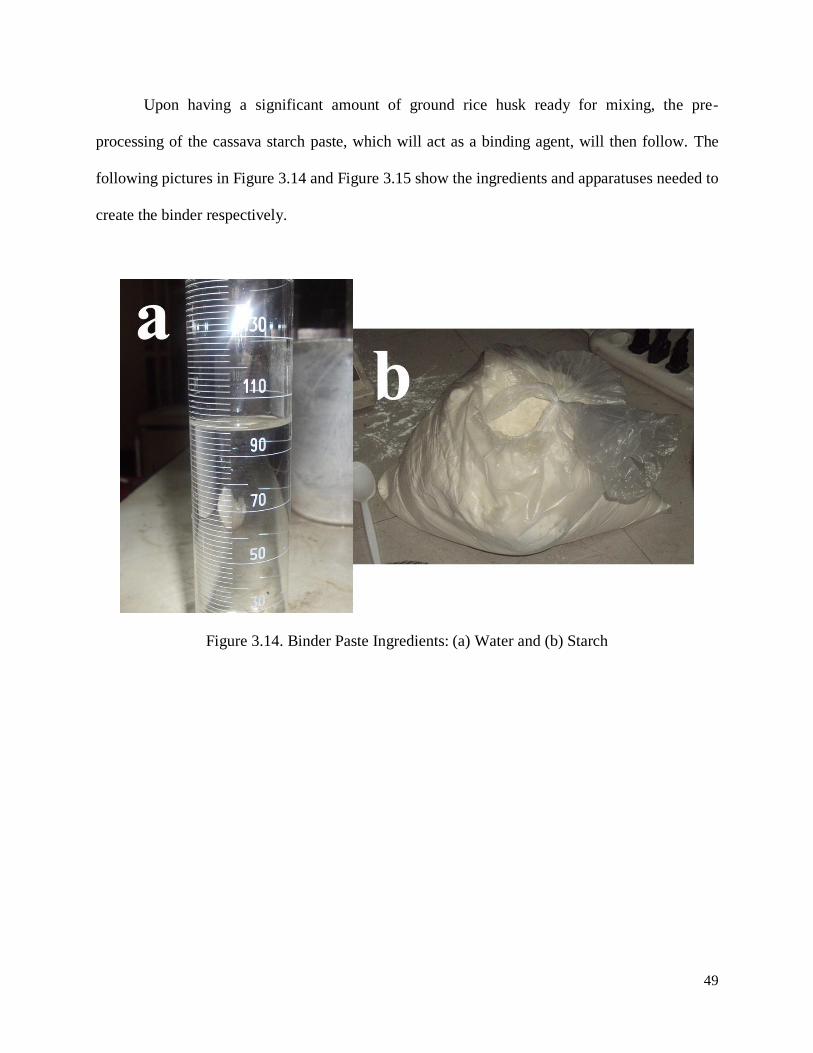
Upon having a significant amount of ground rice husk ready for mixing, the pre-
processing of the cassava starch paste, which will act as a binding agent, will then follow. The
following pictures in Figure 3.14 and Figure 3.15 show the ingredients and apparatuses needed to
create the binder respectively.
Figure 3.14. Binder Paste Ingredients: (a) Water and (b) Starch

50
Figure 3.15. Apparatuses needed for Binder Cooking: (a) Analytical Balance, (b) Graduated
Cylinder, (c) Cooking Pot, and (d) Electric Stove
As illustrated on the above image, 100 mL of water and 35 grams of cassava starch are
the ingredient needed to create the binding paste for the briquette. The indicated quantities for
each ingredient are intended for single sample of briquette.

51
To begin,60 mL out of the 100 mL of water is to be mixed with 35 grams of cassava
starch into a bowl or container untilthe starch fully dissolved in the water and has no lumps. The
consistency of the starch-water mixture should neither be too viscous (thick)nor too watery
(drippy). The remaining 40 mL of water is to be heated in a pot or a can until it boils. Once it
already boils, the starch-water mixture from earlier is to be poured unto it while being stirred.
The overall mixture inside the pot should be stirred at regular intervals until becomes ready for
mixing to avoid burning the binder paste which settles at the bottom of the pot. The binder is said
to be ready for mixing or cooked when the paste already appears to be nearly translucent and
feels gelatinous.
At this point, the preparation of the feedstock could now be realized. To do so, the
cooked binder should be pouredinto the 70 grams groundrice husk on a separate container. After
that, the two should be pre-mixed together manually (either by using a spatula or bare hands) so
as tomake the feedstock become nearly homogenous before the binder solidifies.Presented in the
portrait below, Figure 3.16, is an example of a feedstock that is ready for loading into the mixing
chamber.

52
Figure 3.16. Sample Feedstock Ready for Loading
Overall, the ratio of the ground rice husk biomass to cassava starch binder is about
0.5783or 36.65 % rice husk and 63.35 % binder by weight. This ratio that was used during the
testing was initially adapted from the study of Baconguis (2006) which was 8% to 15% binder by
weight and 85% to 92% biomass by weight. Later on, the ratio was modified accordingly so as to
fit for the purposes and bounds of this study.
3.5.2 Briquetting Operation Proper
Following the preparation of the feedstock, the operation proper of the briquetting press
will then advance.First, the feedstock is to be loaded into the mixing chamber.In contrast with
the initial mixing of the feedstock, the purpose of the mixing chamber in the study is for
thorough and further mixing of the feedstock as well as to prevent it from solidifying prior to its
compression.

53
Once the loading of the feedstock has been done, the machine will now be turned on so
that the briquetting operation mayofficially begin. From the mixing chamber, the feedstock will
be conveyed to the mold through the guide tube with the aid of gravity.While the feedstock
accumulates and settles inside the mold, it is instantaneously being heated by the heating system
of the machine at a temperature that was set by the user. As soon as the mold is already full and
ready for compaction, it will move directly below the hydraulic press which marks the start of
the compression proper of the operation.
An initial test run is to be conducted before having the machine totally engage into full
operation which involves varying of both pressure and temperature.This test run will involve
testing of whether the feedstock really became a briquette after going through the
machineoperating at maximumavailable pressure and temperature. If the feedstock does not form
into briquettes, then amendmentsare to be made such as an increase in the amount of binding
agent and vary the preheatingtime until briquettes are formed.
The moment it has been confirmed that machine could really create briquette, test run
with varying pressure and temperature could already be carried out.At runtime of the press, the
installed control panelmay be used to monitorand regulate some of the briquetting parameters
such as pressure and temperature. If an error occurred, the machine should be stopped; if no error
occurred, then the operation continues. If a disturbance occurred, the built-in machinecontrols
may be used;however, if the disturbance is uncontrollable,the machine has to be
stopped.Nonetheless, if no disturbance occurred, then the operation continues. Figure 3.18
summarizes the briquette operation and testing phase.

54
In addition to Figure 3.18, Figure 3.17 shows a closer view of the densification operation
that will be done using the machine. The densification operation to be done will follow a planned
scheme to see if the automated briquetting machine is indeed flexible.

55
Press
Briquetted?
NO
Increase Pressure and/ or
Temperature by N amount
of increment
NO
Create X number of
briquettes at current
P and T
YES
ENDP and T >= max
operating pressure?
Starting Pressure
P = Pstart
Starting Temperature
T = Tstart
START
YES
Figure 3.17. Densification Process

56
START
Feedstock
Ingredients
Acquisition
Feedstock
Preparation
Densification
Operation
Biomass
Briquetted?
Do modifications &
improvementsNO
Data
acquisition
from sensors
Continue
Densification
Operation
YES
Display to
Monitoring
System
A
A
Disturbance/s
Occurred?
Continue
Operation until
feedstock runs out
Controllable by
the machine?
Other forms
of Data
Acquisition
Record for
further analysis
END
Control using
machine installed
functions
YES
YES
Use Emergency
Stop Button
Error/s
Occurred?
Troubleshoot
Restart
Densification
Operation
NO
YES
NO
NO
Figure 3.18. Summary of Briquette Press Operation and Testing

57
Chapter 4
RESULTS, ANALYSIS, AND CONCLUSION
This chapter presents the data gathered through simulations and experimentations done
by the group. The simulations were done on the design phase of the study, before the actual
fabrication and procurement of materials. The experiments are presented mostly in table form
with their corresponding graphs. Also, the analyses of the data followed by the conclusion, are
discussed on the latter part of this chapter.
4.1 Results
The results of the experiments conducted by the group, as explained in the previous
chapter, are summarized in this section. On Table 4.1, a list of the parameters measured in the
machine together with their corresponding monitoring unit used can be seen.
Table 4.1. Parameters Monitored / Controlled
Parameter Monitoring Unit
Biomass level on the Mixing Chamber Proximity sensor
Temperature Temperature controller
Positioning of the mold 3 proximity sensors
Pressure 2 Pressure gauges and pressure switch
For continuous operation, a proximity sensor is attached to the mixing chamber. With the
use of an indicator light, the user can know when the biomass level is low and needs refilling. In
addition to that proximity sensor, 3 more inductive proximity sensors are used to position the
mold. For the temperature aspect, a temperature controller with a thermocouple attached to the
band heater is used to monitor the temperature at the mold. Lastly, 2 pressure gauges, one

58
attached before the solenoid valve and one attached before the vertical hydraulic cylinder, and a
pressure switch are installed on the system to make sure that the pressure supplied to the biomass is
correct.
4.1.1 Simulations
Several parts of the machine have undergone simulations such as stress analysis, factor of
safety, etc. The results of the simulations done by the group are shown below while detailed
reports can be seen on Appendices C, D & E.
Figure 4.1.Factor of Safety Analysis on the Table Assembly

59
Figure 4.2. Factor of Safety Analysis on the Mounting of Hydraulic Press Assembly
Figure 4.3. Factor of Safety Analysis on the Hydraulic Press Casing
These simulations were done using Solidworks 2012. The designs of these parts of the
machine are based on readily available materials and existing parts. The results of the

60
simulations done are on the figures above but detailed reports can be seen on Appendices C, D &
E.
4.1.2 Machine Operation
The data gathered during the machine operation proper is divided into three parts: heating
system, pressure system, and the briquette formation. These are the major aspects of the
machine that reflects the machine performance. Table 4.2 shows the operating parameters and
the time needed for each.
Table 4.2. Operating Parameters Observed during Machine Operations
Operating Parameter Working parameter
Stabilization of the Offshoot (Heating System) 3 – 4 minutes
Preheating Length 20 minutes
Pressing Time 1 minute
From the experimentations, it was observed that upon turning on of the heater, it takes
around 3 to 4 minutes before the temperature stabilizes. Also, after a number of trials, it was
determined that the minimum preheating and pressing time are 20 minutes and 1 minute,
respectively.
4.1.2.1 Heating System
For the heating system of the machine, the temperature set by the user on the temperature
controller was counterchecked by a thermocouple attached to the band heater. The readings on
both the controller and the thermocouple are recorded on Table 4.3. Also, as the temperature was

61
varied, the time needed to achieve such changes was recorded. The data gathered on each trial
are summarized on Table 4.4.
Table 4.3. Temperature Readings (in °C)
Temperature
Controller
Thermocouple %Difference
Trial 1 Trial 2 Trial 3 Average
0 0 0 0 0.00 0.00
30 35 33 33 33.67 10.89
40 46 44 41 43.67 8.40
50 54 53 51 52.67 5.06
60 64 61 65 63.33 5.26
70 72 71 73 72.00 2.78
80 81 82 80 81.00 1.23
90 90 91 90 90.33 0.37
100 98 100 99 99.00 1.01
110 110 111 110 110.33 0.30
120 119 123 121 121.00 0.83
130 129 132 131 130.67 0.51
140 138 142 140 140.00 0.00
150 149 148 152 149.67 0.22
160 157 161 160 159.33 0.42
170 166 169 171 168.67 0.79
180 174 177 181 177.33 1.50
190 186 191 193 190.00 0.00
200 194 198 204 198.67 0.67
210 208 210 212 210.00 0.00
220 214 219 225 219.33 0.30
230 227 234 228 229.67 0.15
240 239 240 242 240.33 0.14
250 249 252 251 250.67 0.27
260 258 264 258 260.00 0.00
270 265 270 272 269.00 0.37
280 273 281 277 277.00 1.08
290 281 288 286 285.00 1.75
300 293 295 298 295.33 1.58

62
For each trial, the temperature on the controller was set from 30 °C to 300 °C, with 10 °C
increment. Once the temperature on the controller stabilizes, the temperature on the
thermocouple is recorded, then the temperature is increased until it reaches the maximum
temperature capacity of the heating system. This was repeated three times then the average
temperature form these trials were computed. The average was compared to the temperature on
the controller to achieve the percentage difference between these two readings.
Table 4.4. Temperature Readings with Time
Temperature
Controller (°C)
Time (in seconds)
Trial 1 Trial 2 Trial 3
0 0.00 0.00 0.00
30 0.24 0.25 0.24
40 0.26 0.27 0.27
50 5.44 5.56 4.49
60 9.20 9.39 8.57
70 11.52
Skipped to
10.45
80 13.29 13.37
90 16.02 15.59
100 18.15 17.55
110 20.55 20.02
120 22.24 22.56
130 24.36 25.03
140 26.03 11.44 27.44
150 28.41 13.29 28.22
160 29.58
Skipped to
30.35
170 32.43 32.58
180 34.18 34.39
190 35.47 15.11 35.86
200 37.15 16.58 37.41
210 38.7 17.35 39.12
220 40.07 19.23 40.54
230 41.35 20.51 41.87
240 43.14 22.19 43.26
250 44.15 23.44 44.41
260 45.09 24.53 45.4

63
270 45.97 25.42 46.35
280 46.66 26.15 47.11
290 47.31 27.01 47.79
300 48.11 28.05 48.5
On another testing, the temperature was again taken but now, the time needed to reach
the desired pressure was monitored. On Table 4.4, the data from the three trials can be seen. On
Trial 1, the temperature was increased by 10 °C from 30 °C until it reaches 300 °C. As a pattern
was observed by the group on the first trial, they increased the temperature by 80 °C at one point
and 40 °C on another part, to see if it takes the same time as when it is increased by 10°C. On
the third trial, the same increment of 10 °C was used.
Figure 4.4. Temperature versus time graph
02468
101214161820222426283032343638404244464850
0 20 40 60 80 100 120 140 160 180 200 220 240 260 280 300
Tim
e (
in s
eco
nd
s)
Temperature (in degree Celsius)
Temperature versus Time
Trial 1 Trial 2 Trial 3

64
The relationship of the values on Table 4.4 is shown on this graph. The temperature set
on the controller serves as the x-axis while the time needed to reach a certain temperature is on
the y-axis. The three trials are represented by the three lines. The blue and green lines
representing Trials 1 and 3 are almost coinciding, showing that the readings gathered on these
trials do not differ much. However, since on the third trial, there was a huge increase on the
temperature setting (increased by 80 °C, from 60 °C to 140 °C), it can be seen that the time used
for that particular trial is shorter. Nevertheless, it can be observed that the three lines have the
same slope, except for those parts where there was sudden increase in temperature.
4.1.2.2 Pressure System
For the next parameter, the pressure, the group has two pressure gauges attached to the
system. The pressure set on the pressure switch is counterchecked by these two pressure gauges.
The readings are summarized on Table 4.5.
Table 4.5. Pressure Readings (in kgf / cm2)
Trial 1
Pressure
Switch Position
Pressures %
Difference PS Pressure
(Convention)
PG
1
PG
2
Average
Pressure
W2 80° 55 57 58 57.5 4.35
N2 55 57 60 58.5 5.98
E2 60 63 64 63.5 5.51
S2 65 65 66 65.5 0.76
W3 70 68 68 68 2.94
N3 75 70 72 71 5.63
E3 80 73 73 73 9.59
S3 85 70 75 72.5 17.24
W4 90 82 88 85 5.88
N4 95 95 94 94.5 0.53
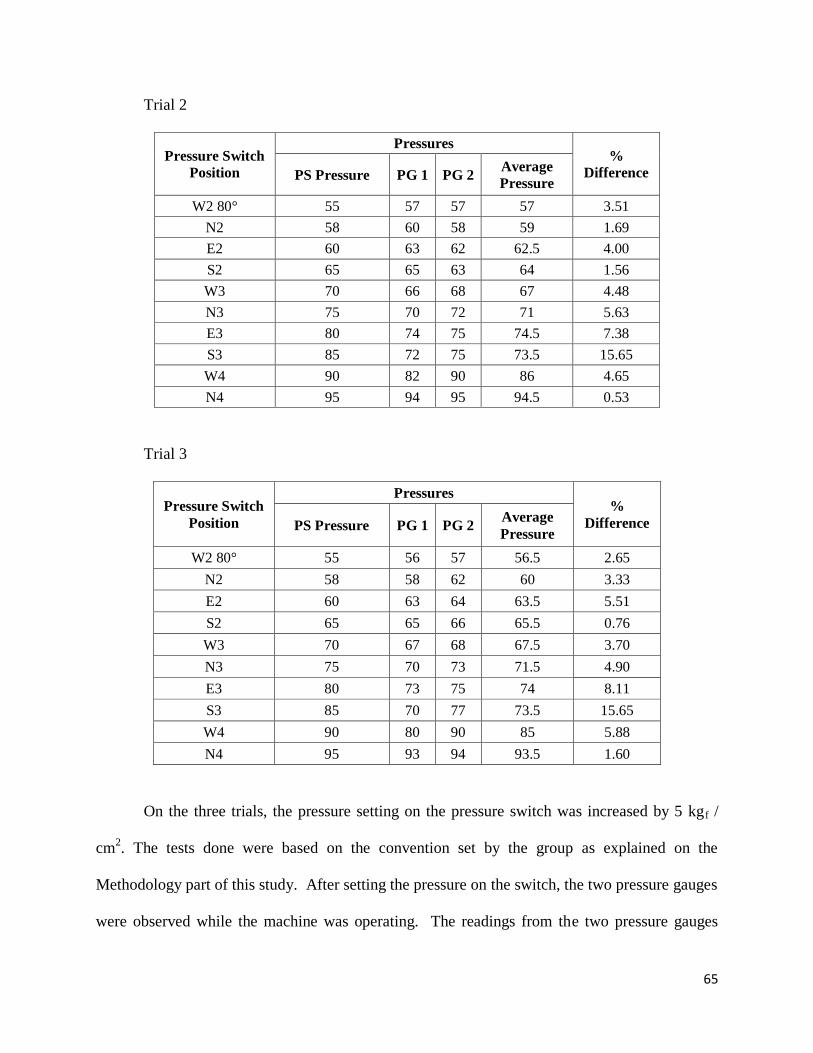
65
Trial 2
Pressure Switch
Position
Pressures %
Difference PS Pressure PG 1 PG 2 Average
Pressure
W2 80° 55 57 57 57 3.51
N2 58 60 58 59 1.69
E2 60 63 62 62.5 4.00
S2 65 65 63 64 1.56
W3 70 66 68 67 4.48
N3 75 70 72 71 5.63
E3 80 74 75 74.5 7.38
S3 85 72 75 73.5 15.65
W4 90 82 90 86 4.65
N4 95 94 95 94.5 0.53
Trial 3
Pressure Switch
Position
Pressures %
Difference PS Pressure PG 1 PG 2 Average
Pressure
W2 80° 55 56 57 56.5 2.65
N2 58 58 62 60 3.33
E2 60 63 64 63.5 5.51
S2 65 65 66 65.5 0.76
W3 70 67 68 67.5 3.70
N3 75 70 73 71.5 4.90
E3 80 73 75 74 8.11
S3 85 70 77 73.5 15.65
W4 90 80 90 85 5.88
N4 95 93 94 93.5 1.60
On the three trials, the pressure setting on the pressure switch was increased by 5 kgf /
cm2. The tests done were based on the convention set by the group as explained on the
Methodology part of this study. After setting the pressure on the switch, the two pressure gauges
were observed while the machine was operating. The readings from the two pressure gauges

66
were also recorded together with their computed average. Afterwards, the percentage difference
between the set pressure and the actual pressure was calculated.
For the first trial, most of the readings are within the tolerance limit of 10 % except that
on S3. The same observations can be done on both Trials 2 and 3. The analysis of this data can
be seen on the Analysis part of this Chapter.
Figure 4.5. Graph of the Pressures at Different Trials
On the graph, the set pressure on the pressure switch is represented by the linear blue line
while the three other lines represent the three trials. It can be seen that the green, red, and violet
50
55
60
65
70
75
80
85
90
95
100
50 55 60 65 70 75 80 85 90 95 100
Pressure (in kgf/cm2)
Pressure at Different Trials
PS Pressure
Trial 1
Trial 3
Trial 2

67
lines behave almost identically, showing that the data gathered on the three trials are almost the
same. However, these three lines do not behave the same as the blue one, showing that there are
differences on the pressure read by the gauges and that set on the pressure switch. These
differences are explained on the Analysis part of this chapter.
4.1.2.3 Briquette Formation
Varying the parameters, the group has identified the temperature and the pressure where
the briquette actually forms is listed on Table 4.6. Pictures of some of the briquettes are shown
on Figure 4.6.
Table 4.6. Briquetting Parameters Overview
Temperature (deg C) Pressure (kgf/cm2) Briquette Formed
Yes No
0
55
x
10
x
20
x
30
60
x
40
x
50
x
60
x
70
65
x
80
x
90
x
100
x
110
70
x
120
x
130
x
140
x
150
75
x
160
x
170
x
180
x
190 80
x
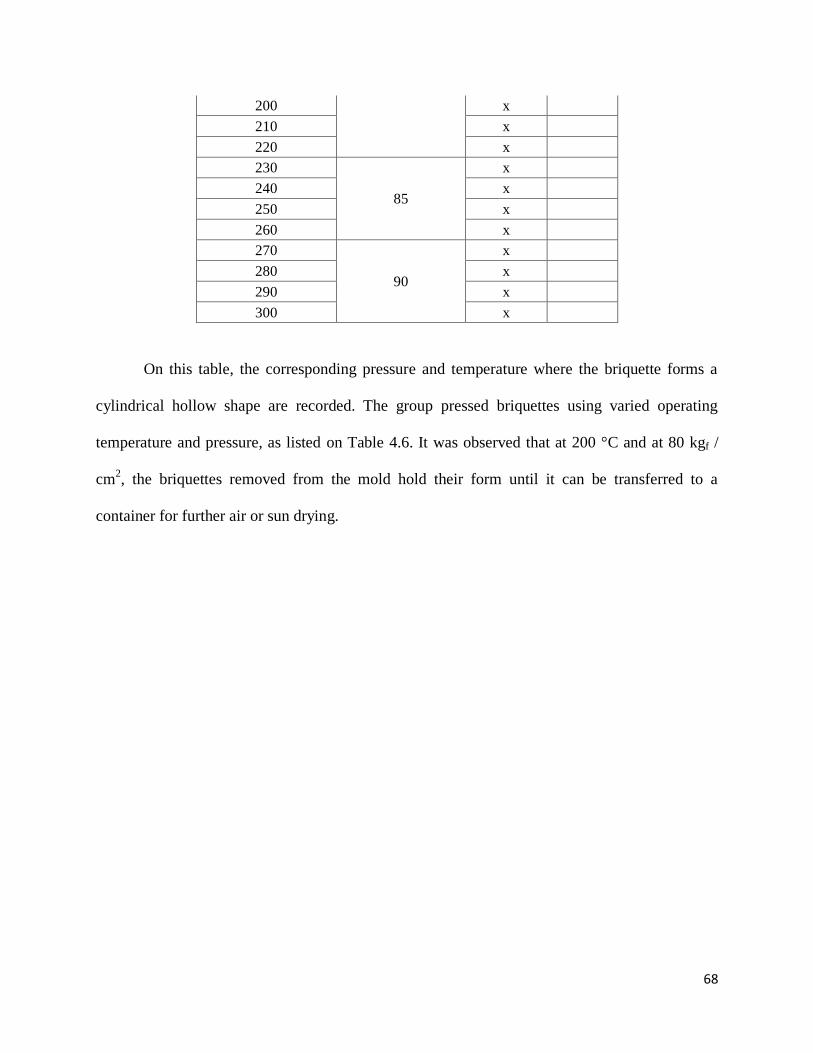
68
200 x
210 x
220 x
230
85
x
240 x
250 x
260 x
270
90
x
280 x
290 x
300 x
On this table, the corresponding pressure and temperature where the briquette forms a
cylindrical hollow shape are recorded. The group pressed briquettes using varied operating
temperature and pressure, as listed on Table 4.6. It was observed that at 200 °C and at 80 kgf /
cm2, the briquettes removed from the mold hold their form until it can be transferred to a
container for further air or sun drying.

69
Figure 4.6. Briquette Samples
The picture on the upper left was pressed with an operating temperature and pressure of
60 °C and 60 kgf / cm2, the one on the lower left at 100 °C and 65 kgf / cm
2, while on the upper
right at 150 °C and 75 kgf / cm2 and lastly, the one on the lower right at 200 °C and at maximum
pressure of 95 kgf / cm2. It can be seen that on the first picture, the briquette instantly crumbles

70
down once removed from the mold while the second and third formed into cylinders but do not
stay firm for long. With the proper parameters, it can be seen on the last picture that the
briquette was formed properly and after some drying time, it became hard enough to not break
even when dropped on the floor. These physical characteristics of the briquette show how
pressure and temperature affect the compaction, texture, and firmness of the briquettes.
4.1.3 Economic Evaluation
For the economic evaluation of the machine, the number of units sold and the number of
years of operation before return of investment is achieved, are computed in the tables below. On
the computation, the cost of the machine and the daily operating expenses were taken into
account and are also listed below.
4.1.3.1 Existing Manually Operated Briquette Machine
The computations found on this section are based on for the manual briquetting
machine used by the Industrial Technology Development Institute of the Philippines’
Department of Energy (ITDI – DOST). These machines are used by some of the citizens in rural
areas of the country. These data were gathered from the paper of Bawagan (n.d.).
The briquettes made by ITDI – DOST were sold for Php 50.00 per kilogram. Based on
Bawagan (n.d.), the machine capacity is 2,500 kilograms of briquette in a month operation. The
machine operates 25 days a month at 8 hours per day. In their computation, the payback period
is 3.9 years or after selling 138,420 briquettes. The following expenses are summarized on the
following tables.

71
Table 4.7. Cost of the Machine
Equipment Price (in Php)
Drum type carbonizer 40,000.00
Gas engine operated hamermill crusher
(5 hp) 50,000.00
Manual type mixer 7,500.00
Manual type briquettor 20,000.00
LPG Stove Burner 1,500.00
Production Accessories 1,000.00
Total 120,000.00
The individual equipment needed in manual briquetting with their corresponding cost
are seen on Table 4.7. Since manual briquetting utilizes separate carbonizer, crusher, mixer and
press (briquettor), they all contribute to the expense of the machine.
Table 4.8. Daily Operation Expenses (in Php)
Cost/kg Total Cost
Materials 8.16 816.00
Direct Labor Cost 5 500.00
Factory Overhead
Fuel 0.19 19.00
Utilities 0.36 36.00
Packaging 0.78 78.00
Repairs & Maintenance* 0.04 4.00
Factory supplies 0.05 5.00
Total 14.58 1458.00
*Repairs and maintenance is assumed 1% of initial cost of equipment

72
In preparing the feedstock and in operating the machines needed in forming briquettes,
the electrical and material costs should also be taken note of. Materials such as the binder and
the biomass itself, labor costs for the machine operators, and other related fixed costs, were
identified for effective computation. And as seen on Table 4.8, the daily operating expense of a
manual briquette machine is Php 1,458.00.
4.1.3.2 Automated Briquette Machine
The expenses in manufacturing the experimental automated briquette machine were
tallied and are summarized in this section. From that list, the group canvassed the additional
expenses if the machine is to be used for mass production. The operating expenses such as the
electricity and the binder were also considered in computing for the payback period. The
expenses for both the experimental and the mass production machine are listed below.
4.1.3.2.1 Assumptions
In the computations, the following assumptions were used:
Table 4.9. Assumptions
1 briquette = approximately 70 grams 8 hours / day operation
(1 hour for binder preparation)
1 kg = 15 briquettes = 1 batch of
pressing 35 kg / day production
1 batch = 12 minutes,
thus 5 batches = 1 hour 25 days / month operation
The briquette weight was measured using a digital scale and found out to be
approximately 70 grams. The planned automated machine for mass production have 15 molds,
thus in one press / batch, 15 briquettes will be formed. Based on the experimental machine, it

73
takes 12 minutes for a batch to be formed, resulting to 5 batches formed in one hour. From these
values, the machine has an estimated 35 kg / day production.
Table 4.10. Cost of Machine (Experimental and for Mass Production)
Part Experimental Mass Production
Price Price
Machine Fabrication 68,000.00 150,000.00
Heating System 6,224.00 20,000.00
Pressure Switch 6,500.00 6,500.00
Pressure Gauge 500.00 500.00
Electrical appurtances (wires, switches, etc.) 3,000.00 3,000.00
Solenoid Valve - 8,000.00
Proximity Sensors - 2,400.00
PLC - 10,000.00
Total 84,224.00 200,400.00
All the expenses on the production of the experimental machine are tallied on the second
column. For the mass production machine, the expenses for the modification of the machine and
the purchase of the components that were only borrowed by the group from the University are
listed on the third column. It can be seen that the total cost of the experimental machine and the
mass production machine are Php 85,224.00 and Php 200,400.00, respectively.
4.1.3.2.2 Daily Operation Expenses
Table 4.11 Electrical Consumption
Part Power
Consumption (kW) kWh/day
PLC 0.08 0.64
Power Supply (3) 0.44 10.56
Heater 0.5 4.00
Motor 1 (3 hp) 2.2371 17.90

74
Motor 2 (0.5 hp) 0.37285 2.98
Electrical Stove 1 1.00
Blender 0.35 0.35
Total 4.98 37.43
Price per kwh Php 10.50
Electrical Consumption expenses / day Php 393.01
All the equipment that needs electricity are listed on Table 4.11 together with their
corresponding power rating. Multiplying with the amount of time they are used in a daily basis,
the electrical consumption of each equipment was identified. The price per kilowatt was based
on the average price in Metro Manila were the experimental machine is located.
Table 4.12. Biomass Preparation
Biomass-related expenses Consumption
(kg/day)
Unit Price (Php
/ kg)
Price
(in Php)
Biomass (Php 30/ 20 kg sack) 40 1.5 60.00
Starch (Php 45.00 / kg) 21 45 945.00
Water (Php 0.028 / liter) 60 0.028 1.68
Total 121 46.53 1,006.68
For the experimentations done in this study, a sack of rice hull and starch were
purchased. Based on the amount of binder used in every experiment and the price of each
ingredient, the cost of the feedstock per day was identified.

75
Table 4.13. Summary of Operating Expenses per day
Consumption Price (in Php)
Electricity 393.01
Biomass-related 1,006.68
Total 1,399.69
From Tables 4.11 and 4.12, the summary of the total expenses in the daily production of
briquettes are found. These values are based on actual experiments conducted by the group.
4.1.3.2.3 Return of Investment Computation (Daily Operation Basis)
Production = 35 kg / day
Selling Price = Php 50.00 / kg (same with the existing manual briquette machine)
Capital (Equipment Expenses) Php 170,400.00
Gross Income
1,750.00
Daily Operating Expenses
(1,399.69)
Net Income Php 350.31
Thus,
In the case that a mass production machine is fabricated based on the existing
experimental machine, the ROI of that machine is estimated to be achieved after 1.91 years or
after selling 300, 334.68 briquettes.
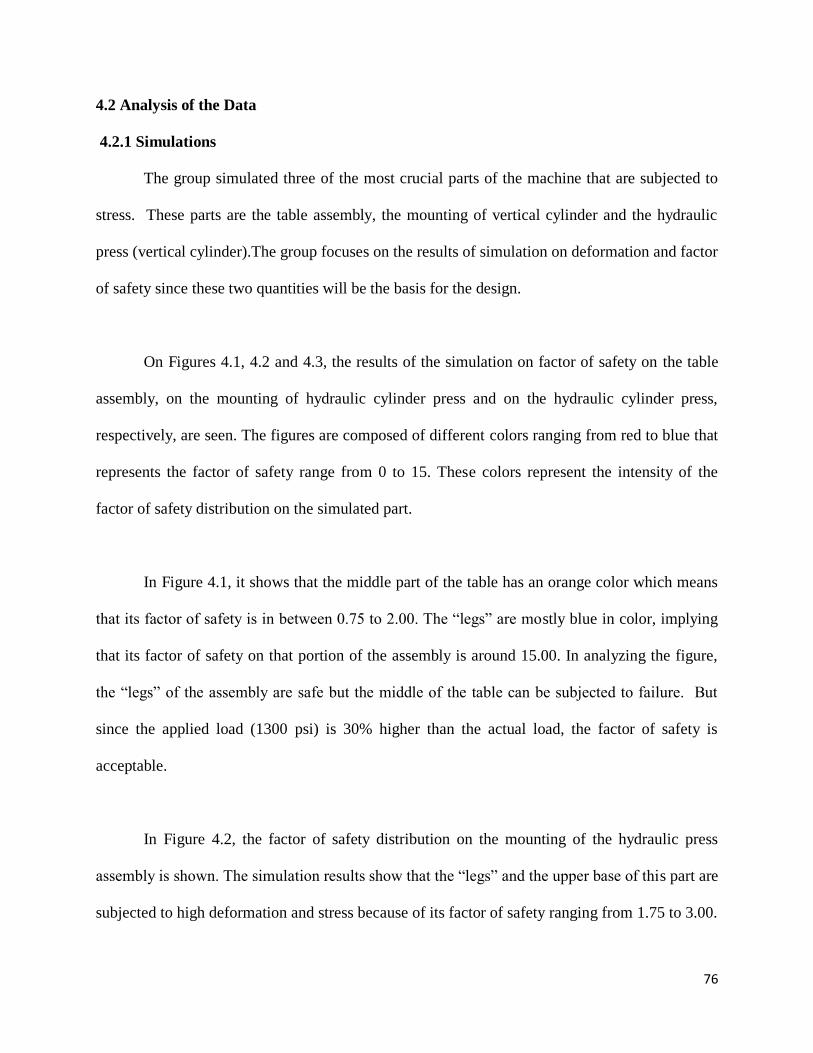
76
4.2 Analysis of the Data
4.2.1 Simulations
The group simulated three of the most crucial parts of the machine that are subjected to
stress. These parts are the table assembly, the mounting of vertical cylinder and the hydraulic
press (vertical cylinder).The group focuses on the results of simulation on deformation and factor
of safety since these two quantities will be the basis for the design.
On Figures 4.1, 4.2 and 4.3, the results of the simulation on factor of safety on the table
assembly, on the mounting of hydraulic cylinder press and on the hydraulic cylinder press,
respectively, are seen. The figures are composed of different colors ranging from red to blue that
represents the factor of safety range from 0 to 15. These colors represent the intensity of the
factor of safety distribution on the simulated part.
In Figure 4.1, it shows that the middle part of the table has an orange color which means
that its factor of safety is in between 0.75 to 2.00. The “legs” are mostly blue in color, implying
that its factor of safety on that portion of the assembly is around 15.00. In analyzing the figure,
the “legs” of the assembly are safe but the middle of the table can be subjected to failure. But
since the applied load (1300 psi) is 30% higher than the actual load, the factor of safety is
acceptable.
In Figure 4.2, the factor of safety distribution on the mounting of the hydraulic press
assembly is shown. The simulation results show that the “legs” and the upper base of this part are
subjected to high deformation and stress because of its factor of safety ranging from 1.75 to 3.00.

77
However, as mentioned earlier, the applied load is also 30% higher to the actual load, thus, this
factor of safety is acceptable.
In Figure 4.3, this figure shows the simulation on the casing of the hydraulic press. Based
on the simulation results, the component has a high factor of safety ranging from 5.00 to 8.50.
these figures indicate that the component has a low chance of failing. The results of the
simulations done by the group are shown below while detailed report can be seen on Appendices
C, D & E.
4.2.2 Machine Operation
4.2.2.1 Heating System
Based on Table 4.3 it can be seen that the percentage differences between temperature set
on the temperature controller and the reading from the pocket thermocouple, is within the
tolerance range of ± 10%. After three trials, the average temperature was taken and compared
with the designated temperature on the controller to compute for the percentage differences. As
seen, only at one time was the fluctuation over 10 %, at the 30° C reading. This can be attributed
to the surrounding temperature where the experiments were conducted. Since most of the
experiments were done on the months of May and June 2012 when the weather once reached
over 35° C, the band heater had a hard time keeping the temperature down to 30 ° C. Also,
eighteen out of the twenty eight readings has almost negligible percentage difference, less than 1
%. It shows that the heating system provides effectively the amount of temperature it is tasked to
provide.

78
For the time needed to reach a certain temperature, the group monitored it using a
stopwatch at every increment. During the experimentations, at the beginning of operation, it was
observed that there is an offshoot of around 10-12 % but stabilizes after around four minutes, as
seen on Table 4.4. On the two trials, the time was taken at every 10 °C and it can be observed
that it takes approximately two minutes. But when it reaches around 180 °C, the time
requirement decreases to one and a half minutes until it reaches 250 °C, wherein only a minute is
needed. In addition, the group also tried varying the increase in temperature. As seen on the
Table 4.4, at Trial 2, from 60 °C to 130 °C and 150 °C to 190 °C, it also takes around two
minutes - same as when the temperature is increased by just 10 °C. This signifies that regardless
of how much the temperature is increased, it needs only a maximum of around two minutes. It
indicates that the heater should be turned on at least four minutes before the operation (even
during binder preparation), to reduce idle time. Moreover, it was examined that as the
temperature increases, the offshoot decreases, thus resulting to shorter stabilization period.
As expressed on the Methodology part of this study, the production of briquette requires
a preheating of approximately twenty minutes, before pressing. This is to compensate the
carbonization process which minimizes moisture and increases the briquette’s heating value,
done in manual briquetting, as discussed by Bawagan (n.d.). The length of preheating was
identified through several trials, ranging from no preheating at all to 30 minutes. Below 20
minutes of preheating produces moist briquettes that deforms quickly upon removal from the
mold while more than 20 minutes makes the briquette too dry and more difficult to press.
79
It should also be taken note that the temperature readings on Table 4.3 are that emitted by
the band heater and not what the biomass actually receives. It is because of the width of the
mold that traps the heat, reducing the actual temperature that reaches the biomass. The
experimentations done by the group verified that the temperature set and displayed in the
temperature controller is really what the band heater emits.
4.2.2.2 Pressure System
Through the convention assigned by the group, it can be seen that the percentage
differences between the average pressure readings from the two gauges and the set pressure of
the pressure switch, meet the tolerance level of ± 10%. Also, based on the experimentations, it
was learned that a minimum of 25 kgf / cm2 is needed to move the horizontal cylinder and 55 kgf
/ cm2, for the vertical cylinder. These operating pressures set the pressing pressure to a range of
55 to 95 25 kgf / cm2.
Another factor that affects the pressure readings was the method used to record them.
The group recorded the pressure gauges using a digital camera and phone cameras. After the
machine operation, the pressure readings were taken by the group members as the videos were
watched. Even though the videos were repeatedly watched before taking note of the pressure,
human error can still play a part on this aspect of the study.
Lastly, it can be seen that at S3, the pressure switch sets only at around 73 kgf / cm2,
though it should be at 85 kgf / cm2, following the convention set by the group. However, at W4,
the pressure abruptly increases to approximately 85 kgf / cm2, which is within the tolerance range

80
set by the group but breaking the 5 kgf / cm2 increment convention. This can be attributed to a
malfunctioning dial or to a not-well-distributed pressure increment of the pressure switch, since
at N4, the pressure on the pressure switch corresponds again to those on the pressure gauges.
4.2.2.3 Briquette Formation
On Table 4.6, the minimum and maximum pressure and temperature needed to form
briquettes are identified. It shows that at least 200 °C and 80 kgf / cm2 is needed to form
briquettes that will not crumble upon removal from the mold. From the experimentations of the
group, it was found out that if the temperature or the pressure is less than 200 °C or 80 kgf / cm2,
the briquette cannot withstand the force applied to remove it from the mold – it instantly crushes
upon removal. On the other hand, if the temperature and the pressure are increased above the
minimum, less air / sun drying needed; it do not make the briquette stick to the mold or more
difficult to remove.
4.2.3 Economic Evaluation
Taking into account the machine expenses and the machine daily operation expenses such
as rice hull and binder prices and electrical consumption, it was computed that the return of
investment (ROI) will be achieved after approximately 2 years, more than a year shorter than that
of the manual machine (Bawagan n.d.), with the same selling price of Php 50.00 / kilogram.
This may be attributed to the relatively large initial expense needed for manual machines since it
requires a separate individual equipments such as the carbonizer.
For the mass production automated machine, it can be seen that a capital of
approximately Php 200,000.00 is needed, same as with the manual machine. Even though less
81
briquettes are produced in the automated machine, since it weighs more less briquettes are
needed for the per kilo selling. However, since different types of biomass and binders have
different weights, this can vary. Also, the prices may vary based on the time of machine
production and project implementation.
4.2.4 Overall Machine Performance
The automated machine prototype that was made for this study is able to adjust pressure
and temperature more accurately and through automated means. The temperature could be
adjusted by pressing buttons on the control panel while the pressure could be adjusted through a
knob attached to a switch. Also, the machine operation was done with the use of buttons and
switches; thus, allowing the user to operate the machine even at a distance from it. When a
problem arises, the operator would be not affected directly and an emergency stop button could
be triggered to stop the operation.
For all the parameters set by the group, the values obtained during experimentations were
within the 10% tolerance range. This implies that the machine is accurate and is effective in
giving off the pressure and temperature desired for the operation. Moreover, due to the manual
and automatic operating options of the machine, it gives the machine its versatility. In the
manual setting, the operator could control the hydraulic system, i.e. movement of the cylindrical
mold and briquetting operation, using a toggle switch made into a joystick. In the automatic
setting, on the other hand, the machine could be left to operate in itself according to set program
until the very last step of the operation.

82
4.3 Conclusion
From the experiments done and the data gathered, it can be justified that the group
achieved the objectives of this study. A small-scale automated briquette machine was designed
and fabricated that can produce briquettes automatically, without human interference, upon the
loading of the feedstock. Along with that, the primary operating parameters, the temperature and
the pressure, can be varied through the control system utilized in the machine. These parameters
can be observed through the gauges and the display screen, allowing the user to easily monitor
the changes in the machine. Also, the accuracy of the heating and the pressure system were
validated repetitively during several trials. These were done with the use of two pressure gauges
and a pocket thermocouple that simultaneously takes readings. After the experimentation, it was
computed that the data gathered complies with the set tolerance level.
With the PLC serving as the heart of this control system, variations in the relationship of
the inputs and outputs in this machine are done through changes in the program; not through
repetitive wiring. Since it also has access to the primary parts of the machine, immediate
shutdown can be done, in case uncertain circumstances arise.
Using the economic evaluation done on the machine, it can be observed where the bulk of
the expenses were spent at, allowing further studies to minimize the cost. By doing that, the aim
of using an automated briquette machine for mass production, is a step closer to realization.
Lastly, this dissertation promotes further studies on the use of biomasses to supply part of the
country’s energy needs with high quality briquettes. This machine can help in understanding
deeper the different characteristics of briquettes, optimizing their use. It hopes to enlighten the

83
path to more researches and to maximize the potential into this overlooked capability of our
agro-wastes.

84
BIBLIOGRAPHY
Baconguis, Santiago R. (2007). Abandoned Biomass Resource Statistics in the Philippines.
Retrieved March 05, 2011 from
http://www.nscb.gov.ph/ncs/10thNCS/papers/invited%20papers/ips-20/ips20-03.pdf.
bdeee2_1.aspx
Bawagan, A. (n.d.). Village Level Charcoal Briquetting [(Powerpoint slides].
Bolton, W. (2009). Programmable Logic Controllers. Retrieved June 01, 2012 from:
http://books.google.com.ph/books?id=_qC6mlaiXF4C&printsec=frontcover&dq=progra
mmable+logic+controller&hl=en&sa=X&ei=p7a7T-
a1HqLUmAWzobWiCQ&sqi=2&redir_esc=y#v=onepage&q=programmable%20logic%
20controller&f=false
Cheremisinoff, N., Cheremisinoff, P., & Ellerbusch, F. (1980). Biomass:Applications,
Technology, and Production. New York, USA: Marcel Dekker, Inc.
Daiwey, A. S., Rotaquio, E. Jr. L., Angara, E. V. (2010). Charcoal Briquetting Technology in the
Province of Aurora, Philippines. ASCOT International Journal, 3. Retrieved from
http://ascot.edu.ph/research/2010/12/charcoal-briquetting-technology-in-the-province-of-
aurora-philippines-2/
Delta Electronics, Inc. (2006). DVP - EH2 Instructional sheet. Retrieved July 8, 2012, from
http://www.delta.com.tw/product/em/control/plc/download/manual/DVP-
EH2_manual_en.pdf
Department of Energy. (2011a). Renewable Energy. Retrieved February 19, 2011 from
http://www.doe.gov.ph/ER/Renenergy.htm.

85
Department of Energy. (2011b). Renewable Energy: Biomass, Solar, Wind and Ocean. Retrieved
February 19, 2011 from http://www.doe.gov.ph/ER/BioOSW.htm.
Fule, C., Go, K., Hua, J., Rabby M, & Tan, I. (2010). Automated Briquetting Machine.
(Undergraduate Dissertation). De La Salle University, Manila, Philippines.
Grover, P.D. & Mishra S.K. (1996). Biomass Briquetting: Technology and Practices. Regional
Wood Energy Development Programme In Asia GCP/RAS/154/NET. Retrieved February
24, 2010 from http://wgbis.ces.iisc.ernet.in/energy/HC270799/RWEDP/acrobat/fd46.pdf
Industrial Hydraulic Services, Inc. (2007). Fluid Power Formulas. Retrieved June 15, 2012 from
http://www.ihservice.com/PDF's/Fluid%20Power%20Formulas.pdf
Kaliyan, Nalladurai & Morey, Vance R. (2009). Factors affecting strength and durability of
densified biomass products. Biomass and Bioenergy, 33, 337-359.
doi:10.1016/j.biombioe.2008.08.005
Khan, Q.S. (n.d). Design and Manufacturing of Hydraulic Cylinder. Retrieved from
http://www.scribd.com/doc/17375627/Volume2-Design-and-Manufacturing-of-
Hydraulic-Cylinders
Maglaya, A.B. & Biona, J.B.M. (2010). Combustion Properties, Performance And Net Energy
Benefits Of Jatropha Bio-Coals Briquettes.
Omron Corporation. (2008). Solid State Relay G3F / G3FD. Retrieved July 8, 2012, from
http://www.ia.omron.com/data_pdf/data_sheet/g3f_g3fd_dsheet_csm153.pdf
Penton. (2011a). AC Motor – Basics of AC Motor Design Engineering. Retrieved March 05,
2011 from http://www.electricmotors.machinedesign.com/guiEdits/Content/bdeee2/
Ramsdale, R. (2006). Reference Tables: Fluid Power Formulas. Retrieved March 22, 2011 from
http://www.engineershandbook.com/Tables/fluidpowerformulas.htm

86
Rockis & Mazur. (2007). Motor Formulas. Retrieved March 21, 2011 from http://www.elec-
toolbox.com/Formulas/Motor/mtrform.htm
RUF Briquetting Machinery. (2008). Automated Briquetting Plant [Video file]. Retrieved from
http://www.youtube.com/watch?v=je48_bqJu04
Sing, Didar & Kashyap, M.M. (1985). Mechanical and Combustion Characteristics of Paddy
Husk Briquettes. Agricultural Wastes, 13, 189-196. doi:10.1016/0141-4607(85)90033-2.
wisegeek.com/what-are-pressure-sensors.htm. n.d. What are Pressure Sensors?
wisegeek.com/what-is-a-briquette.htm. n.d. What is Briquette?

87
APPENDIX A
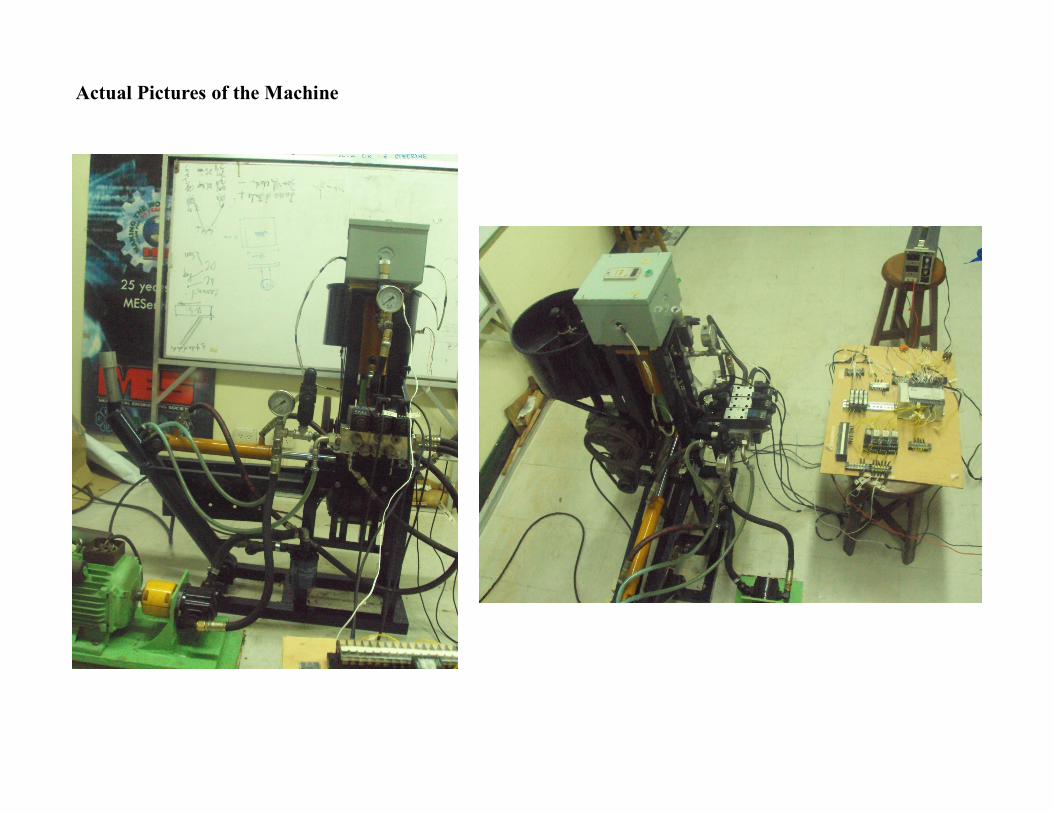
Actual Pictures of the Machine

Mixing Chamber / Hopper
Motor and Pulleys
Mixing Chamber

Heating System
Band Heater
Temperature controller

Hydraulic System
Horizontal Hydraulic Cylinder
Band Heater
Pump and Motor

Hydraulic System
Pressure switch Pressure gauge

Controls System
Controls connection and control panel
Programmable Logic Controller
Solenoid valves

94
APPENDIX B

18
10
20
1
2
5
7
6
4
9
3
14
12
15
13
11
16
17
19
8
21
July 10, 2012
mmUnits
QTYDRW NO
Revised
Date
Approved by
Designed by
MATRL
SCALEPART NO
Dr. Alvin Chua
T.GuanlaoTHESIS Drawn by
Assembly Name:
T.Guanlao, R.Guting, A.Gatmaitan, C.Janairo
De La SalleUniversity
Part Name:
11
x Briquetting Machine Assembly
n/a
1:8
n/a
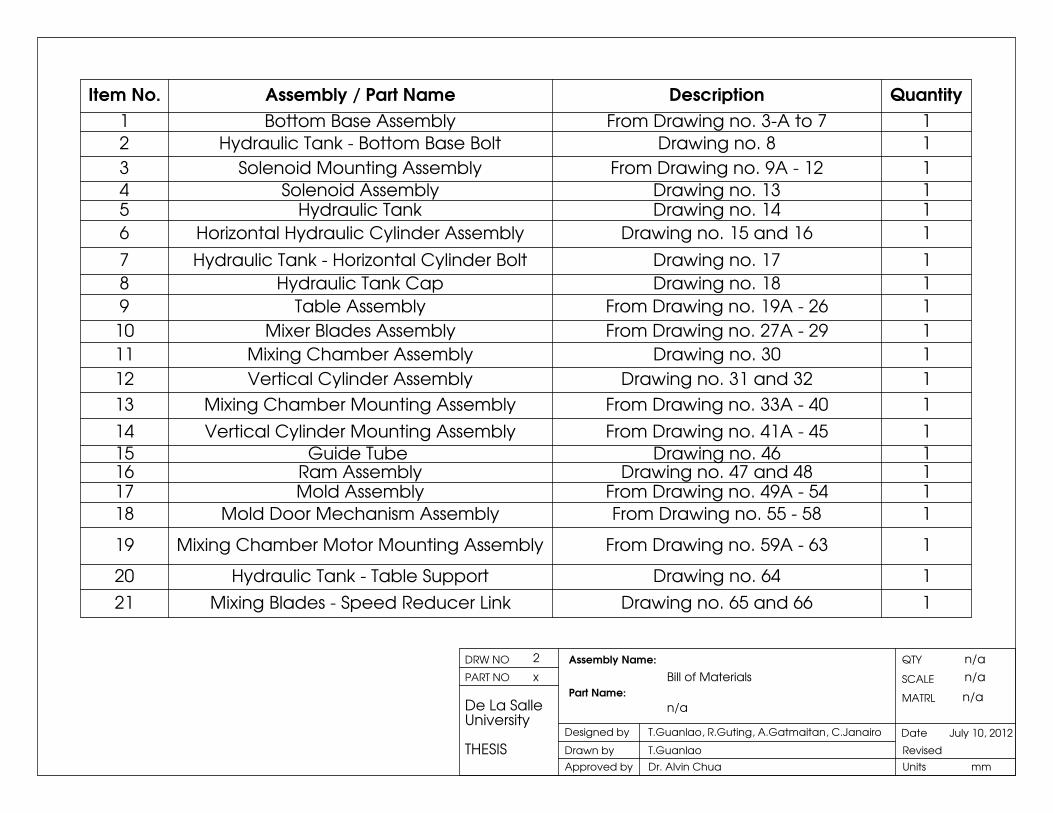
2
x Bill of Materials
n/a
n/a
n/a
n/a
Item No. Assembly / Part Name Description Quantity
1 Bottom Base Assembly From Drawing no. 3-A to 7 1
2 Hydraulic Tank - Bottom Base Bolt Drawing no. 8 1
3 Solenoid Mounting Assembly From Drawing no. 9A - 12 1
4 Solenoid Assembly Drawing no. 13 15 Hydraulic Tank Drawing no. 14 1
6 Horizontal Hydraulic Cylinder Assembly Drawing no. 15 and 16 1
7 Hydraulic Tank - Horizontal Cylinder Bolt Drawing no. 17 1
8 Hydraulic Tank Cap Drawing no. 18 1
9 Table Assembly From Drawing no. 19A - 26 1
10 Mixer Blades Assembly From Drawing no. 27A - 29 1
11 Mixing Chamber Assembly Drawing no. 30 1
12 Vertical Cylinder Assembly Drawing no. 31 and 32 1
13 Mixing Chamber Mounting Assembly From Drawing no. 33A - 40 1
14 Vertical Cylinder Mounting Assembly From Drawing no. 41A - 45 1
15 Guide Tube Drawing no. 46 116 Ram Assembly Drawing no. 47 and 48 117 Mold Assembly From Drawing no. 49A - 54 1
18 Mold Door Mechanism Assembly From Drawing no. 55 - 58 1
19 Mixing Chamber Motor Mounting Assembly From Drawing no. 59A - 63 1
20 Hydraulic Tank - Table Support Drawing no. 64 1
21 Mixing Blades - Speed Reducer Link Drawing no. 65 and 66 1
mmUnits
QTYDRW NO
Revised
Date
Approved by
Designed by
MATRL
SCALEPART NO
De La SalleUniversity
THESIS Drawn by
Assembly Name:
T.Guanlao, R.Guting, A.Gatmaitan, C.Janairo
T.Guanlao
Dr. Alvin Chua
July 10, 2012
Part Name:

97
APPENDIX C

Development of an Automated Briquette Machine De La Salle University
Analyzed with SolidWorks Simulation Simulation of Briquette Machine v1.4 - Table Assembly
Simulation of Briquette Machine v1.4 - Table Assembly Date: Tuesday, July 10, 2012 Designer: A. Gatmaitan, T. Guanlao, R. Guting,
C. Janairo Study name:1300 Analysis type:Static
Table of Contents Description ............................................ 1
Assumptions .......................................... 2
Model Information ................................... 2
Study Properties ..................................... 5
Units ................................................... 5
Material Properties .................................. 6
Loads and Fixtures................................... 7
Connector Definitions ............................... 8
Contact Information ............................... 10
Mesh Information .................................. 11
Resultant Forces ................................... 12
Study Results ....................................... 13
Description Framework of the briquette machine which will hold most of the machine parts such as the hydraulic cylinder, solenoid valves, and gauges.

De La Salle University
A. Gatmaitan, T. Guanlao, R. Guting, C. Janairo 7/10/2012
Analyzed with SolidWorks Simulation Simulation of Briquette Machine v1.4 - Table
Assembly
Assumptions
Original Model
Model Analyzed
Model Information
Model name: Briquette Machine v1.4 - Table Assembly
Current Configuration: Default<As Machined>
Solid Bodies

De La Salle University
A. Gatmaitan, T. Guanlao, R. Guting, C. Janairo 7/10/2012
Analyzed with SolidWorks Simulation Simulation of Briquette Machine v1.4 - Table
Assembly
Document Name and Reference
Treated As Volumetric Properties Document Path/Date
Modified
Cut-Extrude7
Solid Body
Mass:0.300489 kg Volume:3.80366e-005 m^3
Density:7900 kg/m^3
Weight:2.94479 N
F:\School Files\THESIS\Machine Essentials\Briquette Machine Design v1.4
(Final)\Briquette Machine v1.4 - Table
Assembly.SLDPRT Jul 10 12:56:22 2012
Cut-Extrude1[1]
Solid Body
Mass:0.524166 kg Volume:6.63501e-005 m^3
Density:7900 kg/m^3 Weight:5.13682 N
F:\School Files\THESIS\Machine Essentials\Briquette Machine Design v1.4
(Final)\Briquette Machine v1.4 - Table
Assembly.SLDPRT Jul 10 12:56:22 2012
Cut-Extrude1[2]
Solid Body
Mass:0.524166 kg Volume:6.63501e-005 m^3
Density:7900 kg/m^3 Weight:5.13682 N
F:\School Files\THESIS\Machine Essentials\Briquette Machine Design v1.4
(Final)\Briquette Machine v1.4 - Table
Assembly.SLDPRT Jul 10 12:56:22 2012
Cut-Extrude3[1]
Solid Body
Mass:0.307993 kg
Volume:3.89864e-005 m^3 Density:7900 kg/m^3
Weight:3.01833 N
F:\School Files\THESIS\Machine Essentials\Briquette Machine Design v1.4
(Final)\Briquette Machine v1.4 - Table
Assembly.SLDPRT Jul 10 12:56:22 2012
Cut-Extrude6[1]
Solid Body
Mass:0.707603 kg Volume:8.957e-005 m^3
Density:7900 kg/m^3 Weight:6.93451 N
F:\School Files\THESIS\Machine Essentials\Briquette Machine Design v1.4
(Final)\Briquette Machine v1.4 - Table
Assembly.SLDPRT Jul 10 12:56:22 2012
Trim/Extend1[2]
Solid Body
Mass:0.71044 kg Volume:8.99291e-005 m^3
Density:7900 kg/m^3 Weight:6.96231 N
F:\School Files\THESIS\Machine Essentials\Briquette Machine Design v1.4
(Final)\Briquette Machine v1.4 - Table
Assembly.SLDPRT Jul 10 12:56:22 2012

De La Salle University
A. Gatmaitan, T. Guanlao, R. Guting, C. Janairo 7/10/2012
Analyzed with SolidWorks Simulation Simulation of Briquette Machine v1.4 - Table
Assembly
Cut-Extrude6[2]
Solid Body
Mass:0.705633 kg Volume:8.93207e-005 m^3
Density:7900 kg/m^3 Weight:6.91521 N
F:\School Files\THESIS\Machine Essentials\Briquette Machine Design v1.4
(Final)\Briquette Machine v1.4 - Table
Assembly.SLDPRT Jul 10 12:56:22 2012
Cut-Extrude3[3]
Solid Body
Mass:0.70847 kg Volume:8.96798e-005 m^3
Density:7900 kg/m^3 Weight:6.94301 N
F:\School Files\THESIS\Machine Essentials\Briquette Machine Design v1.4
(Final)\Briquette Machine v1.4 - Table
Assembly.SLDPRT Jul 10 12:56:22 2012
Split Line1
Solid Body
Mass:4.37645 kg Volume:0.000553981 m^3
Density:7900 kg/m^3 Weight:42.8892 N
F:\School Files\THESIS\Machine Essentials\Briquette Machine Design v1.4
(Final)\Briquette Machine
v1.4 - Table Assembly.SLDPRT
Jul 10 12:56:22 2012

De La Salle University
A. Gatmaitan, T. Guanlao, R. Guting, C. Janairo 7/10/2012
Analyzed with SolidWorks Simulation Simulation of Briquette Machine v1.4 - Table
Assembly
Study Properties Study name 1300
Analysis type Static
Mesh type Solid Mesh
Thermal Effect: On
Thermal option Include temperature loads
Zero strain temperature 298 Kelvin
Include fluid pressure effects from SolidWorks Flow Simulation
Off
Solver type Direct sparse solver
Inplane Effect: Off
Soft Spring: Off
Inertial Relief: Off
Incompatible bonding options Automatic
Large displacement Off
Compute free body forces On
Friction Off
Use Adaptive Method: Off
Result folder SolidWorks document (F:\School Files\THESIS\Machine Essentials\Briquette Machine Design v1.4 (Final))
Units Unit system: SI (MKS)
Length/Displacement mm
Temperature Kelvin
Angular velocity Rad/sec
Pressure/Stress N/m^2

De La Salle University
A. Gatmaitan, T. Guanlao, R. Guting, C. Janairo 7/10/2012
Analyzed with SolidWorks Simulation Simulation of Briquette Machine v1.4 - Table
Assembly
Material Properties
Model Reference Properties Components
Name: AISI 1020 Model type: Linear Elastic Isotropic
Default failure criterion:
Max von Mises Stress
Yield strength: 3.51571e+008 N/m^2 Tensile strength: 4.20507e+008 N/m^2 Elastic modulus: 2e+011 N/m^2 Poisson's ratio: 0.29
Mass density: 7900 kg/m^3 Shear modulus: 7.7e+010 N/m^2
Thermal expansion coefficient:
1.5e-005 /Kelvin
SolidBody 7(Cut-Extrude7)(Briquette Machine v1.4 - Table Assembly), SolidBody 8(Cut-Extrude1[1])(Briquette Machine v1.4 - Table Assembly), SolidBody 9(Cut-Extrude1[2])(Briquette Machine v1.4 - Table Assembly), SolidBody 10(Cut-Extrude3[1])(Briquette Machine v1.4 - Table
Assembly), SolidBody 11(Cut-Extrude6[1])(Briquette Machine v1.4 - Table Assembly), SolidBody 12(Trim/Extend1[2])(Briquette Machine v1.4 - Table Assembly), SolidBody 13(Cut-Extrude6[2])(Briquette Machine v1.4 - Table Assembly), SolidBody 14(Cut-Extrude3[3])(Briquette Machine v1.4 - Table Assembly), SolidBody 15(Split
Line1)(Briquette Machine v1.4 - Table Assembly)
Curve Data:N/A

De La Salle University
A. Gatmaitan, T. Guanlao, R. Guting, C. Janairo 7/10/2012
Analyzed with SolidWorks Simulation Simulation of Briquette Machine v1.4 - Table
Assembly
Loads and Fixtures
Fixture name Fixture Image Fixture Details
Fixed-1
Entities: 4 face(s) Type: Fixed Geometry
Resultant Forces Components X Y Z Resultant
Reaction force(N) 0.000152588 17595.3 -0.000150681 17595.3
Reaction Moment(N-m) 0 0 0 0
Load name Load Image Load Details
Pressure-1
Entities: 1 face(s) Type: Normal to selected face
Value: 1300 Units: psi
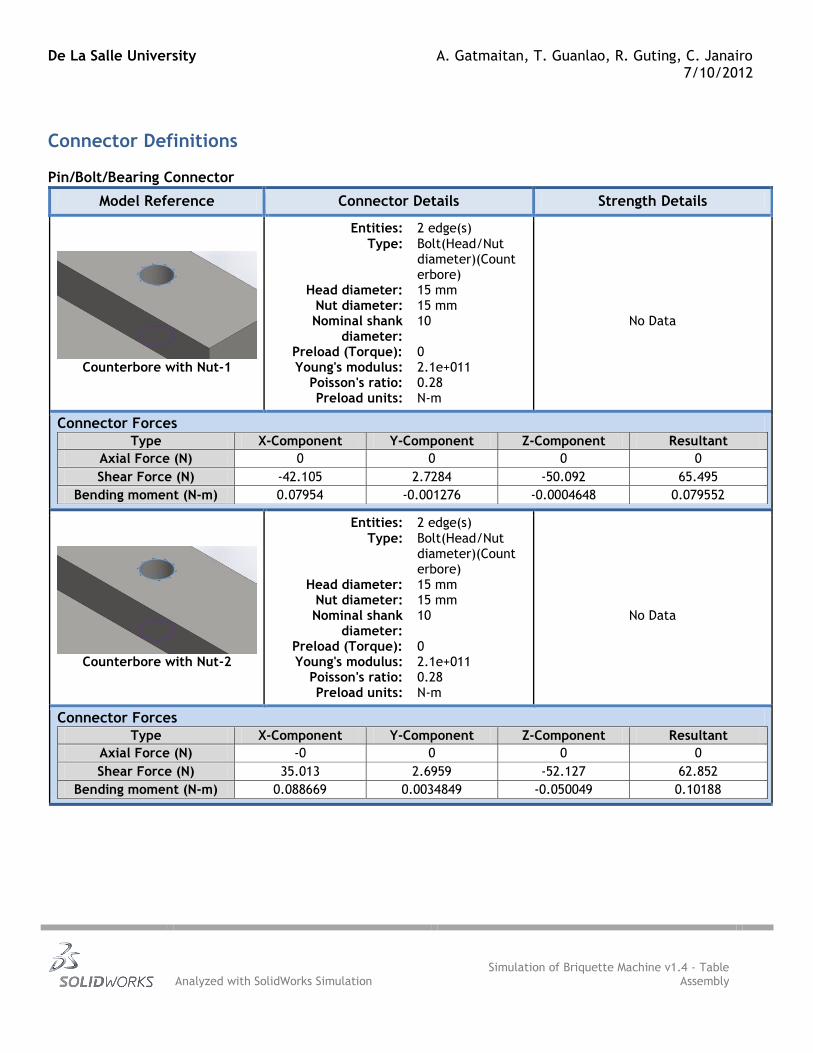
De La Salle University
A. Gatmaitan, T. Guanlao, R. Guting, C. Janairo 7/10/2012
Analyzed with SolidWorks Simulation Simulation of Briquette Machine v1.4 - Table
Assembly
Connector Definitions Pin/Bolt/Bearing Connector
Model Reference Connector Details Strength Details
Counterbore with Nut-1
Entities: 2 edge(s)
Type: Bolt(Head/Nut diameter)(Counterbore)
Head diameter: 15 mm Nut diameter: 15 mm Nominal shank
diameter: 10
Preload (Torque): 0 Young's modulus: 2.1e+011
Poisson's ratio: 0.28 Preload units: N-m
No Data
Connector Forces
Type X-Component Y-Component Z-Component Resultant
Axial Force (N) 0 0 0 0
Shear Force (N) -42.105 2.7284 -50.092 65.495
Bending moment (N-m) 0.07954 -0.001276 -0.0004648 0.079552
Counterbore with Nut-2
Entities: 2 edge(s)
Type: Bolt(Head/Nut diameter)(Counterbore)
Head diameter: 15 mm Nut diameter: 15 mm Nominal shank
diameter: 10
Preload (Torque): 0 Young's modulus: 2.1e+011
Poisson's ratio: 0.28 Preload units: N-m
No Data
Connector Forces
Type X-Component Y-Component Z-Component Resultant
Axial Force (N) -0 0 0 0
Shear Force (N) 35.013 2.6959 -52.127 62.852
Bending moment (N-m) 0.088669 0.0034849 -0.050049 0.10188

De La Salle University
A. Gatmaitan, T. Guanlao, R. Guting, C. Janairo 7/10/2012
Analyzed with SolidWorks Simulation Simulation of Briquette Machine v1.4 - Table
Assembly
Counterbore with Nut-3
Entities: 2 edge(s) Type: Bolt(Head/Nut
diameter)(Count
erbore) Head diameter: 15 mm
Nut diameter: 15 mm Nominal shank
diameter: 10
Preload (Torque): 0 Young's modulus: 2.1e+011
Poisson's ratio: 0.28 Preload units: N-m
No Data
Connector Forces
Type X-Component Y-Component Z-Component Resultant
Axial Force (N) -0 0 -0 0
Shear Force (N) 44.663 3.0235 56.643 72.197
Bending moment (N-m) -0.17301 0.0004309 0.080116 0.19066
Counterbore with Nut-4
Entities: 2 edge(s) Type: Bolt(Head/Nut
diameter)(Count
erbore) Head diameter: 15 mm
Nut diameter: 15 mm Nominal shank
diameter: 10
Preload (Torque): 0 Young's modulus: 2.1e+011
Poisson's ratio: 0.28 Preload units: N-m
No Data
Connector Forces
Type X-Component Y-Component Z-Component Resultant
Axial Force (N) 0 0 -0 0
Shear Force (N) -40.313 2.8815 54.889 68.164
Bending moment (N-m) -0.13759 0.00063086 -0.039696 0.1432

De La Salle University
A. Gatmaitan, T. Guanlao, R. Guting, C. Janairo 7/10/2012
Analyzed with SolidWorks Simulation Simulation of Briquette Machine v1.4 - Table
Assembly
Contact Information
Contact Contact Image Contact Properties
Component Contact-1
Type: Bonded Components: 8 Solid Body (s)
Options: Compatible mesh
Component Contact-2
Type: Bonded Components: 5 Solid Body (s)
Options: Compatible mesh

De La Salle University
A. Gatmaitan, T. Guanlao, R. Guting, C. Janairo 7/10/2012
Analyzed with SolidWorks Simulation Simulation of Briquette Machine v1.4 - Table
Assembly
Mesh Information Mesh type Solid Mesh
Mesher Used: Standard mesh
Automatic Transition: Off
Include Mesh Auto Loops: Off
Jacobian points 4 Points
Element Size 14.3001 mm
Tolerance 0.715006 mm
Mesh Quality High
Mesh Information - Details
Total Nodes 20905
Total Elements 10546
Maximum Aspect Ratio 22.476
% of elements with Aspect Ratio < 3 39.6
% of elements with Aspect Ratio > 10 1.56
% of distorted elements(Jacobian) 0
Time to complete mesh(hh;mm;ss): 00:00:20
Computer name: TRISTAN-PC

De La Salle University
A. Gatmaitan, T. Guanlao, R. Guting, C. Janairo 7/10/2012
Analyzed with SolidWorks Simulation Simulation of Briquette Machine v1.4 - Table
Assembly
Resultant Forces
Reaction Forces
Selection set Units Sum X Sum Y Sum Z Resultant
Entire Model N 0.000152588 17595.3 -0.000150681 17595.3
Reaction Moments
Selection set Units Sum X Sum Y Sum Z Resultant
Entire Model N-m 0 0 0 0
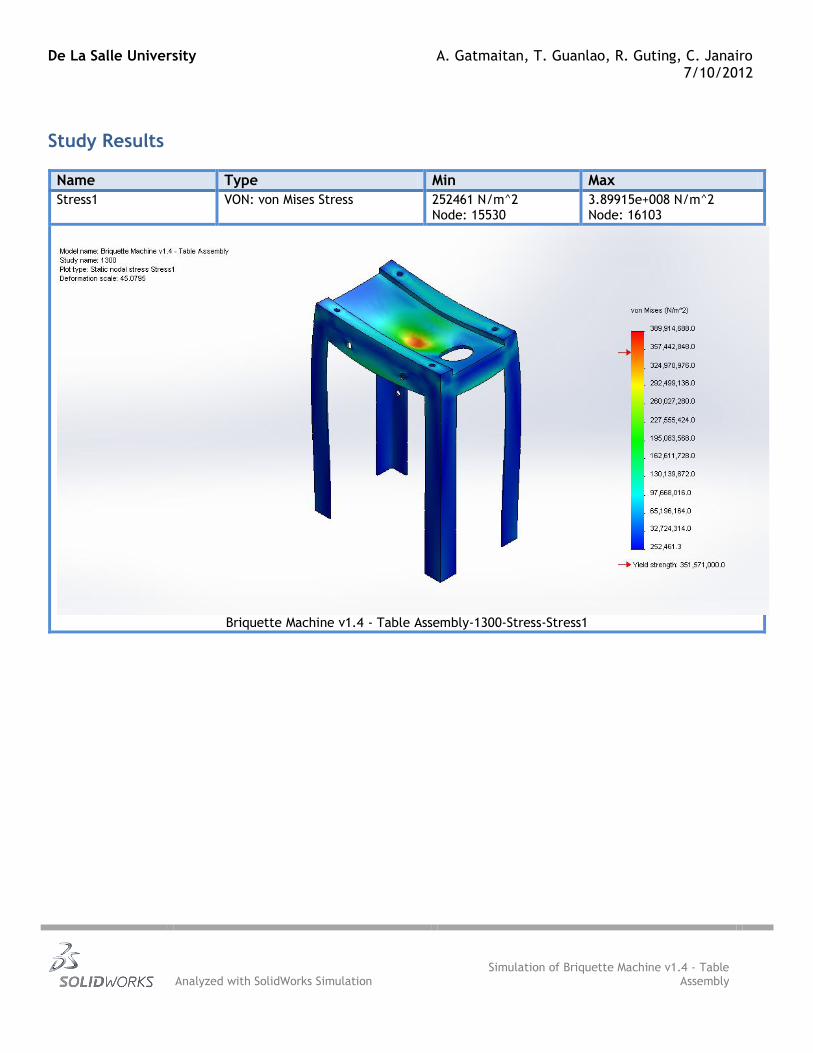
De La Salle University
A. Gatmaitan, T. Guanlao, R. Guting, C. Janairo 7/10/2012
Analyzed with SolidWorks Simulation Simulation of Briquette Machine v1.4 - Table
Assembly
Study Results
Name Type Min Max
Stress1 VON: von Mises Stress 252461 N/m^2 Node: 15530
3.89915e+008 N/m^2 Node: 16103
Briquette Machine v1.4 - Table Assembly-1300-Stress-Stress1

De La Salle University
A. Gatmaitan, T. Guanlao, R. Guting, C. Janairo 7/10/2012
Analyzed with SolidWorks Simulation Simulation of Briquette Machine v1.4 - Table
Assembly
Name Type Min Max
Displacement1 URES: Resultant Displacement 0 mm Node: 6694
0.98271 mm Node: 16103
Briquette Machine v1.4 - Table Assembly-1300-Displacement-Displacement1

De La Salle University
A. Gatmaitan, T. Guanlao, R. Guting, C. Janairo 7/10/2012
Analyzed with SolidWorks Simulation Simulation of Briquette Machine v1.4 - Table
Assembly
Name Type Min Max
Strain1 ESTRN: Equivalent Strain 2.44593e-006 Element: 6868
0.000835919 Element: 10021
Briquette Machine v1.4 - Table Assembly-1300-Strain-Strain1

De La Salle University
A. Gatmaitan, T. Guanlao, R. Guting, C. Janairo 7/10/2012
Analyzed with SolidWorks Simulation Simulation of Briquette Machine v1.4 - Table
Assembly
Name Type Min Max
Factor of Safety1 Automatic 0.901661 Node: 16103
1392.57 Node: 15530
Briquette Machine v1.4 - Table Assembly-1300-Factor of Safety-Factor of Safety1

114
APPENDIX D

Development of an Automated Briquette Machine De La Salle University
Analyzed with SolidWorks Simulation Simulation of Briquette Machine v1.4 - Vertical Cylinder
Case
Simulation of Briquette Machine v1.4 - Vertical Cylinder Case Date: Tuesday, July 10, 2012 Designer: A. Gatmaitan, T. Guanlao, R. Guting,
C. Janairo Study name:1300 Analysis type:Static
Table of Contents Description ............................................ 1
Model Information ................................... 2
Study Properties ..................................... 3
Units ................................................... 3
Material Properties .................................. 4
Loads and Fixtures................................... 4
Contact Information ................................. 5
Mesh Information .................................... 5
Resultant Forces ..................................... 6
Study Results ......................................... 7
Description The Vertical Cylinder Case is the one who comes in contact with the biomass on the mold when the pressing is done. It is important that it can sustain the pressure that will be applied during machine operations.

De La Salle University A. Gatmaitan, T. Guanlao, R. Guting, C. Janairo
7/10/2012
Analyzed with SolidWorks Simulation Simulation of Briquette Machine v1.4 - Vertical
Cylinder Case
Model Information
Model name: Briquette Machine v1.4 - Vertical Cylinder Case
Current Configuration: Default
Solid Bodies
Document Name and Reference
Treated As Volumetric Properties Document Path/Date
Modified
Cut-Extrude3
Solid Body
Mass:3.42958 kg Volume:0.000434124 m^3
Density:7900 kg/m^3 Weight:33.6099 N
F:\School
Files\THESIS\Machine Essentials\Briquette Machine Design v1.4
(Final)\Briquette Machine v1.4 - Vertical Cylinder
Case.SLDPRT Jul 08 02:56:14 2012
Fillet1
Solid Body
Mass:0.366527 kg Volume:4.63958e-005 m^3
Density:7900 kg/m^3
Weight:3.59196 N
F:\School Files\THESIS\Machine Essentials\Briquette Machine Design v1.4
(Final)\Briquette Machine v1.4 - Vertical Cylinder
Case.SLDPRT Jul 08 02:56:14 2012
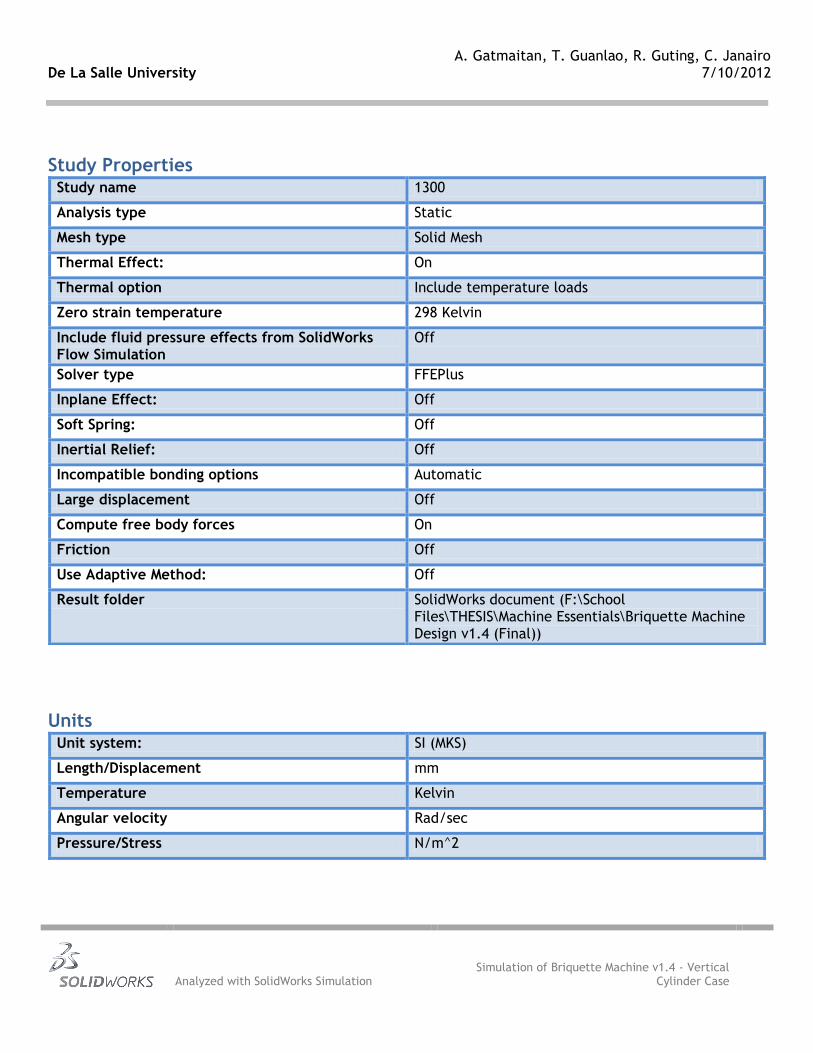
De La Salle University A. Gatmaitan, T. Guanlao, R. Guting, C. Janairo
7/10/2012
Analyzed with SolidWorks Simulation Simulation of Briquette Machine v1.4 - Vertical
Cylinder Case
Study Properties Study name 1300
Analysis type Static
Mesh type Solid Mesh
Thermal Effect: On
Thermal option Include temperature loads
Zero strain temperature 298 Kelvin
Include fluid pressure effects from SolidWorks Flow Simulation
Off
Solver type FFEPlus
Inplane Effect: Off
Soft Spring: Off
Inertial Relief: Off
Incompatible bonding options Automatic
Large displacement Off
Compute free body forces On
Friction Off
Use Adaptive Method: Off
Result folder SolidWorks document (F:\School Files\THESIS\Machine Essentials\Briquette Machine Design v1.4 (Final))
Units Unit system: SI (MKS)
Length/Displacement mm
Temperature Kelvin
Angular velocity Rad/sec
Pressure/Stress N/m^2

De La Salle University A. Gatmaitan, T. Guanlao, R. Guting, C. Janairo
7/10/2012
Analyzed with SolidWorks Simulation Simulation of Briquette Machine v1.4 - Vertical
Cylinder Case
Material Properties
Model Reference Properties Components
Name: AISI 1020 Model type: Linear Elastic Isotropic
Default failure criterion:
Max von Mises Stress
Yield strength: 3.51571e+008 N/m^2 Tensile strength: 4.20507e+008 N/m^2 Elastic modulus: 2e+011 N/m^2 Poisson's ratio: 0.29
Mass density: 7900 kg/m^3 Shear modulus: 7.7e+010 N/m^2
Thermal expansion coefficient:
1.5e-005 /Kelvin
SolidBody 1(Cut-Extrude3)(Briquette Machine v1.4 - Vertical Cylinder Case), SolidBody 2(Fillet1)(Briquette Machine v1.4 - Vertical Cylinder Case)
Curve Data:N/A
Loads and Fixtures
Fixture name Fixture Image Fixture Details
Fixed-1
Entities: 4 face(s) Type: Fixed Geometry
Resultant Forces
Components X Y Z Resultant
Reaction force(N) 0.233231 0.266266 4690.47 4690.47
Reaction Moment(N-m) 0 0 0 0
Load name Load Image Load Details
Pressure-1
Entities: 1 face(s) Type: Normal to selected face
Value: 1300 Units: psi

De La Salle University A. Gatmaitan, T. Guanlao, R. Guting, C. Janairo
7/10/2012
Analyzed with SolidWorks Simulation Simulation of Briquette Machine v1.4 - Vertical
Cylinder Case
Contact Information
Contact Contact Image Contact Properties
Global Contact
Type: Bonded Components: 1 component(s)
Options: Compatible mesh
Mesh Information Mesh type Solid Mesh
Mesher Used: Standard mesh
Automatic Transition: Off
Include Mesh Auto Loops: Off
Jacobian points 4 Points
Element Size 7.98994 mm
Tolerance 0.399497 mm
Mesh Quality High
Mesh Information - Details
Total Nodes 17769
Total Elements 9392
Maximum Aspect Ratio 9.8815
% of elements with Aspect Ratio < 3 96.4
% of elements with Aspect Ratio > 10 0
% of distorted elements(Jacobian) 0
Time to complete mesh(hh;mm;ss): 00:00:09
Computer name: TRISTAN-PC

De La Salle University A. Gatmaitan, T. Guanlao, R. Guting, C. Janairo
7/10/2012
Analyzed with SolidWorks Simulation Simulation of Briquette Machine v1.4 - Vertical
Cylinder Case
Resultant Forces
Reaction Forces
Selection set Units Sum X Sum Y Sum Z Resultant
Entire Model N 0.233231 0.266266 4690.47 4690.47
Reaction Moments
Selection set Units Sum X Sum Y Sum Z Resultant
Entire Model N-m 0 0 0 0

De La Salle University A. Gatmaitan, T. Guanlao, R. Guting, C. Janairo
7/10/2012
Analyzed with SolidWorks Simulation Simulation of Briquette Machine v1.4 - Vertical
Cylinder Case
Study Results
Name Type Min Max
Stress1 VON: von Mises Stress 390808 N/m^2
Node: 1847
2.52896e+008 N/m^2
Node: 12009
Briquette Machine v1.4 - Vertical Cylinder Case-1300-Stress-Stress1

De La Salle University A. Gatmaitan, T. Guanlao, R. Guting, C. Janairo
7/10/2012
Analyzed with SolidWorks Simulation Simulation of Briquette Machine v1.4 - Vertical
Cylinder Case
Name Type Min Max
Displacement1 URES: Resultant Displacement 0 mm Node: 127
0.163384 mm Node: 16951
Briquette Machine v1.4 - Vertical Cylinder Case-1300-Displacement-Displacement1

De La Salle University A. Gatmaitan, T. Guanlao, R. Guting, C. Janairo
7/10/2012
Analyzed with SolidWorks Simulation Simulation of Briquette Machine v1.4 - Vertical
Cylinder Case
Name Type Min Max
Strain1 ESTRN: Equivalent Strain 3.14347e-006 Element: 6933
0.000703229 Element: 7816
Briquette Machine v1.4 - Vertical Cylinder Case-1300-Strain-Strain1

De La Salle University A. Gatmaitan, T. Guanlao, R. Guting, C. Janairo
7/10/2012
Analyzed with SolidWorks Simulation Simulation of Briquette Machine v1.4 - Vertical
Cylinder Case
Name Type Min Max
Factor of Safety1 Automatic 1.39018 Node: 12009
899.601 Node: 1847
Briquette Machine v1.4 - Vertical Cylinder Case-1300-Factor of Safety-Factor of Safety1

125
APPENDIX E

Development of an Automated Briquette Machine De La Salle University
Analyzed with SolidWorks Simulation Simulation of Briquette Machine v1.4 - Vertical Cylinder
Mounting Assembly
Simulation of Briquette Machine v1.4 - Vertical Cylinder Mounting Assembly Date: Tuesday, July 10, 2012 Designer: A. Gatmaitan, T. Guanlao, R. Guting,
C. Janairo
Study name: 1300 Analysis type: Static
Table of Contents Description ............................................ 1
Assumptions .......................................... 2
Model Information ................................... 2
Study Properties ..................................... 5
Units ................................................... 5
Material Properties .................................. 6
Loads and Fixtures................................... 7
Contact Information ................................. 7
Mesh Information .................................... 8
Resultant Forces ..................................... 9
Study Results ....................................... 10
Description This part holds the hydraulic cylinder that applies the
needed pressure on the biomass briquette. Different
analyses were conducted on the two “feet” of this
part, wherein most of the stress is concentrated.

De La Salle University A. Gatmaitan, T. Guanlao, R. Guting, C. Janairo
7/10/2012
Analyzed with SolidWorks Simulation Simulation of Briquette Machine v1.4 - Vertical
Cylinder Mounting Assembly
Assumptions
Original Model
Model Analyzed
Model Information
Model name: Briquette Machine v1.4 - Vertical Cylinder Mounting Assembly
Current Configuration: Default<As Machined>
Solid Bodies

De La Salle University A. Gatmaitan, T. Guanlao, R. Guting, C. Janairo
7/10/2012
Analyzed with SolidWorks Simulation Simulation of Briquette Machine v1.4 - Vertical
Cylinder Mounting Assembly
Document Name and Reference
Treated As Volumetric Properties Document Path/Date
Modified
Structural Member1[1]
Solid Body
Mass:1.25173 kg Volume:0.000158447 m^3
Density:7900 kg/m^3 Weight:12.267 N
F:\School Files\THESIS\Machine Essentials\Briquette Machine Design v1.4
(Final)\Briquette Machine v1.4 - Vertical Cylinder
Mounting Assembly.SLDPRT
Jul 09 21:57:02 2012
Structural Member1[2]
Solid Body
Mass:1.25173 kg Volume:0.000158447 m^3
Density:7900 kg/m^3 Weight:12.267 N
F:\School Files\THESIS\Machine Essentials\Briquette Machine Design v1.4
(Final)\Briquette Machine v1.4 - Vertical Cylinder
Mounting Assembly.SLDPRT
Jul 09 21:57:02 2012
Structural Member2[1]
Solid Body
Mass:1.25173 kg Volume:0.000158447 m^3
Density:7900 kg/m^3 Weight:12.267 N
F:\School Files\THESIS\Machine Essentials\Briquette Machine Design v1.4
(Final)\Briquette Machine v1.4 - Vertical Cylinder
Mounting Assembly.SLDPRT
Jul 09 21:57:02 2012
Structural Member2[2]
Solid Body
Mass:1.25173 kg Volume:0.000158447 m^3
Density:7900 kg/m^3 Weight:12.267 N
F:\School Files\THESIS\Machine Essentials\Briquette Machine Design v1.4
(Final)\Briquette Machine v1.4 - Vertical Cylinder
Mounting Assembly.SLDPRT
Jul 09 21:57:02 2012
Split Line1
Solid Body
Mass:4.15355 kg Volume:0.000525766 m^3
Density:7900 kg/m^3 Weight:40.7048 N
F:\School Files\THESIS\Machine Essentials\Briquette Machine Design v1.4
(Final)\Briquette Machine v1.4 - Vertical Cylinder
Mounting Assembly.SLDPRT
Jul 09 21:57:02 2012

De La Salle University A. Gatmaitan, T. Guanlao, R. Guting, C. Janairo
7/10/2012
Analyzed with SolidWorks Simulation Simulation of Briquette Machine v1.4 - Vertical
Cylinder Mounting Assembly
Boss-Extrude1[1]
Solid Body
Mass:2.41798 kg Volume:0.000306073 m^3
Density:7900 kg/m^3 Weight:23.6962 N
F:\School Files\THESIS\Machine Essentials\Briquette Machine Design v1.4
(Final)\Briquette Machine v1.4 - Vertical Cylinder
Mounting Assembly.SLDPRT
Jul 09 21:57:02 2012
Boss-Extrude1[2]
Solid Body
Mass:2.41798 kg Volume:0.000306073 m^3
Density:7900 kg/m^3 Weight:23.6962 N
F:\School Files\THESIS\Machine Essentials\Briquette Machine Design v1.4
(Final)\Briquette Machine v1.4 - Vertical Cylinder
Mounting Assembly.SLDPRT
Jul 09 21:57:02 2012

De La Salle University A. Gatmaitan, T. Guanlao, R. Guting, C. Janairo
7/10/2012
Analyzed with SolidWorks Simulation Simulation of Briquette Machine v1.4 - Vertical
Cylinder Mounting Assembly
Study Properties Study name 1000
Analysis type Static
Mesh type Solid Mesh
Thermal Effect: On
Thermal option Include temperature loads
Zero strain temperature 298 Kelvin
Include fluid pressure effects from SolidWorks Flow Simulation
Off
Solver type Direct sparse solver
Inplane Effect: Off
Soft Spring: Off
Inertial Relief: Off
Incompatible bonding options Automatic
Large displacement Off
Compute free body forces On
Friction Off
Use Adaptive Method: Off
Result folder SolidWorks document (F:\School Files\THESIS\Machine Essentials\Briquette Machine Design v1.4 (Final))
Units Unit system: SI (MKS)
Length/Displacement mm
Temperature Kelvin
Angular velocity Rad/sec
Pressure/Stress N/m^2

De La Salle University A. Gatmaitan, T. Guanlao, R. Guting, C. Janairo
7/10/2012
Analyzed with SolidWorks Simulation Simulation of Briquette Machine v1.4 - Vertical
Cylinder Mounting Assembly
Material Properties
Model Reference Properties Components
Name: AISI 1020 Model type: Linear Elastic Isotropic
Default failure criterion:
Max von Mises Stress
Yield strength: 3.51571e+008 N/m^2 Tensile strength: 4.20507e+008 N/m^2 Elastic modulus: 2e+011 N/m^2 Poisson's ratio: 0.29
Mass density: 7900 kg/m^3 Shear modulus: 7.7e+010 N/m^2
Thermal expansion coefficient:
1.5e-005 /Kelvin
SolidBody 2(Structural Member1[1])(Briquette Machine v1.4 - Vertical Cylinder Mounting Assembly), SolidBody 4(Structural Member1[2])(Briquette Machine v1.4 - Vertical Cylinder Mounting Assembly),
SolidBody 5(Structural Member2[1])(Briquette Machine v1.4 - Vertical Cylinder Mounting Assembly), SolidBody 6(Structural Member2[2])(Briquette Machine v1.4 - Vertical Cylinder Mounting Assembly), SolidBody 7(Split Line1)(Briquette Machine v1.4 - Vertical Cylinder Mounting Assembly), SolidBody 17(Boss-Extrude1[1])(Briquette Machine v1.4 - Vertical Cylinder Mounting Assembly), SolidBody 19(Boss-
Extrude1[2])(Briquette Machine v1.4 - Vertical Cylinder Mounting Assembly)
Curve Data:N/A
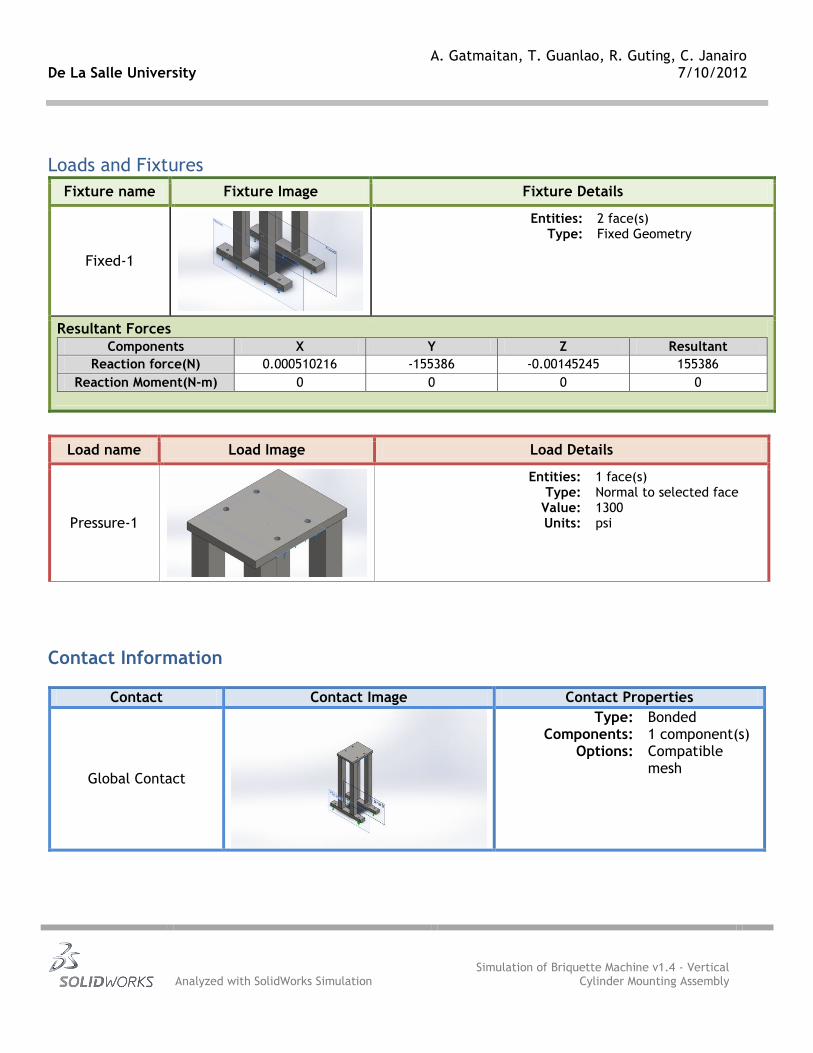
De La Salle University A. Gatmaitan, T. Guanlao, R. Guting, C. Janairo
7/10/2012
Analyzed with SolidWorks Simulation Simulation of Briquette Machine v1.4 - Vertical
Cylinder Mounting Assembly
Loads and Fixtures
Fixture name Fixture Image Fixture Details
Fixed-1
Entities: 2 face(s) Type: Fixed Geometry
Resultant Forces
Components X Y Z Resultant
Reaction force(N) 0.000510216 -155386 -0.00145245 155386
Reaction Moment(N-m) 0 0 0 0
Load name Load Image Load Details
Pressure-1
Entities: 1 face(s) Type: Normal to selected face
Value: 1300 Units: psi
Contact Information
Contact Contact Image Contact Properties
Global Contact
Type: Bonded Components: 1 component(s)
Options: Compatible mesh

De La Salle University A. Gatmaitan, T. Guanlao, R. Guting, C. Janairo
7/10/2012
Analyzed with SolidWorks Simulation Simulation of Briquette Machine v1.4 - Vertical
Cylinder Mounting Assembly
Mesh Information Mesh type Solid Mesh
Mesher Used: Standard mesh
Automatic Transition: Off
Include Mesh Auto Loops: Off
Jacobian points 4 Points
Element Size 16.6262 mm
Tolerance 0.83131 mm
Mesh Quality High
Mesh Information - Details
Total Nodes 19329
Total Elements 10169
Maximum Aspect Ratio 23.264
% of elements with Aspect Ratio < 3 35
% of elements with Aspect Ratio > 10 1.98
% of distorted elements(Jacobian) 0
Time to complete mesh(hh;mm;ss): 00:00:22
Computer name: TRISTAN-PC

De La Salle University A. Gatmaitan, T. Guanlao, R. Guting, C. Janairo
7/10/2012
Analyzed with SolidWorks Simulation Simulation of Briquette Machine v1.4 - Vertical
Cylinder Mounting Assembly
Resultant Forces
Reaction Forces
Selection set Units Sum X Sum Y Sum Z Resultant
Entire Model N 0.000510216 -155386 -0.00145245 155386
Reaction Moments
Selection set Units Sum X Sum Y Sum Z Resultant
Entire Model N-m 0 0 0 0

De La Salle University A. Gatmaitan, T. Guanlao, R. Guting, C. Janairo
7/10/2012
Analyzed with SolidWorks Simulation Simulation of Briquette Machine v1.4 - Vertical
Cylinder Mounting Assembly
Study Results
Name Type Min Max
Stress1 VON: von Mises Stress 31599.9 N/m^2
Node: 16298
5.04514e+008 N/m^2
Node: 14380
Briquette Machine v1.4 - Vertical Cylinder Mounting Assembly-1000-Stress-Stress1

De La Salle University A. Gatmaitan, T. Guanlao, R. Guting, C. Janairo
7/10/2012
Analyzed with SolidWorks Simulation Simulation of Briquette Machine v1.4 - Vertical
Cylinder Mounting Assembly
Name Type Min Max
Displacement1 URES: Resultant Displacement 0 mm Node: 14729
0.697117 mm Node: 12385
Briquette Machine v1.4 - Vertical Cylinder Mounting Assembly-1000-Displacement-Displacement1

De La Salle University A. Gatmaitan, T. Guanlao, R. Guting, C. Janairo
7/10/2012
Analyzed with SolidWorks Simulation Simulation of Briquette Machine v1.4 - Vertical
Cylinder Mounting Assembly
Name Type Min Max
Strain1 ESTRN: Equivalent Strain 2.00253e-007 Element: 7795
0.00164121 Element: 1338
Briquette Machine v1.4 - Vertical Cylinder Mounting Assembly-1000-Strain-Strain1

De La Salle University A. Gatmaitan, T. Guanlao, R. Guting, C. Janairo
7/10/2012
Analyzed with SolidWorks Simulation Simulation of Briquette Machine v1.4 - Vertical
Cylinder Mounting Assembly
Name Type Min Max
Factor of Safety1 Automatic 0.673171 Node: 185
11125.7 Node: 16298
Briquette Machine v1.4 - Vertical Cylinder Mounting Assembly-1000-Factor of Safety-Factor of Safety1

139
APPENDIX F

L N S/S +24V 24G X0 X1 X2 X3 X4 X5 X6 X7 X10
C0 Y0 C1 Y1 C2 Y2 C3 Y3 Y4 C4 Y5 Y6 Y7
AC
+24VOut0V
Proximity Sensor 3
TSC1207-N
220 VAC
24V, 0.3ADC
8
12
14
13
SSR MY4N-D2
8
12
14
13
SSR MY4N-D2
8
12
14
13
SSR MY4N-D2
8
12
14
13
SSR MY4N-D2
+24VOut0V
Proximity Sensor 3
TSC1207-N
+24VOut0V
Proximity Sensor 3
TSC1207-N
DELTA DVP 32EH00T2
24V, 1.25ADC
Solenoid 1
Solenoid 2
Solenoid 3
Solenoid 4
-
+
-
+
-
+
-
+
Toggle Switch
Pressure Switch
24G
+24V
Fuse 1
Fuse 2
Fuse 3Fuse 4
+24 V, 0.3 A
-24 V, 0.3 A
+24 V, 1.25 A
-24 V, 1.25 A
-
+
-
+
-
+
-
+-
+
-
+
-
+
-
+
Inputs
Electrical Diagram

141
APPENDIX G


143
APPENDIX H

http://www.delta.com.tw/industrialautomation/
2006-10-24
5011650900-H2E0
High-Speed, Multi-Functional Programmable Logic Controller
Instruction Sheet
Warning This instruction sheet only provides introductory information on electrical specification, functions, wiring,
trouble-shooting and peripherals. For detailed information on programming and instructions, please refer to “DVP-PLC Application Manual: Programming”. For how to purchase its peripheral devices, please refers to the manual enclosed with the product.
DVP-EH2 is an OPEN-TYPE device and therefore should be installed in an enclosure free of airborne dust, humidity,
electric shock and vibration. The enclosure should prevent non-maintenance staff from operating the device (e.g. key or specific tools are required for opening the enclosure) in case danger and damage on the device may occur.
DO NOT connect input AC power supply to any of the I/O terminals; otherwise serious damage may occur. Check all
the wiring again before switching on the power and Do NOT tough any terminal when the power is switched on. Make sure the groud terminal is correctly grounded in order to prevent electromagnetic interference.
Introduction 1.1 Model Explanation & Peripherals
Nameplate Explanation
100~240VAC 50/60Hz 30VA MAX
MODELPOWER INPUT
OUTPUTMODULE 2.0A 250Vac 50/60Hz RES LOAD
32EH00R2T6160018
VX.XX
DELTA ELECTRONICS,INC. MADE IN XXXXXX
DVP32EH00R2Delta PLC model namePower input specification
Output module specification
Barcode & series No.
Firmware version
Model/Serial No. Explanation
32EH00R2 0 T 6 16 0018
Model nameVersion No.Production plant (Taoyuan)Production year (2006)Production weekProduction No.
1.2 Product Profile & Outline
1
2 3
5 9 4 9
6
10
54
7
8
Open COM1 cover
Communication port cover Extension module connection port cover I/O terminal cover Input indicator Function card/memory card cover Output indicator I/O terminals DIN rail clip I/O terminal No. DIN rail (35mm)
3
1
26
7
1
254
8
Open COM2 cover
Mounting screw Memory card port Direct mounting hole POWER/RUN/BAT.LOW/ERROR indicator Battery socket Extension module connection port Function card mounting hole
Removable Terminal BlockCOM 2 (RS-485)
RUN / STOP SWITCH
VR 0 VR 1
COM 1 (RS-232)
Battery
Remove RS-485 terminal
Part Description COM2 (RS-485) For both master & slave modes RUN/STOP switch PLC RUN/STOP control
VR0 Enable M1178/corresponding value of D1178
VR1 Enable M1179/corresponding value of D1179
COM1 (RS-232) For slave mode Battery Shall be changed within 1 min.
1.3 Installation of function card/memory card (optional accessories) Remove function card
Remove memory card
Close the cover
For details, see the instruction sheets of these accessories.
Electrical Specifications Model Item 16EH00 2 20EH00 2 32EH00 2 40EH00 2 48EH00 2 64EH00 2 80EH00 2
Power supply voltage
100 ~240VAC (-15% ~ 10%); 50/60Hz ± 5%
Fuse capacity 2A/250VAC Power consumption
50VA 50VA 60VA 60VA 60VA 80VA 80VA
DC24V current supply
500mA 500mA 500mA 500mA 500mA 500mA 500mA
Power protection DC24V; output short-circuited Withstand voltage 1500VAC (Primary-Secondary); 1500VAC (Primary-PE); 500VAC (Secondary-PE) Insulation resistance
>5 MΩ (all I/O point-to-ground: 500VDC)
Noise immunity ESD: 8KV Air Discharge; EFT: Power Line: 2KV, Digital I/O: 1KV, Analog & Communication I/O: 250V Damped-Oscillatory Wave: Power Line: 1KV, Digital I/O: 1KV, RS: 26MHz ~ 1GHz, 10V/m
Earth The diameter of grounding wire shall not be less than that of L, N terminal of the power. (When many PLCs are in use at the same time, please make sure every PLC is properly grounded.)
Operation/storage Operation: 0ºC ~ 55ºC (temperature); 50 ~ 95% (humidity); pollution degree 2 Storage: -40 ºC ~ 70 ºC (temperature); 5 ~ 95% (humidity)
Vibration/shock immunity
International standards: IEC1131-2, IEC 68-2-6 (TEST Fc)/IEC1131-2 & IEC 68-2-27 (TEST Ea)
Weight (g) 500/480 520/500 652/612 710/675 748/688 836/756 948/848
Input point specifications 24VDC single common port input Spec.
Items Low speed High speed (200KHz) Note
Input wiring type Change wiring from S/S to SINK or SOURCE Input indicator LED display; light on = ON, light off = OFF Input voltage 24VDC ± 10%
Off On 16VDC ± 10% Active Level
On Off 12VDC ± 10% Response Time / Noise Immunity 10 ms 0.5us
Input point X0 ~ X7, X10 ~ X17 can conduct 10 ~ 60ms digital filter adjustment
Output point specifications Single common port transistor output Spec.
Items Low speed High speed* Single common port relay output
Max. frequency 10KHz 200KHz Load ON/OFF control Output indicator LED display; light on = ON, light off = OFF Min. load - 2mA/DC power supply Working voltage 5 ~ 30VDC <250VAC, 30VDC Insulation Photocoupler isolation Magnetic isolation
Current specification 0.3A/1 point @ 40ºC <1KHz, 0.3A/1 point @ 40°C ≧1KHz, 30mA/1 point @ 40°C
2A/1 point (5A/COM) 75 VA (conductive), 90W (resistive)
Off On 20us Max. output delay time On Off 30us
0.2us 10ms
Over-current protection N/A Mechanical life N/A 2×10⁷ times (without load)
Electrical life N/A 1.5×105 times (5A 30VDC); 5×105 times (3A 120VAC); 3×104 times (5A 250VAC)
*High-speed output points (Y0, Y2) are only in DVP20EH2 and DVP32EH2; high-speed output points (Y0, Y1, Y2, Y3, Y4, Y6) are only in DVP40EH2.
Installation & Wiring 3.1 Dimension
4.6 X 2
WW1
80.0
90.0
82.2
Model W (mm) W1 (mm)
DVP16EH00R2/T2 113 103 DVP20EH00R2/T2 113 103 DVP32EH00R2/T2 143.5 133.5 DVP40EH00R2/T2 158.8 153.8 DVP48EH00R2/T2 174 164 DVP64EH00R2/T2 212 202 DVP80EH00R2/T2 276 266
3.2 Wiring terminals
16EH2
X7X6
X5X4
X3X2
X1X0
Y0 Y1 Y2 Y3 Y4 Y5 Y6C6C2C1C0
S/S
Y7C3 C4 C5 C7
20EH2
X13X12
X11X10
X7X6
X5X4
X3X2
X1X0
Y0 Y1C1
Y2 Y3 Y4C3C0
S/S
C2 C4+24V
24GY6
Y5 Y7
32EH2 Relay
X17X16
X15X14
X13X12
X11X10
X7X6
X5X4
X3X2
X1X0
Y0 Y1Y2
Y3 Y4 Y5Y6 C3C2C1C0
Y7Y12
Y13Y16
Y17Y15Y14Y11Y10
S/S
32EH2 Transistor
X17X16
X15X14
X13X12
X11X10
X7X6
X5X4
X3X2
X1X0
Y0 Y1C1
Y2 Y3 Y4Y6 C5C3C0
Y5Y12
Y11Y17
Y16Y14Y13Y10Y7
S/S
C2 C6 Y15C4
40EH2 Relay
X23X22
X21X20
X17X16
X15X14
X13X12
X11X10
X7X6
X5X4
24G Y0C0
Y2 Y3C3 C5C4C224V
Y12Y10Y6Y4
S/S
Y14 Y16Y15C1 Y5 Y11 C6
X24 X26X25 X27
Y1Y7 Y13 Y17
X1
40EH2 Transistor
X23X22
X21X20
X17X16
X15X14
X13X12
X11X10
X7X6
X5X4
24G Y0C0
Y2 Y3C4C2C124V
Y12Y10Y6Y4
S/S
Y14 Y16Y15
Y5Y11 C5
X24 X26X25 X27
Y1 Y7Y13 Y17
X1
C3
48EH2
X17X16
X15X14
X13X12
X11X10
X7X6
X5X4
X3X2
X1X0
Y0 Y1Y2
Y3 Y4 Y5Y6 C3C2C1C0
Y7Y12
Y13Y16
Y17Y15Y14Y11Y10
S/SX27
X26X25
X24X23
X22X21
X20
C4 Y21Y22
Y27Y23Y26Y24Y20
Y25
64EH2
X17X16
X15X14
X13X12
X11X10
X7X6
X5X4
X3X2
X1X0
Y0 Y1Y2
Y3 Y4 Y5Y6 C3C2C1C0
Y7Y12
Y13Y16
Y17Y15Y14Y11Y10
S/SX27
X26X25
X24X23
X22X21
X20
C4 Y22Y21 Y27
Y24Y25Y23Y20
Y26
X37X36
X35X34
X33X32
X31X30
C5 Y31Y32
Y37Y33Y36Y34Y30
Y35
80EH2
X15X14
X13X12
X11X10
X7X6
X5X4
X3X2
X1X0
Y0 Y1Y2
Y3 Y4 Y5Y6 C3C2C1C0
Y7Y12
Y13Y16
Y17Y15Y14Y11Y10
S/SX23
X22X21
X20X17
X16
C4 Y22Y21 Y27Y25Y23Y20
Y26
X31X30
X33X32
X27X26
X25X24
C6 Y32Y31 Y37
Y34Y35Y33Y30
Y36
X35X34
X37X36
X41X40
X43X42
X45X44
X47X46
C5Y24
C7 Y42Y41 Y47
Y44Y45Y43Y40
Y46
3.3 Installation
How to install DIN rail
DVP-PLC can be secured to a cabinet by using the DIN rail of 35mm in height and 7.5mm in depth. When mounting PLC to DIN rail, be sure to use the end bracket to stop any side-to-side movement of PLC and reduce the chance of wires being loosen. A small retaining clip is at the bottom of PLC. To secure PLC to DIN rail, place the clip onto the rail and gently push it up. To remove it, pull the retaining clip down and gently remove PLC from DIN rail, as shown in the figure.
How to screw Please use M4 screw according to the dimension of the product. Please install PLC in an enclosure with sufficient space around it to allow heat dissipation as shown in the figure.
DVP MPU> 50mm> 50mm
> 50mm
> 50mm
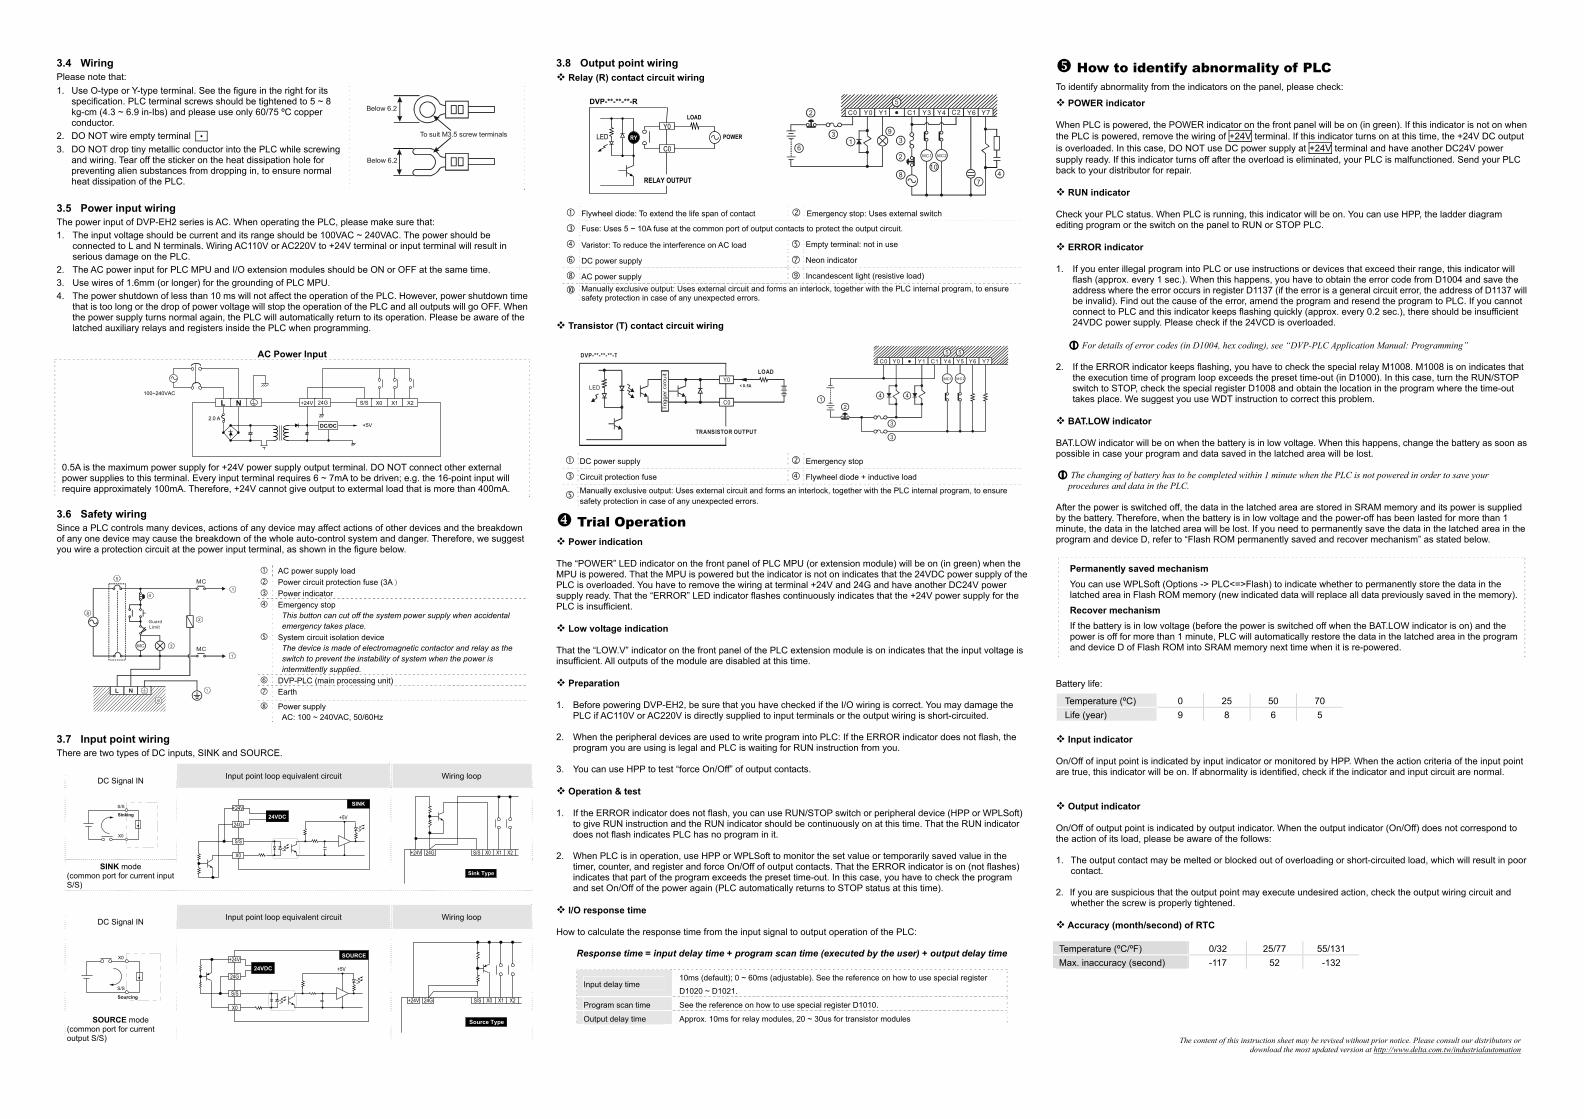
3.4 Wiring Please note that: 1. Use O-type or Y-type terminal. See the figure in the right for its
specification. PLC terminal screws should be tightened to 5 ~ 8 kg-cm (4.3 ~ 6.9 in-Ibs) and please use only 60/75 ºC copper conductor.
2. DO NOT wire empty terminal • 3. DO NOT drop tiny metallic conductor into the PLC while screwing
and wiring. Tear off the sticker on the heat dissipation hole for preventing alien substances from dropping in, to ensure normal heat dissipation of the PLC.
To suit M3.5 screw terminals
Below 6.2
Below 6.2
3.5 Power input wiring The power input of DVP-EH2 series is AC. When operating the PLC, please make sure that: 1. The input voltage should be current and its range should be 100VAC ~ 240VAC. The power should be
connected to L and N terminals. Wiring AC110V or AC220V to +24V terminal or input terminal will result in serious damage on the PLC.
2. The AC power input for PLC MPU and I/O extension modules should be ON or OFF at the same time. 3. Use wires of 1.6mm (or longer) for the grounding of PLC MPU. 4. The power shutdown of less than 10 ms will not affect the operation of the PLC. However, power shutdown time
that is too long or the drop of power voltage will stop the operation of the PLC and all outputs will go OFF. When the power supply turns normal again, the PLC will automatically return to its operation. Please be aware of the latched auxiliary relays and registers inside the PLC when programming.
AC Power Input
L N
2.0 ADC/DC +5V
+24V 24G S/S X0 X1 X2
100~240VAC
0.5A is the maximum power supply for +24V power supply output terminal. DO NOT connect other external power supplies to this terminal. Every input terminal requires 6 ~ 7mA to be driven; e.g. the 16-point input will require approximately 100mA. Therefore, +24V cannot give output to extermal load that is more than 400mA.
3.6 Safety wiring Since a PLC controls many devices, actions of any device may affect actions of other devices and the breakdown of any one device may cause the breakdown of the whole auto-control system and danger. Therefore, we suggest you wire a protection circuit at the power input terminal, as shown in the figure below.
AC power supply load Power circuit protection fuse (3A) Power indicator Emergency stop
This button can cut off the system power supply when accidental emergency takes place.
System circuit isolation device The device is made of electromagnetic contactor and relay as the switch to prevent the instability of system when the power is intermittently supplied.
DVP-PLC (main processing unit) Earth
MC MC
NL
1
1
2
3
4
5
6
7
8
GuardLimit
MC
Power supply AC: 100 ~ 240VAC, 50/60Hz
3.7 Input point wiring There are two types of DC inputs, SINK and SOURCE.
Input point loop equivalent circuit Wiring loop DC Signal IN
S/S
X0
Sinking
SINK mode
(common port for current input S/S)
24VDC24G
X0
S/S
+24VSINK
+5V
24G S/S X0 X1 X2+24V
Sink Type
Input point loop equivalent circuit Wiring loop DC Signal IN
S/S
X0
Sourcing
SOURCE mode (common port for current output S/S)
24VDC24G
X0
S/S
+24V SOURCE
+5V
24G S/S X0 X1 X2+24V
Source Type
3.8 Output point wiring Relay (R) contact circuit wiring
Y0RYLED
C0
LOAD
POWER
DVP-**-**-**-R
RELAY OUTPUT
2
31
5C0 Y0 Y1 C1 Y3 Y4 C2 Y6 Y7
4
MC1 MC2
7
10
3
2
8
9
6
Flywheel diode: To extend the life span of contact Emergency stop: Uses external switch
Fuse: Uses 5 ~ 10A fuse at the common port of output contacts to protect the output circuit.
Varistor: To reduce the interference on AC load Empty terminal: not in use
DC power supply Neon indicator
AC power supply Incandescent light (resistive load)
Manually exclusive output: Uses external circuit and forms an interlock, together with the PLC internal program, to ensure safety protection in case of any unexpected errors.
Transistor (T) contact circuit wiring
Y0LED
C0
TRANSISTOR OUTPUT
LOAD
DVP-**-**-**-T
< 0.5A
MC1 MC2
2
3
1
C0 Y0 Y1 C1 Y4 Y5 Y6 Y75
4
5
3
4
DC power supply Emergency stop
Circuit protection fuse Flywheel diode + inductive load
Manually exclusive output: Uses external circuit and forms an interlock, together with the PLC internal program, to ensure safety protection in case of any unexpected errors.
Trial Operation Power indication
The “POWER” LED indicator on the front panel of PLC MPU (or extension module) will be on (in green) when the MPU is powered. That the MPU is powered but the indicator is not on indicates that the 24VDC power supply of the PLC is overloaded. You have to remove the wiring at terminal +24V and 24G and have another DC24V power supply ready. That the “ERROR” LED indicator flashes continuously indicates that the +24V power supply for the PLC is insufficient.
Low voltage indication That the “LOW.V” indicator on the front panel of the PLC extension module is on indicates that the input voltage is insufficient. All outputs of the module are disabled at this time.
Preparation 1. Before powering DVP-EH2, be sure that you have checked if the I/O wiring is correct. You may damage the
PLC if AC110V or AC220V is directly supplied to input terminals or the output wiring is short-circuited. 2. When the peripheral devices are used to write program into PLC: If the ERROR indicator does not flash, the
program you are using is legal and PLC is waiting for RUN instruction from you. 3. You can use HPP to test “force On/Off” of output contacts.
Operation & test
1. If the ERROR indicator does not flash, you can use RUN/STOP switch or peripheral device (HPP or WPLSoft) to give RUN instruction and the RUN indicator should be continuously on at this time. That the RUN indicator does not flash indicates PLC has no program in it.
2. When PLC is in operation, use HPP or WPLSoft to monitor the set value or temporarily saved value in the
timer, counter, and register and force On/Off of output contacts. That the ERROR indicator is on (not flashes) indicates that part of the program exceeds the preset time-out. In this case, you have to check the program and set On/Off of the power again (PLC automatically returns to STOP status at this time).
I/O response time
How to calculate the response time from the input signal to output operation of the PLC:
Response time = input delay time + program scan time (executed by the user) + output delay time
Input delay time 10ms (default); 0 ~ 60ms (adjustable). See the reference on how to use special register
D1020 ~ D1021.
Program scan time See the reference on how to use special register D1010.
Output delay time Approx. 10ms for relay modules, 20 ~ 30us for transistor modules
How to identify abnormality of PLC To identify abnormality from the indicators on the panel, please check:
POWER indicator When PLC is powered, the POWER indicator on the front panel will be on (in green). If this indicator is not on when the PLC is powered, remove the wiring of +24V terminal. If this indicator turns on at this time, the +24V DC output is overloaded. In this case, DO NOT use DC power supply at +24V terminal and have another DC24V power supply ready. If this indicator turns off after the overload is eliminated, your PLC is malfunctioned. Send your PLC back to your distributor for repair.
RUN indicator Check your PLC status. When PLC is running, this indicator will be on. You can use HPP, the ladder diagram editing program or the switch on the panel to RUN or STOP PLC.
ERROR indicator 1. If you enter illegal program into PLC or use instructions or devices that exceed their range, this indicator will
flash (approx. every 1 sec.). When this happens, you have to obtain the error code from D1004 and save the address where the error occurs in register D1137 (if the error is a general circuit error, the address of D1137 will be invalid). Find out the cause of the error, amend the program and resend the program to PLC. If you cannot connect to PLC and this indicator keeps flashing quickly (approx. every 0.2 sec.), there should be insufficient 24VDC power supply. Please check if the 24VCD is overloaded.
For details of error codes (in D1004, hex coding), see “DVP-PLC Application Manual: Programming”
2. If the ERROR indicator keeps flashing, you have to check the special relay M1008. M1008 is on indicates that
the execution time of program loop exceeds the preset time-out (in D1000). In this case, turn the RUN/STOP switch to STOP, check the special register D1008 and obtain the location in the program where the time-out takes place. We suggest you use WDT instruction to correct this problem.
BAT.LOW indicator
BAT.LOW indicator will be on when the battery is in low voltage. When this happens, change the battery as soon as possible in case your program and data saved in the latched area will be lost.
The changing of battery has to be completed within 1 minute when the PLC is not powered in order to save your procedures and data in the PLC.
After the power is switched off, the data in the latched area are stored in SRAM memory and its power is supplied by the battery. Therefore, when the battery is in low voltage and the power-off has been lasted for more than 1 minute, the data in the latched area will be lost. If you need to permanently save the data in the latched area in the program and device D, refer to “Flash ROM permanently saved and recover mechanism” as stated below.
Permanently saved mechanism You can use WPLSoft (Options -> PLC<=>Flash) to indicate whether to permanently store the data in the latched area in Flash ROM memory (new indicated data will replace all data previously saved in the memory). Recover mechanism If the battery is in low voltage (before the power is switched off when the BAT.LOW indicator is on) and the power is off for more than 1 minute, PLC will automatically restore the data in the latched area in the program and device D of Flash ROM into SRAM memory next time when it is re-powered.
Battery life:
Temperature (ºC) 0 25 50 70 Life (year) 9 8 6 5
Input indicator
On/Off of input point is indicated by input indicator or monitored by HPP. When the action criteria of the input point are true, this indicator will be on. If abnormality is identified, check if the indicator and input circuit are normal.
Output indicator On/Off of output point is indicated by output indicator. When the output indicator (On/Off) does not correspond to the action of its load, please be aware of the follows: 1. The output contact may be melted or blocked out of overloading or short-circuited load, which will result in poor
contact. 2. If you are suspicious that the output point may execute undesired action, check the output wiring circuit and
whether the screw is properly tightened.
Accuracy (month/second) of RTC Temperature (ºC/ºF) 0/32 25/77 55/131 Max. inaccuracy (second) -117 52 -132
The content of this instruction sheet may be revised without prior notice. Please consult our distributors or download the most updated version at http://www.delta.com.tw/industrialautomation