Development of Abutment Design Standards for …publications.iowa.gov/2661/1/tr486vol1.pdfF. W....
100
F. W. Klaiber, D. J. White, T. J. Wipf, B. M. Phares, V. W. Robbins Development of Abutment Design Standards for Local Bridge Designs Volume 1 of 3 Development of Design Methodology August 2004 Sponsored by the Iowa Department of Transportation Highway Division and the Iowa Highway Research Board Iowa DOT Project TR - 486 Final Department of Civil and Construction Engineering
-
Upload
phungkhanh -
Category
Documents
-
view
215 -
download
1
Transcript of Development of Abutment Design Standards for …publications.iowa.gov/2661/1/tr486vol1.pdfF. W....
F. W. Klaiber, D. J. White, T. J. Wipf, B. M. Phares, V. W. Robbins
Development of Abutment Design Standards for Local Bridge Designs
Volume 1 of 3
Development of Design Methodology
August 2004
Sponsored by the Iowa Department of Transportation
Highway Division and the Iowa Highway Research Board
Iowa DOT Project TR - 486
Final
Department of Civil and Construction Engineering

The opinions, findings, and conclusions expressed in this publication are those of the authors and not necessarily those of
the Iowa Department of Transportation.
F. W. Klaiber, D. J. White, T. J. Wipf, B. M. Phares, V. W. Robbins
Development of Abutment Design Standards for Local Bridges Bridge Designs
Volume 1 of 3
Development of Design Methodology
August 2004
Sponsored by the Iowa Department of Transportation
Highway Division and the Iowa Highway Research Board
Iowa DOT Project TR - 486
Final
Department of Civil and Construction Engineering

ABSTRACT
Several superstructure design methodologies have been developed for low volume road bridges by
the Iowa State University Bridge Engineering Center. However, to date no standard abutment designs have
been developed. Thus, there was a need to establish an easy to use design methodology in addition to
generating generic abutment standards and other design aids for the more common substructure systems
used in Iowa.
The final report for this project consists of three volumes. The first volume (this volume)
summarizes the research completed in this project. A survey of the Iowa County Engineers was conducted
from which it was determined that while most counties use similar types of abutments, only 17 percent use
some type of standard abutment designs or plans. A literature review revealed several possible alternative
abutment systems for future use on low volume road bridges in addition to two separate substructure lateral
load analysis methods. These consisted of a linear and a non-linear method. The linear analysis method
was used for this project due to its relative simplicity and the relative accuracy of the maximum pile
moment when compared to values obtained from the more complex non-linear analysis method. The
resulting design methodology was developed for single span stub abutments supported on steel or timber
piles with a bridge span length ranging from 20 to 90 ft and roadway widths of 24 and 30 ft. However,
other roadway widths can be designed using the foundation design template provided. The backwall height
is limited to a range of 6 to 12 ft, and the soil type is classified as cohesive or cohesionless. The design
methodology was developed using the guidelines specified by the American Association of State Highway
Transportation Officials Standard Specifications, the Iowa Department of Transportation Bridge Design
Manual, and the National Design Specifications for Wood Construction.
The second volume introduces and outlines the use of the various design aids developed for this
project. Charts for determining dead and live gravity loads based on the roadway width, span length, and
superstructure type are provided. A foundation design template was developed in which the engineer can
check a substructure design by inputting basic bridge site information. Tables published by the Iowa
Department of Transportation that provide values for estimating pile friction and end bearing for different
combinations of soils and pile types are also included. Generic standard abutment plans were developed
for which the engineer can provide necessary bridge site information in the spaces provided. These tools
enable engineers to design and detail county bridge substructures more efficiently.
The third volume provides two sets of calculations that demonstrate the application of the
substructure design methodology developed in this project. These calculations also verify the accuracy of
the foundation design template. The printouts from the foundation design template are provided at the end
of each example. Also several tables provide various foundation details for a pre-cast double tee
superstructure with different combinations of soil type, backwall height, and pile type.

TABLE OF CONTENTS
LIST OF FIGURES vii
LIST OF TABLES ix
1. INTRODUCTION 1
1.1. Background 1
1.2. Objective and Scope 3
1.3. Report Summary 4
2. INPUT FROM IOWA ENGINEERS 5
2.1. TR-486 Survey 5
2.1.1. Objective and Scope of Survey 5
2.1.2. Survey Results and Summary 6
2.2. Project Advisory Committee (PAC) 7
3. LITERATURE REVIEW 9
3.1. Abutment Classifications 9
3.2. Available Abutment Design Information 12
3.3. Lateral Load Analysis Techniques 13
3.3.1. Non-Linear Analysis 13
3.3.2. Linear Analysis 14
3.3.3. Lateral Load Analysis Comparison 18
4. DESIGN METHODOLOGY 25
4.1. Design Loads 25
4.1.1. Gravity Loads 25
4.1.1.1. Dead Load 25
4.1.1.2. Live Load 29
4.1.2. Lateral Loads 30
4.2. Structural Analysis 31
4.2.1. Internal Pile Forces 31
4.2.1.1. Axial Pile Force 31
4.2.1.2. Pile Bending Moment and Anchor Rod Force 32
4.2.2. Internal Anchor Block Forces 34
4.2.3. Miscellaneous Element Forces 34
vi
4.3. Capacity of Foundation Elements 35
4.3.1. Pile Capacity 35
4.3.1.1. Bearing Capacity 35
4.3.1.2. Structural Capacity 36
4.3.1.2.1. Steel Piles 36
4.3.1.2.2. Timber Piles 39
4.3.2. Anchor Block Capacity 43
4.3.2.1. Lateral Capacity 43
4.3.2.2. Structural Capacity 46
4.3.3. Miscellaneous Substructure Elements 46
4.4. Design Checks of Foundation Elements 46
5. ALTERNATIVE LOW-VOLUME ABUTMENT SYSTEMS 49
5.1. Micropiles 49
5.2. Geosynthetic Reinforced Soil Bridge Abutments 51
5.3. Geopier Foundations 55
5.4. Sheet Pile Abutments 58
6. REPORT SUMMARY 63
7. RECOMMENDED RESEARCH 67
8. ACKNOWLEDGEMENTS 69
9. REFERENCES 71
APPENDIX A. TR-486 SURVEY 75
APPENDIX B. TR-486 SURVEY SUMMARY 81
vii
LIST OF FIGURES
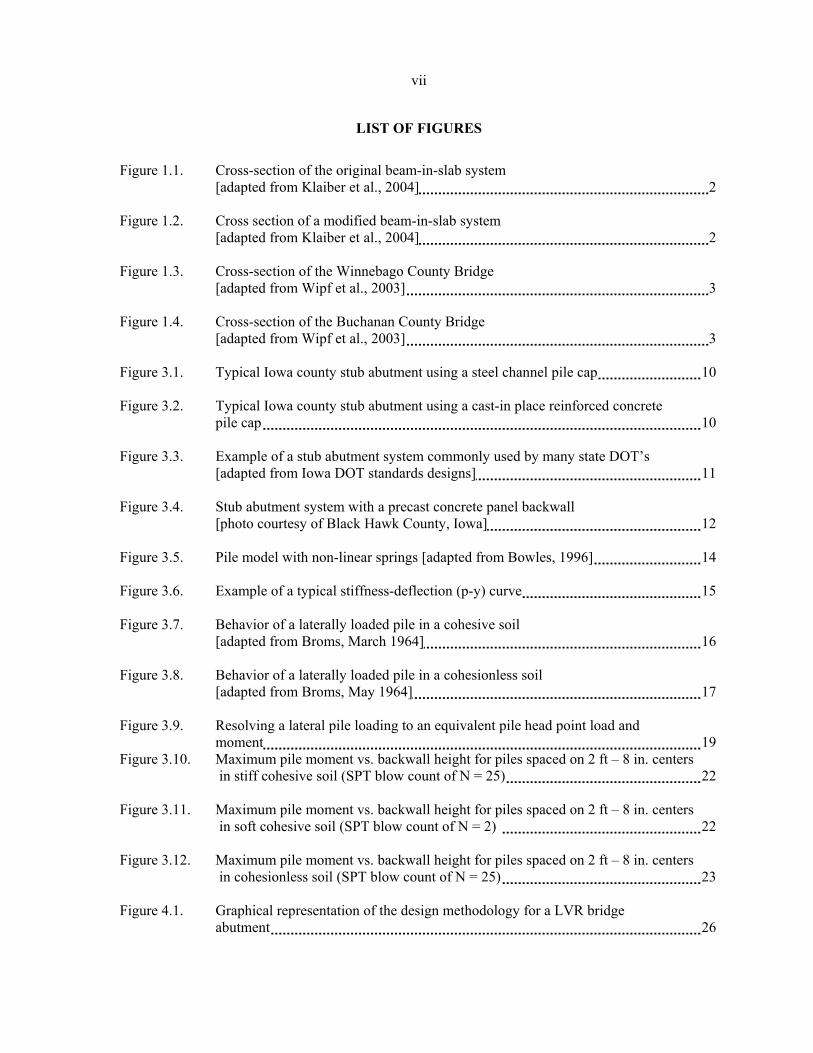
Figure 1.1. Cross-section of the original beam-in-slab system [adapted from Klaiber et al., 2004] 2
Figure 1.2. Cross section of a modified beam-in-slab system
[adapted from Klaiber et al., 2004] 2 Figure 1.3. Cross-section of the Winnebago County Bridge
[adapted from Wipf et al., 2003] 3 Figure 1.4. Cross-section of the Buchanan County Bridge
[adapted from Wipf et al., 2003] 3 Figure 3.1. Typical Iowa county stub abutment using a steel channel pile cap 10 Figure 3.2. Typical Iowa county stub abutment using a cast-in place reinforced concrete
pile cap 10 Figure 3.3. Example of a stub abutment system commonly used by many state DOT’s
[adapted from Iowa DOT standards designs] 11 Figure 3.4. Stub abutment system with a precast concrete panel backwall
[photo courtesy of Black Hawk County, Iowa] 12 Figure 3.5. Pile model with non-linear springs [adapted from Bowles, 1996] 14 Figure 3.6. Example of a typical stiffness-deflection (p-y) curve 15 Figure 3.7. Behavior of a laterally loaded pile in a cohesive soil
[adapted from Broms, March 1964] 16 Figure 3.8. Behavior of a laterally loaded pile in a cohesionless soil
[adapted from Broms, May 1964] 17 Figure 3.9. Resolving a lateral pile loading to an equivalent pile head point load and
moment 19 Figure 3.10. Maximum pile moment vs. backwall height for piles spaced on 2 ft – 8 in. centers
in stiff cohesive soil (SPT blow count of N = 25) 22 Figure 3.11. Maximum pile moment vs. backwall height for piles spaced on 2 ft – 8 in. centers
in soft cohesive soil (SPT blow count of N = 2) 22 Figure 3.12. Maximum pile moment vs. backwall height for piles spaced on 2 ft – 8 in. centers
in cohesionless soil (SPT blow count of N = 25) 23 Figure 4.1. Graphical representation of the design methodology for a LVR bridge
abutment 26
viii
Figure 4.2. Estimated dead load abutment reactions for a 24 ft roadway width 27 Figure 4.3. Estimated dead load abutment reactions for a 30 ft roadway width 27 Figure 4.4. Maximum live load abutment reaction without impact for two, 10 ft design
lanes 29 Figure 4.5. Lateral soil pressure distributions [adapted from the Iowa DOT BDM, 2004] 30 Figure 4.6. Location of anchor block for maximum efficiency
[adapted from Bowles, 1996] 44 Figure 4.7. Soil pressure distribution used to determine the lateral anchor block capacity
[adapted from Bowles, 1996] 45 Figure 5.1. Micropile construction sequence [adapted from FHWA, 2002] 51 Figure 5.2. Cross-section of a GRS bridge abutment
[adapted from Abu-Hejleh et al., 2000] 52 Figure 5.3. A preloaded and prestressed GRS structure
[adapted from Uchimura et al., 1998] 54 Figure 5.4. Geopier element construction sequence [adapted from Wissman et al., 2000] 56 Figure 5.5. High-energy, low-frequency hammer used for the construction of Geopier
foundations [photo courtesy of the Iowa DOT] 56 Figure 5.6. Retaining wall with Geopier uplift elements
[adapted from White et al., 2001] 57 Figure 5.7. Cross-section view of a sheet pile abutment 58 Figure 5.8. Plan view of a combination box and flat sheet pile abutment below the pile
cap 59 Figure 5.9. Plan view of an open cell sheet pile abutment
[adapted from Nottingham et al., 2000] 61

ix
LIST OF TABLES
Table 3.1. Summary of the soil properties used in LPILE 20 Table 4.1. Nominal axial pile factors for various superstructure systems 32 Table 4.2. Effective length factors and pile lengths between braced points 39 Table B.1. Summary of survey TR-486 83

1. INTRODUCTION
1.1. BACKGROUND
In the 1994 Iowa Highway Research Board (Iowa HRB) Project HR-365, several replacement
bridges being used by Iowa counties and the surrounding states were identified, reviewed and
evaluated [1]. Results of a survey of the Iowa County Engineers and neighboring states indicates
that:
Sixty-nine percent of the Iowa counties have the capabilities to construct relatively short
spans bridges with their own forces.
The most commonly used replacement bridges are continuous concrete slabs and prestressed
concrete girder bridges for the primary reason that standard designs are readily available and
have minimal maintenance requirements.
There are several unique replacement bridge systems that are constructed by county forces.
Two bridges systems were identified for additional investigation.
The development of the first system, Steel Beam Precast Units, started in the Iowa HRB
Project HR-382 [2, 3]. The Steel Beam Precast Unit concept involves the fabrication of a precast unit
constructed by county forces. The precast units are composed of two steel beams connected by a
composite concrete slab. The deck thickness in the precast units are limited to reduce unit weight so
that the units can be fabricated off site and then transported to the bridge site. Once at the bridge site,
adjacent precast units are connected and the remaining overlay portion of the concrete deck is placed.
A Steel Beam Precast Unit demonstration bridge was constructed and tested along with the
development of design software, a set of designs for a range of roadway widths and span lengths, and
generic plans.
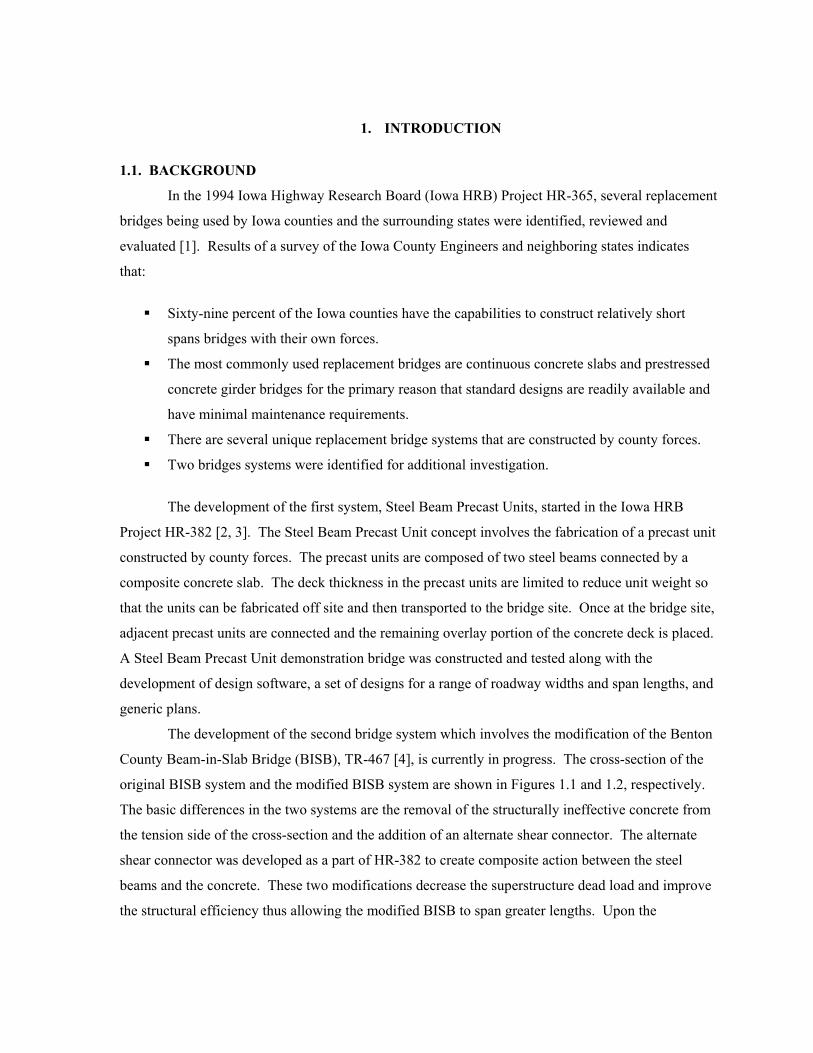
The development of the second bridge system which involves the modification of the Benton
County Beam-in-Slab Bridge (BISB), TR-467 [4], is currently in progress. The cross-section of the
original BISB system and the modified BISB system are shown in Figures 1.1 and 1.2, respectively.
The basic differences in the two systems are the removal of the structurally ineffective concrete from
the tension side of the cross-section and the addition of an alternate shear connector. The alternate
shear connector was developed as a part of HR-382 to create composite action between the steel
beams and the concrete. These two modifications decrease the superstructure dead load and improve
the structural efficiency thus allowing the modified BISB to span greater lengths. Upon the
2
Figure 1.1. Cross-section of the original beam-in-slab system [adapted from Klaiber et al., 2004].
Figure 1.2. Cross section of a modified beam-in-slab system [adapted from Klaiber et al., 2004].
completion of TR-467, a design methodology will be developed along with a generic set of plans for
the bridge system.
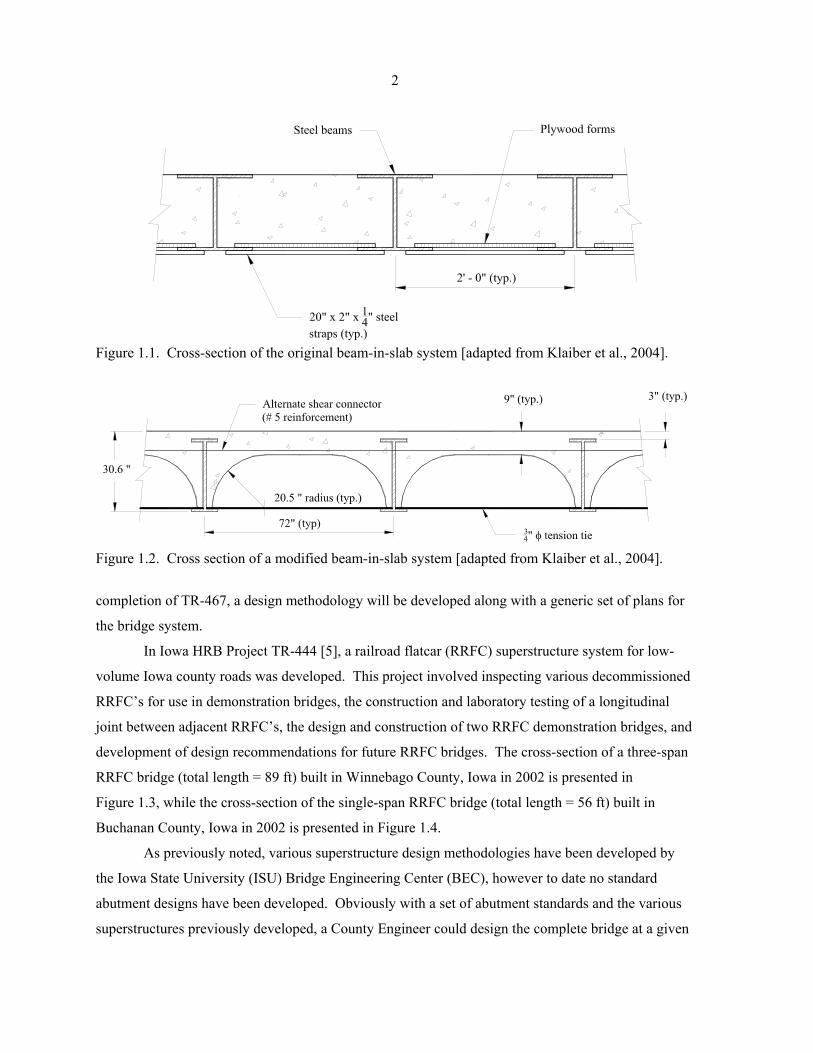
In Iowa HRB Project TR-444 [5], a railroad flatcar (RRFC) superstructure system for low-
volume Iowa county roads was developed. This project involved inspecting various decommissioned
RRFC’s for use in demonstration bridges, the construction and laboratory testing of a longitudinal
joint between adjacent RRFC’s, the design and construction of two RRFC demonstration bridges, and
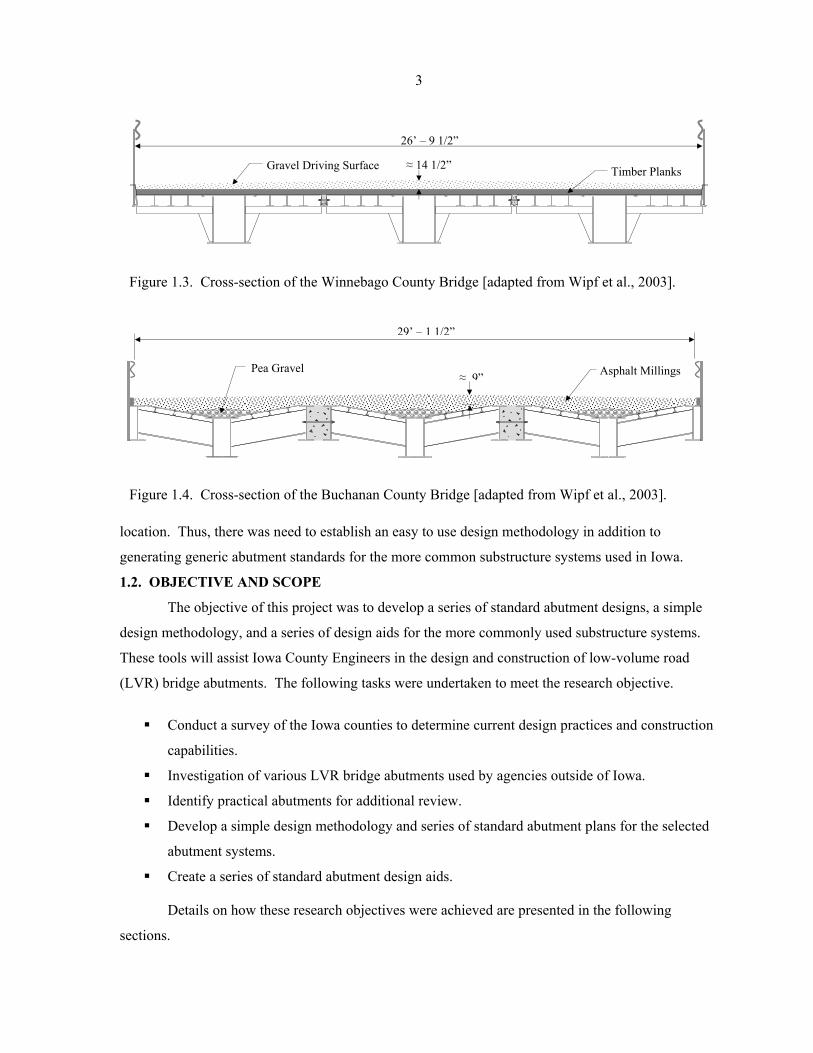
development of design recommendations for future RRFC bridges. The cross-section of a three-span
RRFC bridge (total length = 89 ft) built in Winnebago County, Iowa in 2002 is presented in
Figure 1.3, while the cross-section of the single-span RRFC bridge (total length = 56 ft) built in
Buchanan County, Iowa in 2002 is presented in Figure 1.4.
As previously noted, various superstructure design methodologies have been developed by
the Iowa State University (ISU) Bridge Engineering Center (BEC), however to date no standard
abutment designs have been developed. Obviously with a set of abutment standards and the various
superstructures previously developed, a County Engineer could design the complete bridge at a given
3
location. Thus, there was need to establish an easy to use design methodology in addition to
generating generic abutment standards for the more common substructure systems used in Iowa.
1.2. OBJECTIVE AND SCOPE
The objective of this project was to develop a series of standard abutment designs, a simple
design methodology, and a series of design aids for the more commonly used substructure systems.
These tools will assist Iowa County Engineers in the design and construction of low-volume road
(LVR) bridge abutments. The following tasks were undertaken to meet the research objective.
Conduct a survey of the Iowa counties to determine current design practices and construction
capabilities.
Investigation of various LVR bridge abutments used by agencies outside of Iowa.
Identify practical abutments for additional review.
Develop a simple design methodology and series of standard abutment plans for the selected
abutment systems.
Create a series of standard abutment design aids.
Details on how these research objectives were achieved are presented in the following
sections.
Figure 1.3. Cross-section of the Winnebago County Bridge [adapted from Wipf et al., 2003].
Gravel Driving Surface Timber Planks
26’ – 9 1/2”
≈ 14 1/2”
Figure 1.4. Cross-section of the Buchanan County Bridge [adapted from Wipf et al., 2003].
Pea Gravel Asphalt Millings
29’ – 1 1/2”
≈ 9”
4
1.3. REPORT SUMMARY
This report is divided into three volumes. Volume 1 includes the survey results of the Iowa
County Engineers, the development of the abutment design methodology, standard designs, design
aids, and a summary of additional research required. Many different sources of information were
utilized in the development of the standard abutment plans and design aids. This includes technical
articles, the websites of several state departments of transportation (DOT’s), plus the input of local
Iowa County Engineers. This input from the local Iowa Engineers was obtained from a survey
distributed by the BEC to the Iowa County Engineers and from members of the Project Advisory
Committee (PAC). The members of the PAC represented Iowa counties as well as the Iowa
Department of Transportation (Iowa DOT).
Volume 1: Development of Design Methodology also includes the design methodology
developed for this project. This includes the determination of gravity and lateral loads, performing
the structural analysis, computing the system capacity, and performing various design requirement
checks. A summary of research needed on alternative abutment systems (which are easy to construct,
applicable in a wide range of situations, and are cost competitive) is also presented.
Volume 2: Users Manual provides a set of LVR bridge abutment design aids and instructions
on how to use them. All of the design aids and design equations are included in the appendices of
Volume 2. This includes: estimated gravity loads, driven pile foundation soils information chart,
printouts from the foundation design template, generic standard abutment plans, and design
methodology equations with selected figures.
In Volume 2, three figures are provided to determine conservative dead and live load
abutment reactions for various span lengths of some LVR bridge systems. A description of all input
values required for using the foundation design template (FDT) along with recommendations for the
optimization of a foundation design are presented. The instructions for using the standard abutment
plans are also provided. By modifying the abutment bearing surface, this methodology can be used to
design the foundation system for essentially any type of bridge superstructure system.
Volume 3: Verification of Design Methodology provides two sets of calculations that
demonstrate the application of the substructure design methodology developed in this project. These
calculations also verify the accuracy of the FDT. The printouts from the FDT are provided at the end
of each example. Additionally, several tables present various foundation details for a pre-cast double
tee superstructure (PCDT) with different combinations of soil type, backwall height, and pile type.
5
2. INPUT FROM IOWA ENGINEERS
The objective of this project was to create an easy-to-use design methodology and design aids
to assist Iowa County Engineers in the development, design, and construction of various types of
LVR bridge abutments. To accomplish this objective, local Iowa Engineers needed to be actively
involved in the project, providing information, guidelines and recommendations to the research team.
This included providing information on the design of the most common abutment systems,
construction practices, and the county capabilities in these respective areas. This information was
collected through a survey sent to the Iowa counties and from the PAC recommendations.
2.1. TR-486 SURVEY
Prior to this project, the design methodologies and construction practices of the Iowa counties
were not entirely known. This included the details and types of bridge site investigations conducted
prior to the design, what percentage of counties design and construct their own abutments, what
percentage hire a consultant or contractor for the substructure design and/or construction, the
equipment and labor requirements for the construction of the most common abutment types, and the
common foundation element trends or patterns for various geographic locations throughout the state.
2.1.1. Objective and Scope of Survey
The objective of this survey was to obtain information relating to the common abutment
designs and construction practices of Iowa counties. This information was collected to help guide
other aspects of this project. One area of primary interest was the type and level of design work
performed by the Iowa County Engineers for LVR bridge abutments. Specifically, it was desired to
know if county engineering departments perform a majority of the design work in-house, or if private
consultants are hired. Information relating to design methodologies and standard abutment designs
that are commonly used as well as their limitations and applicability was also desired.
Another area of interest was related to the bridge foundation. This includes information on
the type, quantity and typical depths of bridge foundation elements (e.g., steel and timber piles).
Similarly, information regarding the common types of subsurface explorations was needed to fully
understand typical county designs.
It was also desired to determine methods used by counties in the construction of LVR bridge
abutments. It was unknown if counties use county personnel for the construction of a typical LVR
bridge or if private contractors are employed. Additionally, the type of equipment and the amount of
labor required for the construction of a typical LVR bridge abutment was not known.
6
In an attempt to answers these questions, TR-486 survey (included in Appendix A) was
developed and sent to Iowa County Engineers in the summer of 2003.
2.1.2. Survey Results and Summary
A detailed summary of the results of the survey is presented in Appendix B. The results in
Appendix B are grouped according to the six Iowa DOT transportation districts. A brief summary of
the complete survey results is presented below:
Forty-six percent of counties (46 of 99 counties) completed and returned the survey.
Seventeen percent of the responses (eight counties) stated that they use some type of standard
abutment design; six counties sent drawings or plans.
For the standard abutment designs that are used by Iowa counties, the following general
limitations apply: single span lengths ranging from 20 to 90 ft, small or no skew angles,
situations when shallow bedrock is typically not encountered, and de-icing salts are generally
not used.
Twenty-six percent of the responses (12 counties) stated that they knew of other agencies
with standard abutment plans. The other agencies listed include: other counties, Oden
Enterprises, and the Iowa DOT. It should be noted that some counties that were mentioned
stated that they did not use standard abutment plans.
The equipment required for the construction of a typical LVR bridge abutment varied by
county. Among the more common pieces of equipment mentioned were: cranes, vibrating
and hammer pile drivers, excavators, and welders.
The labor force required for construction of a standard abutment, when given in terms of
man-hours, varied from 72 to 400 hours depending on the county. Some labor requirements
were stated as: “four laborers” or “three to four workers, three to six weeks”.
Twenty-eight percent of the responses (13 counties) have their own bridge construction crew,
63 percent of the responses (29 counties) hire a contractor and nine percent (4 counties) use
both alternatives.
Fifty-six percent of the responses (26 counties) stated that some type of site investigation is
performed before the installation of bridge foundation elements.
Forty-five percent of the responses (21 counties) specifically stated that some type of
subsurface exploration is performed and 13 percent (six counties) specifically cite that a SPT
test is performed. No other specific soil test was mentioned.
7
Sixty-five percent of the responses (30 counties) stated that steel H-piles are used at least
some of the time, whereas 33 percent of the responses (15 counties) use timber piles at least
some of the time, and ten percent of the responses (5 counties) indicate use of reinforced
concrete piles.
The installation depth for steel H-piles ranged from 20 to 90 ft, depending on the county, with
the most common depth being approximately 40 ft. The depth for timber piles ranged from
20 to 40 ft, depending on the county, with the most common depth being approximately 30 ft.
2.2. PROJECT ADVISORY COMMITTEE (PAC)
In addition to the results from the Iowa County Engineer’s survey, the previously mentioned
PAC was formed to provide additional information and guidance. Members of the PAC consisted of
Brian Keierleber (Buchanan County Engineer), Mark Nahra (Delaware County Engineer), Tom
Schoellen (Assistant Black Hawk County Engineer,), and Dean Bierwagen (Methods Engineer, Iowa
Department of Transportation). The PAC committee was created to provide the research team
professional input throughout the various stages of the project.
The PAC provided very valuable information relating to the scope of the project. In meetings
with the PAC, it was decided that standard abutment designs should include roadway widths of
24 and 30 ft with single span lengths ranging from 20 to 90 ft. It was also suggested that the standard
abutment designs should accommodate different superstructure types such as the RRFC, BISB,
PCDT, prestressed concrete girders (PSC), quad tee’s, glued-laminated (glulam) timber girders, and
slab bridges. Additionally, since 6 to 12 ft is a common range for the abutment backwall heights in
Iowa, it was decided to limit the designs to this range. The PAC noted that most Iowa counties
primarily use steel and timber piles, and thus should be the two materials investigated for use in the
abutment designs. Finally, members of the PAC stated that some type of computer based design aid
would be very useful in assisting the County Engineers in the design of the foundation elements. This
design aid needs to be easy to use and readily available. The operating system suggested by the
members of the PAC was visual basic or an Excel spreadsheet.
After the initial scope of the project was defined, members of the PAC were frequently
contacted about issues relating the design methodology and design aids. Issues such as the use of
anchor systems, tiebacks, sheet piles, and lateral load analysis were all addressed. Additionally,
members of the PAC provided guidance and suggestions on the practicality and format of the design
aids being developed so they could be easily used by Iowa County Engineers.

9
3. LITERATURE REVIEW
A literature search was performed to collect information on standard abutment plans and
design methodologies that are currently used for LVR bridge abutments. Several sources including:
1.) all state DOT websites, 2.) the Federal Highway Administration (FHWA), 3.) the Local
Technology Assistance Program (LTAP) network, and 4.) the Transportation Research Information
Services (TRIS) were used in the literature search.
The literature reviewed in this report is not intended to be all inclusive on the topic of LVR
bridge abutments. It focuses primarily on the information required to develop the design
methodology and standard abutment plans for this project. Some additional information such as
available standard abutment designs and alternative abutment systems are also included in this
review.
3.1. ABUTMENT CLASSIFICATIONS
Abutments systems are generally classified as either integral or stub abutments. In an integral
abutment, the superstructure is structurally connected to the substructure with a reinforced concrete
end diaphragm, shear key, and/or reinforcing dowel rods. The structural connection subjects the piles
to bending loads caused by thermally induced horizontal movements as well as the end rotation of the
superstructure from live loads [6]. After a review of project survey results and the input of the PAC
presented in Chapter 2, it was evident that integral abutments systems used in Iowa counties are based
on the standard designs available through the Iowa DOT [7]. Thus, it was decided that there is
already sufficient information available on integral abutments.
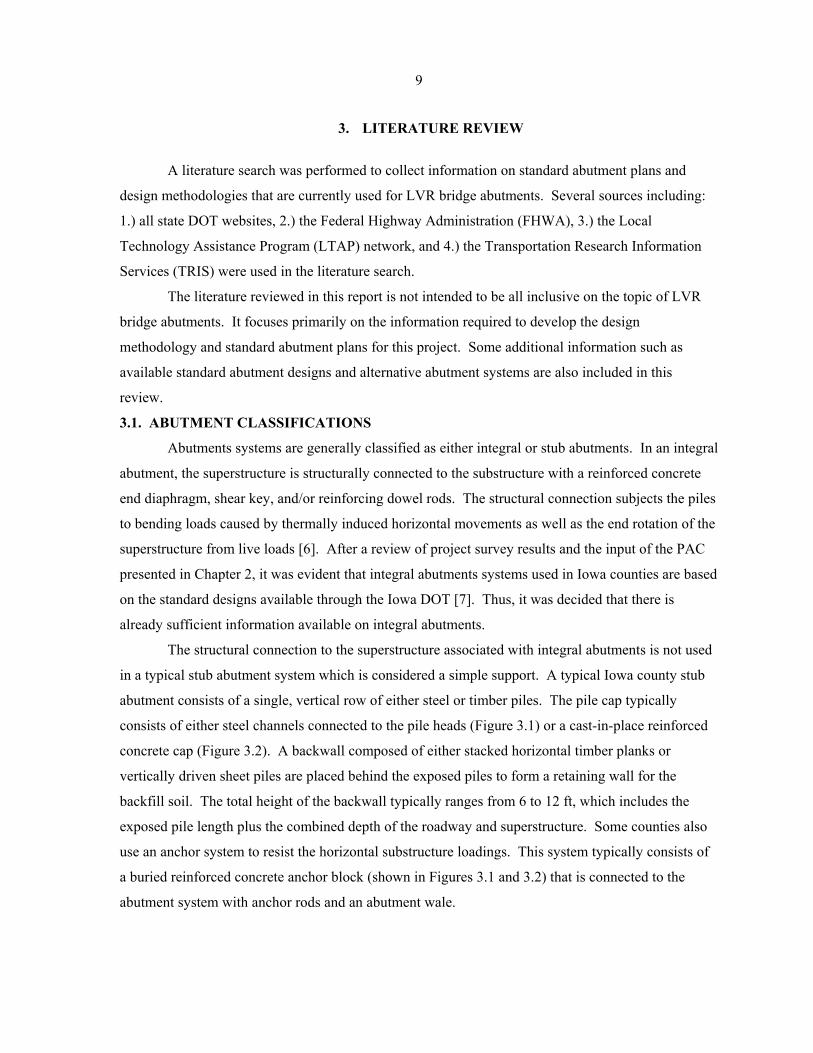
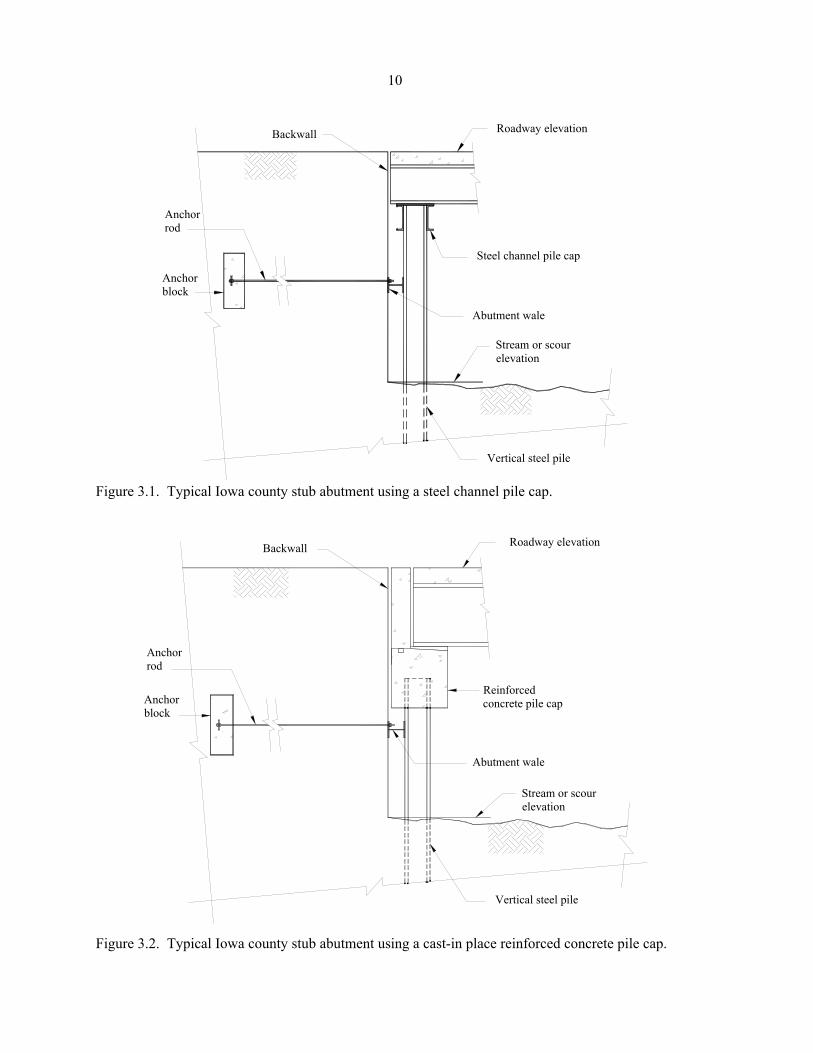
The structural connection to the superstructure associated with integral abutments is not used
in a typical stub abutment system which is considered a simple support. A typical Iowa county stub
abutment consists of a single, vertical row of either steel or timber piles. The pile cap typically
consists of either steel channels connected to the pile heads (Figure 3.1) or a cast-in-place reinforced
concrete cap (Figure 3.2). A backwall composed of either stacked horizontal timber planks or
vertically driven sheet piles are placed behind the exposed piles to form a retaining wall for the
backfill soil. The total height of the backwall typically ranges from 6 to 12 ft, which includes the
exposed pile length plus the combined depth of the roadway and superstructure. Some counties also
use an anchor system to resist the horizontal substructure loadings. This system typically consists of
a buried reinforced concrete anchor block (shown in Figures 3.1 and 3.2) that is connected to the
abutment system with anchor rods and an abutment wale.
10
Backwall
Abutment wale
Vertical steel pile
Stream or scour elevation
Steel channel pile cap
Anchor block
Anchor rod
Roadway elevation
Figure 3.1. Typical Iowa county stub abutment using a steel channel pile cap.
Backwall
Abutment wale
Vertical steel pile
Stream or scour elevation
Reinforced concrete pile capAnchor
block
Anchor rod
Roadway elevation
Figure 3.2. Typical Iowa county stub abutment using a cast-in place reinforced concrete pile cap.
11
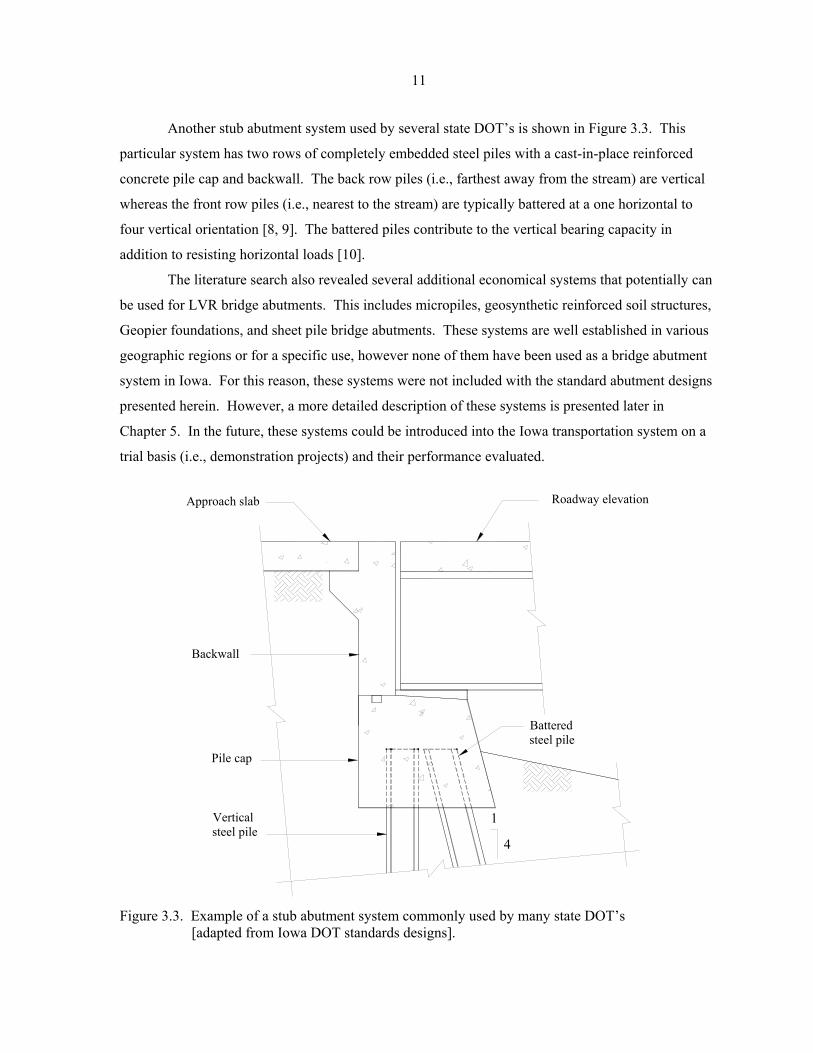
Another stub abutment system used by several state DOT’s is shown in Figure 3.3. This
particular system has two rows of completely embedded steel piles with a cast-in-place reinforced
concrete pile cap and backwall. The back row piles (i.e., farthest away from the stream) are vertical
whereas the front row piles (i.e., nearest to the stream) are typically battered at a one horizontal to
four vertical orientation [8, 9]. The battered piles contribute to the vertical bearing capacity in
addition to resisting horizontal loads [10].
The literature search also revealed several additional economical systems that potentially can
be used for LVR bridge abutments. This includes micropiles, geosynthetic reinforced soil structures,
Geopier foundations, and sheet pile bridge abutments. These systems are well established in various
geographic regions or for a specific use, however none of them have been used as a bridge abutment
system in Iowa. For this reason, these systems were not included with the standard abutment designs
presented herein. However, a more detailed description of these systems is presented later in
Chapter 5. In the future, these systems could be introduced into the Iowa transportation system on a
trial basis (i.e., demonstration projects) and their performance evaluated.
1
4
Pile cap
Roadway elevation
Backwall
Approach slab
Vertical steel pile
Battered steel pile
Figure 3.3. Example of a stub abutment system commonly used by many state DOT’s
[adapted from Iowa DOT standards designs].
12
3.2. AVAILABLE ABUTMENT DESIGN INFORMATION
An item of particular interest in this literature review was standard abutment plans and
designs. The Iowa DOT has developed a series of bridge standards for Iowa county roads [7]. These
include standards for prestressed girder and slab bridges with either integral or stub abutments. For
example, the Iowa DOT H24S-87 and H30S-87 standards provide complete superstructure and
substructure details for a single span, prestressed concrete girder bridge with a roadway width of
24 and 30 ft and span lengths ranging from 30 to 80 ft. The substructure details are similar to those
shown in Figure 3.2, which includes a single row of exposed timber piles, a timber plank backwall,
and a cast-in-place reinforced concrete pile cap. However the bridge superstructure is integral with
the pile cap and backwall system unlike Figure 3.2. Other Iowa DOT standard bridge designs include
H24-87, H30-94, J24-87, and J30-87. These standards provide design details for three-span
prestressed girder and slab bridges with roadway widths of either 24 or 30 ft. The total bridge lengths
range from 126 to 243 ft and 75 to 125 ft for the prestressed concrete girder and slab bridges
standards, respectively. The substructure details consist of an integral abutment with a single row of
vertical piles.
A review of all 50 state DOT websites revealed a number of different abutment standards
available online. Most standards utilize fully embedded piles with either a cast-in-place or pre-cast
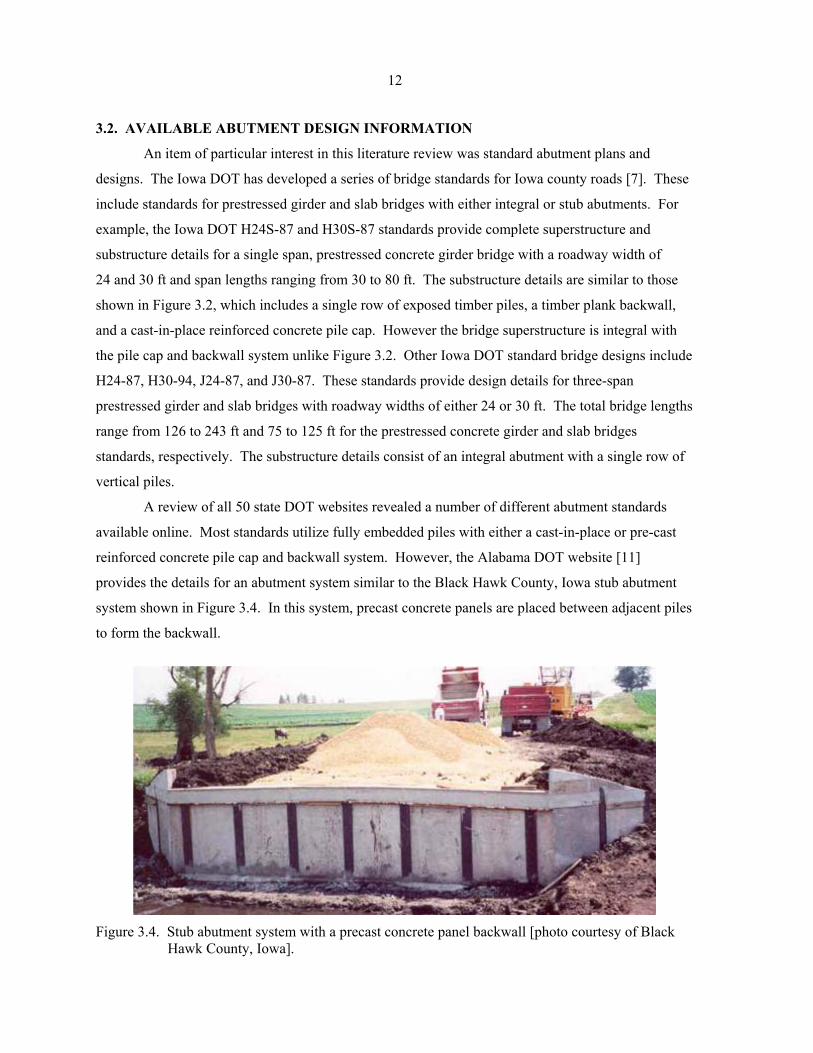
reinforced concrete pile cap and backwall system. However, the Alabama DOT website [11]
provides the details for an abutment system similar to the Black Hawk County, Iowa stub abutment
system shown in Figure 3.4. In this system, precast concrete panels are placed between adjacent piles
to form the backwall.
Figure 3.4. Stub abutment system with a precast concrete panel backwall [photo courtesy of Black
Hawk County, Iowa].
13
Various state DOT websites, including Iowa [8], New York [12], Ohio [13], Oklahoma [14],
Pennsylvania [9], and Texas [15] also provide abutment standards on-line. Additionally,
Pennsylvania and Oklahoma provide standard abutment designs specifically for LVR bridge
abutments. The Pennsylvania DOT standard design sheets are in a generic format in which the
engineer can calculate and then fill-in the necessary information (e.g. roadway width, etc.). The
Oklahoma DOT LVR bridge abutment standards sheets are not generic, however standard sheets are
available for different superstructure types, span lengths and skew angles.
The National Cooperative Highway Research Program (NCHRP) Synthesis 32-08: Cost
Effective Structures for Off-system Bridges [16] provides a comprehensive summary of different
organizations and government agencies with published bridge standard designs. For example, in the
late 1970’s and 1980’s, the FHWA published bridge standards for concrete, steel and timber
superstructures. Unfortunately, these bridge standards have not been updated to include code
changes. Other organizations such as the American Iron and Steel Institute, the Concrete Reinforcing
Steel Institute, the U.S. Army Corps of Engineers, the U.S. Navy Facilities Command, and the
Precast/Prestressed Concrete Institute have also published bridge standards that include substructure
details.
3.3. LATERAL LOAD ANALYSIS TECHNIQUES
The foundation elements most commonly used for LVR bridge abutments in Iowa consist of
the vertical steel or timber piles previously described. Two different methods for determining the pile
behavior when subjected to lateral loads were reviewed for this project.
3.3.1. Non-Linear Analysis
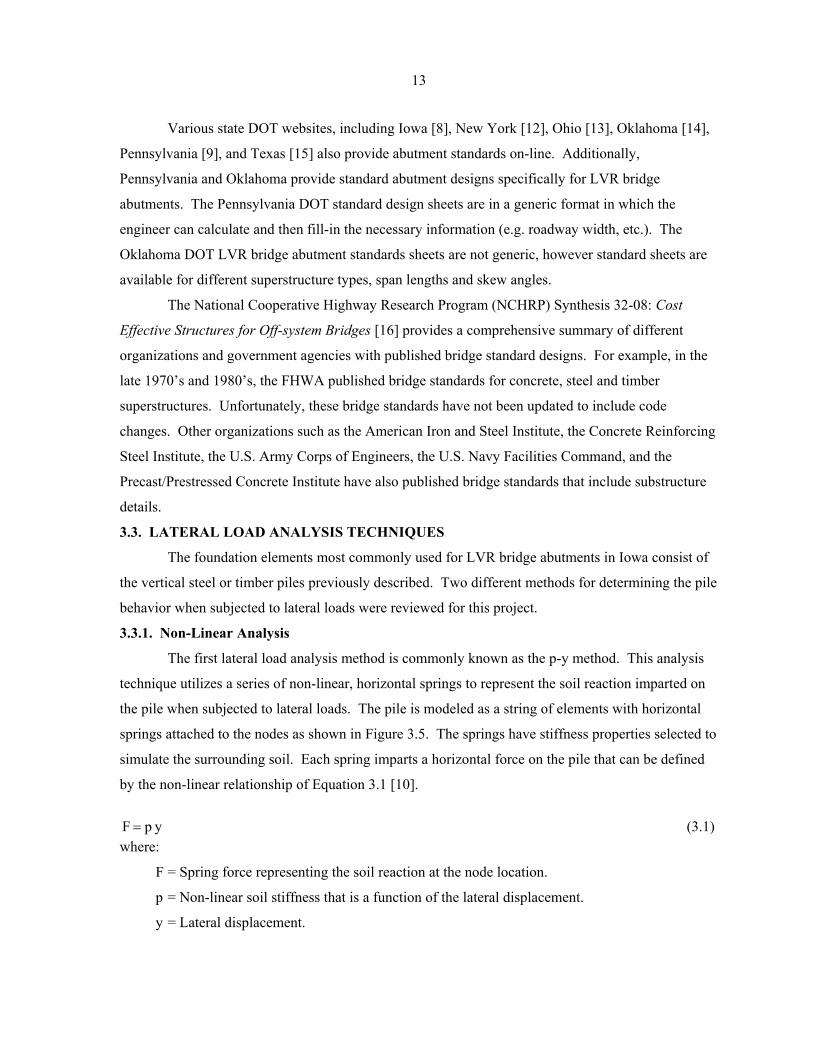
The first lateral load analysis method is commonly known as the p-y method. This analysis
technique utilizes a series of non-linear, horizontal springs to represent the soil reaction imparted on
the pile when subjected to lateral loads. The pile is modeled as a string of elements with horizontal
springs attached to the nodes as shown in Figure 3.5. The springs have stiffness properties selected to
simulate the surrounding soil. Each spring imparts a horizontal force on the pile that can be defined
by the non-linear relationship of Equation 3.1 [10].
ypF = (3.1)
where:
F = Spring force representing the soil reaction at the node location.
p = Non-linear soil stiffness that is a function of the lateral displacement.
y = Lateral displacement.
14
Figure 3.5. Pile model with non-linear springs [adapted from Bowles, 1996].
The magnitude of the applied soil stress has a significant influence on the soil stiffness. As
the depth below the ground surface increases, the associated increase in vertical stress will induce an
associated increase in the soil stiffness. Additionally, the lateral pile movement will also convey
additional stresses on the soil. Because of the dependence on depth, different non-linear spring
stiffness values are assigned to each spring in the pile model thus creating a statically indeterminate,
non-linear system. Typically, empirical equations developed from lateral load tests are used to model
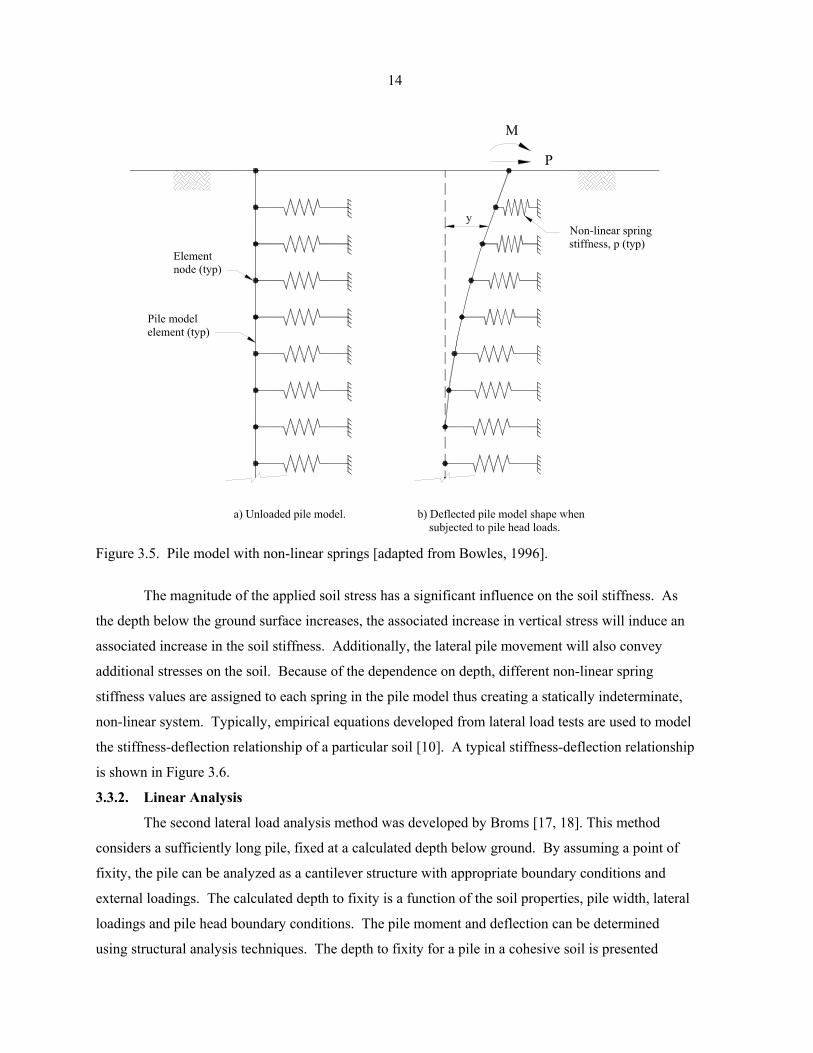
the stiffness-deflection relationship of a particular soil [10]. A typical stiffness-deflection relationship
is shown in Figure 3.6.
3.3.2. Linear Analysis
The second lateral load analysis method was developed by Broms [17, 18]. This method
considers a sufficiently long pile, fixed at a calculated depth below ground. By assuming a point of
fixity, the pile can be analyzed as a cantilever structure with appropriate boundary conditions and
external loadings. The calculated depth to fixity is a function of the soil properties, pile width, lateral
loadings and pile head boundary conditions. The pile moment and deflection can be determined
using structural analysis techniques. The depth to fixity for a pile in a cohesive soil is presented
15
0
100
200
300
400
500
600
0.00 0.05 0.10 0.15 0.20 0.25
Deflection, y (in.)
Stiff
ness
, p (l
b/in
.)
Figure 3.6. Example of a typical stiffness-deflection (p-y) curve.
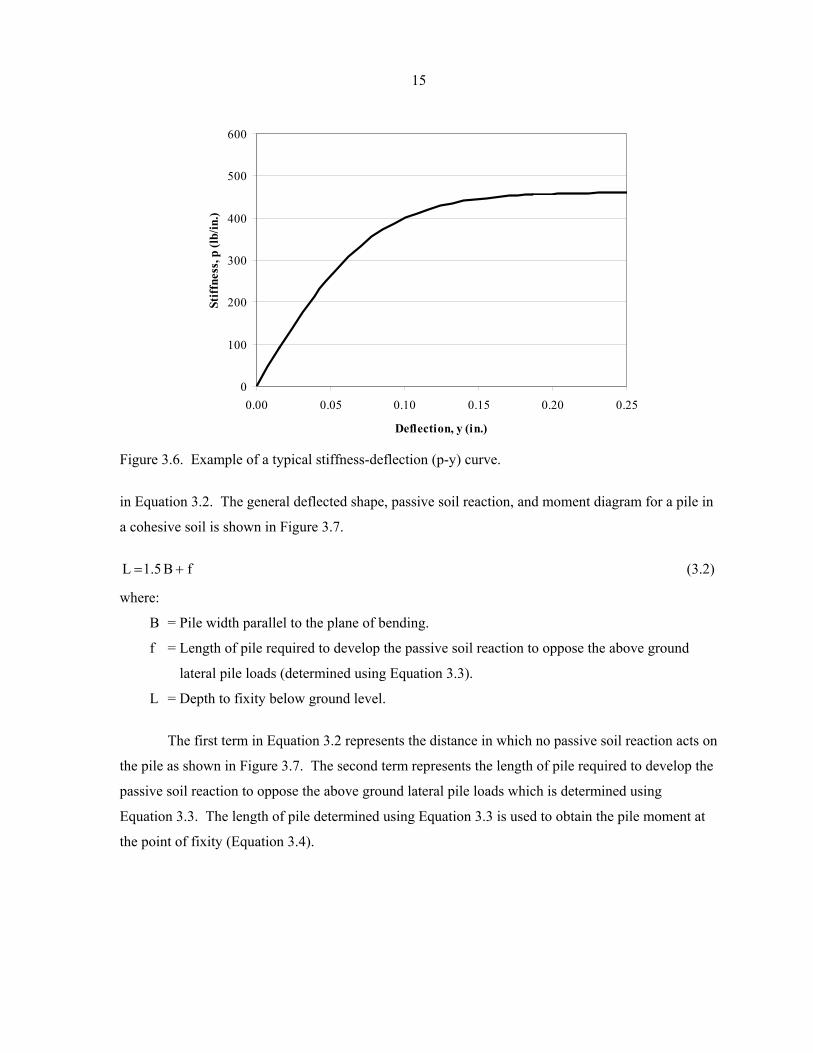
in Equation 3.2. The general deflected shape, passive soil reaction, and moment diagram for a pile in
a cohesive soil is shown in Figure 3.7.
fB5.1L += (3.2)
where:
B = Pile width parallel to the plane of bending.
f = Length of pile required to develop the passive soil reaction to oppose the above ground
lateral pile loads (determined using Equation 3.3).
L = Depth to fixity below ground level.
The first term in Equation 3.2 represents the distance in which no passive soil reaction acts on
the pile as shown in Figure 3.7. The second term represents the length of pile required to develop the
passive soil reaction to oppose the above ground lateral pile loads which is determined using
Equation 3.3. The length of pile determined using Equation 3.3 is used to obtain the pile moment at
the point of fixity (Equation 3.4).
16
M
L
e
H
c) Bending moment. b) Soil reaction (force / length).
a) Pile deflection.
U9 c B
1.5 B
f
Figure 3.7. Behavior of a laterally loaded pile in a cohesive soil [adapted from Broms,
March 1964].
Bc9Hf
u
= (3.3)
where:
B = Pile width parallel to the plane of bending.
c u = Undrained shear strength of the soil.
f = Length of pile required to develop the passive soil reaction to oppose the above
ground lateral pile loads.
H = Total magnitude of the above ground lateral pile loads.
( )f5.0B5.1eHM ++= (3.4)
where:
B = Pile width parallel to the plane of bending.
e = Distance above ground level to the centroid of the lateral pile loads.
17
f = Length of pile required to develop the passive soil reaction to oppose the above
ground lateral pile loads (determined using Equation 3.3).
H = Total magnitude of the above ground lateral pile loads.
M = Moment in pile at the point of fixity.
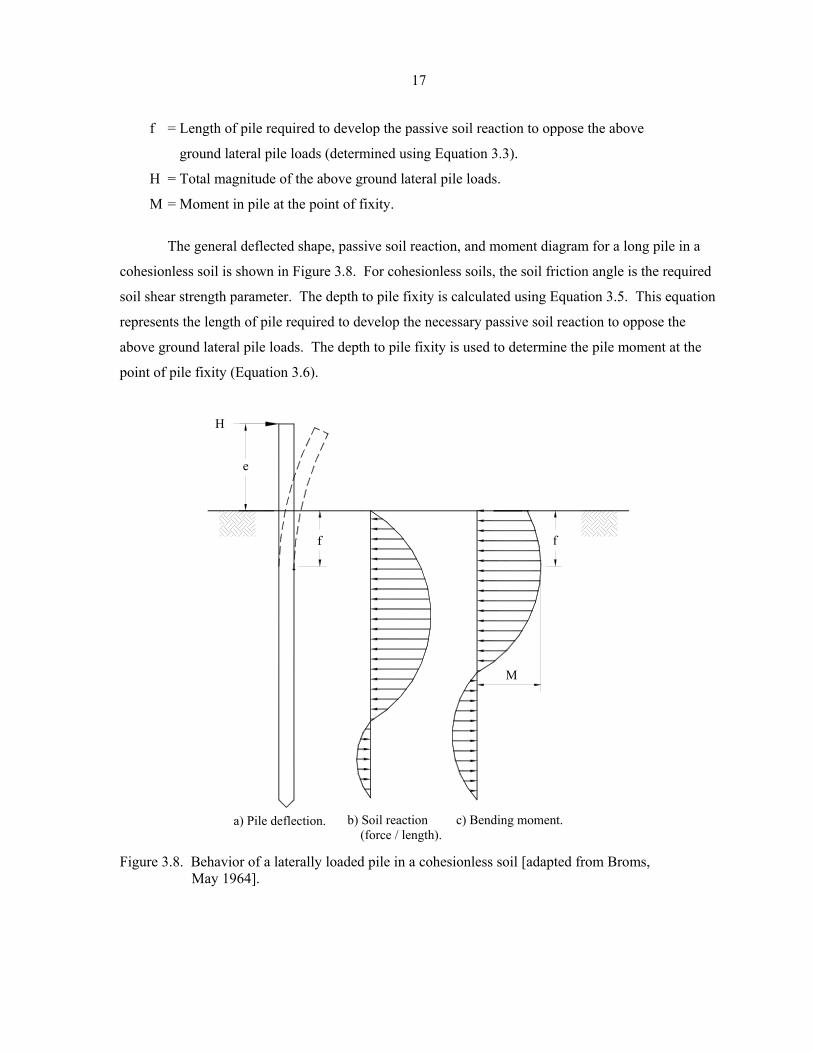
The general deflected shape, passive soil reaction, and moment diagram for a long pile in a
cohesionless soil is shown in Figure 3.8. For cohesionless soils, the soil friction angle is the required
soil shear strength parameter. The depth to pile fixity is calculated using Equation 3.5. This equation
represents the length of pile required to develop the necessary passive soil reaction to oppose the
above ground lateral pile loads. The depth to pile fixity is used to determine the pile moment at the
point of pile fixity (Equation 3.6).
f
M
e
H
c) Bending moment.b) Soil reaction (force / length).
a) Pile deflection.
f
Figure 3.8. Behavior of a laterally loaded pile in a cohesionless soil [adapted from Broms,
May 1964].
18
PKBH82.0f
γ= (3.5)
where:
B = Pile width parallel to the plane of bending.
f = Depth to fixity below ground level and length of pile required to develop the passive
soil reaction to oppose the above ground lateral loads.
H = Total magnitude of the above ground lateral pile loads.
K P = φ−φ+
sin1sin1 = Rankine passive earth pressure coefficient.
γ = Soil unit weight.
φ = Soil friction angle.
( )f67.0eHM += (3.6)
where:
e = Distance above ground level to the centroid of the lateral pile loads.
f = Depth to fixity below ground level (determined using Equation 3.5).
H = Total magnitude of the above ground lateral pile loads.
M = Moment in pile at the point of fixity.
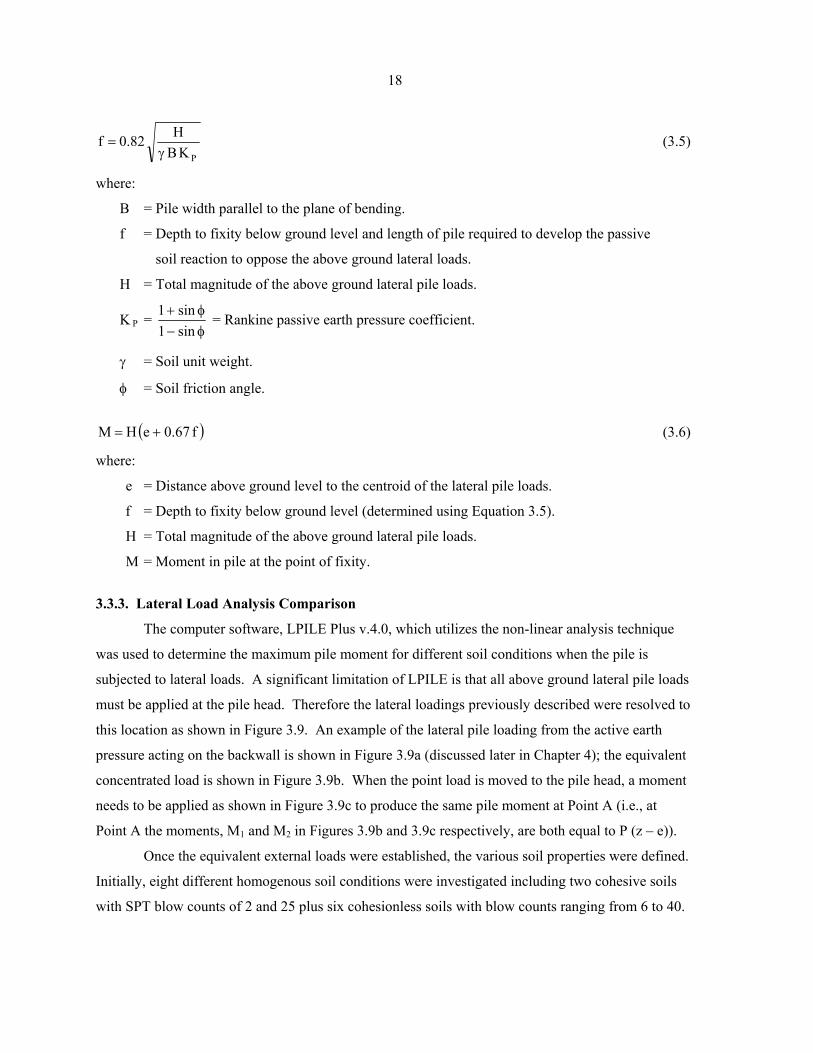
3.3.3. Lateral Load Analysis Comparison
The computer software, LPILE Plus v.4.0, which utilizes the non-linear analysis technique
was used to determine the maximum pile moment for different soil conditions when the pile is
subjected to lateral loads. A significant limitation of LPILE is that all above ground lateral pile loads
must be applied at the pile head. Therefore the lateral loadings previously described were resolved to
this location as shown in Figure 3.9. An example of the lateral pile loading from the active earth
pressure acting on the backwall is shown in Figure 3.9a (discussed later in Chapter 4); the equivalent
concentrated load is shown in Figure 3.9b. When the point load is moved to the pile head, a moment
needs to be applied as shown in Figure 3.9c to produce the same pile moment at Point A (i.e., at
Point A the moments, M1 and M2 in Figures 3.9b and 3.9c respectively, are both equal to P (z – e)).
Once the equivalent external loads were established, the various soil properties were defined.
Initially, eight different homogenous soil conditions were investigated including two cohesive soils
with SPT blow counts of 2 and 25 plus six cohesionless soils with blow counts ranging from 6 to 40.
19
p = γ h K
P = 12 p hh e
P
M = P eRoadway
LC Pile
Roadway Roadway
PileCLLC Pile
a) Soil pressure distribution. b) Equivalent point load. c) Rationalized pile head force and moment.
z zz
A A
M 21Ma
Figure 3.9. Resolving a lateral pile loading to an equivalent pile head point load and moment.
These soils were selected from Table 1.2 in the Iowa DOT Foundation Soils Information Chart (Iowa
DOT FSIC) [19] which is presented as Table B.2 in Appendix B of Volume 2. This table, which is
described later in Chapter 4, provides estimates of the allowable friction and end bearing values for
piles based on the SPT blow count.
The eight soil conditions previously stated can be classified into one of three categories for
LPILE analysis: soft cohesive soils or stiff cohesive soils and cohesionless soils. For soft cohesive
soils, the undrained shear strength and the soil strain value corresponding to one-half the maximum
principal stress difference (ε50) are required in addition to the soil unit weight. Terzaghi and
Peck [20] present one of the more commonly used correlations (see Equation 3.7) between the SPT
blow count and the undrained shear strength. This relationship was selected because the Iowa DOT
FSIC [19] also correlates the SPT blow count to soil bearing properties. Since this correlation can be
unreliable for some in-situ conditions, it is recommended that, whenever possible, the undrained shear
strength be determined by testing soil samples from the bridge site. Estimated ε50 values used in this
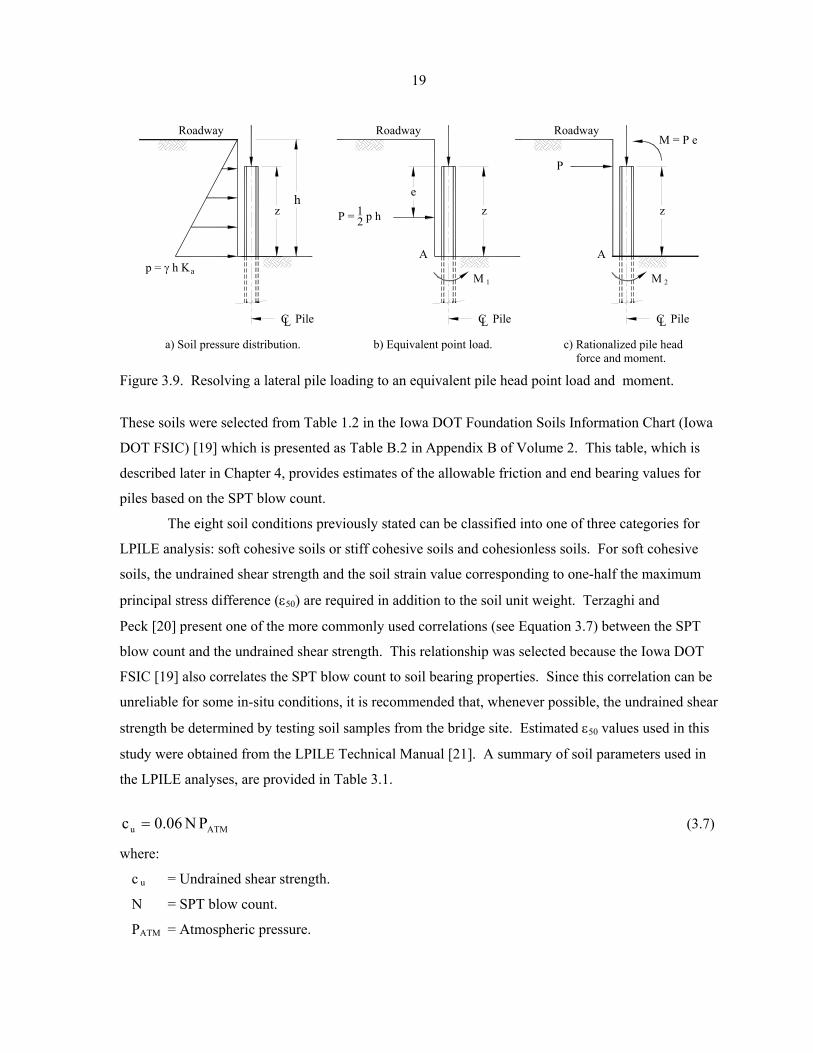
study were obtained from the LPILE Technical Manual [21]. A summary of soil parameters used in
the LPILE analyses, are provided in Table 3.1.
ATMu PN06.0c = (3.7)
where:
c u = Undrained shear strength.
N = SPT blow count.
PATM = Atmospheric pressure.
20
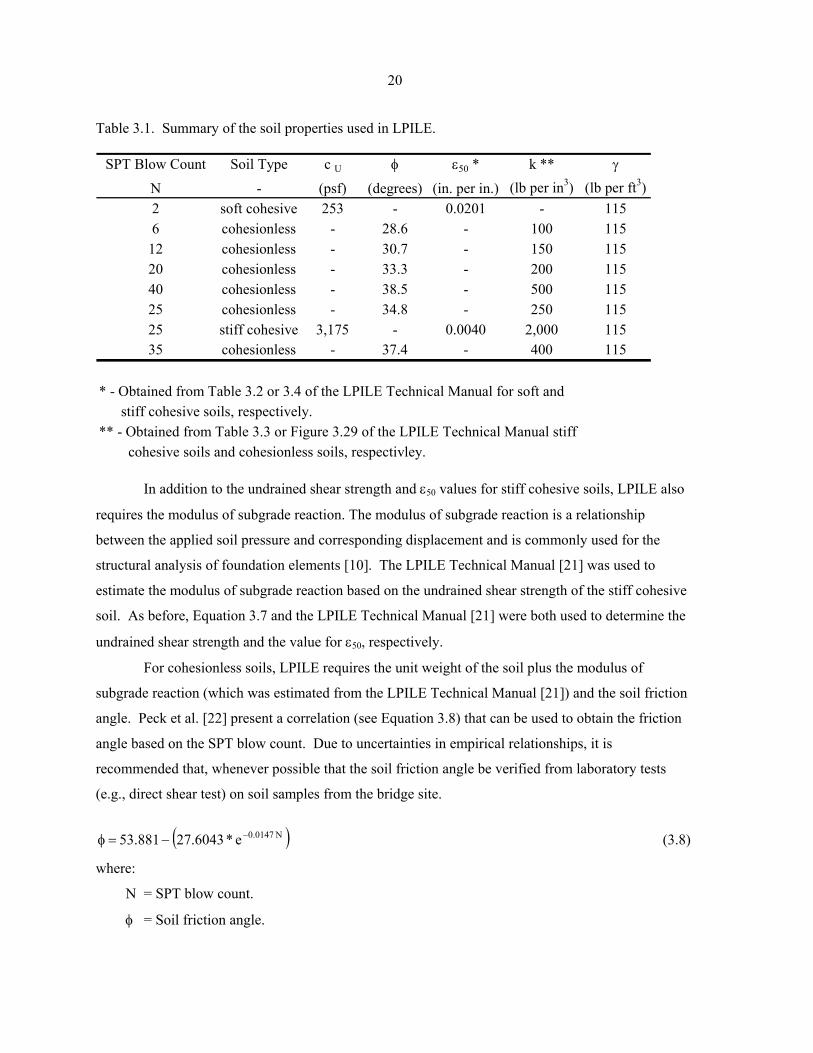
Table 3.1. Summary of the soil properties used in LPILE.
SPT Blow Count Soil Type c U φ ε50 * k ** γ
N - (psf) (degrees) (in. per in.) (lb per in3) (lb per ft3)2 soft cohesive 253 - 0.0201 - 1156 cohesionless - 28.6 - 100 115
12 cohesionless - 30.7 - 150 11520 cohesionless - 33.3 - 200 11540 cohesionless - 38.5 - 500 11525 cohesionless - 34.8 - 250 11525 stiff cohesive 3,175 - 0.0040 2,000 11535 cohesionless - 37.4 - 400 115
stiff cohesive soils, respectively.
cohesive soils and cohesionless soils, respectivley.** - Obtained from Table 3.3 or Figure 3.29 of the LPILE Technical Manual stiff
* - Obtained from Table 3.2 or 3.4 of the LPILE Technical Manual for soft and
In addition to the undrained shear strength and ε50 values for stiff cohesive soils, LPILE also
requires the modulus of subgrade reaction. The modulus of subgrade reaction is a relationship
between the applied soil pressure and corresponding displacement and is commonly used for the
structural analysis of foundation elements [10]. The LPILE Technical Manual [21] was used to
estimate the modulus of subgrade reaction based on the undrained shear strength of the stiff cohesive
soil. As before, Equation 3.7 and the LPILE Technical Manual [21] were both used to determine the
undrained shear strength and the value for ε50, respectively.
For cohesionless soils, LPILE requires the unit weight of the soil plus the modulus of
subgrade reaction (which was estimated from the LPILE Technical Manual [21]) and the soil friction
angle. Peck et al. [22] present a correlation (see Equation 3.8) that can be used to obtain the friction
angle based on the SPT blow count. Due to uncertainties in empirical relationships, it is
recommended that, whenever possible that the soil friction angle be verified from laboratory tests
(e.g., direct shear test) on soil samples from the bridge site.
( )N0147.0e*6043.27881.53 −−=φ (3.8)
where:
N = SPT blow count.
φ = Soil friction angle.
21
The linear analysis technique reported by Broms [17, 18] was also used to determine the
maximum moment in laterally loaded piles for different soil conditions. The undrained shear strength
and soil friction angle are required for cohesive and cohesionless soils, respectively. The SPT blow
count correlations, defined by Equations 3.7 and 3.8, can also be used for this analysis method. As
previously noted, the depth to fixity and the corresponding pile moment is determined using
Equations 3.2 through 3.6 for the various types of soils.
A comparison of the two lateral load analysis techniques reveals the advantages of both
methods. The non-linear method can be used for more complex soil conditions such as a non-
homogenous soil profile. It also provides a more accurate representation of the moment distribution
along the length of the pile. However, specialized geotechnical software, such as LPILE, is needed to
perform this analysis.
Brom’s method [17, 18] does not account for the redistribution of pile loads below the point
of fixity. Additionally, the soil pressure distributions used to determine the depth to fixity and the
shape of the soil reactions were developed in the 1960’s and may not be entirely accurate based on
the non-linear soil load-deflection response shown in Figure 3.6. However, once the shape of the soil
reactions are established, the pile deflection and moment along the length of the pile above the point
of fixity can easily be determined. This analysis technique can also be incorporated into commonly
available spreadsheet software.
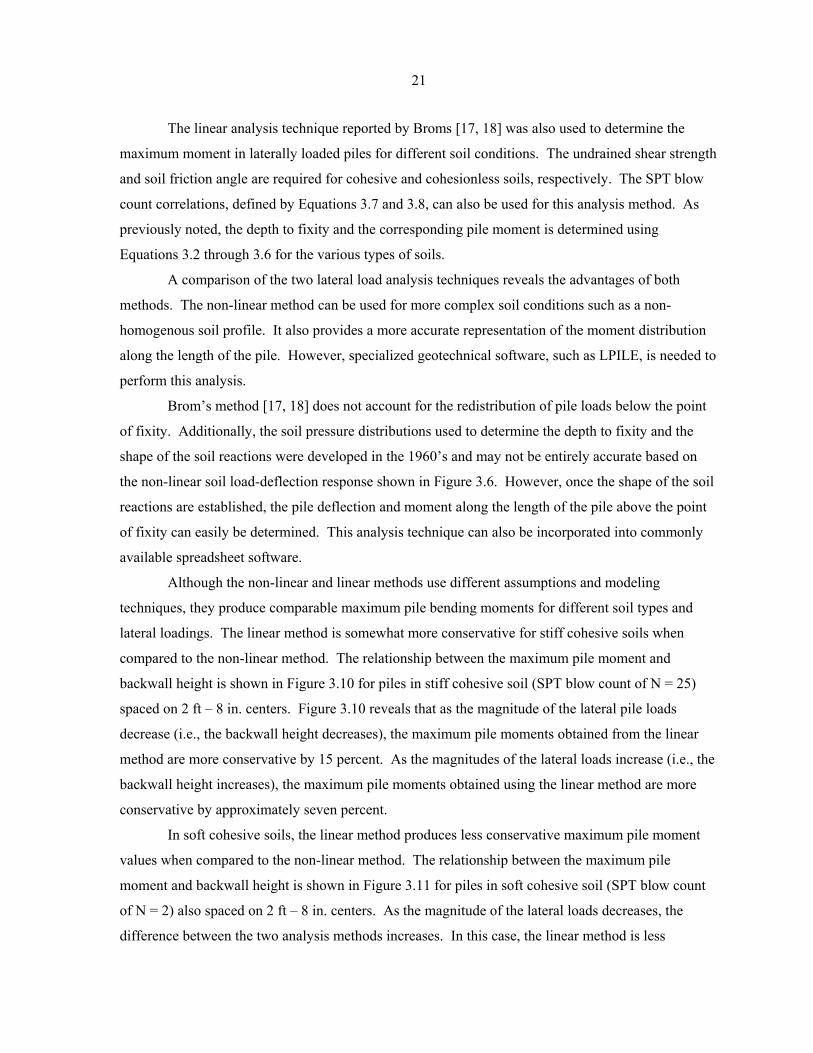
Although the non-linear and linear methods use different assumptions and modeling
techniques, they produce comparable maximum pile bending moments for different soil types and
lateral loadings. The linear method is somewhat more conservative for stiff cohesive soils when
compared to the non-linear method. The relationship between the maximum pile moment and
backwall height is shown in Figure 3.10 for piles in stiff cohesive soil (SPT blow count of N = 25)
spaced on 2 ft – 8 in. centers. Figure 3.10 reveals that as the magnitude of the lateral pile loads
decrease (i.e., the backwall height decreases), the maximum pile moments obtained from the linear
method are more conservative by 15 percent. As the magnitudes of the lateral loads increase (i.e., the
backwall height increases), the maximum pile moments obtained using the linear method are more
conservative by approximately seven percent.
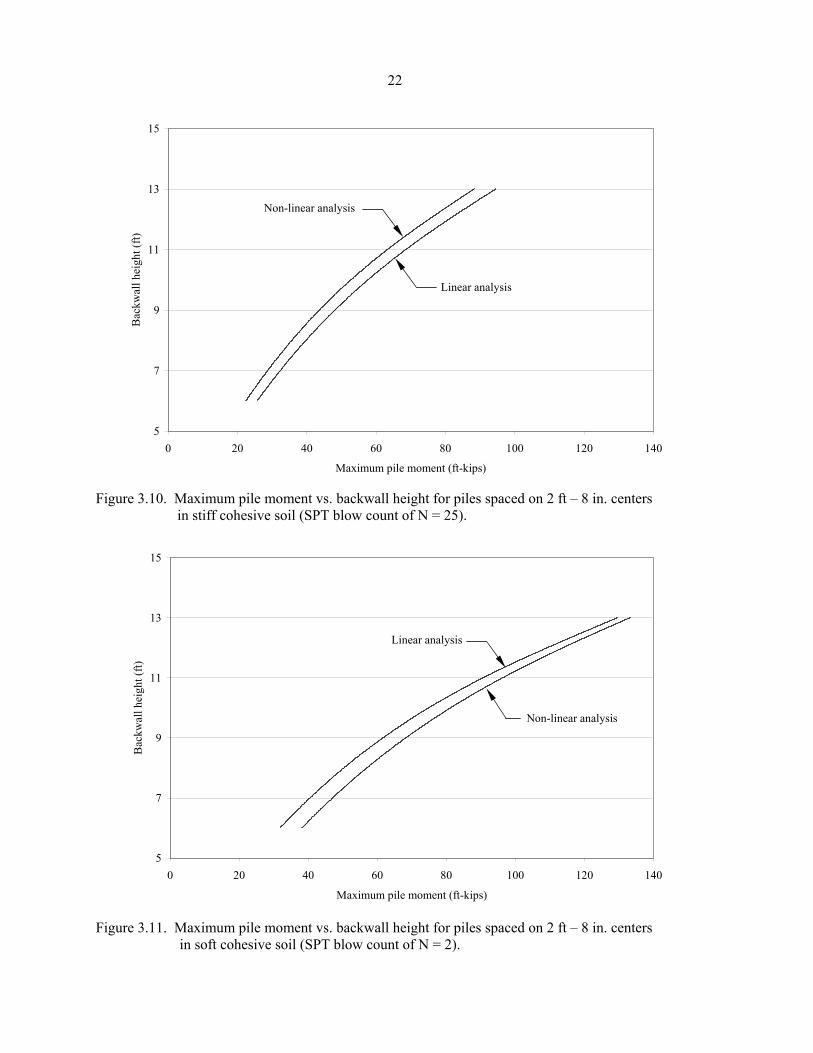
In soft cohesive soils, the linear method produces less conservative maximum pile moment
values when compared to the non-linear method. The relationship between the maximum pile
moment and backwall height is shown in Figure 3.11 for piles in soft cohesive soil (SPT blow count
of N = 2) also spaced on 2 ft – 8 in. centers. As the magnitude of the lateral loads decreases, the
difference between the two analysis methods increases. In this case, the linear method is less
22
5
7
9
11
13
15
0 20 40 60 80 100 120 140
Maximum pile moment (ft-kips)
Bac
kwal
l hei
ght (
ft)
Linear analysis
Non-linear analysis
Figure 3.10. Maximum pile moment vs. backwall height for piles spaced on 2 ft – 8 in. centers
in stiff cohesive soil (SPT blow count of N = 25).
5
7
9
11
13
15
0 20 40 60 80 100 120 140
Maximum pile moment (ft-kips)
Bac
kwal
l hei
ght (
ft)
Linear analysis
Non-linear analysis
Figure 3.11. Maximum pile moment vs. backwall height for piles spaced on 2 ft – 8 in. centers
in soft cohesive soil (SPT blow count of N = 2).
23
conservative by about 20 percent for lower backwall heights. As the magnitude of the lateral loads
increases, the two methods converge to within three percent.
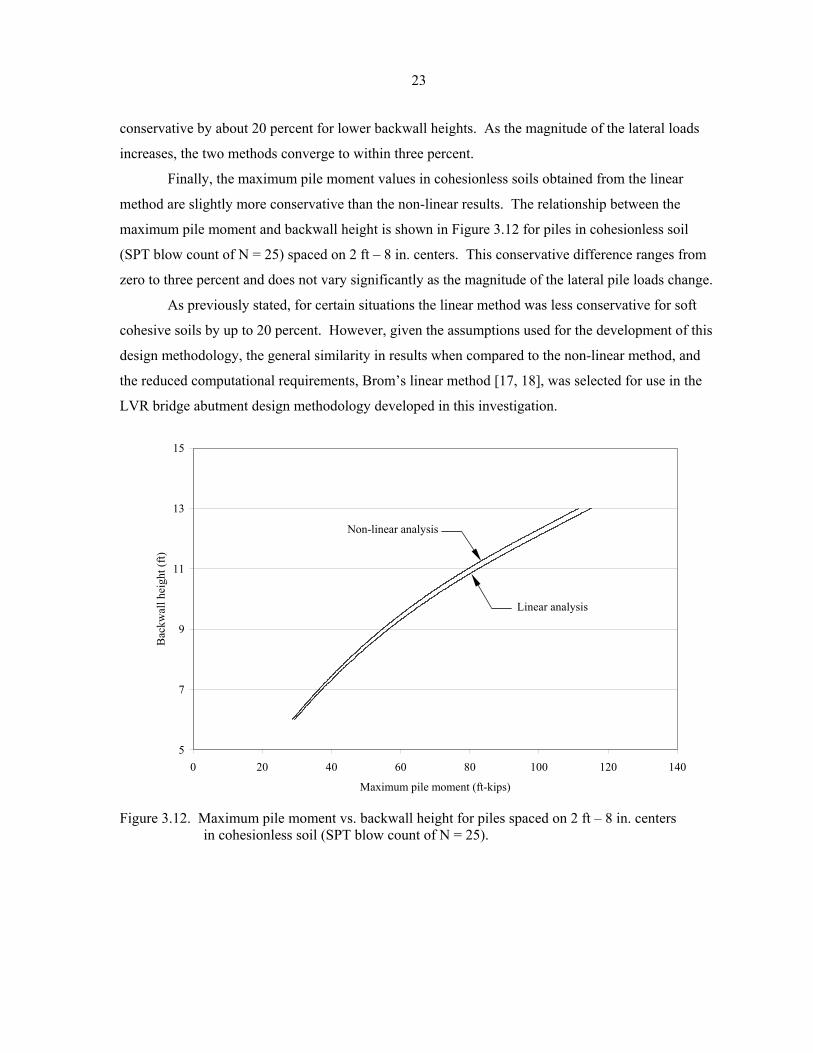
Finally, the maximum pile moment values in cohesionless soils obtained from the linear
method are slightly more conservative than the non-linear results. The relationship between the
maximum pile moment and backwall height is shown in Figure 3.12 for piles in cohesionless soil
(SPT blow count of N = 25) spaced on 2 ft – 8 in. centers. This conservative difference ranges from
zero to three percent and does not vary significantly as the magnitude of the lateral pile loads change.
As previously stated, for certain situations the linear method was less conservative for soft
cohesive soils by up to 20 percent. However, given the assumptions used for the development of this
design methodology, the general similarity in results when compared to the non-linear method, and
the reduced computational requirements, Brom’s linear method [17, 18], was selected for use in the
LVR bridge abutment design methodology developed in this investigation.
5
7
9
11
13
15
0 20 40 60 80 100 120 140
Maximum pile moment (ft-kips)
Bac
kwal
l hei
ght (
ft)
Non-linear analysis
Linear analysis
Figure 3.12. Maximum pile moment vs. backwall height for piles spaced on 2 ft – 8 in. centers
in cohesionless soil (SPT blow count of N = 25).

25
4. DESIGN METHODOLOGY
In this chapter, a design methodology is developed for the foundation elements most
commonly used for LVR bridge abutments in Iowa. This includes determination of substructure
loads, structural analyses, determination of the pile and anchor system capacities, and design
verification. An overview of additional substructure elements such as pile caps, abutment wales, and
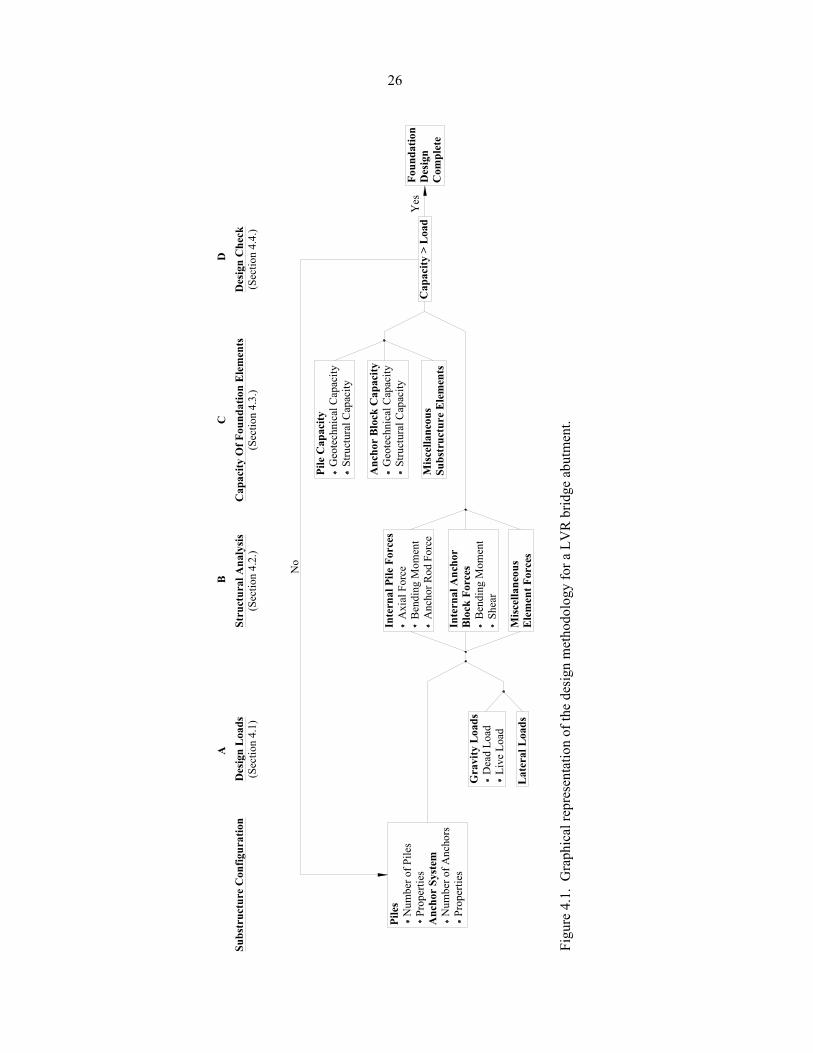
backwalls is also presented. A graphical flow chart of the design methodology is shown in
Figure 4.1.
4.1. DESIGN LOADS
Once the basic substructure configuration is established (i.e., the number of piles, the lateral
restraint system, and the corresponding system properties), the substructure loads must be identified.
This step is denoted as Part A in Figure 4.1. Gravity loads include bridge live loads and dead loads
due to the superstructure and substructure self-weight. Lateral loadings are imparted to the bridge
substructure by active and passive soil pressures in addition to longitudinal braking and lateral wind
loads transmitted through the bridge bearings.
4.1.1. Gravity Loads
The identification of substructure gravity loads includes the self-weight of the bridge
superstructure and substructure in addition to bridge live loads. The total abutment reaction is
obviously equal to the sum of the dead and live load reactions.
4.1.1.1. DEAD LOAD
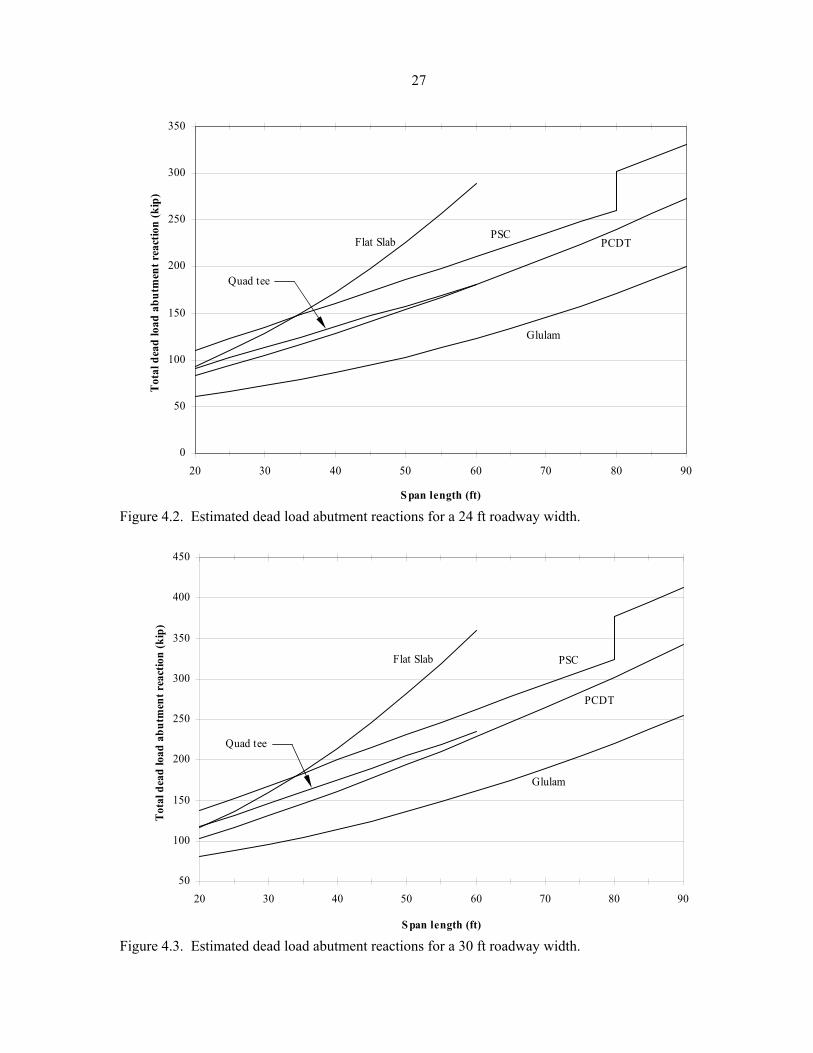
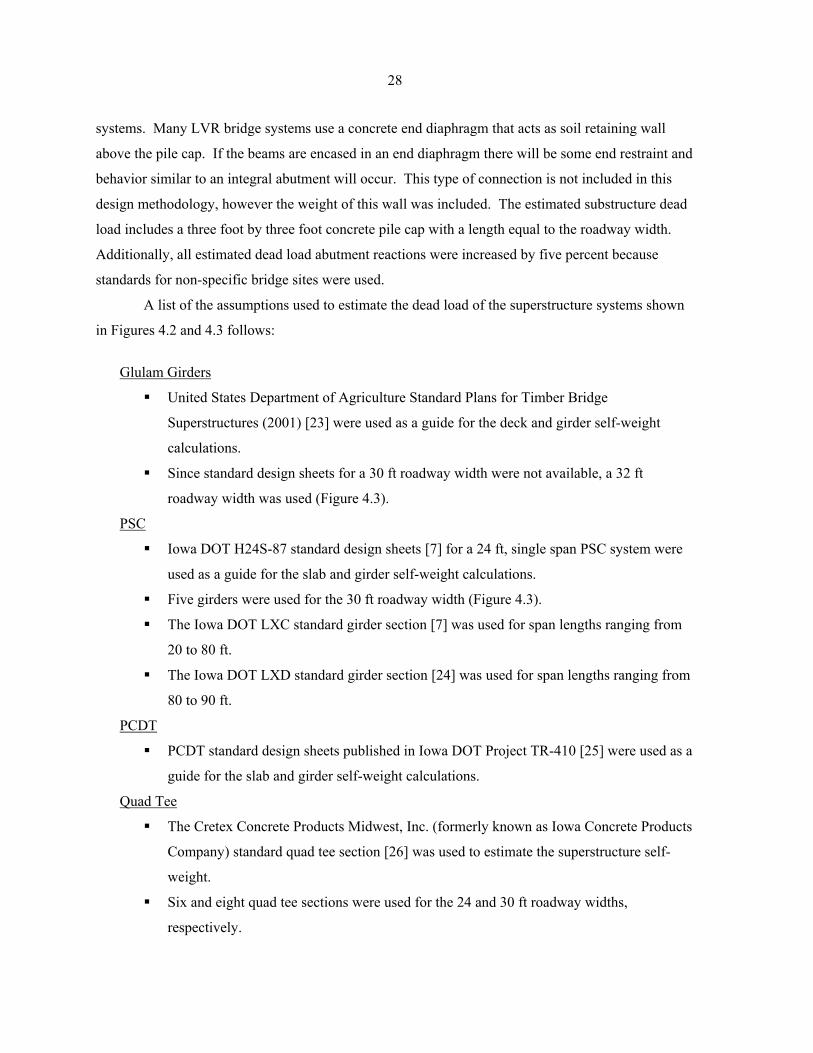
Conservative total dead load abutment reactions for PCDT, PSC, quad tee, glulam, and slab
bridge systems are shown in Figures 4.2 and 4.3 for 24 and 30 ft roadway widths, respectively. It
should be noted that the PCDT dead load abutment reactions can also be used for steel girder
superstructures. These estimated abutment reactions are based on published standard design sheets
for the respective superstructure systems and include the self-weight of both the superstructure and
substructure. More accurate and potentially smaller dead load abutment reactions can be calculated
by using site-specific bridge information. The dead load abutment reactions for other standard
superstructure systems such as the RRFC and BISB systems are not included since there are
numerous different cross sections used in these systems which results in different self-weights.
A number of conservative assumptions, applicable to all superstructure systems previously
listed, were used to estimate the dead load abutment reactions shown in Figures 4.2 and 4.3. For all
superstructure systems, a 20 psf future wearing surface was assumed in addition to two thrie-beam
rails, with a conservatively estimated weight of 50 plf per rail, were assumed for all superstructure
26
Mis
cella
neou
s E
lem
ent F
orce
s
Cap
acity
> L
oad
Mis
cella
neou
s Su
bstr
uctu
re E
lem
ents
Anc
hor
Blo
ck C
apac
ity
Geo
tech
nica
l Cap
acity
St
ruct
ural
Cap
acity
Inte
rnal
Anc
hor
Blo
ck F
orce
s
Ben
ding
Mom
ent
Sh
ear
Lat
eral
Loa
ds
Inte
rnal
Pile
For
ces
A
xial
For
ce
Ben
ding
Mom
ent
A
ncho
r Rod
For
ce
Des
ign
Che
ck(S
ectio
n 4.
4.)
Cap
acity
Of F
ound
atio
n E
lem
ents
(Sec
tion
4.3.
)St
ruct
ural
Ana
lysi
s(S
ectio
n 4.
2.)
Pile
Cap
acity
G
eote
chni
cal C
apac
ity
Stru
ctur
al C
apac
ity
Des
ign
Loa
ds(S
ectio
n 4.
1)
No
Foun
datio
n D
esig
n C
ompl
ete
Gra
vity
Loa
ds
Dea
d Lo
ad
Live
Loa
d
Yes
Subs
truc
ture
Con
figur
atio
n
Pile
s
Num
ber o
f Pile
s
Prop
ertie
sA
ncho
r Sy
stem
N
umbe
r of A
ncho
rs
Prop
ertie
s
Figu
re 4
.1.
Gra
phic
al re
pres
enta
tion
of th
e de
sign
met
hodo
logy
for a
LV
R b
ridge
abu
tmen
t.CB
AD
27
0
50
100
150
200
250
300
350
20 30 40 50 60 70 80 90
S pan length (ft)
Tot
al d
ead
load
abu
tmen
t rea
ctio
n (k
ip)
PCDTPSC
Flat Slab
Glulam
Quad tee
Figure 4.2. Estimated dead load abutment reactions for a 24 ft roadway width.
50
100
150
200
250
300
350
400
450
20 30 40 50 60 70 80 90
S pan length (ft)
Tot
al d
ead
load
abu
tmen
t rea
ctio
n (k
ip)
PSCFlat Slab
Quad tee
PCDT
Glulam
Figure 4.3. Estimated dead load abutment reactions for a 30 ft roadway width.
28
systems. Many LVR bridge systems use a concrete end diaphragm that acts as soil retaining wall
above the pile cap. If the beams are encased in an end diaphragm there will be some end restraint and
behavior similar to an integral abutment will occur. This type of connection is not included in this
design methodology, however the weight of this wall was included. The estimated substructure dead
load includes a three foot by three foot concrete pile cap with a length equal to the roadway width.
Additionally, all estimated dead load abutment reactions were increased by five percent because
standards for non-specific bridge sites were used.
A list of the assumptions used to estimate the dead load of the superstructure systems shown
in Figures 4.2 and 4.3 follows:
Glulam Girders
United States Department of Agriculture Standard Plans for Timber Bridge
Superstructures (2001) [23] were used as a guide for the deck and girder self-weight
calculations.
Since standard design sheets for a 30 ft roadway width were not available, a 32 ft
roadway width was used (Figure 4.3).
PSC
Iowa DOT H24S-87 standard design sheets [7] for a 24 ft, single span PSC system were
used as a guide for the slab and girder self-weight calculations.
Five girders were used for the 30 ft roadway width (Figure 4.3).
The Iowa DOT LXC standard girder section [7] was used for span lengths ranging from
20 to 80 ft.
The Iowa DOT LXD standard girder section [24] was used for span lengths ranging from
80 to 90 ft.
PCDT
PCDT standard design sheets published in Iowa DOT Project TR-410 [25] were used as a
guide for the slab and girder self-weight calculations.
Quad Tee
The Cretex Concrete Products Midwest, Inc. (formerly known as Iowa Concrete Products
Company) standard quad tee section [26] was used to estimate the superstructure self-
weight.
Six and eight quad tee sections were used for the 24 and 30 ft roadway widths,
respectively.
29
Slab Bridge
Iowa DOT J24-87 standard design sheets [7] for a 24 ft, three span slab bridge were used
as a guide for superstructure self-weight calculations.
The center span length to slab depth ratios of the Iowa DOT J24-87 standard design
sheets [7] were used to estimate the slab depths for all applicable span lengths.
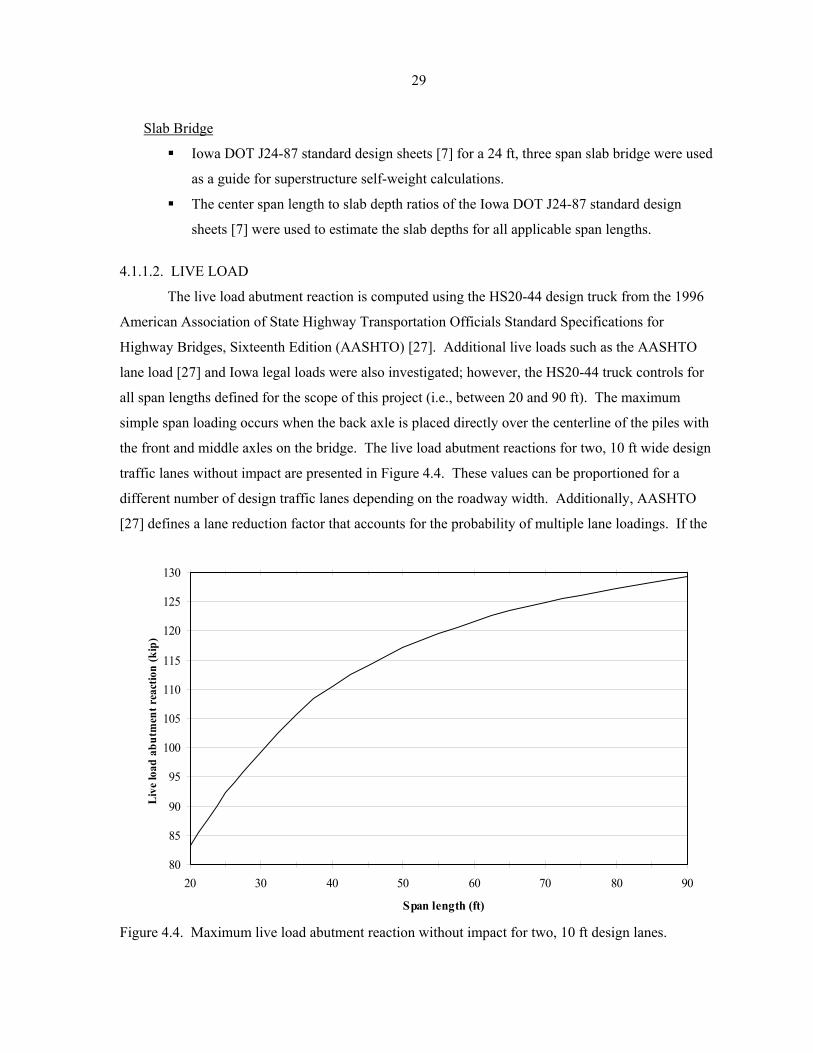
4.1.1.2. LIVE LOAD
The live load abutment reaction is computed using the HS20-44 design truck from the 1996
American Association of State Highway Transportation Officials Standard Specifications for
Highway Bridges, Sixteenth Edition (AASHTO) [27]. Additional live loads such as the AASHTO
lane load [27] and Iowa legal loads were also investigated; however, the HS20-44 truck controls for
all span lengths defined for the scope of this project (i.e., between 20 and 90 ft). The maximum
simple span loading occurs when the back axle is placed directly over the centerline of the piles with
the front and middle axles on the bridge. The live load abutment reactions for two, 10 ft wide design
traffic lanes without impact are presented in Figure 4.4. These values can be proportioned for a
different number of design traffic lanes depending on the roadway width. Additionally, AASHTO
[27] defines a lane reduction factor that accounts for the probability of multiple lane loadings. If the
80
85
90
95
100
105
110
115
120
125
130
20 30 40 50 60 70 80 90
Span length (ft)
Liv
e lo
ad a
butm
ent r
eact
ion
(kip
)
Figure 4.4. Maximum live load abutment reaction without impact for two, 10 ft design lanes.
30
number of 10 ft design lanes is equal to three, then 90 percent of the live load is applied. If four or
more design lanes are used, then 75 percent of the live load is used. Live load impact is not included
in the design of substructure elements embedded in soil (i.e., piles and the anchor system) as cited in
Section 6.5 of the Iowa DOT Bridge Design Manual (Iowa DOT BDM) [8].
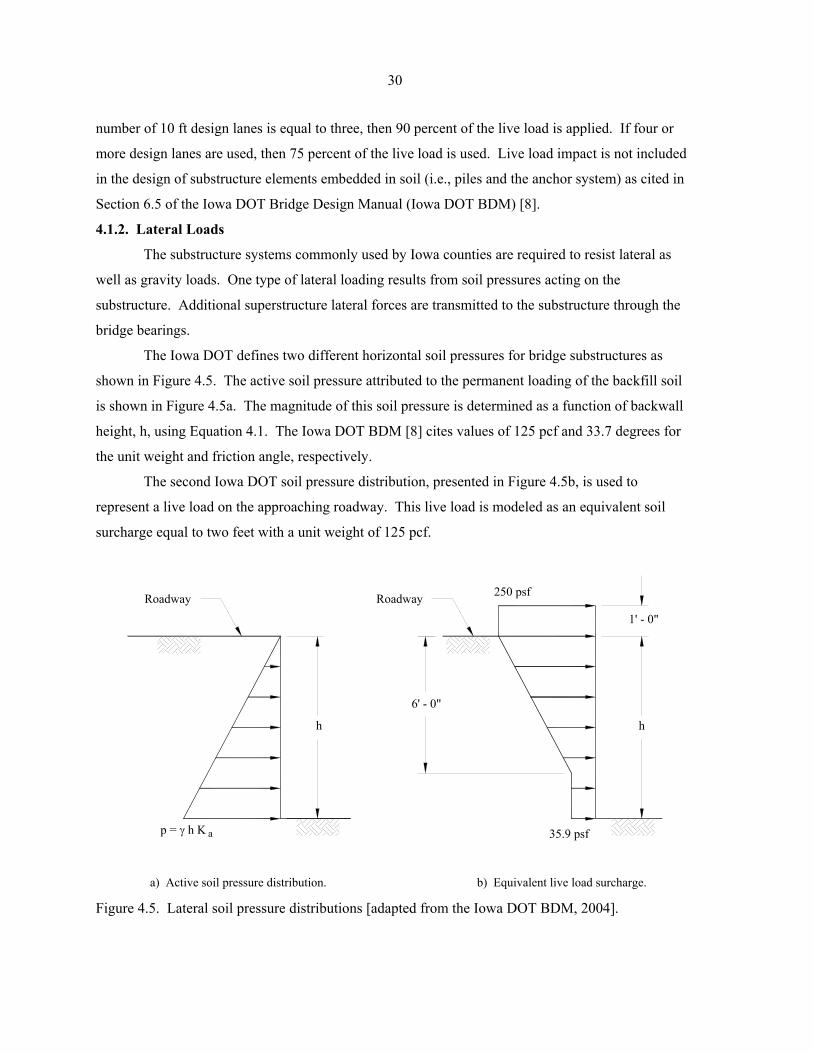
4.1.2. Lateral Loads
The substructure systems commonly used by Iowa counties are required to resist lateral as
well as gravity loads. One type of lateral loading results from soil pressures acting on the
substructure. Additional superstructure lateral forces are transmitted to the substructure through the
bridge bearings.
The Iowa DOT defines two different horizontal soil pressures for bridge substructures as
shown in Figure 4.5. The active soil pressure attributed to the permanent loading of the backfill soil
is shown in Figure 4.5a. The magnitude of this soil pressure is determined as a function of backwall
height, h, using Equation 4.1. The Iowa DOT BDM [8] cites values of 125 pcf and 33.7 degrees for
the unit weight and friction angle, respectively.
The second Iowa DOT soil pressure distribution, presented in Figure 4.5b, is used to
represent a live load on the approaching roadway. This live load is modeled as an equivalent soil
surcharge equal to two feet with a unit weight of 125 pcf.
p = γ h K
h
a) Active soil pressure distribution. b) Equivalent live load surcharge.
35.9 psf
250 psf
6' - 0"
1' - 0"
h
Roadway Roadway
a
Figure 4.5. Lateral soil pressure distributions [adapted from the Iowa DOT BDM, 2004].
31
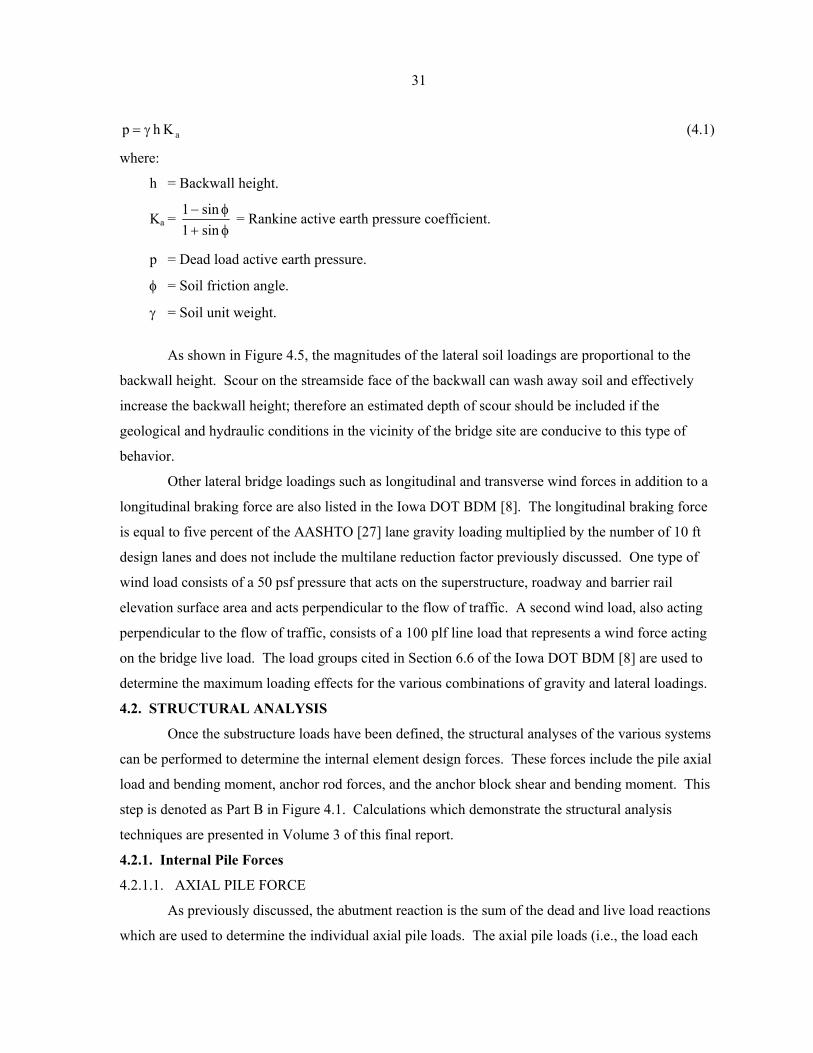
aKhp γ= (4.1)
where:
h = Backwall height.
Ka = φ+φ−
sin1sin1 = Rankine active earth pressure coefficient.
p = Dead load active earth pressure.
φ = Soil friction angle.
γ = Soil unit weight.
As shown in Figure 4.5, the magnitudes of the lateral soil loadings are proportional to the
backwall height. Scour on the streamside face of the backwall can wash away soil and effectively
increase the backwall height; therefore an estimated depth of scour should be included if the
geological and hydraulic conditions in the vicinity of the bridge site are conducive to this type of
behavior.
Other lateral bridge loadings such as longitudinal and transverse wind forces in addition to a
longitudinal braking force are also listed in the Iowa DOT BDM [8]. The longitudinal braking force
is equal to five percent of the AASHTO [27] lane gravity loading multiplied by the number of 10 ft
design lanes and does not include the multilane reduction factor previously discussed. One type of
wind load consists of a 50 psf pressure that acts on the superstructure, roadway and barrier rail
elevation surface area and acts perpendicular to the flow of traffic. A second wind load, also acting
perpendicular to the flow of traffic, consists of a 100 plf line load that represents a wind force acting
on the bridge live load. The load groups cited in Section 6.6 of the Iowa DOT BDM [8] are used to
determine the maximum loading effects for the various combinations of gravity and lateral loadings.
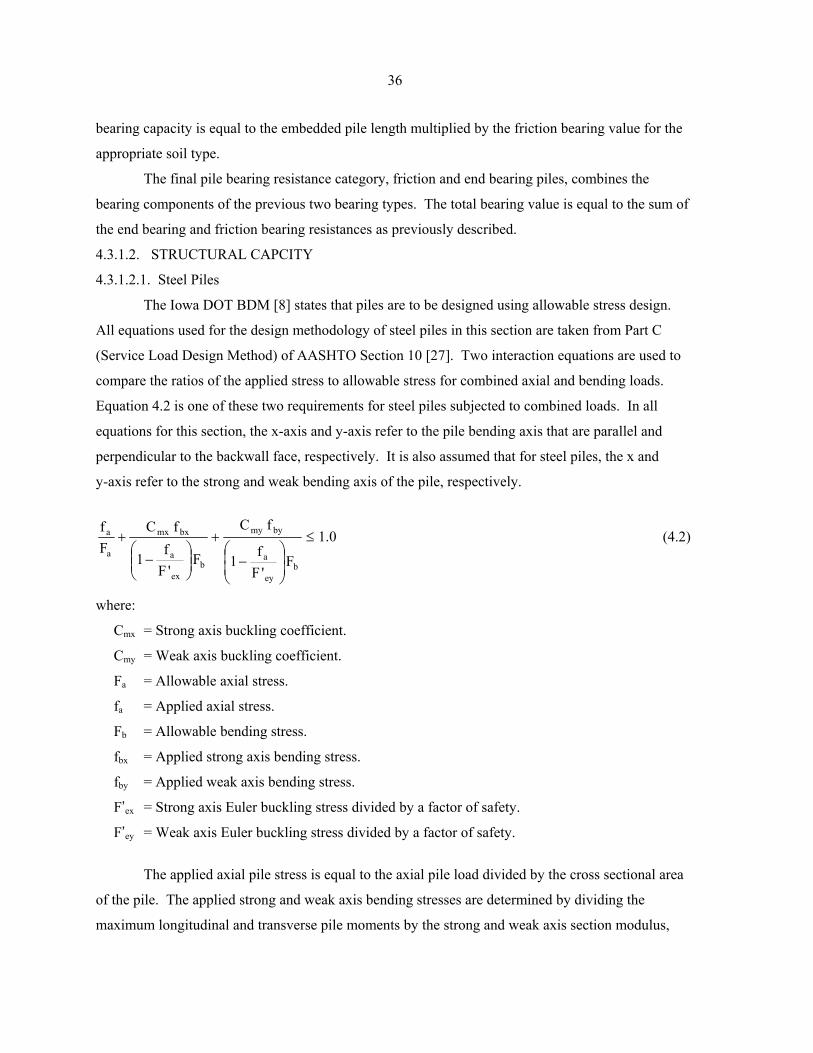
4.2. STRUCTURAL ANALYSIS
Once the substructure loads have been defined, the structural analyses of the various systems
can be performed to determine the internal element design forces. These forces include the pile axial
load and bending moment, anchor rod forces, and the anchor block shear and bending moment. This
step is denoted as Part B in Figure 4.1. Calculations which demonstrate the structural analysis
techniques are presented in Volume 3 of this final report.
4.2.1. Internal Pile Forces
4.2.1.1. AXIAL PILE FORCE
As previously discussed, the abutment reaction is the sum of the dead and live load reactions
which are used to determine the individual axial pile loads. The axial pile loads (i.e., the load each
32
pile must resist) are not only a function of the total number of piles but also their spacing and the
location of superstructure reactions applied at the bearing locations. A nominal axial pile factor was
developed to account for the non-uniform distribution of gravity loads to the piles due to the pile
spacing and the location of the superstructure bearing points. Various combinations of superstructure
systems and pile spacings were analyzed by creating a series of pile cap models and analyzing them
using a structural analysis program. The pile cap was modeled as a continuous beam with the
assumption of simple supports representing the piles. The loading consisted of point loads whose
values were equal to the total abutment reaction divided by the number of superstructure bearing
locations. Different combinations of pile and superstructure bearing location configurations produced
various maximum axial pile forces within a given pile group. The maximum axial pile force for the
more practical configurations were compared to the pile forces when the gravity loads were assumed
to be evenly distributed to all piles. The nominal axial pile factors, shown in Table 4.1, were
developed to account for axial pile loads for various superstructure systems and pile layouts. The
design axial pile force is equal to the total abutment reaction divided by the number of piles times the
nominal axial pile factor given in Table 4.1. Type 1 and Type 2 RRFC’s refers to cars similar to
those shown in Figures 1.3 and 1.4, respectively.
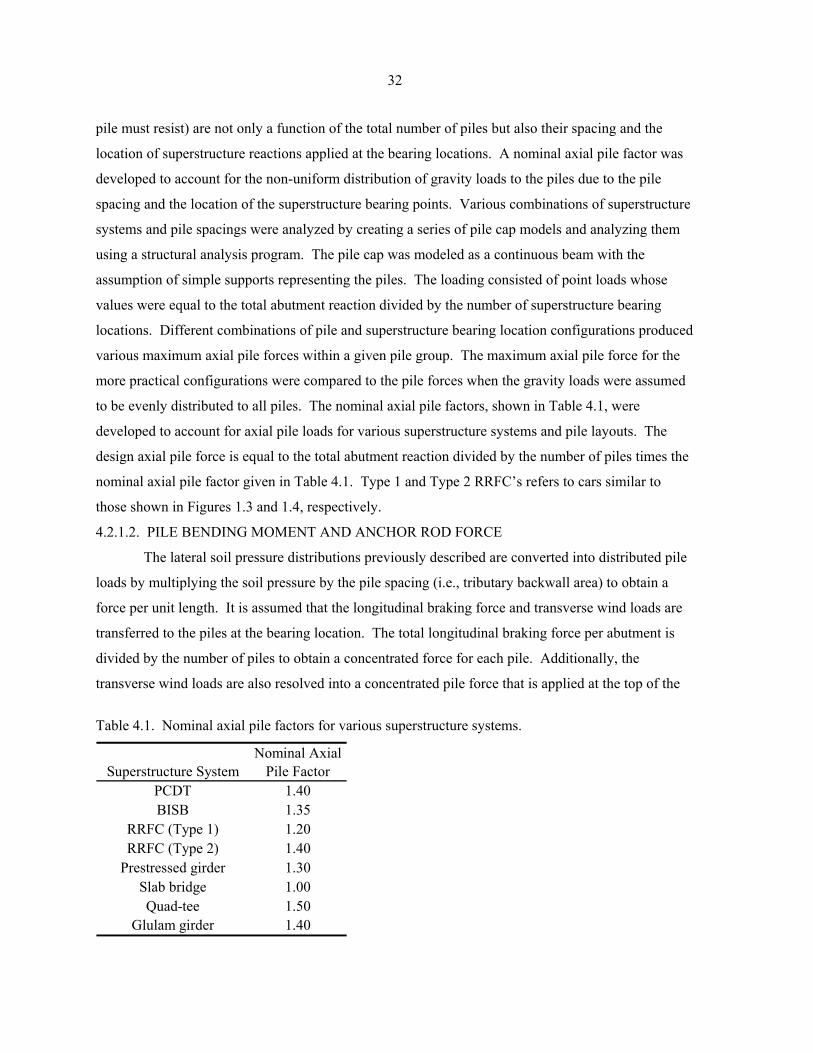
4.2.1.2. PILE BENDING MOMENT AND ANCHOR ROD FORCE
The lateral soil pressure distributions previously described are converted into distributed pile
loads by multiplying the soil pressure by the pile spacing (i.e., tributary backwall area) to obtain a
force per unit length. It is assumed that the longitudinal braking force and transverse wind loads are
transferred to the piles at the bearing location. The total longitudinal braking force per abutment is
divided by the number of piles to obtain a concentrated force for each pile. Additionally, the
transverse wind loads are also resolved into a concentrated pile force that is applied at the top of the
Table 4.1. Nominal axial pile factors for various superstructure systems.
Superstructure SystemPCDT 1.40BISB 1.35
RRFC (Type 1) 1.20RRFC (Type 2) 1.40
Prestressed girder 1.30Slab bridge 1.00Quad-tee 1.50
Glulam girder 1.40
Nominal Axial Pile Factor
33
pile to induce weak axis bending. The transverse wind on superstructure load per pile is calculated by
multiplying the 50 psf wind pressure by half the span length and the superstructure elevation surface
area, and then dividing by the number of piles. Similarly, the transverse wind on the bridge live load
per pile is obtained by multiplying the 100 plf line load by half the span length and then dividing by
the number of piles.
As previously noted in Chapter 3, two different lateral load analysis methods were used and
compared. The linear method, presented by Broms [17, 18], produced comparable results to the non-
linear computer analysis method. The linear method can be easily incorporated into a foundation
design template; therefore it was selected for use in the design methodology for LVR bridge
abutments. This allows the pile to be analyzed as a cantilever system.
The passive soil reactions for a single pile in both a cohesive and cohesionless soil resulting
from external lateral loads are shown in Figures 3.7 and 3.8, respectively. The magnitude of this
resistance depends on pile width parallel to the plane of bending and the properties of the soil. A
uniform soil reaction is specified by Broms [17, 18] for cohesive soils, however no guidance on the
exact shape of the soil reaction for cohesionless soils is provided. For the results presented herein, a
parabolic shape was assumed. The total magnitude of the passive soil resistance equals the above
ground lateral loadings.
For some cases, a lateral restraint system, consisting of a buried reinforced concrete anchor
block tied to the piles by tension rods, can be used to reduce the lateral loading effects. Also, a
positive connection between the superstructure and substructure uses the axial stiffness of the
superstructure to transfer lateral loads among the substructures units.
If a lateral restraint system is not utilized, the maximum bending moment and deflection of
the pile system is found using statics. The principal of superposition can be used to determine the
combined effects of all the lateral pile loadings. The addition of a lateral restraint system creates a
statically indeterminate system. Although there are several methods that can be used to solve this
system, in this investigation an iterative, consistent deformation approach (in which the displacement
of the lateral restraint system is equal to the displacement of the pile at the anchor location including
the elongation of the anchor rod) was used. The two lateral restraint systems previously noted
(a buried reinforced concrete anchor block and a positive bearing connection between the
superstructure and substructure) were considered in this project.
To analyze each pile individually, the anchor rod axial stiffness per pile is calculated by
equally distributing the total cross sectional area of all anchor rods for one abutment to each pile. In
this case, an abutment wale as shown in Figures 3.1 and 3.2 must be provided so that the anchor rod
34
forces can be transferred to the adjacent piles. An abutment wale is not needed if an anchor rod is
connected to each pile. After the anchor rod axial stiffness per pile is established, the structural
analysis of the system is performed, using the iterative approach previously described, to determine
the anchor rod force. Once this force is known, the maximum bending moment and deflection along
the length of the pile can be determined.
4.2.2. Internal Anchor Block Forces
The anchor block is analyzed as a continuous beam using simple supports that correspond to
the location of the anchor rods. The net soil reaction imparted on the anchor block to resist the lateral
substructure loads is represented by a uniform distributed load equal to the anchor rod force per pile
multiplied by the number of piles and divided by the total length of the anchor block. The moment
distribution method was used to determine the moment at the anchor rod locations. Equilibrium
equations are then used to determine the maximum internal shear and moment of the anchor block.
Obviously, any structural analysis software packages could be used to determine the internal anchor
block forces.
The support reactions obtained from the structural analysis will not necessarily be equal to
the magnitude of the calculated anchor rod forces. The primary reason for this difference is the
relative stiffness of the anchor block between the various anchor rods.
4.2.3. Miscellaneous Element Forces
The structural analysis of additional substructure elements such as the pile cap, abutment
wale and backwall must also be performed. However, a design methodology for these additional
elements is beyond the scope of this project.
The structural analysis of an abutment pile cap is similar to the process used in analyzing the
anchor block that was previously discussed. The pile cap is modeled as a continuous beam with
simple supports that correspond to the location of the piles. The total abutment reaction (including
live load impact) is applied to the pile cap model as a series of concentrated forces that correspond to
the superstructure bearing points. The magnitude of the concentrated forces are determined by either
taking the total abutment reaction and dividing by the number of bearing points or using the tributary
area above the superstructure bearing points. For a slab bridge, a uniform distributed load equal to
the total abutment reaction divided by the length of the pile cap is used in place of the superstructure
point loads. Any type of structural analysis for indeterminate structures can be used to determine the
moments at the pile locations which in turn are used to determine the maximum internal shears and
moments in the pile cap.
35
Backwall components are typically composed of horizontal timber planks, vertically driven
sheet piles, or some type of precast or cast-in-place concrete panels (Figure 3.4). The magnitude of
the backwall loads are determined by computing the soil pressures acting at a point of interest and
then applying these pressures to the tributary area of the backwall section.
The abutment wale is analyzed as a continuous beam that spans between the supporting piles.
There are two possible loading conditions for the abutment wale. If anchor rods are connected to the
abutment wale, these rod forces are represented as point loads on the wale and act in the opposite
direction of the backwall soil pressures. If the wale is located between the piles and backwall as
shown in Figures 3.1 and 3.2, a uniformly distributed load that represents the total backwall load
acting on a tributary area is applied to the abutment wale.
4.3. CAPACITY OF FOUNDATION ELEMENTS
The guidelines specified in AASHTO [27], the Iowa DOT BDM [8], and the National Design
Specification Manual for Wood Construction (NDS Manual) [28] are considered in determining the
capacities of the various foundation elements. This step in the design methodology is denoted as
Part C in Figure 4.1.
4.3.1. Pile Capacity
4.3.1.1. BEARING CAPACITY
In the approach used herein, piles are classified into three groups, end bearing, friction
bearing, and combined friction and end bearing piles. End bearing piles develop the necessary
vertical capacity from the bearing of the pile tip on a relatively hard foundation material. Estimated
end bearing values (in psi) for various H-pile sizes and foundation materials as stated by the Iowa
DOT FSIC [19] are presented in Appendix B of Volume 2. These values are correlated to the SPT
blow count and include a factor of safety of 2.0. The pile capacity is equal to the product of the cross
sectional pile area and the estimated end bearing value.
Friction piles develop the necessary resistance from the shear forces between the embedded
pile surface and the surrounding soil. The magnitude of this bearing resistance varies significantly
with pile type and soil type. The Iowa DOT FSIC [19] also states estimated friction bearing values
(in tons per foot) for various pile types and foundation materials. This information, which is
correlated to the SPT blow count and includes a factor of safety of 2.0, is also included in Appendix B
of Volume 2 The values provided for timber piles are based on a pile diameter of 10 in. If a different
pile diameter is used, an appropriate friction bearing value per foot can be obtained by dividing the
values provided by 10 in. and multiplying by the actual pile diameter in inches. For friction piles, the
36
bearing capacity is equal to the embedded pile length multiplied by the friction bearing value for the
appropriate soil type.
The final pile bearing resistance category, friction and end bearing piles, combines the
bearing components of the previous two bearing types. The total bearing value is equal to the sum of
the end bearing and friction bearing resistances as previously described.
4.3.1.2. STRUCTURAL CAPCITY
4.3.1.2.1. Steel Piles
The Iowa DOT BDM [8] states that piles are to be designed using allowable stress design.
All equations used for the design methodology of steel piles in this section are taken from Part C
(Service Load Design Method) of AASHTO Section 10 [27]. Two interaction equations are used to
compare the ratios of the applied stress to allowable stress for combined axial and bending loads.
Equation 4.2 is one of these two requirements for steel piles subjected to combined loads. In all
equations for this section, the x-axis and y-axis refer to the pile bending axis that are parallel and
perpendicular to the backwall face, respectively. It is also assumed that for steel piles, the x and
y-axis refer to the strong and weak bending axis of the pile, respectively.
0.1
F'F
f1
fC
F'F
f1
fCFf
bey
a
bymy
bex
a
bxmx
a
a ≤
−
+
−
+ (4.2)
where:
Cmx = Strong axis buckling coefficient.
Cmy = Weak axis buckling coefficient.
Fa = Allowable axial stress.
fa = Applied axial stress.
Fb = Allowable bending stress.
fbx = Applied strong axis bending stress.
fby = Applied weak axis bending stress.
F’ex = Strong axis Euler buckling stress divided by a factor of safety.
F’ey = Weak axis Euler buckling stress divided by a factor of safety.
The applied axial pile stress is equal to the axial pile load divided by the cross sectional area
of the pile. The applied strong and weak axis bending stresses are determined by dividing the
maximum longitudinal and transverse pile moments by the strong and weak axis section modulus,
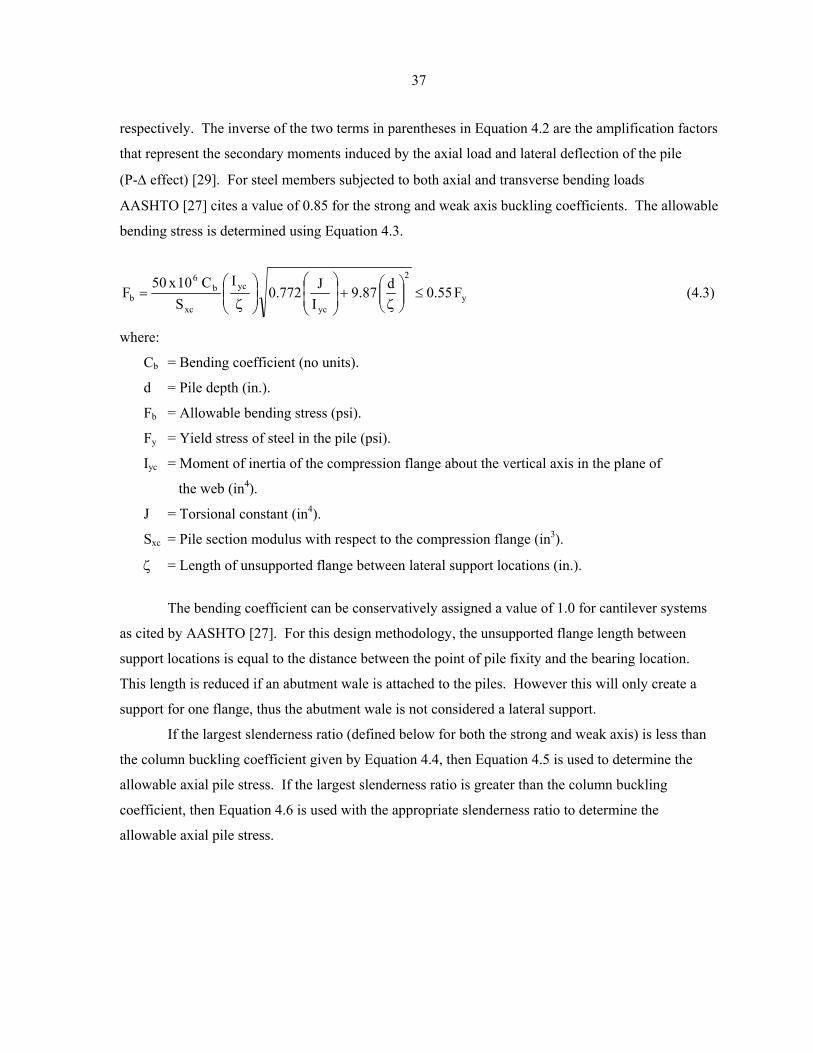
37
respectively. The inverse of the two terms in parentheses in Equation 4.2 are the amplification factors
that represent the secondary moments induced by the axial load and lateral deflection of the pile
(P-∆ effect) [29]. For steel members subjected to both axial and transverse bending loads
AASHTO [27] cites a value of 0.85 for the strong and weak axis buckling coefficients. The allowable
bending stress is determined using Equation 4.3.
y
2
yc
yc
xc
b6
b F55.0d87.9IJ772.0
IS
C10x50F ≤
ζ
+
ζ
= (4.3)
where:
Cb = Bending coefficient (no units).
d = Pile depth (in.).
Fb = Allowable bending stress (psi).
Fy = Yield stress of steel in the pile (psi).
Iyc = Moment of inertia of the compression flange about the vertical axis in the plane of
the web (in4).
J = Torsional constant (in4).
Sxc = Pile section modulus with respect to the compression flange (in3).
ζ = Length of unsupported flange between lateral support locations (in.).
The bending coefficient can be conservatively assigned a value of 1.0 for cantilever systems
as cited by AASHTO [27]. For this design methodology, the unsupported flange length between
support locations is equal to the distance between the point of pile fixity and the bearing location.
This length is reduced if an abutment wale is attached to the piles. However this will only create a
support for one flange, thus the abutment wale is not considered a lateral support.
If the largest slenderness ratio (defined below for both the strong and weak axis) is less than
the column buckling coefficient given by Equation 4.4, then Equation 4.5 is used to determine the
allowable axial pile stress. If the largest slenderness ratio is greater than the column buckling
coefficient, then Equation 4.6 is used with the appropriate slenderness ratio to determine the
allowable axial pile stress.
38
y
2
C FE2C π
= (4.4)
where:
CC = Column buckling coefficient.
E = Modulus of elasticity.
Fy = Yield stress of steel in pile.
( )
π−=
E4
Fr/Kl1
12.2F
F 2y
2y
a (4.5)
where:
E = Modulus of elasticity.
Fa = Allowable axial stress.
Fy = Yield stress of steel in pile.
K = Effective length factor (see Table 4.2).
Kl/r = Slenderness ratio.
l = Pile length between braced points (see Table 4.2).
r = Radius of gyration.
( )2
2
ar/Kl12.2
EF π= (4.6)
where:
E = Modulus of elasticity.
Fa = Allowable axial stress.
K = Effective length factor (see Table 4.2).
Kl/r = Slenderness ratio.
l = Pile length between braced points (see Table 4.2).
r = Radius of gyration.
To calculate the allowable axial stress, the slenderness ratio used in Equations 4.5 and 4.6 is
the maximum for either the strong or weak pile bending axis. A summary of the effective length
factors and pile length between braced points to be used for the strong and weak axis with and
without a lateral restraint system is presented in Table 4.2.
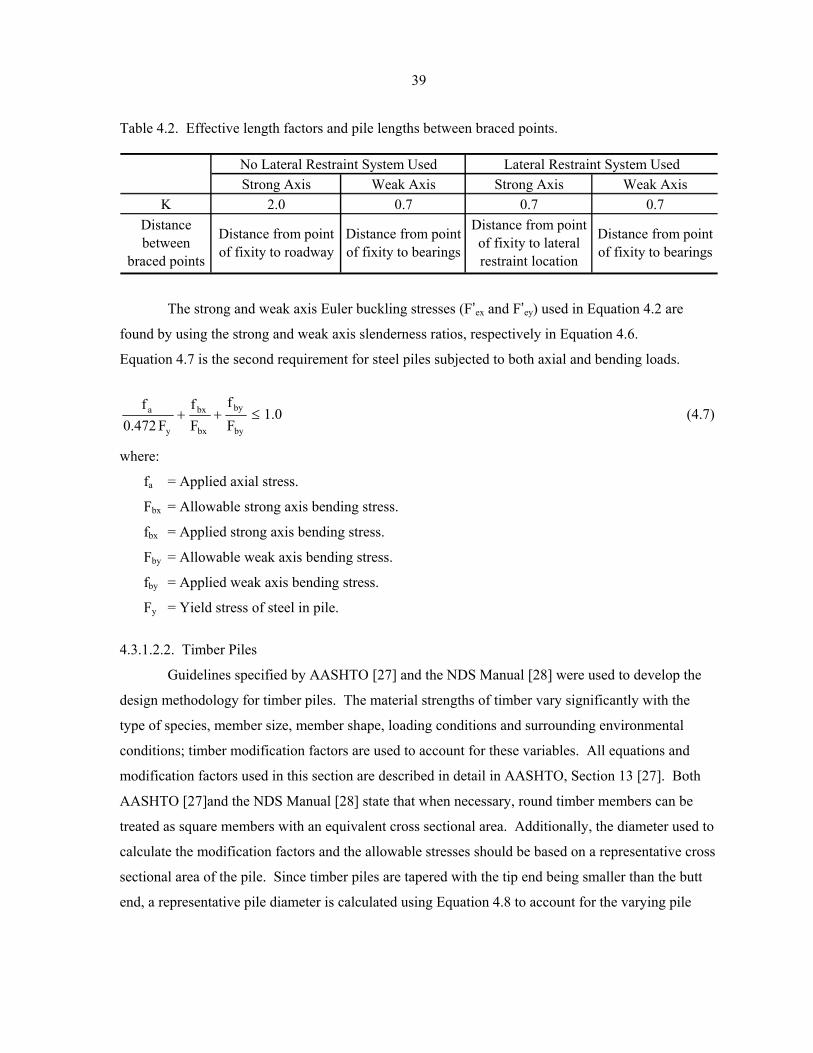
39
Table 4.2. Effective length factors and pile lengths between braced points.
Strong Axis Weak Axis Strong Axis Weak AxisK 2.0 0.7 0.7 0.7
Distance between
braced points
No Lateral Restraint System Used Lateral Restraint System Used
Distance from point of fixity to bearings
Distance from point of fixity to lateral restraint location
Distance from point of fixity to roadway
Distance from point of fixity to bearings
The strong and weak axis Euler buckling stresses (F’ex and F’ey) used in Equation 4.2 are
found by using the strong and weak axis slenderness ratios, respectively in Equation 4.6.
Equation 4.7 is the second requirement for steel piles subjected to both axial and bending loads.
0.1Ff
Ff
F472.0f
by
by
bx
bx
y
a ≤++ (4.7)
where:
fa = Applied axial stress.
Fbx = Allowable strong axis bending stress.
fbx = Applied strong axis bending stress.
Fby = Allowable weak axis bending stress.
fby = Applied weak axis bending stress.
Fy = Yield stress of steel in pile.
4.3.1.2.2. Timber Piles
Guidelines specified by AASHTO [27] and the NDS Manual [28] were used to develop the
design methodology for timber piles. The material strengths of timber vary significantly with the
type of species, member size, member shape, loading conditions and surrounding environmental
conditions; timber modification factors are used to account for these variables. All equations and
modification factors used in this section are described in detail in AASHTO, Section 13 [27]. Both
AASHTO [27]and the NDS Manual [28] state that when necessary, round timber members can be
treated as square members with an equivalent cross sectional area. Additionally, the diameter used to
calculate the modification factors and the allowable stresses should be based on a representative cross
sectional area of the pile. Since timber piles are tapered with the tip end being smaller than the butt
end, a representative pile diameter is calculated using Equation 4.8 to account for the varying pile
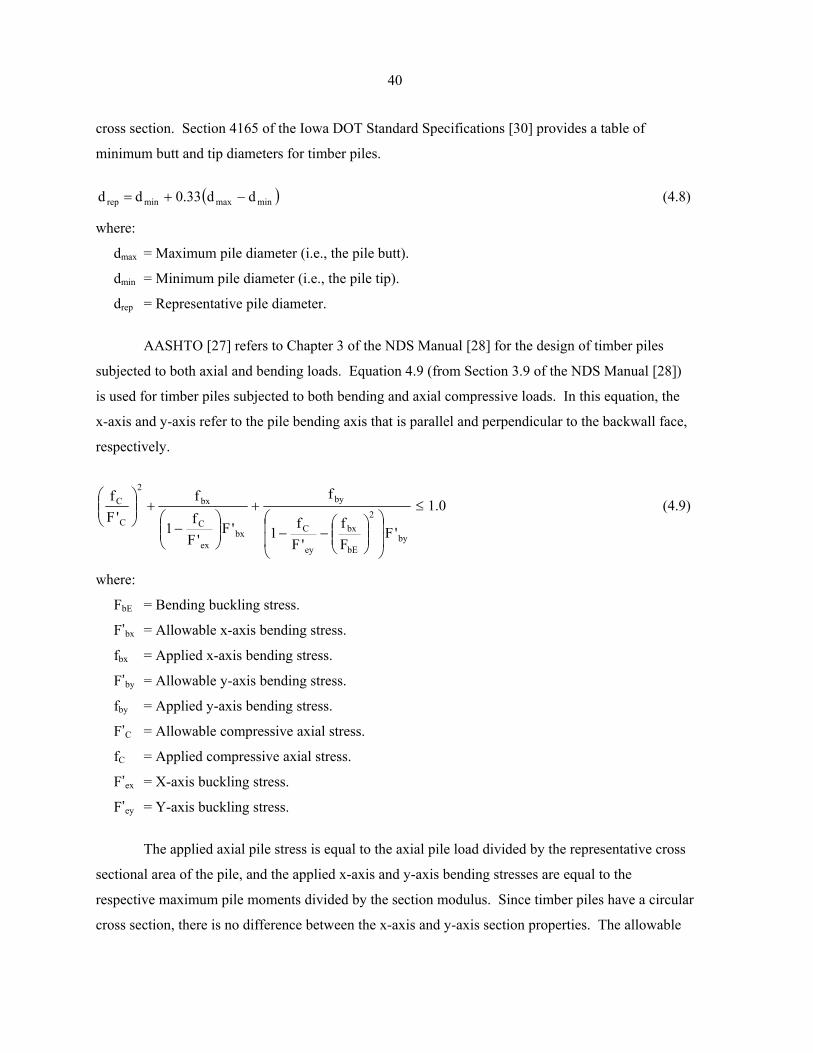
40
cross section. Section 4165 of the Iowa DOT Standard Specifications [30] provides a table of
minimum butt and tip diameters for timber piles.
( )minmaxminrep dd33.0dd −+= (4.8)
where:
dmax = Maximum pile diameter (i.e., the pile butt).
dmin = Minimum pile diameter (i.e., the pile tip).
drep = Representative pile diameter.
AASHTO [27] refers to Chapter 3 of the NDS Manual [28] for the design of timber piles
subjected to both axial and bending loads. Equation 4.9 (from Section 3.9 of the NDS Manual [28])
is used for timber piles subjected to both bending and axial compressive loads. In this equation, the
x-axis and y-axis refer to the pile bending axis that is parallel and perpendicular to the backwall face,
respectively.
0.1
'FFf
'Ff
1
f
'F'F
f1
f'F
f
by
2
bE
bx
ey
C
by
bxex
C
bx2
C
C ≤
−−
+
−
+
(4.9)
where:
FbE = Bending buckling stress.
F’bx = Allowable x-axis bending stress.
fbx = Applied x-axis bending stress.
F’by = Allowable y-axis bending stress.
fby = Applied y-axis bending stress.
F’C = Allowable compressive axial stress.
fC = Applied compressive axial stress.
F’ex = X-axis buckling stress.
F’ey = Y-axis buckling stress.
The applied axial pile stress is equal to the axial pile load divided by the representative cross
sectional area of the pile, and the applied x-axis and y-axis bending stresses are equal to the
respective maximum pile moments divided by the section modulus. Since timber piles have a circular
cross section, there is no difference between the x-axis and y-axis section properties. The allowable
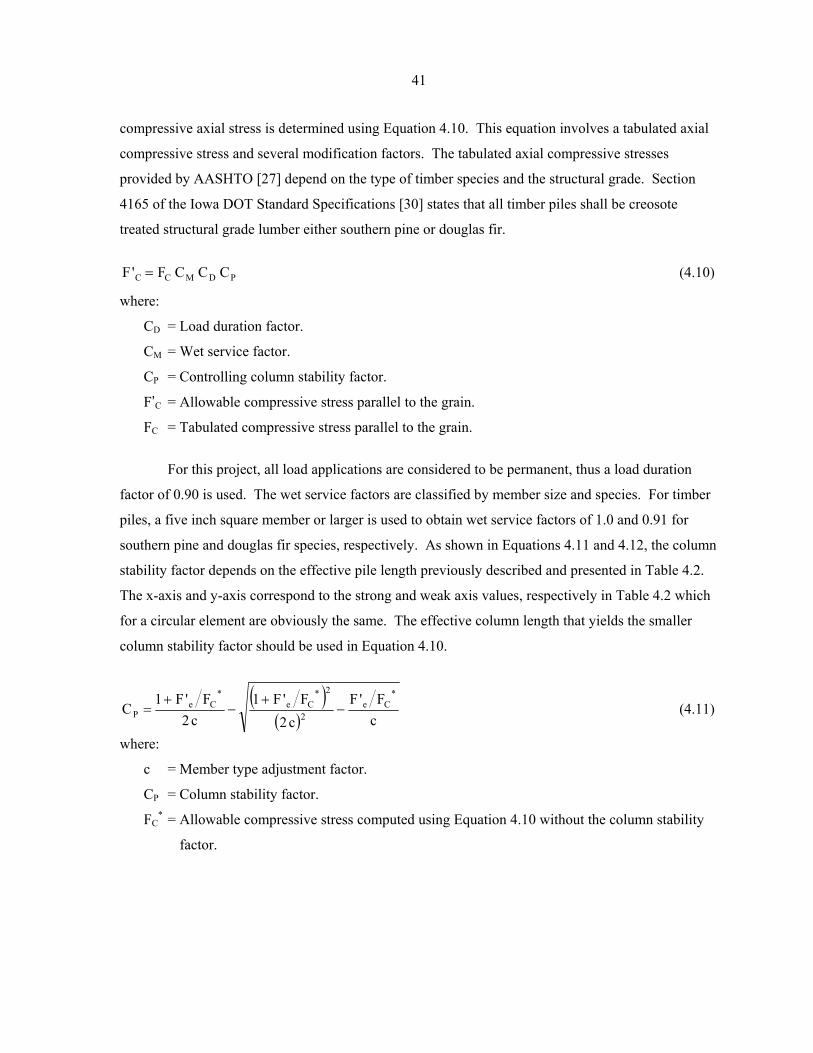
41
compressive axial stress is determined using Equation 4.10. This equation involves a tabulated axial
compressive stress and several modification factors. The tabulated axial compressive stresses
provided by AASHTO [27] depend on the type of timber species and the structural grade. Section
4165 of the Iowa DOT Standard Specifications [30] states that all timber piles shall be creosote
treated structural grade lumber either southern pine or douglas fir.
PDMCC CCCF'F = (4.10)
where:
CD = Load duration factor.
CM = Wet service factor.
CP = Controlling column stability factor.
F’C = Allowable compressive stress parallel to the grain.
FC = Tabulated compressive stress parallel to the grain.
For this project, all load applications are considered to be permanent, thus a load duration
factor of 0.90 is used. The wet service factors are classified by member size and species. For timber
piles, a five inch square member or larger is used to obtain wet service factors of 1.0 and 0.91 for
southern pine and douglas fir species, respectively. As shown in Equations 4.11 and 4.12, the column
stability factor depends on the effective pile length previously described and presented in Table 4.2.
The x-axis and y-axis correspond to the strong and weak axis values, respectively in Table 4.2 which
for a circular element are obviously the same. The effective column length that yields the smaller
column stability factor should be used in Equation 4.10.
( )( ) c
F'Fc2
F'F1c2
F'F1C
*Ce
2
2*Ce
*Ce
P −+
−+
= (4.11)
where:
c = Member type adjustment factor.
CP = Column stability factor.
FC* = Allowable compressive stress computed using Equation 4.10 without the column stability
factor.
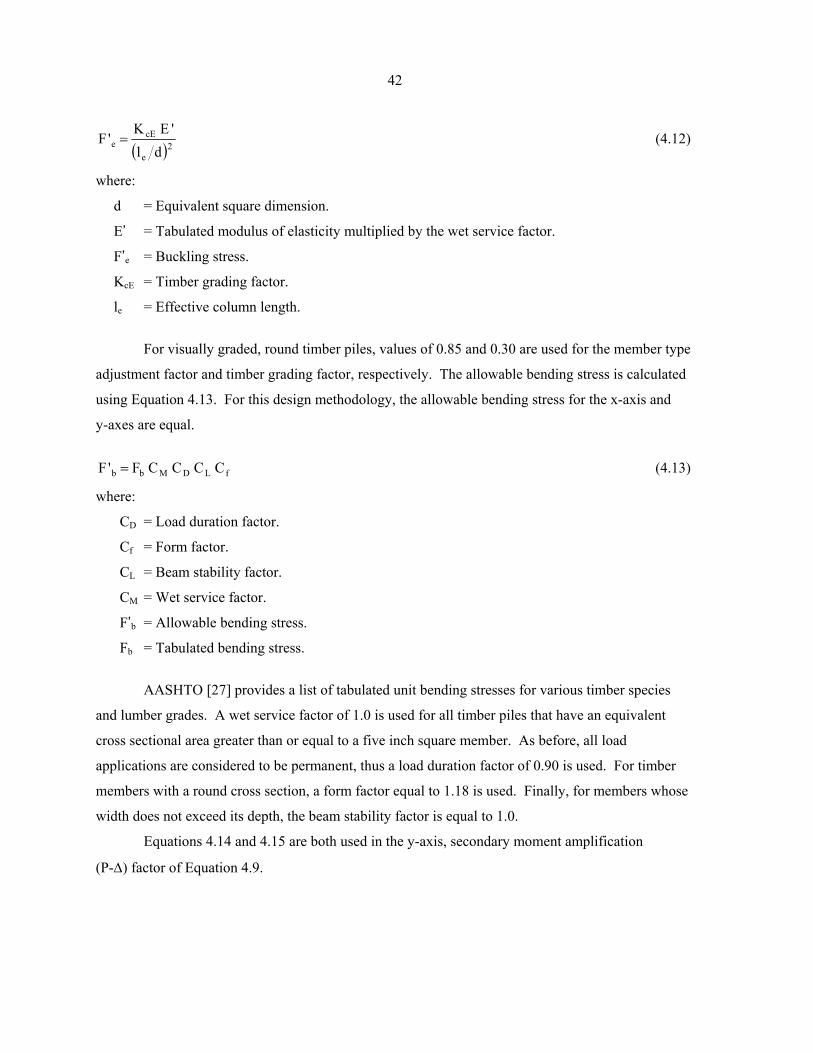
42
( )2e
cEe
dl'EK
'F = (4.12)
where:
d = Equivalent square dimension.
E’ = Tabulated modulus of elasticity multiplied by the wet service factor.
F’e = Buckling stress.
KcE = Timber grading factor.
le = Effective column length.
For visually graded, round timber piles, values of 0.85 and 0.30 are used for the member type
adjustment factor and timber grading factor, respectively. The allowable bending stress is calculated
using Equation 4.13. For this design methodology, the allowable bending stress for the x-axis and
y-axes are equal.
fLDMbb CCCCF'F = (4.13)
where:
CD = Load duration factor.
Cf = Form factor.
CL = Beam stability factor.
CM = Wet service factor.
F’b = Allowable bending stress.
Fb = Tabulated bending stress.
AASHTO [27] provides a list of tabulated unit bending stresses for various timber species
and lumber grades. A wet service factor of 1.0 is used for all timber piles that have an equivalent
cross sectional area greater than or equal to a five inch square member. As before, all load
applications are considered to be permanent, thus a load duration factor of 0.90 is used. For timber
members with a round cross section, a form factor equal to 1.18 is used. Finally, for members whose
width does not exceed its depth, the beam stability factor is equal to 1.0.
Equations 4.14 and 4.15 are both used in the y-axis, secondary moment amplification
(P-∆) factor of Equation 4.9.
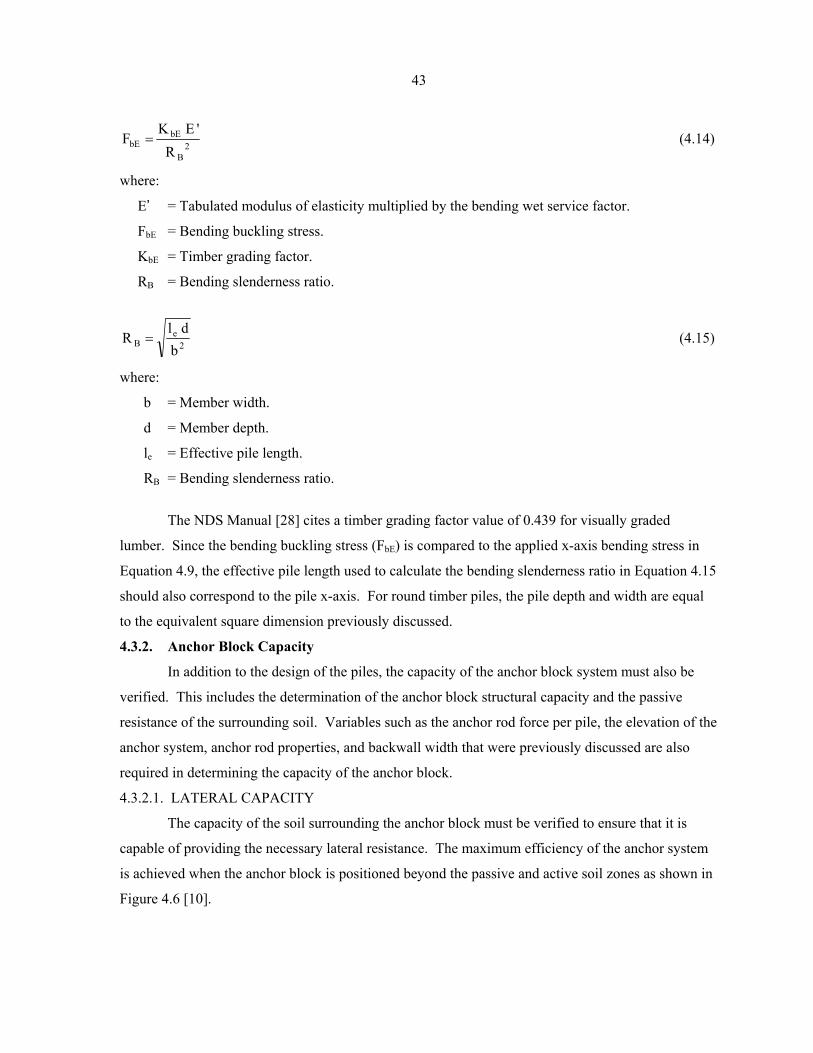
43
2B
bEbE
R'EK
F = (4.14)
where:
E’ = Tabulated modulus of elasticity multiplied by the bending wet service factor.
FbE = Bending buckling stress.
KbE = Timber grading factor.
RB = Bending slenderness ratio.
2e
B bdl
R = (4.15)
where:
b = Member width.
d = Member depth.
le = Effective pile length.
RB = Bending slenderness ratio.
The NDS Manual [28] cites a timber grading factor value of 0.439 for visually graded
lumber. Since the bending buckling stress (FbE) is compared to the applied x-axis bending stress in
Equation 4.9, the effective pile length used to calculate the bending slenderness ratio in Equation 4.15
should also correspond to the pile x-axis. For round timber piles, the pile depth and width are equal
to the equivalent square dimension previously discussed.
4.3.2. Anchor Block Capacity
In addition to the design of the piles, the capacity of the anchor block system must also be
verified. This includes the determination of the anchor block structural capacity and the passive
resistance of the surrounding soil. Variables such as the anchor rod force per pile, the elevation of the
anchor system, anchor rod properties, and backwall width that were previously discussed are also
required in determining the capacity of the anchor block.
4.3.2.1. LATERAL CAPACITY
The capacity of the soil surrounding the anchor block must be verified to ensure that it is
capable of providing the necessary lateral resistance. The maximum efficiency of the anchor system
is achieved when the anchor block is positioned beyond the passive and active soil zones as shown in
Figure 4.6 [10].
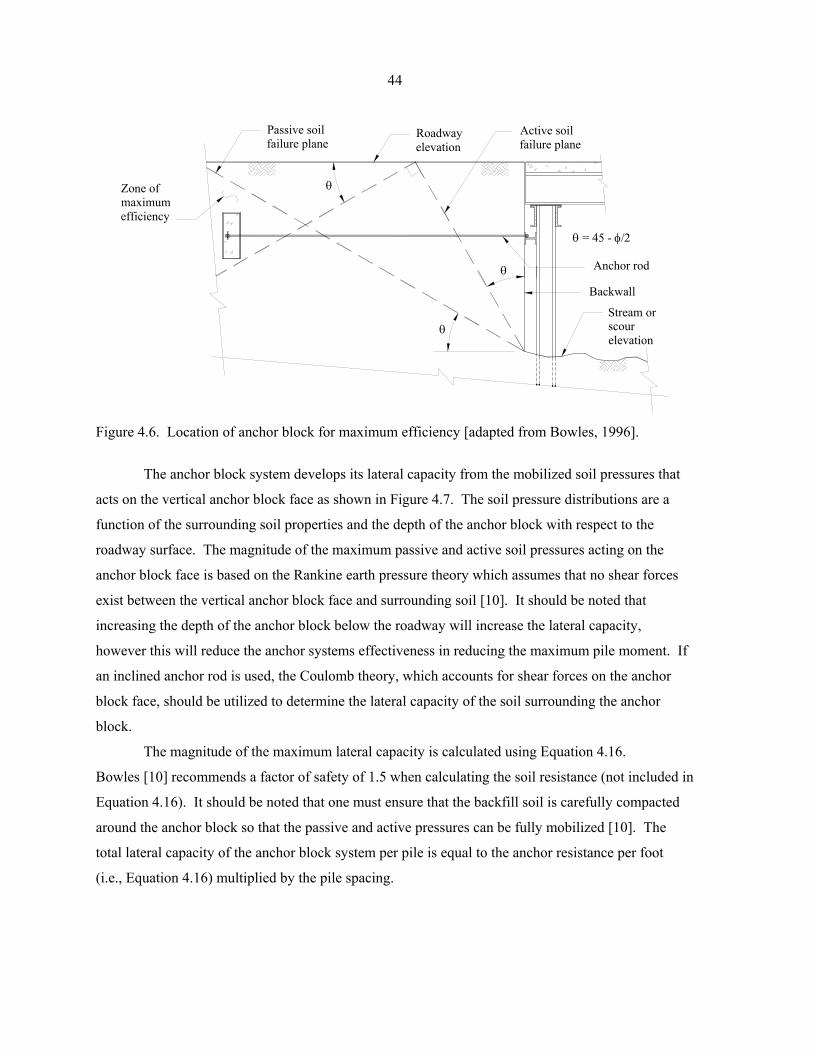
44
Roadway elevation
Stream or scour elevation
Anchor rod
Zone of maximum efficiency
Active soil failure plane
Passive soil failure plane
θ
θ
θ = 45 - φ/2
θ
Backwall
Figure 4.6. Location of anchor block for maximum efficiency [adapted from Bowles, 1996].
The anchor block system develops its lateral capacity from the mobilized soil pressures that
acts on the vertical anchor block face as shown in Figure 4.7. The soil pressure distributions are a
function of the surrounding soil properties and the depth of the anchor block with respect to the
roadway surface. The magnitude of the maximum passive and active soil pressures acting on the
anchor block face is based on the Rankine earth pressure theory which assumes that no shear forces
exist between the vertical anchor block face and surrounding soil [10]. It should be noted that
increasing the depth of the anchor block below the roadway will increase the lateral capacity,
however this will reduce the anchor systems effectiveness in reducing the maximum pile moment. If
an inclined anchor rod is used, the Coulomb theory, which accounts for shear forces on the anchor
block face, should be utilized to determine the lateral capacity of the soil surrounding the anchor
block.
The magnitude of the maximum lateral capacity is calculated using Equation 4.16.
Bowles [10] recommends a factor of safety of 1.5 when calculating the soil resistance (not included in
Equation 4.16). It should be noted that one must ensure that the backfill soil is carefully compacted
around the anchor block so that the passive and active pressures can be fully mobilized [10]. The
total lateral capacity of the anchor block system per pile is equal to the anchor resistance per foot
(i.e., Equation 4.16) multiplied by the pile spacing.
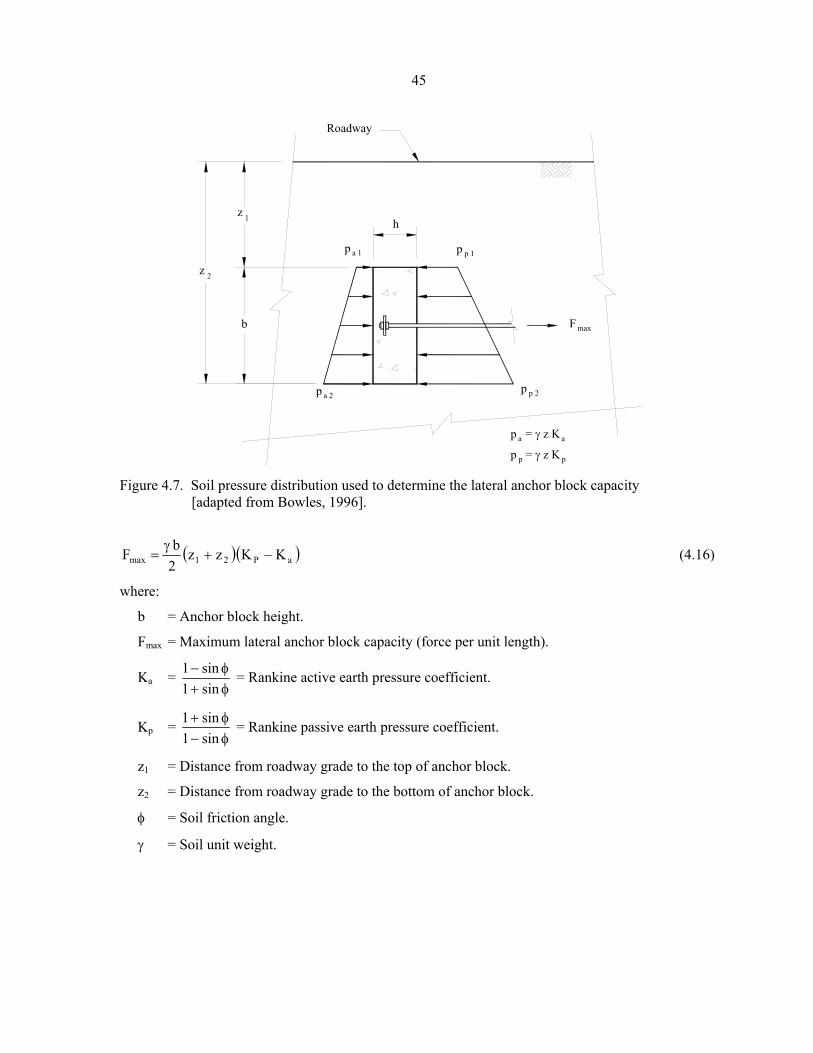
45
b
z 1 h
maxF
pp = γ z K p
ap = γ z Ka
a 2p
p a 1
p p 2
p 1p
2z
Roadway
Figure 4.7. Soil pressure distribution used to determine the lateral anchor block capacity
[adapted from Bowles, 1996].
( )( )aP21max KKzz2bF −+
γ= (4.16)
where:
b = Anchor block height.
Fmax = Maximum lateral anchor block capacity (force per unit length).
Ka = φ+φ−
sin1sin1 = Rankine active earth pressure coefficient.
Kp = φ−φ+
sin1sin1 = Rankine passive earth pressure coefficient.
z1 = Distance from roadway grade to the top of anchor block.
z2 = Distance from roadway grade to the bottom of anchor block.
φ = Soil friction angle.
γ = Soil unit weight.
46
4.3.2.2. STRUCTURAL CAPACITY
Once the lateral capacity of the anchor block has been verified, the structural capacity must
be investigated. The anchor block is designed using reinforced concrete design practice described in
AASHTO, Section 8 [27]. This includes designing the flexural and shear reinforcement in addition to
checking the development length requirements of the flexural reinforcement, the ductility, and the
minimum reinforcement requirements. It should be noted that the internal anchor block bending
loads induced by the anchor rods and soil pressure distributions act on a plane that is parallel to the
backwall face. Therefore the effective depth of the concrete used in the flexure design is a function of
the horizontal anchor block face dimension, ‘h’. An example of the anchor block design process is
included in a design verification example presented in Volume 3 of this final report.
4.3.3. Miscellaneous Substructure Elements
The capacity of additional substructure elements such as the pile cap, abutment wale, and
backwall must also be determined. As previously mentioned, a design methodology for these
additional elements is beyond the scope of this project.
A reinforced concrete pile cap would be designed using AASHTO [27] Section 8 whereas
Section 10 would be used for the design of a steel pile cap. The structural capacity of the abutment
wale and backwall system should also be determined using AASHTO [27] Section 10 and Section 13
for steel and timber materials, respectively.
4.4. DESIGN CHECKS OF FOUNDATION ELEMENTS
Once the internal element loads and capacities have been determined, the adequacy of the
substructure system must be checked. In general, this consists of verifying that the system capacity is
greater than the applied loads. This step in the design methodology for LVR bridge abutments is
denoted as Part D in Figure 4.1. In the following sections, the specific design requirements for the
pile and anchor system are presented.
The structural capacity of both steel and timber piles is not computed directly using the
design methodology presented in this report; alternatively, interaction requirements are used to
determine the ratios of applied to allowable stresses for combined bending and axial loadings. For
steel piles, if Equation 4.2 or 4.7 yield a value less than 1.0, the pile is considered structurally
adequate. This requirement is the same for timber piles, however Equation 4.9 is used. If the
interaction equation requirement is not satisfied, an alternative substructure configuration must be
used.
The pile bearing capacity must also be larger than the axial pile load. Additional bearing
requirements are cited by AASHTO [27] and the Iowa DOT BDM [8]. Both sources state that the
47
maximum applied axial steel pile stress must not exceed 25 percent the steel yield stress.
Section 6.2.6 of the Iowa DOT BDM [8] provides more detailed axial pile stress requirements for
both steel and timber piles based on the type of bearing resistance and the type of foundation material.
The maximum allowable axial pile stress for a friction bearing steel pile is equal to 6 ksi. For end
bearing steel piles, the maximum allowable axial pile stress is equal to 6 and 9 ksi for end bearing
foundation material with a SPT blow count less than or greater than 200, respectively. Finally, the
maximum axial pile stress for combined friction and end bearing steel piles is 9 ksi for an end bearing
foundation material with a SPT blow count between 100 and 200. The maximum allowable axial pile
stress is equal to 6 ksi for all other combinations of friction and end bearing foundation materials. For
timber piles, the Iowa DOT BDM [8] states that the applied axial pile load must be less than 20 tons
for pile lengths between 20 and 30 ft and 25 tons for pile lengths between 35 and 55 ft.
The capacity of the anchor system must also be verified. The applied anchor rod stress must
be less than the allowable anchor rod stress defined in AASHTO [27] as 55 percent of the yield stress.
The maximum passive resistance of the soil surrounding the anchor block (per foot of length) is
obtained from Equation 4.16. This capacity per foot is multiplied by the pile spacing and must be
greater than the required anchor force per pile as previously discussed. It is recommended that the
total length of the anchor block be greater than or equal to the number of piles multiplied by the pile
spacing. In order to satisfy the structural design requirements, the internal anchor block shear and
bending forces resulting from applied loads must be less than the structural capacity of the anchor
block determined using AASHTO [27] reinforced concrete guidelines.

49
5. ALTERNATIVE LOW-VOLUME ABUTMENT SYSTEMS
The literature search revealed several alternative abutment systems that may be of interest to
Iowa Engineers. Each of these systems are well established in a particular geographic region or for a
specific use, however none of them have been used as a bridge abutment system in Iowa. Alternative
abutment systems include micropiles, geosynthetic reinforced soil (GRS) structures, Geopier
foundations, and sheet pile abutments. Since these are economical and provide advantages over the
traditional deep foundation systems currently used (i.e., driven piles), they show promise for
numerous sites in Iowa. As noted in Chapter 7, it is proposed that several of these systems be tested
in demonstration projects.
5.1. MICROPILES
Micropiles originated in Italy in the early 1950’s and are used to strengthen and stabilize
existing structure foundations. The term “micropile” is one of many terms used to describe a small
diameter bored injection pile. Other terms include: minipile, root pile, pinpile, drilled-in-pier pile and
drilled cast-in-place concrete pile [31, 32]. The term micropile will be used herein.
A micropile is typically defined as a small diameter (less than 12 in.) structural element that
is constructed by boring a hole in the soil and filling it with steel reinforcement and either gravity
flow or pressurized cementitious grout. The steel reinforcement typically consists of either steel
reinforcement bars and/or a tubular drill casing left in place for the upper length of the micropile
shaft. Micropile lengths of close to 100 ft with diameters ranging from 3.9 to 11.8 in. have been
documented [31]. Depending on the soil conditions and pile size, a micropile can have a bearing
capacity up to 225 kips. This relatively large capacity is developed from the frictional forces between
the grout and the surrounding soil [33].
Significant micropile usage began in the United States in the late 1970’s [32]. California is
one of the leading states in the use of micropile foundations. Many existing foundations in the
earthquake prone region require retrofitting to meet new seismic design code requirements.
Micropiles have both substantial tensile and compressive capacities making them ideal for these
situations. They can be easily incorporated in an existing structure by either drilling holes into the
existing foundation or tying a new pile cap into the existing structure [34].
As previously noted, micropiles were originally developed to underpin or strengthen existing
structure foundations in urban areas where excavation or driven piles were not feasible alternatives.
Driven piles require more space and overhead clearance when compared to the minimum 8 ft
50
clearance required for the installation of some micropiles. Also, the excessive vibrations associated
with driving piles can influence the surrounding soil and initiate additional settlement [32].
There are many situations when a micropile system could be more cost effective than driven
piles. The equipment used for micropile installation is relatively small compared to pile driving
equipment and is therefore more mobile. Micropiles are also ideally suited for fragile environmental
areas since the installation equipment produces a relatively small amount of noise, vibrations, and
waste material. Another advantage of micropiles is that they can be installed in situations in which
traditional driven piles may not be practical. This includes the presence of compressible and
expansive soil layers. Downdrag and uplift forces are not as influential on micropile foundations due
to the relatively small surface area of the piles. Additionally, the presence of cobbles, boulders and
other subsurface obstructions are not as troublesome for micropiles as they may be for driven
piles [34].
Micropiles work well for many situations; however, there are some restrictions. The small
diameter of micropiles limit their lateral load and flexural capacities. Alternatives include the use of a
battered micropile to resist lateral loadings or replacing the bar reinforcement with structural steel
tubing located on the upper length of the micropile shaft. Another restriction of micropiles is the
special techniques required for installation, including various drilling techniques, reinforcement types,
grout mixtures, and grout placement procedures. If a micropile is not properly designed for the site
conditions, or if the contractor does not have sufficient experience with installing micropiles, the
structural and bearing capacity of the micropile can be compromised [34].
Micropile installation procedures may require an experienced contractor, however the
techniques and equipment required are generally no different from what is required for the installation
of ground anchors, soil nails and grout holes. The general construction sequence for micropiles using
a drill casing is shown in Figure 5.1. First, a hole is drilled to the appropriate depth. A drill casing is
inserted into the hole to maintain the shape as the depth increases. Once the desired depth has been
obtained, the drill bit is removed and the casing is left in place. Next, gravity flow grout is placed in
the hole in addition to any steel reinforcement. Finally, the top of the drill casing is sealed and an
additional amount of grout is placed under pressure while the drill casing is raised to the final height.
The finished micropile is then tied to a new or existing structure foundation. The increased grout
pressure will create a grout bulb with an increased surface area. Additionally, the lateral pressure
increases the bearing capacity of the pile by improving the ground-to-ground bond. The drill casing
can be left in place for the micropile reinforcement as shown in Figure 5.1 [34].
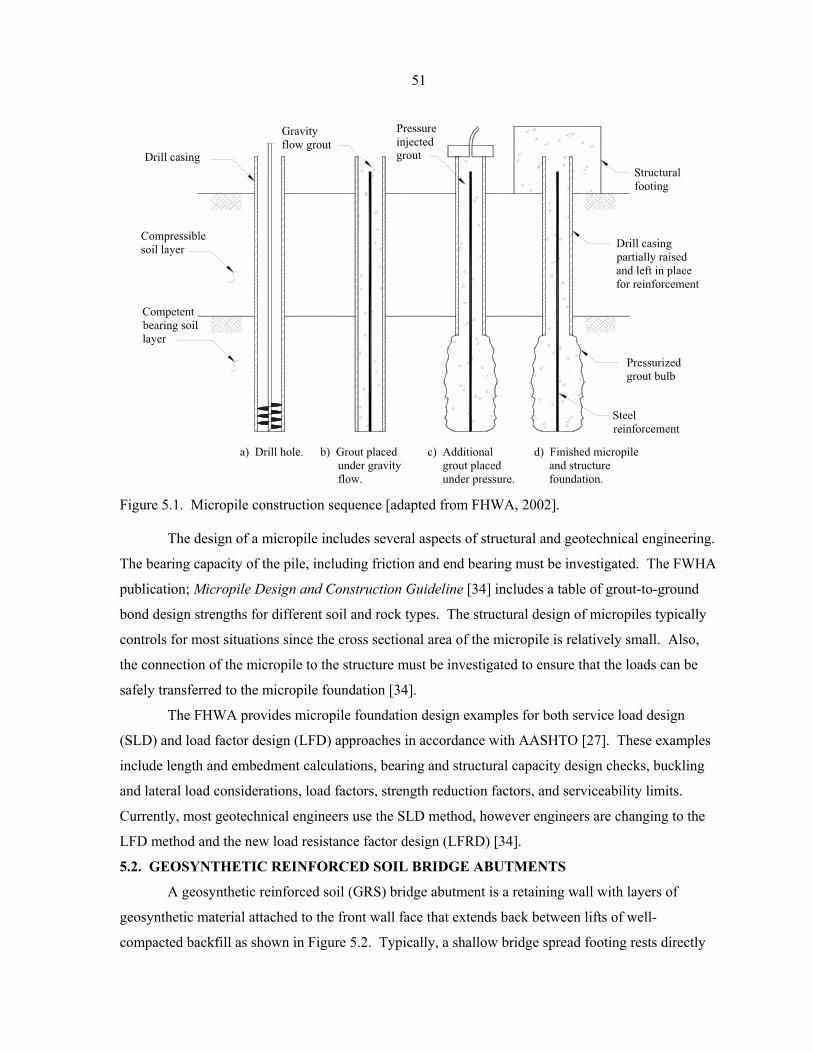
51
Figure 5.1. Micropile construction sequence [adapted from FHWA, 2002].
The design of a micropile includes several aspects of structural and geotechnical engineering.
The bearing capacity of the pile, including friction and end bearing must be investigated. The FWHA
publication; Micropile Design and Construction Guideline [34] includes a table of grout-to-ground
bond design strengths for different soil and rock types. The structural design of micropiles typically
controls for most situations since the cross sectional area of the micropile is relatively small. Also,
the connection of the micropile to the structure must be investigated to ensure that the loads can be
safely transferred to the micropile foundation [34].
The FHWA provides micropile foundation design examples for both service load design
(SLD) and load factor design (LFD) approaches in accordance with AASHTO [27]. These examples
include length and embedment calculations, bearing and structural capacity design checks, buckling
and lateral load considerations, load factors, strength reduction factors, and serviceability limits.
Currently, most geotechnical engineers use the SLD method, however engineers are changing to the
LFD method and the new load resistance factor design (LFRD) [34].
5.2. GEOSYNTHETIC REINFORCED SOIL BRIDGE ABUTMENTS
A geosynthetic reinforced soil (GRS) bridge abutment is a retaining wall with layers of
geosynthetic material attached to the front wall face that extends back between lifts of well-
compacted backfill as shown in Figure 5.2. Typically, a shallow bridge spread footing rests directly
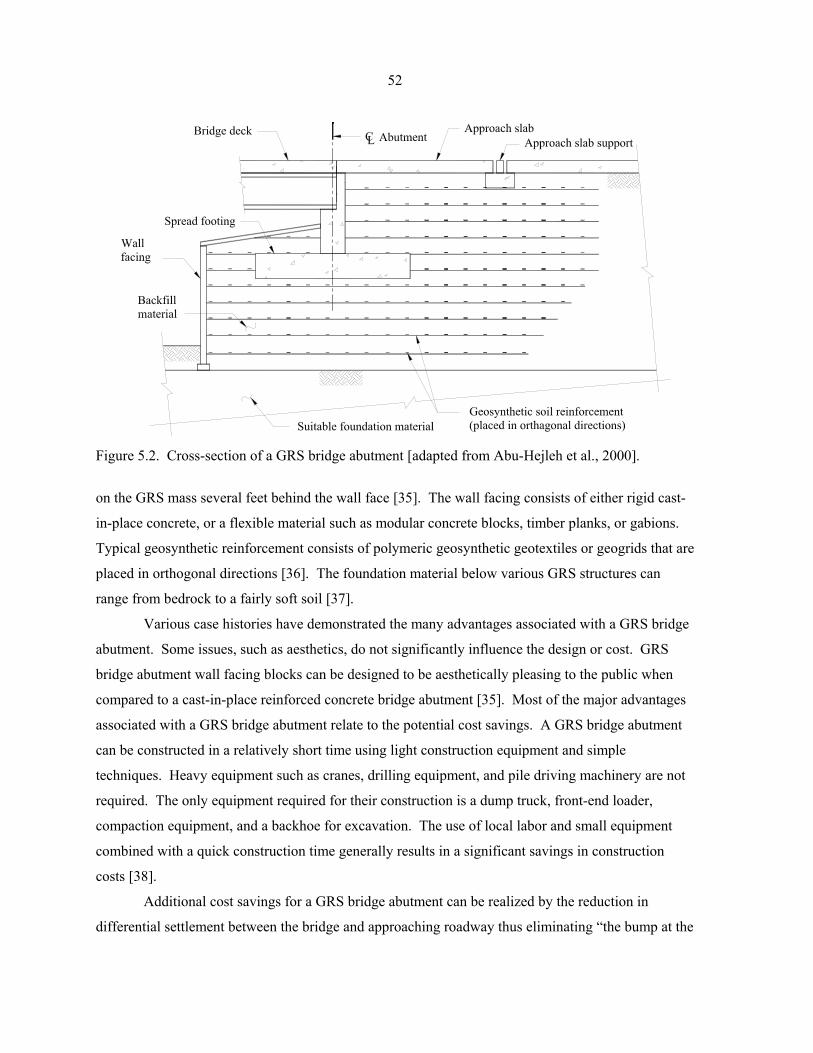
52
Figure 5.2. Cross-section of a GRS bridge abutment [adapted from Abu-Hejleh et al., 2000].
on the GRS mass several feet behind the wall face [35]. The wall facing consists of either rigid cast-
in-place concrete, or a flexible material such as modular concrete blocks, timber planks, or gabions.
Typical geosynthetic reinforcement consists of polymeric geosynthetic geotextiles or geogrids that are
placed in orthogonal directions [36]. The foundation material below various GRS structures can
range from bedrock to a fairly soft soil [37].
Various case histories have demonstrated the many advantages associated with a GRS bridge
abutment. Some issues, such as aesthetics, do not significantly influence the design or cost. GRS
bridge abutment wall facing blocks can be designed to be aesthetically pleasing to the public when
compared to a cast-in-place reinforced concrete bridge abutment [35]. Most of the major advantages
associated with a GRS bridge abutment relate to the potential cost savings. A GRS bridge abutment
can be constructed in a relatively short time using light construction equipment and simple
techniques. Heavy equipment such as cranes, drilling equipment, and pile driving machinery are not
required. The only equipment required for their construction is a dump truck, front-end loader,
compaction equipment, and a backhoe for excavation. The use of local labor and small equipment
combined with a quick construction time generally results in a significant savings in construction
costs [38].
Additional cost savings for a GRS bridge abutment can be realized by the reduction in
differential settlement between the bridge and approaching roadway thus eliminating “the bump at the

53
end of the bridge”. Different settlement rates between the bridge foundation system (deep or shallow)
and the approach roadway fill are typically the cause for this differential settlement. Past attempts to
solve this problem have included extension of the wingwalls to further contain the backfill soil, using
a stronger/stiffer approach slab, and using granular backfill soil to limit the magnitude of the
settlement [35]. As shown in Figure 5.2, the geosynthetic reinforcement extends well beyond bridge
abutment spread footing, thus the bridge foundation and approaching roadway are both supported by
the same system. The additional approach slab support as shown in Figure 5.2 is to help reduce
differential settlement in a GRS bridge abutment approach slab.
There are certain situations in which a GRS bridge abutment may not be a feasible
alternative. For example, the front face of the GRS bridge abutment wall does not extend very far
below the ground line. Therefore, the GRS mass should be placed on a coarse, non-scour susceptible
material or should only be used in situations where the potential for scour does not exist [39]. Also,
GRS bridge abutments can tolerate differential settlement thus exhibiting good seismic
performance [35]. However, if the total settlement is projected to be more than three inches, deep
foundation elements should be considered [39].
The Founders/Meadow bridge abutment in Colorado was the first GRS bridge abutment
constructed in the United States for large volumes of traffic; this bridge was opened in 1999 [40].
Other GRS bridge abutments have been built by several different government agencies such as the
FHWA, the Colorado DOT, as well as the California DOT (Caltrans), and Alaska DOT in
conjunction with the United States Forest Service [37, 38, 40]. These GRS bridge abutments were for
either small forest park roads, trail bridges, or for experimental purposes.
As previously described, the application of a GRS structure as a bridge foundation is a
relatively new idea. Based on the performance of the experimental and in service GRS bridge
abutments, some recommendations can be made. One important factor associated with a GRS bridge
abutment is the condition of the backfill soil. The backfill material should consist of a course-grained
soil with a high soil friction angle that is compacted with a 95 percent compactive effort [38, 41].
The Colorado DOT also recommends the construction of the backfill should take place in the drier,
warmer months instead of the cold winter season. It may be possible that excess moisture could
become trapped and freeze in the backfill soil during the winter months. When the temperature
increases, thawing could create an outward wall displacement [39].
The geosynthetic reinforcement in a GRS mass increases significantly the vertical bearing
capacity. It has been documented that the strength of the geosynthetic reinforcement is not as
influential as the vertical spacing of the reinforcement. A smaller vertical reinforcement spacing
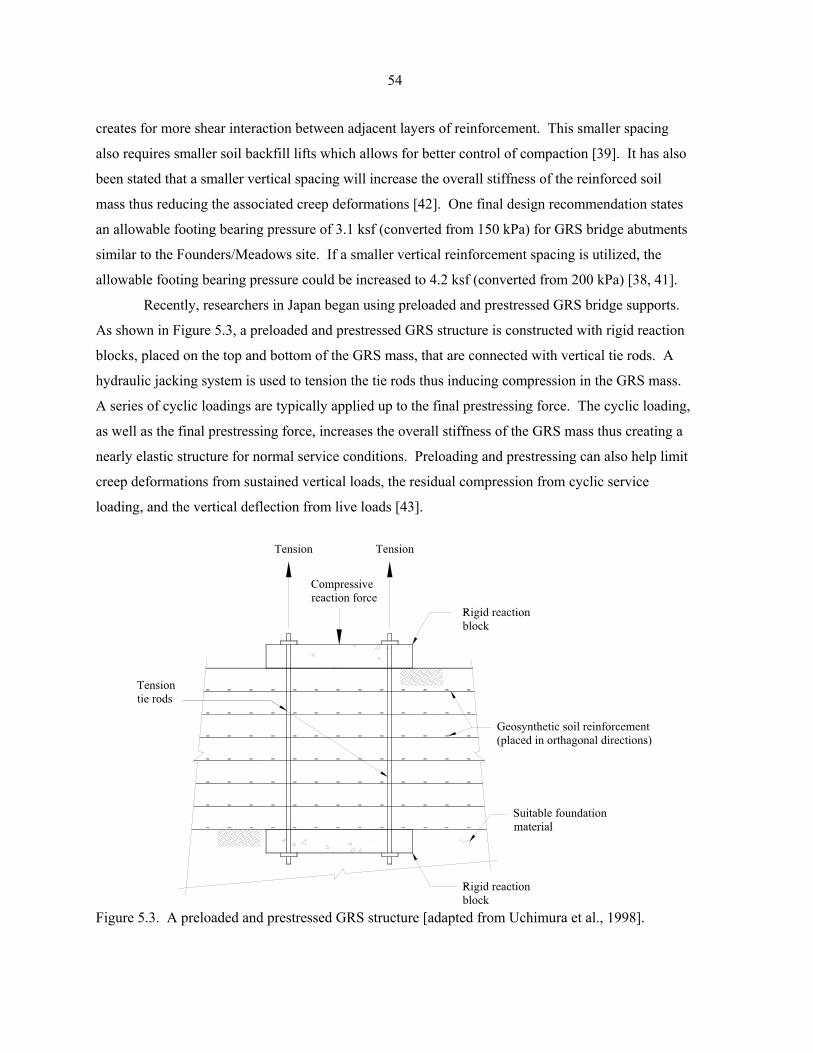
54
creates for more shear interaction between adjacent layers of reinforcement. This smaller spacing
also requires smaller soil backfill lifts which allows for better control of compaction [39]. It has also
been stated that a smaller vertical spacing will increase the overall stiffness of the reinforced soil
mass thus reducing the associated creep deformations [42]. One final design recommendation states
an allowable footing bearing pressure of 3.1 ksf (converted from 150 kPa) for GRS bridge abutments
similar to the Founders/Meadows site. If a smaller vertical reinforcement spacing is utilized, the
allowable footing bearing pressure could be increased to 4.2 ksf (converted from 200 kPa) [38, 41].
Recently, researchers in Japan began using preloaded and prestressed GRS bridge supports.
As shown in Figure 5.3, a preloaded and prestressed GRS structure is constructed with rigid reaction
blocks, placed on the top and bottom of the GRS mass, that are connected with vertical tie rods. A
hydraulic jacking system is used to tension the tie rods thus inducing compression in the GRS mass.
A series of cyclic loadings are typically applied up to the final prestressing force. The cyclic loading,
as well as the final prestressing force, increases the overall stiffness of the GRS mass thus creating a
nearly elastic structure for normal service conditions. Preloading and prestressing can also help limit
creep deformations from sustained vertical loads, the residual compression from cyclic service
loading, and the vertical deflection from live loads [43].
Figure 5.3. A preloaded and prestressed GRS structure [adapted from Uchimura et al., 1998].
55
The first preloaded and prestressed GRS bridge pier in Japan was put into service in 1997. In
this initial project, a GRS bridge pier and abutment were constructed. The pier was preloaded and
prestressed, however the abutment was not which permitted a direct comparison of the two GRS
systems. The construction of the GRS bridge pier took five workers a total of five days to complete,
and the duration of the preloading process took 72 hours. Structural monitoring under service loads
has revealed that the preloaded and prestressed GRS bridge pier has behaved nearly elastically
whereas the GRS bridge abutment had had a relatively larger residual compression. The Japanese
researchers believe that the GRS bridge abutment will require premature maintenance work whereas
the preloaded and prestressed GRS bridge pier will not [43].
5.3. GEOPIER FOUNDATIONS
Geopier foundations, or rammed aggregate piers, are a type of specially compacted aggregate
columns that can be used to vertically reinforce a soil profile thus allowing a shallow spread footing
foundation to be used in poor soil conditions. Geopier foundations are being used to control
foundation settlement, provide uplift capacity, and to stabilize soil slopes. Geopier foundations are
constructed using a unique technique that imparts lateral stress on the surrounding soil which
increases the vertical bearing capacity and reduces the magnitude of total settlement [44]. Geopier
elements are designed to improve the surrounding soil conditions; they do not support the foundation
loads as independent structural members, therefore they do not need to extend to deeper, more
suitable soil layers [45]. These advantages make Geopier foundations an effective and cost-
competitive alternative. In certain situations, Geopier foundations result in a 40 to 60 percent cost
savings when compared to deep foundations [44]. For example, Geopier foundations with lengths
ranging from 7 to 9 ft in combination with shallow spread footings were used in the construction of a
parking garage in place of 75 ft long driven piles at a cost savings of over 50 percent [46].
One of the biggest advantages of a Geopier foundation is that it can be used in poor soil
conditions where settlement may be a concern. In these situations, typical foundation solutions
include the excavation and replacement of existing weak soil layers or the driving of piles to bedrock.
Typical Geopier foundations are less than 20 ft in length and have been documented to work in a
variety of situations including soft organic clays, peat, loose silt, uncompacted fill soils, debris fill
soils, stiff to very stiff clays, and medium dense to dense sands. Geopier foundations can increase the
bearing capacity of weak soils so that the construction of a structure is feasible [46].
The Geopier foundation construction sequence is shown in Figure 5.4. The first step in the
construction sequence involves drilling a hole 24 to 36 in. in diameter to a depth of 6 to 23 ft. A layer
of crushed, clean aggregate is placed in the bottom of the hole and then compacted using a high-
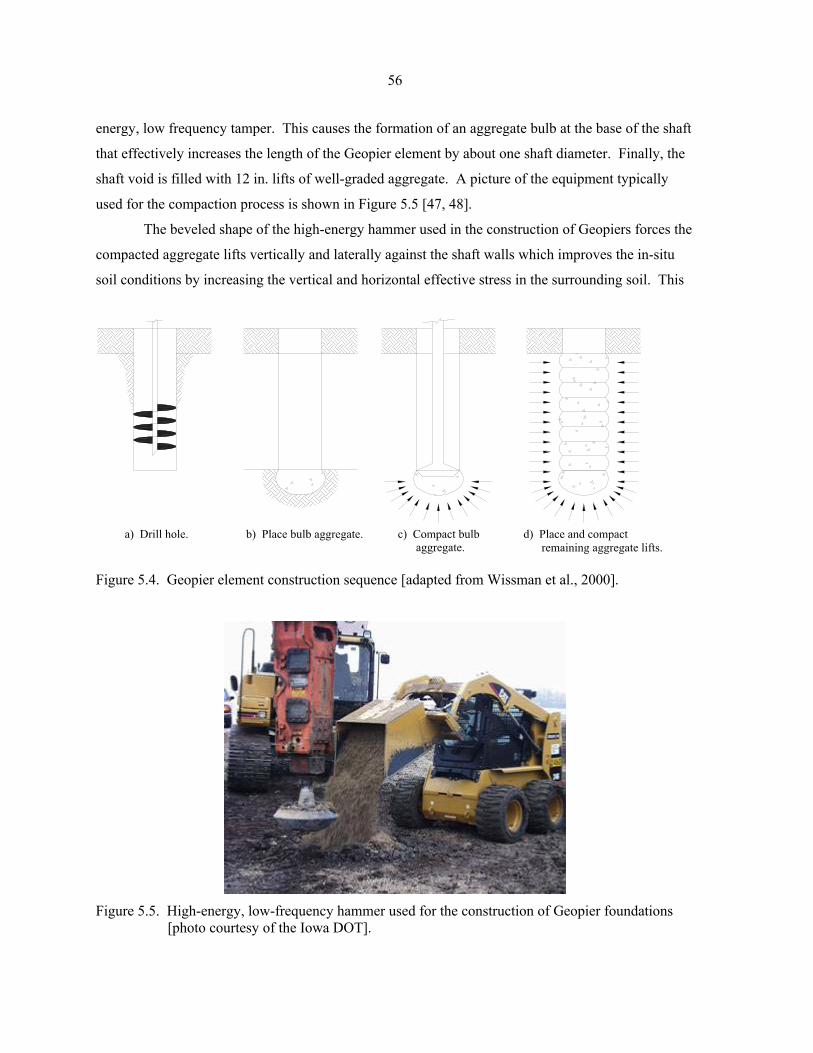
56
energy, low frequency tamper. This causes the formation of an aggregate bulb at the base of the shaft
that effectively increases the length of the Geopier element by about one shaft diameter. Finally, the
shaft void is filled with 12 in. lifts of well-graded aggregate. A picture of the equipment typically
used for the compaction process is shown in Figure 5.5 [47, 48].
The beveled shape of the high-energy hammer used in the construction of Geopiers forces the
compacted aggregate lifts vertically and laterally against the shaft walls which improves the in-situ
soil conditions by increasing the vertical and horizontal effective stress in the surrounding soil. This
Figure 5.4. Geopier element construction sequence [adapted from Wissman et al., 2000].
Figure 5.5. High-energy, low-frequency hammer used for the construction of Geopier foundations
[photo courtesy of the Iowa DOT].
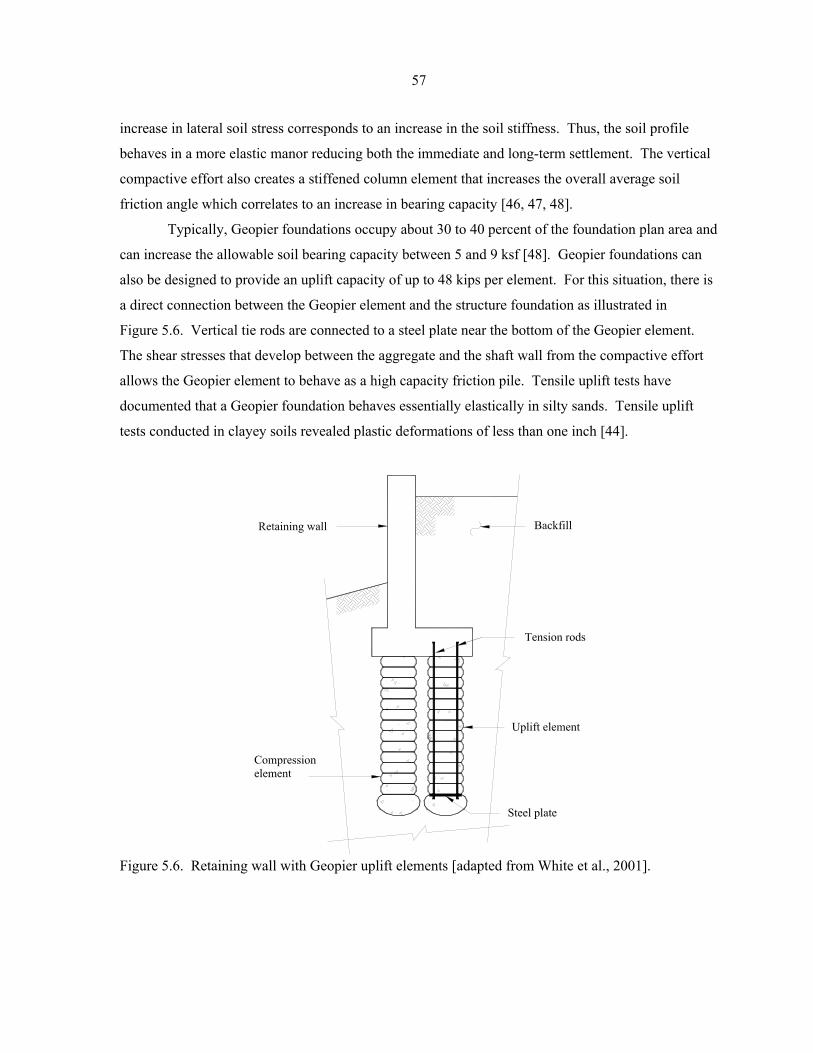
57
increase in lateral soil stress corresponds to an increase in the soil stiffness. Thus, the soil profile
behaves in a more elastic manor reducing both the immediate and long-term settlement. The vertical
compactive effort also creates a stiffened column element that increases the overall average soil
friction angle which correlates to an increase in bearing capacity [46, 47, 48].
Typically, Geopier foundations occupy about 30 to 40 percent of the foundation plan area and
can increase the allowable soil bearing capacity between 5 and 9 ksf [48]. Geopier foundations can
also be designed to provide an uplift capacity of up to 48 kips per element. For this situation, there is
a direct connection between the Geopier element and the structure foundation as illustrated in
Figure 5.6. Vertical tie rods are connected to a steel plate near the bottom of the Geopier element.
The shear stresses that develop between the aggregate and the shaft wall from the compactive effort
allows the Geopier element to behave as a high capacity friction pile. Tensile uplift tests have
documented that a Geopier foundation behaves essentially elastically in silty sands. Tensile uplift
tests conducted in clayey soils revealed plastic deformations of less than one inch [44].
Figure 5.6. Retaining wall with Geopier uplift elements [adapted from White et al., 2001].
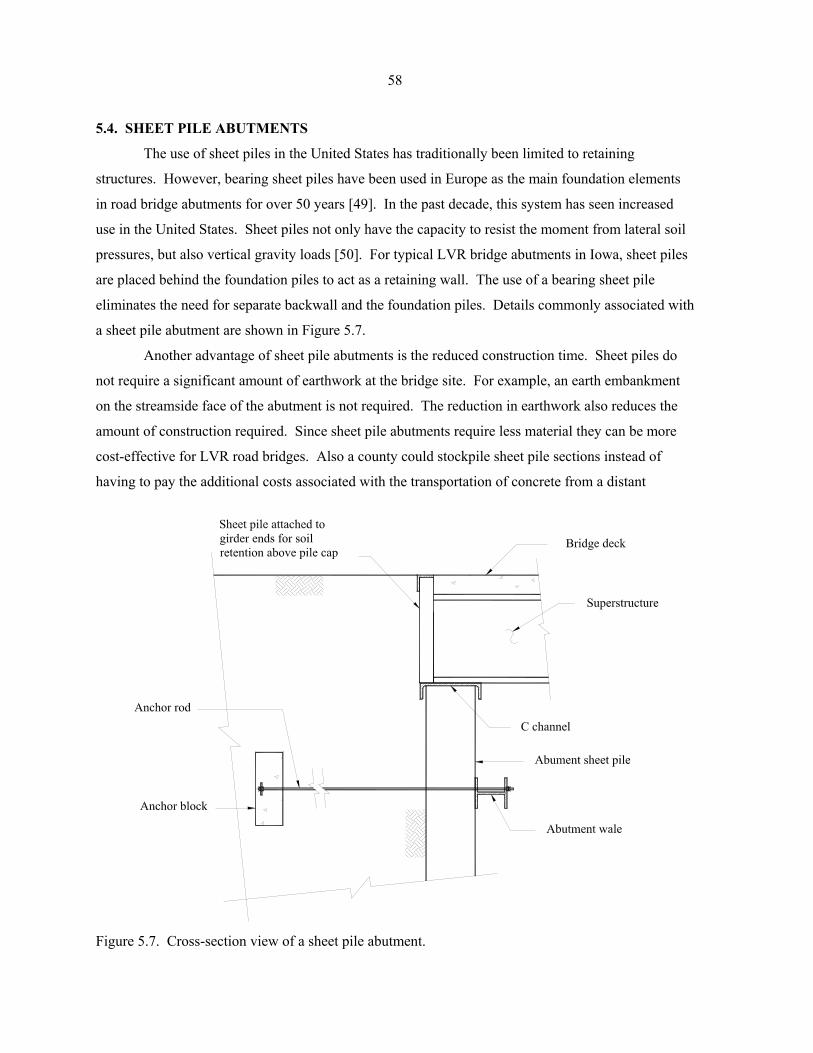
58
5.4. SHEET PILE ABUTMENTS
The use of sheet piles in the United States has traditionally been limited to retaining
structures. However, bearing sheet piles have been used in Europe as the main foundation elements
in road bridge abutments for over 50 years [49]. In the past decade, this system has seen increased
use in the United States. Sheet piles not only have the capacity to resist the moment from lateral soil
pressures, but also vertical gravity loads [50]. For typical LVR bridge abutments in Iowa, sheet piles
are placed behind the foundation piles to act as a retaining wall. The use of a bearing sheet pile
eliminates the need for separate backwall and the foundation piles. Details commonly associated with
a sheet pile abutment are shown in Figure 5.7.
Another advantage of sheet pile abutments is the reduced construction time. Sheet piles do
not require a significant amount of earthwork at the bridge site. For example, an earth embankment
on the streamside face of the abutment is not required. The reduction in earthwork also reduces the
amount of construction required. Since sheet pile abutments require less material they can be more
cost-effective for LVR road bridges. Also a county could stockpile sheet pile sections instead of
having to pay the additional costs associated with the transportation of concrete from a distant
Figure 5.7. Cross-section view of a sheet pile abutment.
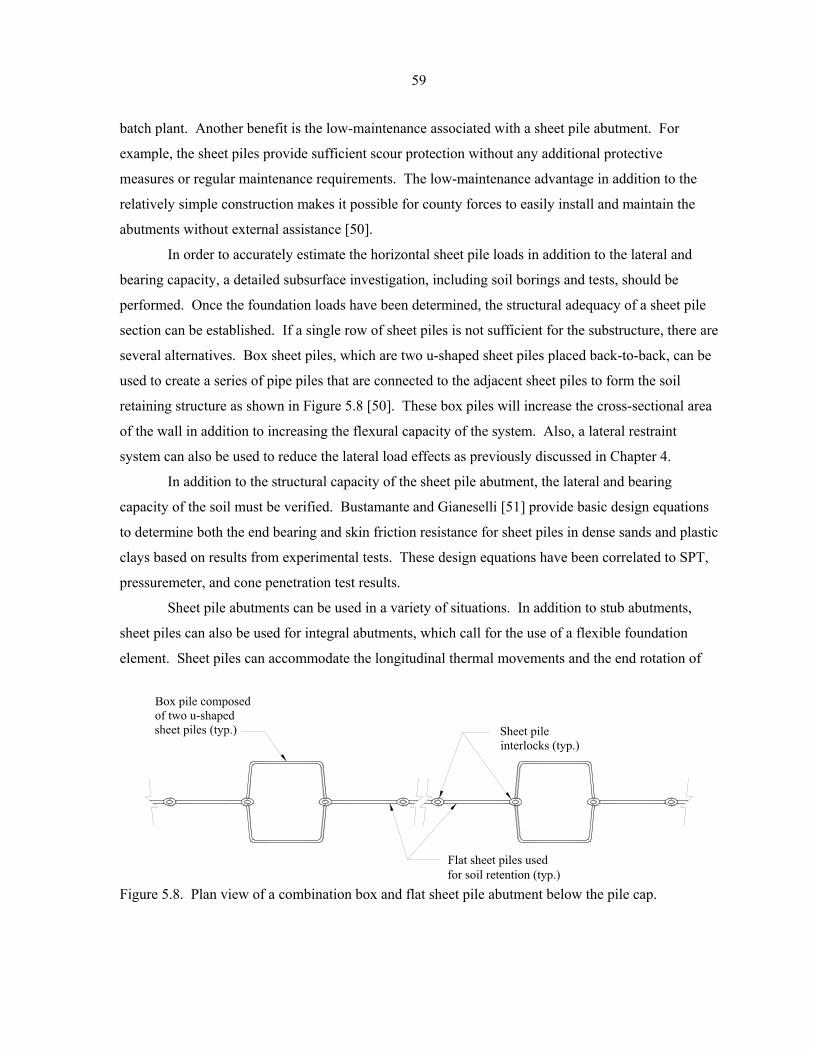
59
batch plant. Another benefit is the low-maintenance associated with a sheet pile abutment. For
example, the sheet piles provide sufficient scour protection without any additional protective
measures or regular maintenance requirements. The low-maintenance advantage in addition to the
relatively simple construction makes it possible for county forces to easily install and maintain the
abutments without external assistance [50].
In order to accurately estimate the horizontal sheet pile loads in addition to the lateral and
bearing capacity, a detailed subsurface investigation, including soil borings and tests, should be
performed. Once the foundation loads have been determined, the structural adequacy of a sheet pile
section can be established. If a single row of sheet piles is not sufficient for the substructure, there are
several alternatives. Box sheet piles, which are two u-shaped sheet piles placed back-to-back, can be
used to create a series of pipe piles that are connected to the adjacent sheet piles to form the soil
retaining structure as shown in Figure 5.8 [50]. These box piles will increase the cross-sectional area
of the wall in addition to increasing the flexural capacity of the system. Also, a lateral restraint
system can also be used to reduce the lateral load effects as previously discussed in Chapter 4.
In addition to the structural capacity of the sheet pile abutment, the lateral and bearing
capacity of the soil must be verified. Bustamante and Gianeselli [51] provide basic design equations
to determine both the end bearing and skin friction resistance for sheet piles in dense sands and plastic
clays based on results from experimental tests. These design equations have been correlated to SPT,
pressuremeter, and cone penetration test results.
Sheet pile abutments can be used in a variety of situations. In addition to stub abutments,
sheet piles can also be used for integral abutments, which call for the use of a flexible foundation
element. Sheet piles can accommodate the longitudinal thermal movements and the end rotation of
Figure 5.8. Plan view of a combination box and flat sheet pile abutment below the pile cap.
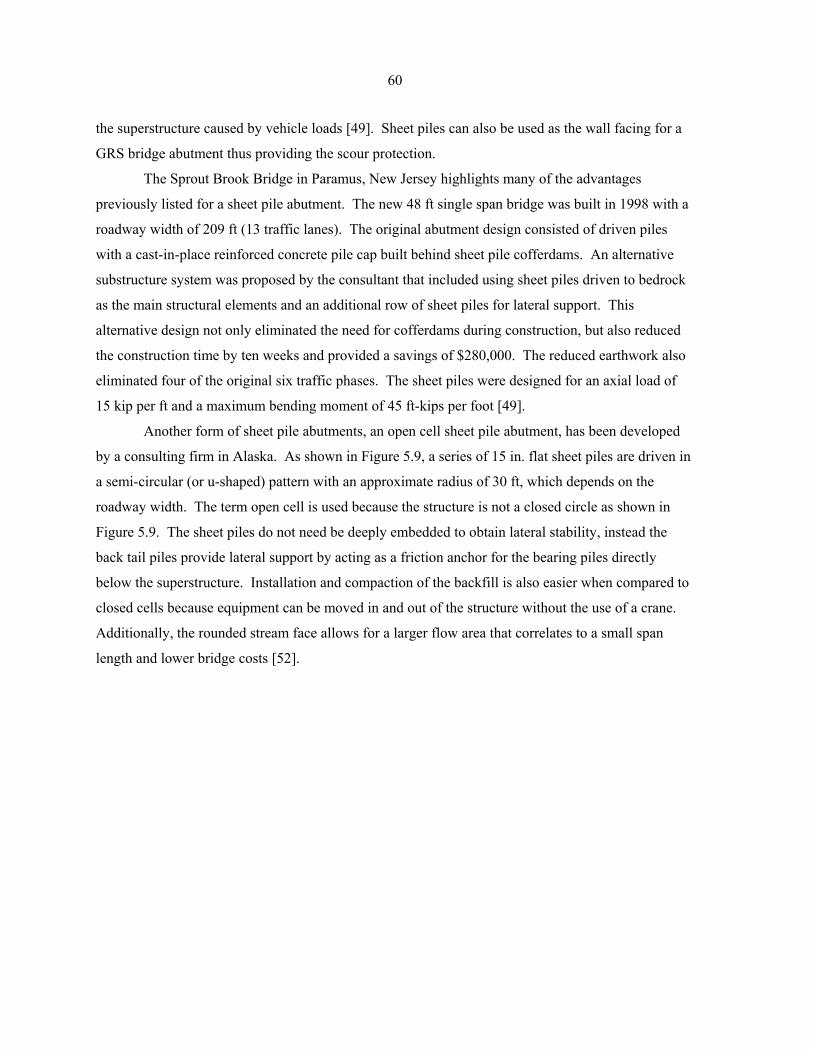
60
the superstructure caused by vehicle loads [49]. Sheet piles can also be used as the wall facing for a
GRS bridge abutment thus providing the scour protection.
The Sprout Brook Bridge in Paramus, New Jersey highlights many of the advantages
previously listed for a sheet pile abutment. The new 48 ft single span bridge was built in 1998 with a
roadway width of 209 ft (13 traffic lanes). The original abutment design consisted of driven piles
with a cast-in-place reinforced concrete pile cap built behind sheet pile cofferdams. An alternative
substructure system was proposed by the consultant that included using sheet piles driven to bedrock
as the main structural elements and an additional row of sheet piles for lateral support. This
alternative design not only eliminated the need for cofferdams during construction, but also reduced
the construction time by ten weeks and provided a savings of $280,000. The reduced earthwork also
eliminated four of the original six traffic phases. The sheet piles were designed for an axial load of
15 kip per ft and a maximum bending moment of 45 ft-kips per foot [49].
Another form of sheet pile abutments, an open cell sheet pile abutment, has been developed
by a consulting firm in Alaska. As shown in Figure 5.9, a series of 15 in. flat sheet piles are driven in
a semi-circular (or u-shaped) pattern with an approximate radius of 30 ft, which depends on the
roadway width. The term open cell is used because the structure is not a closed circle as shown in
Figure 5.9. The sheet piles do not need be deeply embedded to obtain lateral stability, instead the
back tail piles provide lateral support by acting as a friction anchor for the bearing piles directly
below the superstructure. Installation and compaction of the backfill is also easier when compared to
closed cells because equipment can be moved in and out of the structure without the use of a crane.
Additionally, the rounded stream face allows for a larger flow area that correlates to a small span
length and lower bridge costs [52].
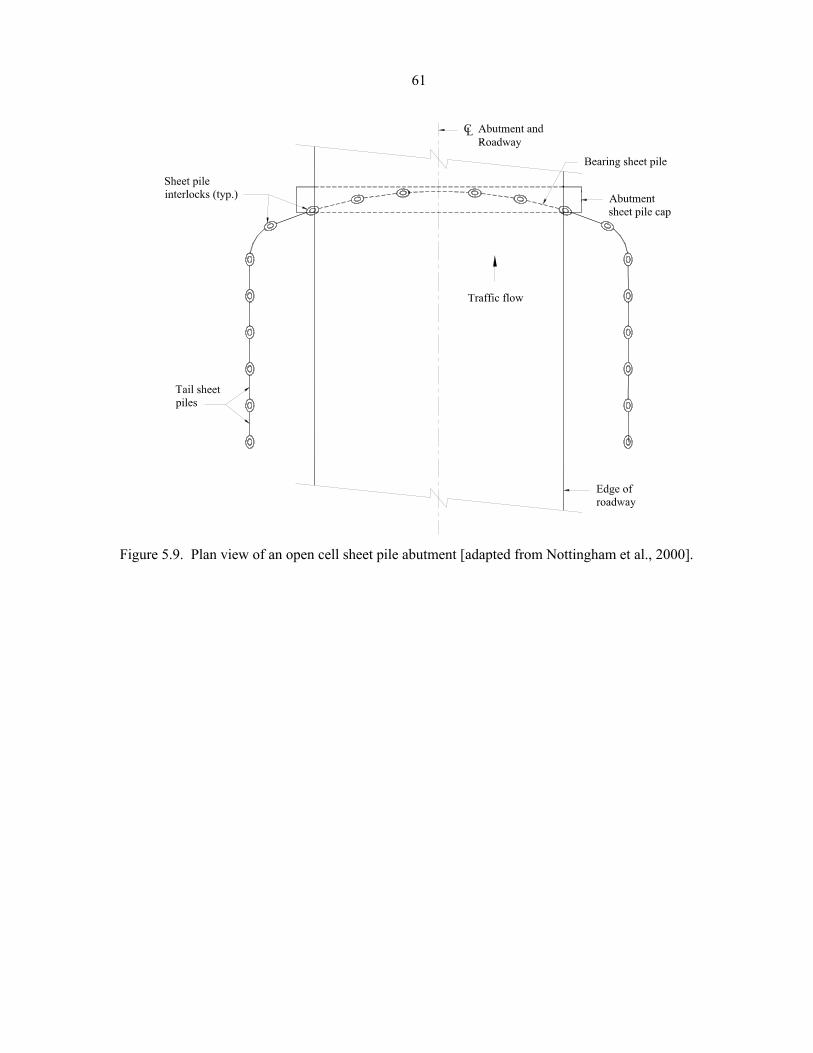
61
Figure 5.9. Plan view of an open cell sheet pile abutment [adapted from Nottingham et al., 2000].

63
6. REPORT SUMMARY
This research project consisted of three major phases: the collection of LVR bridge abutment
information, the development of an abutment design methodology, and the creation of design aids for
Iowa County Engineers and municipal engineers. In the first phase, a literature review and survey of
the Iowa County Engineers was completed in addition to the formation of the PAC. The literature
review focused on locating LVR bridge abutment design information. A survey was used to
determine the level of current knowledge and/or use of standard design sheets by the counties and the
identification of common construction methods and trends. The PAC, which was composed of Iowa
County Engineers and representatives from the Iowa DOT Office of Bridges and Structures, provided
information on the roadway and span length limitations, which superstructures should be
accommodated by the standard abutment designs, information on backwall heights, and common pile
materials. Additionally, members of the PAC noted that local Iowa Engineers would have more
flexibility when designing an abutment if a flexible and easy to use design template was created
(i.e., a spreadsheet or Visual Basic software). This phase of the project resulted in the identification
of different LVR bridge abutment systems commonly used in Iowa counties, a series of alternative
abutment systems, and two different pile analysis methodologies that could be used to investigate the
influence of the lateral loading on the piles.
The literature search revealed several alternative abutment systems that are well established
in a particular geographic region or for a specific use; however, none of them have been used in Iowa
bridge abutments. The alternative abutment systems include micropiles, GRS structures, Geopier
foundations, and sheet pile abutments. Since these are economical and provide advantages over the
traditional deep foundations systems currently used (i.e., driven piles), they show promise for use in
Iowa. As noted in the following chapter, it is proposed that several of these systems be investigated
and tested in demonstration projects.
The second phase of this project involved investigating different lateral load analysis
methodologies and the development of a foundation design methodology for the foundation elements.
Two separate pile analysis methods were investigated, including a linear and a non-linear method. It
was determined that each method has certain advantages such as the ability to model complex soil
conditions and profiles, more accurately representing the actual soil and pile interaction, and the ease
of incorporating the analysis method into a complete design methodology.
The maximum pile moments obtained from the linear and non-linear methods were
compared; it was determined that the linear method is more conservative for most lateral load cases
64
associated with LVR bridge abutments. For stiff cohesive soils, the linear method is more
conservative by 7 to 15 percent depending on the magnitude of the lateral pile loadings. However,
the linear method produces less conservative maximum pile moments in soft cohesive soils. The
linear method is less conservative by about 3 to 20 percent depending on the lateral pile loading.
Finally, the maximum pile moments in cohesionless soils obtained from the linear method are more
conservative by zero to three percent when compared to the non-linear analysis method.
Based on the relative simplicity and the correlation of the calculated maximum pile moments,
it was decided that the linear analysis procedure presented by Broms [17, 18] would be the most
suitable for this project. This method considers the pile fixed at a calculated depth below ground
based on soil properties and lateral loading conditions. The maximum moment in the pile can then be
calculated using basic structural analysis. The structural analysis procedure for the piles was
developed using the recommendations of the AASTHO [27] and the NDS Manual for Wood
Construction [28] for steel and timber piles.
An analysis and design methodology was also developed for the lateral restraint system that
can be used to resist the lateral substructure loads. Two lateral restraint systems are presented: a
positive connection between the superstructure bearings and the substructure, and a buried concrete
anchor connected to the substructure with anchor rods. A positive connection between the
superstructure bearings and substructure will transfer lateral loads between the superstructure units
using the axial stiffness of the superstructure. The lateral restraint provided by an anchor system is a
result of the passive soil pressure that acts on the vertical anchor face in the opposite direction of the
lateral substructure loads as described by Bowles [10]. This lateral capacity is transferred to the pile
system with the use of anchor rods and an abutment wale. The procedure for determining the
structural capacity of the anchor block was developed using AASHTO [27] reinforced concrete
design specifications.
The third and final phase of this project involved the development of the design aids that
incorporate the previously mentioned design methodology. These design aids include a FDT with
instructions and a series of generic standard abutment plans. The design spreadsheet is used to verify
the adequacy of a pile and anchor system (if needed) for a particular bridge. The engineer inputs data
such as bridge geometry, soil conditions, pile information, and lateral restraint details. This
information is used in an analysis of the foundation system to determine the capacity of the system,
and to complete the required design checks. Finally, a series of generic standard abutment plans were
created for different situations. This includes different standard sheets for each combination of steel
or timber piles either with or without concrete anchors, a steel channel or concrete pile cap, and a

65
backwall consisting of timber planks or vertically driven sheet piles. The standard abutment sheets
can be used by Iowa County Engineers to produce the necessary drawings for the more common LVR
bridge abutments systems. In order for the engineer to produce a finished set of abutment
construction sheets, the necessary details such as the bridge geometry, member size (i.e., W, C, and
HP shapes), and material properties must be provided by the engineer. Volume 2 of this final report
is a design manual for LVR bridge abutments that also presents the previously mentioned design aids
in detail. A series of design examples are also presented in Volume 3 of this final report.

67
7. RECOMMENDED RESEARCH
Additional research is recommended to investigate other types of abutments mentioned in this
report. A brief description of several items that should be investigated is presented below:
The literature search revealed several alternative abutment systems that could be economical
at certain sites. These systems include micropiles, GRS structures, Geopier foundations, and
sheet pile abutments. Some of these systems are well established in certain regions of the
country or for a specific use; however, none have been used in a bridge abutment system in
Iowa. Since these appear to be economical and provide advantages over the traditional deep
foundations systems (i.e., driven piles), they show promise for use on Iowa LVR bridge
abutments. Thus, demonstration projects employing each of these four systems should be
undertaken. Each of these abutment systems should be instrumented and monitored for at
least three years. Design methodologies and generic plans (similar to those developed in this
project) should be developed to assist engineers with their design.
The use of precast substructure elements for bridge abutments should be investigated. A
precast system has several advantages. An offsite precast yard results in faster production
and better quality control when compared to onsite concrete construction. Thus, precast
elements will result in a faster construction sequence of a bridge’s substructure. Additionally,
once the casting elements have been purchased, the overall cost of future abutments will be
reduced. Demonstration projects using precast elements will document these advantages.
The details associated with the precast substructure elements noted below should be
investigated:
o Pile cap that can also be used as a backwall (similar to Figures 3.2 and 3.3).
o Wingwalls.
o Backwall panels that are placed between exposed steel H-piles (Figure 3.4).
o Tieback systems (grouted in place).
o Complete backwall systems that are post-tensioned to a system of piles.
68
As previously noted, the design methodology and design aids developed in this investigation
provide engineers with the tools to significantly reduce the time and effort required to design
a LVR bridge abutment. Although the information and tools provided with this report can be
applied to LVR bridge abutment design following the guidelines specified herein, a short
course should be developed and administered to familiarize engineers the with the design
methodology and design aids. This one-half day short course could be presented in each of
the six transportation districts to minimize travel time for Iowa County Engineers.
69
8. AKNOWLEDGEMENTS
The research presented in this report was conducted by the Bridge Engineering Center under
the auspices of the Engineering Research Institute of Iowa State University. The research was
sponsored by the Highway Division of the Iowa Department of Transportation and the Iowa Highway
Research Board under Research Project TR-486.
The authors wish to thank the various Iowa DOT Engineers and Iowa County Engineers who
provided their input and support. In particular, we wish to thank the Project Advisory Committee:
Dean G. Bierwagen: Methods Engineer, Office of Bridges and Structures, Iowa DOT.
Brian Keierleber: County Engineer, Buchanan County.
Mark J. Nahra: County Engineer, Delaware County.
Tom P. Schoellen: Assistant County Engineer, Black Hawk County.
Special thanks are accorded to the following Iowa State University undergraduate civil
engineering students for their assistance in various aspects of the project: Toshia Akers, Jonathan
Greenlee, and Katie Hagen.

71
9. REFERENCES
1. Wipf, T.J., F.W. Klaiber, and A. Prabhakaran. Evaluation of Bridge Replacement Alternatives for the County Bridge System. Final Report for Iowa DOT HR-365, Aug. 1994, 113 p.
2. Wipf, T. J., F. W. Klaiber, and B. M. Phares. Investigation of Two Bridges Alternating for
Low Volume Roads – Concept 1: Steel Beam Precast Units. Final Report for Iowa DOT HR-382: Volume 1 of 2, April 1997, 138 p.
3. Klaiber, F. W., T. J. Wipf, J. R. Reid, and M. J. Peterson. Investigation of Two Bridge
Alternatives for Low Volume Roads – Concept 2: Beam-In-Slab Bridge. Final Report for Iowa DOT HR-382: Volume 2 of 2, April 1997, 140 p.
4. Klaiber, F. W., T. J. Wipf, and T. F. Konda. Investigation of a Beam-in-Slab Bridge System
for Low-Volume Road Bridges. Final Report for Iowa DOT TR-467, publication expected Fall, 2004.
5. Wipf, T. J., F. W. Klaiber, J. D. Witt, and J. D. Doornink. Demonstration Project using
Railroad Flatcars for Low-Volume Road Bridges. Final Report for Iowa DOT TR-444, February 2003, 193 p.
6. Abendroth, R., and L. Greimann. Rational Design Approach for Integral Abutment Bridge
Piles. Transportation Research Record, No. 1223, pp. 12-23.
7. Iowa Department of Transportation. H24S-87, HS30-87, H24-87, H30-87, J24-87, and J30-87 Standard Bridge Designs. Ames: 1987.
8. Bridge Design Manual. Iowa Department of Transportation, Ames.
http://www.dot.state.ia.us/bridge/index.htm . Accessed August 30th, 2004.
9. Bridge Standard Drawings. Pennsylvania Department of Transportation, Harrisburg. http://www.dot.state.pa.us/Bridge/Standards/index.html . Accessed August 30th, 2004.
10. Bowles, J. Foundation Analysis and Design, Fifth Ed. McGraw – Hill, New York, 1996.
11. Bridge Bureau 2003 Standard Drawings. Alabama Department of Transportation,
Montgomery. http://www.dot.state.al.us/Bureau/bridge/index.htm . Accessed August 30th, 2004.
12. Bridge Detail (BD) Sheets. New York Department of Transportation, Albany.
http://www.dot.state.ny.us/structures/structures_home.html . Accessed August 30th, 2004.
13. Standard Bridge Drawings. Ohio Department of Transportation, Columbus. http://www.dot.state.oh.us/se/Default.asp. Accessed August 30th, 2004.
14. Bridge Design Standards. Oklahoma Department of Transportation, Oklahoma City.
http://www.okladot.state.ok.us/bridge/index.htm. Accessed August 30th, 2004.
72
15. Bridge Standards. Texas Department of Transportation, Austin. http://www.dot.state.tx.us/business/standardplanfiles.htm. Accessed August 30th, 2004.
16. Federal Highway Administration. NCHRP Synthesis 32-08: Cost Effective Structures for Off-
System Bridges. Washington D.C: publication expected 2004.
17. Broms, B.B. Lateral Resistance of Piles in Cohesive Soils. Journal of the Soil Mechanics and Foundations Division, Proceedings of the American Society of Civil Engineers, Vol. 90, No. SM2, March 1964, pp. 27-63.
18. Broms, B.B. Lateral Resistance of Piles in Cohesionless Soils. Journal of the Soil Mechanics
and Foundations Division, Proceedings of the American Society of Civil Engineers, Vol. 90, No. SM3, May 1964, pp. 123-156.
19. Iowa Department of Transportation. Foundation Soils Information Chart. Ames: 1994.
20. Terzaghi, K. and R. Peck. Soil Mechanics in Engineering Practice, Second Ed. Wiley, New
York, 1968.
21. LPILE Plus v. 4.0 for Windows Technical Manual. ENSOFT, Inc., Austin, Texas, 2000.
22. Peck, R. B. Foundation Engineering. Wiley, New York, 1974.
23. USDA (United States Department of Agriculture), Standard Plans for Timber Bridge Superstructures, Washington, D.C., 2001.
24. Pretensioned, Prestressed Concrete Beam Standards: LXD Beam Details. Iowa Department
of Transportation, Ames. http://www.dot.state.ia.us/bridge/index.htm. Accessed August 30th, 2004.
25. Wipf, T. J., F. W. Klaiber, B. M. Phares, and M.E. Fagen. Investigation of Two Bridges
Alternating for Low Volume Roads – Phase II, Concept 1: Steel Beam Precast Units. Final Report for Iowa DOT TR-410: Volume 1 of 2, July 2000, 170 p.
26. Prestressed Concrete Quad Tee Bridge Standards. Cretex Concrete Products Midwest, Inc.
(formerly known as Iowa Concrete Products Company), West Des Moines: 1991.
27. AASHTO (American Association of State Highway and Transportation Officials), Standard Specifications for Highway Bridges, 16th edition, Washington, D.C., 1996.
28. NDS (National Design Specifications), Manual For Wood Construction, Washington,
D.C., 2001.
29. Breyer, D. E. Design of Wood Structures, Third Ed. McGraw – Hill, New York, 1993.
30. Iowa Department of Transportation, Standard Specifications for Highway and Bridge Construction, Ames, IA, 1997.
73
31. Bruce, D., and C. Yeung. A Review of Minipiling, With Particular Regard to Hong Kong Applications. Hong Kong Engineer, Vol. 12, No. 6, June 1984, pp. 31-54.
32. Bruce, D. Aspects of Minipiling Practice in the United States. Ground Engineering,
November 1988, pp. 20-33.
33. Koreck, W. Small Diameter Bored Injection Piles. Ground Engineering, Vol. 11, No. 4, 1978, pp. 14-20.
34. FHWA (Federal Highway Administration), Micropile Design and Construction Guidelines,
Publication No. FHWA-SA-97-070, Washington D.C., 2002.
35. Abu-Hejleh, N., and T. Wang, J. Zornberg. Performance of Geosynthetic-Reinforced Walls Supporting Bridge and Approaching Roadway Structures. Geotechnical Special Publication, Vol. 103, 2000, pp. 218-243.
36. Ashmawy, A., A. Cira, M. Gunaratne, and P. Lai. Factors Controlling the Internal Stability
and Deformation of Geogrid Reinforced Bridge Abutments. Transportation Research Board, 82nd Annual Meeting (CD-ROM), No. 03-3201, 2003, pp. 1-17.
37. Keller, G., and S. Devin. Geosynthetic-Reinforced Soil Bridge Abutments. Transportation
Research Record, No. 1819, 2003, pp. 362-368.
38. Adams, M., K. Ketchart, A. Ruckman, A. DiMillio, J. Wu, and R. Satyanarayana. Reinforced Soil for Bridge Support Applications on Low-Volume Roads. Transportation Research Record, No. 1652, 1999, pp. 150-160.
39. Abu-Hejleh, N., J. Zornberg, W. Outcalt, and M. McMullen. Results and Recommendations
of Forensic Investigation of Three Full-Scale GRS Abutment and Piers in Denver, Colorado. Report No. CDOT-DTD-R-2001-6, Colorado Department of Transportation.
40. Abu-Hejleh, N., W. Outcalt, T. Wang, and J. Zornberg. Performance of Geosynthetic-
Reinforced Walls Supporting the Founders/Meadows Bridge and Approaching Roadway Structures – Report 1: Design, Materials, Construction, Instrumentation, and Preliminary Results. Report No.CDOT-DTD-R-2000-5, Colorado Department of Transportation.
41. Abu-Hejleh, N., J. Zornberg, T. Wang, M. McMullen, and W. Outcalt. Performance of
Geosynthetic-Reinforced Walls Supporting the Founders/Meadows Bridge and Approaching Roadway Structures – Report 2: Assessment of the Performance and Design of the Front GRS Walls and Recommendations for Future GRS Abutments. Report No.CDOT-DTD-R-2001-12, Colorado Department of Transportation.
42. Abu-Hejleh, N., J. Zornberg, T. Wang, and J. Watcharamonthein. Monitored Displacements
of Unique Geosynthetic-Reinforced Soil Bridge Abutments. Geosynthetics International, Vol. 9, No. 1, 2002, pp. 71-95.
43. Uchimura, T., F. Tatsuoka, M. Tateyama, and T. Koga. Preloaded-Prestressed Geogrid-
Reinforced Soil Bridge Pier. 6th International Conference on Geosynthetics Conference, Vol. 2, March 1998, pp. 565-572.
74
44. Lawton, E., N. Fox, and R. Handy. Short Aggregate Piers Defeat Poor Soils. Civil
Engineering, Vol. 64, No. 12, 1994, pp. 52-55.
45. Wissmann, K., and N. Fox. Design and Analysis of Short Aggregate Piers Used To Reinforce Soil for Foundation Support. Proceedings, Geotechnical Colloquium, Technical University Darmstadt, Germany, Vol. 1, No. 1, 2000, pp. 1-10.
46. Wissmann, K., N. Fox, and J. Martin. Rammed Aggregate Piers Defeat 75-Foot Long Driven
Piles. Geotechnical Special Publication, Vol. 94, 2000, pp. 198-210.
47. White, D., K. Wissmann, and E. Lawton. Geopier Soil Reinforcement for Transportation Applications. Geotechnical News, Vol. 19, No. 4, 2001, pp. 63-68.
48. Wissmann, K., K. Moser, and M. Pando. Mitigating Settlement Risks in Residual Piedmont
Soils With Rammed Aggregate Pier Elements. Proceedings, ASCE Specialty Conference, Blacksburg, VA, June 2001, pp. 1-15.
49. Carle, R., and S. Whitaker. Sheet Piling Bridge Abutments. Deep Foundations Institute
Annual Meeting, Baltimore, Maryland, Oct. 1989, pp. 1-16.
50. Sassel, R. Fast Track Construction With Less Traffic Disruption. Structural Engineer Magazine, Oct. 2000, pp. 1-2.
51. Bustamante, M., and L. Gianeselli. Predicting the Bearing Capacity of Sheet Piles Under
Vertical Load. Proceedings of the 4th International Conference on Piling and Deep Foundations, Stresa Italy, April 1991, pp. 1-8.
52. Nottingham, D., D. Thieman, and K. Braun. Design, Construction, and Performance of Open
Cell Sheet Pile Bridge Abutments. Proceedings of the Eleventh International Conference on Cold Regions Engineering: Impacts on Transportation and Infrastructure, 2000, pp. 437-447.

75
APPENDIX A
TR-486 SURVEY


77
Iowa Department of Transportation Highway Division
Research Project TR-486
“Development of Abutment Design Standards for Local Bridge Designs”
Questionnaire completed by: ___________________________________ Organization: ________________________________________________ Address: ___________________________________________________ ___________________________________________________ ___________________________________________________ E-mail address: _____________________________________________ Responses can either be E-mailed or faxed to F. W. Klaiber (E-mail address: [email protected]; Fax number: 515-294-7424). If you have some abutment designs, pictures, etc. that you are willing to share, please mail them to: Prof. F. Wayne Klaiber, P.E. 422 Town Engr. Bldg. CCEE Dept. Iowa State University Ames, Iowa 50011
Section 1
Q-1) Does your county have standard bridge abutment designs that are used on low-volume road bridges or off-system bridges. Yes _______ No _______ If you answered no to Q-1, please skip the remaining questions (Q-2 – Q-6) in this section and complete the questions in Section 2. Q-2) Would you please send us a copy of your standard abutment design(s). Yes _______ No _______

78 Q-3) In what situations (conditions) are your standard abutment designs not applicable? __________________________________________________________ __________________________________________________________ __________________________________________________________ __________________________________________________________ Q-4) What is the maximum superstructure span length used with your abutment standards? LMAX = ______________ Q-5) What type of construction equipment, special tools, etc. are required to install your standard abutments? Please indicate after each item if you own the equipment (O) or rent the equipment (R). ___________________________________________________________ ___________________________________________________________ ___________________________________________________________ ___________________________________________________________ Q-6) Approximately how long does it take to install one of your standard abutments? ________ hours. Approximately how many workers are required to construct a standard abutment? _______________. If you prefer, you can respond to Q-6 in man hours.
Section 2 Q-7) Do you know of other counties, cities, or other agencies that have standard abutment designs for low volume road bridges or off system bridges? If yes, please identify. ___________________________________________________________ ___________________________________________________________ ___________________________________________________________

79 Q-8) Do you have a bridge construction crew that you routinely use to build small bridges or do you typically hire a contractor? ___________________________________________________________ ___________________________________________________________ ___________________________________________________________ ___________________________________________________________ Q-9) Do you do a site investigation before installing substructures? Yes _______ No _______ Q-10) If you do site investigations, what type (and number) of soil tests are completed? ___________________________________________________________ ___________________________________________________________ ___________________________________________________________ ___________________________________________________________ Q-11) What types and how many foundation elements do you typically use in an abutment? How deep are they installed? ___________________________________________________________ ___________________________________________________________ ___________________________________________________________ Comments? ___________________________________________________________ ___________________________________________________________ ___________________________________________________________ ___________________________________________________________


81
APPENDIX B
TR-486 SURVEY SUMMARY

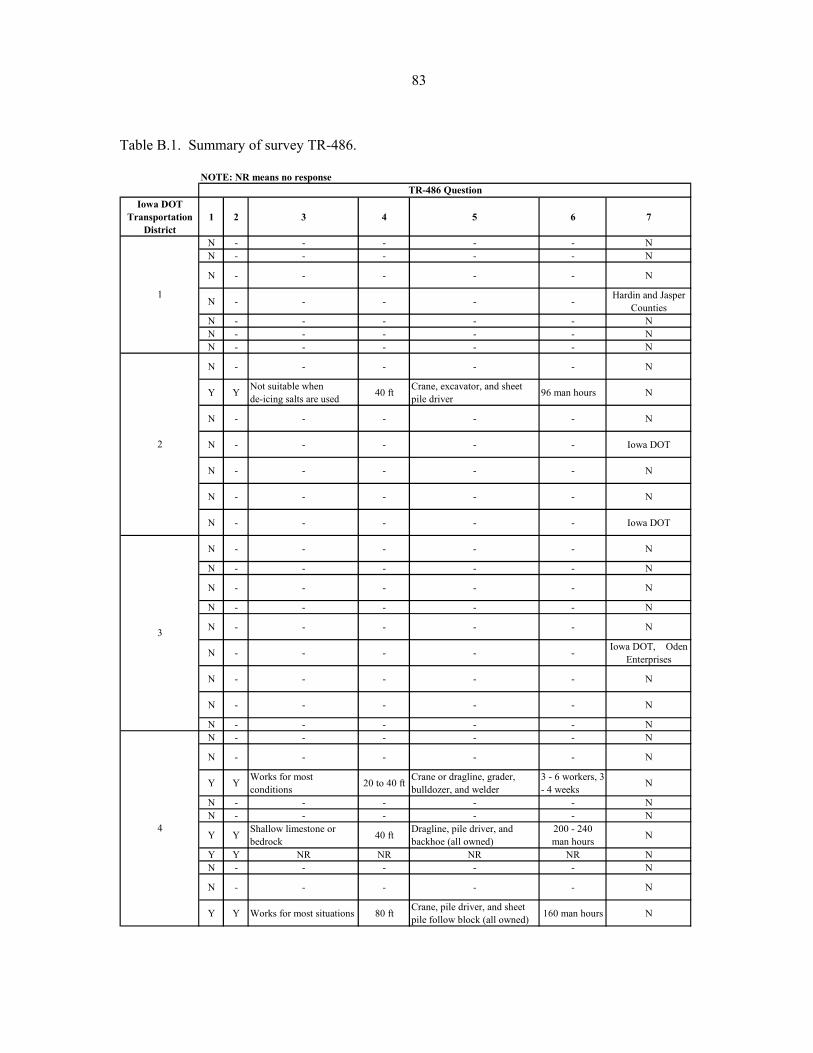
83
Table B.1. Summary of survey TR-486.
NOTE: NR means no response
Iowa DOT Transportation
District1 2 3 4 5 6 7
N - - - - - NN - - - - - N
N - - - - - N
N - - - - - Hardin and Jasper Counties
N - - - - - NN - - - - - NN - - - - - N
N - - - - - N
Y Y Not suitable when de-icing salts are used 40 ft Crane, excavator, and sheet
pile driver 96 man hours N
N - - - - - N
N - - - - - Iowa DOT
N - - - - - N
N - - - - - N
N - - - - - Iowa DOT
N - - - - - N
N - - - - - N
N - - - - - N
N - - - - - N
N - - - - - N
N - - - - - Iowa DOT, Oden Enterprises
N - - - - - N
N - - - - - N
N - - - - - NN - - - - - N
N - - - - - N
Y Y Works for most conditions 20 to 40 ft Crane or dragline, grader,
bulldozer, and welder3 - 6 workers, 3 - 4 weeks N
N - - - - - NN - - - - - N
Y Y Shallow limestone or bedrock 40 ft Dragline, pile driver, and
backhoe (all owned)200 - 240 man hours N
Y Y NR NR NR NR NN - - - - - N
N - - - - - N
Y Y Works for most situations 80 ft Crane, pile driver, and sheet pile follow block (all owned) 160 man hours N
1
2
TR-486 Question
3
4
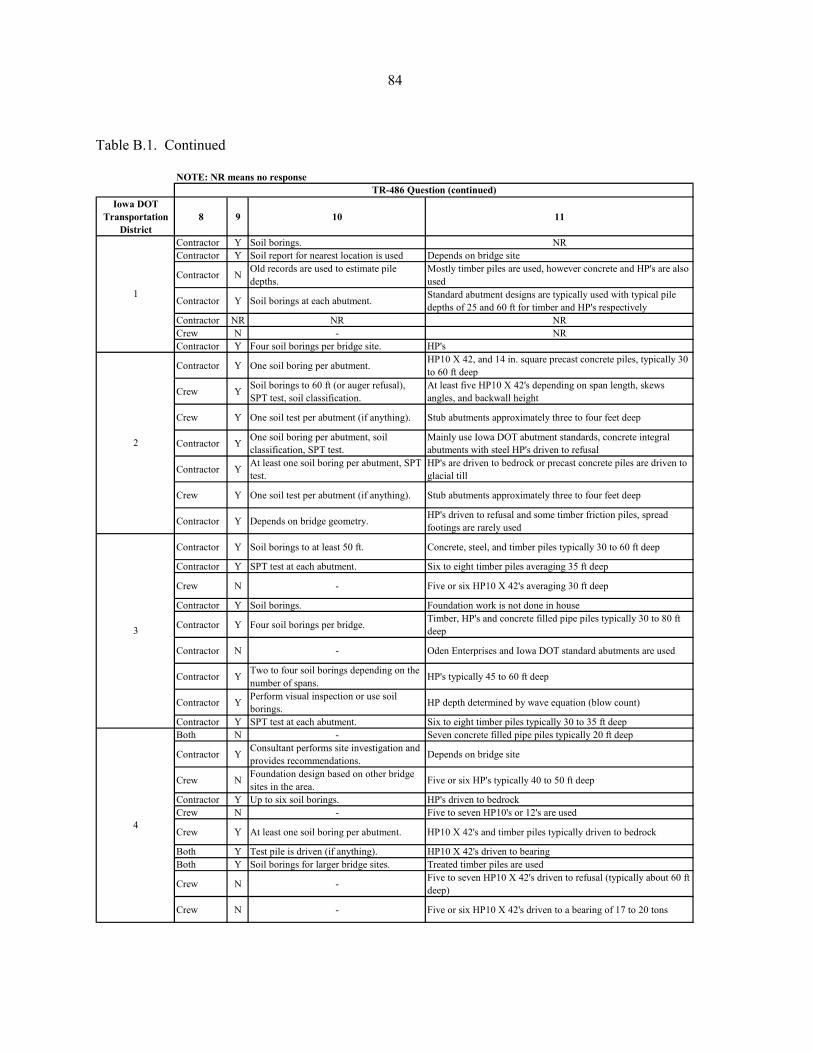
84
Table B.1. Continued
NOTE: NR means no response
Iowa DOT Transportation
District8 9 10 11
Contractor Y Soil borings. NRContractor Y Soil report for nearest location is used Depends on bridge site
Contractor N Old records are used to estimate pile depths.
Mostly timber piles are used, however concrete and HP's are also used
Contractor Y Soil borings at each abutment. Standard abutment designs are typically used with typical pile depths of 25 and 60 ft for timber and HP's respectively
Contractor NR NR NRCrew N - NRContractor Y Four soil borings per bridge site. HP's
Contractor Y One soil boring per abutment. HP10 X 42, and 14 in. square precast concrete piles, typically 30 to 60 ft deep
Crew Y Soil borings to 60 ft (or auger refusal), SPT test, soil classification.
At least five HP10 X 42's depending on span length, skews angles, and backwall height
Crew Y One soil test per abutment (if anything). Stub abutments approximately three to four feet deep
Contractor Y One soil boring per abutment, soil classification, SPT test.
Mainly use Iowa DOT abutment standards, concrete integral abutments with steel HP's driven to refusal
Contractor Y At least one soil boring per abutment, SPT test.
HP's are driven to bedrock or precast concrete piles are driven to glacial till
Crew Y One soil test per abutment (if anything). Stub abutments approximately three to four feet deep
Contractor Y Depends on bridge geometry. HP's driven to refusal and some timber friction piles, spread footings are rarely used
Contractor Y Soil borings to at least 50 ft. Concrete, steel, and timber piles typically 30 to 60 ft deep
Contractor Y SPT test at each abutment. Six to eight timber piles averaging 35 ft deep
Crew N - Five or six HP10 X 42's averaging 30 ft deep
Contractor Y Soil borings. Foundation work is not done in house
Contractor Y Four soil borings per bridge. Timber, HP's and concrete filled pipe piles typically 30 to 80 ft deep
Contractor N - Oden Enterprises and Iowa DOT standard abutments are used
Contractor Y Two to four soil borings depending on the number of spans. HP's typically 45 to 60 ft deep
Contractor Y Perform visual inspection or use soil borings. HP depth determined by wave equation (blow count)
Contractor Y SPT test at each abutment. Six to eight timber piles typically 30 to 35 ft deepBoth N - Seven concrete filled pipe piles typically 20 ft deep
Contractor Y Consultant performs site investigation and provides recommendations. Depends on bridge site
Crew N Foundation design based on other bridge sites in the area. Five or six HP's typically 40 to 50 ft deep
Contractor Y Up to six soil borings. HP's driven to bedrockCrew N - Five to seven HP10's or 12's are used
Crew Y At least one soil boring per abutment. HP10 X 42's and timber piles typically driven to bedrock
Both Y Test pile is driven (if anything). HP10 X 42's driven to bearingBoth Y Soil borings for larger bridge sites. Treated timber piles are used
Crew N - Five to seven HP10 X 42's driven to refusal (typically about 60 ft deep)
Crew N - Five or six HP10 X 42's driven to a bearing of 17 to 20 tons
TR-486 Question (continued)
1
2
3
4
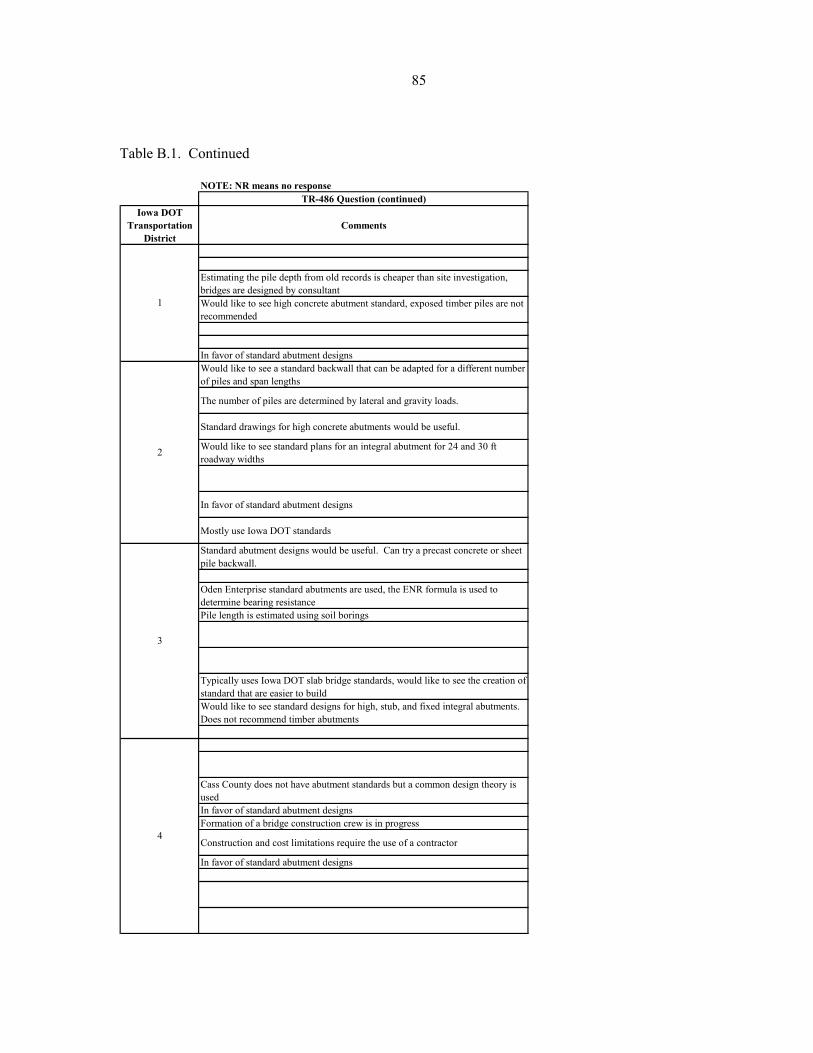
85
Table B.1. Continued
NOTE: NR means no responseTR-486 Question (continued)
Iowa DOT Transportation
DistrictComments
Estimating the pile depth from old records is cheaper than site investigation, bridges are designed by consultantWould like to see high concrete abutment standard, exposed timber piles are not recommended
In favor of standard abutment designsWould like to see a standard backwall that can be adapted for a different number of piles and span lengths
The number of piles are determined by lateral and gravity loads.
Standard drawings for high concrete abutments would be useful.
Would like to see standard plans for an integral abutment for 24 and 30 ft roadway widths
In favor of standard abutment designs
Mostly use Iowa DOT standards
Standard abutment designs would be useful. Can try a precast concrete or sheet pile backwall.
Oden Enterprise standard abutments are used, the ENR formula is used to determine bearing resistancePile length is estimated using soil borings
Typically uses Iowa DOT slab bridge standards, would like to see the creation of standard that are easier to buildWould like to see standard designs for high, stub, and fixed integral abutments. Does not recommend timber abutments
Cass County does not have abutment standards but a common design theory is usedIn favor of standard abutment designsFormation of a bridge construction crew is in progress
Construction and cost limitations require the use of a contractor
In favor of standard abutment designs
1
2
3
4
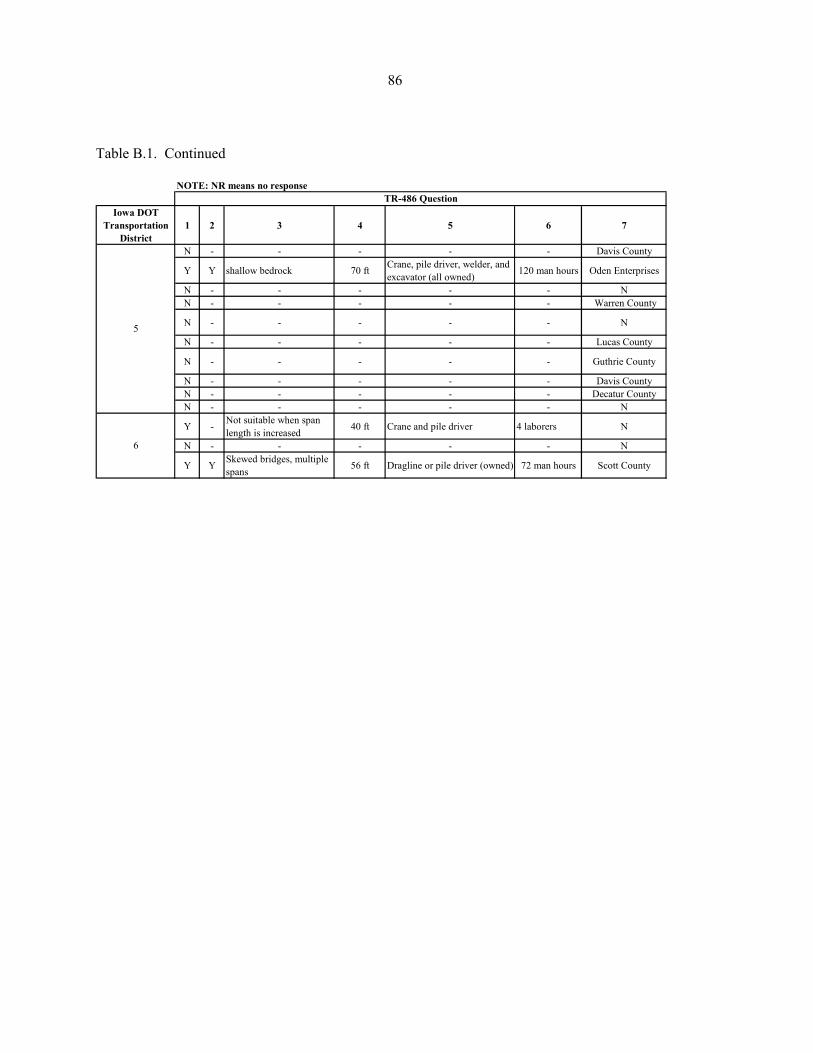
86
Table B.1. Continued
NOTE: NR means no response
Iowa DOT Transportation
District1 2 3 4 5 6 7
N - - - - - Davis County
Y Y shallow bedrock 70 ft Crane, pile driver, welder, and excavator (all owned) 120 man hours Oden Enterprises
N - - - - - NN - - - - - Warren County
N - - - - - N
N - - - - - Lucas County
N - - - - - Guthrie County
N - - - - - Davis CountyN - - - - - Decatur CountyN - - - - - N
Y - Not suitable when span length is increased 40 ft Crane and pile driver 4 laborers N
N - - - - - N
Y Y Skewed bridges, multiple spans 56 ft Dragline or pile driver (owned) 72 man hours Scott County
5
6
TR-486 Question
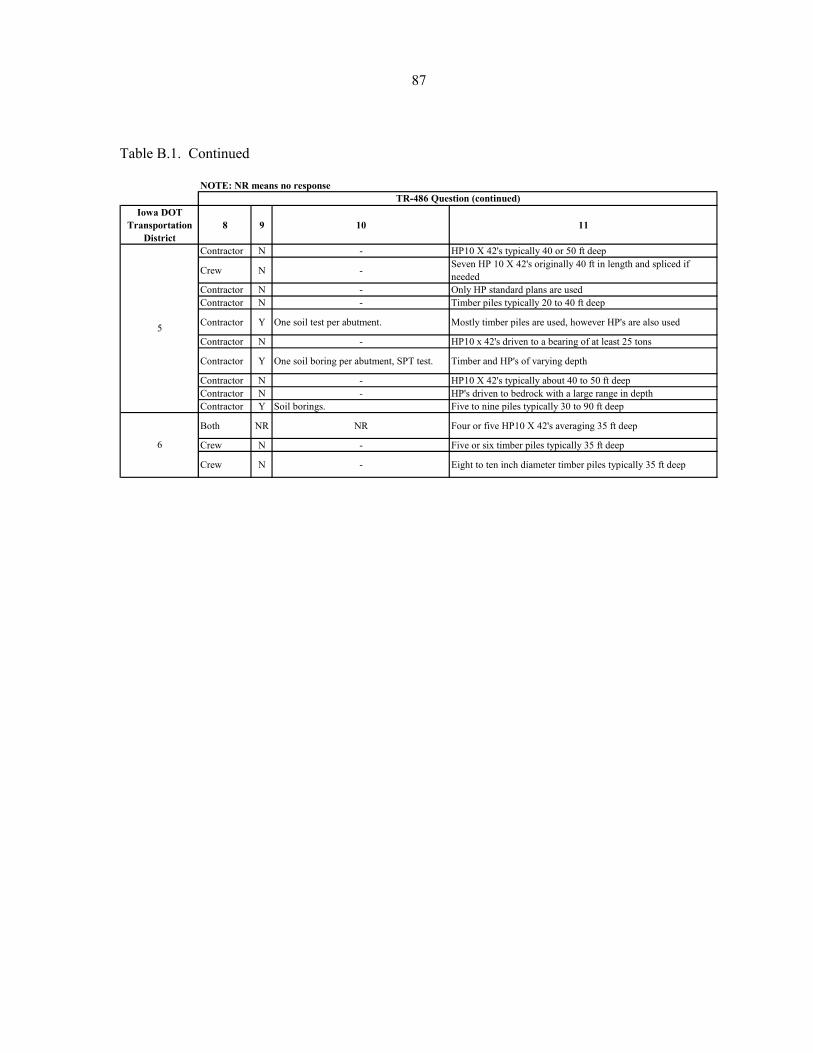
87
Table B.1. Continued
NOTE: NR means no response
Iowa DOT Transportation
District8 9 10 11
Contractor N - HP10 X 42's typically 40 or 50 ft deep
Crew N - Seven HP 10 X 42's originally 40 ft in length and spliced if needed
Contractor N - Only HP standard plans are usedContractor N - Timber piles typically 20 to 40 ft deep
Contractor Y One soil test per abutment. Mostly timber piles are used, however HP's are also used
Contractor N - HP10 x 42's driven to a bearing of at least 25 tons
Contractor Y One soil boring per abutment, SPT test. Timber and HP's of varying depth
Contractor N - HP10 X 42's typically about 40 to 50 ft deepContractor N - HP's driven to bedrock with a large range in depthContractor Y Soil borings. Five to nine piles typically 30 to 90 ft deep
Both NR NR Four or five HP10 X 42's averaging 35 ft deep
Crew N - Five or six timber piles typically 35 ft deep
Crew N - Eight to ten inch diameter timber piles typically 35 ft deep
TR-486 Question (continued)
5
6
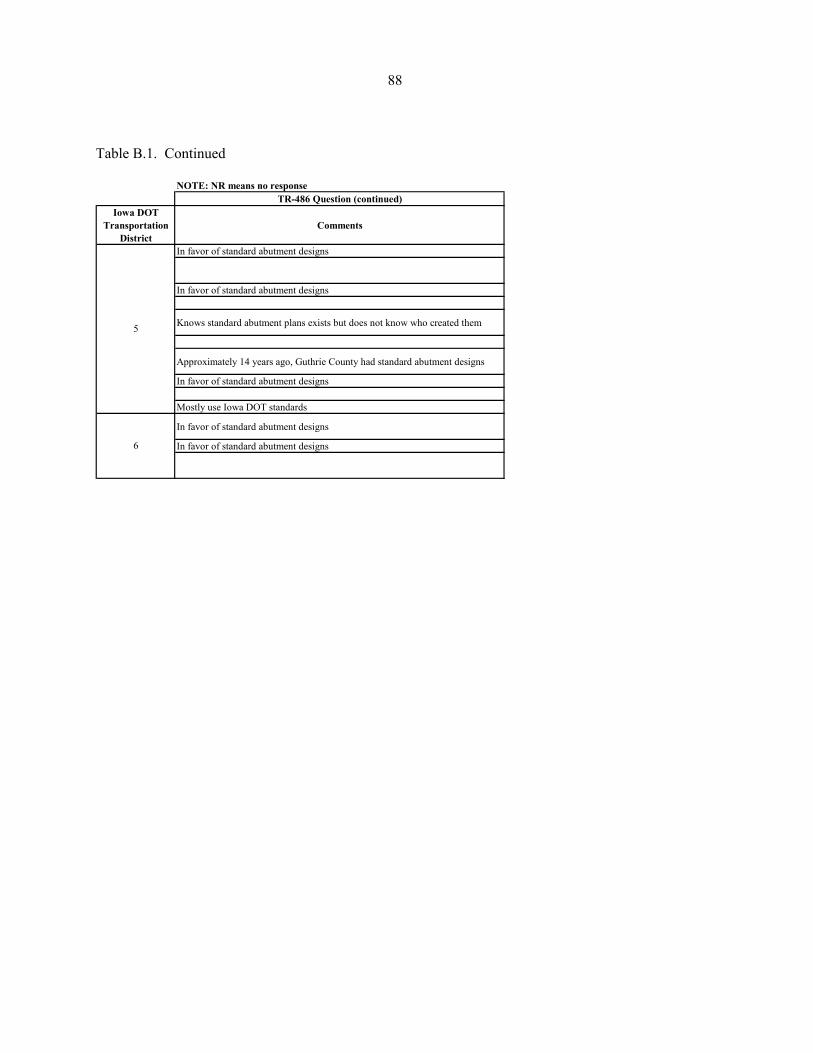
88
Table B.1. Continued
NOTE: NR means no responseTR-486 Question (continued)
Iowa DOT Transportation
DistrictComments
In favor of standard abutment designs
In favor of standard abutment designs
Knows standard abutment plans exists but does not know who created them
Approximately 14 years ago, Guthrie County had standard abutment designs
In favor of standard abutment designs
Mostly use Iowa DOT standards
In favor of standard abutment designs
In favor of standard abutment designs
5
6