
Development of a Thermodynamically Consistent Volume ...
116
Development of a Thermodynamically Consistent Volume Translation Method in Peng- Robinson Equation of State By Jialin Shi A Thesis Submitted in Partial Fulfillment of the Requirements for the Degree of Master of Science in Petroleum Engineering Department of Civil and Environmental Engineering University of Alberta © Jialin Shi, 2017
Transcript of Development of a Thermodynamically Consistent Volume ...

Development of a Thermodynamically Consistent Volume Translation Method in Peng-
Robinson Equation of State
By
Jialin Shi
A Thesis Submitted in Partial Fulfillment of the Requirements for the Degree of
Master of Science
in
Petroleum Engineering
Department of Civil and Environmental Engineering
University of Alberta
© Jialin Shi, 2017

ii
ABSTRACT
Cubic equations of state (CEOS) are frequently used to predict the phase behavior and
volumetric properties of pure compounds and mixtures encountered in the field of chemical and
petroleum engineering. Volume translation is proposed to further improve the accuracy of
density predictions by CEOS. Previous research shows that a temperature-dependent volume-
translated EOS could result in crossing of pressure-volume isotherms for a pure compound,
which leads to an anomalous behavior that the predicted molar volume for a pure component can
be lower at a higher temperature at an isobaric condition. Such crossover phenomenon fails to
consistently predict the thermodynamic properties of a pure compound, thus restricting the wide
applications of the temperature-dependent volume translated EOS.
Aiming at addressing the above thermodynamic inconsistency in some volume-translated EOSs,
a criterion is proposed to judge whether a volume-translated EOS will result in crossover issues,
and if so, the extent of the temperature and pressure range over which the crossover phenomenon
occurs. The criterion is developed based on a fundamental fact that the isobaric expansivity for a
pure gas or liquid is positive. The recently proposed volume translations are evaluated on the
basis of the developed criterion. For the various types of temperature-dependent volume
translations, we obtain the specific temperature/pressure conditions over which there is certainly
no crossover phenomenon. It can be concluded that there is thermodynamic inconsistency at a
lower pressure for most nonlinear temperature-dependent volume translations, but no any
crossover issues exist for the constant volume translations and linear temperature-dependent
volume translations with a negative coefficient of temperature.
Next, a generalized temperature-dependent volume translation model is developed for the more
accurate prediction of the liquid densities of pure components. On the basis of the criterion on
iii
thermodynamic consistency we have proposed, a mathematical constraint is introduced into the
proposed model. The model parameters are determined based on the regression of the density
data collected for16 pure compounds. The new volume-translated PR EOS can improve the
liquid density prediction with an overall absolute average percentage deviation of 1.42%.
Notably, the new volume translation model does not lead to the crossing of pressure-volume
isotherms over a wide range of pressure and temperature (up to 100 MPa and 1000 K).

iv
ACKNOWLEDGMENTS
I would like to express my sincere gratitude to my supervisor, Dr. Huazhou Andy Li, for his
supervision and support during my master program at the University of Alberta. He equipped me
with brilliant ideas, critical thinking skills and professional skills that are helpful for my future
academic endeavours. With Dr. Li’s guidance and supervision, I also learn how to improve
myself-management skills and how to prepare myself to become a good researcher. In addition, I
want to thank my examination committee members, Dr. Zhehui Jin and Dr. Yuntong She for
their critical and valuable comments.
I am grateful for the support from my family during my study at the University of Alberta.
Thanks for the constant love and support from my Mom (Ju Zhang), Dad (Jianbing Shi), my
girlfriend (Wanying Pang) and other family members.
I would also like to thank all my many friends in Edmonton; their friendship is invaluable to me.
In addition, I always have the pleasure of working with the past and present group members
(Lanxiao Hu, Bailu Teng, Yueliang Liu, Wanying Pang, Dashun Wang, Hanru Yu, Mian Qin,
Gongjue Wei, Hao Sun, Sean Perkins, Chen Wang, Chao Wang, Jianyi Gao, Ruixue Li, Siyuan
Yi, Chang Lu and Qianhui Zhao) in Dr. Li’s research group. Thanks for their friendship and
support!
Finally, I also greatly acknowledge the financial support provided by one Discovery Grant from
the Natural Sciences and Engineering Research Council (NSERC) to Dr. Huazhou Andy Li
(NSERC RGPIN 05394).

v
DEDICATION
This dissertation is dedicated to my dearest parents, Mrs. Ju Zhang and Mr. Jianbing Shi and to
the memory of my friend, Chocho.

vi
TABLE OF CONTENTS
ABSTRACT ................................................................................................................................... ii
ACKNOWLEDGMENTS ........................................................................................................... iv
DEDICATION............................................................................................................................... v
LIST OF FIGURES ...................................................................................................................... x
CHAPTER 1 INTRODUCTION ........................................................................................... 1
1.1. Research Background ........................................................................................................... 1
1.2. Overview of CEOS............................................................................................................... 1
1.2.1. van der Waals EOS ........................................................................................................ 1
1.2.2. Redlich-Kwong EOS ..................................................................................................... 3
1.2.3. Soave-Redlich-Kwong EOS .......................................................................................... 4
1.2.4. Peng-Robinson EOS ...................................................................................................... 5
1.2.5. Volume Translation Concept ......................................................................................... 6
1.3. Problem Statement ............................................................................................................... 6
1.4. Objectives ............................................................................................................................. 7
1.5. Thesis Structure .................................................................................................................... 7
CHAPTER 2 CRITERION FOR DETERMINING CROSSOVER PHENOMENON IN
VOLUME-TRANSLATED EQUATION OF STATES .......................................................... 10
2.1. Introduction ........................................................................................................................ 12
2.2. Motivation .......................................................................................................................... 15

vii
2.3. Mathematical Formulation ................................................................................................. 17
2.4. Results and Discussion ....................................................................................................... 21
2.4.1. Linear Temperature-Dependent Volume Translations ................................................ 21
2.4.2. Exponential-Type Temperature-Dependent Volume Translations .............................. 23
2.4.3. Temperature-Dependent Volume Translations Based on Distance Function ............. 24
2.5. Conclusions ........................................................................................................................ 26
CHAPTER 3 A GENERALIZED VOLUME TRANSLATION CORRELATION WITH
THERMODYNAMIC CONSISTENCY FOR MORE ACCURATE LIQUID-DENSITY
PREDICTION FOR PURE COMPONENTS .......................................................................... 50
3.1. Introduction ........................................................................................................................ 52
3.2. Concept of the Volume Translated EOS ............................................................................ 55
3.3. Development of Thermodynamically Consistent Volume Translation Model .................. 56
3.3.1. Choice of Alpha Function............................................................................................ 56
3.3.2. Development of a Consistent Volume Translation Model .............................................. 58
3.4. Results and Discussion ....................................................................................................... 61
3.4.1. Determination of Model Parameters ............................................................................ 61
3.4.2. Modeling Results for Pure Components ...................................................................... 63
3.5. Conclusions ........................................................................................................................ 64
CHAPTER 4 CONCLUSIONS AND RECOMMENDATIONS ............................................ 97
4.1. Conclusions ........................................................................................................................ 97

viii
4.2. Recommendations .............................................................................................................. 98
BIBLIOGRAPHY ....................................................................................................................... 99
ix
LIST OF TABLES
Table 2.1 Constants of the PR EOS and SRK EOS in Eq. (1) ...................................................... 31
Table 2.2 Physical Properties of Pure Fluids Used in This Study ................................................ 31
Table 2.3 Range of Reduced Temperature over Which Crossover Occurs at Different Isobaric
Pressures for CH4 .......................................................................................................................... 31
Table 2.4 Range of Reduced Temperature over Which Crossover Occurs at Different Isobaric
Pressures for CO2 .......................................................................................................................... 32
Table 2.5 Range of Reduced Temperature over Which Crossover Occurs at Different Isobaric
Pressures for n-C5H12 .................................................................................................................... 32
Table 2.6 Range of Reduced Temperature over Which Crossover Occurs at Different Isobaric
Pressures for n-C10H22................................................................................................................... 33
Table 3.1 Physical Properties of Pure Fluids Used in This Study ................................................ 69
Table 3.2 Optimized Values of the Volume Translation Parameters A, B and C in Eq. (10) ....... 70
Table 3.3 Values of the Parameters Shown in Eq. (15) ................................................................ 71
Table 3.4 Average Absolute Percentage Deviations (%AAD) in Liquid Density Predictions
Provided by the New Volume Translation Model and Other Volume Translation Models ......... 72

x
LIST OF FIGURES
Fig.2.1 PV diagram for CH4 calculated by SRK EOS .................................................................. 34
Fig.2.2 PV diagram for CH4 calculated by SRK EOS with the temperature-dependent volume
translation proposed by Ji and Lempe .......................................................................................... 35
Fig.2.3 Schematic showing the nature of crossover of two neighboring isotherms ..................... 36
Fig.2.4 Relationship between the first derivative of corrected molar volume with respect to
temperature (D) and reduced temperature (Tr) for the volume translation proposed by De
Sant’Ana et al. [10] for CH4 at different constant pressures of: (a) 2Pc; (b) 5Pc; (c) 10Pc; and (d)
100Pc ............................................................................................................................................. 37
Fig.2.5 Relationship between the first derivative of corrected molar volume with respect to
temperature (D) and reduced temperature (Tr) for the volume translation proposed by Magoulas
and Tassios [9] for CH4 at different constant pressures of: (a) 2Pc; (b) 5Pc; (c) 10Pc; and (d)
100Pc ............................................................................................................................................. 38
Fig.2.6 Relationship between the first derivative of corrected molar volume with respect to
temperature (D) and reduced temperature (Tr) for the volume translation proposed by Chou and
Prausnitz [7] for CH4 at different constant pressures of: (a) 2Pc; (b) 5Pc; (c) 10Pc; and (d) 100Pc
....................................................................................................................................................... 39
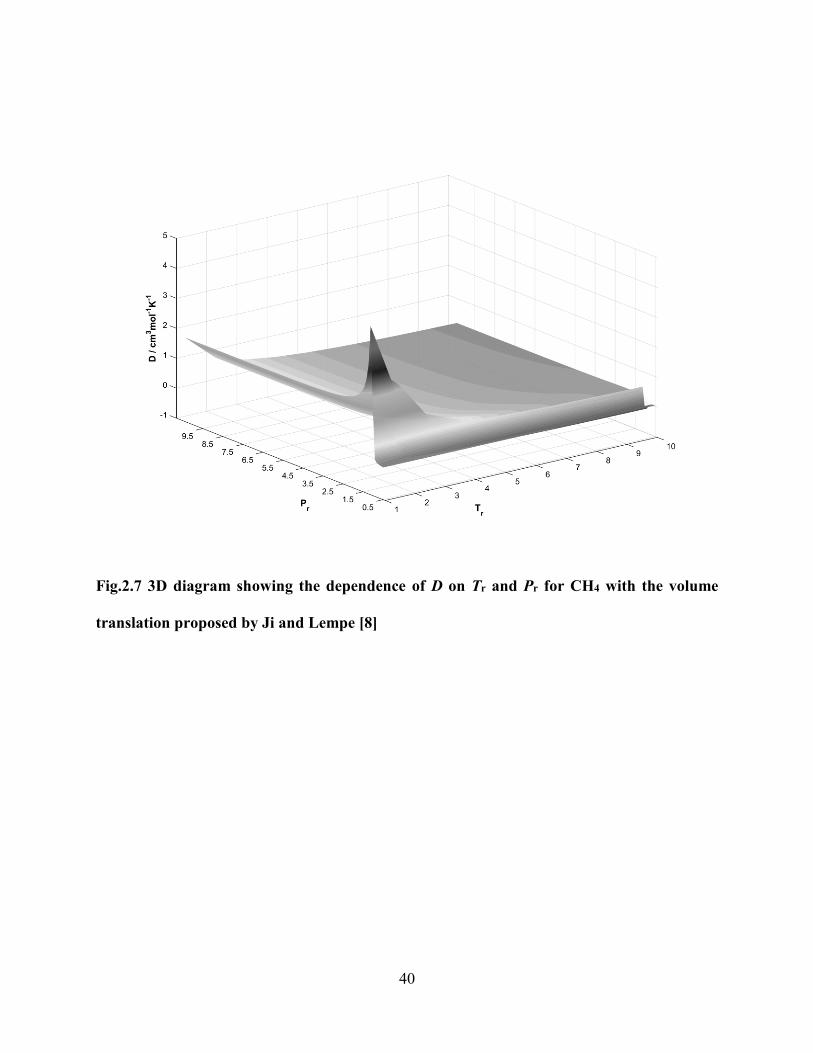
Fig.2.7 3D diagram showing the dependence of D on Tr and Pr for CH4 with the volume
translation proposed by Ji and Lempe [8] ..................................................................................... 40
Fig.2.8 Relationship between the first derivative of corrected molar volume with respect to
temperature (D) and reduced temperature (Tr) for the volume translation proposed by Ji and
Lempe [8] for CH4 at different constant pressures of: (a) 2Pc; (b) 5Pc; (c) 10Pc; and (d) 100Pc . 41

xi
Fig.3.1 The needed volume shift in PR EOS for methane at P=3.5 MPa ..................................... 73
Fig.3.2 The needed volume shift by PR EOS for methane at P=5 MPa ....................................... 74
Fig.3.3 A sketch illustrating the impact of a constant or temperature-dependent volume
translation on the calculated pressure/volume isotherms .............................................................. 75
Fig.3.4 The relationship between the soave alpha function [2] and reduced temperature............ 76
Fig.3.5 The relationship between the value of D1 and reduced temperature at three different
constant pressures (5 MPa, 10 MPa and 20 MPa) ........................................................................ 77
Fig.3.6 Plots of model parameters A, B and C in Eq. (10) vs. the acentric factor ........................ 78
Fig.3.7 Comparison between the needed volume shift (black dots) for n-butane (P=0.5 Pc, 0.6 Pc,
0.7 Pc, 0.8 Pc, 0.9 Pc, 1 Pc, 1.5 Pc and 2 Pc) and those calculated by the other four different
volume translation models ............................................................................................................ 79
Fig.3.8 Comparison between the needed volume shift (black dots) for benzene (P=0.5 Pc, 0.6 Pc,
0.7 Pc, 0.8 Pc, 0.9 Pc, 1 Pc, 1.5 Pc and 2 Pc) and those calculated by the other four different
volume translation models ............................................................................................................ 80
Fig.3.9 Comparison of the measured saturated molar volumes [31] for n-butane and calculated
ones with different models ............................................................................................................ 81
Fig.3.10 Comparison of the measured saturated molar volumes [31] for benzene and calculated
ones with different models ............................................................................................................ 82
Fig.3.11 Comparison between the needed volume shift (black dots) for methane (P=0.5 Pc, 0.6
Pc, 0.7 Pc, 0.8 Pc, 0.9 Pc, 1 Pc, 1.5 Pc and 2 Pc) and those calculated by the other four different
volume translation models ............................................................................................................ 83
xii
Fig.3.12 Comparison between the needed volume shift (black dots) for ethane (P=0.5 Pc, 0.6 Pc,
0.7 Pc, 0.8 Pc, 0.9 Pc, 1 Pc, 1.5 Pc and 2 Pc) and those calculated by the other four different
volume translation models ............................................................................................................ 84
Fig.3.13 Comparison between the needed volume shift (black dots) for ethylene (P=0.5 Pc, 0.6
Pc, 0.7 Pc, 0.8 Pc, 0.9 Pc, 1 Pc, 1.5 Pc and 2 Pc) and those calculated by the other four different
volume translation models ............................................................................................................ 85
Fig.3.14 Comparison between the needed volume shift (black dots) for propane (P=0.5 Pc, 0.6 Pc,
0.7 Pc, 0.8 Pc, 0.9 Pc, 1 Pc, 1.5 Pc and 2 Pc) and those calculated by the other four different
volume translation models ............................................................................................................ 86
Fig.3.15 Comparison between the needed volume shift (black dots) for n-pentane (P=0.5 Pc, 0.6
Pc, 0.7 Pc, 0.8 Pc, 0.9 Pc, 1 Pc, 1.5 Pc and 2 Pc) and those calculated by the other four different
volume translation models ............................................................................................................ 87
Fig.3.16 Comparison between the needed volume shift (black dots) for n-hexane (P=0.5 Pc, 0.6
Pc, 0.7 Pc, 0.8 Pc, 0.9 Pc, 1 Pc, 1.5 Pc and 2 Pc) and those calculated by the other four different
volume translation models ............................................................................................................ 88
Fig.3.17 Comparison between the needed volume shift (black dots) for n-heptane (P=0.5 Pc, 0.6
Pc, 0.7 Pc, 0.8 Pc, 0.9 Pc, 1 Pc, 1.5 Pc and 2 Pc) and those calculated by the other four different
volume translation models ............................................................................................................ 89
Fig.3.18 Comparison between the needed volume shift (black dots) for toluene (P=0.5 Pc, 0.6 Pc,
0.7 Pc, 0.8 Pc, 0.9 Pc, 1 Pc, 1.5 Pc and 2 Pc) and those calculated by the other four different
volume translation models ............................................................................................................ 90

xiii
Fig.3.19 Comparison between the needed volume shift (black dots) for n-octane (P=0.5 Pc, 0.6
Pc, 0.7 Pc, 0.8 Pc, 0.9 Pc, 1 Pc, 1.5 Pc and 2 Pc) and those calculated by the other four different
volume translation models ............................................................................................................ 91
Fig.3.20 Comparison between the needed volume shift (black dots) for n-nonane (P=0.5 Pc, 0.6
Pc, 0.7 Pc, 0.8 Pc, 0.9 Pc, 1 Pc, 1.5 Pc and 2 Pc) and those calculated by the other four different
volume translation models ............................................................................................................ 92
Fig.3.21 Comparison between the needed volume shift (black dots) for n-decane (P=0.5 Pc, 0.6
Pc, 0.7 Pc, 0.8 Pc, 0.9 Pc, 1 Pc, 1.5 Pc and 2 Pc) and those calculated by the other four different
volume translation models ............................................................................................................ 93
Fig.3.22 Comparison between the needed volume shift (black dots) for n-dodecane (P=0.5 Pc,
0.6 Pc, 0.7 Pc, 0.8 Pc, 0.9 Pc, 1 Pc, 1.5 Pc and 2 Pc) and those calculated by the other four
different volume translation models ............................................................................................. 94
Fig.3.23 Comparison between the needed volume shift (black dots) for carbon dioxide (P=0.5 Pc,
0.6 Pc, 0.7 Pc, 0.8 Pc, 0.9 Pc, 1 Pc, 1.5 Pc and 2 Pc) and those calculated by the other four
different volume translation models ............................................................................................. 95
Fig.3.24 Comparison between the needed volume shift (black dots) for oxygen (P=0.5 Pc, 0.6 Pc,
0.7 Pc, 0.8 Pc, 0.9 Pc, 1 Pc, 1.5 Pc and 2 Pc) and those calculated by the other four different
volume translation models ............................................................................................................ 96

1
CHAPTER 1 INTRODUCTION
1.1. Research Background
The relationship between the pressure, molar volume, and temperature (PVT) for pure fluids or
mixtures is one of the most fundamental and significant aspects in the modeling of fluid phase
behavior. A theoretical model is necessary to simulate the relationship of PVT for the real fluids
in the chemical and petroleum engineering. For example, during CO2 injection for enhanced oil
recovery, reliable predictions of phase equilibria and volumetric properties of CO2/oil mixtures
are a prerequisite for achieving accurate compositional modeling of such a complicated process.
Since the publication of van der Waals equation [1] in 1873, cubic equations of state (CEOS)
have been widely applied to model the compositional and volumetric phase behavior because of
their simplicity and reliability. Thereafter,variousmodifications have been proposed to enhance
the predictive capability of CEOS [2-4]. However, larger errors still exist for the two-parameter
CEOSs because of the inaccurate representation of the critical compressibility factors for pure
compounds.
1.2. Overview of CEOS
1.2.1. van der Waals EOS
Pressure, volume, and temperature determine the behavior of gas. The ideal gas law was first
proposed by Émile Clapeyron [5 and 6]. The ideal gas law is given by,
RTP
V (1)
2
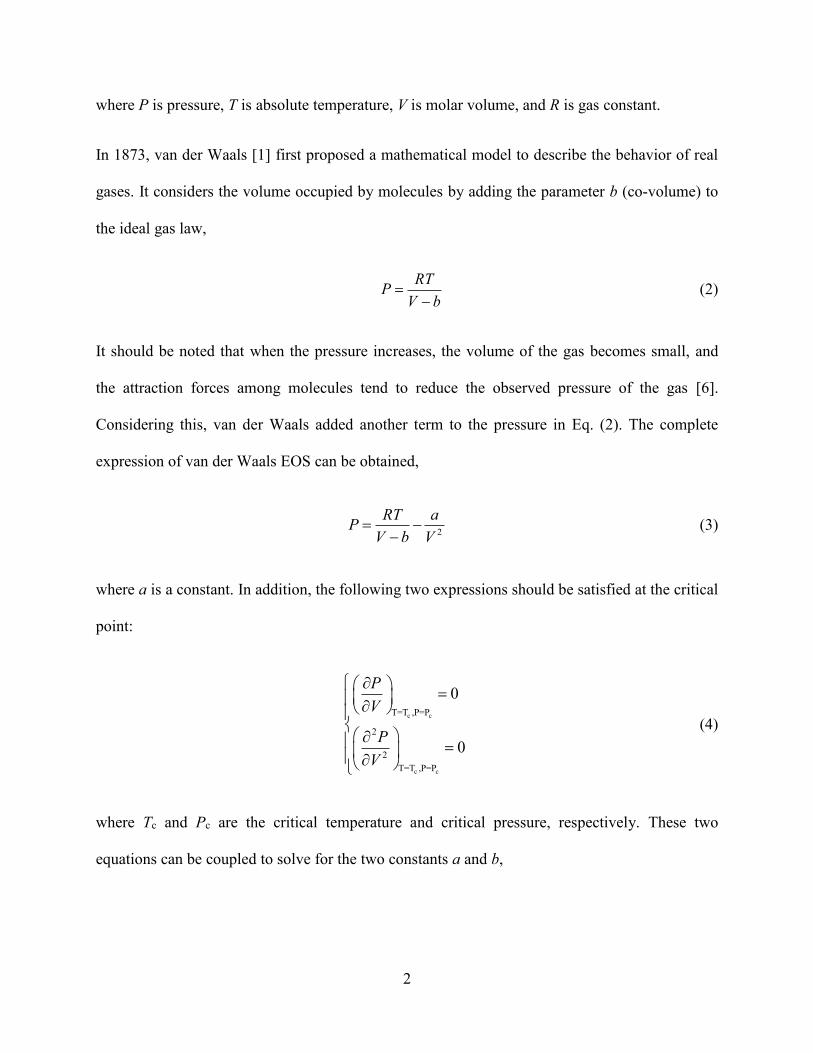
where P is pressure, T is absolute temperature, V is molar volume, and R is gas constant.
In 1873, van der Waals [1] first proposed a mathematical model to describe the behavior of real
gases. It considers the volume occupied by molecules by adding the parameter b (co-volume) to
the ideal gas law,
RTP
V b
(2)
It should be noted that when the pressure increases, the volume of the gas becomes small, and
the attraction forces among molecules tend to reduce the observed pressure of the gas [6].
Considering this, van der Waals added another term to the pressure in Eq. (2). The complete
expression of van der Waals EOS can be obtained,
2
RT aP
V b V
(3)
where a is a constant. In addition, the following two expressions should be satisfied at the critical
point:
c c
c c
T=T ,P=P
2
2
T=T ,P=P
0
0
P
V
P
V
(4)
where Tc and Pc are the critical temperature and critical pressure, respectively. These two
equations can be coupled to solve for the two constants a and b,

3
2 227
64
8
c
c
c
c
R Ta
P
RTb
P
(5)
1.2.2. Redlich-Kwong EOS
In 1949, Redlich and Kwong [2] proposed the following CEOS,
1/2
RT aP
V b T V V b
(6)
where a and b are different for various components. Their expression are given as follows,
2 2.50.42748
0.08664
c
c
c
c
R Ta
P
RTb
P
(7)
We can also rewrite the proposed EOS in terms of compressibility factor,
2
1A P Z BP
Z BPZ Z BP
(8)
where Z is compressibility factor, and the two parameters A and B are given as below,
respectively,
2
2 5/2
aA
R T
bB
RT
(9)

4
It should be noted that the critical compressibility factor, Zc, is constant for all pure fluids, and its
value is 0.33.
The proposed Redlich-Kwong EOS improves the accuracy in vapor pressure prediction. In
addition, Redlich and Kwong replaced the term2V in van der Waals EOS with V V b ,
leading to more accurate predictions of vapor-liquid equilibria (VLE) [2].
1.2.3. Soave-Redlich-Kwong EOS
Soave [3] further modified the Redlich-Kwong EOS with the introduction of a
temperature/component-dependent parameter a, giving the famous SRK EOS. The so-called
SRK EOS is given as [3],
a TRTP
V b V V b
(10)
where
2 2
2
2
0.42747
1 1
0.480 1.574 0.176
0.08664
c
cc
c
c
c
c
a T a T
R Ta
P
TT m
T
m
RTb
P
(11)
where is acentric factor, and the so-called alpha function, T , becomes unity when the
temperature is critical temperature. In addition, the parameter m is a function of acentric factor in

5
the alpha function. The SRK EOS provides more accurate prediction of the vapor pressures for
pure components. Similarly, the SRK EOS can be written in terms of compressibility factor as
follows,
3 2 2 0F Z Z Z A B B AB (12)
where two parameters A and B are given as below,
2 2 2 2c
P PA a a
R T R T
PB b
RT
(13)
1.2.4. Peng-Robinson EOS
It is worth noting that a major deficiency of RK EOS and SRK EOS is that the predicted density
values for the liquid phase are unreliable, albeit the calculated vapor densities are generally
acceptable [4]. To overcome this drawback, Peng and Robinson [4] proposed a new two-
parameter EOS with a modification in the attractive pressure term, namely, PR EOS,
2 22
RT aP
V b V bV b
(14)
where
2 2
2
0.45724
1 1
0.07780
c
cc
c
c
c
c
a T a T
R Ta
P
TT m
T
RTb
P
(15)
6
The term m in the alpha function is a function of the acentric factor as shown below [7],
2
2 3
0.37464 1.54226 0.26992 , 0.49
0.379642 1.48503 0.164423 0.016666 , 0.49m
(16)
PR EOS can be also written as below,
3 2 2 2 31 2 3 0F Z B Z A B B Z AB B B (17)
1.2.5. Volume Translation Concept
The predicted liquid molar volume by these CEOSs could differ considerably from the
experimental value, especially near the critical region. To address such limitation of two-
parameter CEOS and improve the accuracy of predicted liquid density, Martin [8] in 1967
proposed the concept of volume translation concept for the first time. The essence of the volume
translation concept is that it moves the liquid volume along the molar volume coordinate without
altering the phase equilibrium calculations for pure components or mixtures. Later in 1982,
Peneloux et al. [5] proposed a constant volume translation for SRK EOS, which became a
milestone in the volume translation theory. The performance of this correlation is good in the
low temperature range but tends to be compromised near the critical point. To accommodate the
effect of temperature on the volume translation, many follow-up researches were carried out to
develop temperature-dependent volume translations in CEOS.
1.3. Problem Statement
With an introduction of the volume translation concept, the prediction of liquid density can be
improved without causing any change to the phase equilibrium calculations. However, for some
nonlinear temperature-dependent volume translation techniques, the isotherms could cross each

7
other in the pressure-volume (PV) diagram, leading to anomalous predictions of molar volume
for a pure component at an isobaric condition. Such crossover phenomenon impairs the accuracy
of predicted molar volume, causes thermodynamic inconsistency in the predicted thermodynamic
properties, and restricts theapplication range of the temperature-dependent volume translated
EOS. It is important that a volume-translated EOS should avoid the aforementioned crossover
issue.
1.4. Objectives
The main objective of this research is to develop a thermodynamically consistent volume
translation method in PR EOS. The detailed objectives include the following:
1) To develop a criterion to judge whether the crossover phenomenon exists with various volume
translations;
2) To evaluate the specific temperature/pressure conditions over which there is certainly no
crossover phenomenon for the recently published volume translation methods;
3) To present a mathematical constraint to make the new proposed volume translation capable of
preventing the occurrence of crossover over a wide range of pressure and temperature; and
4) To develop a generalized consistent temperature-dependent volume translation model in PR
EOS to improve the predicting accuracy of the liquid densities for pure components.
1.5. Thesis Structure
In this thesis, we first develop a criterion to judge whether a volume-translated EOS will result in
crossover issues. Then, applying the proposed criterion, the recently published volume
translations are evaluated and, the specific temperature/pressure conditions over which there is

8
certainly no crossover phenomenon are obtained. Last, a generalized temperature-dependent
volume translation model is developed by introducing a mathematical constraint to the proposed
model, which ensures no crossing of pressure-volume isotherms occurs over a wide range of
pressure/temperature and provides more accurate predictions of the liquid densities for pure
components.
This thesis is a paper-based thesis, organized as follows:
In Chapter 1, the research background, a brief introduction of CEOS and volume translation
concept as well as the problem statement are presented, followed by the objectives and the thesis
structure.
Chapter 2 presents a criterion we have proposed to judge whether the crossover phenomenon
exists for a given volume-translated EOS based on a fundamental rule that the isobaric
expansivity for a pure gas or liquid is positive. This criterion can be used to judge whether the
crossover issues occur over a temperature range of [Ttp, nTc] and a pressure range of (0, nPc] for
a given volume-translated EOS. The proposed criterion provides insights and guidance to
develop a more reliable volume translation method presented in Chapter 3.
In Chapter 3, a generalized temperature-dependent volume translation model is developed in the
PR EOS to enhance the accuracy of predicted molar volume. The new model consists of three
acentric factor-dependent parameters. Based on the criterion of thermodynamic consistency, a
constraint is introduced into the nonlinear regression, which ensures that there is no any crossing
of isotherms at a wide range of pressure and temperature (up to 100 MPa and 1000K).
Chapter 4 summarizes the conclusions of this study as well as recommendations for future work.

9
References
[1] J.D. Waals, Over de continuiteit van den gas-en vloeistoftoestand, Sijthoff (1873).
[2] O. Redlich, J.N. Kwong, On the thermodynamics of solutions. V. An equation of state.
Fugacities of gaseous solutions, Chemical Reviews. 44 (1949) 233-244.
[3] G. Soave, Equilibrium constants from a modified Redlich–Kwong equation of state, Chem.
Eng. Sci. 27 (1972) 1197-1203.
[4] D.Y. Peng, D.B. Robinson, A new two-constant equation of state, Ind. Eng. Chem. Fundam.
15 (1976) 59-64.
[5] É. Clapeyron, Mémoire sur la puissance motrice de la chaleur, J. Gabay (1834).
[6] T. Ahmed, Equations of state and PVT analysis, Elsevier (2013).
[7] D.B. Robinson, D.Y. Peng, The characterization of the heptanes and heavier fractions for the
GPA Peng-Robinson programs, Gas Processors Association (1978).
[8] J.J. Martin, Equations of state-Applied thermodynamics symposium, Ind. Eng. Chem. 59
(1967) 34-52.
10
CHAPTER 2 CRITERION FOR DETERMINING CROSSOVER
PHENOMENON IN VOLUME-TRANSLATED EQUATION OF STATES
A version of this chapter was presented at the 65th Canadian Chemical Engineering Conference
held in Calgary, Alberta, Canada, 4-7 October 2015, and has been accepted for publication in
Fluid Phase Equilibria, 430 (2016): 1-12.

11
Abstract
Volume translation is widely adopted in cubic equation of state (CEOS) to achieve more accurate
density predictions for pure compounds and mixtures. Previous research reveals that a
temperature-dependent volume-translated EOS could result in crossing of pressure-volume
isotherms for a pure compound, which leads to an anomalous behavior that the predicted molar
volume for a pure component can possibly be lower at a higher temperature at an isobaric
condition. Such crossover phenomenon fails to consistently predict the thermodynamic
properties of a pure compound, e.g., giving negative isobaric thermal expansivity. In this study,
we develop a concise criterion to judge whether a volume-translated EOS will result in crossover
issues, and if so, the extent of the temperature and pressure range over which the crossover
phenomenon occurs. The recently proposed volume translations are evaluated on the basis of the
developed criterion. For the various types of temperature-dependent volume translations, we
obtain the specific temperature/pressure conditions over which there is certainly no crossover
phenomenon.
Keywords: crossover phenomenon, volume translation, equation of state, thermodynamics, PVT
relations

12
2.1. Introduction
Cubic equations of states (CEOS), such as the Peng-Robinson equation of state (PR EOS) [1]
and Soave-Redlich-Kwong equation of state (SRK EOS) [2], are widely applied in chemical and
petroleum industry for modeling compositional and volumetric phase behavior of pure
compounds as well as mixtures. The generalized CEOS is given as [3],
2 2
RT aP
V b V ubV wb
(1)
where
ca a (2)
2 20 c
c a
c
R Ta
p (3)
2
0.5
r1 1m T
(4)
0 cb
c
RTb
p (5)
where P is pressure, T is temperature, Tr is reduced temperature, V is molar volume, a and b are
EOS parameters, Tc and Pc are critical temperature and pressure, respectively, R is the universal
gas constant, refers to the so-called alpha function, u, w, 0
a , 0
b are constants, and m is a
function of acentric factor. Table 1 shows the different values of the constants u, w, 0
a , 0
b and
m for the PR EOS and SRK EOS, respectively.

13
The constant critical compressibility factor predicted by the PR EOS and SRK EOS, is larger
than the experimental value. As a result, the predicted liquid molar volume by these CEOSs
could differ considerably from the experimental value, especially near the critical region. To
address such limitation of two-parameter CEOS and improve the prediction accuracy of liquid
density, a volume translation concept was first proposed by Martin [4] in 1967. This method
translates the predicted liquid volume along the volume coordinate without any changes in the
phase equilibrium calculations for pure components or mixtures. In 1982, a constant volume
translation for SRK EOS was proposed by Peneloux et al. [5]; this constant correction term
significantly improves the predictions of liquid density in the low temperature range. However,
its performance is compromised near the critical point.
In order to overcome the deficiency of the constant correction proposed by Peneloux et al. [5],
many researchers have developed various types of temperature-dependent volume translations in
two-parameter CEOS to accommodate the effect of temperature on the volume translation
needed. To ensure that the introduced volume translation does not affect phase equilibrium
calculations, it is constrained to be only a function of temperature. A general temperature-
dependent volume translation for the CEOS can be represented as,
CEOS Correctedc T V V (6)
where c T is a temperature-dependent volume translation term, CorrectedV is the corrected molar
volume, and CEOSV is the original molar volume calculated by the CEOS model.
In 1989, Mathias et al. [6] proposed a distance correction, a dimensionless quantity related to the
inverse of the isothermal compressibility, to improve density prediction near the critical region.
14
Based on the principle of distance correction, Chou and Prausnitz [7] presented a
phenomenological correction to the SRK EOS for more accurate volumetric predictions; the
volume translated SRK EOS provides absolute deviations of less than 3.1% in the calculated
saturated liquid densities for 10 pure fluids. Furthermore, Ji and Lempe [8] proposed a new
volume translation method with a modified distance function to the SRK EOS by introducing
empirical parameters; using this volume translation method, the average relative deviation in the
calculated saturated liquid densities has been reduced to 0.96% for 36 compounds. Aside from
these distance corrections, some authors [9-12] proposed some other temperature-dependent
volume translations. Magoulas and Tassios [9], for example, developed an exponential-type
volume translation correction to the PR EOS and VDW EOS together with a modified
function for normal alkanes up to n-C20H42. De Sant’Ana et al. [10] proposed a volume
translation that considers the temperature as well as the molecular weight of each compound.
Although the above temperature-dependent volume translations improve the volume molar
predictions in the saturated region, these methods do not perform equally well at high
temperature/pressure conditions. To improve the prediction of molar volume at extreme
conditions, Pedersen et al. [11] introduced a temperature-dependent volume translation in PR
EOS and SRK EOS for paraffins, heavy aromatic fluids with a significant content of C81+, and
reservoir fluids. This new volume translation reduces the average deviation to less than 6.1% in
the predicted densities for various reservoir fluids. Recently, Baled et al. [12] proposed a linear
temperature-dependent volume translation for pure components at high temperature/pressure
conditions, which is relevant to the phase-behavior modeling of ultradeep reservoir fluids.
Applying this high-temperature/high-pressure volume translation implemented in both SRK EOS
15
and PR EOS, they obtained mean absolute relative deviations of 1.47% and 2.01%, respectively,
for 17 pure compounds.
2.2. Motivation
Most temperature-dependent volume translations can provide more accurate predictions of molar
volume than the original CEOS; however, these methods may lead to the crossing of isotherms in
the pressure-volume (PV) diagram because various degrees of volume shifts are required for the
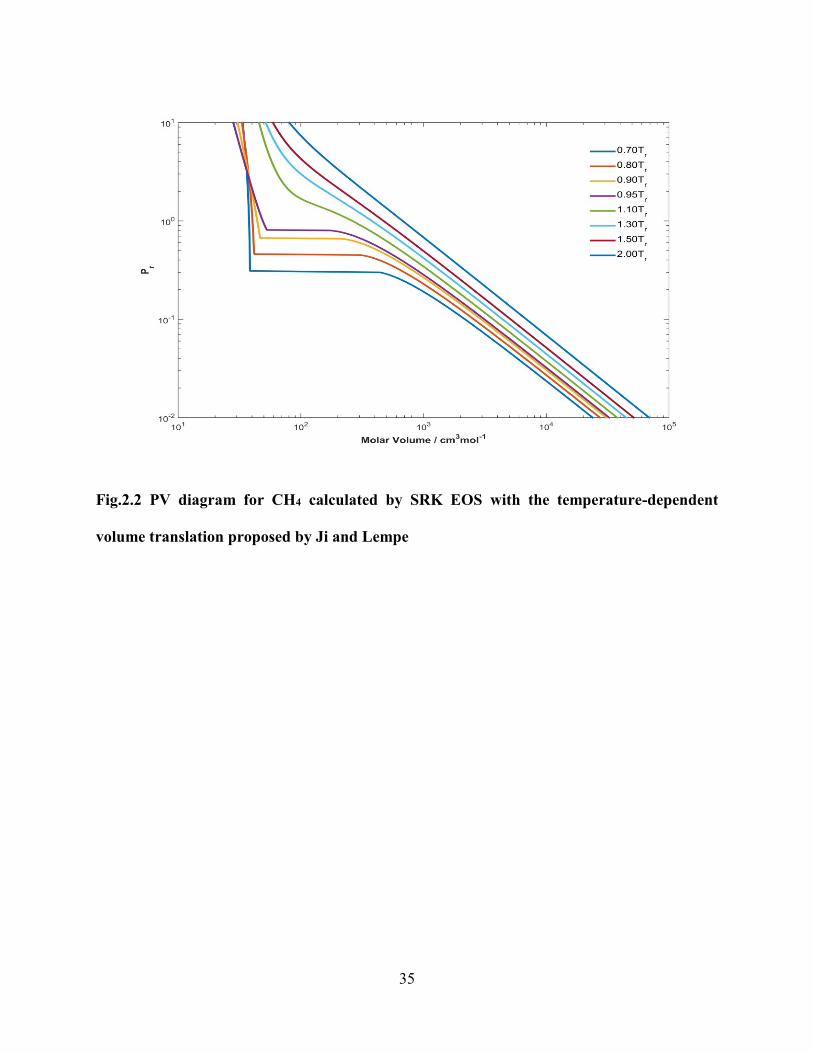
different isotherms along the molar volume coordinate [13]. Figs. 2.1 and 2.2 show the PV
diagrams for CH4 calculated by the original SRK EOS and those calculated by SRK EOS with
the temperature-dependent volume translation proposed by Ji and Lempe [8], respectively. One
can clearly observe the crossing of isotherms with this temperature-dependent volume translation,
i.e., the predicted molar volume is lower at a higher temperature under isobaric conditions. Such
so-called crossover phenomenon violates the basic physics of pure fluid: the molar volume of a
pure fluid should be expanded when heated under an isobaric condition [13]. Moreover, it is
noted that there are two different temperatures corresponding to a given molar volume or a given
pressure due to the crossing of isotherms in the PV diagram, as shown in Fig.2.2. In particular,
such thermodynamic inconsistency restricts the range of applications of the volume translated
EOS, albeit these methods may improve the prediction accuracy of molar volumes under some
conditions.
Some studies have been conducted to show the crossover phenomenon of PV isotherms
calculated by a given volume-translated EOS. Salim and Trebble [14] pointed out that
temperature-dependent co-volume could lead to crossover phenomenon. Yelash and Kraska [15]
16
proposed an approach to analyze the crossover phenomenon in terms of virial coefficients and
stated that a volume translation parameter that decreases with temperature does not cause
isotherm crossing. Hoyos [16] proposed a method for evaluating whether volume translated EOS
is consistent by drawing the partial derivative of pressure with respect to temperature at a
constant volume. Recently, Frey et al. [17] pointed out that the region of PVT space related to
fluid phase calculations is limited, and crossover phenomenon may be outside this region. But
one must recognize that, very often, volume translations are also applied to fluid systems
subjected to extreme conditions, such as the reservoir fluid contained in high
temperature/pressure conditions. Baled et al. [12] demonstrated that their volume translation
does not yield crossover phenomenon over wide ranges of temperature and pressure. In addition,
for the temperature-dependent volume translation model proposed by Abudour et al. [18], the
plots of liquid density versus pressure for CO2 were used to demonstrate that their method does
not lead to thermodynamic inconsistencies. To summarize, however, the aforementioned
investigations on crossover issues are all conducted with limited scopes; for instance, a finite
number of PV isotherms are often drawn to show there is no crossover issue. A conclusion that
no crossover occurs over a wide range of temperature and pressure cannot be guaranteed. There
is lacking of a methodology that can be used to judge whether crossover issue occurs or not. It is,
thereby, highly necessary and meaningful to revisit the crossover issue, as well as develop a
reliable and convenient criterion to evaluate the thermodynamic consistency of volume
translation methods used in CEOS [12-18]. This will help researchers and engineers to choose
the appropriate volume translation method that does not bear crossover issues and well suits
specific application of interest.
17
In this work, we develop a criterion to judge whether a volume translation in CEOS can provide
consistent prediction of PVT relations over a wide range of temperature and pressure. We apply
this criterion to the popular volume translations used in CEOS and provide the application ranges
over which there is certainly no crossover issue when using these volume translation methods.
2.3. Mathematical Formulation
The compressibility factor for a real fluid is given by,
PVZ
RT (7)
where Z is the compressibility factor which is a function of pressure and temperature, i.e.,
,Z Z P T . Compressibility factor can be readily obtained by solving any CEOS such as PR
EOS or SRK EOS.
If a volume translation is introduced in a two-parameter CEOS, the corrected molar volume can
be obtained from Eq. (6),
Corrected CEOSV V c T (8)
Based on theoretical examination of the nature of volume translation methods, Yelash and
Kraska [15] concluded that crossing issue can be avoided if the pole-packing fraction decreases
with an increasing temperature, leading to the following condition,
0
c T
T
(9)

18
Later, we will show that Eq. (9) is only a sufficient condition for a volume translation not to
cause crossover phenomenon, but not a sufficient and necessary condition.
We next perform a graphical analysis regarding the crossover phenomenon. Fig. 2.3 shows two
PV isotherms calculated with a volume translation method at 1T and 1T T (where T is a
positive temperature difference). As shown in Fig. 2.3, if crossing exists between these two
isotherms in the PV diagram: at the intersection of the two isotherms corresponding to P1, the
difference in the corrected molar volumes corresponding to 1T and 1T T equals to 0, i.e.,
Corrected Corrected
1 1 0V T T V T , while the difference in molar volumes at the isobaric
pressure P2 is less than 0, i.e., Corrected Corrected
1 1 0V T T V T . This means that if there is no
crossover between these two isotherms, the following relation holds,
Corrected Corrected
1 10
V T T V T
T
(10)
In a more general sense, if T is infinitesimal, we will have,
Corrected Corrected Corrected1 1
0PP
lim 0T
V T T V T V
T T (11)
which ensures that there is no crossing of one isotherm with a neighbouring isotherm from a
mathematical point of view. Thus, the following equation can be obtained,
CEOSCorrected CEOS
P PP
0V c T c TV V
T T T T
(12)

19
where CEOS
P
V
T
can be evaluated as below based on Eq. (7),
CEOS
PP
P
ZRT
V RT Z ZRP
T T P T P
(13)
Because there is no crossover phenomenon for a two-parameter CEOS, the first derivative of the
molar volume with respect to temperature calculated by a two-parameter CEOS is always
positive,
CEOS
PP
0V RT Z ZR
T P T P
(14)
Substituting Eq. (13) into Inequality (12), the following inequality can be obtained,
Corrected
PP
0c TV RT Z ZR
DT P T P T
(15)
where D is the first derivative of corrected molar volume with respect to temperature. Thereby,
the condition for a volume translation without giving crossover phenomenon over a temperature
range of [Ttp, nTc] and a pressure range of (0, nPc] is obtained,
cc cnP
c T RT Z ZR
T nP T nP
, tp c,T T nT (16)
20
where Ttp is triple point temperature;
cnP
Z
T
and Z can be evaluated with Eq. (7) for PR EOS
and SRK EOS, respectively, as shown by Appendix A; and the term c T
T
can be evaluated
for different volume translations, as shown by Appendix B. It is noted that Inequality (16) needs
only to be applied once at nPc over the temperature range [Ttp, nTc], if one is interested in judging
the existence of isotherm crossover over [Ttp, nTc] and (0, nPc]. It can be easily proven that the
condition given by Inequality (16) is a necessary and sufficient condition for a volume
translation without giving crossover issues over a given temperature range of [Ttp, nTc] and
pressure range of (0, nPc]. In practice, nPc and nTc can be set as high values, for instance, 10Pc
and 10Tc, respectively, which brackets the range of pressure/temperature conditions relevant to
most petroleum engineering and chemical engineering applications. In addition, comparison of
Inequalities (9) and (16) shows that the condition given by Inequality (16) encloses the condition
given by Inequality (9). Such criterion is also consistent with the physical principle that the
volume of a pure fluid in gaseous state or liquid state should be expanded when heated under an
isobaric condition, indicating the isobaric expansivity ( P ) for a pure fluid should be always
positive,
P
P
1 V
V T (17)
Nevertheless, it should be noted that such statement is not always true for solid materials; some
solid materials exhibit negative isobaric expansivity under specific conditions [23].

21
2.4. Results and Discussion
With the introduction of volume translation, the molar volume prediction for pure fluids is more
accurate in comparison with the original two-parameter CEOS. Over the last 3 decades, various
types of volume translation schemes have been proposed; most methods can be roughly grouped
into the following categories: constant volume translations as proposed by Peneloux et al. [5],
linear temperature-dependent volume translations, exponential-type temperature-dependent
volume translations, and temperature-dependent volume translations based on distance functions.
However, many volume translations were proposed at the expense of compromised
thermodynamic consistency. The criterion developed in this study will be used to assess if these
various types of volume translation methods lead to crossover phenomenon or not. Four pure
compounds, CH4, CO2, n-C5H12, and n-C10H22, are used for demonstration purposes. Their basic
physical properties are presented in Table 2.
2.4.1. Linear Temperature-Dependent Volume Translations
As for the constant volume translation corrections, a component-dependent term was first
proposed by Peneloux et al. [5]. Pendersen et al. [11] introduced a temperature-dependent
Peneloux parameter in the SRK and PR EOS to match the experimental data for simulating
reservoir’s phase behaviour; most notably, the correction remains constant for light component
from CH4 to n-C6H14. For constant volume translations, the derivative of constant volume
translation with respect to temperature is always zero, indicating that the Inequality (16) is
always satisfied and thus no crossover phenomenon occurs.
The molar volume prediction with the constant volume translation is generally not satisfactory
especially when the critical point is approached. Such deficiency, to some extent, motivates the
22
introduction of a linear temperature-dependent volume translation. Below is the generalized form
of a linear temperature-dependent volume translation,
c T AT B (17)
where A and B are constants that may vary for different compounds. As for such linear
temperature-dependent volume translation, if its derivative with respect to temperature is
negative, i.e.,
0
c TA
T
(18)
the first derivative of corrected molar volume with respect to temperature (D) is always positive
according to Inequality (15). This means that there is no crossover if the value of A in the linear
temperature-dependent volume translation is negative. For instance, Baled et al. [12] proposed a
linear temperature-dependent volume translation correction to SRK and PR EOS at extreme
conditions; the two parameters A and B in the correction are a function of molecular weight and
acentric factor. It was shown that all the optimized values of the parameter A in volume
translation for different components are always negative, which ensures that no thermodynamic
inconsistency exists with this method. As for the other linear temperature-dependent volume
translation proposed by De Sant’Ana et al. [10], the two parameters A and B are related to
molecular weight; the parameter A is given as,
0.023 0.00056
c TA MW
T
(19)
where MW is molecular weight. It can be seen that no crossover phenomenon exists if the
molecular weight is larger than 41.07 g/mol because of a negative parameter A. Taking CO2

23
(molecular weight is 44.01 g/mol) for example, the calculated value for A is negative (-0.00165),
which ensures that there is no crossover phenomenon over a wide range of temperature and
pressure for CO2 based on Inequality (15). However, as for CH4 (16.04 g/mol), the value of A is
0.01402, which is positive. Thus, further analysis is warranted. With the volume translation
proposed by De Sant’Ana et al. [10], we can obtain the relationship between the first derivative
of corrected molar volume with respect to temperature (D) versus the reduced temperature (Tr)
for CH4 at different constant pressure of 2Pc, 5Pc, 10Pc and 100Pc, respectively. Fig. 2.4 shows
the calculation results. No crossing of isotherms exists when the constant pressures are 2Pc, 5Pc
and 10Pc, respectively, because the value of D is always positive. However, if the pressure
increases to 100Pc, we can encounter a range of temperature that yields a negative D. This
implies that there is a crossing of any two isotherms from 0.476Tc to 0.524Tc at 100Pc in the PV
diagram. Table 3 shows the detailed range of temperatures that yield negative D at different
isobaric pressures for CH4 for various volume translation methods. Also listed are the maximum
pressures Pm*, below which there is no crossover in the PV diagram over the temperature range
of [Ttp, 3Tc].
2.4.2. Exponential-Type Temperature-Dependent Volume Translations
In order to improve the molar volume prediction near or higher than the critical region, more
complex volume translation methods, such as the exponential-type temperature-dependent
volume translation, are proposed. In 1990, Magoulas and Tassios [9] developed an exponential
temperature-dependent volume translation in PR EOS for the n-alkanes up to n-C20H42. The
derivation of D based on the Magoulas and Tassios [9] method is given in Appendix B. To
explore whether crossover phenomenon exists with this volume translation, Fig. 2.5 plots D as a
function of reduced temperature (Tr) for CH4 at different isobaric pressures. As can be seen from

24
Fig. 2.5, the value of D is always positive when the isobaric pressure is 2Pc, which means there
is no crossing of isotherms in the PV diagram over [Ttp, 3Tc] and (0, 2Pc]. In comparison, D
becomes negative over a temperature range of 0.869-0.999Tc at an isobaric pressure of 5Pc. This
indicates that the crossover phenomenon appears in this range of temperature of 0.869-0.999Tc
for any two isotherms. In addition, at the isobaric pressure of 5Pc, for isotherms corresponding to
temperatures less than 0.869Tc or larger than 0.999Tc, no crossover exists because of the positive
value of D. However, it should be noted that one isotherm with a temperature falling between
0.869Tc-0.999Tc can possibly crossover with another isotherm with a temperature beyond the
range of 0.869Tc-0.999Tc. When the isobaric pressures are 10Pc and 100Pc respectively, we
obtain wider ranges of temperatures that result in negative D, i.e., 0.814Tc-0.999Tc for 10Pc and
0.638Tc-0.999Tc for 100Pc, respectively. For the other temperature-dependent volume
translations with an exponential form proposed by Hong and Duan [19], similar conclusions can
be made.
2.4.3. Temperature-Dependent Volume Translations Based on Distance Function
Several other researchers incorporated a density dependency, associated with the inverse of the
isothermal compressibility, into the volume translation equation. Chou and Prausnitz [7]
presented a phenomenological volume translation to the SRK EOS with a distance correction,
Corrected CEOS cc
c
1 0.35
3 0.35
RTV V c Z
P d
(20)
where the distance function is given by,

25
CEOS CEOS
c cTCEOS
T
1 1
1
P Pd
RT RT
V
(21)
where d is the distance function, c is the Peneloux volume translation [5], is molar density,
and Zc is the experimental critical compressibility for a pure fluid.
We use the developed criterion to evaluate the crossover existence for the Chou and Prausnitz
correlation [7]. With the Chou and Prausnitz correlation [7], Fig. 2.6 plots D as a function of Tr
for CH4 at different isobaric pressures. It can be observed that D is always positive over the
temperature range of interest at different isobaric pressures, which indicates that no crossover
phenomenon appears in the PV diagram over a wide range of temperatures and pressures, i.e.,
[Ttp, 3Tc] and (0, 100Pc]. Later, Ji and Lempe [8] proposed a new volume translation term with a
modified distance function for the SRK EOS. Fig. 2.7 shows a 3D diagram that depicts the
dependence of D on temperature and pressure with the volume translation proposed by Ji and
Lempe [8]. Fig. 2.8 plots D as a function of Tr at different isobaric pressures, which are evaluated
based on the Ji and Lempe [8] correlation. As shown in Fig. 2.8, at isobaric pressures up to 2Pc,
it is obviously observed that no crossover phenomenon occurs due to the positive values of D.
Nonetheless, the crossover phenomenon appears in between 0.787Tc-0.983Tc for the pressure
range of (0-5Pc]. When we continue to extend the range of pressures up to 10Pc and 100Pc,
respectively, the ranges of temperatures, over which crossing of any two isotherms occurs, are
also expanded to 0.712Tc-0.993Tc and 0.476Tc-0.999Tc, respectively.
On the basis of the proposed criterion, we have also examined other popular volume translation
methods [18, 20]. Tables 3-6 list the detailed crossover analysis results on various volume

26
translation methods for CH4, CO2, n-C5H12 and n-C10H22, respectively. These tables include the
maximum ranges of pressure (0, Pm] over which there is certainly no crossing of two isotherms
with temperatures falling between [Ttp, 3Tc]. It can be seen from these tables that some popular
volume translation methods will cause crossover issues even at relatively low
pressure/temperatures relevant to petroleum engineering or chemical engineering applications.
For example, the Ji and Lempe [8] method begins to cause crossover of isotherms at a low
pressure of 1.732Pc for CO2, i.e., 12.777 MPa. Such relatively low pressure is frequently
encountered in engineering applications, such as CO2 enhanced oil recovery or CO2
sequestration in depleted oil reservoirs. In addition, it is worthwhile noting that the crossover
phenomenon could probably exist in the mixtures if there are isotherm crossings in the PV
diagrams for the pure components.
2.5. Conclusions
In this work, we developed a criterion to judge whether the crossover phenomenon exists for a
given volume-translated EOS based on a fundamental rule that the isobaric expansivity for a pure
gas or liquid is positive. This criterion can be used to judge if one given volume-translated CEOS
leads to crossover issues over a temperature range of [Ttp, nTc] and a pressure range of (0, nPc].
We only need to apply the criterion once at nPc over the temperature range of [Ttp, nTc] for such
purpose. The criterion developed in this study can aid in developing more reliable volume
translation methods that are guaranteed to not give rise to crossover issues, as well as avoid
anomalous isobaric expansivity for pure compounds.

27
Based on this criterion, the widely used volume translation methods have been evaluated in
terms of their thermodynamic consistency. It should be noted that not all temperature-dependent
volume translation yields crossover phenomenon. For the most linear temperature-dependent
volume translation corrections, there is no crossover phenomenon if the coefficient of
temperature is negative. We find that there are crossover issues for most of the popular
exponential-type volume translation methods [9, 19-20], and the crossover issue can appear at
relatively low pressures. In comparison to the exponential-type volume translations, the volume
translation methods based on the concept of distance correction, such as the methods proposed
by Chou and Prausnitz [7] and Abudour et al. [18] tend to have wider temperature/pressure
ranges over which no crossover issues appear.
28
References:
[1] D.Y. Peng, D.B. Robinson, A new two-constant equation of state, Ind. Eng. Chem. Fundam.
15 (1976) 59-64.
[2] G. Soave, Equilibrium constants from a modified Redlich–Kwong equation of state, Chem.
Eng. Sci. 27 (1972) 1197-1203.
[3] G. Schmidt, H. Wenzel, A modified van der Waals type equation of state, Chem. Eng. Sci. 35
(1980) 1503-1512.
[4] J.J. Martin, Equations of state-Applied thermodynamics symposium, Ind. Eng. Chem. 59
(1967) 34-52.
[5] A. Peneloux, E. Rauzy, R. Freze, A consistent correction for Redlich–Kwong–Soave volumes,
Fluid Phase Equilib. 8 (1982) 7-23.
[6] P.M. Mathias, T. Naheiri, E.M. Oh, A density correction for the Peng–Robinson equation of
state, Fluid Phase Equilib. 47 (1989) 77-87.
[7] G.F. Chou, J.M. Prausnitz, A phenomenological correction to an equation of state for the
critical region, AIChE J. 35 (1989) 1487-1496.
[8] W.R. Ji, D.A. Lempe, Density improvement of the SRK equation of state, Fluid Phase
Equilib. 130 (1997) 49-63.
[9] K. Magoulas, D. Tassios, Thermophysical properties of n-alkanes from C1 to C20 and their
prediction for higher ones, Fluid Phase Equilib. 56 (1990) 119-140.
29
[10] H.B. de Sant’Ana, P. Ungerer, J.C. de Hemptinne, Evaluation of an improved volume
translation for the prediction of hydrocarbon volumetric properties, Fluid Phase Equilib. 154
(1999) 193-204.
[11] K.S. Pedersen, J. Milter, H. Sørensen, Cubic equations of state applied to HT/HP and highly
aromatic fluids, SPE J. 9 (2004) 186-192.
[12] H. Baled, R.M. Enick, Y. Wu, M.A. McHugh, W. Burgess, D. Tapriyal, B.D. Morreale,
Prediction of hydrocarbon densities at extreme conditions using volume-translated SRK and PR
equations of state fit to high temperature, high pressure PVT data, Fluid Phase Equilib. 317
(2012) 65-76.
[13] O. Pfohl, Letter to the editor: “Evaluation of an improved volume translation for the
prediction of hydrocarbon volumetric properties”, Fluid Phase Equilib. 163 (1999) 157-159.
[14] P.H. Salim, M.A. Trebble, A modified Trebble-Bishnoi equation of state: thermodynamic
consistency revisited, Fluid Phase Equilib. 65 (1991) 59-71.
[15] L.V. Yelash, T. Kraska, Volume-translated equations of state: Empirical approach and
physical relevance, AIChE J. 49 (2003) 1569-1579.
[16] B. Hoyos, Generalized liquid volume shifts for the Peng-Robinson equation of state for C1
to C8 hydrocarbons, Latin Amer. Appl. Res. 34 (2004) 83-89.
[17] K. Frey, C. Augustine, R.P. Ciccolini, S. Paap, M. Modell, J. Tester, Volume translation in
equations of state as a means of accurate property estimation, Fluid Phase Equilib. 260 (2007)
316-325.

30
[18] A.M. Abudour, S.A. Mohammad, R.L. Robinson, K.A.M. Gasem, Volume-translated Peng–
Robinson equation of state for saturated and single-phase liquid densities, Fluid Phase Equilib.
335 (2012) 74-87.
[19] L. Hong, Y.Y. Duan, Empirical correction to the Peng–Robinson equation of state for the
saturated region, Fluid Phase Equilib. 233 (2005) 194-203.
[20] M. Nazarzadeh, M. Moshfeghian, New volume translated PR equation of state for pure
compounds and gas condensate systems, Fluid Phase Equilib. 337 (2013) 214-224.
[21] P.J. Linstrom, W.G. Mallard (Eds.), NIST Chemistry WebBook, NIST Standard Reference
Database Number 69, National Institute of Standards and Technology, Gaithersburg, MD, 20899,
http://webbook.nist.gov.
[22] C.F. Spencer, R.P. Danner, Improved equation for prediction of saturated liquid density, J.
Chem. Eng. Data. 17 (1972) 236-241.
[23] T.A. Mary, J.S.O. Evans, T. Vogt, A.W. Sleight, Negative thermal expansion from 0.3 to
1050 Kelvin in ZrW2O8, Science. 272 (1996) 90.

31
Tables and Figures:
Table 2.1 Constants of the PR EOS and SRK EOS in Eq. (1)
EOS u w 0
a 0
b m
PR[1] 2 -1 0.45724 0.07780 20.37464 1.54226 0.26992
SRK[2] 1 0 0.42748 0.08664 20.480 1.574 0.176
Table 2.2 Physical Properties of Pure Fluids Used in This Study
Compound Ttp (K) Tc (K) Pc (MPa) cz RAz Reference
CH4 90.71 190.56 4.5992 0.011 0.2863 0.2876 [21, 22]
CO2 216.54 304.13 7.3773 0.22394 0.2746 0.2736 [21, 22]
n-C5H12 211.37 469.70 3.3700 0.251 0.2684 0.2685 [21, 22]
n-C10H22 339.74 617.70 2.1030 0.488 0.2501 0.2503 [21, 22]
Table 2.3 Range of Reduced Temperature over Which Crossover Occurs at Different
Isobaric Pressures for CH4
Reduced Temperature
Reference 2Pc 5Pc 10Pc 100Pc Pm*
Peneloux et al. [5] No No No No No
Chou and Prausnitz [7] No No No No 2111.931Pc
Ji and Lempe [8] No 0.787-0.983 0.712- 0.993 0.476-0.999 2.399Pc
Magoulas and Tassios [9] No 0.869-0.999 0.814-0.999 0.638-0.999 2.077Pc
De Sant’Ana et al. [10] No No No 0.476-0.524 98.166Pc
Pedersen et al. [11] No No No No No
Baled et al. [12] No No No No No
Abudour et al. [18] No No No No 2333.536Pc
Hong and Duan [19] 0.987-0.999 0.879-0.999 0.831-0.999 0.676-0.999 1.931Pc
Nazarzadeh and
Moshfeghian [20]
No 0.876-0.999 0.825-0.999 0.668-0.999 2.012Pc
*Note: Pm is the maximum pressure below which there is no crossover in the PV diagram over
the temperature range of [Ttp, 3Tc].

32
Table 2.4 Range of Reduced Temperature over Which Crossover Occurs at Different
Isobaric Pressures for CO2
Reduced Temperature
Reference 2Pc 5Pc 10Pc 100Pc Pm*
Peneloux et al. [5] No No No No No
Chou and Prausnitz [7] No No No No 3407.528Pc
Ji and Lempe [8] 0.947-0.998 0.854-0.999 0.782- 0.999 0.712-0.999 1.732Pc
Magoulas and Tassios [9] 0.968-0.999 0.899-0.999 0.864-0.999 0.746-0.999 1.722Pc
De Sant’Ana et al. [10] No No No No No
Pedersen et al. [11] No No No No No
Baled et al. [12] No No No No No
Abudour et al. [18] No No No No 3774.546Pc
Hong and Duan [19] 0.960-0.999 0.894-0.999 0.858-0.999 0.739-0.999 1.682Pc
Nazarzadeh and
Moshfeghian [20]
0.964-0.999 0.886-0.999 0.847-0.999 0.723-0.999 1.781Pc
*Note: Pm is the maximum pressure below which there is no crossover in the PV diagram over
the temperature range of [Ttp, 3Tc].
Table 2.5 Range of Reduced Temperature over Which Crossover Occurs at Different
Isobaric Pressures for n-C5H12
Reduced Temperature
Reference 2Pc 5Pc 10Pc 100Pc Pm*
Peneloux et al. [5] No No No No No
Chou and Prausnitz [7] No No No No 5297.625Pc
Ji and Lempe [8] No No No 0.450-0.999 1.405Pc
Magoulas and Tassios [9] 0.952-0.999 0.893-0.999 0.859-0.999 0.747-0.999 1.592Pc
De Sant’Ana et al. [10] No No No No No
Pedersen et al. [11] No No No No No
Baled et al. [12] No No No No No
Abudour et al. [18] No No No No 5873.90Pc
Hong and Duan [19] 0.949-0.999 0.891-0.999 0.858-0.999 0.747-0.999 1.560Pc
Nazarzadeh and
Moshfeghian [20]
0.953-0.999 0.887-0.999 0.852-0.999 0.738-0.999 1.661Pc
*Note: Pm is the maximum pressure below which there is no crossover in the PV diagram over
the temperature range of [Ttp, 3Tc].
33
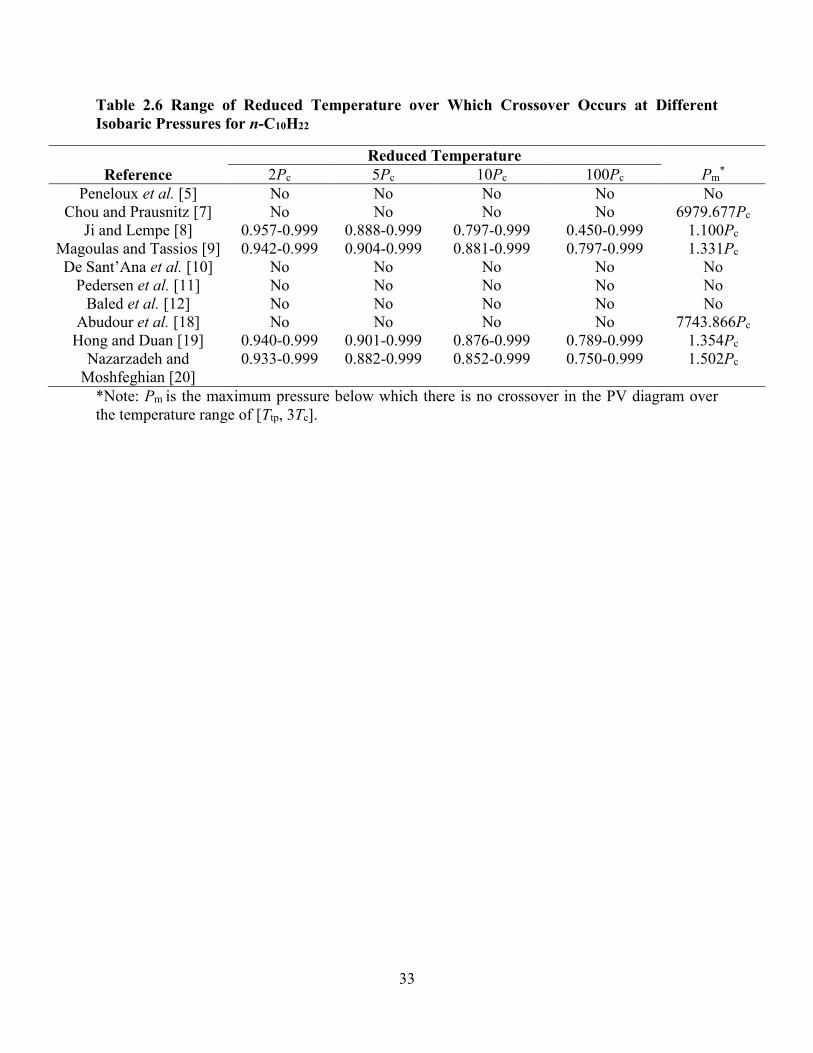
Table 2.6 Range of Reduced Temperature over Which Crossover Occurs at Different
Isobaric Pressures for n-C10H22
Reduced Temperature
Reference 2Pc 5Pc 10Pc 100Pc Pm*
Peneloux et al. [5] No No No No No
Chou and Prausnitz [7] No No No No 6979.677Pc
Ji and Lempe [8] 0.957-0.999 0.888-0.999 0.797-0.999 0.450-0.999 1.100Pc
Magoulas and Tassios [9] 0.942-0.999 0.904-0.999 0.881-0.999 0.797-0.999 1.331Pc
De Sant’Ana et al. [10] No No No No No
Pedersen et al. [11] No No No No No
Baled et al. [12] No No No No No
Abudour et al. [18] No No No No 7743.866Pc
Hong and Duan [19] 0.940-0.999 0.901-0.999 0.876-0.999 0.789-0.999 1.354Pc
Nazarzadeh and
Moshfeghian [20]
0.933-0.999 0.882-0.999 0.852-0.999 0.750-0.999 1.502Pc
*Note: Pm is the maximum pressure below which there is no crossover in the PV diagram over
the temperature range of [Ttp, 3Tc].

34
Fig.2.1 PV diagram for CH4 calculated by SRK EOS
35
Fig.2.2 PV diagram for CH4 calculated by SRK EOS with the temperature-dependent
volume translation proposed by Ji and Lempe

36
Fig.2.3 Schematic showing the nature of crossover of two neighboring isotherms

37
Fig.2.4 Relationship between the first derivative of corrected molar volume with respect to
temperature (D) and reduced temperature (Tr) for the volume translation proposed by De
Sant’Ana et al. [10] for CH4 at different constant pressures of: (a) 2Pc; (b) 5Pc; (c) 10Pc;
and (d) 100Pc

38
Fig.2.5 Relationship between the first derivative of corrected molar volume with respect to
temperature (D) and reduced temperature (Tr) for the volume translation proposed by
Magoulas and Tassios [9] for CH4 at different constant pressures of: (a) 2Pc; (b) 5Pc; (c)
10Pc; and (d) 100Pc

39
Fig.2.6 Relationship between the first derivative of corrected molar volume with respect to
temperature (D) and reduced temperature (Tr) for the volume translation proposed by
Chou and Prausnitz [7] for CH4 at different constant pressures of: (a) 2Pc; (b) 5Pc; (c) 10Pc;
and (d) 100Pc
40
Fig.2.7 3D diagram showing the dependence of D on Tr and Pr for CH4 with the volume
translation proposed by Ji and Lempe [8]

41
Fig.2.8 Relationship between the first derivative of corrected molar volume with respect to
temperature (D) and reduced temperature (Tr) for the volume translation proposed by Ji
and Lempe [8] for CH4 at different constant pressures of: (a) 2Pc; (b) 5Pc; (c) 10Pc; and (d)
100Pc

42
Appendix A. Derivatives of Compressibility Factor With Respect to Temperature for SRK
EOS and PR EOS
SRK equation of state is given by [2],
2
RT aP
V b V bV
(A.1)
Letting,
ZRTV
P (A.2)
2 2 2 2c
P PA a a
R T R T (A.3)
PB b
RT (A.4)
Eq.(A.1) can be written as,
3 2 2 0F Z Z Z A B B AB (A.5)
2 23 2 ( )F
Z Z A B BZ
(A.6)
FZ B
A
(A.7)
(1 2 )F
B Z AB
(A.8)
Since pressure is constant, we can obtain the following equation,
43
0F Z F F A F B
T T Z A T B T
(A.9)
Thus, the first derivative of compressibility factor with respect to temperature for SRK EOS can
be obtained,
F A F B
Z A T B TFT
Z
(A.10)
Also,
2 2 2
c4 4
2T R T T R TAa P
T R T
(A.11)
2
B Pb
T RT
(A.12)
Substituting the above equation into Eq. (A.10), we can obtain,
2 2 2
c4 4 2
2 2
2( ) 2
3 2
T R T T R T bPZ B a P Z BZ A
Z R T RT
T Z Z A B B
(A.13)
PR equation of state can be written as below [1],
3 2 2 2 31 2 3 0F Z B Z A B B Z AB B B (A.14)
2 23 2 (1 ) ( 3 2 )F
Z Z B A B BZ
(A.15)
44
FZ B
A
(A.16)
2 26 2 2 3F
Z BZ Z A B BB
(A.17)
F A F B
Z A T B TFT
Z
(A.18)
2 2 2
c4 4
2T R T T R TAa P
T R T
(A.19)
2
B Pb
T RT
(A.20)
The first derivative of compressibility factor with respect to temperature for PR EOS can be
obtained,
2 2 2
2 2
c4 4 2
2 2
2( ) 6 2 2 3
3 2 2 3 2
T R T T R T bPZ B a P Z BZ Z A B B
Z R T RT
T Z Z ZB A B B
(A.21)

45
Appendix B. Derivatives of the Corrected Molar Volume With Respect to Temperature (D)
Linear Temperature-Dependent Volume Translation. The volume translation with PR EOS
proposed by Baled et al. [12] is given as,
rc T A BT (B.1)
where A and Bare functions of molecular weight, M, and acentric factor, , as shown below,
0 1 3 5
2 4 6
1 1 1, , exp exp expA B f M k k k k
k M k M k M (B.2)
wherek0 through k6 are constants. Thus, the first derivative of this volume translation with respect
to temperaturecan be derived as,
c
c T B
T T (B.3)
Exponential-Type Volume Translation. The volume translation in PR EOS proposed by
Magoulas and Tassios [9] is given as,
PRc0 c c 0 r
c
( ) exp( 1 )RT
c T c Z Z c TP
(B.4)
where the expressions of c0 and are described by,
2 3 4c0 0 1 2 3 4( )
c
RTc k k k k k
P (B.5)
46
0 1l l (B.6)
where k0 through k4 as well as l0 and l1 are correction parameters for PR EOS respectively. In
addition, the alpha function in Eq. (2) is given as,
2 3 4
0 1 2 3 4d d d d d (B.7)
where d0 through d4 are constants.
Thus, the first derivative of this volume translation with respect to temperature can be written as
follows,
when r 1T ,
PRc
c c 0 r
c c
( ) exp 1c T RT
Z Z c TT T P
(B.8)
when r 1T ,
PRc
c c 0 r
c c
( ) exp 1c T RT
Z Z c TT T P
(B.9)
Volume Translation with a Distance Function. The volume translation with PR EOS proposed
by Abudouret al. [18] is given as,
PRc c1 1 c c
c c
0.350.004 exp 2
0.35
RT RTc T c c d Z Z
P P d
(B.10)
47
where c1 is a fluid-dependent parameter (e.g., c1 has a value of 0.00652 for CO2), PR
cZ is the
critical compressibility factor given by PR EOS (0.3074), cZ is the experimental critical
compressibility factor and d is the dimensionless distance function described by,
PR
c T
1 Pd
RT
(B.11)
It should be noted that the alpha function in Eq. (2) is calculated with the following expression
[18],
2C+Dω+Eω
r rexp 1A BT T
(B.12)
where is the acentric factor, A through E are correction parameters. Thus, the first derivative
of this volume translation with respect to temperature can be written as follows,
PR expc c
1 c c 2
p pc c
0.352 0.004 exp 2
0.35
c T RT RTd dc d Z Z
T P T P Td
(B.13)
where the first derivative of d with respect to temperature can be obtained based on the
derivation below. According to the real gas law, d can be written as follows,
2 2
c
c
T T
V P Z Td
ZRTRT ZT P Z
P P
(B.14)
Thus, the first derivative of d with respect to temperature can be obtained,

48
2 2 T
p T
2
P
c
T
2
Z
PZ Z ZZT Z P Z Z T P
T P T T
d
T ZT P Z
P
(B.15)
where the value of p
Z
T
can be assessed according to Eq. (A.21), while the terms of Z
P
and T
Z
P
T
can be obtained based on the following derivations. According to Eq. (A.14),
the first derivative of the compressibility factor with respect to pressure can be obtained as
follows,
2 2
2 2 2 2T
2 6 2 3
3 2 2 3 2
a Z B bRT Z Z ZB A B BZ
P R T Z Z ZB A B B
(B.16)
Subsequently, the first derivative of Z
P
with respect to temperature can be given as,
c
pT
3 3 2 2
2
3 2 2 3 2
Z BZaRT Z B a T RT T R
T TP
T R T Z Z ZB A B B

49
2 2
p p p
2 2 2 2
2 2 6 6 2 6 2 6 2 3
3 2 2 3 2
Z Z Z B A B BbRT Z B Z B bR Z Z ZB A B B
T T T T T T T
R T Z Z ZB A B B
2 2
p
22 2 2 2
2 6 2 3 6 2 2 2 2 6
3 2 2 3 2
Z B Aa Z B bRT Z Z ZB A B B Z B Z B
T T T
R T Z Z ZB A B B
(B.17)
where the first derivative of alpha function with respect to temperature is given by,
2 2
2 2
2 C+Dω+Eω -1 2 C+Dω+Eω
C+Dω+Eω 1+C+Dω+Eωc c c
1A C D E T B C D E TBT
T T T
2C+Dω+Eω
r rexp 1A BT T
(B.18)
50
CHAPTER 3 A GENERALIZED VOLUME TRANSLATION
CORRELATION WITH THERMODYNAMIC CONSISTENCY FOR
MORE ACCURATE LIQUID-DENSITY PREDICTION FOR PURE
COMPONENTS
A version of this chapter will be submitted to Fluid Phase Equilibria.

51
Abstract
For the most nonlinear temperature-dependent volume translation techniques, there is a crossing
of isotherms in the pressure-volume (PV) diagram, which leads to thermodynamic inconsistency
and restricts the range of applications of the volume translated equation of state (EOS). In this
work, a generalized consistent temperature-dependent volume translation model is developed to
achieve more accurate prediction of the liquid densities of pure components. Based on a criterion
we have derived in a prior work, a mathematical constraint is applied when the model parameters
are being regressed to match the measured density data; by adopting this criterion, we ensure that
that no any crossover phenomenon exists for the new volume translation model over a wide
range of pressure and temperature (up to 100 MPa and 1000 K). The model parameters are
determined based on the regression of the density data of 16 compounds. The new volume-
translated PR EOS leads to improved liquid density prediction with an overall 1.42% absolute
average percentage deviation.
Keywords:Volume translation, PR EOS, Thermodynamic consistency, Crossing of isotherms
52
3.1. Introduction
The relationship between the pressure, molar volume and temperature (PVT) for pure fluids or
mixtures is one of most fundamental and important relationships that are used for phase behavior
modeling and thermodynamic computations. Since the appearance of van der Waals equation in
1873, cubic equations of state (CEOS) such as Soave-Redlich-Kwong EOS (SRK EOS) [1] and
Peng-Robinson EOS(PR EOS) [2] have been widely applied in the industry for modeling
compositional and volumetric phase behavior over the past 100 years because of their simplicity
and reliability. Taking methane as an example, however, the predicted molar volume by PR EOS
differs considerably from the experimental value especially near the critical region, as presented
in the Figs.3.1 and 3.2. Fig. 3.1 shows the molar volume residuals (defined as the difference
between the measured molar volume and that calculated by PR EOS) for methane (Pc=4.599
MPa) when the pressure is 3.5 MPa, while Fig.3.2 presents the molar volume residuals for
methane when the pressure is 5 MPa. It should be noted that the practically needed volume shift
is not continuous because of the existence of the saturation pressure when the pressure is lower
than the critical pressure. Likewise, Frey et al. [3] presented a similar overall tendency of molar
volume residuals for propane. It is evident that the existing two-parameter EOSs such as SRK
and PR EOS cannot accurately predict molar volumes, especially near the critical region.
One key reason for the above deficiency in CEOS is due to the inaccurate value of the critical
compressibility factor used in the conventional two-parameter CEOS. It is noted that the critical
compressibility factor ,c CEOSZ is a constant for SRK EOS and PR EOS; the critical
compressibility factors in SRK EOS and PR EOS are 0.3333 and 0.3074, respectively. One
improvement in PR EOS is that it uses a slightly lower critical compressibility factor, which is

53
closer to the experimental values for most hydrocarbons. In practice, however, the actual values
of cZ should vary from one component to another.
To address such limitation of two-parameter EOS, constant volume translations proposed by
Peneloux et al. [4] and Jhaveri and Youngren [5] were introduced into the cubic EOS based on
the justification that the needed correction for molar volume is nearly constant up to a reduced
temperature of 0.75. Recently, Le Guennec et al. [6] presented a constant volume translation
correlation that has been developed based on the experimental saturated-liquid density data at a
reduced temperature of 0.8, which indeed improves the prediction of the volumetric, saturation
and the other thermodynamic properties. However, as shown in Figs. 3.1 and 3.2, the
performance of the constant volume translation models is compromised near the critical region.
Some researchers focus on the development of the temperature-dependent volume translations to
accommodate the effect of the temperature on the molar volume. Generally, for the most
temperature-dependent models, there are three types of mathematical schemes: 1) linear
temperature-dependent volume translations [9-11], 2) exponential-type temperature-dependent
volume translations [12-18], and 3) temperature-dependent volume translations based on
distance functions [17, 19-21]. In terms of the accuracy of density prediction, the exponential-
type models and models with a distance function have a better performance than the linear
temperature-dependent volume shift because these models can fit the overall tendency of the
needed correction in molar volume. It should be noted that some temperature-dependent volume
translation models [7, 8] are developed to improve the density prediction at subcritical conditions,
and cannot be applied to the density prediction at supercritical conditions. Such deficiency limits
the wide application of these models in the industry.

54
In volume translation techniques, however, apart from the prediction accuracy of thermodynamic
properties, thermodynamic consistency is also an important factor to judge if the proposed model
is reliable [22, 23]. For the constant volume translations or linear temperature-dependent volume
translations with a negative coefficient of temperature, there is no any crossing of isotherms in
the PV diagram [23]. Nonetheless, a crossover usually occurs between two isotherms (below
than critical temperature) in the PV diagram at a relatively lower pressure (below than 2 Pc) for
the most nonlinear temperature-dependent volume translations. The crossing of isotherms in the
PV diagram means that the predicted molar volume is lower at a higher temperature under
isobaric conditions, which violates a fundamental assumption of thermodynamics. In addition,
such thermodynamically inconsistent phenomenon leads to negative values of several
thermodynamic properties: isobaric thermal expansivity, speed of sound and heat capacity,
which restricts the application range of the temperature-dependent volume translation models
and makes the proposed models unreliable.
Recently, several authors presented some temperature/pressure-dependent volume translations to
improve the prediction of molar volume considering that different levels of corrections are
needed at different isobaric conditions [24, 25]. These volume translation methods may indeed
provide more accurate density predictions than other constant and temperature-dependent
volume translations. However, it should be noted that these pressure/temperature-dependent
volume translations can lead to the alteration of vapor pressure and phase equilibrium, making
them deviate much from the experimental data. The purpose of this work is to develop an
improved volume translation model that cannot only achieve a higher accuracy in the density
prediction but also avoid the crossing of isotherms over a wide range of temperature and pressure.

55
3.2. Concept of the Volume Translated EOS
To improve the prediction of liquid molar volumes, the following volume translation was
introduced into the original PR EOS [4],
CEOS Correctedc T V V (1)
where c T is the volume translation, CorrectedV is the corrected molar volume, and CEOSV is the
original molar volume calculated by the cubic EOS model. Fig.3.3 shows a sketch illustrating the
impact of a constant or temperature-dependent volume translation on the calculated
pressure/volume isotherms. As shown in Fig. 3.3, after the temperature-dependent volume
translation has been applied, the predicted molar volume is translated along the molar volume
coordinate without causing any changes in the phase equilibrium calculations for each isotherm.
Substituting CEOSV with
CorrectedV in the original PR EOS, the following volume translated PR
EOS can be obtained,
RT a
PV c b V c V c b b V c b
(2)
where
ca a (3)
2 20 c
c a
c
R Ta
p (4)
0 cb
c
RTb
p (5)

56
where P is pressure, T is temperature, V is molar volume, Tc and Pc are critical temperature and
pressure, respectively, R is the universal gas constant, refers to the so-called alpha function,
the constants of the a and b parameters of the above equations, 0
a and 0
b , are 0.45724 and
0.07780, respectively.
3.3. Development of Thermodynamically Consistent Volume Translation Model
3.3.1. Choice of Alpha Function
Based on the van der Waal’s theory, the parameter a is expected to decrease monotonically with
temperature and approach zero at high temperatures [26]. However, for the Soave-type
polynomial alpha function proposed by Peng and Robinson [2], the first derivative of the alpha
function with respect to temperature is not always negative. Taking n-C8H18( 0.399552 ) as
an example, Fig.3.4 shows the variation of the alpha function as a function of temperature. It can
be seen that the alpha function goes through a minimum value at 4.223rT and then increases
with temperature. To address such limitation of the Soave-type alpha function, some exponential
alpha functions [27-30] are proposed by some researchers to ensure that the alpha values are
always positive and decreasing over the entire temperature range.
In 2003, Coquelet et al. [27] argued that an alpha function must satisfy some basic requirements
to have accurate representations of vapor pressures for pure compounds. Recently, Le Guennec
et al. [26] proposed a theoretically-based guideline to derive an alpha function that could: 1)
guarantee consistent calculations of residual molar enthalpy, 2) ensure that the first derivative of
alpha function appears in the mathematical expression of the residual molar enthalpy and entropy,
and 3) ensure that the second derivative of alpha appears in the mathematical expression of the

57
residual heat capacity at a constant volume. Based on these constraints proposed by the above
authors [26, 27], the following requirements should be satisfied for the alpha function: 1) the
value of the alpha function should be equal to 1 at the critical point, 2) a list of mathematical
constraints in terms of the thermodynamic properties should be applied at all temperatures:
2 2
2 2
3
3
0 and continuous
0 and continuous
0 and continuous
0
r r
r r
r
T
d d
dT dT
d d
dT dT
d
dT
(6)
where Tr is reduced temperature. In this work, based on the above sets of constraints, a consistent
alpha function proposed by Le Guennec et al. [6] is chosen to more accurately predict the vapor
pressure and the other thermodynamic properties for pure compounds. The generalized alpha
function is presented as below [6],
2 1 2
2
2
exp 1
0.1760 0.2600 0.8884
0.1290 0.6039 0.0877
M M
r rrT T L T
M
L
(7)
where is acentric factor, the parameters M and L are both acentric factor-dependent
coefficients.

58
3.3.2. Development of a Consistent Volume Translation Model
3.3.2.1. Motivation of Developing a New Volume Translation
Various types of volume translation schemes have been proposed by researchers over the last
three decades. Except constant volume translations and linear temperature-dependent volume
translation with a negative coefficient of temperature, there are crossover phenomena for most of
the other temperature-dependent volume translation methods under a lower isobaric condition
[23].
In a prior work, we proposed a criterion to judge whether the crossover phenomenon exists for a
given volume-translated EOS based on a fundamental rule that the isobaric expansivity for pure
components is positive [23]. The mathematical inequality is shown as below,
Corrected
Pp
0c TV RT Z ZR
DT P T P T
(8)
where D is the first derivative of corrected molar volume with respect to temperature at a
isobaric condition, and Z is the compressibility factor. This criterion can be used to judge if one
given volume translated EOS leads to crossover issues over a temperature range of [Ttp, nTc] and
a pressure range of (0, nPc],
cc cnP
c T RT Z ZR
T nP T nP
, tp c,T T nT (9)
where Ttp is triple point temperature; the derivation of
cnP
Z
T
and c T
T
are included in the
previous work. If we are interested in judging the existence of isotherm crossover over [Ttp, nTc]

59
and (0, nPc], we only need to apply the inequality (9) once at nPc over the temperature range of
[Ttp, nTc]. If the inequality (9) is violated, there will be crossover issue over [Ttp, nTc] and (0, nPc].
It can be clearly seen that the term D consists of two parts: part A is P
RT Z ZR
P T P
(denoted
by D1) and part B is the first derivative of volume translation with respect to temperature. The
term D1 is function of pressure and temperature, and Fig. 3.5 shows the relationship between the
values of term D1 and reduced temperature for methane at three different isobaric conditions, i.e.,
5 MPa, 10 MPa and 20 MPa, respectively. The value of the term D1 generally decreases with an
increasing isobaric pressure, which means that the value of the first derivative of volume
translation with respect to temperature should decrease at the same temperature as the isobaric
pressure increases if the mathematical inequality needs to be satisfied. For the most of the
proposed nonlinear temperature-dependent volume translations, there is a quite large value of the
first derivative of volume translation with respect to temperature when the reduced temperature
is less than 1 and especially close to 1.
In this work, thus, we developed a new generalized temperature-dependent volume translation
model that can simultaneously satisfy the following requirements:
1) The new scheme should fit the overall trend of the needed volume shift and give a more
accurate density prediction than the constant volume translation model;
2) The new scheme should ensure that there is no any crossing of isotherms at a wide range of
pressure and temperature (up to 100 MPa and 1000 K).
60
3.3.2.2. Mathematical Formulation
In order to meet the above requirements, a generalized volume translation model based on the
Gaussian function is proposed as below,
2
2
1exp
2
rPR
r c
Tc T V A C
B
(10)
where PR
cV is the critical molar volume calculated by the PR EOS, and the parameters A, B and C
are specific for each substance. This proposed model is slightly different from the one proposed
by Monnery et al. [8] in that the proposed model is symmetric with respect to Tr=1, while the
Monnery et al. model is symmetric with respect to a component-specific parameter. With a
positive A, it exhibits a symmetric "bell" shape, which can match the overall tendency of the
practically needed volume shift as shown in Figs. 3.1 and 3.2. The coefficients A, B and C
appearing in Eq. (10) are component-dependent parameters, and the determination of these
parameters will be shown later. Another feature of this function is that its first derivative with
respect to temperature approaches zero when the reduced temperature increases close to 1,
resulting in that it is easier for this function to satisfy the inequality (9) than the other nonlinear
temperature-dependent models which normally shows a large and positive slope as the reduced
temperature rises close to 1.
In order to ensure that there no crossover at the given temperature and pressure ranges, a
mathematical constraint is applied,
2
2 2
P
11exp 0
2
rPR rc
c
TTRT Z ZRV A
P T P B T B
(11)
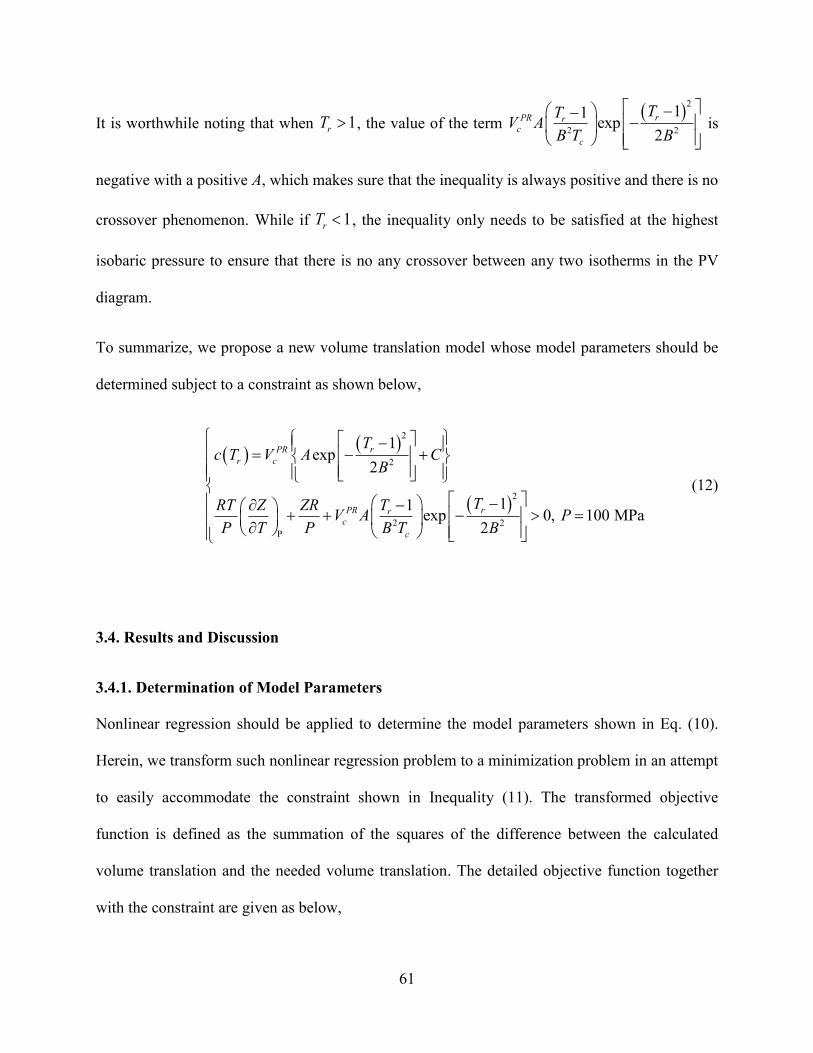
61
It is worthwhile noting that when 1rT , the value of the term
2
2 2
11exp
2
rPR rc
c
TTV A
B T B
is
negative with a positive A, which makes sure that the inequality is always positive and there is no
crossover phenomenon. While if 1rT , the inequality only needs to be satisfied at the highest
isobaric pressure to ensure that there is no any crossover between any two isotherms in the PV
diagram.
To summarize, we propose a new volume translation model whose model parameters should be
determined subject to a constraint as shown below,
2
2
2
2 2
P
1exp
2
11exp 0, 100 MPa
2
rPR
r c
rPR rc
c
Tc T V A C
B
TTRT Z ZRV A P
P T P B T B
(12)
3.4. Results and Discussion
3.4.1. Determination of Model Parameters
Nonlinear regression should be applied to determine the model parameters shown in Eq. (10).
Herein, we transform such nonlinear regression problem to a minimization problem in an attempt
to easily accommodate the constraint shown in Inequality (11). The transformed objective
function is defined as the summation of the squares of the difference between the calculated
volume translation and the needed volume translation. The detailed objective function together
with the constraint are given as below,

62
2
2
2
21
2
1
1
22
Min
1Subject to:
rj
rj
TN
jBPR
j c
T
rjPR Bc j
c
cF x Ae C
V
TV A e D
B T
(13)
where
PR Exp
P,j
, =100 MPa
j j j
j j
j
c V V
RT Z RZD P
P T P
(14)
where j refers to the jth data point, and N is the number of data points considered for a given pure
compound. The experimental density data are retrieved from the NIST database [31]. The
sequential quadratic programming method (SQP) is used to determine the model parameters by
solving the minimization problem. Table 1 shows the physical properties of the pure fluids
considered in this study [31, 32], while Table 2 presents the values of A, B and C determined for
each compound.
In addition, in order to provide a generalized volume translation model for compounds not
included in the database, we attempt to correlate the three parameters A, B and C to the acentric
factors of all the compounds considered. Fig.3.6 presents the comparison between the regressed
and generalized values of A, B and C and it can be clearly seen from Fig.3.6 that a linear
dependence on the acentric factor can be found for each model parameter. The three linear
functions shown below can be used to describe such linear dependence,

63
1 2
3 4
5 6
A K K
B K K
C K K
(15)
Table 3 shows the values of the parameters K1through K6 determined by regression.
3.4.2. Modeling Results for Pure Components
In order to demonstrate the prediction accuracy of the newly proposed volume translation
scheme, we compare it against another four models that do not exhibit thermodynamic
inconsistency: 1) the original PR EOS [2], 2) the Peneloux model for PR EOS [33], 3) the de
Sant’Anaet al. model for PR EOS [9], 4) the Baled et al. model for PR EOS [11]. The average
absolute percentage deviation (AAD%) is calculated to assess the performance of different
models:
cal cal
1 exp
100AAD%
i iN
ii
V V
N V
(17)
where N is the number of data points considered, cal
iV and exp
iV are the calculated molar volume
and experimental molar volume for the ith data point, respectively. Table 4 shows the
comparative results. It can be seen from Table 4 that, overall, our generalized volume translation
model provides the smallest AAD% of 1.42. In comparison, the original PR EOS model [2], the
Peneloux et al. model [33], the de Sant’Ana et al. model [9] and the Baled et al. model [11] give
higher values of the AAD%, i.e., 5.09%, 1.98%, 15.32% and 3.19%, respectively.
Figs.3.7 and 3.8 show a comparison between the needed volume shifts (black dots) at different
constant pressures (0.5Pc, 0.6Pc, 0.7Pc, 0.8Pc, 0.9Pc, 1Pc, 1.5Pc and 2Pc) and the calculated
volume shifts for n-butane and benzene, respectively. Compared with the other three models, it is

64
clearly shown that the proposed model in this work provides a better match with the practically
needed volume shift. The appendix presents the detailed comparisons for the other components.
Figs.3.9 and 3.10 compare the original PR EOS and the PR EOS with the new volume translation
model in terms of their accuracy in predicting the saturated-liquid molar volumes for n-butane
and benzene, respectively. As seen from Figs. 3.9 and 3.10, it is evident that the proposed
scheme can obviously provide an improved prediction of saturated-liquid molar volumes
especially at subcritical temperatures. It is worthwhile mentioning that the performance of the
proposed model can be even further augmented by removing the constraint applied during the
regression, albeit such removal of the constraint will lead to the crossing of isotherms otherwise.
3.5. Conclusions
We develop a generalized temperature-dependent volume translation model for PR EOS in order
to provide more accurate predictions of molar volumes for pure compounds. The new volume
translation model has three parameters that are linearly dependent on the acentric factor of pure
compounds. The proposed model can well capture the trend in the volume translations that are
needed for the liquid-phase density. Notably, the new volume translation model does not bear
crossover issues of the PV isotherms over a wide range of pressure and temperature (up to 100
MPa and 1000K). Compared with the other four models documented in the literature, the new
model gives the smallest error.

65
References
[1] G. Soave, Equilibrium constants from a modified Redlich–Kwong equation of state, Chem.
Eng. Sci. 27 (1972) 1197-1203.
[2] D.Y. Peng, D.B. Robinson, A new two-constant equation of state, Ind. Eng. Chem. Fundam.
15 (1976) 59-64.
[3] K. Frey, C. Augustine, R.P. Ciccolini, S. Paap, M. Modell, J. Tester, Volume translation in
equations of state as a means of accurate property estimation, Fluid Phase Equilibr. 260 (2007)
316-325.
[4] A. Peneloux, E. Rauzy, R. Freze, A consistent correction for Redlich–Kwong–Soave volumes,
Fluid Phase Equilibr. 8 (1982) 7-23.
[5] B.S. Jhaveri, G.K. Youngre, Three-parameter modification of the Peng-Robinson equation of
state to improve volumetric prediction, in: 59th Annual Technical Conference and Exhibition,
Houston, Sept. 16-19, SPE 13118, 1984.
[6] Y. Le Guennec, R. Privat, J.-N. Jaubert, Development of the translated-consistent tc-PR and
tc-RK cubic equations of state for a safe and accurate prediction of volumetric, energetic and
saturation properties of pure compounds in the sub- and supercritical domains, Fluid Phase
Equilibr. 429 (2016) 301-312.
[7] B. Hoyos, Generalized liquid volume shifts for the Peng-Robinson equation of state for C1 to
C8 hydrocarbons, Latin Amer. Appl. Res. 34 (2004) 83-89.
[8] W.D. Monnery, W.Y. Svrcek, M.A. Satyro, Gaussian-like volume shifts for the Peng-
Robinson equation of state, Ind. Eng. Chem. Res.37 (1998) 1663–1672.
66
[9] H.B. de Sant’Ana, P. Ungerer, J.C. de Hemptinne, Evaluation of an improved volume
translation for the prediction of hydrocarbon volumetric properties, Fluid Phase Equilibr. 154
(1999) 193-204.
[10] K.S. Pedersen, J. Milter, H. Sørensen, Cubic equations of state applied to HT/HP and highly
aromatic fluids, SPE J. 9 (2004) 186-192.
[11] H. Baled, R.M. Enick, Y. Wu, M.A. McHugh, W. Burgess, D. Tapriyal, B.D. Morreale,
Prediction of hydrocarbon densities at extreme conditions using volume-translated SRK and PR
equations of state fit to high temperature, high pressure PVT data, Fluid Phase Equilibr. 317
(2012) 65-76.
[12] P. Watson, M. Cascella, D. May, S. Salerno, D. Tassios, Prediction of vapor pressures and
saturated molar volumes with a simple cubic equation of state, 2. The Van der Waals-711 EOS,
Fluid Phase Equilibr. 27 (1986) 35–52.
[13] I. Søreide, Improved phase behavior predictions of petroleum reservoir fluids from a cubic
equation of state, Ph.D. thesis, Norwegian Institute of Technology, 1989.
[14] K. Magoulas, D. Tassios, Thermophysical properties of n-alkanes from C1 to C20 and their
prediction for higher ones, Fluid Phase Equilibr. 56 (1990) 119-140.
[15] L. Hong, Y.Y. Duan, Empirical correction to the Peng–Robinson equation of state for the
saturated region, Fluid Phase Equilibr. 233 (2005) 194-203.
[16] H. Lin, Y.Y. Duan, T. Zhang, Z.M. Huang, Volumetric property improvement for the
Soave-Redlich-Kwong equation of state, Ind. Eng. Chem. Res. 45 (2006) 1829-1839.

67
[17] A.M. Abudour, S.A. Mohammad, R.L. Robinson, K.A.M. Gasem, Volume-translated Peng–
Robinson equation of state for saturated and single-phase liquid densities, Fluid Phase Equilibr.
335 (2012) 74-87.
[18] M. Nazarzadeh, M. Moshfeghian, New volume translated PR equation of state for pure
compounds and gas condensate systems, Fluid Phase Equilibr. 337 (2013) 214-224.
[19] P.M. Mathias, T. Naheiri, E.M. Oh, A density correction for the Peng–Robinson equation of
state, Fluid Phase Equilibr. 47 (1989) 77-87.
[20] G.F. Chou, J.M. Prausnitz, A phenomenological correction to an equation of state for the
critical region, AIChE J. 35 (1989) 1487-1496.
[21] W.R. Ji, D.A. Lempe, Density improvement of the SRK equation of state, Fluid Phase
Equilibr. 130 (1997) 49-63.
[22] O. Pfohl, Letter to the editor: “Evaluation of an improved volume translation for the
prediction of hydrocarbon volumetric properties”, Fluid Phase Equilibr. 163 (1999) 157-159.
[23] J. Shi, H. Li, Criterion for determining crossover phenomenon in volume-translated
equation of states, Fluid Phase Equilibr. 430 (2016) 1-12.
[24] J. Hekayati, A. Roosta, J. Javanmardi, Volumetric properties of supercritical carbon dioxide
from volume-translated and modified Peng-Robinson equations of state, Korean J. Chem. Eng.
33.11 (2016) 3231-3244.
[25] K. Frey, M. Modell, J. Tester, Density-and-temperature-dependent volume translation for
the SRK EOS: 1. Pure fluids, Fluid Phase Equilibr. 279 (2009) 56-63.

68
[26] Y. Le Guennec, S. Lasala, R. Privat, J.-N. Jaubert, A consistency test for alpha functions of
cubic equations of state, Fluid Phase Equilibr. 427 (2016) 513-538.
[27] C. Coquelet, A. Chapoy, D. Richon, Development of a new alpha function for the Peng-
Robinson equation of state: comparative study of alpha function models for pure gases (natural
gas components) and water-gas systems, Int. J. Thermophys. 25 (2004) 133-158.
[28] M.A. Trebble, P.R. Bishnoi, Development of a new four-parameter cubic equation of state,
Fluid Phase Equilibr. 35 (1987) 1-18.
[29] K.A.M. Gasem, W. Gao, Z. Pan, R.L. Robinson, A modified temperature dependence for
the Peng-Robinson equation of state, Fluid Phase Equilibr. 181 (2001) 113-125.
[30] H. Li, D. Yang, Modified α function for the Peng-Robinson equation of state to improve the
vapor pressure prediction of non-hydrocarbon and hydrocarbon compounds, Energy Fuels. 25
(2011) 215-223.
[31] P.J. Linstrom, W.G. Mallard (Eds.), NIST Chemistry WebBook, NIST Standard Reference
Database Number 69, National Institute of Standards and Technology, Gaithersburg, MD, 20899,
http://webbook.nist.gov.
[32] C.F. Spencer, R.P. Danner, Improved equation for prediction of saturated liquid density, J.
Chem. Eng. Data. 17 (1972) 236–241.
[33] J.-N. Jaubert, R. Privat, Y. Le Guennec, L. Coniglio, Note on the properties altered by
application of a Peneloux-type volume translation to an equation of state, Fluid Phase Equilibr.
419 (2016) 88-95.

69
Tables and Figures:
Table 3.1 Physical Properties of Pure Fluids Used in This Study
Components Tc (K) Pc (MPa) cz RAz MW(g/mol)
Carbon dioxide 304.21 7.383 0.274 0.2736 0.223621 44.0095
Oxygen 154.58 5.043 0.2879 0.2909 0.0221798 31.9988
Methane 190.564 4.599 0.286 0.2876 0.0115478 16.0425
Ethane 305.32 4.872 0.279 0.2789 0.099493 30.069
Ethylene 282.34 5.041 0.281 0.281 0.0862484 28.0532
Propane 369.83 4.248 0.276 0.2763 0.152291 44.0956
n-Butane 425.12 3.796 0.274 0.2728 0.200164 58.1222
n-Pentane 469.7 3.37 0.27 0.2685 0.251506 72.1488
n-Hexane 507.6 3.025 0.266 0.2685 0.301261 86.1754
n-Heptane 540.2 2.74 0.261 0.2611 0.349469 100.202
n-Octane 568.7 2.49 0.256 0.2567 0.399552 114.229
n-Nonane 594.6 2.29 0.255 0.2547 0.44346 128.255
n-Decane 617.7 2.11 0.254 0.2503 0.492328 142.282
n-Dodecane 658 1.82 0.251 0.2466 0.576385 170.335
Toluene 591.75 4.108 0.264 0.2646 0.264012 92.1384
Benzene 562.05 4.895 0.268 0.2696 0.2103 78.1118
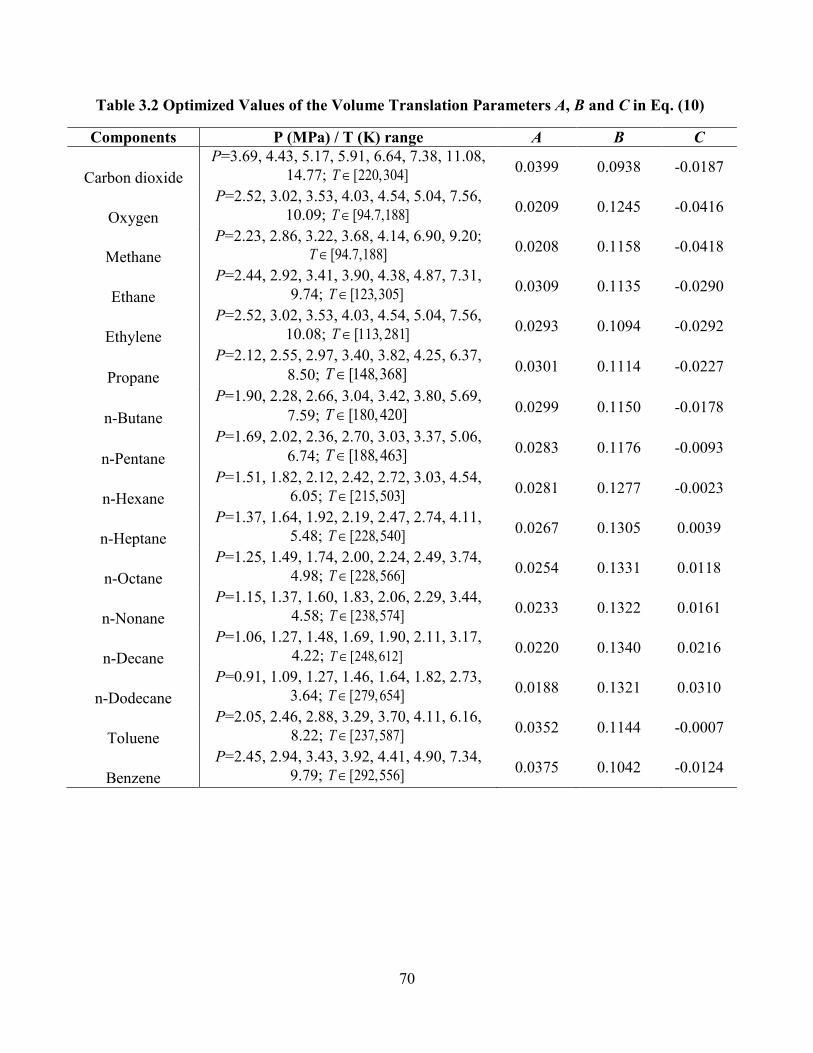
70
Table 3.2 Optimized Values of the Volume Translation Parameters A, B and C in Eq. (10)
Components P (MPa) / T (K) range A B C
Carbon dioxide
P=3.69, 4.43, 5.17, 5.91, 6.64, 7.38, 11.08,
14.77; [220,304]T 0.0399 0.0938 -0.0187
Oxygen
P=2.52, 3.02, 3.53, 4.03, 4.54, 5.04, 7.56,
10.09; [94.7,188]T 0.0209 0.1245 -0.0416
Methane
P=2.23, 2.86, 3.22, 3.68, 4.14, 6.90, 9.20;
[94.7,188]T 0.0208 0.1158 -0.0418
Ethane
P=2.44, 2.92, 3.41, 3.90, 4.38, 4.87, 7.31,
9.74; [123,305]T 0.0309 0.1135 -0.0290
Ethylene
P=2.52, 3.02, 3.53, 4.03, 4.54, 5.04, 7.56,
10.08; [113,281]T 0.0293 0.1094 -0.0292
Propane
P=2.12, 2.55, 2.97, 3.40, 3.82, 4.25, 6.37,
8.50; [148,368]T 0.0301 0.1114 -0.0227
n-Butane
P=1.90, 2.28, 2.66, 3.04, 3.42, 3.80, 5.69,
7.59; [180,420]T 0.0299 0.1150 -0.0178
n-Pentane
P=1.69, 2.02, 2.36, 2.70, 3.03, 3.37, 5.06,
6.74; [188,463]T 0.0283 0.1176 -0.0093
n-Hexane
P=1.51, 1.82, 2.12, 2.42, 2.72, 3.03, 4.54,
6.05; [215,503]T 0.0281 0.1277 -0.0023
n-Heptane
P=1.37, 1.64, 1.92, 2.19, 2.47, 2.74, 4.11,
5.48; [228,540]T 0.0267 0.1305 0.0039
n-Octane
P=1.25, 1.49, 1.74, 2.00, 2.24, 2.49, 3.74,
4.98; [228,566]T 0.0254 0.1331 0.0118
n-Nonane
P=1.15, 1.37, 1.60, 1.83, 2.06, 2.29, 3.44,
4.58; [238,574]T 0.0233 0.1322 0.0161
n-Decane
P=1.06, 1.27, 1.48, 1.69, 1.90, 2.11, 3.17,
4.22; [248,612]T 0.0220 0.1340 0.0216
n-Dodecane
P=0.91, 1.09, 1.27, 1.46, 1.64, 1.82, 2.73,
3.64; [279,654]T 0.0188 0.1321 0.0310
Toluene
P=2.05, 2.46, 2.88, 3.29, 3.70, 4.11, 6.16,
8.22; [237,587]T 0.0352 0.1144 -0.0007
Benzene
P=2.45, 2.94, 3.43, 3.92, 4.41, 4.90, 7.34,
9.79; [292,556]T 0.0375 0.1042 -0.0124

71
Table 3.3 Values of the Parameters Shown in Eq. (15)
Parameters Value
K1 -0.0086
K2 0.0297
K3 0.0421
K4 0.1093
K5 0.1341
K6 -0.0439

72
Table 3.4 Average Absolute Percentage Deviations (%AAD) in Liquid Density Predictions
Provided by the New Volume Translation Model and Other Volume Translation Models
Components %AAD in liquid density
PR
EOS[2]
Peneloux for PR
EOS [33]
De Sant’An et al.
[9]
Baled et al.
[11]
This work
Carbon dioxide 3.22 2.68 31.98 10.58 2.03
Oxygen 9.43 1.48 54.07 5.07 0.92
Methane 8.95 1.52 51.10 1.60 0.64
Ethane 6.57 1.54 26.58 1.59 1.05
Ethylene 6.62 1.47 31.84 2.04 1.08
Propane 5.24 1.57 13.38 1.64 1.15
n-Butane 4.19 1.57 6.66 2.49 1.24
n-Pentane 2.59 1.72 3.80 2.84 1.24
n-Hexane 1.93 3.51 2.68 2.95 1.45
n-Heptane 2.29 2.03 2.47 2.88 1.35
n-Octane 4.22 2.11 2.67 2.87 1.53
n-Nonane 5.38 2.16 2.52 2.69 1.63
n-Decane 6.84 2.11 2.94 3.01 1.95
n-Dodecane 9.27 2.18 4.52 3.33 2.35
Toluene 1.82 2.34 3.26 2.91 2.25
Benzene 2.95 1.76 4.67 2.73 1.19
Overall 5.09 1.98 15.32 3.19 1.42

73
Fig.3.1 The needed volume shift in PR EOS for methane at P=3.5 MPa

74
Fig.3.2 The needed volume shift by PR EOS for methane at P=5 MPa

75
Fig.3.3 A sketch illustrating the impact of a constant or temperature-dependent volume
translation on the calculated pressure/volume isotherms

76
Fig.3.4 The relationship between the soave alpha function [2] and reduced temperature

77
Fig.3.5 The relationship between the value of D1 and reduced temperature at three
different constant pressures (5 MPa, 10 MPa and 20 MPa)

78
Fig.3.6 Plots of model parameters A, B and C in Eq. (10) vs. the acentric factor
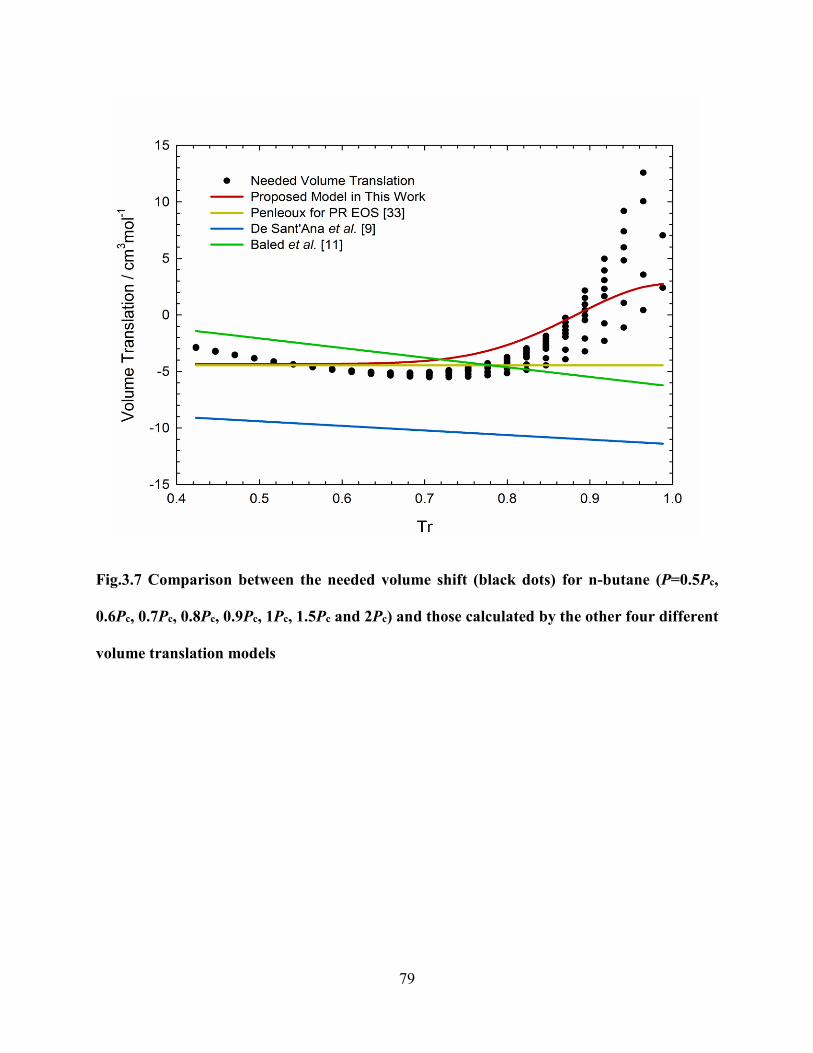
79
Fig.3.7 Comparison between the needed volume shift (black dots) for n-butane (P=0.5Pc,
0.6Pc, 0.7Pc, 0.8Pc, 0.9Pc, 1Pc, 1.5Pc and 2Pc) and those calculated by the other four different
volume translation models
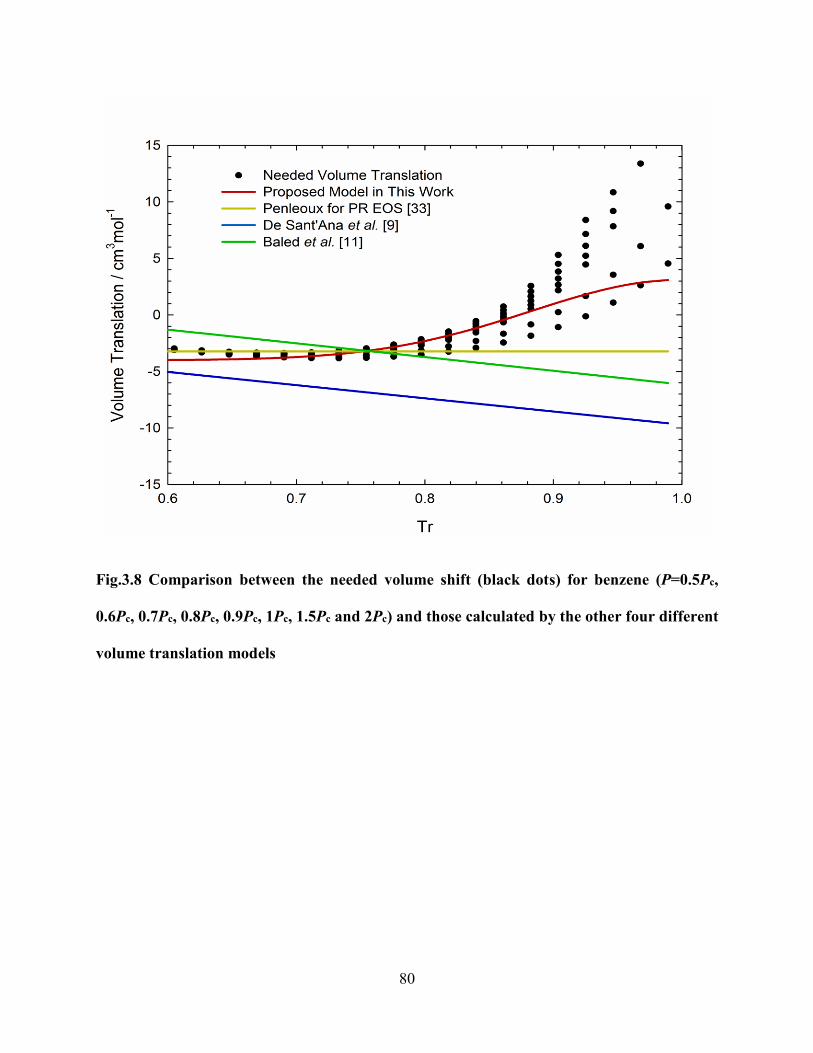
80
Fig.3.8 Comparison between the needed volume shift (black dots) for benzene (P=0.5Pc,
0.6Pc, 0.7Pc, 0.8Pc, 0.9Pc, 1Pc, 1.5Pc and 2Pc) and those calculated by the other four different
volume translation models

81
Fig.3.9 Comparison of the measured saturated molar volumes [31] for n-butane and
calculated ones with different models

82
Fig.3.10 Comparison of the measured saturated molar volumes [31] for benzene and
calculated ones with different models

83
Appendix A:
Fig.3.11 Comparison between the needed volume shift (black dots) for methane (P=0.5Pc,
0.6Pc, 0.7Pc, 0.8Pc, 0.9Pc, 1Pc, 1.5Pc and 2Pc) and those calculated by the other four different
volume translation models
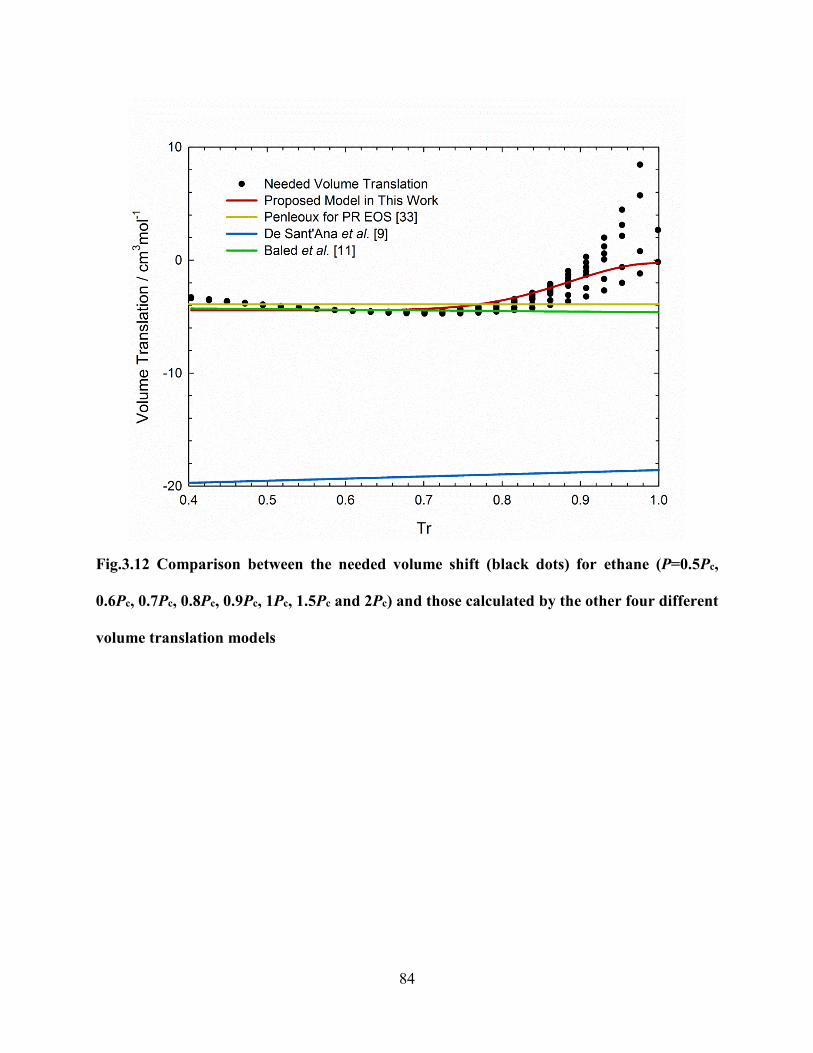
84
Fig.3.12 Comparison between the needed volume shift (black dots) for ethane (P=0.5Pc,
0.6Pc, 0.7Pc, 0.8Pc, 0.9Pc, 1Pc, 1.5Pc and 2Pc) and those calculated by the other four different
volume translation models

85
Fig.3.13 Comparison between the needed volume shift (black dots) for ethylene (P=0.5Pc,
0.6Pc, 0.7Pc, 0.8Pc, 0.9Pc, 1Pc, 1.5Pc and 2Pc) and those calculated by the other four different
volume translation models

86
Fig.3.14 Comparison between the needed volume shift (black dots) for propane (P=0.5Pc,
0.6Pc, 0.7Pc, 0.8Pc, 0.9Pc, 1Pc, 1.5Pc and 2Pc) and those calculated by the other four different
volume translation models

87
Fig.3.15 Comparison between the needed volume shift (black dots) for n-pentane (P=0.5Pc,
0.6Pc, 0.7Pc, 0.8Pc, 0.9Pc, 1Pc, 1.5Pc and 2Pc) and those calculated by the other four different
volume translation models

88
Fig.3.16 Comparison between the needed volume shift (black dots) for n-hexane (P=0.5Pc,
0.6Pc, 0.7Pc, 0.8Pc, 0.9Pc, 1Pc, 1.5Pc and 2Pc) and those calculated by the other four different
volume translation models

89
Fig.3.17 Comparison between the needed volume shift (black dots) for n-heptane (P=0.5Pc,
0.6Pc, 0.7Pc, 0.8Pc, 0.9Pc, 1Pc, 1.5Pc and 2Pc) and those calculated by the other four different
volume translation models

90
Fig.3.18 Comparison between the needed volume shift (black dots) for toluene (P=0.5Pc,
0.6Pc, 0.7Pc, 0.8Pc, 0.9Pc, 1Pc, 1.5Pc and 2Pc) and those calculated by the other four different
volume translation models

91
Fig.3.19 Comparison between the needed volume shift (black dots) for n-octane (P=0.5Pc,
0.6Pc, 0.7Pc, 0.8Pc, 0.9Pc, 1Pc, 1.5Pc and 2Pc) and those calculated by the other four different
volume translation models
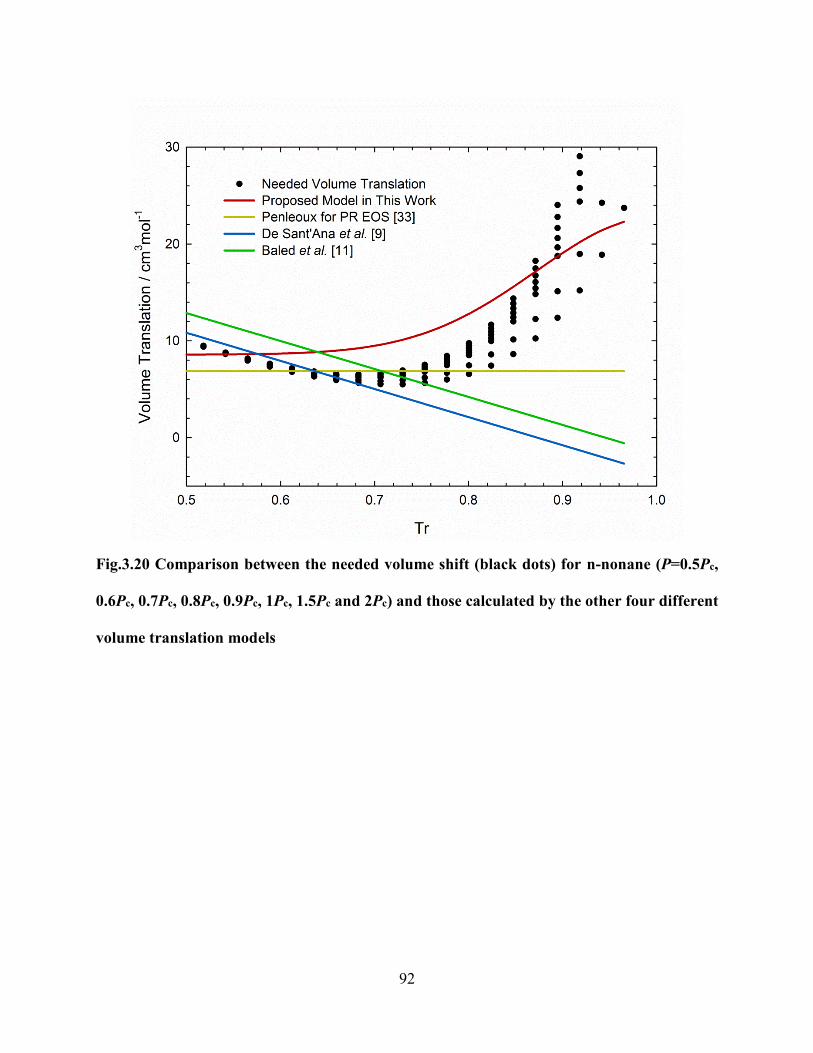
92
Fig.3.20 Comparison between the needed volume shift (black dots) for n-nonane (P=0.5Pc,
0.6Pc, 0.7Pc, 0.8Pc, 0.9Pc, 1Pc, 1.5Pc and 2Pc) and those calculated by the other four different
volume translation models

93
Fig.3.21 Comparison between the needed volume shift (black dots) for n-decane (P=0.5Pc,
0.6Pc, 0.7Pc, 0.8Pc, 0.9Pc, 1Pc, 1.5Pc and 2Pc) and those calculated by the other four different
volume translation models
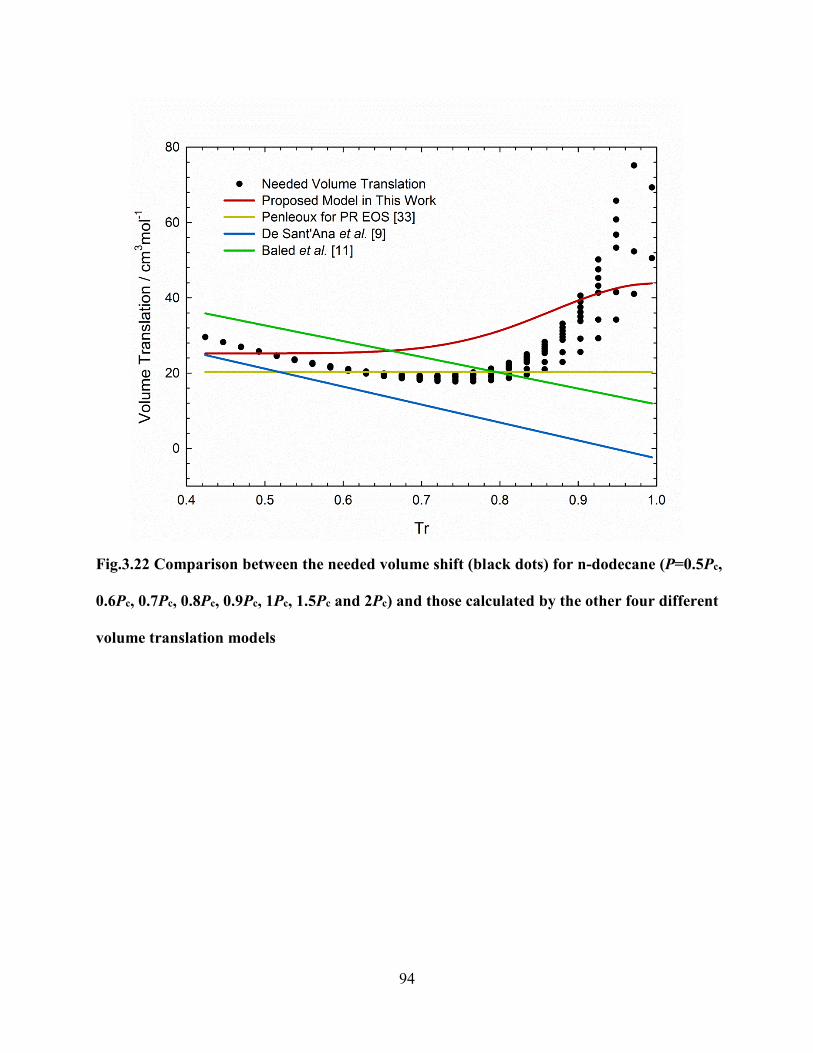
94
Fig.3.22 Comparison between the needed volume shift (black dots) for n-dodecane (P=0.5Pc,
0.6Pc, 0.7Pc, 0.8Pc, 0.9Pc, 1Pc, 1.5Pc and 2Pc) and those calculated by the other four different
volume translation models
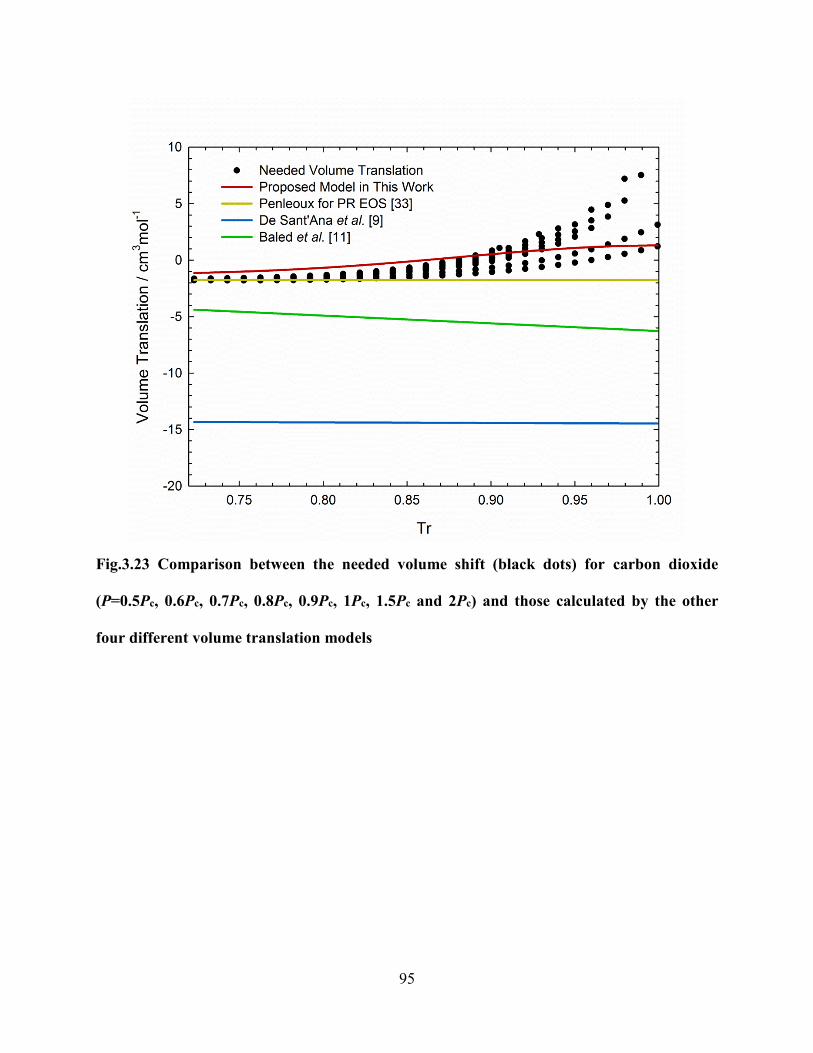
95
Fig.3.23 Comparison between the needed volume shift (black dots) for carbon dioxide
(P=0.5Pc, 0.6Pc, 0.7Pc, 0.8Pc, 0.9Pc, 1Pc, 1.5Pc and 2Pc) and those calculated by the other
four different volume translation models

96
Fig.3.24 Comparison between the needed volume shift (black dots) for oxygen (P=0.5Pc,
0.6Pc, 0.7Pc, 0.8Pc, 0.9Pc, 1Pc, 1.5Pc and 2Pc) and those calculated by the other four different
volume translation models

97
CHAPTER 4 CONCLUSIONS AND RECOMMENDATIONS
4.1. Conclusions
In this study, crossover phenomenon with thermodynamic inconsistency is analyzed based on the
PV diagram for pure component. A criterion is proposed to judge if the crossover phenomenon
exists in various volume translations, and if so, the extent of the temperature and pressure range
over which the crossover phenomenon occurs. The recently proposed volume translations are
evaluated on the basis of the developed criterion. It can be concluded that there is
thermodynamic inconsistency at a lower pressure for most nonlinear temperature-dependent
volume translations, but no any crossover issues exist for the constant volume translations and
linear temperature-dependent volume translations with a negative coefficient of temperature.
In addition, a generalized temperature-dependent volume translation model is proposed for the
PR EOS for the more accurate prediction of molar volume. The method consists of three acentric
factor dependent parameters. On the basis of the criterion of thermodynamic consistency we
have proposed, a constraint is introduced into the nonlinear regression combined with the
proposed volume translation model. The model parameters are determined based on the
regression of the density data of 16 pure compounds. The new volume-translated PR EOS leads
to an improved liquid density prediction with an overall absolute average percentage deviation of
1.42%. Notably, the new volume translation model does not lead to the crossing of pressure-
volume isotherms over a wide range of pressure and temperature (up to 100 MPa and 1000 K).

98
4.2. Recommendations
With the introduction of a mathematical constraint on the basis of the criterion on
thermodynamic consistency, no crossing appears in the PV isotherms calculated by our volume-
translated PR EOS over a wide range of temperature and pressure. However, for the more
complicated mixtures, future work is needed to check if the thermodynamic consistency in terms
of the PVT relations remains valid for mixtures.
Liquid density prediction for pure components is improved by using a generalized volume
translation technique developed in this study. In the future, in combination with the use of proper
mixing rules, the newly proposed volume translated EOS can be extended to the phase behavior
modeling for mixtures, e.g., heavy oil/solvent mixtures, for achieving more accurate density
predictions.

99
BIBLIOGRAPHY
A. Peneloux, E. Rauzy, R. Freze, A consistent correction for Redlich–Kwong–Soave volumes,
Fluid Phase Equilib. 8 (1982) 7-23.
A.M. Abudour, S.A. Mohammad, R.L. Robinson, K.A.M. Gasem, Volume-translated Peng–
Robinson equation of state for saturated and single-phase liquid densities, Fluid Phase Equilib.
335 (2012) 74-87.
B. Hoyos, Generalized liquid volume shifts for the Peng-Robinson equation of state for C1 to C8
hydrocarbons, Latin Amer. Appl. Res. 34 (2004) 83-89.
B.S. Jhaveri, G.K. Youngre, Three-parameter modification of the Peng-Robinson equation of
state to improve volumetric prediction, in: 59th Annual Technical Conference and Exhibition,
Houston, Sept. 16-19, SPE 13118, 1984.
C. Coquelet, A. Chapoy, D. Richon, Development of a new alpha function for the Peng-
Robinson equation of state: comparative study of alpha function models for pure gases (natural
gas components) and water-gas systems, Int. J. Thermophys. 25 (2004) 133-158.
C.F. Spencer, R.P. Danner, Improved equation for prediction of saturated liquid density, J. Chem.
Eng. Data. 17 (1972) 236–241.
D.B. Robinson, D.Y. Peng, The characterization of the heptanes and heavier fractions for the
GPA Peng-Robinson programs, Gas Processors Association (1978).
D.Y. Peng, D.B. Robinson, A new two-constant equation of state, Ind. Eng. Chem. Fundam. 15
(1976) 59-64.

100
É. Clapeyron, Mémoire sur la puissance motrice de la chaleur, J. Gabay (1834).
G. Schmidt, H. Wenzel, A modified van der Waals type equation of state, Chem. Eng. Sci. 35
(1980) 1503-1512.
G. Soave, Equilibrium constants from a modified Redlich–Kwong equation of state, Chem. Eng.
Sci. 27 (1972) 1197-1203.
G.F. Chou, J.M. Prausnitz, A phenomenological correction to an equation of state for the critical
region, AIChE J. 35 (1989) 1487-1496.
H. Baled, R.M. Enick, Y. Wu, M.A. McHugh, W. Burgess, D. Tapriyal, B.D. Morreale,
Prediction of hydrocarbon densities at extreme conditions using volume-translated SRK and PR
equations of state fit to high temperature, high pressure PVT data, Fluid Phase Equilib. 317
(2012) 65-76.
H. Li, D. Yang, Modified α function for the Peng-Robinson equation of state to improve the
vapor pressure prediction of non-hydrocarbon and hydrocarbon compounds, Energy Fuels. 25
(2011) 215-223.
H. Lin, Y.Y. Duan, T. Zhang, Z.M. Huang, Volumetric property improvement for the Soave-
Redlich-Kwong equation of state, Ind. Eng. Chem. Res. 45 (2006) 1829-1839.
H.B. de Sant’Ana, P. Ungerer, J.C. de Hemptinne, Evaluation of an improved volume translation
for the prediction of hydrocarbon volumetric properties, Fluid Phase Equilib. 154 (1999) 193-
204.
I. Søreide, Improved phase behavior predictions of petroleum reservoir fluids from a cubic
equation of state, Ph.D. thesis, Norwegian Institute of Technology, 1989.
101
J.D. Waals, Over de continuiteit van den gas-en vloeistoftoestand, Sijthoff (1873).
J. Hekayati, A. Roosta, J. Javanmardi, Volumetric properties of supercritical carbon dioxide from
volume-translated and modified Peng-Robinson equations of state, Korean J. Chem. Eng. 33.11
(2016) 3231-3244.
J. Shi, H. Li, Criterion for determining crossover phenomenon in volume-translated equation of
states, Fluid Phase Equilibr. 430 (2016) 1-12.
J.J. Martin, Equations of state-Applied thermodynamics symposium, Ind. Eng. Chem. 59 (1967)
34-52.
J.-N. Jaubert, R. Privat, Y. Le Guennec, L. Coniglio, Note on the properties altered by
application of a Peneloux-type volume translation to an equation of state, Fluid Phase Equilibr.
419 (2016) 88-95.
K. Frey, C. Augustine, R.P. Ciccolini, S. Paap, M. Modell, J. Tester, Volume translation in
equations of state as a means of accurate property estimation, Fluid Phase Equilib. 260 (2007)
316-325.
K. Frey, M. Modell, J. Tester, Density-and-temperature-dependent volume translation for the
SRK EOS: 1. Pure fluids, Fluid Phase Equilibr. 279 (2009) 56-63.
K. Magoulas, D. Tassios, Thermophysical properties of n-alkanes from C1 to C20 and their
prediction for higher ones, Fluid Phase Equilib. 56 (1990) 119-140.
K.A.M. Gasem, W. Gao, Z. Pan, R.L. Robinson, A modified temperature dependence for the
Peng-Robinson equation of state, Fluid Phase Equilibr. 181 (2001) 113-125.

102
K.S. Pedersen, J. Milter, H. Sørensen, Cubic equations of state applied to HT/HP and highly
aromatic fluids, SPE J. 9 (2004) 186-192.
L. Hong, Y.Y. Duan, Empirical correction to the Peng–Robinson equation of state for the
saturated region, Fluid Phase Equilib. 233 (2005) 194-203.
L.V. Yelash, T. Kraska, Volume-translated equations of state: Empirical approach and physical
relevance, AIChE J. 49 (2003) 1569-1579.
M. Nazarzadeh, M. Moshfeghian, New volume translated PR equation of state for pure
compounds and gas condensate systems, Fluid Phase Equilibr. 337 (2013) 214-224.
M.A. Trebble, P.R. Bishnoi, Development of a new four-parameter cubic equation of state, Fluid
Phase Equilibr. 35 (1987) 1-18.
O. Pfohl, Letter to the editor: “Evaluation of an improved volume translation for the prediction
of hydrocarbon volumetric properties”, Fluid Phase Equilib. 163 (1999) 157-159.
O. Redlich, J.N. Kwong, On the thermodynamics of solutions. V. An equation of state.
Fugacities of gaseous solutions, Chemical Reviews. 44 (1949) 233-244.
P. Watson, M. Cascella, D. May, S. Salerno, D. Tassios, Prediction of vapor pressures and
saturated molar volumes with a simple cubic equation of state, 2. The Van der Waals-711 EOS,
Fluid Phase Equilibr. 27 (1986) 35–52.
P.H. Salim, M.A. Trebble, A modified Trebble-Bishnoi equation of state: thermodynamic
consistency revisited, Fluid Phase Equilib. 65 (1991) 59-71.

103
P.J. Linstrom, W.G. Mallard (Eds.), NIST Chemistry WebBook, NIST Standard Reference
Database Number 69, National Institute of Standards and Technology, Gaithersburg, MD, 20899,
http://webbook.nist.gov.
P.M. Mathias, T. Naheiri, E.M. Oh, A density correction for the Peng–Robinson equation of state,
Fluid Phase Equilib. 47 (1989) 77-87.
T. Ahmed, Equations of state and PVT analysis, Elsevier (2013).
T.A. Mary, J.S.O. Evans, T. Vogt, A.W. Sleight, Negative thermal expansion from 0.3 to 1050
Kelvin in ZrW2O8, Science. 272 (1996) 90.
W.D. Monnery, W.Y. Svrcek, M.A. Satyro, Gaussian-like volume shifts for the Peng-Robinson
equation of state, Ind. Eng. Chem. Res.37 (1998) 1663–1672.
W.R. Ji, D.A. Lempe, Density improvement of the SRK equation of state, Fluid Phase Equilib.
130 (1997) 49-63.
Y. Le Guennec, R. Privat, J.-N. Jaubert, Development of the translated-consistent tc-PR and tc-
RK cubic equations of state for a safe and accurate prediction of volumetric, energetic and
saturation properties of pure compounds in the sub- and supercritical domains, Fluid Phase
Equilibr. 429 (2016) 301-312.
Y. Le Guennec, S. Lasala, R. Privat, J.-N. Jaubert, A consistency test for alpha functions of cubic
equations of state, Fluid Phase Equilibr. 427 (2016) 513-538.


