DEVELOPMENT OF A SMART TEMPERATURE REGULATOR FOR ...
74
Tallinn 2019 TALLINN UNIVERSITY OF TECHNOLOGY School of Information Technologies Henri Sink 178144IVEM DEVELOPMENT OF A SMART TEMPERATURE REGULATOR FOR ISOTHERMAL DNA AMPLIFICATION LAB- ON-A-CHIP SYSTEMS Master’s thesis Supervisor: Tamás Pardy PhD
Transcript of DEVELOPMENT OF A SMART TEMPERATURE REGULATOR FOR ...

Tallinn 2019
TALLINN UNIVERSITY OF TECHNOLOGY
School of Information Technologies
Henri Sink 178144IVEM
DEVELOPMENT OF A SMART
TEMPERATURE REGULATOR FOR
ISOTHERMAL DNA AMPLIFICATION LAB-
ON-A-CHIP SYSTEMS
Master’s thesis
Supervisor: Tamás Pardy
PhD

Tallinn 2019
TALLINNA TEHNIKAÜLIKOOL
Infotehnoloogia teaduskond
Henri Sink 178144IVEM
TARGA TERMOSTAADI ARENDUS
ISOTERMILISE DNA AMPLIFIKATSIOONI
LABOR KIIBIL SÜSTEEMIDELE
Magistritöö
Juhendaja: Tamás Pardy
PhD

3
Author’s declaration of originality
I hereby certify that I am the sole author of this thesis. All the used materials, references
to the literature and the work of others have been referred to. This thesis has not been
presented for examination anywhere else.
Author: Henri Sink
06.05.2019

4
Abstract
Nucleic acid amplification testing provides a method for detecting infectious diseases
through the genetic material, rather than antigens or antibodies, allowing an early
diagnosis. Currently, the gold standard method for nucleic acid testing is PCR, which is
typically used in a clinical laboratory with complex and expensive equipment. When rapid
answers are required or access to a suitable facility is not available, Point of Care testing
is needed. Thus, exists a need for portable, low cost devices capable of performing such
analysis. Isothermal nucleic acid amplification testing on the other hand, allows to do the
same analysis with simplified devices, in the field, without having to compromise
specificity or sensitivity.
In this work, a wireless smart temperature controller for microfluidic lab-on-a-chip
cartridges was developed, capable of fulfilling the temperature requirements of a wide
range of isothermal amplification protocols. The thesis covers the design and
implementation of a proof-of-concept prototype, validation of the device with both
experimental and simulated thermal analysis and offers an optimized solution for the
electronics design for the device. The results of the thermal analysis performed on the
prototype show a maximum SSE of 0.7 ºC, for 12 distinct isothermal amplification
protocols, with over 85% of the reaction liquid in range for each – proving the thermostat
viable as a universal lab-on-a-chip isothermal NAAT temperature regulator.
This thesis is written in English and is 74 pages long, including 6 chapters, 31 figures and
9 tables.

5
Annotatsioon
TARGA TERMOSTAADI ARENDUS ISOTERMILISE DNA
AMPLIFIKATSIOONI LABOR KIIBIL SÜSTEEMIDELE
Nukleiinhappe amplifikatsiooni meetodil testimine võimaldab avastada varases
staadiumis nakkushaigusi läbi geneetilise materjali analüüsimise, erinevalt klassikalisest
autoimmuunodiagnostikast antikehade ja antigeenide kaudu. Hetkel on nukleiinhappe
testi meetodite kuldne standard PCR – polümeraasi ahelreaktsioon, mis on praktikas
rakendatav vaid laborikeskkonnas, kasutades suhteliselt keerulisi, suuremahulisi ja
kalleid seadmeid. Kui on vajadus kiireks diagnoosimiseks või ligipääs vastava
võimekusega asutusse on piiratud või lausa puudulik, on vajadus patsiendi
lähiuuringuteks (POCT), mille eelduseks on portatiivsed, odavad, kasutajasõbralikud
seadmed, mis on võimelised taolist analüüsi läbi viima. Nukleiinhappe amplifikatsiooni
isotermilistel meetoditel on võimalik teostada lihtsamate, kompaktsemate seadmetega,
laborist eemal, ilma kompromisse toomata nii spetsiifilisuses ega tundlikkuses.
Antud töös arendati juhtmevaba tark temperatuuriregulaator kasutamiseks labor-kiibil
mikrofluiidiliste kassettidega, mis on võimeline täitma laia ulatuse isotermiliste
amplifikatsiooni protokollide temperatuurivajadusi. Lõputöö kirjeldab idee tõendamiseks
loodud prototüübi disainimist ja rakendamist, seadme valideerimist nii eksperimentaalse
kui ka simuleeritud termilist analüüsi ja pakub välja optimeeritud lahenduse seadme
elektroonikale. Prototüübil teostatud termilise analüüsi tulemused näitavad, et
maksimaalne püsiviga 12 distinktiivse isotermilise protokolli jaoks oli 0.7 ºC ning enam
kui 85% reaktsioonisegust oli lubatud temperatuurivahemikus – tõestades, et loodud
seade on rakendatav kui universaalne isotermilise nukleiinhappe amplifikatsiooni
temperatuuriregulaator.
Lõputöö on kirjutatud inglise keeles ning sisaldab teksti 74 leheküljel, 6 peatükki, 31
joonist, 9 tabelit.
6
List of abbreviations and terms
µTAS Micro total analysis systems
ABS Acrylonitrile butadiene styrene
ADC Analog-digital converter
ASCII American Standard Code for Information Interchange
CAD Computer assisted design
CPU Central processing unit
DC Direct current
DLP Digital light projection
DMM Digital multimeter
DNA Deoxyribonucleic acid
DTR Data terminal ready
EDA Electronic design automation
EPO European patent office
FCC Federal Communications Commission
FDM Fused deposition modelling
GPIO General-purpose input-output
GUI Graphical user interface
HVAC Heating, ventilation and air conditioning
I2C Inter-Integrated circuit
IC Integrated circuit
IDE Integrated development environment
IO Input-output
JST Japan solderless terminal
LDO Low dropout regulator
LED Light-emitting diode
LOC Lab-on-a-chip
LPF Low-pass filter
MCU Microcontroller unit

7
MEMS Microelectromechanical systems
MIT Massachusetts Institute of Technology
MOSFET Metal-oxide semiconductor field effect transistor
MS Microsoft
NAAT Nucleic acid amplification testing
NI National Instruments
NMOS N-type Metal-Oxide semiconductor
OLED Organic light-emitting diode
PC Personal computer
PCB Printed circuit board
PCR Polymerase chain reaction
PGA Programmable gain amplifier
PID Proportional-Integral-Derivative
POC Point-of-care
PON Point-of-need
PWM Pulse-width modulation
RAM Random-access memory
RC Resistor-Capacitor
Rds(on) On-state drain-to-source resistance
RGB Red-green-blue
RSC The Royal Society of Chemistry
RTOS Real-time operating system
RTS Request to send
RxD Receive data
SCPI Standard Commands for Programmable Instruments
SMD Surface-mount device
SoC System on chip
SRS Stanford Research Systems Inc
SSE Steady-state error
STEP Standard for the Exchange of Product Data
TEC Thermoelectric converter
TUT Tallinn University of Technology
TxD Transmit data
UART Universal asynchronous receiver-transmitter

8
UI User interface
USB Universal serial bus
USPTO United States Patent and Trademark Office
Vcc Common collector voltage (positive supply voltage)
Vdd Common drain voltage (positive supply voltage)
VI Virtual Instrument (National Instruments Labview)

9
Table of contents
1 Introduction ................................................................................................................. 13
2 State of the art overview .............................................................................................. 16
2.1 Smart thermostats for Lab-on-a-Chip ................................................................... 16
2.2 Isothermal nucleic acid amplification testing (NAAT) ........................................ 17
2.3 Electrical heating elements ................................................................................... 20
2.4 Power supply options............................................................................................ 23
3 Materials and methods ................................................................................................. 27
3.1 Thermostat prototype design ................................................................................ 27
3.1.1 Requirements ................................................................................................. 27
3.1.2 Electronics Design ......................................................................................... 27
3.1.3 Microfluidic chip design ................................................................................ 35
3.1.4 Prototype enclosure and chip holder ............................................................. 37
3.1.5 Software, communication and user interface ................................................ 39
3.2 Evaluation methodology for thermostat prototype ............................................... 45
3.2.1 Experimental setup for thermal analysis ....................................................... 45
3.2.2 Model for simulated thermal analysis ........................................................... 46
4 Results and discussion ................................................................................................. 49
4.1 Experimental thermal analysis .............................................................................. 49
4.1.1 Initial characterization ................................................................................... 49
4.1.2 Steady-state thermal analysis ........................................................................ 51
4.1.3 Stress test and battery lifetime estimation ..................................................... 53
4.2 Simulated thermal analysis ................................................................................... 55
5 Improved electronics design ........................................................................................ 59
6 Summary and conclusions ........................................................................................... 68
References ...................................................................................................................... 71

10
List of figures
Figure 1. Market share of microfluidic-based point-of-care testing devices on the market
of PoC testing from 2014 to 2021 (forecast) in billions USD [4] .................................. 14
Figure 2. Peltier element construction [13] .................................................................... 20
Figure 3. Etched foil heater construction [14] ................................................................ 22
Figure 4. Heating element PCB layout ........................................................................... 29
Figure 5. Finished heating element ................................................................................ 29
Figure 6. Wemos TTGO MINI32 V2.0 development board[20] ................................... 30
Figure 7. Heater MOSFET and current shunt schematic................................................ 32
Figure 8. Thermistor electronic interface schematic ...................................................... 33
Figure 9. Photo of prototype electronics layout (top side), peripheral board on the left,
controller board in the middle and user interface board on the right. ............................ 34
Figure 10. Envisiontec Perfactory 4 DLP 3D printer ..................................................... 35
Figure 11. Microfluidic chip design and dimensions ..................................................... 36
Figure 12. Photo of designed microfluidic chip, 3D printed on Envisiontec Perfactory 4,
with a hole in the centre of the reaction chamber for a temperature sensor ................... 37
Figure 13. Prototype enclosure with first iteration chip holder ...................................... 38
Figure 14. Prototype enclosure design with revised chip holder .................................... 38
Figure 15. SRS thermistor calculator, used for Steinhart-Hart coefficients calculation
and comparison to the Beta-model [28] ......................................................................... 44
Figure 16. Photo of the prototype used for experimental thermal analysis, showing the
thermostat with the special microfluidic chip with an embedded thermistor ................. 45
Figure 17. Section view of the simplified 3D geometry for finite element modeling .... 47
Figure 18. Graph showing results of the initial test. T_Chip values were the
temperatures in the microreactor, T_Heater were the heater surface temperatures.
T_Setpoint marks the set point. ...................................................................................... 49
Figure 19. Photo of the temperature sensor bonding methods to the chip, left photo
shows the thermoplastic elastomer disfigured after initial tests because of melting, the
photo on the right shows the epoxied solution used in all the other tests....................... 50

11
Figure 20. Temperature transients with setpoints of 35-65 °C at 25 °C ambient
temperature in climate chamber. T_Chip values were the temperatures in the
microreactor, T_Heater were the heater surface temperatures. ...................................... 52
Figure 21. Thermostat thermal transients at ambient temperatures of 20 °C and 30 °C
with 3 transients for each temperature T_Chip values were the temperatures in the
microreactor, T_Heater were the heater surface temperatures. ...................................... 53
Figure 22. Graph showing battery life test data. T_Chip marks the temperature in the
microreactor, T_Heater marks the heater surface temperatures. U_Bat marks the battery
voltage. The battery voltage graph has been smoothed for better readability ................ 55
Figure 23. Temperature distribution of the simulation (left) and the IR thermal image
(right) with their corresponding temperature legends. ................................................... 56
Figure 24. Battery charging circuit for optimized design ............................................... 59
Figure 25. Over discharge protection for optimized design ........................................... 60
Figure 26. USB connection and USB-Serial interface for the optimized device ........... 62
Figure 27. Heater control MOSFET and current sense shunt for optimized device ...... 63
Figure 28. External ADC circuitry for the optimized device ......................................... 64
Figure 29. MCU and UI schematic for optimized design............................................... 65
Figure 30. 3D rendering of the PCB for the optimized design ....................................... 66
Figure 31. Conceptual model rendering of a section of the enclosure and user interface
for the imroved electronics design. The grey block under the circuit board represents a
Turnigy 4200 mAh LiFePO4 battery for size reference. ................................................ 67

12
List of tables
Table 1. Isothermal NAAT protocols with their temperature and duration requirements
[12] ................................................................................................................................. 19
Table 2. Summary table of applicable 20 mm x 20 mm heating element technology
options ............................................................................................................................ 23
Table 3. Battery chemistry comparison [15] .................................................................. 24
Table 4. Comparison of viable power supply options .................................................... 26
Table 5. Summary of requirements ................................................................................ 27
Table 6. Summary of material properties used in the simulation model ........................ 47
Table 7. Boundary conditions and initial parameter values used in the simulation model
........................................................................................................................................ 48
Table 8. Steady-state thermal analysis results for various isothermal nucleic acid
amplification test protocols [5] ....................................................................................... 52
Table 9. Summary of simulated thermal analysis for various nucleic acid amplification
test (NAAT) protocols [5] .............................................................................................. 58

13
1 Introduction
The potential of very small machines was appreciated already before the technology to
produce them was invented. Soon after the invention of microtechnology, it became
apparent that this technology could be used for more than just electronic integrated
circuits – pressure sensors, airbag sensors and other mechanically movable structures
were developed onto the chip, evolving the integrated circuits into MEMS
(microelectromechanical systems) [1]. Not long after, fluid channels, mixers, valves,
pumps and other fluid handling laboratory devices were integrated into the chip – the start
of the lab-on-a-chip (LOC) technology and µTAS (micro total analysis systems) [2],[3].
LOC technology offers control over fluid volumes down to femtoliter scale, producing
less waste and requiring less reagents and sample, lowering the cost and duration of the
analysis. The compact nature of the technology allows for portable, hand-held analysis
devices with cost-effective disposable chips – making it possible to do point-of-care
medical testing, as well as real-time detection of hazardous chemicals, biological
weapons, explosives. As soon as the benefits of lab-on-a-chip devices were realized, the
market for these devices started growing exponentially and has been following a rising
trend ever since. According to market research performed by Yole Developpement, the
microfluidic industry is structured for further growth, several companies have diversified
their activities and have launched growth operations and promising new technologies and
applications suggest a bright future for microfluidics. [4]
Point-of-care testing is defined as medical diagnostic testing at or near the point of care,
in contrast to the typical pattern of sending the samples away from the patients to a
medical laboratory and waiting to learn the results, maybe for days, postponing the
treatment. Isothermal DNA amplification protocols allow the detection of bacterial and
viral infections, foodborne pathogens etc. in the field, with a specificity and sensitivity
comparable to clinical laboratories, giving the results rapidly and precisely. The
instrumentation for isothermal nucleic acid amplification can be made more efficient and
simpler, and therefore more usable in portable field-operated devices, than for example
PCR, which requires thermal cycling [5]. The market share of microfluidics for point-of-
care testing is growing and will continue to do so, as can be seen on the Yole
Developpement’s graph below, on Figure 1.

14
Figure 1. Market share of microfluidic-based point-of-care testing devices on the market of PoC testing
from 2014 to 2021 (forecast) in billions USD [4]
Precise temperature control is a key part of isothermal DNA amplification, and portability
is essential to allow point-of-care testing, therefore there is a need for a portable
temperature regulator, where the price and ease-of-use allow the device to be available to
the general public.
The goal of this thesis is to develop a LOC temperature regulator (thermostat, heating,
insulation and microfluidic chip interface) that is possible to control and monitor via
Bluetooth and/or Wi-Fi from a typical smartphone or tablet via an app. The app should
have the option to pre-program heating profiles (time, temperature) and then when started,
the thermostat should run by itself and signal to the user when it’s ready. The goal would
be a universal device with ease-of-use in mind at a price point which would make it
available to a wider audience.

15
In this thesis, a LOC temperature regulator prototype will be designed, tested and
validated. The prototype will include heating, insulation, thermal interface, chip holder
for microfluidic chips and electronics for control and communication. The prototype
demonstration will include an example microfluidic chip for demonstration. The thermal
system will be laid out, optimized and verified experimentally and via simulation. In the
end, an optimized solution will be provided from the performed analysis.

16
2 State of the art overview
2.1 Smart thermostats for Lab-on-a-Chip
In order to research the state of the art, a search was performed in a number of databases,
e.g. IEEE Xplore, Scopus, Researchgate, PubMed, RSC. Patent databases, such as, EPO
Espacenet, USPTO, Google Patents and were checked. Also, Google Scholar was used
as a starting point, as it includes most of the beforementioned databases. The keywords
used for the search were the ones mentioned before as the topic keywords, in different
combinations, mostly ’temperature control’, ’microfluidic’, ’lab-on-a-chip’, ’thermostat’,
’heating’. A series of articles regarding temperature control in microfluidic chips were
found, including an overview of heating solutions [6]. However most of the articles found
are regarding application-specific solutions [7], with complicated (and expensive)
manufacturing processes [8], or with external equipment working from the grid with non-
limited power, making them non-applicable in a portable, battery powered design with
disposable chips. Two articles were found, that use the most applicable approach for the
regulator to be developed. First of which, „All-plastic, low-power, disposable,
continuous-flow PCR chip with integrated microheaters for rapid DNA amplification“ by
Moschou, D. et al. [9], shows a complicated chip design, but also uses resistive heaters
and a microcontroller to control the temperature, however, the computations are done on
a PC instead of the microcontroller and it uses mains power and lacks a modern user
interface. It is more of a non-commercial, practical aid, not the main emphasis of their
article. The second article that stood out was „Finite Element Modelling for the
Optimization of Microheating in Disposable Molecular Diagnostics“ [10], a part of T.
Pardy’s doctoral thesis, „Microheating Solution for Molecular Diagnostics Devices“ [11],
a good source of information about the state of the art in this field, since his thesis also
considers possible temperature control solutions for lab-on-a-chip devices, including an
Arduino based mini-thermostat used in the beforementioned article – a battery powered
device, capable of controlling a resistive heater through pulse-width modulation (PWM).
This heating solution could be a good starting point for this development. So-called
„smart thermostats“ are available for HVAC systems, for homes and offices, etc. They
are meant for mains voltage heating devices and are incompatible with LoC device

17
requirements. In conclusion, no solutions were found, that could fill the requirements of
the proposed thermostat.
2.2 Isothermal nucleic acid amplification testing (NAAT)
The aim of nucleic acid amplification is usually to study or detect individual genes or
specific DNA regions of interest. In order to do so, it is often more useful and simpler to
generate multiple copies of a target, to obtain a large quantity of nucleic acid to study, or
to detect more easily. This can be done through in vitro amplification methods, which
selectively amplify nucleic acids with a certain sequence. For detection – if the detection
target is in the analyzed sample, it will be amplified, if not, there is nothing to amplify.
The golden standard method for nucleic acid amplification is polymerase chain reaction
(PCR). PCR uses thermal cycling, which exposes the reactants to repeated cycles of
heating and cooling to go through the different temperature-dependent reactions that are
involved. The method uses two types of reagents – primers and a polymerase, where
primers are short single strand DNA fragments that have a complimentary sequence to
the target DNA) and the polymerase is an enzyme that is used for synthesis of new DNA.
In PCR the DNA strands are separated at high temperature, through DNA melting, then
the temperature is lowered so the primers can bind to the complementary sequences of
DNA, after which the polymerase can start assembling a new DNA strand. Through the
cycles, this firstly generated DNA „template“ is itself used for replication, causing an
exponential amplification.
Isothermal NAAT methods usually use different reagents to PCR. For example, loop-
mediated isothermal amplification utilizes two sets of specially designed primers together
with a DNA polymerase, that has strand displacement activity. This way, the high
temperature of DNA melting can be avoided and the procedure is run at a single
temperature.
These methods have been proved to have similar sensitivity, selectivity and throughput
as the golden standard of PCR. For miniaturized analysis systems, isothermal
amplification methods allow for a simplified device and a much more efficient testing
from the point of energy consumption, allowing for portable, low cost analysis devices.

18
The requirement for isothermal NAAT methods to be successful is precise temperature
control during a specified time. These methods have a small temperature region, where
the procedure will be successful. Going out of the temperature threshold will affect the
throughput, but can also cause transcription faults, where the generated DNA is not
actually the target DNA or even cause damage to the polymerase. The polymerase is an
enzyme (a protein), so usually increasing temperature increases activity, however going
over a critical temperature will cause denaturation. For a simple analogy, one might
consider an egg white – when it gets cooked it changes the structure of the protein,
changing its properties.
The proposed device would be universal to most isothermal NAAT protocols. A list of
protocols with the temperature and time requirements are given in Table 1. It should be
noted, that while the target range for some methods may be given as quite a wide range,
in reality, it depends on the exact reagents used, and usually ±1 ºC of a certain temperature
is the practical tolerance given for best results [11].

19
Table 1. Isothermal NAAT protocols with their temperature and duration requirements [12]
Method Full Name Target range
[°C]
Reaction duration
[min]
RCA Rolling Circle Amplification 30–65 60
RAM Ramification amplification method 35 120-180
SDA Strand displacement amplification 37 120
RPA Recombinase Polymerase Amplification 37–42 20
BAD
AMP
Beacon-assisted detection amplification 40 40
SMART Signal-mediated amplification of RNA
technology
41 180
NASBA Nucleic Acid Sequence Based
Amplification
41 105
SPIA Single primer isothermal amplification 45–50 240
EXPAR Exponential amplification reaction 55 10-20
NEAR Nicking Enzyme Amplification Reaction 55–59 10
TMA Transcription-mediated amplification 60 140
ICA Isothermal chain amplification 60 60
PG-RCA Primer-generation Rolling Circle
Amplification
60 60-120
LAMP Loop mediated isothermal amplification 60–65 60-90
HDA Helicase dependent amplification 64 75-90
CPA Cross-priming amplification 65 60
NEMA Nicking endonuclease-mediated
isothermal amplification
65 30
A range of 20-70 °C was proposed as a requirement to the developable thermostat,
covering all of the NAAT protocols given in Table 1, with a certain tolerance for higher
or lower temperature setpoints as well.

20
2.3 Electrical heating elements
The heating element is the primary component of a heating regulator. The heating
methods usable for lab-on-a-chip devices include pre-heated liquids, Joule heating,
microwaves, chemical reactions [6] and Peltier effect. In this thesis, only electrical heat
sources are considered, because these are most easily and efficiently controlled by digital
electronics. They are also the most viable options for a compact, reusable heat source.
The patent search revealed no smart portable temperature control solutions for lab-on-a-
chip devices. Some patents related to microfluidic temperature control were found,
however they describe methods and devices not relevant to this topic.
Table 2 summarizes commercially available heating element options based on well-
known International suppliers (Europe: Farnell, Mouser, RS Online, China: Alibaba).
Below the heating element technology options are described in detail.
Peltier elements
Most electrical heat sources rely on Joule heating, more commonly known as resistive
heating, in which passing a current through a conductor produces heat. The other
commonly known electrical heating phenomena is the Peltier effect – where a current
flowing through a junction of two conductors, heat may be generated or removed at the
junction. A typical Peltier heat pump involves multiple junctions in series, through which
a current is driven. Some of the junctions lose heat due to the Peltier effect, while others
gain heat. The commonly available Peltier elements usually consists of PN junctions with
copper interconnects and ceramic isolators on two sides, which also act as heat spreaders
(Figure 2).
Figure 2. Peltier element construction [13]
21
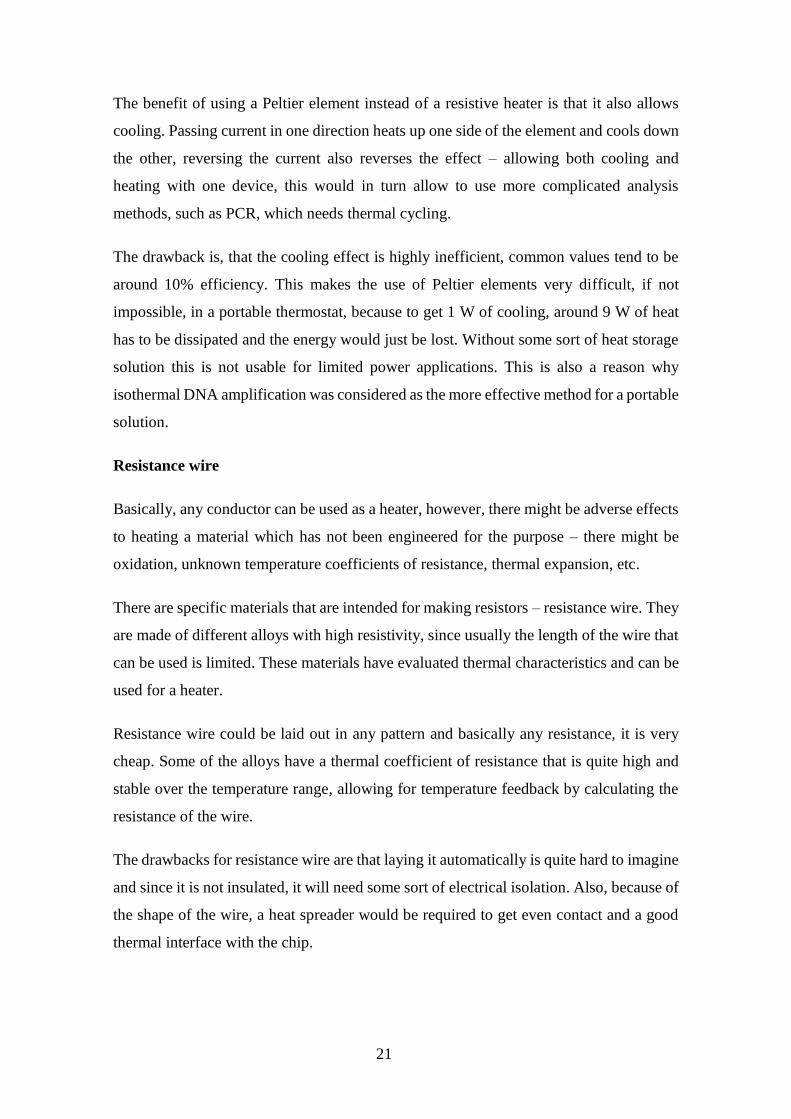
The benefit of using a Peltier element instead of a resistive heater is that it also allows
cooling. Passing current in one direction heats up one side of the element and cools down
the other, reversing the current also reverses the effect – allowing both cooling and
heating with one device, this would in turn allow to use more complicated analysis
methods, such as PCR, which needs thermal cycling.
The drawback is, that the cooling effect is highly inefficient, common values tend to be
around 10% efficiency. This makes the use of Peltier elements very difficult, if not
impossible, in a portable thermostat, because to get 1 W of cooling, around 9 W of heat
has to be dissipated and the energy would just be lost. Without some sort of heat storage
solution this is not usable for limited power applications. This is also a reason why
isothermal DNA amplification was considered as the more effective method for a portable
solution.
Resistance wire
Basically, any conductor can be used as a heater, however, there might be adverse effects
to heating a material which has not been engineered for the purpose – there might be
oxidation, unknown temperature coefficients of resistance, thermal expansion, etc.
There are specific materials that are intended for making resistors – resistance wire. They
are made of different alloys with high resistivity, since usually the length of the wire that
can be used is limited. These materials have evaluated thermal characteristics and can be
used for a heater.
Resistance wire could be laid out in any pattern and basically any resistance, it is very
cheap. Some of the alloys have a thermal coefficient of resistance that is quite high and
stable over the temperature range, allowing for temperature feedback by calculating the
resistance of the wire.
The drawbacks for resistance wire are that laying it automatically is quite hard to imagine
and since it is not insulated, it will need some sort of electrical isolation. Also, because of
the shape of the wire, a heat spreader would be required to get even contact and a good
thermal interface with the chip.

22
Etched foil heater
Etched foil heaters consist of a thin resistive material, etched to a shape on a dielectric
substrate and covered by another (Figure 3). Usually the heaters are formed onto
polyimide (commonly known as Kapton), but can also be on mica, silicone or other
materials.
Figure 3. Etched foil heater construction [14]
Etched foil heaters can be fabricated with great precision, also in miniature sizes. They
can be integrated into the microfluidic chip itself. There are a lot of manufacturers that
provide custom solutions.
The commercially available etched foil heaters are usually too big and use a voltage
higher (12 V, 24 V, even up to 400 V), than a typical battery-operated embedded device.
They are also hard to mount because they usually have no mounting holes or anything.
This means they should be custom made for the purpose, the price of which varies a lot
depending on manufacturer and quantities.
A summary of the discussed heating element technologies is below in Table 2.

23
Table 2. Summary table of applicable 20 mm x 20 mm heating element technology options
Peltier/TEC Resistive
wire
Etched foil PCB based
Availability Available in
different sizes
and
resistances
Raw
materials
available, no
off-the-shelf
solutions
Available as 5 V,
12 V, 24 V, 220
V versions.
Custom made in
quantity
Custom made
in both for
prototyping
and in
quantity
Resistance
range [Ω]
0.2 – 10 0-20 5 V: 6-10
Custom: 0 –
100+
0-20
Usable voltage
[V]
2-24 0-12 0-24+ 0-12
Typical power
rating [W]
10-20 Custom made 1-10 < 5
Heat spreader
needed
No Yes Maybe No
Sensor
integration
Not integrated Difficult Can be integrated
for custom made
products
Any off the
shelf
thermistor can
be designed
on board
Price per
heater [EUR]
From Europe
– 10+
From China –
5-10
Difficult to
manufacture
and to give a
price
Off the shelf – 5
– 50
Custom made –
0.2 to 20
JLCPCB –
0,033
A custom PCB based heater has no significant drawbacks and is also the cheapest option,
therefore it was chosen as the technology to be used in the design of the thermostat. The
only possible difficulty is that it isn’t a common practice to use PCBs as heaters and needs
to be custom designed and evaluated.
2.4 Power supply options
For the device to be portable, it has to be battery powered. To select a suitable battery
chemistry, the differences of some popular battery chemistries were analyzed. The
comparison can be seen below in Table 3, including both rechargeable and primary
batteries.

24
Table 3. Battery chemistry comparison [15]
LiCoO2 LiFePo4 NiMh NiCd ZnC Alkaline LiF
Rechargable yes yes yes yes No No No
Voltage
range [V]
2.8-4.2 2.65-3.6 1.0-1.5 1.1-
1.35
0.9-1.5 1.0-1.65 0.9-1.6
Energy
density
[W*h/L]
560 333 401 100 92 250-434 480
Cycle
durability
[cycles]
400-1200 2000+ 180-
2000
2000 N/A N/A N/A
Impedance
[16], [17]
Very low,
stable
Lowest,
stable
Medium,
usable
stability
Low,
worse
than
NiMh
High, rises
fast when
discharging
Medium at
first, rises
fast when
discharging
Medium,
rises
only in
the end
of life
Battery
management
Best
availability
Good
availability
Few, but
very
simple
Same
as
NiMh
Not needed Not needed Not
needed
From primary batteries, ZnC and Alkaline batteries are not suitable for this application
because of their high internal resistance. The resistance of the battery would be
comparable to the heater, making it an equivalent heat source. Lithium primary batteries
would be a more reasonable choice; however, they are much more expensive, comparable
to rechargeable lithium-based batteries.
NiCd batteries were mainly used as tool batteries because of their lower internal resistance
compared to NiMh. They have been replaced by lithium ion batteries, which nowadays
are superior in practically every way. Since lithium ion batteries are so mass produced,
they are even cheaper than a comparable energy of NiCd batteries.

25
NiMh batteries provide a good energy density and are still very popular because they have
a similar cell voltage to alkaline batteries, used in a lot of consumer products, such as
remotes, wireless keyboards and mouse’s, photography equipment etc. NiMh cells come
with low internal resistance and high cycle life versions, usable for the thermostat.
Lithium ion batteries are the best choice, they have high energy density and very good
internal resistance characteristics, while being the cheapest option (price to energy ratio).
The choice was to use a rechargeable battery for cost and comfort for the user. Since the
process is quite power intensive, ZnC and Alkaline batteries would have to be replaced
too often and lithium primary cells are too expensive. To further improve on the
versatility, a requirement of charging through a Micro-USB port was set, so the device
could be charged with the most common phone chargers or from a computer USB port.
For charging over USB, there are both linear and switching regulator based chargers.
Since the thermostat is meant to be low-cost, a linear charger will be much less complex
and also cheaper than a switch-mode charger. Using a linear charger will however limit
the voltage of the battery pack.
Both single cell LiCoO2 and LiFePo4 batteries would be chargeable over USB, USB
charger ICs for Li-Ion 1 cell batteries are very common and cheap. For NiMh, it is
possible to charge single or dual cell battery packs [18], but three cell pack charging
voltage is up to 4.65 V, where even when disregarding the voltage drops everything
including the pass-transistor of the regulator, charging from a computer USB port might
fail because USB 2.0 and 3.0 allow down to 4.4 V and 4.45 V bus voltages respectively.
For reference, a single LiCoO2 cell charging voltage is 4.2 V and for a LiFePo4 cell is
3.6 V.
A comparison table of the most viable supply options are given in Table 4, with the battery
and converter type, efficiency over range, usable energy from the battery, calculated
energy density and supply noise and cost. For the sake of comparison, we assume that an
ESP32 microcontroller is used. A single or dual cell NiMh battery pack would require
using a boost converter. Using a LiCoO2 cell gives multiple options – an LDO, Boost-
LDO, traditional Buck-Boost or some more special options such as the Analog Devices
(Linear Technology) LTC3440. Each of these options offer its benefits and drawbacks.

26
The cheapest of which is of course just using an LDO. The LDO voltage would probably
have to be 2.8 V or higher to get the best performance, because the ESP32 flash memory
works only down to 2.7 V. Using a 3.3 V LDO for example would make the supply
unstable when working in the dropout region, causing issues with the temperature
feedback. For a LiFePO4 battery, a regulator is not necessary, since the ESP32 works up
to 3.6 V, which is the upper limit of this battery chemistries voltage. This gives a
significant advantage to the LiFePO4 technology, as no regulator means no power loss
over it.
Table 4. Comparison of viable power supply options
Battery
type
Converter
type
Average
efficiency
over
range
[%]
Usable
energy1
[%]
Overall
efficiency
[%]
Energy
density x
overall
efficiency
[Wh/L]
Supply
noise
Power
supply
cost
NiMh
2S2
Boost 80 100 80 321 High High
LiCoO2
1S
LDO 78 90 70,2 393,12
Low Medium
LiCoO2
1S
Buck-
Boost
90-95 100 90-95 504 High Highest
LiFePO4
1S
N/A 100 98 98 327 None None
1 From the method’s capability to use the battery without dropping under the 2.7 V required for the MCU
2 S=number of cells in series

27
3 Materials and methods
3.1 Thermostat prototype design
In this section, the technological solution for the proof-of-concept prototype will be
discussed in detail, starting from the requirements and explaining all of the major
component choices.
3.1.1 Requirements
The thermal requirements for the device were set to match the different isothermal NAAT
profiles discussed in this work (see Table 1). Device dimension requirements were
determined according to the standards set in the Thomas Johann Seebeck Department of
Electronics Lab-on-a-Chip workgroup. Communication and user interface requirements
were determined according to the targeted application. The requirements are shown below
in Table 5.
Table 5. Summary of requirements
Property Value
Regulation range 20-70 ºC
SSE +/- 1 ºC
Power source Batteries
Thermostat dimensions 12 cm x 8 cm x 5 cm
Microfluidic chip dimensions (for chip
holder, heater)
20 mm x 30 mm x 1,5 mm
User interface Bluetooth GUI and physical UI
Connectivity USB, Bluetooth, Wi-Fi
Typical reaction volume < 1 ml
3.1.2 Electronics Design
Heating element
A PCB based heating element is similar to an etched foil heater, just that the substrate is
a FR4 laminate and the foil is copper, insulated by a lacquer-like solder mask. Using a
PCB as a heating element is uncommon and no references were found of similar uses in
the field.

28
There are no commercial off-the-shelf PCB based heaters available, that could be used,
so it had to be custom designed. There are many benefits to using a PCB as a heater.
Firstly, there are a huge amount of PCB manufacturers available both locally and globally,
one could even do it at home with simple PCB etching techniques. Typically, even
prototype manufacturers allow 0,004” or ~0.1mm trace width and clearance, so the heater
shape can be optimized for a certain shape and a certain resistance. The FR4 substrate
allows for good mechanical stability and the top surface of the PCB is very uniform in
height, eliminating the need for a separate heat spreader. Also, all sorts of custom
mounting methods may be used, the most obvious of which is mounting holes. Since
prototype PCBs are produced in great quantities, the price is very low. Typical price for
10 pcs of 10 by 10 cm boards is 5 Euros from Chinese manufacturers, such as JLCPCB.
This makes the price of a single 2 by 3 cm heater 0,033 Euros.
The PCB based heating element was designed, so the heated area is a 20 mm x 20 mm
square, which corresponds to the width of the microfluidic chip. It also includes 4
mounting holes in the corners. No components were set on the top to have a flat surface.
Also, copper islands were laid out between the traces to have a better heat distribution
and a flatter surface. The heating element trace is a 0.1524 mm (6 mil) wide, 540 mm
long trace, which with the standard 35 µm copper thickness comes to around a 2 ohm
resistance. The traces going to the heating trace on top were made twice as wide on the
bottom, so the resistance on the bottom would be reasonably low. This way, the trace
heats up on the top side and not on the bottom. The thermistor was set on the bottom of
the PCB, with vias connecting from a copper island under the thermistor through to the
top, where a larger copper area was left between the heater trace to reduce the risk of
having a hot spot in there. For wiring to the heater, a surface mount JST XH series
connector, rated for 3 A with a maximum resistance of 10 mΩ, was placed on the bottom.
For best noise immunity, a shielded cable could be used to connect to the thermistor,
separate from the heater cable. If low cost is the main priority, wires could be soldered
straight to the pads. The layout of the heater PCB can be seen below on Figure 4 and a
photo of the completed heating element with the temperature sensor on Figure 5.

29
Figure 4. Heating element PCB layout
Figure 5. Finished heating element
Controller board
The main parameters for choosing the MCU for this device were connectivity and price.
There is also the need for low power operation, but most modern controllers have quite
good low power modes and possibilities, it is just up to the programmer to take advantage
of this.
Since this device should have both Bluetooth and Wi-Fi connectivity at a low price, there
is actually not many alternatives to choose from. The most popular choice in the IoT
community at the moment is the EspressIf ESP32 [19], which was also chosen for this
thesis task. It is very powerful, has great availability and good documentation and is really
cheap. The alternatives to this are for example the Intel Edison, the Samsung Artik 5 or
some MediaTek SoC’s, for example WRTnode^7. All the alternatives that were found,
either lack in availability, documentation or are just too expensive for a low-cost device.

30
The ESP32 has a vast community behind it, with lots of open source hardware and
software available. The hardware comes in different forms – as an individual SoC, a
module or as development boards. The series includes single and dual core processors,
modules with different amounts of memory, with or without a built-in antenna, or as
complete boards together with USB interfaces, GPIO headers, battery management and
even UI, like screens and buttons.
For the proof-of-concept prototype, a Wemos TTGO MINI 32 V2.0 development board
(Figure 6) was used, which includes the ESP32-D0WDQ6 Dual Core SoC and was chosen
because of its small footprint and battery management capabilities.
Figure 6. Wemos TTGO MINI32 V2.0 development board[20]
Power consumption calculations
The microcontroller needs a 3.3 V nominal supply to operate. To decide, what kind of
power supply options are viable, some preliminary power consumption calculations were
performed. The manufacturer datasheet recommends at least 500 mA current capability
for the power source of the ESP32, because of short peaks of power needed for the
operation of the Bluetooth and Wi-Fi transceivers. [19]
The datasheet also specifies current consumption at different settings. In active mode,
with two cores running at 240 MHz, transmitting Bluetooth data, the current consumption
is 130 mA. While receiving, the consumption is 95-100 mA. At 3.3V nominal, this comes
to roughly around 0.4 W average consumption.

31
For the power consumption of the heater, a very approximate calculation is done at the
moment. At an ambient temperature of 20 °C and a reactor temperature of 70 °C, the
temperature difference ΔT is 50 °C. The microfluidic chip thickness is around 1.5mm and
the thickness of the chip holder that would hold it down on the heater is probably in the
range of 2 mm. It is assumed that the heat is transferred through an area of the size
allocated by the chip – 2 by 3 cm. Both the enclosure material and the chip have thermal
characteristics λ close to ABS plastic, the thermal conductivity of which is 0.128 – 0.187
W/m*K [21] To calculate the power dissipated through this arrangement, the definition
of thermal conductivity is used:
𝜆 = 𝑃
(𝐴 ⋅Δ𝑇𝑡 )
= 𝑃 ⋅ 𝑡
𝐴 ⋅ Δ𝑇→ 𝑃 =
𝜆 ⋅ 𝐴 ⋅ Δ𝑇
𝑡=
0.16 ⋅ 0.02 ⋅ 0.03 ⋅ 50
0.002 + 0.0015≅ 1.37 W
λ = specific thermal conductivity (W/(K·m))
P = power (W)
A = area (m2)
t = thickness (m)
The power dissipation of the device will be reduced by thermal insulation, this can be
taken as a worst-case power consumption.
Total power consumption of the device, assuming 100% conversion efficiency, is going
to be up to around 1,8 W, assuming the beforementioned conditions. Typically, in an 8-
hour work day, realistically up to five 1-hour long assays could be performed, so the
amount of energy required from the supply comes to a total of 9 Wh. Therefore, the
requirements for the power supply circuitry are: 2.7-3.6 V logic voltage supply, capable
of 500mA peaks, at least 3 W power available throughout the battery life, capacity of up
to 9 Wh in a reasonable size. For the first iteration prototype, the battery management
built into the Wemos TTGO Mini32 development board was used together with an LDO
and a LiCoO2 battery. The LDO on board was a 3.3 V regulator, which in the process of
testing proved to be noisy, especially in the dropout region. For the improved design (see
Section 5 for implementation), a LiFePO4 battery will be used. A noise-free supply is
more important than a small amount of extra energy density.

32
Peripheral electronics board design
The heater was designed with PWM control in mind – the resistance is around 3 ohms,
allowing enough heat to be generated even at the low end of the battery life – at 2.7 V it
still allows for ~ 2.4 W power.
The amount of current the ESP32 GPIO pin can deliver is a few tens of milliamperes, so
a logic level N-type MOSFET was used to switch the necessary current. In case of the
first iteration, an IRLZ44N was used, being as it was available from the supplies of the
author and was only non-optimal because of a large power overhead, which also might
bring along a higher gate capacitance. In the second iteration, the transistor choice was
optimized, an IRL6342 was chosen.
The schematic showing the MOSFET configuration together with the current shunt for
measuring the heater current can be seen below on Figure 7. The gate of the transistor is
fed through a resistor to reduce ringing and control the slew-rate. A high value bleed
resistor is added from the gate to ground (or to source) to make sure that if the MCU pin
would be floating, charge could not build up on the gate and trigger the transistor, causing
the heater to heat up uncontrollably. The bleed resistor was added before the gate resistor,
because with such a low gate drive voltage, it is better not to have a voltage divider in the
gate drive circuitry.
Figure 7. Heater MOSFET and current shunt schematic

33
While the ESP32 ADC is probably capable of doing the measurement tasks needed in this
device, the controller comes with an uncalibrated voltage reference from the factory. This
means that for the ADC to give any reasonable results, the voltage reference has to be
routed out to a physical IO and manually calibrated. Also, the dynamic range of the ADC
is limited near both rails, so measuring the battery voltage with the internal ADC would
require a voltage divider – a constant load on the battery unless switched with some more
external electronics.
Therefore, an external ADC was used for temperature, battery voltage and heater current
feedback. The ADC used was a Texas Instruments ADS1115 16-Bit, low power, I2C
enabled ADC with a programmable gain amplifier. The PGA allows to measure the heater
current straight off a shunt resistor without any extra amplification. Each of the inputs
was also filtered with a low-pass filter.
To interface the thermistor, which is read as the output from a voltage divider, through an
LPF. Also, the upper leg voltage is measured, this way, both the current and voltage drop
of the thermistor are known, so the resistance can be calculated back from the voltage.
The ADC input impedance was also taken into consideration; however, it introduces a
negligible error so it isn’t used in the calculations. The thermistor interfacing schematic
can be seen on Figure 8.
Figure 8. Thermistor electronic interface schematic

34
For user interface and debugging, an OLED display with an I2C interface was used in
combination with 3 pushbuttons, used to navigate through different configurable
parameters and status views.
Proof-of-concept electronics
The first iteration prototype of the control and interface electronics were made using the
development board, two prototyping boards (peripheral electronics board, UI board) and
the external ADC as a module. The boards were stacked up, connected together with
special 0.1-inch header pins, which have a female side to go on top of the board and a
long male pin on the bottom, making it possible to stack 3 boards together.
The peripheral electronics board was used for all the vital electronics and connectors,
including the ADC, the MOSFET, battery, heater and thermistor connections and all the
passives. The top board had the pushbuttons and the OLED screen. The development
board was left in between, giving access to all the GPIO pins for both the upper and the
lower board. The UI board could be removed with the device running if needed to have
access below. This was used to confirm measured ADC values and to check the gate drive
waveform for the heater MOSFET. The three boards can be seen on Figure 9.
In the first iteration, a 1200 mAh 3.7V nominal non-branded lithium ion battery was used,
as this was available with fast delivery at low cost. The operating time from battery power
will be limited to a few hours instead of a whole work day as specified before in the power
Figure 9. Photo of prototype electronics layout (top side), peripheral board on the left, controller board in
the middle and user interface board on the right.
1 cm

35
consumption calculation part of the thesis, however it will allow the prototype to be
tested.
3.1.3 Microfluidic chip design
The purpose of the microfluidic chip was to fit a correct volume, in this case 50 µL of
fluid in the specific area, where the heat can most efficiently be transferred. It also has to
allow for easy liquid input and output.
The chip is manufactured through DLP (digital light projection) 3D printing on an
Envisiontec Perfactory 4 printer (Figure 10)Figure 10. Envisiontec Perfactory 4 DLP 3D
printer, with the inputs, outputs and required channels. Because of the limitations of the
technology, the chip cannot be printed as a single piece – the channel has to be left open,
otherwise it would get clogged by resin. The channel will be sealed off with adhesive
PET film.
Figure 10. Envisiontec Perfactory 4 DLP 3D printer
Since NAAT is often performed to analyze potentially infectious samples, the input,
where the sample is inserted through, should be sealed after insertion to reduce the risk
of infectious DNA flowing back. Another input is needed to push out the liquid after the
test.
All of the liquid and also gas should stay inside the chip during the test, which would
naturally make it an isochoric process, where with temperature, also the pressure starts to
rise. In order to ensure, that the pressure doesn’t grow too high and break the seal between

36
the chip and the film, a gas spring (e.g. an empty syringe) is used on the output of the
reactor.
In total, 2 inputs and 2 outputs are needed to fulfil the requirements – one input for the
sample, the other for air, one output for the result and the other for the gas spring, which
for testing purposes can just be a syringe.
The shape of the reactor was chosen to be round, for several reasons. The heater will get
hotter in the center than on the edges, so thermally it makes sense to condense the liquid
to as small of an area as possible. Also, a round shape aids in flow of the liquid, as opposed
to corners that lead to higher wall adhesion. Finally, a round shape is always best to seal,
because it doesn’t generate stress concentrators.
The microfluidic chip was designed in Dassault Systèmes SolidWorks CAD software.
The reactor diameter was first calculated from the necessary reaction volume and then
the area together with the input and output channels was fine-tuned using SolidWorks
section evaluation tools to give a volume of 50 µL. The design of the microfluidic chip
can be seen on the drawing in Figure 11 and the actual 3D printed chip on Figure 12.
Figure 11. Microfluidic chip design and dimensions

37
3.1.4 Prototype enclosure and chip holder
In order to be able to work with the prototype device and to test its performance, an
enclosure for the electronics was needed, together with a chip holding interface. The
enclosure was designed in SolidWorks and the G-Code for printing was generated with
Ultimaker Cura 3D printing software.
The prototype enclosure was designed to be FDM 3D printed, which gives the designer
both a lot of freedom and also has a lot of limitations to take into consideration, such as
all thickness dimensions should be a multiplier of the nozzle diameter, etc. All fasteners
holding together the enclosure were made with captive nuts, an opening was left for the
USB connector and power switch, fillets and chamfers were used extensively to
strengthen connections between corners. Dimensional tolerances were all made taking
into account the 3D printing process and material properties, making sure all pieces fit
together effortlessly without having to modify them after printing. The printer used was
a modified Ultimaker 2+, the material was Devil Design ABS+.
The prototype chip holder cover went through two iterations, while the first one was small
and seemed at first to be more comfortable to use, it soon turned out, that it is more
reasonable to make a thicker, larger cover with insulation inside. The first iteration can
be seen below (Figure 13).
Figure 12. Photo of designed microfluidic chip, 3D printed on Envisiontec Perfactory 4, with a hole in the
centre of the reaction chamber for a temperature sensor

38
Figure 13. Prototype enclosure with first iteration chip holder
The final version of the prototype enclosure, that was used throughout the testing phase
can be seen below (Figure 14).
Figure 14. Prototype enclosure design with revised chip holder

39
3.1.5 Software, communication and user interface
For the purpose of the thesis, the program code was written for the proof-of-concept
prototype using Arduino IDE (integrated development environment). The following
section will give an overview of the main methods used to fulfil the requirements set in
the beginning.
PID control loop
The main functionality of the device is to keep a constant temperature at the heater. For
that, a PID control loop was used. The calculation was kept as short as possible, avoiding
instructions that would make the process control slower.
The proportional part is calculated as the difference between the setpoint and the actual
temperature value, aka the error, multiplied by the proportional constant.
The derivative part is calculated as the difference between the last cycle error value and
the current cycle error value, divided by the interval between the cycles, multiplied by the
derivative constant.
Since the system is discrete and limited in resolution, and the cycle times are short, the
difference between the last cycle error and current cycle error is null in most cycles and
only appears in some of them, the differential value of the algorithm is quite jumpy. To
mitigate this, a moving average of the differential value is calculated over a window of 5
cycles. This smoothens the effect of the differential value of the algorithm without
creating too much extra delay. Extra delay between different components of the algorithm
makes it prone to oscillations.
The integral component is calculated as the sum of the last cycles integral component and
the error value of the cycle, multiplied by the interval between the cycles and the integral
constant.
With a PID regulator, when the heating starts, the actual temperature will stay lower than
the setpoint for the natural process time constant of the system. During this time, the
integral value would be summed up to a point where if the value reaches the setpoint, the
integral component will have a significant error and would cause the system to overshoot.
This is called integral windup. In order to reduce this effect, three solutions were used –

40
firstly, the integral component value is limited to a certain value, so that it cannot “wind
up” to an infinitely large value, reducing the time it takes to return to the controlled
calculations. Secondly, the integral value is only calculated when the temperature has
reached near enough values to the steady state, in this case, ± 2 °C of the setpoint. Thirdly,
the integral component is cleared whenever the error value is over 10 °C, usually
indicating a change in the setpoint value.
The PID constants were tuned one by one, starting from the proportional, similar to the
Ziegler-Nichols method [22]. The proportional constant was increased up to the value
where it can reach all the desired setpoints and will actually overshoot. Then the
derivative component was tuned to dampen the reaction and remove the overshoot. Lastly
the integral constant was added in to slowly take the steady state error to around zero.
For the proof of concept, the constants were left constant throughout the setpoint range,
this was taken as good enough. To get a quicker process time constant and even better
regulation, the PID constants could be optimized for different setpoint ranges.
Bluetooth communication
The Bluetooth communication between the MCU and the smartphone interface app was
developed onto the BluetoothSerial library included in the Arduino core for ESP32 WiFi
chip by Espressif [23].
The library includes everything necessary to have a FreeRTOS task running to handle the
data transmission, it allocates receive and transmit buffers, handles all sorts of exceptions,
all in a very good non-blocking and real-time application enabling way. The data
transmission is handled just like a simple serial transmission for the user of the library.
A simple protocol was written to be able to parse out the command or parameter type
from the data and also the value. For the prototype, the protocol is ASCII coded text based
and a buffer is just parsed for keywords and the values following them and checked
against value ranges. Later, this can be improved upon by optimizing the protocol to either
encode the data, if it was necessary, or just reduce the overhead of the text-based system.
The smartphone app was created in MIT App Inventor 2, which is a visual programming
environment for easily creating applications to use with an Android operating system

41
[24]. The Bluetooth communication was done using the included BluetoothClient
component together with the simple text-based communication protocol. The app
periodically checks for the Bluetooth connection, if there is a device paired, another timer
is run to check if there is data available in the buffer, in which case the data is read, parsed
for keywords and the values and features on the display are updated. The data is sent from
the app on events, such as a click of a button or the change in the temperature setpoint
value. The NAAT protocol presets are hard coded into the app at the moment, loading
them from a list just changes the setpoint and time remaining values and a custom preset
can be made by manually changing the values.
User interface, menu system
A simple menu system was implemented to allow for using the thermostat through the
physical UI on the device itself. For the first iteration, the menus and submenus are hard-
coded into the program code.
The menu system was made using a single menu position variable, that is controlled by
the buttons. It is incremented and decremented with the up and down buttons and
multiplied by 10 each time a submenu is accessed and divided by ten each time when
returning to a higher-level menu.
The pushbuttons were connected between a GPIO and ground with no electronical
debouncing. The buttons were interfaced using interrupts, where in the interrupt service
routine, just a flag is set for the corresponding button.
Since the buttons have a tendency to bounce, a simple non-blocking software debouncing
algorithm was used. At the beginning of each program cycle, the system time is updated.
Each time any button press is registered, the time value is saved into a variable. The next
button press will only be registered, if the difference between the saved value and the
system time for the current cycle is greater than the configurable debounce time interval.
The displayed information is handled in a long switch-case statement, which takes the
menu position variable as the operator and each case has a different display state. One of
the more difficult challenges with this kind of system is to have the display updating
correctly without flickering, that is, without clearing it each cycle. For that, each of the

42
fields where the values change was evaluated to see that in any case the field where the
characters are written will not have any old characters from the last cycle.
The OLED display uses an SSD1306 segment driver and controller IC with I2C
communication. The Acrobotic AI_Ardulib_SSD1306 library [25] was used to simplify
interfacing with the display. The library includes an assortment of functions that send the
necessary I2C data to display the data or to configure the display – turn it on or off, change
the brightness, etc.
Debugging information
For debugging the devices behavior, information is sent out to the serial interface if a
define for debugging in the configuration header file is set. The information sent out
includes text-based keywords and corresponding parameter values in a tab delimited
format. This format allows to manipulate the data in a spreadsheet program such as MS
Excel. It is also useful for the built-in serial plotter in the Arduino IDE, which
automatically plots the data with a legend if the values are formatted in this manner.
Thermistor reading, Steinhart-Hart equations
As mentioned before, a thermistor is used for the heater temperature feedback.
To get a temperature reading from the calculated resistance, three different methods were
considered: the Steinhart-Hart equation [26], the Beta or basic equation, and a lookup
table containing the values for each resistance. There are more advanced methods, but
those use already 4th order polynomials, that calculations of which on a microcontroller
will take too long or will have to be approximated to the point where the advantage is
lost.
Since the processor is very capable of doing complex calculations, the Steinhart-Hart
equation was used, since it is the most accurate of these three methods and is capable of
very good precision. [27] The lookup table can be as accurate, it would just need a
unnecessarily large table for the resolution that a calculated value offers, slowing down
the method. Even though it might seem that the temperature doesn’t need to have a very
good resolution, the extra resolution helps make the PID regulator more stable.

43
The Steinhart-Hart equation is:
1
𝑇= 𝐴 + 𝐵 ∗ ln 𝑅 + 𝐶 ∗ (ln 𝑅)3
Where T is the temperature (in kelvins), R is the resistance at T (in ohms); A, B, and C
are the Steinhart–Hart coefficients, which vary depending on the type and model of
thermistor and the temperature range of interest.
Now to get the Steinhart-Hart coefficients, there has to be at least three known operating
points for the thermistor. The thermistor used is a Murata NCP21XV103J03RA, for
which the datasheet specifies all the resistances throughout the temperature range from -
40 to 125 °C. Because the coefficients give the most accurate results for the range that
the points define, the reference points were taken as 25, 50 and 75 °C to cover the usable
temperature range of the thermostat.
For the calculations of the coefficients, a Stanford Research Systems Inc calculator was
used [28]. The calculator gives a graph of the resistance-temperature curves, comparing
the Beta-equation and Steinhart-Hart equation results as can be seen on Figure 15. The
comparison shows, that the Beta-equation starts to give a noticeable error in the higher
temperatures. For example, at 70 °C, the Beta-equation gives a result of 70.28 °C. This is
also confirmed by the manufacturer datasheet, which specifies a beta value correction at
higher temperatures.

44
Figure 15. SRS thermistor calculator, used for Steinhart-Hart coefficients calculation and comparison to
the Beta-model [28]
Other libraries
For periodic events, the Ticker library [29], included in the ESP32 Arduino libraries was
used. The library allows to set up different timing related tasks in an efficient, non-
blocking way, making use of the hardware timers and the RTOS running on the controller.
This library was used to periodically send and receive data and update the display.
The external ADC was handled with Ton Rutgers ADS1115_async library [30], which
allows interfacing with the ADC channels asynchronously – getting the data as soon as it
is ready. Other available libraries waited for all channels to finish conversion first. The
library also includes auto-ranging, which might be used in the future.
For PWM control of the heater, the LEDC module [31] of the ESP32 was used, which is
primarily designed to control the intensity of LEDs. It has 16 independent channels to
generate PWM with half of them having a hardware-based timer for PWM control
independent of the application software. The ESP32 controller allows to map the PWM
output to basically any GPIO, and the LEDC module includes lots of different functions
to interface with the timers as efficiently as possible. The PWM for the heater was run
with the timer resolution of 12 bits and at a base frequency of 10 kHz. The PWM
frequency can go up to 40 MHz with a single bit resolution, dividing in half with each
extra bit of resolution. At 12 bits, the maximum frequency is approximately 19,5 kHz.

45
3.2 Evaluation methodology for thermostat prototype
3.2.1 Experimental setup for thermal analysis
The experimental setup used for initial verification used the thermostat in the first
iteration 3D-printed enclosure, which had no thermal insulation on top and had many
mechanical weak points, which were unacceptable for a prototype, that has to go through
a lot of tests and be opened up and closed multiple times.
The microfluidic chips, that were used during the experiments were DLP 3D-printed, with
a hole in the center of the reaction chamber, sized to accept a bead-type thermistor, that
was sealed first with a thermoplastic adhesive. This thermistor was to measure the
temperature of the liquid inside the chip to verify the accuracy of the system. The
thermistor used for verification was a TE Connectivity GA10K4A1A.
Two syringes were connected to the inlets of the microfluidic chip – one filled with
distilled water and the other empty. Open tubes were connected to the outlets and closed
off with clamps after filling the reaction chamber with the water. The empty syringe acted
as a gas spring to avoid excessive pressure while heating. The assembly can be seen in
Figure 16.
Figure 16. Photo of the prototype used for experimental thermal analysis, showing the thermostat with the
special microfluidic chip with an embedded thermistor

46
The thermistor data was measured with an Agilent (Keysight) 34410A benchtop digital
multimeter (DMM). We planned to record data on the PC via a MATLAB script,
controlling the DMM via USB through SCPI (Standard Commands for Programmable
Instruments) commands, but during initial tests, we experienced unhandled MATLAB
exceptions with the script. Therefore, a National Instruments Labview based program,
aka virtual instrument (VI) was used for data acquisition instead.
The thermostat was programmed to send full debugging information over UART through
an UART-USB interface built onto the development board to the PC. The information
included the PID components, the battery voltage and heater current, the heater PWM
duty cycle and a timestamp. The data was collected with the terminal software PuTTY,
making use of the included logging functionality.
3.2.2 Model for simulated thermal analysis
While the experimental setup will be enough to evaluate the performance of the
thermostat’s temperature regulation, there is still only a single temperature probe in the
reaction chamber, giving us no data about the temperature distribution. A simulation
model was created in order to gain more information about the temperature distribution
and to calculate the volume of the sample in the allowed range of temperature.
The thermal model detailed in this work was designed for stationary thermal analysis and
a 3D device geometry with well-defined structural materials and boundary conditions.
The model was a simplified 3D representation of the experimental setup as shown on
Figure 17. Instead of incorporating Joule heating in the model and giving the heater power
as an input, the heater was represented as a temperature boundary condition, since the
heater´s surface temperature was known and experimentally verified at multiple set
points. Therefore, the model was based on the heat transfer equation assuming no flow
(during amplification, the reaction liquid is stationary). Thermal properties (density, heat
conductivity, specific heat capacity) of the structural materials in the model are detailed
in Table 6. Boundary conditions and initial values are detailed in Table 7. Ambient
temperature for the model was set to a constant 25 °C.

47
Table 6. Summary of material properties used in the simulation model
Material Density [kg/m3] Thermal Conductivity
[W/mK]
Specific Heat
Capacity
[J/kgK]
3D printed plastic 1470 0.18 1190
Copper 8960 400 385
FR4 1900 0.143 1369
Air 1225 0.024 1000
Water 1000 0.6 4184
Figure 17. Section view of the simplified 3D geometry for finite element modeling
The model was implemented in COMSOL® Multiphysics version 5.4 using the Heat
Transfer interface. The model was solved via the built-in stationary solver of COMSOL
on a PC with a Core i7-7700 CPU with 32 GB RAM. The 3D model of the device was
simplified in Solidworks to decrease mesh complexity: the electronics and the battery
were replaced by simple boxes with the corresponding size, features for the fasteners were
removed and also all filleting was removed. The file was exported as a STEP file to import
into COMSOL.
All heat transfer mechanisms that occur in real life were taken into account – thermal
conduction, convection and radiation. Even though the model was thoroughly simplified,
still, 36 distinct domains with 1223 boundaries remained and were used for the
calculations. The thermistor embedded into the microreactor of the microfluidic chip was
modelled in COMSOL as a Domain Point Probe, at the same height as in the experimental

48
model. The mesh was generated with the built-in “Finer” settings, resulting in 1,301,982
elements with an average element size of 0.3 mm3 and an element quality of 0.63 (based
on the radius ratio method [32].)
Table 7. Boundary conditions and initial parameter values used in the simulation model
Boundary Condition Boundary Initial Value (if
Applicable)
Ambient temperature External boundaries 25 °C
Ambient pressure
(absolute)
External boundaries 1 atm
Heater Heater track surface As per set point
Convective heat loss External boundaries Not applicable
Electrical insulation Heater boundaries except
contacts
Not applicable
Radiative heat loss External boundaries Not applicable

49
4 Results and discussion
4.1 Experimental thermal analysis
To evaluate the proof-of-concept prototype and optimize the solution, experimental
thermal analysis was performed with different environmental variables and setpoints,
backed up by simulation through finite element modelling.
4.1.1 Initial characterization
Initial proof-of-concept tests were made in an air-conditioned office room, maintained at
approximately 25 °C. The transient response of the heater and the temperature in the chip
were measured during three thermal cycles, each of which at setpoint of 60 °C. The
heating period was initially set to 15 minutes. It was verified that the steady-state-error
was within bounds of the requirements. After each 15-minute heating cycle, the
thermostat was allowed to cool back down to room temperature.
The goal was to characterize the thermostat’s response, measuring the process time
constant and steady state error at a moderately high temperature setpoint. The requirement
for the steady state error was to be under 1 °C. The thermal transients can be seen on
Figure 18.
Figure 18. Graph showing results of the initial test. T_Chip values were the temperatures in the
microreactor, T_Heater were the heater surface temperatures. T_Setpoint marks the set point.

50
The PID regulator was tuned to be quite aggressive, while having minimal overshoot, the
time constant for the heater was 1 min 29 s (± 9 s), for the microreactor it was 5 min 58 s
(± 17 s), the steady-state error was 0.35 °C (± 0.06 °C), within the required range. The
maximum temperature the heater reached at the overshoot was 0.3 °C (± 0.1 °C). From
the battery voltage and heater current data, the power consumption at steady state was
calculated as 0.75 W.
The overshoot was caused by integral windup. The initially set ± 2 °C range from the
setpoint for calculating the integral component is too large, also, the proportional gain
could be increased to shorten the time the integral component has to grow. Overall the
algorithm worked fine.
The initial tests showed that the chip assembly held together without leaking and the
thermostat was able to reach the target temperature range within 10 minutes, so the 15
minutes cycle was correctly defined. It also brought out a problem with the method for
sealing the temperature sensor in the chip. Thermoplastic adhesive was used initially, but
already at a 60 °C setpoint, the adhesive softened and stuck to the chip holder cover. The
problem was solved by using epoxy resin instead to seal up the thermistor. Figure 19.
shows both of the sealing methods.
Figure 19. Photo of the temperature sensor bonding methods to the chip, left photo shows the thermoplastic
elastomer disfigured after initial tests because of melting, the photo on the right shows the epoxied solution
used in all the other tests

51
4.1.2 Steady-state thermal analysis
The next series of experiments were done in a controlled environment, using a Vötsch
VT 7004 climate chamber. Thermal analysis was performed at different setpoints at an
ambient temperature of 25 °C, to evaluate the devices performance throughout its output
temperature range. Tested setpoints were defined in the 35-65 °C range with 5 °C
increments, covering the temperatures necessary for 12 different isothermal amplification
protocols, listed below in Table 8.
For these tests, a special micro-USB cable was constructed, with a switch on the positive
supply line, to have data available over USB while demonstrating the ability to work
without an external power source, and to allow comfortable charging without having to
open the climate chamber door. For the aforementioned reason, the thermostat was
controlled over Bluetooth instead of using the physical user interface.
Repeated tests were made at different battery voltage levels to show that the system works
independent of the supply. This did however reveal, that the stability of the temperature
reading, and therefore the stability of the whole system got worse at the point, where the
3.3 V LDO on board started to drop out of regulation. This is a design incompatibility
coming from the development board – a problem to be fixed with an optimized design.
The tests were taken at a voltage level higher than that point.
The results of the tests performed at different setpoints, given with the corresponding
NAAT protocol and target range have been summarized in Table 8. and a graph showing
the temperature transients can be seen on Figure 20. The results include the steady-state
error, calculated heater power and the time constant measured from the reaction chamber
temperature. The results demonstrate, that the prototype is able to stay in specification for
the SSE throughout its range – the maximum steady state error of 0.63 °C was at a setpoint
of 40 °C, the average SSE was under 0.38 °C with the minimum at a setpoint of 55 °C,
where the SSE was 0.08 °C. The steady state power at 35 °C was 0.18 W and increased
quite linearly up to 0.81 W at 65 °C.

52
Table 8. Steady-state thermal analysis results for various isothermal nucleic acid amplification test
protocols [5]
NAAT protocol Target
range
[°C]
Set point
[°C]
Steady-State
Error (SSE)
[°C]
Steady-state
power [W]
Time
constant
RAM 35 35 0.48 0.18 2 min 39 s
RPA, BAD AMP 37-42 40 0.63 0.26 2 min 47 s
SPIA 45-50 45 0.17 0.37 5 min 41 s
45-50 50 0.37 0.49 6 min 29 s
EXPAR, NEAR 55-55 55 0.08 0.59 6 min 56 s
TMA, ICA, PG-
RCA
60 60 0.46 0.71 7 min 8 s
LAMP, CPA,
NEMA
65 65 0.46 0.81 7 min 30 s
Figure 20. Temperature transients with setpoints of 35-65 °C at 25 °C ambient temperature in climate
chamber. T_Chip values were the temperatures in the microreactor, T_Heater were the heater surface
temperatures.
The tests were started at 35 °C and some problems with the system’s stability became
apparent. The temperature feedback had issues. This is because at first, the voltage of the
upper leg of the thermistor wasn’t used in the calculation of the temperature – it was

53
assumed to be 3.3 V because a 3.3 V regulator is used, however that is not actually true,
especially in a battery operated device where the voltage might go so low that the
regulator no longer regulates. The aforementioned misconception is a reason for the
problems in the 35 °C and 40 °C tests. From 45 degrees upwards the voltage was taken
into account and the errors were reduced.
The SSE could be further reduced to practically zero, by calibrating the system in several
points. Even a simple constant offset of e.g. 0.2 °C would give a positive effect, since the
temperature in the reaction chamber will always be a bit lower than the heater itself. This
is proved also by the fact that the error has always been negative. The main objective was
to evaluate the stability of the system and the accuracy of the temperature feedback.
4.1.3 Stress test and battery lifetime estimation
The operating ambient temperature for the thermostat was defined as 20-30 °C,
corresponding to the limits of comfortable room temperature. The prototype was tested
at the extremes of these ambient temperature with a high setpoint of 65 °C. As before,
testing was performed in the climate chamber. Three tests were done at both 20 °C and
30 °C ambient temperature, each time recording a transient of 15 minutes, which can be
seen on Figure 21.
Figure 21. Thermostat thermal transients at ambient temperatures of 20 °C and 30 °C with 3 transients for
each temperature T_Chip values were the temperatures in the microreactor, T_Heater were the heater
surface temperatures.

54
The first test at 20 °C ambient temperature showed another issue with stability, where the
temperature variable didn’t have a good enough resolution – the calculation of the
temperature was modified and temperature oversampling was added, with a moving
average calculation.
At 20 °C ambient temperature, the average steady-state reaction temperature was 64.29
°C (± 0.07 °C), heater temperature was 65 °C (± 0.001 °C), with 0.89 W (± 0.06 W) power
consumption and SSE of 0.71 °C (± 0.07 °C). The time constant was 8 min 43 s (± 32 s).
At 30 °C ambient temperature, the average steady-state reaction temperature was 64.31
°C (± 0.11 °C), heater temperature was 64.99 °C (± 0.001 °C), with 0.77 W (± 0.09 W)
power consumption and SSE of 0.69 °C (± 0.11 °C). The time constant was 7 min 20 s (±
8 s). Thus, it was demonstrated that the thermostat was capable of operating within the
requirements at the extreme ends of the operating ambient temperature range.
The thermostat´s battery life was also tested, by running at the extreme values of the
ambient and setpoint range – at 20 °C ambient with a setpoint of 70. Battery life was
measured from when the temperature reached the target within ±1 °C of the setpoint until
failure. With a 1200 mAh (nominal) battery and the defined test conditions, regulation
failed at 3 h 15 min 55 s. A graph overlaying the temperature of the chip and the heater
together with the battery temperature over time can be seen on Figure 22.

55
This shows that in practice, the power consumption of the device is actually lower than
calculated before in section 3.1.2 of the thesis, which was to be expected, because the
worst-case consumption was calculated there, while in reality, the thermal insulation
provided by the enclosure allows less heat to escape.
4.2 Simulated thermal analysis
After the experimental measurements, simulated analysis was performed. To make sure,
that the model being used for analysis was accurate enough to use, the estimation error
was validated.
The verification of the simulation model was done through comparing infrared thermal
camera images to the simulation results. The thermal camera used for these images was
a Jenoptik VarioCAM 384 HiRes IR camera. The thermostat was set to 60 °C at room
temperature in the aforementioned air-conditioned office, kept at 25 °C. The model was
solved using the Stationary Solver of COMSOL and the temperature plot was compared
to the infrared images, together with a boundary probe at a certain spot, where a point
temperature was taken on the thermal image as well. Comparing these results, an
Figure 22. Graph showing battery life test data. T_Chip marks the temperature in the microreactor,
T_Heater marks the heater surface temperatures. U_Bat marks the battery voltage. The battery voltage
graph has been smoothed for better readability

56
estimation error of less than 0.2 °C was found. The embedded sensor reading was 0.28
°C different from the simulation model. These results are within the required SSE range.
A comparison of the thermal image and simulation temperature plot can be seen below
on Figure 23.
Figure 23. Temperature distribution of the simulation (left) and the IR thermal image (right) with their
corresponding temperature legends.
The model described in section 3.2.2 of the thesis was solved using the Stationary Solver
of COMSOL. The setpoints used for the experimental steady-state thermal simulation
were entered as points into a parametric sweep. Estimation error was calculated as the
absolute error between experimentally recorded and simulated thermistor outputs in
steady-state. The highest error was 0.53 °C, within the required range. The error is mainly
a combination of the calibration errors and uncertainty of the thermostat, combined with
uncertainties coming from the fact that real life and a perfect model are different in terms
of geometrical tolerances and resulting differences in the thermal interface. Also, the
simulation model is simplified. The mean absolute error was 0.25 °C (± 0.16 °C). Table
9 summarizes steady-state temperatures recorded experimentally, compared to simulated
values for all tested set points.
In previous research around this topic, the requirement for the amplification reaction to
be successful is that ~85 % of the reaction liquid had to be in the specified temperature
range. [33] Therefore, at least 42.5 µL of the reaction liquid had to be within ±1 °C from
the set point. From the simulated thermal model, the reaction liquid volume in range could

57
be estimated. In previous research, the volume in range was evaluated using a logical
condition defined in the COMSOL, evaluated for each finite element within the reaction
chamber, represented by the following formula:
η = 50 ⋅1
n∑((Ti > (SP − 1) [°C] ∩ Ti < (SP + 1) [°C]) ∈ {0; 1})
n
i=1
where SP denotes the set point, Ti denotes temperature values for each finite element, n
the total element number and 𝜂 ∈ [0; 50] (μl).
The estimated reaction volumes in range for each set point were summarized in Table 9,
together with the experimental and simulated temperature reading in the microreactor.
The lowest value was 43.32 µL at 60 °C set point, whereas the average was 46.59 µL (±
2.5 µL), both above the required threshold.
As a conclusion, both experimental and simulated thermal analysis were performed on
the thermostat prototype to evaluate the performance of the device through its entire
setpoint range, including in itself at least 12 distinct isothermal amplification protocols.
The prototype was capable of regulating the reaction temperature in the allowed ranges
with maximum steady-state errors below 0.7 °C, without compensating for the fact that
the reaction temperature will always be lower than the measured heater temperature,
proportionally to the setpoint. With this compensation, the steady-state error could be
reduced even further. Target temperatures were reached within less than 8 minutes for the
highest setpoints, again, without compensating for the thermal capacity, and regulating
the heater temperature so it never goes over the setpoint by design. Using the data
gathered from the analysis, even a faster process time constant is possible. The power
consumption of the heater in steady state was less than 1 W even in the most extreme of
the operating conditions. The simulation demonstrated that over 85% of the reaction
volume was in range for all set points that were tested. Therefore, it can be said, that the
proposed design was proven valid at these conditions.

58
Table 9. Summary of simulated thermal analysis for various nucleic acid amplification test
(NAAT) protocols [5]
NAAT protocol Target
range
[°C]
Set point
[°C]
Experimental
Steady-State
[°C]
Simulated
Steady-State
[°C]
Volume in
range [µL]
RAM 35 35 34.52 34.94 48.62
RPA, BAD
AMP
37-42 40 39.37 39.90 49.89
SPIA 45-50 45 44.83 44.87 48.43
45-50 50 49.63 49.83 47.72
EXPAR, NEAR 55-55 55 54.92 54.80 44.74
TMA, ICA, PG-
RCA
60 60 59.54 59.77 43.32
LAMP, CPA,
NEMA
65 65 64.54 64.73 43.408

59
5 Improved electronics design
From the gathered data, development of an improved and optimized electronics design
was done. Through the use of the prototype, the concept of the device was proven – it is
able to perform according to the requirements set in the beginning, but also some points
for improvement were found. Also, the prototype is not producible at a low cost, for that,
a custom PCB was designed together with the optimization of all components. This was
done in KiCAD, an open-source EDA with capabilities comparable to the best
professional tools on the market.
Battery and charger
For power supply, a LiFePO4 battery is used without a voltage regulator, since the battery
voltage range of 2.7 V to 3.6 V corresponds to the operating voltage range of the
microcontroller. All the other components are usable in this range anyway.
To charge the battery, the Microchip MCP73123 LiFePO4 battery charge management
controller was used, which has integrated overvoltage protection, an integrated pass
transistor, current sensing and reverse discharge protection. The schematic of the battery
charging circuit implementation can be seen on Figure 24.
The charging current is programmable via a resistor R6. LED D2 is a charging indicator.
A minimum bypass capacitor of 1 µF is recommended by the datasheet [34] both for the
input and output of the device. C5 and C6 are used as supply bypass capacitors, a 10 µF
ceramic capacitor is used for each.
Figure 24. Battery charging circuit for optimized design

60
Undervoltage protection & main power switch
While the MCP73123 does provide a lot of features, it cannot do the most important
protection for rechargeable lithium batteries – undervoltage protection. For 3.7 V nominal
Li-Ion batteries, protection IC’s with all necessary functions are very common, however
for LiFePO4 batteries, not so much. The undervoltage protection was designed from a
system supervisor IC (On Semiconductor MAX809) and a n-type MOSFET (Infineon
IRL6342) on the low side of the battery as on the schematic on Figure 25.
Figure 25. Over discharge protection for optimized design
When the supply falls under the specified voltage of the MAX809, the supply current for
the IC is typically as low as 0.5 µA, making sure the protection circuit doesn’t drain the
battery while it’s in protection mode. In this case, a 2.9 V supervisor was used, as the next
lower voltage option would set the limit dangerously low – there has to be a capacity
buffer for the time that the user doesn’t recharge the battery.
The over-discharge protection was also used for switching the main power to the device,
since it already has a MOSFET to switch the battery. For that, a switch was connected
between the Vcc of the MAX809 IC and the positive of the battery. This way, the switch
can have a low current carrying capability, since it is only supplying the IC. Since it is
possible to program the device into a very low power sleep mode, the switch can be
bypassed with a jumper and the device can be woken up for example through a push of
one of the UI buttons or through Bluetooth.

61
USB connection, USB to Serial interface
Since by default, this controller is programmed over UART, a USB to Serial interface
was implemented in the optimized design, together with auto-reset functionality to put
the device into the correct mode for programming, the solution can be seen on Figure 26.
The IC used as the interface is a CH340C, a very common device on microcontroller
development boards. This also allows the thermostat to be used through a computer UI
via USB, which might be a preferred method if the device is used mostly in a stationary
application. The suffix C in the part name indicates that it has an onboard oscillator.
The power for the USB-UART interface is taken from USB, not the main supply of the
device – a typical mistake done on practically all ESP32 development boards for battery
use. This would drain the battery, unless some sort of switch is implemented, however,
this is unnecessary, since the device is only in use when USB is connected anyway. A
separate low power, low cost regulator was used for this.
The USB input is protected with a fuse and a diode for reverse polarity protection. A
Zener diode could be used to also clamp the input voltage on the high side, however, all
devices using the 5 V supply from the USB input have a wide enough input range to
consider not using one. Since this is a low-cost device, more sophisticated protection
solutions such as TVS diodes and specialized protection IC’s were excluded.
A 0.1-inch header was also added to the board, with connections to UART RxD, TxD,
DTR, RTS; and the battery positive and negative, to have an option of programming the
board via an external USB to UART interface.

62
Figure 26. USB connection and USB-Serial interface for the optimized device
Heater control
As before, heater power output is controlled via PWM of the heater on the low side with
a NMOS transistor. In the optimized version, an Infineon IRL6342 is used, which was
also used for the main power switch with over discharge protection. The MOSFET is a
logic level control FET, made for battery operated DC motor inverter and system/load
switch applications. It has a very low RDS(ON) of 14.6 mΩ, and the gate threshold voltage
is between 0.5 – 1.1 V. Also the input capacitance is quite low, which is good for high
frequency PWM straight from the MCU’s IO pin.
Again, low side current monitoring is used for the heater, this time using five 1 Ω resistors
in parallel, for a 0.2 Ω shunt resistor. Using common resistor values in parallel gives a
cost advantage over using a high power current shunt resistor. Paralleling up resistors will
also statistically reduce the tolerance of the resistance, if the resistance of the devices
follow a flat or even better a gaussian distribution. As an example, the cheapest 1 ohm
0.25 W SMD resistors from Farnell cost 1,69 Euros for 100 pcs. The cheapest 0.22 ohm
1W SMD resistor costs 5,7 Euros for 20 pcs from the same source. Both cover the need
of 20 boards. The biggest advantage of the single resistor is that it is more compact. The
solution can be seen on Figure 27.

63
Figure 27. Heater control MOSFET and current sense shunt for optimized device
External ADC
While in the prototype, an external ADC module was used on a separate PCB, in this
case, the ADS1115 IC was put on the same board. The datasheet recommends the usual
100 nF bypass capacitor on the supply pins, an extra 1 µF was added to further smooth
the supply, as can be seen on the schematic on Figure 28.
Since the ADC has 4 channels, usable as single-ended or up to 2 differential inputs, and
we only need to measure 3 single ended values, the current sensing was set as a
differential input. Since it is a relatively high current load, it might pull the ground
potential higher than it is on the ADC, so a differential reading might be more accurate.
The temperature sensing was done as before – with a known shunt resistor. The resistor
was chosen to give the best resolution with a constant gain on the PGA of the amplifier,
however, the PGA can be used for auto-ranging to get even better resolution. All inputs
were filtered with a 1 kΩ - 1 µF RC low pass filter. For the thermistor and battery voltage
input, these are for noise immunity, since these signals are really much slower than it
makes sense to filter in the analogue domain. The current sense filtering however is
necessary, because the drive waveform for the heater is PWM, but the current reading has
to be analogue. The PWM is run at 10 kHz at the moment and the RC filter has a cut-off
frequency around 160 Hz, which will filter out the rectangular signal, but won’t make it
too slow to react.

64
Figure 28. External ADC circuitry for the optimized device
MCU and the user interface
In the prototype, the MCU was on a Wemos TTGO Mini32 V2.0 development board,
which used the ESP32-D0WD SOC. For the designed device, an ESP32-WROOM-32D
system-on-module was used. It integrates the same SOC with EEPROM memory and all
the necessary crystals and bypassing, together with a metal case for interference shielding
and a PCB antenna. The module has also been approved by the European and FCC testers.
For the user interface, instead of using 3 buttons, a rotary encoder with an integrated
pushbutton was used, because it is more comfortable and faster to navigate through the
menus and set the different parameters with this interface. An RGB LED and a buzzer
were also added to the board for user feedback. The OLED screen was upgraded to a
bigger size (1.3” instead of 0.96”) for better visibility.
Since the MCU is known to generate up to 500 mA peaks of current draw, the module
was bypassed with both a 100 nF and a 10 µF ceramic capacitor. There is some bypassing
on the module as well but to keep the current paths as short as possible they were included.
The implementation of the MCU and UI can be seen below on Figure 29.

65
Figure 29. MCU and UI schematic for optimized design
PCB Design
The PCB was laid out on a two-layer PCB. The size of the PCB was determined by the
layout of the user interface – the screen and the encoder. Since the encoder will most
probably have some sort of wheel type knob on it, it needs some space from the screen.
On the edge opposite of the screen, there is a micro-USB connector and the power switch.
Next to the USB connector is a side-view LED to indicate the charging status.
The ground plane was split into three – battery negative, digital ground and analogue
ground. Battery negative is needed for the charger and the USB port, because they need
to be able to charge the battery even when it is in undervoltage protection. The USB-
UART interface and undervoltage protection also use the uninterrupted battery negative
connection. The analogue ground plane is used for the ADC, it is separated to try and
isolate the analogue part from digital noise. The whole bottom side of the board is covered
with the ground plane with as little interruptions as possible, except for under the antenna,
where no copper was laid out. The split planes connect to the same point where the
MOSFET switches ground and battery negative together.
Each component was laid out to the manufacturer’s datasheet specification, taking into
account the thermal requirements and also the common good practices like keeping the

66
traces as short as possible, routing the differential signals as differential pairs, bypassing
each IC, etc.
Since this is still most probably going to be a prototype for a more finalized product, hand
soldering was considered for the layout, using footprints with elongated pads where
applicable.
A 3D rendering of the designed PCB can be seen below on Figure 30. The PCB total size
came to 73 x 53 mm. The electronics including everything visible on Figure 30, costs
approximately 15 Euros at a very small volume of 10 boards with most components
sourced from Mouser. Of course, the price will only be reduced with quantity. The price
could also be reduced a lot by disregarding the screen and encoder, which together cost
almost 5 Euros. This could be easily done as an option, because not everyone would need
the physical UI.
Figure 30. 3D rendering of the PCB for the optimized design
A conceptual model visualization of the newly designed PCB and in an enclosure with
the proposed user interface can be seen on Figure 31. The encoder wheel would be backlit
by the RGB LED giving visual feedback about the status of the device. The height of the
enclosure would be around a compact 35 mm instead of the initial 50 mm of the prototype,

67
while still allowing a LiFePO4 battery with a capacity up to around 5000 mAh to fit
effortlessly. The model in Figure 31 represents the size of Turnigy Nano-Tech 4200 mAh
LiFePO4 battery.
Figure 31. Conceptual model rendering of a section of the enclosure and user interface for the imroved
electronics design. The grey block under the circuit board represents a Turnigy 4200 mAh LiFePO4 battery
for size reference.
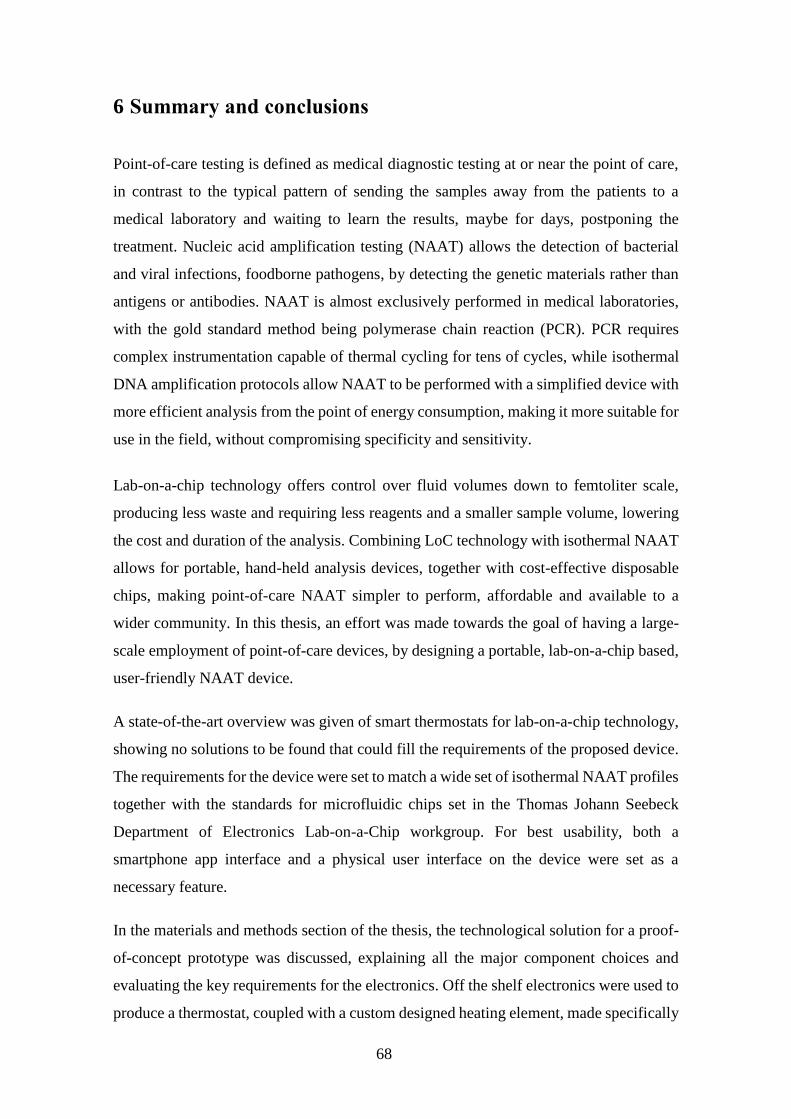
68
6 Summary and conclusions
Point-of-care testing is defined as medical diagnostic testing at or near the point of care,
in contrast to the typical pattern of sending the samples away from the patients to a
medical laboratory and waiting to learn the results, maybe for days, postponing the
treatment. Nucleic acid amplification testing (NAAT) allows the detection of bacterial
and viral infections, foodborne pathogens, by detecting the genetic materials rather than
antigens or antibodies. NAAT is almost exclusively performed in medical laboratories,
with the gold standard method being polymerase chain reaction (PCR). PCR requires
complex instrumentation capable of thermal cycling for tens of cycles, while isothermal
DNA amplification protocols allow NAAT to be performed with a simplified device with
more efficient analysis from the point of energy consumption, making it more suitable for
use in the field, without compromising specificity and sensitivity.
Lab-on-a-chip technology offers control over fluid volumes down to femtoliter scale,
producing less waste and requiring less reagents and a smaller sample volume, lowering
the cost and duration of the analysis. Combining LoC technology with isothermal NAAT
allows for portable, hand-held analysis devices, together with cost-effective disposable
chips, making point-of-care NAAT simpler to perform, affordable and available to a
wider community. In this thesis, an effort was made towards the goal of having a large-
scale employment of point-of-care devices, by designing a portable, lab-on-a-chip based,
user-friendly NAAT device.
A state-of-the-art overview was given of smart thermostats for lab-on-a-chip technology,
showing no solutions to be found that could fill the requirements of the proposed device.
The requirements for the device were set to match a wide set of isothermal NAAT profiles
together with the standards for microfluidic chips set in the Thomas Johann Seebeck
Department of Electronics Lab-on-a-Chip workgroup. For best usability, both a
smartphone app interface and a physical user interface on the device were set as a
necessary feature.
In the materials and methods section of the thesis, the technological solution for a proof-
of-concept prototype was discussed, explaining all the major component choices and
evaluating the key requirements for the electronics. Off the shelf electronics were used to
produce a thermostat, coupled with a custom designed heating element, made specifically

69
for use with 20 mm by 30 mm microfluidic cartridges. A microreactor cartridge with a
50 µL volume was designed together with a suitable chip holding interface to clamp the
heater and chip together, all integrated into a simple enclosure for testing and analysis of
the concept. The software of the proof-of-concept prototype included a PID algorithm for
temperature control, the Steinhart-Hart equation to convert thermistor resistance to
temperature, Bluetooth communication for wireless control and interfacing and
debugging functionality to allow data collection over USB for analysis purposes.
The prototype was constructed with materials available in a short timeframe, to have an
experimental platform to evaluate and further develop the device. A special microfluidic
chip was fabricated for testing purposes, with features to include a temperature sensor in
the reaction chamber. A thermistor was embedded into the chip and an Agilent 34410A
benchtop digital multimeter was used to measure the temperature of the liquid inside the
microreactor. The data was recorded by a PC, controlling the multimeter through SCPI
via USB with a National Instruments Labview virtual instrument (VI). The thermostat
was programmed to send all of its process variables and PID algorithm internal values
over UART to USB to the PC, using PuTTy as the terminal software to collect the data.
Together with the experimental setup, a model for simulated thermal analysis was
designed in COMSOL® Multiphysics 5.4, with a simplified 3D model of the prototype,
to have access to temperature data that would not be reasonable or realistic to measure on
the physical device.
Both experimental and simulated thermal analysis were performed on the thermostat
prototype to evaluate the performance of the device. Tests were carried out both
throughout the operating ambient temperature and set point range, including in itself at
least 12 distinct isothermal amplification protocols. The prototype was capable of
regulating the reaction temperature in the allowed ranges with maximum steady-state
errors below 0.7 °C, with the average SSE under 0.38 °C, without special calibration.
Target temperatures were reached within less than 8 minutes for the highest setpoints,
again, without compensating for the thermal capacity – not allowing the heater to go over
the setpoint even in the heat-up period of the system.
The simulation model was verified by comparing infrared thermal camera images to
simulation results, together with the sensor data from the microfluidic chip. The model
was solved using the Stationary Solver of COMSOL. An estimation error of less than 0.2

70
°C was found from the comparison with the thermal image, well within the required SSE
range. The mean estimation error calculated from the absolute error between
experimentally measured reaction chamber temperature and the simulation was 0.25 °C
(± 0.16 °C), with the highest error being 0.53 °C, all within the required range. As a result
of the simulation, the volume of reaction liquid in the allowed temperature range could
be calculated. For a successful amplification reaction, about 85 % of the liquid had to be
in the specified temperature range, that is 42.5 µL for a 50 µL reaction volume. The lowest
calculated value was 43.32 µL at a set point of 60 °C and the average was 46.59 µL, both
above the required threshold.
As a conclusion, the results of the experimental and simulated thermal analysis showed,
that the prototype was capable of regulating the reaction temperature in the allowed
ranges for all tested setpoints, covering 12 distinct isothermal amplification protocols,
with the maximum steady-state error below 0.7 °C. Furthermore, the simulation results
show that for each of the tested setpoints, the volume in the required temperature range
was sufficient to have a successful amplification assay, proving the concept of the device
viable.
Lastly, since the idea of the prototype was mainly to have a testing platform to make
proof-of-concept testing and evaluation, the design of the device was taken through
another iteration, taking into consideration different issues and optimization opportunities
offered during the testing. A specialized PCB was designed for the thermostat, with cost-
optimized components while increasing the performance. The final design offers a
solution, which is producible, low-cost and more robust than the initial prototype.

71
References
[1] K. Gabriel, J. Jarvis, and W. Trimmer, Small Machines, Large Opportunities: A
Report on the Emerging Field of Microdynamics : Report of the Workshop on
Microelectromechanical Systems Research ; Sponsored by the National Science
Foundation. AT&T Bell Laboratories, 1988.
[2] J. B. Angell, S. C. Terry, and P. W. Barth, “Silicon Micromechanical Devices,”
Scientific American, vol. 248. Scientific American, a division of Nature America,
Inc., pp. 44–55, 1983.
[3] A. Manz, N. Graber, and H. M. Widmer, “Miniaturized total chemical analysis
systems: A novel concept for chemical sensing,” Sensors Actuators B Chem., vol.
1, no. 1–6, pp. 244–248, Jan. 1990.
[4] “, Yole, Yole Développement, microfluidic, microfluidics, fundraising, life
sciences, pharmaceutical, in-vitro diagnostic, medical devices, point of care -
MICROFLUIDIC APPLICATIONS - PLAYERS FOCUS.” [Online]. Available:
http://www.yole.fr/Microfluidic_Applications_Players.aspx#.XM1akqRRWHu.
[Accessed: 04-May-2019].
[5] A. Niemz, T. M. Ferguson, and D. S. Boyle, “Point-of-care nucleic acid testing
for infectious diseases.,” Trends Biotechnol., vol. 29, no. 5, pp. 240–50, May
2011.
[6] V. Miralles et al., “A Review of Heating and Temperature Control in
Microfluidic Systems: Techniques and Applications,” Diagnostics, vol. 3, no. 1,
pp. 33–67, Jan. 2013.
[7] D. J. Sadler, R. Changrani, P. Roberts, Chia-Fu Chou, and F. Zenhausern,
“Thermal management of BioMEMS: Temperature control for ceramic-based
PCR and DNA detection devices,” IEEE Trans. Components Packag. Technol.,
vol. 26, no. 2, pp. 309–316, Jun. 2003.

72
[8] A. I. K. Lao, T. M. H. Lee, I.-M. Hsing, and N. Y. Ip, “Precise temperature
control of microfluidic chamber for gas and liquid phase reactions,” Sensors
Actuators A Phys., vol. 84, no. 1–2, pp. 11–17, Aug. 2000.
[9] D. Moschou et al., “All-plastic, low-power, disposable, continuous-flow PCR
chip with integrated microheaters for rapid DNA amplification,” Sensors
Actuators B Chem., vol. 199, pp. 470–478, Aug. 2014.
[10] T. Pardy, T. Rang, and I. Tulp, “Finite Element Modelling for the Optimization
of Microheating in Disposable Molecular Diagnostics,” Int. J. Comput. Methods
Exp. Meas., vol. 5, no. 1, pp. 13–22, Jan. 2017.
[11] “Microheating Solution for Molecular Diagnostics Devices. Mikrosoojendamine
molekulaardiagnostika seadistes - TTÜR DIGIKOGU.” [Online]. Available:
https://digi.lib.ttu.ee/i/?9249. [Accessed: 21-Apr-2019].
[12] L. M. Zanoli and G. Spoto, “Isothermal amplification methods for the detection
of nucleic acids in microfluidic devices.,” Biosensors, vol. 3, no. 1, pp. 18–43,
Mar. 2013.
[13] “File:Peltierelement.png - Wikimedia Commons.” [Online]. Available:
https://commons.wikimedia.org/wiki/File:Peltierelement.png. [Accessed: 20-
Apr-2019].
[14] “Understanding Etched Foil Heaters | All Flex Heaters.” [Online]. Available:
https://www.allflexheaters.com/understanding-etched-foil-heaters/. [Accessed:
20-Apr-2019].
[15] “Comparison of commercial battery types,” Wikipedia. [Online]. Available:
https://en.wikipedia.org/wiki/Comparison_of_commercial_battery_types.
[Accessed: 01-May-2019].
[16] “Lithium-ion to primary battery power design conversion strategies.” [Online].
Available: https://www.eenewspower.com/content/lithium-ion-primary-battery-
power-design-conversion-strategies/page/0/2. [Accessed: 27-Apr-2019].
[17] Energizer, “Battery and Charger Handbooks.” [Online]. Available:

73
http://data.energizer.com/battery-handbook-crosssections. [Accessed: 27-Apr-
2019].
[18] Maxim Integrated, “Charging Batteries from USB - Application Note -.”
[Online]. Available: https://www.maximintegrated.com/en/app-
notes/index.mvp/id/3607. [Accessed: 27-Apr-2019].
[19] Espressif_Systems, “ESP32 Series (Datasheet).” 2018.
[20] “TTGO MINI32 V2.0.13 ESP32 rev1 (rev one) WiFi + Bluetooth Module For
D1 mini-in Replacement Parts & Accessories from Consumer Electronics on
Aliexpress.com | Alibaba Group.” [Online]. Available:
https://www.aliexpress.com/item/TTGO-MINI32-V2-0-13-ESP32-rev1-rev-one-
WiFi-Bluetooth-Module-For-D1-
mini/32845357819.html?spm=a2g0s.9042311.0.0.27424c4dKtssCO. [Accessed:
21-Apr-2019].
[21] “Overview of materials for Acrylonitrile Butadiene Styrene (ABS), Molded.”
[Online]. Available:
http://www.matweb.com/search/DataSheet.aspx?MatGUID=eb7a78f5948d481c9
493a67f0d089646&ckck=1. [Accessed: 21-Apr-2019].
[22] J. . Ziegler and N. B. Nichols, “Optimum settings for automatic controllers,” vol.
64, pp. 759–768, 1942.
[23] “GitHub - espressif/arduino-esp32: Arduino core for the ESP32.” [Online].
Available: https://github.com/espressif/arduino-esp32. [Accessed: 23-Apr-2019].
[24] “MIT App Inventor | Explore MIT App Inventor.” [Online]. Available:
http://appinventor.mit.edu/explore/#. [Accessed: 04-May-2019].
[25] “GitHub - acrobotic/Ai_Ardulib_SSD1306: Library for using SSD1306-powered
OLED displays in the Arduino IDE.” [Online]. Available:
https://github.com/acrobotic/Ai_Ardulib_SSD1306. [Accessed: 23-Apr-2019].
[26] J. S. Steinhart and S. R. Hart, “Calibration curves for thermistors,” Deep Sea Res.
Oceanogr. Abstr., vol. 15, no. 4, pp. 497–503, Aug. 1968.

74
[27] C. Chen, “Evaluation of resistance–temperature calibration equations for NTC
thermistors,” Measurement, vol. 42, no. 7, pp. 1103–1111, Aug. 2009.
[28] “SRS Thermistor Calculator.” [Online]. Available:
https://www.thinksrs.com/downloads/programs/therm
calc/ntccalibrator/ntccalculator.html. [Accessed: 25-Apr-2019].
[29] “arduino-esp32/libraries/Ticker at master · espressif/arduino-esp32 · GitHub.”
[Online]. Available: https://github.com/espressif/arduino-
esp32/tree/master/libraries/Ticker. [Accessed: 23-Apr-2019].
[30] “GitHub - TonDuino/Arduino_ADS1115_lib: ADS1115 16 bit ADC library for
Arduino.” [Online]. Available:
https://github.com/TonDuino/Arduino_ADS1115_lib. [Accessed: 23-Apr-2019].
[31] “LED Control — ESP-IDF Programming Guide v4.0-dev-402-ga20d02b7f
documentation.” [Online]. Available: https://docs.espressif.com/projects/esp-
idf/en/latest/api-reference/peripherals/ledc.html. [Accessed: 23-Apr-2019].
[32] H. Friess, S. Haussener, A. Steinfeld, and J. Petrasch, “Tetrahedral mesh
generation based on space indicator functions,” Int. J. Numer. Methods Eng., vol.
93, no. 10, pp. 1040–1056, Mar. 2013.
[33] T. Pardy, I. Tulp, C. Kremer, T. Rang, and R. Stewart, “Integrated self-regulating
resistive heating for isothermal nucleic acid amplification tests (NAAT) in Lab-
on-a-Chip (LoC) devices,” PLoS One, vol. 12, no. 12, p. e0189968, Dec. 2017.
[34] “MCP73123 - Battery Management and Fuel Gauges - Battery Management and
Fuel Gauges - Battery Chargers.” [Online]. Available:
https://www.microchip.com/wwwproducts/en/MCP73123. [Accessed: 01-May-
2019].