Development of a new CDM Methodology for Plastics Recycling
19
Development of a new CDM Methodology for Plastics Recycling October 2010 Daniel A. Nolasco and Juan van den Broeck NOLASCO y Asociados S. A., Argentina-Canada www.nolasco.ca
Transcript of Development of a new CDM Methodology for Plastics Recycling

Development of
a new CDM Methodology for
Plastics Recycling
October 2010
Daniel A. Nolasco and Juan van den Broeck
NOLASCO y Asociados S. A., Argentina-Canada
www.nolasco.ca

Objectives
• World Bank’s Carbon Finance Unit’s Project (2009)
• Development of a CDM “Umbrella Methodology” to calculate ERs resulting from replacing virgin raw materials with recycled materials.
• Development of a specific annex: CDM methodology for recycling of high-density and low-density polyethylene (HDPE & LDPE), i.e., “plastics”.
• Provide technical support to get the methodology approved by the CDM Board and apply it to 8 small social recycling facilities in Buenos Aires (CEAMSE).
• Methodology developed based on life-cycle analysis.

Production of Polyethylene (PE)
Ethane
LPG
Gas Oil
Naphtha
Cracking Polimeri-
zation PE
Pellets
Manufacture of PE
products

PE Life Cycle
Oil extraction, refining & transport
Production of PE pellets
Manufacture of PE
products
Product end use
Collection and final
disposal as solid waste
Baseline
Project
Recovery of PE from the
waste stream
Recycling of recovered PE
(washing, drying, etc.)
Manufacture of PE
products
Product end use
Collection and final
disposal as solid waste

CDM Methodology Assumptions
• GHG emissions not taken into account:
Hydrocarbon extraction & transportation to the PE production facility (very conservative approach; yet difficult to estimate with in an acceptable degree of accuracy)
Transportation of PE to manufacturing facilities
Manufacturing of PE products (same process for raw and recycled PE; quality losses are taken into account)
End use, collection, & final disposal of PE (same in both scenarios)
• Project boundaries:
Processing facility: where virgin raw material is produced (facility that produces PE pellets)
Recycling facilities: Facilities where the material is: (a) separated from waste stream, (b) washed, (c) dried, and (d) conditioned to make it usable as raw material in a manufacturing process (granulated and compacted).

Calculations: ERs = BE - PE
Baseline Emissions:
BEi = Σ Q x L x (SEC x EFel + SFC x EFff,g)
Q: Quantity of material recycled (t HDPE or LDPE/year)
L: Net adjustment factor to cover degradation in material quality and material loss in the production process of the final product using the recycled material (0.75)
SEC: Specific electricity consumption for the production of virgin material (0.83 and 1.67 MWh/t for HDPE and LDPE respectively; on polymerization process)
EFel: Emission factor for grid electricity generation (tCO2/MWh)
SFC: Specific fuel consumption for the production of virgin material (15 GJ/t PE on cracking process)
EFff,g: CO2 emission factor for natural gas (tCO2/GJ)

Calculations (cont.)
Project Emissions:
PEi = Q x [EC x EFel + FC x NCV x EFff + SECp x EFel]
Q: Quantity of material recycled (t/year)
EC: Electricity consumption of the recycling facility (MWh/t PE)
EFel: Emission factor for grid electricity generation (tCO2/MWh)
FC: Fuel consumption of the recycling facility (unit mass or volume/t PE)
NCV: Net calorific value of the fossil fuel consumed in the recycling facility (GJ/unit mass or volume)
EFff: CO2 emission factor of the fossil fuel consumed at the recycling facility (tCO2/GJ)
SECp: Specific electricity consumption for the processing/manufacturing which makes plastic resin out of recycled PE flakes (0.5 MWh/t PE = 1.8 GJ/t PE)

Case study 1: CEAMSE Buenos Aires
8 small facilities recuperating 18,000 t/yr, of which 240 t HDPE + 240 t HDPE are recycled every year
Separation
Classification
Packing for transport
Rejection (returned to sanitary landfill)

Case study 1: CEAMSE Buenos Aires
8 small facilities recuperating 18,000 t/yr, of which 240 t HDPE + 240 t HDPE are recycled every year
Separation
Classification
Packing for transport
Rejection (returned to
sanitary landfill)

Case study 1: CEAMSE Buenos Aires
8 small facilities recuperating 18,000 t/yr, of which 240 t HDPE + 240 t HDPE are recycled every year
Separation
Classification
Packing for transport
Rejection (returned to sanitary landfill)

Case study 1: CEAMSE Buenos Aires
8 small facilities recuperating 18,000 t/yr, of which 240 t HDPE + 240 t HDPE are recycled every year
Selection
Classification
Packing for transport
Rejection (returned to sanitary landfill)

Case study 1: CEAMSE Buenos Aires
Baseline emissions:
BEHDPE = 241 tCO2/yr + BELDPE = 342 tCO2/yr
BE = 583 tCO2/yr
Project Emissions:
PE = 241 tCO2/yr
Emission Reductions:
ER = BE – PE = 583 tCO2/yr – 241 tCO2/yr
ER = 342 tCO2/yr
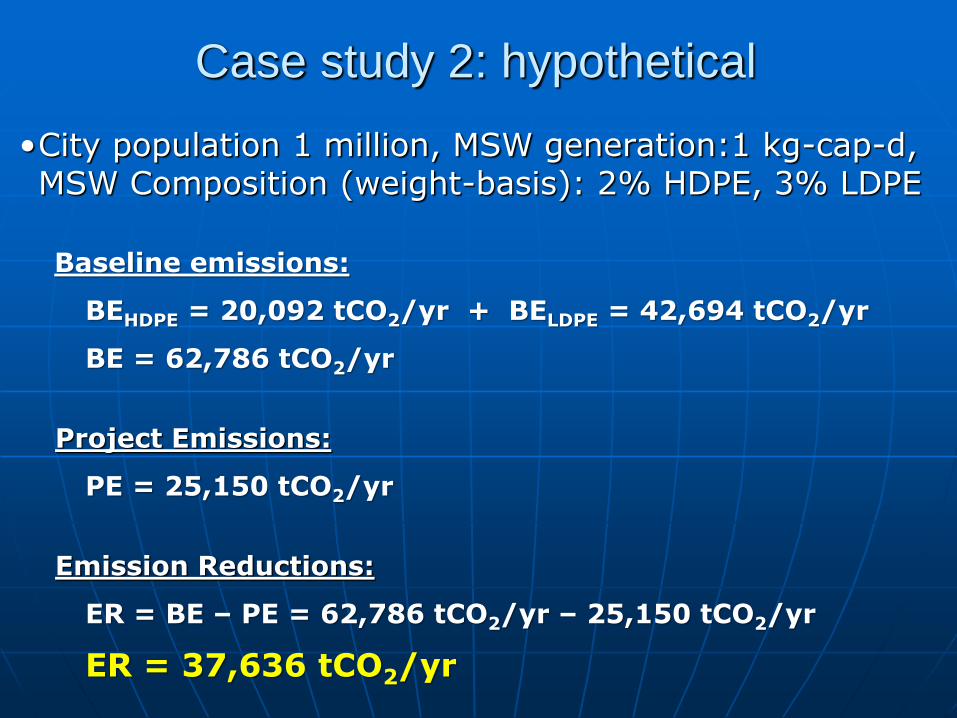
Case study 2: hypothetical
•City population 1 million, MSW generation:1 kg-cap-d, MSW Composition (weight-basis): 2% HDPE, 3% LDPE
Baseline emissions:
BEHDPE = 20,092 tCO2/yr + BELDPE = 42,694 tCO2/yr
BE = 62,786 tCO2/yr
Project Emissions:
PE = 25,150 tCO2/yr
Emission Reductions:
ER = BE – PE = 62,786 tCO2/yr – 25,150 tCO2/yr
ER = 37,636 tCO2/yr

AMS-III.AJ CDM Executive Board approved “AMS-III.AJ Recovery
and recycling of materials from solid wastes”
Applies to “HDPE and LDPE plastics recovered from MSW in the recycling facilities are further processed in manufacturing facilities to produce intermediate and finished products … to displace production of virgin HDPE and LDPE materials in dedicated facilities thereby resulting in energy savings and emission reduction”.
ERs and economic benefits go way beyond those captured by CDM methodology

Issues related to the development of
new CDM methodologies for recycling
Other annexes to be developed within the “umbrella” methodology, e.g., annexes for cardboard, paper, glass, etc.
• Need to work with materials which are recycled in a closed-loop fashion (the recycled material replaces the
same material)
• Need to take into account quality changes in the recycled material.
• Additionality: The existing recycling facilities work in an informal way because their budget is too reduced to afford meeting legal requirements. CERs issuance contributes to reduce informality and/or to raise income to more acceptable level.

¡ Muchas gracias !
Judie Godin, CFU World Bank
John Vlachopoulos, McMaster U.
Sabina Yunis, NOLASCO y Asoc.
Horacio Terraza, IADB
For additional info: [email protected]

Development of
a CDM Methodology for
Plastics Recycling
For more information:

Case study 1: CEAMSE Buenos Aires
BEi = Σ Q x L x (SEC x EFel + SFC x EFff,g)
BEHDPE = 240 t HDPE/year x 0.75 x (0.83 MWh/t PE x 0.6 tCO2/MWh + 15 GJ/tPE x 0.0561 tCO2/GJ) = 241 tCO2/year
BELDPE = 240 t LDPE/year x 0.75 x (1.76 MWh/t PE x 0.6 tCO2/MWh + 15 GJ/t PE x 0.0561 tCO2/GJ) = 342 tCO2/year
BE = 583 tCO2/year
PEi = Σ Q x (EC x EFel + FC x NCV x EFff + SECp x EFel)
PE = 480 t PE/yr x (0.3 MWh/t PE x 0.6 tCO2/MWh + 0.00768 t diesel/t PE x 40 GJ/t diesel x 0.0741 tCO2/GJ + 0.5 MWh/t PE x 0.6 tCO2/MWh)
PE = 480 t CO2e/yr x (0.18 + 0.023 + 0.3)
PE = 241 tCO2/year
ER = 583 – 241
ER = 342 tCO2/year

Case study 2: hypothetical
• City population 1 million, Solid waste generation:1 kg/person/d, SW composition: 2% HDPE, 3% LDPE
Baseline: BEi = Σ Q x L x (SEC x EFel + SFC x EFff,g)
BEHDPE = 20,000 t HDPE/year x 0.75 x (0.83 MWh/t PE x 0.6 tCO2/MWh + 15 GJ/tPE x 0.0561 tCO2/GJ)
BEHDPE = 20,092 tCO2/year
BELDPE = 30,000 t LDPE/year x 0.75 x (1.76 MWh/t PE x 0.6 tCO2/MWh + 15 GJ/t PE x 0.0561 tCO2/GJ)
BELDPE = 42,694 tCO2/year
BE = 62,786 tCO2/year
Project: PEi = Σ Q x (EC x EFel + FC x NCV x EFff + SECp x EFel)
PE = 50,000 t PE/yr (0.3 MWh/t PE x 0.6 tCO2/MWh + 0.00768 t diesel/t PE x 40 GJ/t diesel x 0.0741 tCO2/GJ + 0.5 MWh/t PE x 0.6 tCO2/MWh)
PE = 50,000 x (0.18 + 0.023 + 0.3)
PE = 25,150 tCO2/year
Emission Reductions = 62,786 – 25,150 = 37,636 tCO2/year