
DEVELOPMENT OF A MECHANICAL TESTING AND … · E-mail: [email protected] ... (Winterthur,...
13
48 European Cells and Materials Vol. 5. 2003 (pages 48-60) DOI: 10.22203/eCM.v005a05 ISSN 1473-2262 Abstract A highly accurate (±3%) mechanical loading and meas- urement system combined with a trabecular bone diffu- sion culture-loading chamber has been developed, which provides the ability to study trabecular bone (and possi- bly) cartilage under controlled culture and loading condi- tions over long periods of time. The loading device has been designed to work in two main modes, either to apply a specific compressive strain to a trabecular bone cylinder or to apply a specific force and measure the resulting de- formation. Presently, precisely machined bone cylinders can be loaded at frequencies between 0.1 Hz to 50 Hz and amplitudes over 7,000μe. The system allows accurate meas- urement of many mechanical properties of the tissue in real time, including visco-elastic properties. This paper describes the technical components, reproducibility, pre- cision, and the calibration procedures of the loading sys- tem. Data on long term culture and mechanical responses to different loading patterns will be published separately. Key Words: Trabecular bone diffusion, static and dynamic mechanical loading, biological stimulation, stiffness-meas- urements, Young’s Modulus. * Address for correspondence: David B. Jones Department of Experimental Orthopaedics and Biome- chanics University of Marburg Baldinger Str. D-35033 Marburg, Germany Phone number: +49-6421-286-6484 FAX number: +49-6421-286-8981 E-mail: [email protected] Introduction Numerous in vivo and in vitro models have been devel- oped to investigate the changes in bone metabolism and bone morphological changes, induced by mechanical loading. While significant progress has been made, the transducing mechanisms behind mechano-sensing with regard to the sensing system and which cell type or types are responding remain unknown. These models utilize cell culture (Yeh and Rodan, 1984; Jones et al., 1995, Zaman et al., 1997) organ culture (Rodan et al., 1975; Cheng et al., 1996) or the whole organism (Rubin and Lanyon, 1987; Chow et al., 1998; Ahkter et al., 2002; Rubin et al., 2002). Cells in bioreactors have also been investigated (for example: Botchway et al., 2001). None of these in vitro models reproduce the amplitudes, direc- tion, mode or frequencies occurring in the loaded tissue in vivo due to the highly complex nature of physiological loading. Another method is to cut portions of bone, such as trabecular bone, to shape, which makes loading more quantitative (e.g. El Haj et al., 1990) but do not allow good tissue physiology. Bone cells in vitro may appear to respond to physical stimuli by a number of mechanisms, but they are not grown under physiological conditions and the results may reflect a number of culture artefacts rather than a real physiological response. Organ cultures do not have a blood supply and quickly degenerate a few hundred mi- crometers from the surface. Application of mechanical loads is difficult to quantify in this model. Animal ex- periments are expensive and difficult to perform. This is perhaps why it has been noticed that bone cells and bone organ culture appear to respond differently to dynamic strain (Rawlinson et al., 1995) as well as the strain in the animal. Current bone testing and loading systems that are used to evaluate and test living tissue use hydraulics or a vari- ety of levers, cams, and screws do not have the capability to provide tightly controlled real-time measurements of force and deformation under dynamic loading conditions, especially at frequencies above 10Hz. The quantification of forces is also difficult, especially in organ culture mod- els. Other loading systems, using segments of bone or whole bones, estimate or calculate strain distributions from a limited number of measurements on specimens using strain gauges. A precise and quantifiable loading system is neces- sary in order to apply well-defined mechanical perturbations to specimens that can vary widely in their material and structural properties. We are aware that al- though the compressions and forces may be applied with high precision, the deformations within the tissue that DEVELOPMENT OF A MECHANICAL TESTING AND LOADING SYSTEM FOR TRABECULAR BONE STUDIES FOR LONG TERM CULTURE D.B. Jones 1* , E. Broeckmann 1 , T. Pohl 1 and E.L. Smith 2 1 Department of Experimental Orthopaedics and Biomechanics, University of Marburg, Germany 2 Biogerontology Laboratory, Department of Population Health Sciences, University of Wisconsin-Medical School, Madison, WI, USA
Transcript of DEVELOPMENT OF A MECHANICAL TESTING AND … · E-mail: [email protected] ... (Winterthur,...

48
D B Jones et al. A New Mechanical Testing/Loading System for Bone StudiesEuropean Cells and Materials Vol. 5. 2003 (pages 48-60) DOI: 10.22203/eCM.v005a05 ISSN 1473-2262
Abstract
A highly accurate (±3%) mechanical loading and meas-urement system combined with a trabecular bone diffu-sion culture-loading chamber has been developed, whichprovides the ability to study trabecular bone (and possi-bly) cartilage under controlled culture and loading condi-tions over long periods of time. The loading device hasbeen designed to work in two main modes, either to applya specific compressive strain to a trabecular bone cylinderor to apply a specific force and measure the resulting de-formation. Presently, precisely machined bone cylinderscan be loaded at frequencies between 0.1 Hz to 50 Hz andamplitudes over 7,000µe. The system allows accurate meas-urement of many mechanical properties of the tissue inreal time, including visco-elastic properties. This paperdescribes the technical components, reproducibility, pre-cision, and the calibration procedures of the loading sys-tem. Data on long term culture and mechanical responsesto different loading patterns will be published separately.
Key Words: Trabecular bone diffusion, static and dynamicmechanical loading, biological stimulation, stiffness-meas-urements, Young’s Modulus.
* Address for correspondence:David B. JonesDepartment of Experimental Orthopaedics and Biome-chanicsUniversity of MarburgBaldinger Str.D-35033 Marburg, Germany
Phone number: +49-6421-286-6484FAX number: +49-6421-286-8981
E-mail: [email protected]
Introduction
Numerous in vivo and in vitro models have been devel-oped to investigate the changes in bone metabolism andbone morphological changes, induced by mechanicalloading. While significant progress has been made, thetransducing mechanisms behind mechano-sensing withregard to the sensing system and which cell type or typesare responding remain unknown. These models utilizecell culture (Yeh and Rodan, 1984; Jones et al., 1995,Zaman et al., 1997) organ culture (Rodan et al., 1975;Cheng et al., 1996) or the whole organism (Rubin andLanyon, 1987; Chow et al., 1998; Ahkter et al., 2002;Rubin et al., 2002). Cells in bioreactors have also beeninvestigated (for example: Botchway et al., 2001). Noneof these in vitro models reproduce the amplitudes, direc-tion, mode or frequencies occurring in the loaded tissuein vivo due to the highly complex nature of physiologicalloading. Another method is to cut portions of bone, suchas trabecular bone, to shape, which makes loading morequantitative (e.g. El Haj et al., 1990) but do not allowgood tissue physiology.
Bone cells in vitro may appear to respond to physicalstimuli by a number of mechanisms, but they are notgrown under physiological conditions and the results mayreflect a number of culture artefacts rather than a realphysiological response. Organ cultures do not have ablood supply and quickly degenerate a few hundred mi-crometers from the surface. Application of mechanicalloads is difficult to quantify in this model. Animal ex-periments are expensive and difficult to perform. This isperhaps why it has been noticed that bone cells and boneorgan culture appear to respond differently to dynamicstrain (Rawlinson et al., 1995) as well as the strain inthe animal.
Current bone testing and loading systems that are usedto evaluate and test living tissue use hydraulics or a vari-ety of levers, cams, and screws do not have the capabilityto provide tightly controlled real-time measurements offorce and deformation under dynamic loading conditions,especially at frequencies above 10Hz. The quantificationof forces is also difficult, especially in organ culture mod-els. Other loading systems, using segments of bone orwhole bones, estimate or calculate strain distributionsfrom a limited number of measurements on specimensusing strain gauges.
A precise and quantifiable loading system is neces-sary in order to apply well-defined mechanicalperturbations to specimens that can vary widely in theirmaterial and structural properties. We are aware that al-though the compressions and forces may be applied withhigh precision, the deformations within the tissue that
DEVELOPMENT OF A MECHANICAL TESTING AND LOADING SYSTEM FORTRABECULAR BONE STUDIES FOR LONG TERM CULTURE
D.B. Jones1*, E. Broeckmann1, T. Pohl1 and E.L. Smith2
1 Department of Experimental Orthopaedics and Biomechanics, University of Marburg, Germany2 Biogerontology Laboratory, Department of Population Health Sciences, University of Wisconsin-Medical School,
Madison, WI, USA

49
D B Jones et al. A New Mechanical Testing/Loading System for Bone Studies
result are highly complex.The purpose of this paper is to describe the technical
components, reproducibility, precision, and the calibra-tion procedures of the loading system (Figure 1) the cul-ture loading chamber and the associated technology willbe presented in detail elsewhere. In preliminary studiestrabecular bone cores have been maintained viable duringnon-loading (Smith et al., submitted for publication) andloading conditions in the culture loading chambers for 28day (bovine) (Smith. et al., 2000) and 49 days (humanfemur). (Smith et al., 2001). Our bone samples were ob-tained from bovine and human trabecular bone tissue andprepared under sterile environments in a laboratory of theclinic of the University of Marburg.
The Loading System
The loading system (LS) (Figure 1) consists of a resistiveframe of steel bolts with stainless steel end caps and analuminium housing. A screw mechanism raises and low-ers the load sensor – piezo-electric actuator unit with theload sensor type 9011A, made by KISTLER™(Winterthur, Switzerland) (Figure 1a) and with the piezo-electric actuator (PZA) type P-239K078 (including straingauges) made by Physik Instrumente™,(PI) (Karlsruhe,Germany) (Figure 1b) within the aluminium housing.Using the screw mechanism a small static preload maybe applied to a sample. Any further desired preloads areapplied by the PZA. This brings the interfacing surfacesof the machine and the machine-bone interfaces into con-tact (see below).
Figure 1: The housing of the loading device is made of three cylindrical sections, 15 centimetres in diameter,bolted together with six hardened steel bolts. The front of the housing has an opening for placing the culture bonechamber in position for loading. The chamber is centrally positioned by mechanical stops in the rear of theopening assuring that the chamber is directly centred under the piezo-electric actuator. At the top of the housingis a screw mechanism to raise and lower the actuator onto the bone chamber. It is also used to induce a mechanicalpreload on the bone cores by hand. Sensors and actuators are shown in the figures on the right: (a): force sensor,(b): piezo-electric actuator with a build-in strain gauge sensor to measure the actuator’s expansion, (d): bonechamber. All these components are placed on-axis in the middle of the loading device.

50
D B Jones et al. A New Mechanical Testing/Loading System for Bone Studies
A high voltage amplifier (PI type E-420.00), whose in-put is connected to the analogue output of a microcontrollercircuit (in house design), activates the PZA. Together witha WINDOWS based user interface program it is possible toapply a quantifiable force or a quantifiable deformation ofthe bone core in the culture-loading chamber. Themicrocontroller and associated electronic system and sen-sors work independently of the PC’s operating system andrecord and store real-time measurements of both PZA’s ex-pansion (from strain gauges) and force (load cell). The LSis currently configured to load trabecular bone cores 5 or10 mm in height and 10 mm or 12 mm in diameter, that arehoused in a culture loading chamber (Figure 1d).
Piezo-Electric Actuator/Expansion Sensor
The stiffness of the PZA is 128N/µm. It can apply forces ofup to 4,500N. The maximum expansion depends on theload application. The nominal maximum expansion underno load conditions is typically 60µm. These types of actua-tors show small hysteresis effects. Their expansion at con-stant drive voltage also depends slightly on previous ex-pansions. In dynamic operation the amplitude of expan-sion depends on the operation frequency in combination toresonant frequency of the PZA in connection to the oscil-lating effective mass, visco-elasticity and stiffness of thebone or other material to be loaded. Furthermore the PZA’s
expansion does not follow the high voltage amplifier’sinput signal congruently at frequencies higher than 50Hz. Frequencies above 50 Hz cause an amplitude drop,a phase shift, and the actuator’s dynamic response less-ens resulting in a distortion of the actuator’s displace-ment waveform. This is a result of the power range andthe dynamic response of the commercial amplifier. Thusthe expansion of the PZA cannot be derived from thepiezo’s drive voltage directly. The measurement of ex-pansion requires a separate expansion sensor, which maybe configured with strain gauge sensors or capacitivecoupled sensors to determine the precise (±20nm or±1nm respectively) actuator’s expansion. We used thePZA equipped with strain gauges, configured as aWheatstone bridge as an established standard solutionin strain measurements.
The lower contact surface of the PZA is covered witha sapphire plano-convex lens (VICTOR KYBURZ AG,Safnern, CH) with a radius of 50.8 mm (2 inch) (Figure1c). The spherical nature of the contact surface allowsfor loading adaptation of the system to slightly non-par-allel bone sample surfaces and prevents bending stresswithin the crystal stack and in case there is a wedge-shaped gap between the PZA and the loading piston.The design of the culture loading chamber (Figure 1d),in which the loading piston is sealed with an ‘X’ ring(‘Quad ring’ Busak & Shamban S.A. Crissier, CH No.
Figure 2: The Data Acquisition Module contains two identical programmable low pass filters for noise reduc-tion. The two sample/hold-amplifiers [S/H] have the control line in common to provide simultaneous samplingof force- and expansion signal. By use of a 2 to 1 multiplexer this board needs only one analogue-digital-converter [A/D]. This figure also shows the principle circuit diagram of a charge amplifier (middle, left), whichis used to amplify the force sensor’s response. The amplifier works as a current integrator presenting an outputvoltage linear to input charge. The relay is used to set the output to zero thereby removing residual charge. Theexpansion sensor is shown in the top left corner. This is a four-element strain gauge sensor. The gauges areconfigured as a Wheatstone bridge. An instrumentation amplifier intensifies the cross voltage of the bridge by afactor of approximately 500.

51
D B Jones et al. A New Mechanical Testing/Loading System for Bone Studies
QRAR4111A-E7509) also allows some accommodationof non-parallelity of up to 50µm (the theoretic limit dueto the bone chamber’s geometric tolerances). Howeverthe precision of the sample is kept within ± 2µm in rough-ness and parallelity by using precise histological diamondannular and band saws to minimize non-linearities in themeasurement data.
Electronic Modules
The PZA is driven by a High Voltage Piezo-Actuator(HVPZT) Amplifier (Physik Instrumente™, (PI) type E-420.00). The output voltage range is 0 to -1000 volts. Thehigh voltage amplifier (bottom left in Figure 2) has itsown power supply, and is switched on/off by themicrocontroller of the electronic system (see below).
Data Acquisition Module
This module contains sensor amplifiers, a digital-ana-logue-converter (DAC), an analogue-digital-converter(ADC), filters and sample-hold circuits and was designedand built in-house. Figure 2 shows all parts of this mod-ule in a box together with sensors, sensor amplifiers andthe HVPZT-amplifier. The outputs of the sensor amplifi-ers are passed to switched capacitor low pass filters fornoise reduction. The common cut-off frequency of the fil-ters is set by the microcontroller. Sample/hold amplifiersallow exact simultaneously sampling of the analogue sig-nals, which represent values of force and PZA’s expan-sion.
Microcontroller Module
To avoid complications with critical timing in multitaskingoperating systems on a host personal computer, a sepa-rate microcontroller circuit was designed within the ba-
sic electronics of the loading system. This is designed forreal-time data collection from force and expansion sensoreven at high sampling frequencies up to several kHz. Themodule includes a microcontroller board (type “BDE-module 517-light”, manufacturer: PHYTEC™, Germany),which carries a PC-card memory and a microcontrollerof type 80C517 (Siemens™), comprehending the estab-lished Intel 8051 CPU-core.
The memory organization of the microcontroller mod-ule is shown in Figure 3. Data is collected with 12 bits ofresolution. The oscillation-pattern RAM is provided tostore downloaded data, for instance a dynamic stimula-tion pattern, whereas the PC-card memory is used to storevalues of force and expansion (sensor data) of a measure-ment. The microcontroller is connected with the printerport of a PC or notebook for bi-directional data commu-nication. This line is faster than a serial line such asRS232C. Measurement procedures are fully controlled bythe microcontroller whereas the PC’s control program mayhandle other tasks.
Force Sensor/Amplifier
A piezo force sensor, made by KISTLER™ (Figure 1a),with a stiffness of 1.8kN/µm was used to measure forceapplication to the bone cores. The response to force of thesensor is an electric charge linear to the magnitude of theforce applied to the sensor. Simple circuits with the sen-sor and charge amplifier (Figure 2, middle left) do notalways measure absolute values. The general nature of apiezo-electric sensor is that some residual charge will bemaintained even without load resulting in an offset errorat the amplifier’s output. Thus the system’s control pro-gram has the feature, which sets the force amplifier into areset mode (all residual charge dropped) and an operatemode (amplifier ready to work), which is turned on justbefore starting a measurement.
Figure 3: This figure shows the microcontroller and its 8-bit bus environment: memories (RAM: data, ROM:program), the parallel port interface for data communication with the host computer, bus interface to digital-analogue-converter [DAC] and analogue-digital-converter [ADC].

52
D B Jones et al. A New Mechanical Testing/Loading System for Bone Studies
Expansion Amplifier
The expansion sensor’s cross voltage is passed to an in-strumentation amplifier, shown in Figure 2 (top, left). Thegain of this amplifier is about 500. There are twopotentiometers for rough and fine zero-adjustment: thefirst potentiometer (Figure 2, to the right of the bridge) isadjusted during final manufactory control, the second (tothe left of the bridge) is a digitally driven potentiometercontrolled by the microcontroller.
Quasi-Static and Dynamic Loading
To measure the stiffness of bone or reference bodies (seebelow), we used quasi-static loading where the PZA’s drivevoltage is gradually increased by small incremental stepsover approximately 30 seconds with the force and dis-placement measured simultaneously and data collectedand stored. A low-pass filter smoothes the PZA drive volt-age signal to avoid dynamic stimulation. Furthermore thePZA is released slowly (10 seconds) and smoothly apply-ing a falling edge in form of half a cosine-period (Figure4).
The apparent stiffness (k) is calculated by taking thereciprocal slope (s) of a linear regression line (k = s-1)over a certain selectable force range [fa,fb] with the profitof noise reduction by a factor of n½ , where n is the numberof samples taken for linear regression. In the case of non-linear materials the user has to select an interval on theforce axis, where the curve looks linear (Figure 5). Ourprogram has the feature to store the limits fa,fb of the in-terval associated with the label of a given bone core andautomatically restores the same force interval [fa,fb] when-ever the sample is re-measured.
The program presents the stiffness in terms of aYoung’s modulus (E, in MPa or GPa units) using cylin-drical specimen dimensions, the radius (r) and height (h),for normalization to extract a value, which does not de-
pend on the geometric dimensions of the body:
rπhkE
2⋅=
(1)
In this way we obtain a value, which can be practicallyassociated with mechanical properties of other material.
The purpose of this measurement however is not toderive ‘real’ measurements of the bone stiffness, since cut-ting the cylinders of trabecular bone out of their context
Figure 4: In quasi-static load the drive voltage to thepiezo-electric actuator is increased by small smoothedincremental steps. The falling edge is realized in formof a cosine-edge to avoid dynamic stimulation of bone.
Figure 5: This figure presents an example of data of a quasi-static load on bone. While the piezo-electric actuator’sexpansion is gradually increased, force and displacement are measured simultaneously. This figure also shows thestandard deviation borders of a number of repetitions. The thick line on the right half of the figure is a linear-fit linein the range of fa,fb. The reciprocal value of the slope is taken to obtain the stiffness of the bone sample.
53
D B Jones et al. A New Mechanical Testing/Loading System for Bone Studies
removes many struts and supports. The mechanical stiff-ness measurements thus gained may not be extrapolatedto the whole bone. The purpose is to obtain a precise value,which is used for comparison for subsequent treatmentsi.e. has the sample increased or lost stiffness and how thisis related to biochemical changes or histological or struc-tural changes revealed by µCT imaging. Analysis of thestructure revealed by µCT may be used in future to use infinite element modeling. (For µCT analysis we use a modi-fied bone chamber, where the metallic loading piston andthe chamber bottom are replaced by non-metallic sapphirecylinders.)
In dynamic loading various oscillation pattern suchas standard sinusoidal-, triangular-, square-signals andcomplex waveforms can be applied on a bone sample. Dataof force and PZA’s expansion can be measured simulta-neously during loading. The build-in function generatoralso accepts input of a series of numbers to generate spe-cific designed waveforms. With this feature we have im-ported waveforms of normal walking and jumping from aforce platform and apply these physiological waveformsin our current bone loading program.
Mechanical Calibration
Calibration of Force
The force sensor - located at the top of the PZA (see Fig-ure 1a) - was calibrated at the manufacturer, however the
assembly screw, which applies a significant pre-force tocompress the surfaces together, always shunts part of theforce and therefore the sensor must be calibrated againafter installation to determine the final sensitivity of thecompleted measuring setup. To set the charge amplifierto 1,500N full scale, we switched the pre-scaler to a suit-able sub-range and adjusted the gain-potentiometer of theamplifier to 10 volts (maximum) at 1,500 Newton.
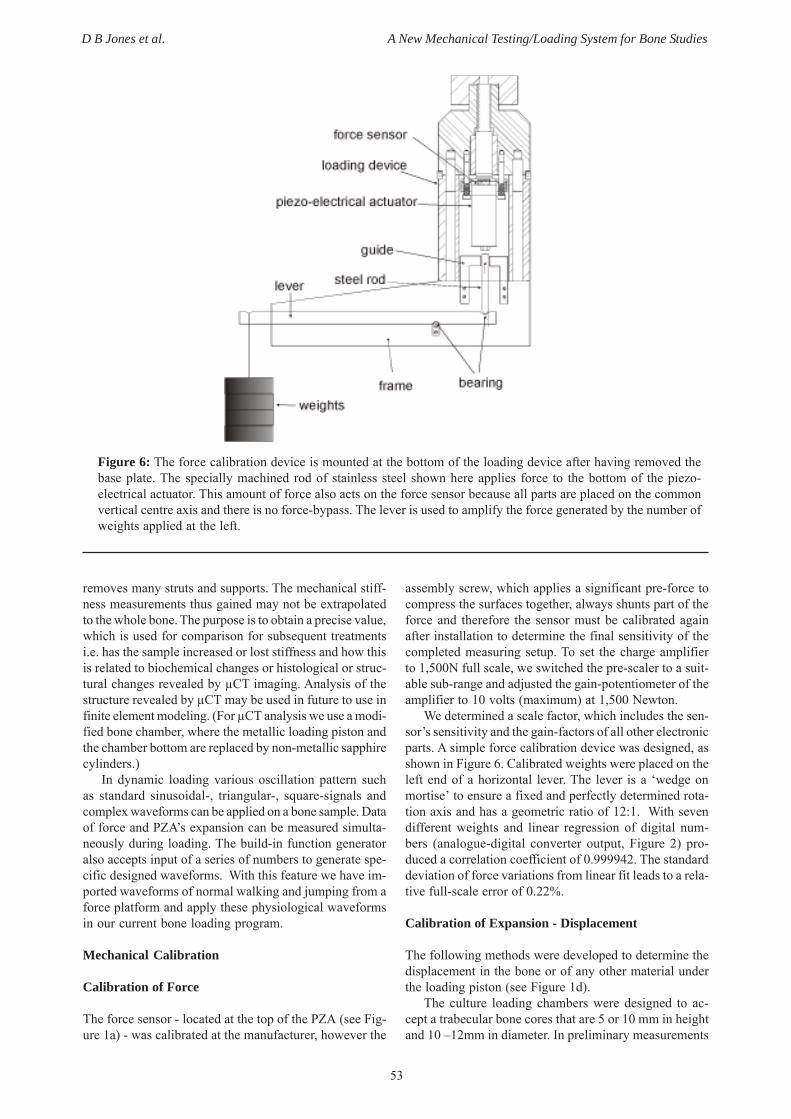
We determined a scale factor, which includes the sen-sor’s sensitivity and the gain-factors of all other electronicparts. A simple force calibration device was designed, asshown in Figure 6. Calibrated weights were placed on theleft end of a horizontal lever. The lever is a ‘wedge onmortise’ to ensure a fixed and perfectly determined rota-tion axis and has a geometric ratio of 12:1. With sevendifferent weights and linear regression of digital num-bers (analogue-digital converter output, Figure 2) pro-duced a correlation coefficient of 0.999942. The standarddeviation of force variations from linear fit leads to a rela-tive full-scale error of 0.22%.
Calibration of Expansion - Displacement
The following methods were developed to determine thedisplacement in the bone or of any other material underthe loading piston (see Figure 1d).
The culture loading chambers were designed to ac-cept a trabecular bone cores that are 5 or 10 mm in heightand 10 –12mm in diameter. In preliminary measurements
Figure 6: The force calibration device is mounted at the bottom of the loading device after having removed thebase plate. The specially machined rod of stainless steel shown here applies force to the bottom of the piezo-electrical actuator. This amount of force also acts on the force sensor because all parts are placed on the commonvertical centre axis and there is no force-bypass. The lever is used to amplify the force generated by the number ofweights applied at the left.

54
D B Jones et al. A New Mechanical Testing/Loading System for Bone Studies
Figures 9a/9b show expansion versus force and dis-placement respectively. All curves show mean values over8 repetitions. When the expansion of the piezo-electricactuator is measured without any load (interferometertouches the PZA-bottom directly) then we obtain a verti-cal straight line directly covering the y-axis (not shownon the plot), because there is no force.
We transferred the fundamental triplet data on thesereference bodies into a look-up table. It is a two-dimen-sional table, which is addressed by the digital values offorce and PZA’s expansion in the system’s control pro-gram. The expansion data are not of final interest; theyare only intermediate values that are used to address thelook-up table to determine the sample’s displacement.Figure 10 shows the same curves as shown in Figure 9a/9b but in a three-dimensional plot based on the force-expansion-plane. All cells of the complete (f,x)-plane arefilled by linear interpolation between the measured curves.To estimate the total error in displacement we analyzedthe row data of our calibration measurements and foundthat standard deviations (not shown in Figure 9a/9b) in-creased with increasing in force and stiffness. The stand-ard deviations are greater than the resolution units of thesensors after conversion to digital numbers: expansionsensor: » ±0.015µm, interferometer: ±0.01µm. We assumethat the precision/roughness of the reference bodies’ sur-faces is responsible for this. Table 2 shows typical valuesbelow and above 400N:
A Young’s modulus greater than 1000MPa can causeerrors up to 2 µm, but this is above the design limit of oursystem. Smallest variations occur in the range 100 –1000MPa and < 400N, whereas below 100MPa errors areincreasing again. Our specific application involves lowvalues of force and an analysis of our raw data shows thatthe noise in force measurement (resolution unit is » ±0.4N) is the dominant part.
Our assumption is that the standard deviation of ourmeasurements data stands for total displacement-errors,
which are reduced to some typical values shown in table2. These errors are lower than the mechanical precisionof the surfaces of the reference bodies.
Control of Quality and Stability
The loading system has been specifically configured toinduce quantifiable loads and deformation to trabecularbone tissue and measure the physical characteristics ofthe bone tissue to a variety of perturbations of force, de-formation, waveforms, frequencies and duration. How-ever, the loading system must be coupled with the spe-cially designed culture-loading chamber for the mainte-nance of long-term bone viability and the ability to evalu-ate the induced perturbations at a single time point or tomonitor bone for 30 to 47 days. In order to have a usefultool for the study of bone both precision and reproducibil-ity must be quantified and demonstrated in both refer-ence bodies and bone tissue. The very nature of boneheterogeneity results in greater variation in measurementdue just to the physical properties of bone compared tothe homogeneity of the metallic reference bodies.
Three areas were investigated relative to long-termreproducibility of the reference bodies and apparent bonestiffness over 20 to 28 days. The physical characteristicsof both the bone and chamber surfaces and the placementof the reference were evaluated after the calibration of theloading system. To study the long-term responsibility andprecision of the loading system a quasi-static loading pro-gram was used for both bone cores and reference bodies.For controls, none dynamically stimulated bone cores weremeasured every 4 days applying a constant force in quasi-static loading, using 25µm of compression in order todetermine their apparent stiffness and the reproducibilityof deformation over a 20-day period. The standard devia-tions of deformation are in the range of 0.6 – 1.3 microm-eter (Figure 11) but we also see a tendency of a small dropin stiffness about 1.5%. This small drop is consistent with
Figure 7: Examples of quasi-static load measurements: Stiffness measurement of different bone-cores

55
D B Jones et al. A New Mechanical Testing/Loading System for Bone Studies
Figure 8: This figure shows a reference body placed into the loading device. The bottom displacement of the topplate is touched by a steel rod, which transfers this movement directly to the laser interferometer. The spring isnecessary to have the rod in touching contact to the reference body’s bottom. With different material and/orthickness of the top plate different stiffness of these bodies can be achieved.
on 5mm high trabecular bone cores in the culture-load-ing chamber we observed apparent stiffness of these coresin a range of 40 (elderly human) to 900 MPa (bovine)under 25µm (4,000µe) of compression. Figure 7 showsthe stress/strain curves of several bone cylinders that showtypical mechanical properties.
Based on these values, seven reference bodies wereconstructed from aluminium and stainless steel, whichwere specifically designed to mimic the MPa range ob-served in the bovine bone cores. The reference bodies weredesigned in the general form of a closed hollow cylinder,open at one end so that the deformation occurring at thebottom of the end plate could be measured by an interfer-ometer during the application of a known force (Figure8). The thickness of the top plate, made from either stain-less steel or aluminium, was calculated based on a spe-cific stiffness and machined to those specifications. Thestiffness range (Young’s modulus) of the seven referencebodies was found in the range of 40 – 1700 MPa as shownin Table 1. The reference bodies were identified and la-belled by the material used and the thickness of the topplate. For example: reference body “Steel 800” has a top-plate made of steel with a thickness of 800µm.
The upper part of these bodies has the same dimen-sion as the standard loading piston (see Figure 1d). Thetotal height of the reference bodies was 5 mm (height ofbone cores) plus the height of the piston. The termination
at the bottom is identical to our standard bone chamberbottom but with a hole in the middle for passage of thesteel rod to transfer the movement of the bottom of theend plate to an electronic Laser-interferometer (type UPM,made by Intop-Precision, Polytec, Germany) (Figure 8).The interferometer operates in a digital mode (countingmode) and in an additional analogue mode (homodynemode). This allows a resolution in the sub-wavelengthrange. The resolution is 10nm and noise mostly is ±10nm.A built-in temperature sensor eliminates the small wave-length shift of the laser-diode at different ambient tem-peratures.
The reference bodies permit measurements that arevery reproducible. Due to the design of theses bodies themovement of the bottom of the top plate should representthe displacement of bone cores, the deformation underthe loading piston.
To find the relation between deformation under theloading piston and piezo-actuator’s expansion for the ref-erence bodies, we used quasi-static loading. With a preloadof always 2.5N (to bring all surfaces into touching con-tact) we measured displacement (d) (interferometer’s data),piezo-electric actuator’s expansion (x) and the force (f) inall seven reference bodies 8 times each. Depending onthe stiffness of a reference body we recorded approximately300 data triplets (f, x, d) per repetition and per body(7x8x300 data triplets).

56
D B Jones et al. A New Mechanical Testing/Loading System for Bone Studies
Figure 9: (a) Measurements on reference bodies: mean value of 8 repeats: expansion versus Force. (b) Measure-ments on reference bodies: mean value of 8 repeats: displacement versus Force. Displacement was measured bythe laser interferometer
a)
b)
Figure 10: The data of the curves shown in figure 9a/9b are used to create a look-up table. Digital values of force(f) and expansion (x) are used to address the horizontal f,x-plane. The correct displacement is taken from thevertical axis.
57
D B Jones et al. A New Mechanical Testing/Loading System for Bone Studies
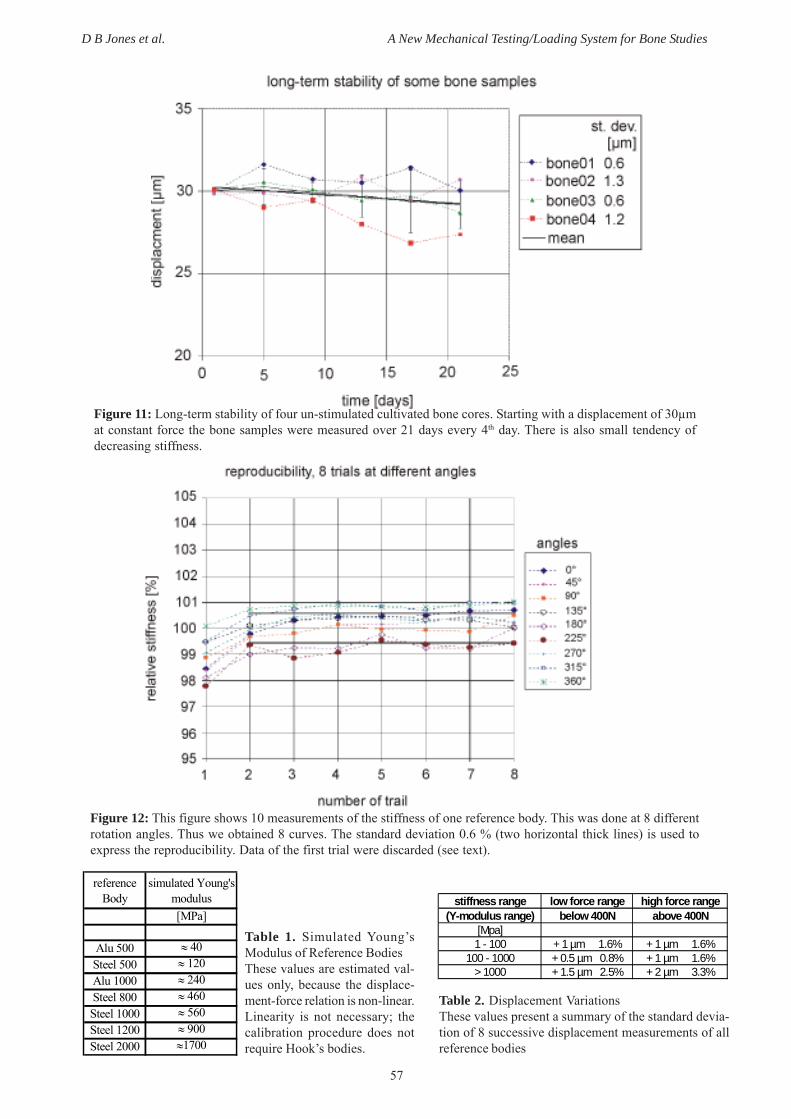
Figure 11: Long-term stability of four un-stimulated cultivated bone cores. Starting with a displacement of 30µmat constant force the bone samples were measured over 21 days every 4th day. There is also small tendency ofdecreasing stiffness.
Figure 12: This figure shows 10 measurements of the stiffness of one reference body. This was done at 8 differentrotation angles. Thus we obtained 8 curves. The standard deviation 0.6 % (two horizontal thick lines) is used toexpress the reproducibility. Data of the first trial were discarded (see text).
Table 1. Simulated Young’sModulus of Reference BodiesThese values are estimated val-ues only, because the displace-ment-force relation is non-linear.Linearity is not necessary; thecalibration procedure does notrequire Hook’s bodies.
Table 2. Displacement VariationsThese values present a summary of the standard devia-tion of 8 successive displacement measurements of allreference bodies
reference Body
simulated Young's modulus
[MPa]
Alu 500 ≈ 40Steel 500 ≈ 120Alu 1000 ≈ 240Steel 800 ≈ 460Steel 1000 ≈ 560Steel 1200 ≈ 900Steel 2000 ≈1700
stiffness range low force range high force range(Y-modulus range) below 400N above 400N
[Mpa]1 - 100 + 1 µm 1.6% + 1 µm 1.6%
100 - 1000 + 0.5 µm 0.8% + 1 µm 1.6%> 1000 + 1.5 µm 2.5% + 2 µm 3.3%

58
D B Jones et al. A New Mechanical Testing/Loading System for Bone Studies
what would be expected in a sedentary condition over thisperiod.
The “steel 1200” stainless steel reference body wasmeasured for stiffness by quasi-static load every day over31 days. The [fa,fb] force range of 500 to 900 N was usedfor all 31 days. The mean Young’s modulus of the refer-ence body was 941.29 MPa with SD of 13.23 MPa, whichis 1.4%.
The same reference body was measured for stiffness8-times (quasi-static load) with incremental rotation at45° to determine position dependency due to possible ei-ther the chamber base or the loading-frame platform notbeing precisely flat and parallel. We found a relative stand-ard deviation of 0.6% (Figure 12).
In comparison with the long-term measurement thereis no significant rotation-effect in bone samples as we ex-pected since the X-ring eliminates tilting around the ver-tical axis. However all curves shown in Figure 12 showanother effect: There was an apparent significant increaseof stiffness (trial 1 to trial 2), between days 1 and 2, whichcould be caused by position setting effects (touching areaadaptation). We find a general increase in apparent stiff-ness of about 3% between culture days 1 and 2 (i.e. afterthe first period of loading). This can also occur with plas-tic and metal standards as we think that this is a me-chanical adaptation to the chamber. We therefore use the2nd days measurement as the baseline.
Preload Effects
Due to the nature of the complex loading device and thenumbers of surfaces that touch, a preload is necessary tobring all these surfaces into contact. There are five con-tact surfaces: PZA - piston, piston - bone, bone – top ofbone chamber base plate, bottom of bone chamber baseplate - frame and the helical contact surface of the posi-tion thread (Figure 1).
Based on the long-term stability data (Young’s modu-lus of a reference body) and those of the PZA measure-ments on bone cores, it was determined that for long-termreproducibility a manually applied preload should be about10N and some micrometers displacement which wereapplied by PZA’s expansion under the control of the pro-gram. We would expect some roughness at the surfaces ofcut bone cores, which would, under light loads appearnon-linear. We decided to use an additional preload of 5micrometer, which is approximately the double the esti-mated roughness our bone surfaces (two surfaces: top andbottom) and will be absorbed by these weak (and dead)structures. Lower preloads cause loss of reproducibilityand linearity.
In dynamic bone stimulation the bone was first ex-posed to a dynamic waveform (this period can last forsome minutes) and then the stiffness was measured witha quasi-static load afterwards. One reason for this is thevisco-elastic effect, in which the bone relaxes quickly andlooses up to 20% loss of stiffness, and recovers by onehour
Discussion
In this paper we demonstrate the design and performanceof a mechanical loading system that works with extremelyhigh precision on small but accurately machined cylin-ders of trabecular bone 10mm diameter and 5–10mm inheight. The frame, the microcontroller design, themicrocontroller software and the Windows software havebeen designed in–house. The system is designed prima-rily to apply precise defined compressive strains to livingtrabecular bone samples, which are principally loaded incompression in vivo. Some mechanical properties of thetissue may be measured but this is not the principle aimof the device since the measurements are not presentlycorrelated with the structure. The instrument has somesignificant advantages over other mechanical testing in-struments used to load and test living bone specimens,not only because of the high precision, but also in thefrequency spectrum it can or potentially can address.Using histology sectioning saws the samples can be ma-chined to the required high precision, which reduces thepre-load stress needed to make accurate mechanical meas-urements and ensures that physiological levels of com-pression can be applied to the tissue. Typically 5–10Nonly are required to achieve this, which corresponds to amaximum theoretical possible strain (assumption:500MPa, linear body – Hook’s law) of around 3–7% ofphysiological strain we use (3,000–4,000µe). Preliminarystudies indicate that due to the preparation, the marginsof the bone to a depth of about 500µm have a significantnumber of dead cells. Thus the small surface roughnessof ±2µm, which will experience higher compressions, isprobably not affecting the results by receiving high strain.Preliminary results with histology do not indicate any frac-tures at the bone-piston interface after 49 days of loading,or any fractures at all within the sample. Since the sur-faces of the bone are the exchange surfaces for diffusionwe cannot improve mechanical contact by using for in-stance a hard cement at the loading interfaces. In a sepa-rate paper we will present data to show the effects of am-plitude and frequency on changes in bone stiffness. Whencombined with long term culture of living bone or carti-lage the range of possible studies is large. To adapt thesystem for measurements on softer cartilage a piezo-elec-trical actuator with a large expansion range should beused. Actuators with extensions up to 180µm are avail-able, higher extensions require a lever mechanism.
Acknowledgements
We wish to thank the European Space AgencyMicrogravity Applications Program (AO 99-122), the AOASIF, Davos (grants AORF 200J and O2 J7) and theDeutsche Arthrose Hilfe for supporting this work.
Patents
United States Patent 6th July, 1998, No.: US 6,171,812:Everett L. Smith, David Jones: Combined perfusion andmechanical loading system for explanted bone.

59
D B Jones et al. A New Mechanical Testing/Loading System for Bone Studies
United States Patent 19th March 2002, No.: US 6,357,303B2: Everett L. Smith, David Jones: Mechanical testing de-vice.
References
Akhter MP, Cullen DM, Recker RR (2002) Bone ad-aptation response to sham and bending stimuli in mice. JClin Densitom 5: 207–216.
Botchwey EA, Pollack SR, Levine EM, Laurencin CT(2001) Bone tissue engineering in a rotating bioreactorusing a microcarrier matrix system. J Biomed Mater Res55: 242–253.
Cheng MZ, Zaman G, Rawlinson SC, Suswillo RF,Lanyon LE (1996) Mechanical loading and sex hormoneinteractions in organ cultures of rat ulna. J Bone MinerRes 11: 502–511.
Chow JW, Wilson AJ, Chambers TJ, Fox SW (1998)Mechanical loading stimulates bone formation by reacti-vation of bone lining cells in 13-week-old rats. J BoneMiner Res 13: 1760–1767.
El Haj AJ, Minter SL, Rawlinson SC, Suswillo R,Lanyon LE (1990) Cellular responses to mechanical load-ing in vitro. J Bone Miner Res 5: 923–932.
Jones DB, Leivseth G, Tenbosch J (1995) Mechano-reception in osteoblast-like cells. Biochem Cell Biol. 73:525–534.
Rawlinson SC, Mosley JR, Suswillo RF, Pitsillides AA,Lanyon LE (1995) Calvarial and limb bone cells in organand monolayer culture do not show the same early re-sponses to dynamic mechanical strain. J Bone Miner Res10: 1225–1232.
Rodan GA, Mensi T, Harvey A (1975) A quantitativemethod for the application of compressive forces to bonein tissue culture. Calcif Tissue Int 18: 125–131.
Rubin CT, Lanyon LE (1997) Kappa Delta Award pa-per. Osteoregulatory nature of mechanical stimuli: func-tion as a determinant for adaptive remodeling in bone. JOrthop Res 5: 300–310.
Rubin CT, Turner AS, Muller R, Mittra E, McLeod K,Lin W, Qin YX (2002) Quantity and quality of trabecularbone in the femur are enhanced by a strongly anabolic,noninvasive mechanical intervention. J Bone Miner Res17: 349–357.
Smith EL, Martens F, Koller K, Clark W, Jones DB(2000) The Effects of 20 Days of Mechanical LoadingPlus PTH on The E-Modulus of Cow Trabecular Bone. JBone Miner Res 15(Suppl l): 247
Smith EL, Boudriot U, Daume B, Kratz M, Jones DB,Cullen D (2001) Long Term Perfusion Loading of Trabecu-lar Bone Cores and Formation Rate. J Bone Miner Res16(Suppl l): 195.
Yeh CK, Rodan GA (1984) Tensile forces enhanceprostaglandin E synthesis in osteoblastic cells grown oncollagen ribbons. Calcif Tissue Int 36 (Suppl 1): 67–71
Zaman G, Suswillo RF, Cheng MZ, Tavares IA, LanyonLE (1997) Early responses to dynamic strain change andprostaglandins in bone-derived cells in culture. J BoneMiner Res 12: 769–777
Discussion with Reviewers
J. Gasser: The authors point out that the purpose of de-termining bone stiffness is not to get the ‘real’ value butto be able to look at relative changes over time. While thereason they give for this desire (disrupted architecture atthe periphery of the cores) is understandable, it could beargued, that as they wish to run finite element analysis onsome of the cores, it would indeed be nice to get as closeas possible to the ‘real’ value for stiffness.Authors: Can we ever get the ‘real’ value for stiffnesswhen we cut out a piece of bone? We think not. Firstly weconsidered the problem of lack of struts as we cut out thecore from its mechanical surroundings and secondly weconsider the supporting effect of the marrow. In a ‘real’piece of bone we would expect the marrow not to besqueezed out easily into free space. The trabecular bone isconstrained not only by the marrow but also by a thinshell of cortical bone which the marrow will also pushagainst. We do not assume that our piece of bone is weakerbecause there can be non linear effects in spring systems-but different. Hence we prefer to look at changes in rela-tive stiffness and test that this is a biological response(data to be published).
J. Gasser: Authors mention the damage caused to theouter 500µm of the cores during manufacturing. Is thisinflicted by the heat generated during cutting? In a coreof 5 to 10mm height does it worry authors that as muchas 20% of the structure they try to stimulate is dead andpossibly unable to respond to the mechanical or chemicalstimuli?Authors: Does it worry us that perhaps 20% is dead? Yes!What to do about it. We are cutting the bone at about 8°Cin PBS. We think that the surface layer of cells is dam-aged more from too fast cutting and heat, but other cellsare dying due to the phenomenon known as neighbourdeath. It should be possible to use inhibitors of apoptosisto reduce this, but it can cost a lot of money. It is difficultfor several reasons to establish cell death in bone. In somepreparations we see living cells at the surface, so it issomething we are looking at.
J. Gasser: The authors point out the many possibilitiesthe system offers to study living bone or cartilage. Pleasebe more specific in what you want to study with this sys-tem and as pointed out earlier, add a comparison as towhere you think the system is performing better than cur-rently available organ culture systems and where you thinkit is not coming close to the in vivo situation (shortcom-ings).Authors: The system was designed to do three things- (1)apply all sorts of mechanical waveforms- frequencies andamplitudes - not necessarily physiological to investigatemechano-transduction in bone and cartilage, (2) ensurethe mechanical properties of the biological material, alsowith regard to the non linearity and visco elastic behav-iour, (3) Maintain the material in as good a condition aspossible. The answer as to how this system is better orworse than other organ culture systems is not described

60
D B Jones et al. A New Mechanical Testing/Loading System for Bone Studies
here, but will be presented for publication soon. Very brieflywhat the system does not have is functioning blood ves-sels or nerves. The lack of blood vessels should haveproved a problem, but practically we see no significantchanges in the histology of the marrow or bone until over50 days (this data will be published soon), which is some-thing no other bone organ culture system can do.
P. Prendergast: Looking at the quasi-static load meas-urement sin in Figure 7, I do not understand why they donot start at 0,0 load/displacement? Have the measurementsmade in the device been corroborated with measurementmade in a materials testing machine?Authors: We are working with dimensions in the tens ofmicrometer range of compression. All the mechanical partsthat can be are pre-compressed, but there are still manymechanical surfaces which are not perfectly flat (mean-ing here an optically flat surface less than ½ lambda).Thus these and the inevitable inaccuracies of cutting thebone cylinders mean that we have to apply a certain pre-force to ‘mate’ all these surfaces. We calculated that asurface roughness of roughly 4 micrometers would needa pre-force of about 1/10th of the ultimate force we wouldapply- assuming the stiffness of the bone cores would needabout 100N of force to achieve a compression of 3,000microstrains, i.e. 1/10th of a supposedly stimulatory sig-nal. In actuality we can sometimes make measurementson bone with an error of less than 5 percent or a pre forceof 5N. This seems to depend on the material properties ofthe bone under test. If we made the bone cores 10mmlong (which is possible using the present design) we could
in theory make ‘better’ mechanical measurements, how-ever we have not yet tested this in terms of how the bonewill react to the longer diffusion paths. These studies areplanned for the future and will be addressed in anotherpaper.
P. Prendergast: The calibration with the reference bod-ies is interesting, though I wonder what biologists read-ing the journal will make of it. I do not think the “look-up” table of Figure 10 helps much and I suggest that itshould be deleted. The reference bodies are all relativelystiff, which tests for the internal deformations within themechanisms of the device when loading stiff samples.However, presumably the displacement with stiff refer-ence bodies is low –have you tried a flexible referencebody where the displacement may be larger to assess re-producibility?Authors: We chose the stiffness of the reference bodies tomatch the range of stiffness we were measuring. Becauseno other material or (materials) was conveniently avail-able over this range we manufactured them and calibratedthem as described. The use of the interferometer gave usan as accurate measurement of displacement as we couldhope for. We indeed tested the results several times againstcommercially available ones such as Dartec or Instron,and also using solid reference bodies of aluminium, whichhave been measured in other devices, but against not moresensitive machines ones which are available. The resultsshowed that our machine when properly calibrated is asaccurate as shown in the paper.