DEVELOPMENT OF A LOW COST ROAD ROUGHNESS MEASURING...
41
DEVELOPMENT OF A LOW COST ROAD ROUGHNESS MEASURING DEVICE A Thesis submitted in partial fulfillment of the requirements for the award of the Degree of Master of Technology in Transportation Engineering by JYOTI BIRAJ DAS 212CE3054 DEPARTMENT OF CIVIL ENGINEERING NATIONAL INSTITUTE OF TECHNOLOGY ROURKELA – 769008
Transcript of DEVELOPMENT OF A LOW COST ROAD ROUGHNESS MEASURING...

DEVELOPMENT OF A LOW COST ROAD
ROUGHNESS MEASURING DEVICE
A Thesis submitted in partial fulfillment of the requirements
for the award of the Degree of
Master of Technology
in
Transportation Engineering
by
JYOTI BIRAJ DAS
212CE3054
DEPARTMENT OF CIVIL ENGINEERING
NATIONAL INSTITUTE OF TECHNOLOGY
ROURKELA – 769008

DEVELOPMENT OF A LOW COST ROAD
ROUGHNESS MEASURING DEVICE
A Thesis submitted in partial fulfillment of the requirements
for the award of the Degree of
Master of Technology
in
Transportation Engineering
by
JYOTI BIRAJ DAS
212CE3054
Under the guidance of
Dr. M. PANDA
DEPARTMENT OF CIVIL ENGINEERING
NATIONAL INSTITUTE OF TECHNOLOGY
ROURKELA-769008

iii
Department of Civil Engineering
National Institute of Technology
Rourkela – 769008
Odisha, India
www.nitrkl.ac.in
CERTIFICATE
This is to certify that the thesis entitled “DEVELOPMENT OF A LOW COST ROAD
ROUGHNESS MEASURING DEVICE” submitted by Mr. JYOTI BIRAJ DAS (Roll No.
212CE3054) in partial fulfillment of the requirements for the award of Master of Technology
Degree in Civil Engineering with specialization in Transportation Engineering at National
Institute of Technology, Rourkela is an authentic work carried out by him under my supervision
and guidance.
To the best of my knowledge, the matter embodied in the thesis has not been submitted to any
other University / Institute for the award of any Degree or Diploma.
Date: Dr. M. PANDA
Place: Rourkela, India Professor
Department of Civil Engineering
National Institute of Technology
Rourkela - 769008

iv
ACKNOWLEDGEMENT
First and foremost I offer my sincere gratitude and respect to my project supervisor, Prof.
Mahabir Panda, Department of Civil Engineering, for his invaluable guidance and suggestions
to me during my study and project work. I consider myself extremely fortunate to have had the
opportunity of associating myself with him for one year. This thesis was made possible by his
patience and persistence.
I express my sincere thanks to Prof. Ujjal Chattaraj and Prof. Prasant Ku. Bhuyan of Civil
Engineering Department, NIT Rourkela for providing valuable co-operation and advice all along
my M.Tech study. I also express my thanks to all my friends of Transportation Engineering
Specialization who helped me to learn many things about my project.
Also I would like to extend my gratefulness to the Head of Department, Prof. N. Roy, and to all
the Professors and staff members of Civil Engineering Department for helping and providing me
the necessary facilities for my research work.
Last but not the least, I express my love to my parents, family and the one above all of us, the
omnipresent God, for answering my prayers and giving me strength and patience always.
Date: JYOTI BIRAJ DAS
Place: Rourkela, India Roll No: 212CE3054
M. Tech (Transportation Engineering)
Department of Civil Engineering
NIT ROURKELA
Odisha – 769008

v
ABSTRACT
One of the most important measures of road condition is roughness of road surface. Mainly there
are two different types of instruments used for the measurement of road roughness in this report.
First one is the Merlin. It is a machine which evaluates roughness using low cost
instrumentation, utilized either for immediate estimation or for adjusting reaction sort
instruments. Secondly is the Auto-Level which is an automated leveling optical instrument.
During construction site surveys for gathering, transferring or setting horizontal levels and grade
applications, is normally used. The estimation of rough distance between instrument and grade
staff is done by the stadia reticle present in auto level. In this study a low cost device has been
indigenously fabricated/ developed to measure the roughness of a road’s surface. Finally,
experiments on ten road stretches have been conducted using three methods including the
developed device. It has been observed that the overall roughness parameters in terms of (IRI) in
all the methods are almost same.
Key words: Roughness, Merlin, Auto- level, IRI

vi
CONTENTS
Items Page No
Certificate iii
Acknowledgment iv
Abstract v
Content vi-vii
List of Figures viii
List of Tables viii
List of Abbreviations viii
Chapter 1
Introduction 1-3
1.1 General 2
1.2 Objective 3
1.3 Thesis Organization 3
Chapter 2
Literature Review 4-21
2.1 International Roughness Index 5
2.2 Roughness Measuring Instrument 6-7
2.3 Range of Roughness Value 8
2.4.1 Merlin- Introduction 9
2.4.2 Principle of Operation 10
2.4.3 General Description 11-12
2.4.4 Method of Use 13
2.4.5 Practical Details 14-15
2.4.6 Calibration Equation 16
2.4.7 Relationship Between IRI and D 16
2.5.1 Auto level-Introduction 17
2.5.2 General Description 18-20
2.5.3 Method of Use 21

vii
Chapter 3
Development of New device 22
Chapter 4
Analysis of Results and Discussion 23-29
4.1 Introduction 24
4.1.1 One reading from Merlin 25
4.1.2 One reading from Auto level 26
4.2 Comparison of IRI values 27
4.2.1 Merlin vs Auto level 28
4.3 Discussion 29
Chapter 5
Conclusion and Future Work 30-31
5.1 Conclusion 31
5.2 Future work 31
References 32-33

viii
List of Figures
Figure 2.1 Range of Roughness Values 8
Figure 2.2 The Merlin 9
Figure 2.3 Description of Merlin 11
Figure 2.4 Relationship between IRI and D 16
Figure 2.5 Auto Level 18
List of Tables
Table 4.1 One of the readings from Auto level 26
Table 4.2 Comparison of IRI Values 27
Table 4.3 IRI Readings Merlin vs Auto Level 28
List of Abbreviations
MERLIN Machine for Evaluating Roughness using Low cost Instrumentation
IRI International Roughness Index
RTRRMS Response Type Road Roughness Meters
PSR Present Serviceability Index
UI Unevenness Index
LCD Liquid Crystal Display
LED Light Emitting Diode
NAASRA National Association of Australia State Road Authorities
CRRI Central Road Research Institute

1
CHAPTER 1
INTRODUCTION

2
1.1 GENERAL
Roughness is characterized as the longitudinal unevenness of road surface. It is a great factor
which measures road condition vehicle operating cost and ride quality. Now a day there is an
importance of study on the effect on vehicle operating cost. Number of experiments and studies
have shown that roughness has greater influence on vehicle productivity, running speed,
maintenance and tire damage and hence vehicle productivity.
Roughness is a figured measure of the longitudinal smoothness for the segment of Road being
overviewed. It is used as an indicator to determine how the road has deteriorated with regard to
ride comfort. Roughness can be determined by different ways in units such as, IRI, NAASRA,
ride number etc. All of these systems of measurement consider the amount of vertical
displacement that is felt by a passenger in the car driving over the section of road. Generally the
higher the number the rougher the road and the less comfortable the ride is to road users.
So it is seen roughness measurement is an important activity for pavement management that’s
why various roughness measuring machines and different scales for roughness have been
developed. As per the requirement for developing countries, there is a need of simple de eloping
machine which can measure roughness over a constrained span of road system specifically or for
aligning different roughness measuring machines.

3
1.2 OBJECTIVES
The overall objectives of the project are as follows:
1. Assess the capabilities of currently available low cost products such as merlin and auto
level.
2. Develop concepts and specifications for a new low cost device.
3. Design and construct the new product.
4. Validate the measurement capabilities of the new product and compare with the existing
two methods.
1.3 THESIS ORGANISATION
The thesis consists of five chapters as described below:
1. Chapter 1 describes general idea about road roughness.
2. Chapter 2 deals with literature review
3. Chapter 3 explains the development of new device.
4. Chapter 4 deals with analysis of results and discussions.
5. Chapter 5 explains the conclusion and future scope.

4
CHAPTER 2
LITERATURE REVIEW

5
2.1 INTRODUCTION
International roughness index (IRI) is the accepted standard for measuring road surface’s
roughness in worldwide. The IRI was obtained by the experiment led in Brazil. This
experimental result helps in comparing directly data from different instruments and different
countries that helps in enabling historical trend to be estimated with confidence. Without a
common method for calculation, results from research could not be compared without the use of
conversion factors from one unit to the next.
As stated by Sayers (1995):
1. From a solitary longitudinal profile might be processed. The specimen interim ought to be no
bigger than 300 mm for exact figuring. The obliged determination is reliant on the roughness
level and for smooth streets better determination is required.
2. It’s assumed that between sampled elevation point a constant slope persists.
3. By using the method of moving average the profile of base length 250mm.
4. After this by using quarter car simulation this smoothed profile is filtered, with Car at a
simulated speed of80km/hr (49.7 m/hr).
5. For finding out IRI direct amassing of mimicked suspension movement is partitioned by the
profile length. Thus, IRI is measured with units in/mi or m/km.

6
2.2 ROUGHNESS MEASURING INSTRUMENT
Rod and level survey: This survey is an accurate measurement of pavement profile for large
projects. This type of survey is inappropriate and uneconomical.
Dipstick profiler: This instrument can measure the road profile accurately. It records 10-15
readings per minutes. Analysis through software provides accuracy to ± 0.127 mm for a
longitudinal profile. Measurements by dipstick are most commonly used for measuring a road
profile.
Profilographs: Profilographs is mounted at the centre of frame for the free vertical movement.
From the motion of sensing wheels the recorded deviation for reference plane is recorded on
graph paper. Very slight surface deviation or the undulation up to 6m of length can be easily
detected by profilographs. However, because of slow speed profilographs are not practical for
road network condition.
Response type road roughness meters (RTRRMs): This type of instrument helps for indirect
measure of longitudinal road profile. The RTRRM readings are affected of tyre pressure, load,
vehicle suspension system, speed of vehicle, etc. Due to this type of sensitivity the readings or
the measurements re to be aligned when there is change in the above factors significantly. The
CRRI’s fifth wheel bump integrator falls in this category which is most commonly used in India.
The advantage of these RTRRMs is that the roughness can be easily measured at speedup to 80
km/hr. Since no to RTRRMs are exactly alike, the measurements are to be converted in
(unevenness index) to a standard common international scale is necessary. The IRI was created
by World Bank to give a base on for comparing roughness values from different instruments.
The IRI summarizes the longitudinal surface profile in the wheel path which is collected by

7
different roughness measuring device and then the computation is done from surface elevation
data. IRI is represented in units of m/km.
Profiling devices: By using either contact or non-contact sensor system these type of devices
very accurately can evaluate the longitudinal profile of a pavement. For the measurement or
mapping of road profile the non-contact systems use laser/ultrasonic devices. These profile-
meters used to calibrate RTRRMs are normally expensive.
Indian Practice
In India the roughness is measured using fifth wheel bump integrator (developed by CRRI) and
is reported as Unevenness Index (UI) in mm/km. For arriving at IRI from UI values the bump
integrator needs to be calibrated for specific set of parameters using dipstick profiler. A typical
relationship between IRI (m/km) and UI (mm/km) is given as
IRI = UI / 720

8
2.3 ROUGHNESS VALUES RANGE The below given figure shows IRI value range for different pavements to corresponding speeds.
Figure 2.1Range of Roughness Values
(www.pavementinteractive.org/wp-content/uploads/2007/08/Iri1.jpg)

9
2.4.1 THE MERLIN
INTRODUCTION
It is another instrument developed to measure road profile. It is a physically worked instrument
to measures surface unevenness at regular interims. The roughness readings are effortlessly taken
through graphical system for the examination of recorded information. The road roughness can
be measured over standard roughness scale with less complex estimation and methods. Its
specific attractions for utilization in pavement are that it is simple to make, easy to work and
keep up.
The device is called MERLIN-Machine for Evaluating Roughness utilizing Low-cost
Instrumentation. In the universal way roughness analyze this instrument was outlined on the
premise of a workstation recreation of its operation on longitudinal way profile.
Figure 2.2 The Merlin (www.aimil.com/product-MERLIN_(AIM_570)-267.aspx)

10
2.4.2 PRINCIPLE OF OPERATION
Merlin is a device with a probe and two feet which rests on the surface with course of wheel
track whose roughness by this device is to be measured. This device is at 1.8 meters separated
and the probe lies at the mid-path between two feet. At the contact of road surface and the two
feet this instrument measures the vertical relocation between the way surface and the focal point.
The measured vertical relocation is called as the mid-harmony deviation.
The relocation relies on upon the progressive interims to be undertaken way surface, if the
readings are taken at progressive interims along a longitudinal profile of way, then the rougher
the street surface the more amazing will be the variability of the vertical displacement. There is
an outline is mounted on the device on which the estimations are recorded by arranging the
relocations as a histogram on a Chart. It is not difficult to record specifically their overlay and
this has been observed that to connect well with the way roughness is measured, spread of mid–
chord deviation method is much important. Case in point, different investigates have proposed
two roughness records MO and OI which are depicted by Sayers et al (1986a),
The Merlin device works on one base length measuring mid harmony deviations and there is no
requirement for bar and level throughout measurements mid harmony deviations variability is
dictated by variability and for determination of roughness next to no estimation is include.

11
2.4.3 GENERAL DESCRIPTION
The accompanying figure demonstrates the Merlin instrument. For simple operation, there is a
wheel as the front leg and back leg is made up of inflexible metal pole. Shorter settling leg is
available at one side of back leg that aides in keeping the device from falling over throughout
taking perusing. There are two handles anticipating behind the primary back leg that gives the
device resemble a long and thin wheel barrow.
Figure 2.3 Description of Merlin (Figure from Merlin manual by AIMIL Ltd.)

12
A pointer is appended at the flip side of the arm, which proceeds onward the arranged
information diagram. The arm is furnished with mechanical enhancement of tens that causes
generation of development of the pointer of one centimeter when the probe moves by one
millimeter. The diagram holds arrangement of segments, being 5 mm in width, and separated
into boxes. On the off chance that the span of the wheel is non-uniform, then it will prompt a
variety in the length of the front leg starting with one estimation then onto the next and bringing
on incorrectness in the Merlin's results. An imprint is given on the edge of the wheel to keep
away from this error and all the estimations are brought with the imprint at its closest vicinity
with the street profile .Then the wheel is in its ordinary position.

13
2.4.4 METHOD OF USE
For determination of roughness of road surface profile, 200 estimations at consistent interims is
to taken. The machine is situated with the wheels on its ordinary location and the back foot
stabilizer probe in touch with the asphalt surface at each one measuring point. At that point the
recording the position of the arm pointer on the graph with a cross in suitable section is carried
out by the administrator. For keeping the record of aggregate number of readings, cross in the
count box of chart is given.
For the further system of estimations the Merlin's handles are lifted up so that just the wheel
stays in touch with the way surface and the machine is rolled in forward heading at the same
methodology is rehashed. As long as the wheel is in the typical position the dividing between the
measuring focuses does not make a difference. By taking the estimations at standard interims,
will help in transforming both great normal specimens over the entire length of the area and
decrease the danger of inclination because of the propensity of administrator to keep away from
terrible areas of the street.
The chart is removed from the merlin after 200 observations. Mid path between the eleventh and
the tenth checking from each one end of the diagram underneath the columns as given in the
sample frequently it may be important to insert between segment limits. "D" is the dividing
between the two imprints is measured in millimeters and it’s characterized as the roughness on
the merlin scale.

14
2.4.5 PRACTICALDETAILS
The primary leg, the focal, the stabilizer, the moving arm and the handles are all made of steel
tubing of square cross segment of 25 x 25 mm with 1.5 mm divider thickness for simple
assembling methodology. The stabilizer handles are settled by jolts with the goal that they could
be evacuated for simpler transportation yet the joints are welded where conceivable. Extra struts
are utilized for reinforcing the joints between the principle pillar and legs. The wheel mounted
in the pair of front forks might be any sort of bike wheel and with a tire having reasonably
smooth tread design.
The back foot and the probe foot are 12 mm wide and adjusted in the path of the wheel track to a
length of 100 mm for decreasing the affectability way surface micro-composition. This adjusting
aide for keeping the purpose of contact of probe with way surface with the same vertical plane.
To abstain from establishing on unpleasant streets the weight is stepped and the turn is created
out of the bike wheel center and the arm between the turns.
The outline holder is ready from metal sheet and is bended in such a route, to the point that the
graph is spoken to with the pointer over its run of development. An aide is altered to the side of
the principle bar holding the arm near the pillar for ensuring the arm from unwanted sideways
development. At the point when the machine is raised by its handle one end of this aide
demonstrations as a stop.
The connection of the probe with moving arm is carried out by a strung pole passing through a
prolonged gap that allows both parallel and vertical modification. The position of the probe
which is vertical is situated to the point that the pointer is near the center of the outline when the
histogram won't be focal or the probe dislodging is zero. At the point the machine is tilted side to

15
side the pointer moves, if the above course of action is not legitimately done. After right
modification of 15 readings the machine is hung to one side so that the stabilizer rests out and
about has little impact on the position of the pointer. The enhancement of the arm ought to be
checked by the assistance of a little alignments piece of 6 mm thickness before utilizing the
machine.
The pointer ought to move by 60 mm after the insertion of piece under the probe. If the pointer is
moved by 57 mm, then the estimation of D indicated on the graph is expanded by the component
of 60/57.A look at is conveyed prior and then afterward each one set of estimations for
guaranteeing that there has been no unwanted development of basic parts like back foot. This is
done by furnishing a proportional payback to a correctly characterized position along the way
and verifying that the pointer perusing is not changed. Throughout undertaking an unpleasant
street, more than 10 readings are at breaking point of the histogram. The probe ought to be
evacuated and connected to the given option settling focuses. The above clarified one makes the
point twice from the turn and diminishes the mechanical intensification to 5. The scaling of
graph is carried out by the prior depicted adjustment strategy. The failures are to be presented are
little and could be disregarded for this situation although the dispersing between the probe and
the two feet of the device is no more 0.9 meters.

16
2.4.6 CALIBRATION EQUATIONS
The IRI scale and the Merlin scale are related by the following equation
For all type of pavement surface:
IRI=0.593+0.0471D 42 > D > 312 (2.4> IRI > 15.9)
IRI= International Roughness Index in m/km
D=roughness in Merlin scale measured in mm
2.4.7 RELATIONSHIP BETWEEN IRI AND D
Figure 2.4 RELATIONSHIPS BETWEEN IRI AND D
(Figure from Merlin manual by AIMIL Ltd.)

17
2.5.1 AUTO LEVEL
INTRODUCTION
Auto level is an automatically operated optical instrument that helps in establishing or checking
points on the horizontal planes. An automatic level, also known as builder’s auto level or a
dumpy level, is a laser marking; optical measuring device helps in estimating a horizontal plane.
This can be done on a small scale such as residential home construction or on a much larger scale
for surveying. Due to the wide range of jobs that can benefit from the use of an automatic level,
the devices themselves are manufactured to different specifications. That is not to say they all
don’t perform the same basic function, they do. However, the function needed will determine the
type of automatic level to be used.
Auto level is set upon a tripod, which is leveled as much as possible. When the auto level is set
on the tripod, a swinging prism inside the level adjusts to compensate for imperfections in the
tripod leveling. This is only good for small inaccuracies; larger variants will need to be dealt
with before proceeding. These are used in the same manner as the dumpy level but are most
often used on residential and smaller scale industrial building construction projects. These levels
set up quickly and are easy to operate for most people. It is, however, still a two person job to
use the level and an assistant will be needed to hold a tape measure or graduated measuring stick.

18
2.5.2 GENERAL DESCRIPTION
Principle of levelling
Height reference is provided by the Auto level which is an optical instrument. "Height of
Collimation" is defined as this height reference which through the axis of the telescope at the
horizontal plane. The height of other stations can be found after knowing the height of
collimation or instrument height by measuring the plane with the help of a staff. The height of
collimation can be obtained by taking the back sight to a staff placed on a bench mark and by
adding the staff reading to the bench mark value.
Figure 2.5Auto level (www.levelling.uhi.ac.uk/pics/pentaxR.jpg)
There are three parts in leveling head:
A tribrach or top plate that carries the spirit level and the instrument
Foot, screws and three leveling
Trivet or a foot plate that is attached with tripod head

19
The staff or the other image can be brought in to focus by the help of object focusing screw.
Auto level has a spherical level which is a bubble spirit level and it is the referenced to the axis
of telescope and attached with the tribrach. The horizontal sight line (Collimation) can be
achieved only if the bubble is within the circle for the instrument. Auto level’s eye piece should
match with observer’s proximity; it should be adjusted and according to the observer to bring the
cross hairs in to sharp focus. This device contains linear bubble level.
Auto level has horizontal circle and one tangent screw which are replaced by markings at
900intervals, which leads for setting out of right angles. Focusing of telescope is done by the
help of object focus screw which is on the right side of the device All instruments contains object
focus screw and the eye piece of cross hair.
Attaching the instrument to the tripod:
The instrument can be centered by the tripod screw which is captive and rested on the movable
bracket. To take tripod screw the device base plate or the trivet stage is threaded. To achieve a
stable contact with the tripod head the three raised ‘feet’ are machined. At level tripod screw
constitutes of a large head and is designed so that it can be tightened and easily undone by hand.
Adjusting the levelling head
The bubble tube should be so aligned that it will be parallel to two foot screws. The two foot
screws should be rotated in opposite direction with facing the device, Either thumbs moving
inwards or thumbs moving outwards in the direction of left thumb the bubble moves. The device
is leveled on the axis only when the bubble is settled at the exact center. The bubble is aligned
with respect to the third leveling screw by the rotation of the telescope by 900.When the bubble is
at centre the auto level is said to be level, checking can be done through 90° of rotation. Re

20
leveling of two foot screws and repeating the rotation can be done for necessary checking. The
two sets of adjustments before leveling of the device and the bubble remaining in the centre of
tube due to the rotation of the telescope may have to done.
Tripod’s each leg can be easily adjustable with the length. By the help of lever clamp the legs are
to be locked (left) or screw (right).it is important to check the locking of lever or the screw is
tight or not after the legs is set to the correct length.
The device is to be set up again and all observations are to be taken again if the instrument height
is changed due to the movement of legs during use. The tripod is to be set on the position and for
sloping area two legs are to be on downhill side. By the change of length of each leg fine
adjustments can be easily achievable. Always there should be surety to have the clamp or locking
screw to be tight after the survey is finished. To keep the instrument at an exact point over the
survey station the plumb rod is required.

21
2.5.3 METHOD OF USE
1. At the start of the project benchmark/datum is recorded since the primary measurement being
recorded by the auto level is elevation.
2. The total length of the road section to be measured by tape to be surveyed.
3. The instrument is to be situated at the first station where the bench mark is visible, which
establishes the elevation of the first point of the road section profile.
4. The auto level should be set up at the location on tripod with the help of plumb bob. Affix the
auto level and level the tripod and auto level by adjusting first the tripod legs to get the bubble
close to the ‘level circle.’ Fine leveling adjustments can be made using the leveling screws on the
auto level.
5. The elevation at the horizontal line within the eyepiece should be determined. This will be
foundation for future measurements. For future instrument elevation, set staff on the project
datum (be sure your rod extends high enough so it is visible to the auto level).
6. At each 2.2 meter distance the staff should be placed for determination of elevation at the
respective points.
7. The level difference is calculated from the previous point to the present point.
8. The slope for each interval is to be calculated by Slope=level difference/interval distance.
9. Avg. value of the slopes is to be calculated by Total summation of slopes/total no of sections.
10. The IRI (international roughness index) is determined which is the representation of road
roughness, IRI=Avg. slope*1000

22
CHAPTER 3
DEVELOPMENT OF NEW DEVICE
(The details are being communicated for a technical paper for possible publication
in a journal and hence are not covered in this chapter.)

23
CHAPTER 4
ANALYSIS OF RESULTS AND
DISCUSSION

24
4.1 INTRODUCTION
This report gives the road roughness value in IRI scale by using three different kinds of
instruments. The lists of instruments are as follows:
Merlin
Auto level
New device
By the use of merlin and new device 10 roads inside NIT, Rourkela campus and 5 roads for auto
level instrument inside NIT, Rourkela campus were conducted for the comparison between the
instrument upon the basis of the roughness values in terms of IRI.
List of the roads used during experiments are listed below.
1. SAC to Hall Gate
2. Main Gate to Front Parking
3. Front Parking to Hall Gate
4. Temple Gate to Front Parking
5. Hall Gate to SAC
6. Library to SAC
7. Front parking to Temple Gate
8. Main Gate to Temple Gate
9. Temple Gate to SAC
10. LA Road

25
4.1.1 One of the readings from Merlin - Test no. 5 (Hall gate to SAC)
From chart
The value of D = 16 divisions [D= roughness on merlin scale]
= 16 * 5 mm [1 division = 5 mm]
= 80 mm [42<D<312]
Calculation of International Road Index (IRI)
IRI = 0.593 + 0.0471D = 0.593 + 0.0471*80
= 0.593 + 3.768 = 4.361 m/km [2.4<IRI<15.9]
Similarly readings were taken inside NIT, Rourkela campus for other 9 roads.

26
4.1.2 One of the readings from Auto level-Test no. 5 (Hall gate to SAC)
Table 4.1 One of the readings from Auto level-Test no. 5 (Hall gate to SAC)
Serial
no.
Intervals in
cm
Readings in
cm Difference Slope
0 0 155.5 0 0
1 220 155.5 0 0
2 440 155 0.5 0.0025
3 660 154.2 0.8 0.004
4 880 153.6 0.6 0.003
5 1100 153.3 0.3 0.0015
6 1320 153.4 -0.1 -0.0005
7 1540 153.3 0.1 0.0005
8 1760 154 -0.7 -0.0035
9 1980 154 0 0
10 2200 154.8 -0.8 -0.004
. . . . .
. . . . .
. . . . .
. . . . .
. . . . .
191 42020 134.6 0.2 0.001
192 42240 134.5 0.1 0.0005
193 42460 134.1 0.4 0.002
194 42680 134 0.1 0.0005
195 42900 133.8 0.2 0.001
196 43120 133.6 0.2 0.001
197 43340 133.5 0.1 0.0005
198 43560 133.4 0.1 0.0005
199 43780 133.5 -0.1 -0.0005
200 44000 133.4 0.1 0.0005
Calculation
Total no. of readings = 200 Summation of slopes = 0.848
IRI = Avg. slope * 1000= (Summation of slopes/Total no. of readings)*1000
= (0.848/200)*1000 = 4.24 m/km
27
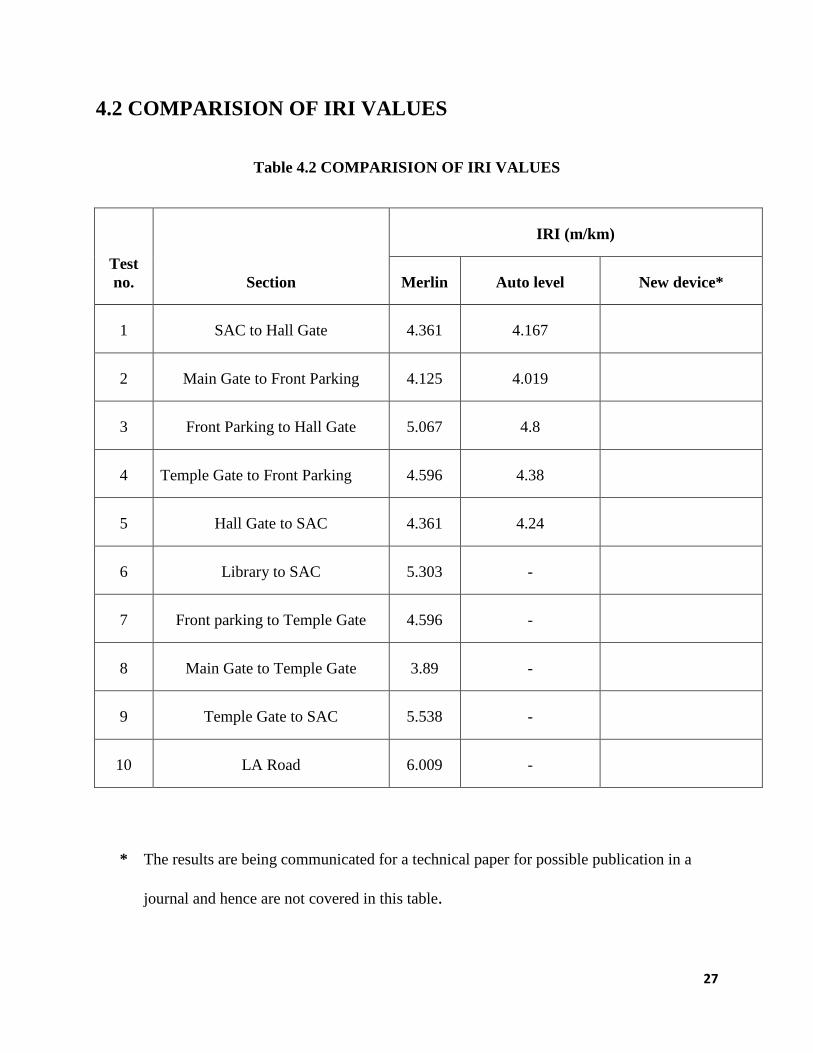
4.2 COMPARISION OF IRI VALUES
Table 4.2 COMPARISION OF IRI VALUES
Test
no. Section
IRI (m/km)
Merlin Auto level New device*
1 SAC to Hall Gate 4.361 4.167
2 Main Gate to Front Parking 4.125 4.019
3 Front Parking to Hall Gate 5.067 4.8
4 Temple Gate to Front Parking 4.596 4.38
5 Hall Gate to SAC 4.361 4.24
6 Library to SAC 5.303 -
7 Front parking to Temple Gate 4.596 -
8 Main Gate to Temple Gate 3.89 -
9 Temple Gate to SAC 5.538 -
10 LA Road 6.009 -
* The results are being communicated for a technical paper for possible publication in a
journal and hence are not covered in this table.

28
4.2.1 Merlin vs Auto level
Table 4.3 IRI reading Merlin vs Auto level
Test
no. Section
IRI (m/km)
Difference
in reading
Error
%
Avg.
error
% Merlin
Auto
level
1 SAC to Hall Gate 4.361 4.167 0.194 4.45
3.95
2
Main Gate to Front
Parking 4.125 4.019 0.106 2.57
3
Front Parking to Hall
Gate 5.067 4.8 0.267 5.27
4
Temple Gate to Front
Parking 4.596 4.38 0.216 4.70
5 Hall Gate to SAC 4.361 4.24 0.121 2.77

29
4.3 DISCUSSION
All the experiments are carried on the roads inside NIT, Rourkela campus using Merlin, Auto
level and new device. The three instruments gave the road’s roughness values by different
methods. Each method is considered for the respective instrument and the value of roughness
was calculated. After the calculation of the roughness of the different section of road by three
different instruments the value of roughness in terms of IRI was compared with the Merlin’s
roughness reading. After comparison with the merlin instrument the error % was calculated for
auto level which is 3.95%. This error % calculated is very less and thus the instruments can be
also used for the calculation of road’s surface roughness. Merlin and auto level are the two
instruments which are already available in the market. But new device is an indigenously
fabricated/ developed device which can be used for the calculation of road’s surface roughness.
The observations with the new device are not being covered here as the same are being
communicated for a technical paper for possible publication in a journal.

30
CHAPTER 5
CONCLUSIONS AND FUTURE SCOPE

31
5.1 CONCLUSIONS
Merlin and auto levels are normally considered to be simple devices for measurement of road
roughness. An attempt has been made in this study to design and develop a new device.
Experiments have been carried out using this device and at the same time using other two types
of equipments on the same road stretches. The results of the experiments on road roughness in
terms of IRI using these three devices have been compared among the three methods considered.
It is observed that auto level has an error% of 3.95% when compared with the IRI values
obtained from merlin. All the three instruments have its unique importance in the calculation of
the road roughness.
5.2 FUTURE SCOPE
It is proposed that the following works using this new device can be taken up in future.
1. A good number of experiments using these three experiments are to be conducted and the
results to be statistically reviewed and compared.
2. The device is to be further modified to suit various roughness conditions.
3. The same stretches should be tested for roughness by using other roughness measuring
methods such as bump integrator and RTRRM in order to establish the validity of this
new setup.

32
REFERENCES
1) Austroads (1999b). “Test Method for Determination of the International Roughness
Index (IRI) (ARRB TR Walking Profiler)”, Austroads Pavement Assessment Test
(PAT01), VicRoads, Australia.
2) Baus, R., and Hong, W. (1999). “Investigation and Evaluation of Roadway Rideability
Equipment and Specifications.” Federal Highway Administration/South Carolina
Department of Transportation Report FHWA-SC-99-05, Columbia, South Carolina.
3) Bennett, C.R. (1996). “Calibrating Road Roughness Meters in Developing Countries”,
Transportation Research Record 1536, National Research Board, Washington, D.C.
4) Cundill, M.A. (1996). “The Merlin Road Roughness Machine: User Guide”, Research
Report 229, Transport Research Laboratory (TRL), Berkshire, United Kingdom.
5) E. Spangler and W. Kelly, "GMR Road Profilometer - A Method for Measuring Road
Profile." Highway Research Record 121, Highway Research Board, 1966.
6) Karamihas, S.M.,etal. 1999. Guidelines for Longitudinal Pavement Profile Measurement:
Final Report. NCHRP 10-47. Washington, DC: Transportation Research Board.
7) Liu Wei, TF Fwa and Zhao Zhe (2005) Wavelet analysis and interpretation of road
roughness. Journal of Transportation Engineering 131, no.2.
8) National Research Council. Manual for Profile Measurement: Operational and Field
Guidelines 1994, Strategic Highway Research Program, Washington, DC.
9) Perera, Rohan W., and. Kohn, Starr D. 1994. Road Profiler Data Analysis and
Correlation Final Report, Research Report No. 92-30, Plymouth, Michigan: Soil and
Materials Engineers, Inc.

33
10) Perera, R.W., Kohn, S.D., and Bemanian, S. 1996. Comparison of Road Profilers.
Report No. TRR 1536, Washington, DC: Transportation Research Board, pp. 117-124.
11) P. W. Amberg, "The Laser Road Surface Tester." Swedish National Road & Traffic
Research Institute, Report No. 255A, 1983.
12) Sayers, M.W. – Karamihas, S.M. (1998): The little book of profiling – Basic information
about measuring and interpreting road profiles, University of Michigan, p.102.
13) Sayers, M.W., Karamihas, S.M. 1996. Estimation of Rideability by Analyzing
Longitudinal Road Profile. Report No. TRR 1536. Washington, DC: Transportation
Research Board, pp.110-116.
14) Thomas, T.R., “Trends in surface roughness”, International Journal of Machine Tools
and Manufacture, 38, Issues 5-6, pp 405-411 (1998).
15) Wang, H. (2006). “Road Profiler Performance Evaluation and Accuracy Criteria
Analysis.” Master thesis, Civil and Environmental Engineering, Virginia Polytechnic
Institute and State University, Blacksburg, Virginia.