DEVELOPMENT OF A CORRELATION TO ESTIMATE THE FATIGUE ... · impact energy, the yield strength, the...
12
71 * To whom correspondence may be addressed CT&F - Ciencia, Tecnología y Futuro - Vol. 4 Num. 2 Dec. 2010 DEVELOPMENT OF A CORRELATION TO ESTIMATE THE FATIGUE STRENGTH FOR STEELS BASED ON LOW-COST TESTS Alexander Martínez 1* , Alban Jaimes 2 , Aníbal Serna 1 and Iván Uribe 2 1 Ecopetrol S. A. – Instituto Colombiano del Petróleo (ICP), Bucaramanga, Santander, Colombia 2 Universidad Industrial de Santander, Bucaramanga, Santander, Colombia e-mail: [email protected] [email protected] (Received, Feb. 15, 2010; Accepted, Oct. 27, 2010) ABSTRACT F atigue cracking in metallic materials occurs mainly due to the effect of cyclic stresses and their variation of magnitude over time. To evaluate the fatigue strength based on S-N curves, many tests are needed, which require a lot of time and incur high costs. For this research, several tests were conducted on samples of high-strength steels to determine their mechanical properties, chemical composition and fatigue. It was found that impact toughness Charpy V Notch , the percentage of alloying elements and the mechanical properties show a positive lineal effect in relation to the fatigue strength of the materials evaluated. Consider- ing this behavior, a correlation to predict the fatigue strength of the steel was developed based on the Charpy impact energy, the yield strength, the ultimate strength, and the hardness of the material; thisa correlation shows a very good fit with the experimental fatigue data The main advantage of this correlation is that the estimation of fatigue strength is based on very low cost tests. Keywords: fatigue prediction, fatigue strength, fatigue test, impact resistance, tensile strenght, toughness.
Transcript of DEVELOPMENT OF A CORRELATION TO ESTIMATE THE FATIGUE ... · impact energy, the yield strength, the...
71
* To whom correspondence may be addressed
CT&F - Ciencia, Tecnología y Futuro - Vol. 4 Num. 2 Dec. 2010
DEVELOPMENT OF A CORRELATION TO ESTIMATE THE FATIGUE
STRENGTH FOR STEELS BASED ON LOW-COST TESTS
Alexander Martínez1*, Alban Jaimes2, Aníbal Serna1 and Iván Uribe2
1 Ecopetrol S. A. – Instituto Colombiano del Petróleo (ICP), Bucaramanga, Santander, Colombia2 Universidad Industrial de Santander, Bucaramanga, Santander, Colombia
e-mail: [email protected] [email protected]
(Received, Feb. 15, 2010; Accepted, Oct. 27, 2010)
ABSTRACT
Fatigue cracking in metallic materials occurs mainly due to the effect of cyclic stresses and their variation of magnitude over time. To evaluate the fatigue strength based on S-N curves, many tests are needed, which require a lot of time and incur high costs. For this research, several tests were conducted on
samples of high-strength steels to determine their mechanical properties, chemical composition and fatigue. It was found that impact toughness Charpy V Notch , the percentage of alloying elements and the mechanical properties show a positive lineal effect in relation to the fatigue strength of the materials evaluated. Consider-ing this behavior, a correlation to predict the fatigue strength of the steel was developed based on the Charpy impact energy, the yield strength, the ultimate strength, and the hardness of the material; thisa correlation shows a very good fit with the experimental fatigue data The main advantage of this correlation is that the estimation of fatigue strength is based on very low cost tests.
Keywords: fatigue prediction, fatigue strength, fatigue test, impact resistance, tensile strenght, toughness.
72 CT&F - Ciencia, Tecnología y Futuro - Vol. 4 Num. 2 Dec. 2010
RESUMEN
El agrietamiento por fatiga en materiales metálicos ocurre principalmente debido al efecto de los esfuerzos cíclicos y la variación de su magnitud en el tiempo. Para evaluar la resistencia a la fatiga basada en las curvas esfuerzo vs. ciclos, se deben correr muchos ensayos, los cuales requieren una
gran cantidad de tiempo y altos costos. En esta investigación, se realizaron ensayos en muestras de acero de alta resistencia para determinar sus propiedades mecánicas, composición química y resistencia a la fatiga. Se encontró que la tenacidad al impacto medida en el ensayo Charpy V Notch (CVN), el porcentaje de elementos de aleación y las propiedades mecánicas mostraron un efecto lineal positivo en relación con la resistencia a la fatiga de los materiales evaluados. Considerando este comportamiento, una correlación para predecir la resistencia a la fatiga fue desarrollada basada en la energía absorbida por impacto, la relación entre el esfuerzo de fluencia y el esfuerzo último y la dureza del material; esta correlación presenta un muy buen ajuste con los datos de fatiga experimentales.
Palabras clave: predicción de fatiga, resistencia a la fatiga, ensayo de fatiga, resistencia al impacto, resistencia a la tracción, tenacidad.
73
DEVELOPMENT OF A CORRELATION TO ESTIMATE THE FATIGUE STRENGTH FOR STEELS BASED ON LOW-COST TESTS
CT&F - Ciencia, Tecnología y Futuro - Vol. 4 Num. 2 Dec. 2010
1. INTRODUCTION
In the oil industry, the use of steel for high-resistance machines is extensive; these steels are subject to high cyclic load conditions that induce damage to the material because of the failure mechanism of fatigue cracking. The selection of these materials is based on fatigue resistance tests carried out in the laboratory, or the performance of the materials in operational condi-tions, or existing recommendations in the literature. In order to carry out the laboratory tests, a representative number of trials are required, which obviously increases costs. Field tests require an impractical amount of time; therefore, the common rule is to use the general recommendations in the current literature. The present investigation sought to develop a methodology of eval-uation that would allow calculating the behavior that a material may show under fatigue conditions, through the implementation of short duration and low-cost tests.
The present research was carried out to determine a correlation between impact toughness and fatigue behavior of the fatigue-resistant steels most commonly used in the production of hydrocarbons. This is based on the fact that an increase in toughness tends to decrease the possibility of the initiation and the propagation rate of fatigue cracks; once a fatigue crack starts to develop, a deformation area encloses the crack tip increasing the number of cycles needed for the beginning and propa-gation, therefore the fatigue strength of the material is increased. Initially, tests were performed to determine chemical composition, microstructure, presence of im-purities, and the mechanical strength of the materials to be evaluated; also impact energy tests were performed by means of the Charpy test to determine toughness and resistance to fatigue.
Based on the data obtained, several multivariable functions were defined that relate the fatigue limit of these steels to their mechanical properties and to the value of the impact energy found in the Charpy test. The correlations obtained allow one to predict fatigue behav-ior based on the results of the tension test and Charpy impact test; these tests are very low-cost and of rapid implementation, thus facilitating the selection processes for these materials, it should be emphasized that this approach is a novel one in the industry. This correlation only applies to steels with high mechanical resistance.
2. THEORICAL FRAMEWORK
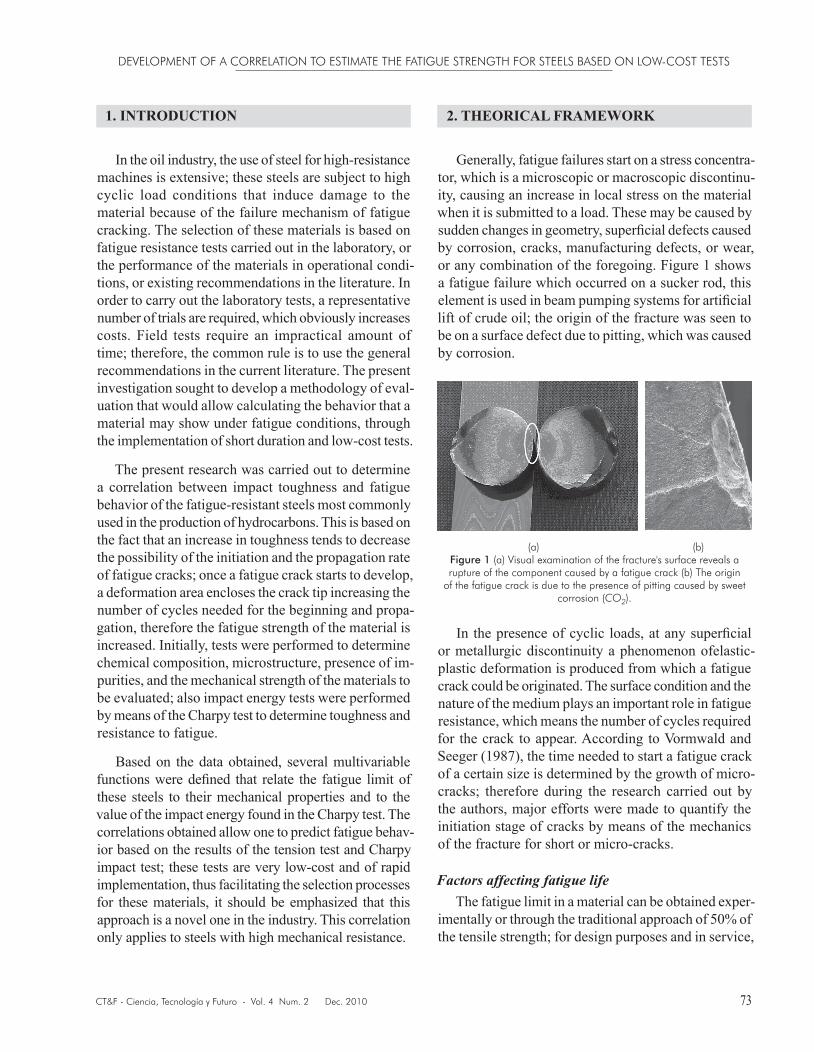
Generally, fatigue failures start on a stress concentra-tor, which is a microscopic or macroscopic discontinu-ity, causing an increase in local stress on the material when it is submitted to a load. These may be caused by sudden changes in geometry, superficial defects caused by corrosion, cracks, manufacturing defects, or wear, or any combination of the foregoing. Figure 1 shows a fatigue failure which occurred on a sucker rod, this element is used in beam pumping systems for artificial lift of crude oil; the origin of the fracture was seen to be on a surface defect due to pitting, which was caused by corrosion.
(a) (b)Figure 1 (a) Visual examination of the fracture's surface reveals a rupture of the component caused by a fatigue crack (b) The origin
of the fatigue crack is due to the presence of pitting caused by sweet corrosion (CO2).
In the presence of cyclic loads, at any superficial or metallurgic discontinuity a phenomenon ofelastic- plastic deformation is produced from which a fatigue crack could be originated. The surface condition and the nature of the medium plays an important role in fatigue resistance, which means the number of cycles required for the crack to appear. According to Vormwald and Seeger (1987), the time needed to start a fatigue crack of a certain size is determined by the growth of micro-cracks; therefore during the research carried out by the authors, major efforts were made to quantify the initiation stage of cracks by means of the mechanics of the fracture for short or micro-cracks.
Factors affecting fatigue life The fatigue limit in a material can be obtained exper-
imentally or through the traditional approach of 50% of the tensile strength; for design purposes and in service,
ALEXANDER MARTÍNEZ et al.
74 CT&F - Ciencia, Tecnología y Futuro - Vol. 4 Num. 2 Dec. 2010
this value is recalculated as the effective or admissible fatigue limit, taking into account the effect of variables such as: average stress, surface finish, environment, stress concentrators, reliability, component size, grain size, heat treatment conditions, chemical composition, and level of inclusions. Listed below are the effects on fatigue performance that various factors cause.
Effect of average stress on fatigue. The contrast between the minimum and maximum load applied to the material has a key effect on the resistance to fatigue cracking; if the ratio is higher, (R = +1,0), fatigue endurance limit decreases, where R is the relationship between the minimum and maximum stress.
Effect of stress concentrators. The resistance to fatigue cracking is severely reduced through the generation of specific stress concentrators caused by the presence of surface defects in the material, such as holes, pores, notches, nicks, abrupt changes in ge-ometry. In a study conducted by Smith, Newman, & Piascik (2003), uniaxial fatigue tests were conducted to compare the fatigue life of nicks produced in the laboratory to Electrical Discharge Machining (EDM) defects. Defects made with EDM are used to simulate the effect of corrosion caused by pitting. For AA 7050 aluminum alloy, the notch produced by EDM resulted in a fatigue life similar to that obtained in the tests of samples containing "pitting" of similar size.
Effect of the level of inclusions. In a study con-ducted by Atkinson and Anderson (2003), a correlation was developed of the maximum inclusion size in clean steels and the relationship to the mechanical properties; among the important contributions of this research is the development of a new approach for the design for fatigue using the generalized Pareto distribution to predict the form of the size distribution of the biggest inclusions and the accumulative volumetric fraction of the component in which the local fatigue stress ex-ceed a particular stress level. The new design method developed in this research allows one to analyze the effect of changes on the design stresses or the clean-ness of the steel on the likelihood of failure. Yang and Zhang (2004) investigated the behavior of the inclu-sions on fatigue behavior in the super-long-life regime in 42 CrMo steels. The analysis by electron scanning microscope showed that fatigue cracks start mainly from non-metallic inclusions, so the high cycle fatigue
behavior is presented in steels with very low content of inclusions (almost zero inclusions).
The size of inclusions can affect the initiation of fatigue cracks, according to the research conducted by Juvonen (2004), in which it wasevaluated the effect of the level of inclusions on the fatigue behavior of dif-ferent carburization conditions in AISI SAE 8620 steel. The relevant conclusion was that the average size of inclusion for the start of fatigue cracks had an effect on the relationship between the fatigue limit and the mechanical resistance when the size of the inclusions ranged between 70 - 90 microns.
Effect of grain size and grain direction. Materials with fine grain size exhibited higher fatigue properties than materials with coarse grain size. The direction of flow of aligned grains in wrought or laminate sheets relative to the direction of the load has a significant effect on fatigue resistance, with cyclic loads across the direction of the grain generating fatigue properties that are inferior to the cyclic loads along the direction of the grain (longitudinal). Research carried out by Di Schino and Kenny (2003) on type 304 stainless steels studied the effect of the grain size of austenite (1 - 47 microns) on behavior in a test of tensile stress and fatigue. The relevant results of this investiga-tion showed an increase in tensile stress and fatigue prop-erties through refining the grain size. In research carried out by Subramanya, Padmanabhan, & Jaeger (2000), the speed of crack growth caused by fatigue was evaluated under the Paris regime for two microalloyed steels with ferrite and pearlite microstructures; the results obtained from testing crack growth rate showed no differences in the response in the region of fatigue crack propagation in two materials evaluated, considering that these materials showed differences with respect to the yield stress on the order of 170 MPa and in the size of pearlite colonies of 7 microns. The previous austenite grain size is directly related to the refining elements of the grain size.
Effect of the microstructure. The microstructure of tempered martensite obtained from a heat treatment of quenching and tempering exhibits fatigue behavior superior to that of any other microstructure. Tempered martensite in steels increases the fatigue limit because it is a structure in which the mobility of dislocations is minimal, resulting in an increased load level neces-sary to be applied in order to displace the dislocations (Lampman, Davidson, & Reidenbach, 1996).
75
DEVELOPMENT OF A CORRELATION TO ESTIMATE THE FATIGUE STRENGTH FOR STEELS BASED ON LOW-COST TESTS
CT&F - Ciencia, Tecnología y Futuro - Vol. 4 Num. 2 Dec. 2010
according to the specifications of the ASTM E 739-91, according to this standard, the tests have a confidence level for research and development of components with a replication of 33-50%.
Chemical composition The samples received were analyzed chemically
using the optical emission spectroscopy technique, according to the specifications of the ASTM E 415-08 Standard.
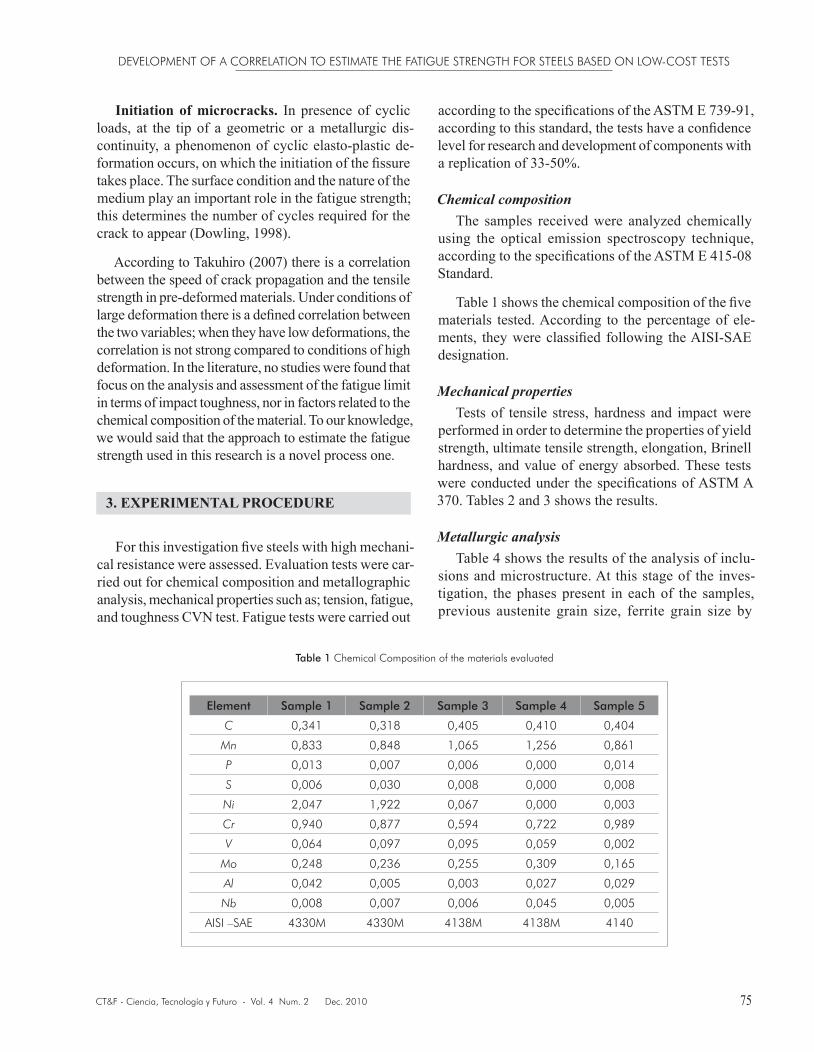
Table 1 shows the chemical composition of the five materials tested. According to the percentage of ele-ments, they were classified following the AISI-SAE designation.
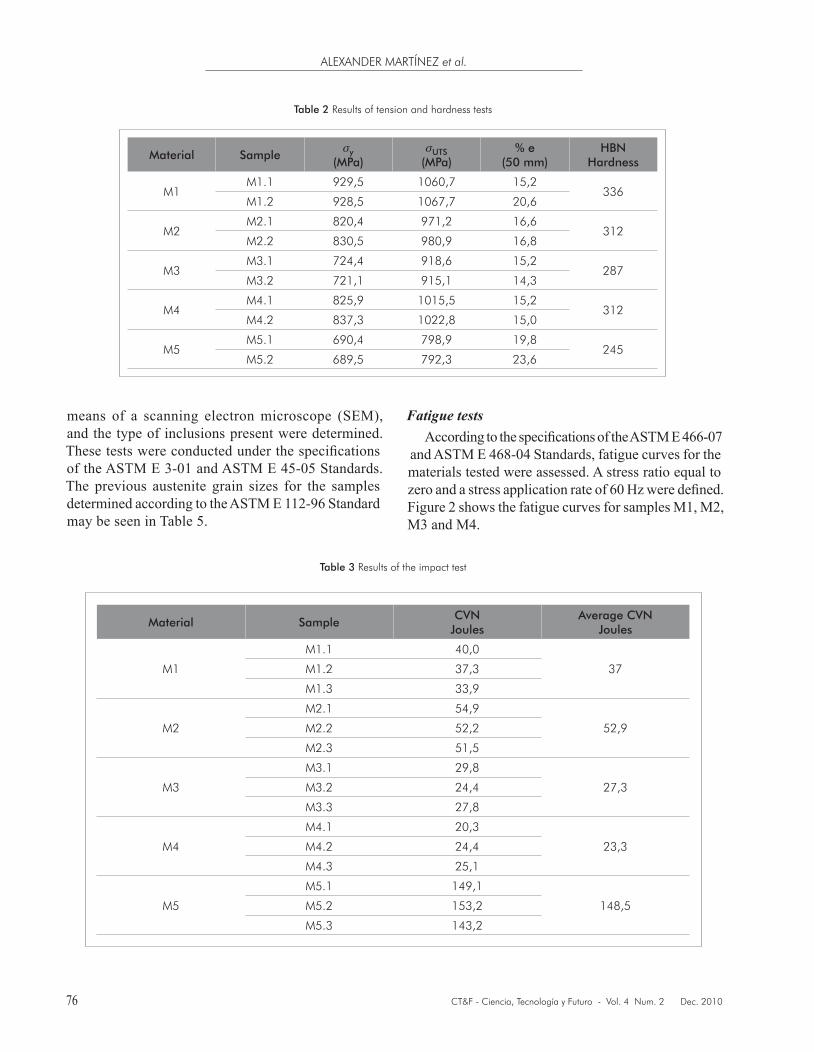
Mechanical propertiesTests of tensile stress, hardness and impact were
performed in order to determine the properties of yield strength, ultimate tensile strength, elongation, Brinell hardness, and value of energy absorbed. These tests were conducted under the specifications of ASTM A 370. Tables 2 and 3 shows the results.
Metallurgic analysis Table 4 shows the results of the analysis of inclu-
sions and microstructure. At this stage of the inves-tigation, the phases present in each of the samples, previous austenite grain size, ferrite grain size by
Initiation of microcracks. In presence of cyclic loads, at the tip of a geometric or a metallurgic dis-continuity, a phenomenon of cyclic elasto-plastic de-formation occurs, on which the initiation of the fissure takes place. The surface condition and the nature of the medium play an important role in the fatigue strength; this determines the number of cycles required for the crack to appear (Dowling, 1998).
According to Takuhiro (2007) there is a correlation between the speed of crack propagation and the tensile strength in pre-deformed materials. Under conditions of large deformation there is a defined correlation between the two variables; when they have low deformations, the correlation is not strong compared to conditions of high deformation. In the literature, no studies were found that focus on the analysis and assessment of the fatigue limit in terms of impact toughness, nor in factors related to the chemical composition of the material. To our knowledge, we would said that the approach to estimate the fatigue strength used in this research is a novel process one.
3. EXPERIMENTAL PROCEDURE
For this investigation five steels with high mechani-cal resistance were assessed. Evaluation tests were car-ried out for chemical composition and metallographic analysis, mechanical properties such as; tension, fatigue, and toughness CVN test. Fatigue tests were carried out
Table 1 Chemical Composition of the materials evaluated
Element Sample 1 Sample 2 Sample 3 Sample 4 Sample 5
C 0,341 0,318 0,405 0,410 0,404
Mn 0,833 0,848 1,065 1,256 0,861
P 0,013 0,007 0,006 0,000 0,014
S 0,006 0,030 0,008 0,000 0,008
Ni 2,047 1,922 0,067 0,000 0,003
Cr 0,940 0,877 0,594 0,722 0,989
V 0,064 0,097 0,095 0,059 0,002
Mo 0,248 0,236 0,255 0,309 0,165
Al 0,042 0,005 0,003 0,027 0,029
Nb 0,008 0,007 0,006 0,045 0,005
AISI –SAE 4330M 4330M 4138M 4138M 4140
ALEXANDER MARTÍNEZ et al.
76 CT&F - Ciencia, Tecnología y Futuro - Vol. 4 Num. 2 Dec. 2010
means of a scanning electron microscope (SEM), and the type of inclusions present were determined. These tests were conducted under the specifications of the ASTM E 3-01 and ASTM E 45-05 Standards. The previous austenite grain sizes for the samples determined according to the ASTM E 112-96 Standard may be seen in Table 5.
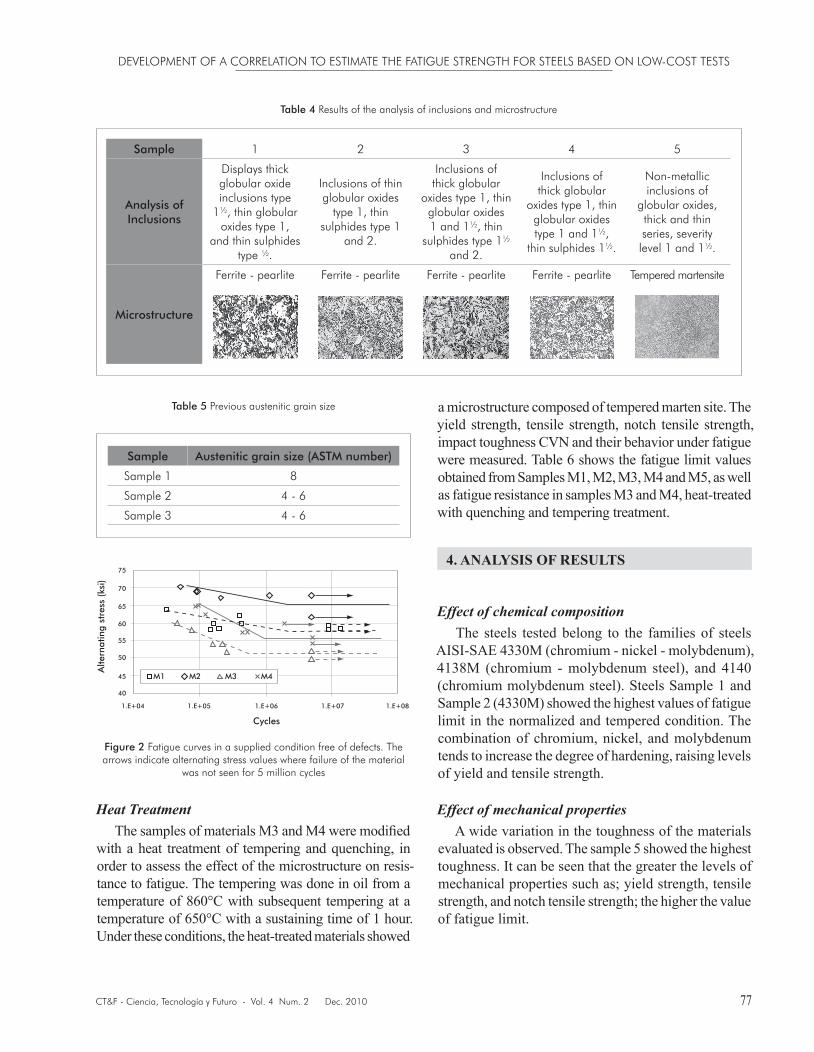
Fatigue testsAccording to the specifications of the ASTM E 466-07
and ASTM E 468-04 Standards, fatigue curves for the materials tested were assessed. A stress ratio equal to zero and a stress application rate of 60 Hz were defined. Figure 2 shows the fatigue curves for samples M1, M2, M3 and M4.
Table 2 Results of tension and hardness tests
Material Sampley
(MPa)UTS
(MPa)% e
(50 mm)HBN
Hardness
M1M1.1 929,5 1060,7 15,2
336M1.2 928,5 1067,7 20,6
M2M2.1 820,4 971,2 16,6
312M2.2 830,5 980,9 16,8
M3M3.1 724,4 918,6 15,2
287M3.2 721,1 915,1 14,3
M4M4.1 825,9 1015,5 15,2
312M4.2 837,3 1022,8 15,0
M5M5.1 690,4 798,9 19,8
245M5.2 689,5 792,3 23,6
Table 3 Results of the impact test
Material SampleCVN
JoulesAverage CVN
Joules
M1
M1.1 40,0
37M1.2 37,3
M1.3 33,9
M2
M2.1 54,9
52,9M2.2 52,2
M2.3 51,5
M3
M3.1 29,8
27,3M3.2 24,4
M3.3 27,8
M4
M4.1 20,3
23,3M4.2 24,4
M4.3 25,1
M5
M5.1 149,1
148,5M5.2 153,2
M5.3 143,2
77
DEVELOPMENT OF A CORRELATION TO ESTIMATE THE FATIGUE STRENGTH FOR STEELS BASED ON LOW-COST TESTS
CT&F - Ciencia, Tecnología y Futuro - Vol. 4 Num. 2 Dec. 2010
Table 4 Results of the analysis of inclusions and microstructure
Sample 1 2 3 4 5
Analysis of Inclusions
Displays thick globular oxide inclusions type
1½, thin globular oxides type 1,
and thin sulphides type ½.
Inclusions of thin globular oxides
type 1, thin sulphides type 1
and 2.
Inclusions of thick globular
oxides type 1, thin globular oxides 1 and 1½, thin
sulphides type 1½ and 2.
Inclusions of thick globular
oxides type 1, thin globular oxides type 1 and 1½,
thin sulphides 1½.
Non-metallic inclusions of
globular oxides, thick and thin series, severity level 1 and 1½.
Microstructure
Ferrite - pearlite Ferrite - pearlite Ferrite - pearlite Ferrite - pearlite Tempered martensite
Table 5 Previous austenitic grain size
Sample Austenitic grain size (ASTM number)
Sample 1 8
Sample 2 4 - 6
Sample 3 4 - 6
a microstructure composed of tempered marten site. The yield strength, tensile strength, notch tensile strength, impact toughness CVN and their behavior under fatigue were measured. Table 6 shows the fatigue limit values obtained from Samples M1, M2, M3, M4 and M5, as well as fatigue resistance in samples M3 and M4, heat-treated with quenching and tempering treatment.
4. ANALYSIS OF RESULTS
Effect of chemical compositionThe steels tested belong to the families of steels
AISI-SAE 4330M (chromium - nickel - molybdenum), 4138M (chromium - molybdenum steel), and 4140 (chromium molybdenum steel). Steels Sample 1 and Sample 2 (4330M) showed the highest values of fatigue limit in the normalized and tempered condition. The combination of chromium, nickel, and molybdenum tends to increase the degree of hardening, raising levels of yield and tensile strength.
Effect of mechanical propertiesA wide variation in the toughness of the materials
evaluated is observed. The sample 5 showed the highest toughness. It can be seen that the greater the levels of mechanical properties such as; yield strength, tensile strength, and notch tensile strength; the higher the value of fatigue limit.
Figure 2 Fatigue curves in a supplied condition free of defects. The arrows indicate alternating stress values where failure of the material
was not seen for 5 million cycles
40
45
50
55
60
65
70
75
1.E+04 1.E+05 1.E+06 1.E+07 1.E+08
Cycles
Alte
rnat
ing
stre
ss (
ksi)
M1 M2 M3 M4
Heat TreatmentThe samples of materials M3 and M4 were modified
with a heat treatment of tempering and quenching, in order to assess the effect of the microstructure on resis-tance to fatigue. The tempering was done in oil from a temperature of 860°C with subsequent tempering at a temperature of 650°C with a sustaining time of 1 hour. Under these conditions, the heat-treated materials showed
ALEXANDER MARTÍNEZ et al.
78 CT&F - Ciencia, Tecnología y Futuro - Vol. 4 Num. 2 Dec. 2010
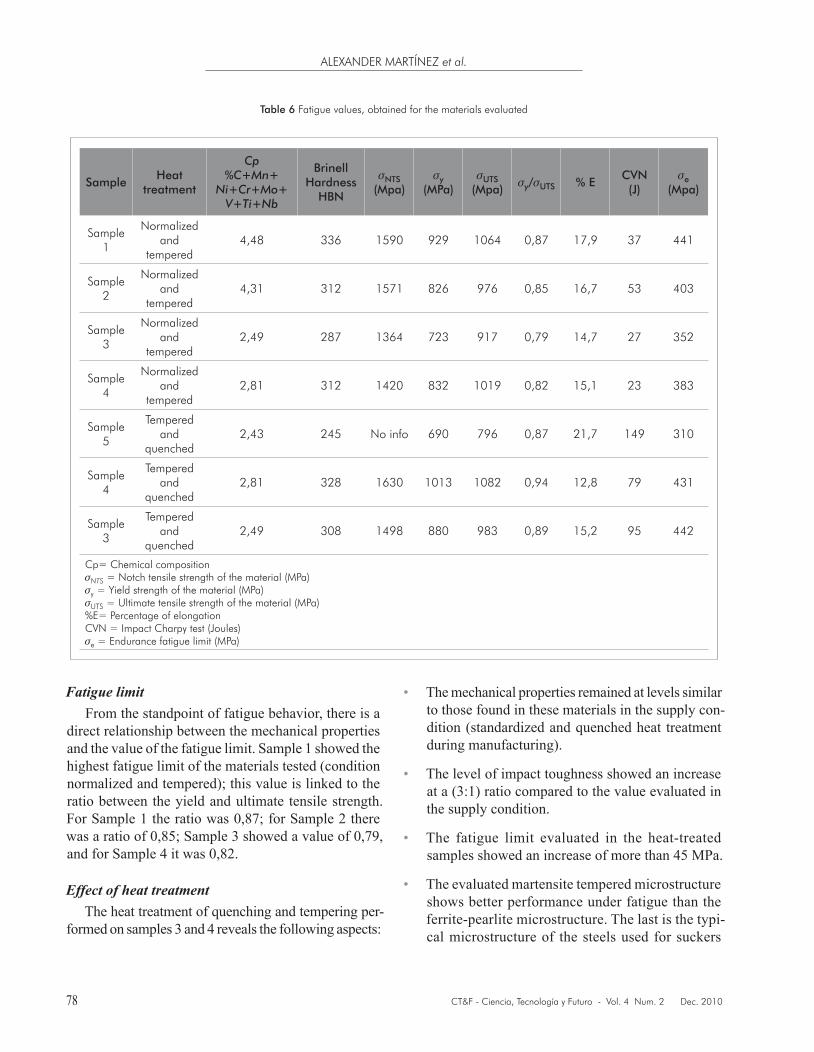
SampleHeat
treatment
Cp %C+Mn+
Ni+Cr+Mo+V+Ti+Nb
Brinell Hardness
HBN
NTS(Mpa)
y(MPa)
UTS(Mpa)
y/UTS % ECVN(J)
e(Mpa)
Sample 1
Normalized and
tempered4,48 336 1590 929 1064 0,87 17,9 37 441
Sample 2
Normalized and
tempered4,31 312 1571 826 976 0,85 16,7 53 403
Sample 3
Normalized and
tempered2,49 287 1364 723 917 0,79 14,7 27 352
Sample 4
Normalized and
tempered2,81 312 1420 832 1019 0,82 15,1 23 383
Sample 5
Tempered and
quenched2,43 245 No info 690 796 0,87 21,7 149 310
Sample 4
Tempered and
quenched2,81 328 1630 1013 1082 0,94 12,8 79 431
Sample 3
Tempered and
quenched2,49 308 1498 880 983 0,89 15,2 95 442
Cp= Chemical compositionNTS = Notch tensile strength of the material (MPa) y = Yield strength of the material (MPa)UTS = Ultimate tensile strength of the material (MPa)%E= Percentage of elongationCVN = Impact Charpy test (Joules) e = Endurance fatigue limit (MPa)
Table 6 Fatigue values, obtained for the materials evaluated
Fatigue limitFrom the standpoint of fatigue behavior, there is a
direct relationship between the mechanical properties and the value of the fatigue limit. Sample 1 showed the highest fatigue limit of the materials tested (condition normalized and tempered); this value is linked to the ratio between the yield and ultimate tensile strength. For Sample 1 the ratio was 0,87; for Sample 2 there was a ratio of 0,85; Sample 3 showed a value of 0,79, and for Sample 4 it was 0,82.
Effect of heat treatmentThe heat treatment of quenching and tempering per-
formed on samples 3 and 4 reveals the following aspects:
• The mechanical properties remained at levels similar to those found in these materials in the supply con-dition (standardized and quenched heat treatment during manufacturing).
• The level of impact toughness showed an increase at a (3:1) ratio compared to the value evaluated in the supply condition.
• The fatigue limit evaluated in the heat-treated samples showed an increase of more than 45 MPa.
• The evaluated martensite tempered microstructure shows better performance under fatigue than the ferrite-pearlite microstructure. The last is the typi-cal microstructure of the steels used for suckers
79
DEVELOPMENT OF A CORRELATION TO ESTIMATE THE FATIGUE STRENGTH FOR STEELS BASED ON LOW-COST TESTS
CT&F - Ciencia, Tecnología y Futuro - Vol. 4 Num. 2 Dec. 2010
rods provided in normalized and tempered supply condition.
• This indicates that an additional parameter had a positive effect on this outcome, and it was impact toughness level.
Formulation of the correlation modelBased on carrying out inexpensive and rapid tests
such as; the Charpy impact toughness, the tensile tests, Brinell hardness, and the chemical composition of the material; a correlation to predict the fatigue endur-ance limit was developed. Using Matlab mathemati-cal software, correlations with three variables were generated, using linear functions for data adjustments. The results in Table 6 were used as the input data for model generation.
Here, see Equations 1, 2 and 3 below as the correla-tions found, which show a difference of ± 2% compared to the value obtained in the long-term fatigue tests. From these equations it can be seen that positive effects were found in the value of impact toughness, hardness of the material, and in the sum of the percentage of al-loying elements (C+Mn+Ni+Cr+Mo+V+Nb) in steel, which tend to increase the mechanical properties and fatigue performance, favoring, in addition, an increase in the value of impact toughness.
Dependent correlation of toughness, hardness, and tensile strength
The following expression relates the mechanical variables of toughness, hardness and strength on the fatigue limit, and combines the toughness field that tends to oppose the resistance to the spread of fatigue cracking.
UTSHBNCVNe σσ 41,059,217,0 −
(1)
Dependent correlation of toughness, chemical com-position and tensile strength
The following expression relates the mechanical variables of toughness, chemical composition and ultimate tensile strength.
UTSCpCVNe σσ 37,049,713,0 (2)
Dependent correlation of the toughness, relationship of strength and hardness
The following expression relates the mechanical variables of tenacity, strength ratio and hardness.
HBNUTS
yCVNe 27,303,79135,1 −σ
σσ
(3)
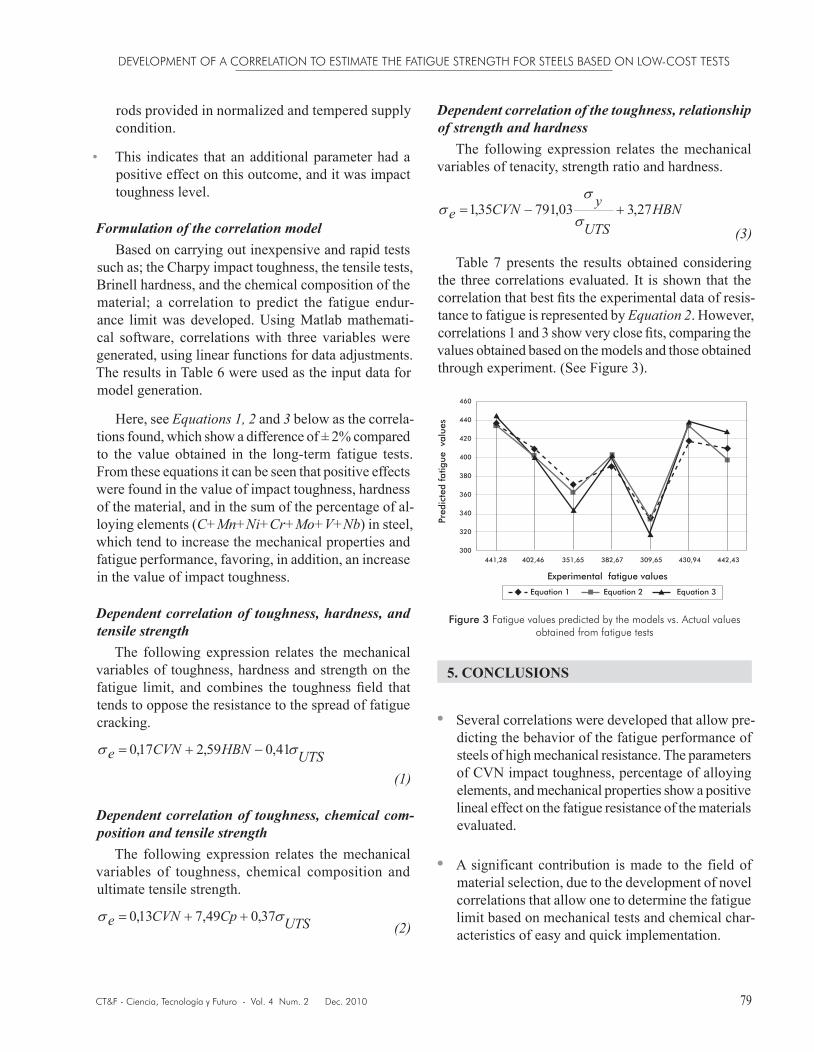
Table 7 presents the results obtained considering the three correlations evaluated. It is shown that the correlation that best fits the experimental data of resis-tance to fatigue is represented by Equation 2. However, correlations 1 and 3 show very close fits, comparing the values obtained based on the models and those obtained through experiment. (See Figure 3).
Figure 3 Fatigue values predicted by the models vs. Actual values obtained from fatigue tests
460
440
420
400
380
360
340
320
300441,28 402,46 351,65 382,67 309,65 430,94 442,43
Experimental fatigue values
Pred
icte
d fa
tigue
va
lues
Equation 1 Equation 2 Equation 3
5. CONCLUSIONS
• Several correlations were developed that allow pre-dicting the behavior of the fatigue performance of steels of high mechanical resistance. The parameters of CVN impact toughness, percentage of alloying elements, and mechanical properties show a positive lineal effect on the fatigue resistance of the materials evaluated.
• A significant contribution is made to the field of material selection, due to the development of novel correlations that allow one to determine the fatigue limit based on mechanical tests and chemical char-acteristics of easy and quick implementation.
ALEXANDER MARTÍNEZ et al.
80 CT&F - Ciencia, Tecnología y Futuro - Vol. 4 Num. 2 Dec. 2010
ACKNOWLEDGMENTS
The authors thanks Ecopetrol S.A. (Colombian Pe-troleum Company) for funding and the authorization to submit the results of this project. In particular, we appreciate the support of José-Martín Lizcano, Carlos-Javier Mateus and Alexander Pérez-Quiroga of the laboratory of Materials Engineering of the Instituto Colombiano del Petróleo (ICP).
REFERENCES
ASTM A 370, Standard Test Methods and Definitions for Mechanical Testing of Steel Products, Anual Book of Standard, ASTM International, www.astm.org., West Conshohocken, PA, 2010.
ASTM E 3-01. Standard Guide for Preparation of Metal-lographic Specimens., Anual Book of Standard, ASTM In-ternational, www.astm.org., West Conshohocken, PA, 2007.
ASTM E45-05. Standard Test Methods for Determining the Inclusion Content of Steel. ASTM International, www.astm.org. Anual Book of Standard, ASTM International, www.astm.org., West Conshohocken, PA, 2005.
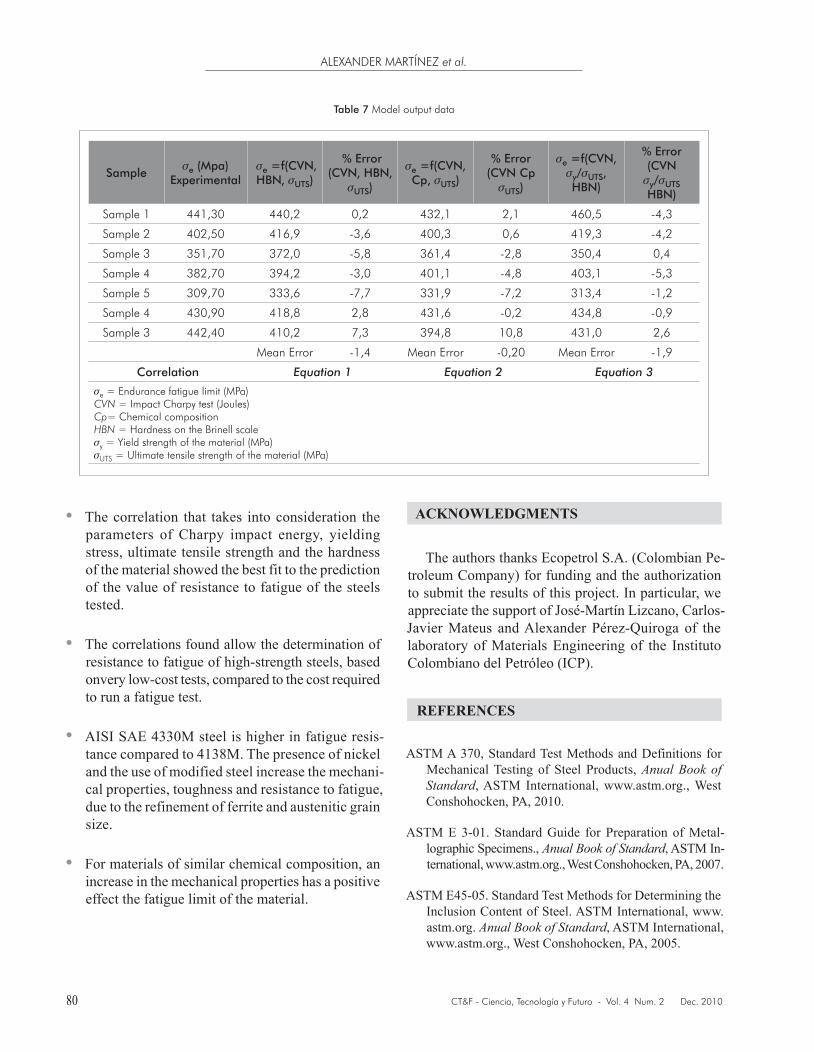
Table 7 Model output data
Samplee (Mpa)
Experimental e =f(CVN, HBN, UTS)
% Error (CVN, HBN, UTS)
e =f(CVN, Cp, UTS)
% Error (CVN Cp UTS)
e =f(CVN, y/UTS, HBN)
% Error (CVN y/UTS HBN)
Sample 1 441,30 440,2 0,2 432,1 2,1 460,5 -4,3
Sample 2 402,50 416,9 -3,6 400,3 0,6 419,3 -4,2
Sample 3 351,70 372,0 -5,8 361,4 -2,8 350,4 0,4
Sample 4 382,70 394,2 -3,0 401,1 -4,8 403,1 -5,3
Sample 5 309,70 333,6 -7,7 331,9 -7,2 313,4 -1,2
Sample 4 430,90 418,8 2,8 431,6 -0,2 434,8 -0,9
Sample 3 442,40 410,2 7,3 394,8 10,8 431,0 2,6
Mean Error -1,4 Mean Error -0,20 Mean Error -1,9
Correlation Equation 1 Equation 2 Equation 3
e = Endurance fatigue limit (MPa)CVN = Impact Charpy test (Joules)Cp= Chemical compositionHBN = Hardness on the Brinell scaley = Yield strength of the material (MPa)UTS = Ultimate tensile strength of the material (MPa)
• The correlation that takes into consideration the parameters of Charpy impact energy, yielding stress, ultimate tensile strength and the hardness of the material showed the best fit to the prediction of the value of resistance to fatigue of the steels tested.
• The correlations found allow the determination of resistance to fatigue of high-strength steels, based onvery low-cost tests, compared to the cost required to run a fatigue test.
• AISI SAE 4330M steel is higher in fatigue resis-tance compared to 4138M. The presence of nickel and the use of modified steel increase the mechani-cal properties, toughness and resistance to fatigue, due to the refinement of ferrite and austenitic grain size.
• For materials of similar chemical composition, an increase in the mechanical properties has a positive effect the fatigue limit of the material.

81
DEVELOPMENT OF A CORRELATION TO ESTIMATE THE FATIGUE STRENGTH FOR STEELS BASED ON LOW-COST TESTS
CT&F - Ciencia, Tecnología y Futuro - Vol. 4 Num. 2 Dec. 2010
ASTM E112-96. Standard Test Methods for Determining Average Grain Size, Anual Book of Standard, ASTM Inter-national, www.astm.org., West Conshohocken, PA, 2004.
ASTM E415-08. Standard Test Method for Atomic Emission Vacuum Spectrometric Analysis of Carbon and Low-Alloy Steel, Anual Book of Standard, ASTM International, www.astm.org., West Conshohocken, PA, 2008.
ASTM E466-07. Standard Practice for Conducting Force Controlled Constant Amplitude Axial Fatigue Tests of Metallic Materials, Anual Book of Standard, ASTM Inter-national, www.astm.org., West Conshohocken, PA, 2007.
ASTM E468-04. Standard Practice for Presentation of Constant Amplitude Fatigue Test Results for Metallic Materials, Anual Book of Standard, ASTM International, www.astm.org., West Conshohocken, PA, 2004.
ASTM E739-91. Standard Practice for Statistical Analysis of Linear or Linearized Stress-Life (S-N) and Strain-Life (ε-N) Fatigue Data, Anual Book of Standard, STM Inter-national, www.astm.org., West Conshohocken, PA, 2004.
Atkinson, H., & Anderson, C. (2003). Estimation of the Maximum Inclusion in Clean Steels and the Relation-ship with Mechanical Properties. Dept. of Mechanical Engineering, University of Sheffield, Sheffield, South Yorkshire, England.
Di Schino & Kenny, J. M. (2003). Grain size dependence of the fatigue behavior of a ultrafine – grained AISI 304 stainless steel, Materials Letters, 57: 3182-3185.
Dowling, N. E. J. (1998). Integral Estimations for Cracks in Infinite Bodies. Eng. Fracture Mechanic, 1: 1-8.
Juvonen, P. (2004). Effects of non-metallic inclusions on fatigue properties of Calcium Treated Steels, Dissertation for the degree of Doctor of Science in Technology to be presented with due permission for public examination and debate in Micronova (Large seminar room), Helsinki Uni-versity of Technology, Espoo, Finland,10th of December.
Lampman, S., Davidson, G., & Reidenbach, F. (1996). Fa-tigue and Fracture, ASM Handbook, 19: 96-109.
Smith, S., Newman, J., & Piascik, R. (2003). Simulation of Fatigue Crack Initiation at Corrosion Pits With EDM Notches, NASA, March 2003.
Subramanya, V., Padmanabhan, K., & Jaeger, G. (2000). On the fatigue crack growth behavior of two ferrite–pearlite microalloyed steels, Materials Letters, 46: 185-188.
Takuhiro, M. (2007). Method for the evaluation of mode I fatigue crack growth rate of prestrained materials, De-partment of Mechanical Engineering Science, Kyushu University. Inter. J. of Fatigue, 29 (9-11): 1737-1743.
Vormwald, M., & Seeger, T. (1987). Crack Initiation Life Predictions Based on Elastic-Plastic Fracture Mechan-ics of Short Cracks, 562-568. FRG, Munich, 7-11 Sept.
Yang, Z., & Zhang, J. M. (2004).The fatigue behaviors of zero inclusion and commercial 42CrMo steels in the superlong fatigue life regime, Acta Materialia, 52: 5235-5241.