Development of a Bush Information System (BIS) for mapping ...
51
Development of a Bush Information System (BIS) for mapping and quantification of bush encroachment and woody biomass potential in Namibia Final Report (FR) (Short Version) Project n° 4782926 Date: 09/08/2021 prepared by: E F T A S Fernerkundung Technologietransfer GmbH commissioned by: Bush Control and Biomass Utilisation Project (BCBU)
Transcript of Development of a Bush Information System (BIS) for mapping ...

Development of a Bush Information System (BIS) for mapping and quantification of bush encroachment and woody biomass potential in Namibia
Final Report (FR) (Short Version)
Project n° 4782926
Date: 09/08/2021
prepared by:
E F T A S Fernerkundung Technologietransfer GmbH
commissioned by:
Bush Control and Biomass Utilisation Project (BCBU)

Short Report BIS Namibia EFTAS Fernerkundung Technologietransfer GmbH 2 / 51
We remember our dear colleague Dave Joubert and his
exceptional enthusiasm, openness, and friendliness.
Legal notice
The contents of this publication were created by EFTAS and partners under GIZ service contract No.81227229. They do not necessarily reflect the official opinions of the GIZ. Neither the GIZ nor any person or company acting on behalf of the GIZ is responsible for the use that may be made of the information contained in this report.
Any use has to be properly cited using the following reference citation:
O. Buck, L. Naidoo, L. Kleinewillinghöfer, M. Kobs, R. Mathieu, C. van der Waal, A. Rothauge, H. Strydom, C. Timm, D. Joubert (t), C. Haub, 2021. Development of a Bush Information System (BIS) for mapping and quantification of bush encroachment and woody biomass potential in Namibia. Final Report - short version. GIZ project report VN-81227229. [online] Windhoek: GIZ, p.51. Available at: https://bis.nsa.org.na/documents.

Short Report BIS Namibia EFTAS Fernerkundung Technologietransfer GmbH 3 / 51
Document Control Information
Settings Value
Document Title: Final Report (FR)( Short version)
Project Title: Development of a Bush Information System (BIS) for mapping and quantification of bush encroachment and woody biomass potential in Namibia
Document Author: O. Buck, C. Haub, M. Kobs, L. Kleinewillinghöfer, C. Timm, R. Mathieu, L. Naidoo, H. Strydom, C. van der Waal, A. Rothauge, D. Joubert (t)
Project Owner: Georg Altrogge
Project Manager: Carsten Haub
Doc. Version: 2.0
Sensitivity: Basic
Distribution: GIZ, Namibia University of Science and Technology (NUST), and Consortia: EFTAS Fernerkundung Technologietransfer GmbH (Germany), together with Hansa Luftbild AG (Germany), the Council for Science and Industrial Research (South Africa), Namibia Ecosystem Services (Namibia), Strydom & Associates Land surveyors (Namibia), Agri Ecological Services Namibia and AgriConsult Namibia
Document history:
Revision Date Created by Short Description of Changes
Draft version 1.0
19/11/2019 EFTAS, HL, CSIR, NES, AC, S&A Draft First version
1.1 19/12/2019 EFTAS, HL, CSIR, NES, AC, S&A Final release. Revised upon comments of 11/12/2019
1.2 24/01/2020 EFTAS, HL, CSIR, NES, AC, S&A Revised upon comments of 16/01/2020
1.3 27/02/2020 EFTAS, HL, CSIR, NES, AC, S&A Revised upon comments of 13/02/2020
2.0 09/08/2021 EFTAS, HL, CSIR, NES, AC, S&A Revised short version for publication

Short Report BIS Namibia EFTAS Fernerkundung Technologietransfer GmbH 4 / 51
Table of content Executive summary ..........................................................................................................................................7
1. Introduction, background and concept ....................................................................................................8
1.1 Aim of the project .............................................................................................................................8 1.2 Our understanding ...........................................................................................................................8 1.3 Stakeholder requirements ................................................................................................................9 2. Report on project milestones ................................................................................................................ 10
2.1 Achievements ................................................................................................................................ 10 3. Realisation ............................................................................................................................................. 11
3.1 BIS portfolio ................................................................................................................................... 12 3.1.1 BIS Products ........................................................................................................................... 12 3.1.2 BIS Information Packages ...................................................................................................... 16 3.1.3 BIS Encroacher species modelling ......................................................................................... 19
3.2 Project Components ...................................................................................................................... 21 3.2.1 Earth Observation mapping and ground truthing ................................................................. 21 3.2.2 Web GIS ................................................................................................................................. 22 3.2.3 Capacity Building ................................................................................................................... 24
4. Review and Assessment ........................................................................................................................ 24
4.1 BIS EO data handling ..................................................................................................................... 24 4.1.1 Thematic level of detail ......................................................................................................... 25 4.1.2 Spatial precision .................................................................................................................... 26
4.2 Assessment on bush encroachment.............................................................................................. 26 4.2.1 Bush or tree equivalent assessment ..................................................................................... 27 4.2.2 ETTE assessment .................................................................................................................... 28
4.3 Review to previous Bush Encroachment estimations ................................................................... 31 4.3.1 Latest estimation on bush encroachment ............................................................................. 31 4.3.2 Discussion .............................................................................................................................. 32
5. Conclusion and Outlook ........................................................................................................................ 33
5.1 Recommendations ......................................................................................................................... 33 5.2 Outlook .......................................................................................................................................... 38 References ..................................................................................................................................................... 42
ANNEX ........................................................................................................................................................... 43
Annex I – Stakeholder assessment ................................................................................................................ 43 Annex II – Use case assessment .................................................................................................................... 44 Annex III – List of BIS field survey parameter ................................................................................................ 46
Annex III.I Sample plot survey application ............................................................................................ 46 Annex III.II BECVOL parameters application .......................................................................................... 50
List of tables Table 1: Spatial approximation of ETTE ........................................................................................................ 28 Table 2: Most important field survey parameters for BIS EO modelling ...................................................... 36

Short Report BIS Namibia EFTAS Fernerkundung Technologietransfer GmbH 5 / 51
List of figures Figure 1: Contemporary map on potential main encroacher species distributions over Namibia. .................8 Figure 2: BIS components .................................................................................................................................9 Figure 3: Interactive GIS viewer of the BIS WebGIS ...................................................................................... 10 Figure 4: Impression of the BIS stakeholder workshop ................................................................................. 11 Figure 5: Overall BIS concept ......................................................................................................................... 11 Figure 6: BIS Canopy Cover map 2018........................................................................................................... 12 Figure 7: BIS Above Ground Biomass map 2018 ........................................................................................... 13 Figure 8: BIS Height of Trees map 2018 ........................................................................................................ 13 Figure 9: BIS Canopy Cover map 2015........................................................................................................... 14 Figure 10: BIS Canopy Cover Change map 2018 versus 2015 ....................................................................... 14 Figure 11: BIS ETTE map 2018 ....................................................................................................................... 15 Figure 12: BIS Potential Main Encroacher Species composition map ........................................................... 15 Figure 13: BIS Probability Maps per Main Encroacher species ..................................................................... 15 Figure 14: BIS Information Package: Support for clearance application ....................................................... 16 Figure 15: BIS Information Package: Planning and Logistics for farmers ...................................................... 17 Figure 16: BIS Information Package: Efficiency assessment of harvesting /clearing activities ..................... 18 Figure 17: BIS Information Package: Benchmark for harvester .................................................................... 19 Figure 18: BIS Encroacher species modelling ................................................................................................ 20 Figure 19: BIS Ground truthing. Collected samples (left) and stratified sampling (right) ............................. 21 Figure 20: Field work assessment versus drone data and visual digitization of canopies onscreen. ........... 22 Figure 21: BIS software components and infrastructure. ............................................................................. 23 Figure 22: QGIS USAGE OF BIS WMS. ............................................................................................................ 23 Figure 23: Visualization of 10m pixel size (black grid) versus the 1 ha minimum mapping unit (white box) over a digital ortho photo (3cm pixel size). ................................................................................................... 24 Figure 24: Comparison of Plot Canopy cover from Field work (black numbers) and CAPI based on drone imagery (pink layers) in the left image; and drone extracted canopy cover (green numbers) in the right image. ............................................................................................................................................................ 25 Figure 25: Comparison of BIS Canopy Cover product at 1 ha pixel size (right image) versus the field work (white 50*50 m plots) and drone image (3-5 cm pixel size – left image). .................................................... 26 Figure 26: Calculated bush equcivalents of field data allocation against the critical bush densities on basis of long term average rainfalls (black polygons) and soil conditions. ............................................................ 27 Figure 27: ETTE assessment of critical bush densities. Modelled ETTE values 2018 (left: Figure 27a) and quantified ETTE thresholds map on basis to long term average rainfalls (black polygons) (right: Figure 27b). ....................................................................................................................................................................... 28 Figure 28: ETTE assessment on bush encroachment. Comparison of the 2018 ETTE map versus the theoretical BE treshold. ................................................................................................................................. 29 Figure 29: ETTE assessment on bush encroachment. Comparison of the 2018 ETTE histogramm versus the theoretical BE treshold. ................................................................................................................................. 30 Figure 30: Spatial display of remarkable histogramm peaks in the ETTE assessment map. (Left – Figure 30a: analysis of the two high value peaks of the histogramm (brown 80,000-90,000 and dark brown >90,000); right - Figure 30b: analysis of possible bush encroachment within the range of the mapping uncertainty (pink) and possible forests (blue). ................................................................................................................. 30 Figure 31: Total extent of Bush Encroachment according to SAIEA (2016). ................................................ 31 Figure 32: BIS working scale (left AGB product at about 1:150,000 scale close to Okahandja compared to full national map at about 1:9,000,000). ............................................................................................................. 39 Figure 33: Available spatial information on bush encroachment in Namibia before (left) and now with the BIS (right). ...................................................................................................................................................... 40

Short Report BIS Namibia EFTAS Fernerkundung Technologietransfer GmbH 6 / 51
List of abbreviations AD Applicable document with relevance for this report (see page 3)
AOI Areas of Interest
BCBU Bush Control and Biomass Utilisation
BE Bush Encroachment
BMZ German Federal Ministry for Economic Cooperation and Development
BIS Bush Information System
CSIR Council for Science and Industrial Research (South Africa)
DoF Directorate of Forestry
DOP Digital Ortho Photo
GPS Global Positioning System
EO Satellite earth observation
ETTE Evapo-Transpiration Tree Equivalents – which is the leaf volume of a 1.5m single stemmed woody plant
GIS Geographic Information System
GIZ Deutsche Gesellschaft für Internationale Zusammenarbeit GmbH
HL Hansa Luftbild AG
LIDAR Light detection and ranging
MAWF Ministry of Agriculture, Water and Forestry of Namibia
MaxENT Maximum Entropy model
MEFT Ministry of Environment, Forestry and Tourism of Namibia
MTG Meteosat Third Generation
NSA Namibia Statistics Agency
NSDI Namibian Spatial Data Infrastructure Standards
NUST Namibia University of Science and Technology
RF Random Forest
RMSE Root mean square error
S1 The COPERNICUS high resolution radar satellite Sentinel-1
S2 The COPERNICUS high resolution optical satellite Sentinel-2 (S2)
TE Tree equivalent
VHR Very high resolution satellite images

Short Report BIS Namibia EFTAS Fernerkundung Technologietransfer GmbH 7 / 51
Executive summary
Bush encroachment in Namibia reduces agricultural productivity and has negative effects on ecosystem services. At the same time, bush biomass can offer a number of economic opportunities. The new Bush Information System (BIS) initiative, which has been launched in October 2018 by the joint Bush Control and Biomass Utilisation project (BCBU) implemented by the Deutsche Gesellschaft fur Internationale Zusammenarbeit GmbH (GIZ), commissioned by the German Federal Ministry for Economic Cooperation and Development (BMZ) in cooperation with the Ministry of Agriculture, Water and Forestry of Namibia (MAWF)1, provides a range of information and explores on bush encroachment and woody biomass potential and threat across Namibia. The system was developed by a consortium of specialised organisations, led by EFTAS Fernerkundung Technologietransfer GmbH (Germany), together with Hansa Luftbild AG (Germany), the Council for Science and Industrial Research (South Africa), Namibia Ecosystem Services (Namibia), Strydom & Associates Land surveyors (Namibia), Agri Ecological Services Namibia and AgriConsult Namibia. The hosting organisation is the Namibia Statistics Agency (NSA).
The key aim of this project was to setup an easy to use WebGIS on the current status and recent changes of the woody resource in Namibia, which is emphasized to be used by non-GIS experts. This WebGIS is the central node that combines (a) systematic national Satellite Earth Observation map products with (b) relevant existing geo information of Namibia, in order to provide end user applications for monitoring and decision support purposes by means of dedicated information sets. This is ensured through systematic training and capacity building by means of interactive help and support functionalities as well as training packages, consisting of tutorials, manuals and exercises. The system has been provided in November 2019 to the Namibia Statistics Agency and finally transferred to their server under https://bis.nsa.org.na. Apart from the generation of some EO products (see chapter 3.1) all envisaged goals have been reached and all foreseen milestones have been delivered. This work constitutes an essential foundation to establish a long-term monitoring system and capability for bush encroachment studies.
The aim of this document is to summarize the project realisation, to reflect on the outcomes against the initial project aims and to provide an outlook on future evolutions. Chapter 1 provides the projects background, its objectives and the underlying concept. Chapter 2 reports on the projects deliverables with respect to the Terms of Reference. Chapter 3 outlines technical aspects of the project, while Chapter 4 reviews and assesses the achievements. Chapter 5 gives a conclusion, recommendation and an outlook.
In conclusion, the BIS project has been completed successfully and its achievements are contributing cutting edge solutions to the assessment of bush encroachment with a systematic EO upscaling approach for the entire Namibian territory. Moreover, it is a unique approach for bush monitoring by means of geo information technology with eventual relevance across the southern African region. Beyond its three components, the project specifically contributed with the introduction and consolidation of a comprehensive remote sensing workflow, including a concept for stratified ground truthing and consultancy on the adequate use and interpretation of the EO results, which was new in the recent bush encroachment discourse.
This project and all the cooperation with the involved experts is unique in the region and has the potential for great impact, with the most important potential to be replicated in the region.
1Current Ministry of Environment, Forestry and Tourism (MEFT), since March 2020

Short Report BIS Namibia EFTAS Fernerkundung Technologietransfer GmbH 8 / 51
1. Introduction, background and concept
Bush encroachment in Namibia reduces agricultural productivity and has negative effects on ecosystem services. At the same time, bush biomass can offer a number of economic opportunities. The new Bush Information System (BIS), which has been launched in October 2018 by the joint Bush Control and Biomass Utilisation (BCBU) project implemented by the Deutsche Gesellschaft fur Internationale Zusammenarbeit GmbH (GIZ), commissioned by the German Federal Ministry for Economic Cooperation and Development (BMZ) in cooperation with the Ministry of Agriculture, Water and Forestry of Namibia (MAWF)2, provides a range of information and explores on bush encroachment and woody biomass potential and threat across Namibia. The system was developed by a consortium of specialized organisations, led by EFTAS Fernerkundung Technologietransfer GmbH (Germany), together with Hansa Luftbild AG (Germany), the Council for Science and Industrial Research (South Africa), Namibia Ecosystem Services (Namibia), Strydom & Associates Land surveyors (Namibia), Agri Ecological Services Namibia and AgriConsult Namibia. The hosting organisation is the Namibia Statistics Agency (NSA).
1.1 Aim of the project
The aim of this “Bush Information System” (BIS) project was to provide a WebGIS based decision support tool that allows to assess and quantify bush encroachment (BE) and woody biomass for the stakeholders in Namibia.
1.2 Our understanding
To establish a reliable “Bush Information System” was understood as an important and strong step to meet the need to monitor and manage, the bush biomass resource and the bush encroachment in Namibia. In view of the dependency of the Namibian socio-economy on rangeland versus the limited extent of the given Namibian land resources / savannas, bush encroachment (BE) is understood as a major impact on Namibian farms, their rangeland productivity and in turn their carrying capacity for grazing livestock. It is also understood that the woody biomass of harvested bushes acts as a source for energy and industrial charcoal production. However, it is yet uncertain how far Namibia is affected by bush encroachment in terms of spatial extent; with assessments ranging from 26 to 45 million hectares. Nor is there so far, a scientific consent about the categorization of specific Bush Density levels as Bush Encroachment, under which conditions species are to be understood as encroaching, or how to combat and control a reasonable woody bush – grassy rangeland ratio. Much research and large efforts are ongoing to better understand the ecology of the savannas’ dynamics, the agro-ecological context between savanna / forest / grassland dynamics. Current investigations are based on the effects of rainfall distribution, disturbances, human interactions and others. Applicable concepts for the integration of satellite earth observation are rare, and so far only limited mapping initiatives have made systematic use of GIS concepts at a country wide level, and no systematic remote sensing-based country-wide BE survey has been done.
2Current Ministry of Environment, Forestry and Tourism (MEFT), since March 2020
Figure 1: Contemporary map on potential main encroacher species distributions over Namibia.

Short Report BIS Namibia EFTAS Fernerkundung Technologietransfer GmbH 9 / 51
The aim was to build on agro-ecological and botanical expertise and link it with up to date Earth Observation (EO) science and technology at different scales. The potential of the now available large free EO datasets through the Sentinel satellite systems and the constant improvement of image analysis/processing algorithms was used as best as possible within the frame of the limited budget. The implementation had to be based on existing open source GIS platforms, open programming libraries, smart mobile technologies, with a critical view on technical limitations of these solutions.
The requested development, setup and implementation of the Bush Information System (BIS) project consisted of three key components (Figure 2): (I) the EO mapping component including ground truthing, (II) the WebGIS component and (III) the training and capacity component. Those three components are aligned to the structure of the tender specifications and will be described in chapter 3.
The core requirement of the project was to create EO-processing based BIS products, covering all Namibian land area in a consistent and harmonized way. To achieve this, satellite data suitable to cover the entire country within adequate observation windows had to be used as input data. The Copernicus Sentinel 1 radar data and Sentinel 2 optical data were chosen as adequate sensor data to also ensure the possibility of future updates of these national BIS products. A good usability and robustness of the WebGIS platform was required to provide self-explaining BIS Information Packages or individual BIS Map Compositions and BIS Reports, so that “Non-GIS-expert end users” have access to suitable decision support information.
1.3 Stakeholder requirements
Based on an extended user requirement assessment, the BCBU project drafted together with the advisory
group of key stakeholders a list of expected BIS products prior to the project start. In a participative effort
this has been carefully considered and brought into the technical GeoIT related context of the BIS and
jointly discussed.
• The following aspects had been identified. Technical limitations to map bush characteristics and
encroachment parameters at national scale
o Availability of applicable optical or radar EO data coverage for 2014
o Feasibility of mapping encroaching vs. non-encroaching tree species at national scale
o Extraction of tree height (between 1-7m) using active and passive satellite sensors vs.
technical limitations to derive vegetation height with nationally available data sets for
2014 & 2018
o Measurement of indirect parameters such as Bush Equivalents (depending per definition
on tree height <> 1.5m) and DBH (not directly measurable from birds eye view)
o Requested continuous parameters / products vs. requested minimum mapping unit of 1
ha
• Application of the targeted overall accuracy of >80% to continuous information derived per ha,
requires
Figure 2: BIS components

Short Report BIS Namibia EFTAS Fernerkundung Technologietransfer GmbH 10 / 51
o Adequate & independent validation data for the reference years with high quality and
adequate national distribution, where in general the more detailed the information
content or classes are, the more ground truthing is needed
o A thematic accuracy reporting in compliance with the National Spatial Data Infrastructure
regulations, (specifically the Government Gazette No. 6145 (5.2)) as either classification
error matrix for categorical classifications or via RMSE assessment for quantitative data.
All these aspects were critically reviewed during the project inception phase in close consultation with all advisory group members. The underlying user requirements were systematically reviewed for their specific information demand and decision purposes, as well as to the currently available data and methodologies to meet these demands. The summary of the assessments, which took place during several meetings with all advisory group members shortly before the inception workshop, between the 12th and the 16th November 2018 in Windhoek, are described in Annex III below. These assessments served as the base for the definition of the BIS Use Cases (Annex IV) leading to the BIS Information Packages (chapter 3.1.2) accessible within the BIS WebGIS.
2. Report on project milestones
2.1 Achievements
With the symbolic handover of the BIS in form of the stakeholder workshop on 6th November 2019 to the NSA, MAWF3 and BCBU, the BIS system was opened to the public for in depth assessments and review. The WebGIS contains all published BIS products, manuals and instructions, including the meta data in line with the Namibia NSDI regulations.
Figure 3: Interactive GIS viewer of the BIS WebGIS
3 Since March 2020 MEFT

Short Report BIS Namibia EFTAS Fernerkundung Technologietransfer GmbH 11 / 51
Figure 4: Impression of the BIS stakeholder workshop
3. Realisation
The central component of the achieved Bush Information System is the WebGIS, through which the BIS EO mapping products can be accessed. In combination with existing geo data (relevant national GIS data layers), and the EO image processing mosaics, BIS reports and information packages can be created for end user applications. Those are dedicated reporting functions which allow end users and non-GIS experts to easily extract and create reports and Information Packages. With these reports monitoring and decision support becomes available for the user requested area of interest. The following sections briefly describe the BIS portfolio and the BIS project components EO mapping, WebGIS and capacity Building.
Figure 5: Overall BIS concept

Short Report BIS Namibia EFTAS Fernerkundung Technologietransfer GmbH 12 / 51
3.1 BIS portfolio
The BIS portfolio contains two types of information. The first outputs are the EO mapping products as, and the second major output are the reports and information packages that are related to BIS user requests / use cases (Annex IV).
3.1.1 BIS Products
The following figures show the different BIS products that have been created as national maps using satellite image data as primary model input from Sentinel 1 and Sentinel 2 for the reference years 2015 and 2018, as well as ancillary field and GIS data. The entire process to create the BIS EO products is described in the Methods Compendium (Buck et al., 2019b). Furthermore, are the validation results documented in the Products validation and quality assurance report (Buck et al., 2019a). Full details are provided with meta data documentation that are compliant and approved by the NSA with the Namibian standards Spatial Data Infrastructure as gazetted in No. 6143, No. 6144 and No. 615. This information is available within the BIS WebGIS for each product and via electronical cataloguing functions.
The BIS Canopy Cover map 2018 is one of the main products of the Bush Information System on Bush Encroachment in Namibia. It provides information on the average canopy cover in % of the dominating vegetation aggregated to one 1ha pixel resolution. The product is based on the fusion of Sentinel 1 and Sentinel 2 mosaics from 2018, and was processed by means of regressive Random Forest algorithms.
Figure 6: BIS Canopy Cover map 2018

Short Report BIS Namibia EFTAS Fernerkundung Technologietransfer GmbH 13 / 51
The BIS Above Ground Biomass map 2018 is one of the main products of the Bush Information System on Bush Encroachment in Namibia. It provides information on the average above ground biomass in tons of the dominating vegetation aggregated to one 1ha pixel resolution. The product is based on the fusion of Sentinel 1 and Sentinel 2 mosaics from 2018, and was processed by means of regressive Random Forest algorithms.
Figure 7: BIS Above Ground Biomass map 2018
The BIS Height of trees map 2018 is one of the main products of the Bush Information System on Bush Encroachment in Namibia. It provides information on the average height in m of the dominating vegetation aggregated to one 1ha pixel resolution. The product is based on the fusion of Sentinel 1 and Sentinel 2 mosaics from 2018, and was processed by means of regressive Random Forest algorithms.
Figure 8: BIS Height of Trees map 2018
Short Report BIS Namibia EFTAS Fernerkundung Technologietransfer GmbH 14 / 51
The BIS Canopy Cover map 2015 is one of the main products of the Bush Information System on Bush Encroachment in Namibia. It provides information on the average canopy cover in % of the dominating vegetation aggregated to one 1ha pixel resolution. The product is based on the fusion of Sentinel 1 and Sentinel 2 mosaics from 2015, and was processed by means of regressive Random Forest algorithms.
Figure 9: BIS Canopy Cover map 2015
The BIS Canopy Cover Change map 2018 versus 2015 is one of the main products of the Bush Information System on Bush Encroachment in Namibia. It provides information on the average canopy cover change in % of the dominating vegetation aggregated to one 1ha pixel resolution. The product is based on the comparison of the BIS_CC products of 2018 versus 2015, and was created by means a simple raster calculation.
Figure 10: BIS Canopy Cover Change map 2018 versus 2015

Short Report BIS Namibia EFTAS Fernerkundung Technologietransfer GmbH 15 / 51
The BIS ETTE map 2018 is one of the main products of the Bush Information System on Bush Encroachment in Namibia. It provides information on the average Bush Density measured in ETTE of the dominating vegetation aggregated to one 1ha pixel resolution. The product is based on the fusion of Sentinel 1 and Sentinel 2 mosaics from 2018, and was processed by means of regressive Random Forest algorithms.
Figure 11: BIS ETTE map 2018
The BIS Potential Main Encroacher Species Composition map is one of the main products of the Bush Information System on Bush Encroachment in Namibia. It provides consistent information on the potential spatial distribution of the main encroacher species compositions over Namibia (based on their soil, temperature, rainfall, landscape requirements etc.). The product is based on various national ecological GIS layers, and was processed by means multi-source GIS integration.
Figure 12: BIS Potential Main Encroacher Species composition map
Example for Acacia mellifera
The BIS Probability Maps per Main Encroacher Species are a complementation of the Potential Main Encroacher Species Composition map and are additional products within the Bush Information System on Bush Encroachment in Namibia. The maps contain probability information on the potential appearance per main encroacher species over Namibia. The product is based on various national ecological GIS layers (e.g. soil, temperature, rainfall...), and was processed by means of MaxENT modelling. The map values range from 0 (low) to 1 (high) potential of appearance. (see chapter 3.1.3).
Figure 13: BIS Probability Maps per Main Encroacher species
Short Report BIS Namibia EFTAS Fernerkundung Technologietransfer GmbH 16 / 51
3.1.2 BIS Information Packages
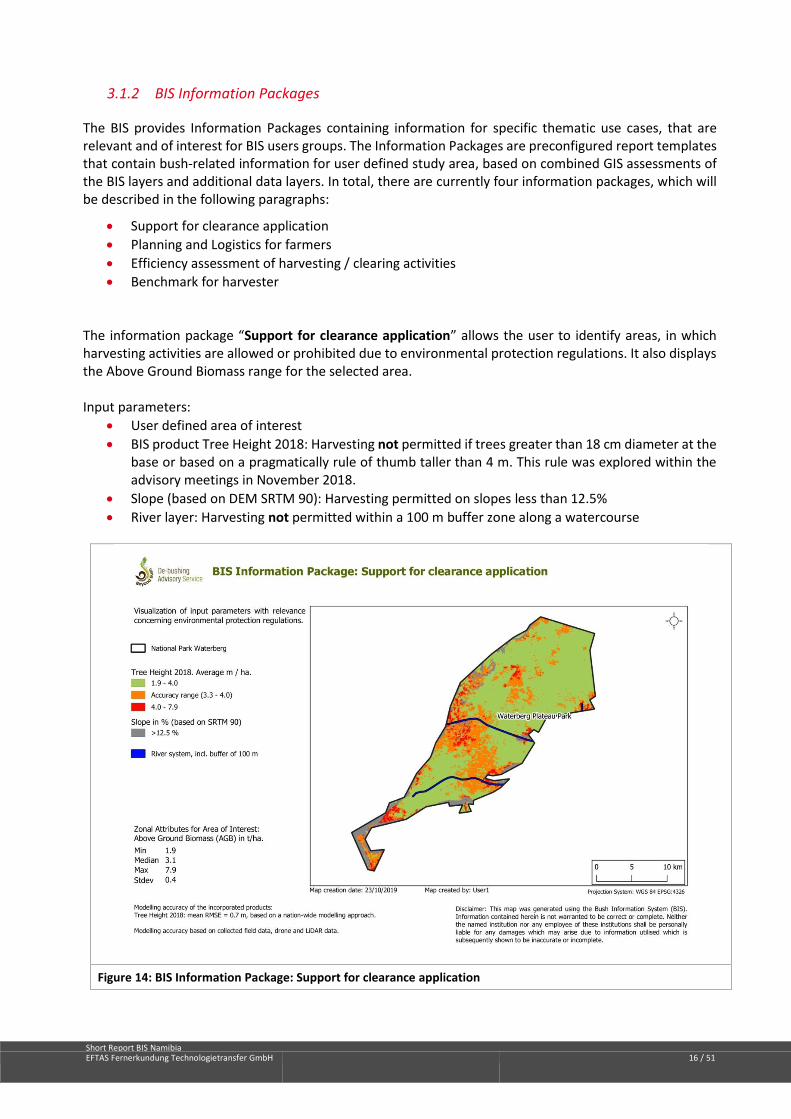
The BIS provides Information Packages containing information for specific thematic use cases, that are relevant and of interest for BIS users groups. The Information Packages are preconfigured report templates that contain bush-related information for user defined study area, based on combined GIS assessments of the BIS layers and additional data layers. In total, there are currently four information packages, which will be described in the following paragraphs:
• Support for clearance application
• Planning and Logistics for farmers
• Efficiency assessment of harvesting / clearing activities
• Benchmark for harvester The information package “Support for clearance application” allows the user to identify areas, in which harvesting activities are allowed or prohibited due to environmental protection regulations. It also displays the Above Ground Biomass range for the selected area.
Input parameters:
• User defined area of interest
• BIS product Tree Height 2018: Harvesting not permitted if trees greater than 18 cm diameter at the base or based on a pragmatically rule of thumb taller than 4 m. This rule was explored within the advisory meetings in November 2018.
• Slope (based on DEM SRTM 90): Harvesting permitted on slopes less than 12.5%
• River layer: Harvesting not permitted within a 100 m buffer zone along a watercourse
Figure 14: BIS Information Package: Support for clearance application

Short Report BIS Namibia EFTAS Fernerkundung Technologietransfer GmbH 17 / 51
The information package “Planning and Logistics for farmers” provides information on the quantity of Above Ground Biomass (AGB), harvest exclusion areas, due to environmental protection regulations as well as the existing road transport network.
Input parameters:
• User defined area of interest
• Quantification of harvestable biomass at site: Above Ground Biomass (t/ha)
• Harvesting exclusion areas based on environmental protection regulations: o BIS product Tree Height 2018: Harvesting not permitted if trees greater than 18 cm
diameter at the base or based on a pragmatically rule of thumb taller than 4 m. This rule was explored within the advisory meetings in November 2018.
o Slope (based on DEM SRTM 90): Harvesting permitted on slopes less than 12.5% o River layer: Harvesting permitted outside a 100 m buffer zone along a watercourse
• Classified road network layer: Trunk Roads / Main Roads / District Roads / Tracks from Digital Namibia by NSA
Figure 15: BIS Information Package: Planning and Logistics for farmers

Short Report BIS Namibia EFTAS Fernerkundung Technologietransfer GmbH 18 / 51
The Information package “Efficiency assessment of harvesting / clearing activities” enables the user to evaluate / monitor biomass changes within an AOI between the years 2015 and 2018.
Input parameters:
• User defined area of interest
• BIS product Canopy Cover Change 2015-2018: Change of canopy cover in %
Figure 16: BIS Information Package: Efficiency assessment of harvesting /clearing activities

Short Report BIS Namibia EFTAS Fernerkundung Technologietransfer GmbH 19 / 51
The information package “Benchmark for harvester” provides information on the quantity of the Above Ground Biomass (AGB) for an AOI, taking a predefined threshold (in this case 30 t/ha) into account.
Input parameters:
• User defined area of interest
• Quantification of harvestable biomass at site: Above Ground Biomass (t/ha)
• Harvesting exclusion areas based on environmental protection regulations: o BIS product Tree Height 2018: Harvesting not permitted if trees greater than 18 cm
diameter at the base or based on a pragmatically rule of thumb taller than 4 m. This rule was explored within the advisory meetings in November 2018.
o Slope (based on DEM SRTM 90): Harvesting permitted on slopes less than 12.5% o River layer: Harvesting permitted outside a 100 m buffer zone along a watercourse
Figure 17: BIS Information Package: Benchmark for harvester
3.1.3 BIS Encroacher species modelling
With the products Potential Main Encroacher Species composition map (Figure 12) and the Probability maps per Main Encroacher (Figure 13) the BIS provides a new type of spatial information on bush monitoring in Namibia. The Probability maps per Main Encroacher are models using the Maximum Entropy model (MaxENT). This determines the suitability for a species as a function of the environmental variables on basis of a set of environmental and/or climate layers that are organized in a set of grid cells over the entire landscape, together with a set of sample locations where the species has been observed. A high value of the function at a particular grid cell indicates that the grid cell is predicted to have suitable conditions for that species. The lower the value, the less favourable are the conditions and the likeliness of its appearance.

Short Report BIS Namibia EFTAS Fernerkundung Technologietransfer GmbH 20 / 51
The computed model is a probability distribution per encroacher species over the entire country. These models provide more details on the potential encroacher species distribution, than the synthesis of the Potential Main Encroacher Species composition map (Figure 12). This map provides only the information “if” or “if not” an encroacher species appears potentially in an area or not. It doesn´t allow to analyse how relevant the potential appearance and impact of the different encroacher species could be. It is based on the Bester and Lubbe maps (Figure 1), the Tree Atlas of Namibia (Curtis & Mannheimer, 2005) and various additional environmental information and an evolution of these established maps towards a more spatially detailed and seamless national dataset (refer to Buck et al., 2019b). Combining both products (Figure 18) with other BIS products allows advanced GIS investigations of the conditions of the woody cover versus the potential spatial appearance of the main encroacher species. For instance, these maps can be used to overlay other BIS EO products, such as the Above Ground Biomass or the ETTE map, in order to explore how far the different encroacher species may play a role for the identified characteristics of the woody cover.
Figure 18: BIS Encroacher species modelling

Short Report BIS Namibia EFTAS Fernerkundung Technologietransfer GmbH 21 / 51
3.2 Project Components
3.2.1 Earth Observation mapping and ground truthing
For the modelling process of the BIS remote sensing products, a Random Forest (RF) machine learning approach was utilised. This modelling process used the Sentinel 1 backscatter and Sentinel 2 reflectance bands as the primary input variables, while other ancillary variables (i.e. derived spectral vegetation indices) were also implemented. For any modelling process, a model calibration and validation dataset is essential. This was derived from collected ground data. The ground collected vegetation parameter (e.g. Canopy Cover or CC) from these ground data sources have been utilised as the independent variable or ground-truth variable in the RF.
Calibration/Validation of the BIS products were done by utilizing not only field survey data, but also drone data and airborne LiDAR datasets. The combination of these data sets has been systematically up scaled towards the Sentinel data resolutions, via the dedicated observation of defined plot sizes that were well representing the spatial resolution of the EO data. Such a dedicated field-drone-satellite upscaling approach is new within the bush control framework in Namibia. The complete cal/val dataset was randomly split into model training and validation datasets using a split of 35/65% for training and validation respectively and then bootstrapped 10 times.
The ground truth data was collected during a nation-wide field survey between 03rd and 18th May 2019. Out of a stratified sample of in total 120 selected sites, 43 sample sites were successfully accessed and observed (see Figure 19). The EO compatible field work consisted of several components, combining the collection of drone data (within a drone quadrant of 250x500m) with measuring a complex set of field work parameters by using mobile devices (Figure 20). The woody structure of pre-selected 50x50m survey plots within the drone quadrant was described by applying several measurements, incl. tree counts, species identification and composition as well as individual tree measurements (BECVOL parameters in reference to Smit, 2014). The detailed ground truth mapping approach was trained on the field teams and documented in a methods compendium (Buck et al. 2019a) and the training package (Annex II).
The collected drone data was processed to a canopy height model or CHM (i.e. Digital Surface Model minus the Bare Earth Model) and served as additional ground truth data for several of the EO products (e.g. AGB, CC, HT). It also enabled the implementation of additional desktop measurements (CAPI approach) in order
Figure 19: BIS Ground truthing. Collected samples (left) and stratified sampling (right)

Short Report BIS Namibia EFTAS Fernerkundung Technologietransfer GmbH 22 / 51
to derive exact survey plot locations, verify the number of individual canopies and measure canopy coverage in %.
Additionally, airborne LiDAR datasets from 2015 were provided by NamPower and also used as cal/val for the 2015 CC product and to assist the modelling efforts of the 2018 products.
Species distributions were created using a GIS data integration approach and supplemented by MaxENT species distribution maps. Both approaches provide information about species distribution from the grid cells (quarter-degree squares, QDS). While the GIS output provides a vector data information, the species models relate the information to the quarter-degree square cells (QDS) of the Tree Atlas Project.
3.2.2 Web GIS
The BIS is built on the open source software GeoNode. GeoNode is a web-based application and platform for developing geospatial information systems (GIS) and for deploying spatial data infrastructures (SDI).
All BIS products, as well as further ancillary national GIS data is available through a cataloguing function in the BIS web portal. All data is compliant with the NSDI meta-data standard, which had been also incorporated into the GeoNode Meta data template. Through the interactive GIS it is now possible to display and overlay the BIS products with Sentinel image mosaics from 2015 and 2018, as well as integrated GIS data layers such as e.g. administrative regions, roads, watercourses. A demo version of the WebGIS was launched on 31.07.2019 and was made available via the URL https://bis-nambia.dev2.eftas.com. In addition, further system implementations were in place on a server hosted by EFTAS. Besides i) a development version for internal testing, ii) a training version had been put in place for external testing and demonstration during the training and testing workshops. The final implementation will be hosted under https://bis.nsa.org.na within the NSA server environment.
Figure 20: Field work assessment versus drone data and visual digitization of canopies onscreen.

Short Report BIS Namibia EFTAS Fernerkundung Technologietransfer GmbH 23 / 51
Detailed information on the concept and the handling on the WebGIS were explained in the training workshops. The system transition to the NSA server has been made in constant exchange between NSA and EFTAS and has been initiated in October 2019. First components have been installed, advices and recommendations from the NSA team on metadata standards taken on board, with access rights and ways to handle vector data updates from the Digital Namibia Catalogue need to be adapted to final agreements.
The BIS WebGIS was officially introduced and presented to the stakeholder community during a launch workshop held at NIPAM in Windhoek on November 6th 2019. Hereby, the concept has been introduced and the functions of the WebGIS explained. The content and purpose of the satellite earth observation (EO) derived BIS products and Information Packages was presented as well.
WebGIS – latest status
After a period between in November and December 2019 the website was available for in-depth explorations and testing of the different experts and stakeholder groups in Namibia, to
provide their feedback to the consulting team
through the GIZ BCBU office.
Full attention was then given to the exchanges that addressed the entire transition of the system to NSA as the future host of the BIS.
The BIS WebGIS has been implemented on basis of the GeoNode software framework. Extensions have been made to the core system to enable BIS users to:
• Create BIS Product reports for user selected areas
• Retrieve BIS Information Package details for user selected areas
The system has been officially presented during the final stakeholder workshop in Windhoek on the 6th November 2019. The public address until the transfer to NSA has been completed was https://bis-namibia.dev2.eftas.com. After the transmission to the official host, an additional consolidation, testing and operationalisation phase was necessary in order to comply with the latest security protocols and server specifications of the NSA. Therefore a separate troubleshooting with an advanced admin training took place in May 2021.
All BIS Products can be queried in the WebGIS via standard internet web browsers. For full functionality a user registration is requested. In addition to the BIS Products, further national GIS data from Digital Namibia, e.g. road network, boundaries, national parks, have been included in the system to be used for individual map compositions. All BIS Products are fully documented with metadata according to the NSDI metadata standard (Government Gazette No. 6144).
Figure 21: BIS software components and infrastructure.
Figure 22: QGIS USAGE OF BIS WMS.

Short Report BIS Namibia EFTAS Fernerkundung Technologietransfer GmbH 24 / 51
The raster and vector layers of the BIS system can be made available as OGC services (WMS and WFS respectively). This allows the use of the BIS products in free GIS systems such as QGIS.
3.2.3 Capacity Building
Capacity building played a major role in succeeding with the BIS project. Besides a solid BIS development and sound data processing, it forms the key for a sustainable success of the system, i.e. its application and frequent use over the coming years. The employed training strategy followed a “training for trainers” concept, which addresses primarily an adequate understanding and use of the BIS products, as well as the usage, administration and maintenance of the WebGIS. Training packages (Buck et al., 2019b), containing comprehensive and ‘easy-to-digest’ manuals were created as PDF files for digital and printed use, together with digital presentations containing interactive ‘step-by-step’ guidelines and interactive online help functions within the WebGIS. Based on the training packages, several thematic workshops were conducted in Windhoek involving stakeholder representatives.
A comprehensive ground truthing training package was setup, to ensure a successful implementation of the ground truthing data collection, crucial for the EO processing of the BIS products. The training was split in a theory session and a practical exercise in the field, covering the entire field data collection approach, the sampling and its role within the BIS project. All aspects of the field work were documented in comprehensive field work instructions (Buck et al., 2019b), including a tree and shrub identification guide. During the training, the set of equipment was introduced and handed over to the survey teams, consisting of smart phones with a specifically developed data entry app, GPS devices, individual sets of field maps and several tools to measure field parameters and mark the survey plots.
4. Review and Assessment
An important overall demand was to contribute to the quantification of the actual extent of bush encroachment affected area over Namibia, given that current assessments are affected by uncertainty. The following sections aim to contribute to this question and to assess the possibilities and limitations within the given BIS frame. In a first section (chapter 4.1) relevant technical aspects will be reflected, that must be taken into account when interpreting EO data. In a next section (chapter 4.2) the current approaches to measure bush encroachment are described. And in a third section, these both methods are brought together and analyzed.
4.1 BIS EO data handling
With the establishment of the BIS Namibia, satellite earth observation (EO) derived data have been introduced as a new type of information into the context of bush encroachment in the country. Therefore it is important to carefully consider the technical principles of remote sensing data, the spatial resolutions, and principle generalisation aspects of the data, when interpreting and using the outputs. Remote Sensing is not a precise science, but allows a specific contribution to spatially relevant questions, which are hardly available through other sources. With a good understanding of the underlying technology, and a careful consideration of its technical limitations, EO data contribute seamless information over the entire country on an objective basis that allows the analysis, comparison or intersection of spatially relevant phenomena. The following sections will explain two significant aspects
Figure 23: Visualization of 10m pixel size (black grid) versus the 1 ha minimum mapping unit (white box) over a digital ortho photo (3cm pixel size).

Short Report BIS Namibia EFTAS Fernerkundung Technologietransfer GmbH 25 / 51
that are key to prevent misinterpretation: the thematic detail of the given information (chapter 4.1.1.) and the spatial precision (chapter 4.1.2).
4.1.1 Thematic level of detail
In general, EO based mapping is an approximation of the land surface that is captured pixel wise, whereby one pixel of the EO image is representing the spectral reflectance of the dominating land cover under that area. For the BIS products the satellite missions Sentinel 1 and Sentinel 2 have been used with 10m and 20m pixel size. On this basis the BIS EO products have been generated to the required units of 1 ha. Figure 23 compares the 10m pixel (black grid) with the 1 ha BIS minimum mapping unit (white square) over a digital ortho photo from a drone with 3 cm pixel size.
When interpreting the individual values of the 1 ha products, it is necessary to always keep in mind, that it represents the dominating characteristics within the map of an area of 100 by 100 m, and never individual features. The consideration of this aspect is expressed through the cartographic scale that defines the suitable level to use and understand the achieved maps. For a sound modelling, field data are also collected in a way which respects the spatial resolution. In order to adequately capture the spectral reflectance of the targeted parameter, groups of pixels, in this case 50 by 50 m (red box above) are collected as ground truthing reference. This field information has then been up-scaled to drone data at 10 by 10m pixel size in order to correspond to the Sentinel data, before being aggregated to 1 ha. The following figures (Figure 24 and Figure 25) illustrate the calculated drone derived CC values versus the field level and at the 1 ha product level in comparison with the field work and drone data over the same area.
This example shows on the one hand the technical limitations in terms of spatial resolution, whereas at the same time it demonstrates the available level of detail that now exists for the whole of Namibia.
Figure 24: Comparison of Plot Canopy cover from Field work (black numbers) and CAPI based on drone imagery (pink layers) in the left image; and drone extracted canopy cover (green numbers) in the right image.

Short Report BIS Namibia EFTAS Fernerkundung Technologietransfer GmbH 26 / 51
Figure 25: Comparison of BIS Canopy Cover product at 1 ha pixel size (right image) versus the field work (white 50*50 m plots) and drone image (3-5 cm pixel size – left image).
4.1.2 Spatial precision
Another critical aspect that is to be respected when using EO data is the approximation of the spatial representation under the area of a pixel. Although the spatial resolution might be understood as a precise measurement, but connected to the above thematic level of detail it only represents the dominating reflectance under the given pixel. That means that the entire pixel size as applied with one class of the map, although in reality only parts of the surface under that pixel do really belong to this class. In essence, accumulating the entire surface of one pixel to one class and multiplying this with the number of pixels within that class, introduces an error and is therefore to be prevented. Ways to overcome this inappropriate “simple pixel counting” approach are to adequately consider the independently validated thematic accuracy of map through appropriate statistical assessments such as calibration or regression estimators. Concepts and documentations on those are for instance described in:
Gallego, J., Carfagna, E., Baruth, B., 2010. Accuracy, objectivity and efficiency of remote sensing for agricultural statistics, in: Benedetti, R., Bee, M., Espa, G., Piersimoni, F. (Eds.), Agricultural Survey Methods. John Wiley & Sons, Chichester, U.K., pp. 193–211.
Gallego, J., Delincé, J., 2010. The European land use and cover area-frame statistical survey, in: Benedetti, R., Bee, M., Espa, G., Piersimoni, F. (Eds.), Agricultural Survey Methods. John Wiley & Sons, Chichester, U.K., pp. 151–168.
Global Strategy to improve Agricultural and Rural Statistics (GSARS), Handbook on Remote Sensing for Agricultural Statistics. Rome: GSARS Handbook, 2017.
4.2 Assessment on bush encroachment
In order to explore the possible value of EO to reply the overall question on the extent of bush encroachment, it is important to compare the current approaches and available assessments. There are currently two established concepts to quantify bush density and Bush Encroachment in Namibia. On approach is the quantification of Bush / Tree Equivalents (TE) (chapter 4.2.1), and the other is the calculation

Short Report BIS Namibia EFTAS Fernerkundung Technologietransfer GmbH 27 / 51
of Evapo-Transpiration Tree Equivalents (ETTE) (chapter 4.2.2). Both parameters are compared with long term average rainfalls, in order to get acceptable ranges of bush densities, beyond which areas would be “bush encroached”. Uncertainty stems a) from the difficulty to capture representative values at hectare level for both concepts and b) extrapolate locally limited measurements to wider geographic areas or at country level.
Based on these concepts the currently used figures on BE are known as judgement based rather than objectively measured and vary widely. Latest attempts to quantify BE were ranging between 26-30 million hectares (see AD01) up to 30-45 million hectares (chapter 4.3.1).
The intention of the Bush quantity product (see Annex III) was to contribute objectivity into the response of this question. Unfortunately the resulted correlations between a first BIS Bush Equivalent map and the reference observations on the ground were too poor to allow a publication. Therefore another attempt was done on ETTE modelling. These approaches are reflected in the next chapters.
4.2.1 Bush or tree equivalent assessment
The general idea behind the Bush / Tree Equivalents (TE) measurement is to count the number of bushes in relation to height classes, whereby one bush/tree equivalent corresponds to one bush with 1.5 m height. Bushes with 3m height correspond to 2 TE, and bushes with 0,75m count as 0.5 TE. In relation to soil conditions, where the number of TEs exceeds twice the average long term annual rainfall, are understood as bush encroached (Rothauge, 2014). In order to quantify the Bush density within the BIS specific field data had been designed, so that the BE values could be calculated per field plot, in order to upscale them further to the EO processing. Generally the field data collection of TEs went well. The defined parameters could be well trained, captured with a tablet and quality controlled (chapter 3.2.1), although the work was off course hard, transport and access were difficult and the collection of numerous samples was limited. But in a first comparison the field information showed a high degree of congruence against the allocation of the critical thresholds as a function of the long term average rainfalls and soil conditions (Figure 26). Except some samples in the central latitude which seem to underrepresent the situation, bush encroachment could be quantified with this field approach.
Another conclusion had to be taken with regard to the planned EO upscaling process. Here only very low correlations had been found between the field work and the modelling approach. Reason for this are expected to be connected to the characteristic of the TE parameters compared to the characteristics of EO data at the given level of detail. The collected field captured counts of bushes with different heights that are to be compared against Sentinel data that record only the top vegetation coverage at 10m spatial resolution. The parameters that are defining the tree or bush equivalent in terms of height and number of bushes appear in dense vegetation as one crown as seen from the satellite in the birds eye view. Conversely, different field approaches, ranging from full counts to a simplified LCCS layer approach (see Buck et al., 2019b), had been compared with good results to the point cloud data from the drown images. In essence, the low validation results of the bush or tree equivalent product (see Buck et al., 2019a) and the limitation to further advance the process, lead to the decision to not publish this product. Although it was anticipated in the inceptions phase (see chapter 1.3), it wasn´t expected that the correlations are that low.
Figure 26: Calculated bush equcivalents of field data allocation against the critical bush densities on basis of long term average rainfalls (black polygons) and soil conditions.

Short Report BIS Namibia EFTAS Fernerkundung Technologietransfer GmbH 28 / 51
4.2.2 ETTE assessment
The concept of Evapo-Transpiration Tree Equivalents (ETTE) is built on the Evapotranspiration Tree Equivalent, which is “the leaf volume equivalent of a 1.5-m single-stemmed Acacia karoo tree” (De Klerk, 2004, p.47). Bush encroachment appears in areas where the ETTE values exceed the 10th of the long term average rainfall values. Based on the BECVOL 3 model (Smit, 2014) ETTE values can be generated from the BIS EO canopy cover, above ground biomass and tree height products through a regressive random forest classifier. In contrast to the tree equivalent approach which can be easily employed in the field, the ETTE concept is rather abstract for field observations and only little applied in Namibia. Nevertheless the correlations between the EO outcomes and the ETTE values that were modelled on basis of the collected field data were acceptable. Although not as good as the correlations for BIS canopy products, further investigations were done, in order to quantify bush encroachment at country level.
In a first step, a digital raster map was calculated showing the allocation of the critical ETTE thresholds for bush encroachment, which is the 10th of the long term average rainfall (see Figure 27b).
Figure 27: ETTE assessment of critical bush densities. Modelled ETTE values 2018 (left: Figure 27a) and quantified ETTE thresholds map on basis to long term average rainfalls (black polygons) (right: Figure 27b).
In a next step, the modelled BIS ETTE product has been assed against the above explained ETTE threshold map through simple raster calculations (Figure 27b-Figure 27a), resulting in a map that shows all areas where the actually modelled ETTE quantity exceeds the critical threshold for bush encroachment based on the long term average rainfall. Theoretically, this map could be used as an indication and a very first attempt that allows to visualize the bush encroachment in a consistent way over entire Namibia (see Figure 28). But caution has to be applied, as it is not a statistical area estimation due to the limitations of the calculated errors of this map (see chapter 4.1), i.e. the applicable thematic error under the given correlation of 0.2 and a mean Root Mean Square Error (RMSE) of about 24,000 ETTE / ha (see Buck et al., 2019a). In order to proceed and to address this, the further approach to display the information focused only on extreme values that are higher than the RMSE. All values plus and minus the 24,000 ETTE/ha are displayed as grey or “no information”. The next challenge is to prevent simple “pixel counting” (see chapter 4.1.2). Accumulating all pixels that are exceeding 24,000 ETTE/ha, multiplied by 1 ha pixel area, would be the inappropriate pixel
Table 1: Spatial approximation of ETTE
Map classes [ETTE/ha ]* No of pixels**
< - 24,000 0
No value (RMSE +/- 24,000) ( 10,000-24,000)
48 million 15 million
+ 24,000 - 40,000 13 million
40,000 – 60,000 1 million
60,000 – 80,000 0
> 80,000 20 million > 500mm/a rainfall > 550 mm/a rainfall
6 million 3 million
*) Actual ETTE values (figure 29 b) less the recommended ETTE values (figure 29 a) **) which is not equal to affected area (see chapter 4.1)

Short Report BIS Namibia EFTAS Fernerkundung Technologietransfer GmbH 29 / 51
counting approach as described above. It would include the entire surfaces of the pixels and lead to an overestimation. In order to prevent a misleading precision that is not existing, an approach is chosen that reports about pixel counts, which are accumulated to spatial approximations in class ranges also considering the calculated RMSE:
• The map has been grouped in classes of ranges of 20,000 ETTE/ha (Figure 28)
• Green classes are mapped as less actual ETTE/ha than the threshold and would indicate “no bush encroachment”
• Brown class are mapped as more ETTE/ha than the threshold and would indicate “bush encroachment”
• The grey class is the thematic uncertainty of the calculated RMSE around the critical threshold for bush encroachment, and is displayed as “no information”.
• About 48 million mapped pixels are within the grey “no value” class.
• About 34 million of the mapped pixels are beyond the RMSE of 24,000 ETTE/ha
• No pixels are below the RMSE of - 24,000 ETTE/ha.
A first interesting result is that all values are either within the uncertain class ranges of the RMSE (grey class in Figure 28) or beyond that, i.e. no values are found in certainly “non bush encroached” classes (green ranges). Conversely, it shows 34 million pixels mapped beyond the uncertainty range (brown classes). These results should be now subject for further assessments, e.g. are the areas of the Northern regions in Namibia that are mapped as areas with high ETTE/ha most probably land cover types such as forests, which are not affected by bush encroachment? On the other hand, the map shows that the actually most affected region along the B2 highway falls into the “no value” class, indicating that possibly the BE impact is under represented in this map.
Figure 28: ETTE assessment on bush encroachment. Comparison of the 2018 ETTE map versus the theoretical BE treshold.

Short Report BIS Namibia EFTAS Fernerkundung Technologietransfer GmbH 30 / 51
Another way to assess the information of the map is by displaying a raster histogram (Figure 29). This shows the number of pixels per map value in the related ETTE/ha ranges as peaks of pixels. Similar as in the map in Figure 28, rarely pixels are below 0 and between 60,000-80,000 ETTE/ha. Remarkable peaks are below 5,000 ETTE/ha, between 10,000 and 30,000 ETTE/ha, between 80,000-90,000 and beyond 90,000 ETTE/ha. Questions would be again:
• Are all cases beyond 80,000 really forests?
• Could the highest peak below 5,000 ETTE/ha be uncritical, due to the mapping uncertainty, as it is so close to 0?
• Are the ranges between 10,000 and 30,000 the actual bush encroachment phenomena?
The below maps aim to address these questions. Figure 30a splits the ranges beyond 80,000 into two classes. The appearance of the related pixels compared to the average rainfall gradients (Figure 27) shows that this peak in the histogram doesn`t contain only forest areas but also bush encroached areas even in the class beyond 90,000 (dark brown). Figure 30b splits the uncertainty range between 0 and 24,000 into two classes, whereas the range between 10,000 and 24,000 (magenta) is displaying actually that region along the B2 highway that was not explicitly mapped before in Figure 28.
Figure 30: Spatial display of remarkable histogramm peaks in the ETTE assessment map. (Left – Figure 30a: analysis of the two high value peaks of the histogramm (brown 80,000-90,000 and dark brown >90,000); right - Figure 30b: analysis of possible bush encroachment within the range of the mapping uncertainty (pink) and possible forests (blue).
With regard to the spatial approximation of the above Table 6 and the maps in Figure 30, areas between 14 million and 34 million hectares would fall in the certain range, which contains pixels that indicate bush encroachment beyond the RMSE of 24,000 ETTE units. This is obviously underestimated. Considering in addition all pixels that appear as joined peak between 10,000 and 30,000 ETTE/ha within the histogram
Figure 29: ETTE assessment on bush encroachment. Comparison of the 2018 ETTE histogramm versus the theoretical BE treshold.

Short Report BIS Namibia EFTAS Fernerkundung Technologietransfer GmbH 31 / 51
(Figure 29) a more realistic scenario appears (see magenta class in Figure 30b). Compared to Figure 28, for instance it well covers the obviously BE affected area along the B2 highway, but the additional roughly 15 million pixels beyond 10,000 ETTE/ha are part of the uncertainty range of the map. Conversely, there are still forest areas within this assessment that are unaffected by bush encroachment and must be deducted here. Assuming areas with more than 500 through 550 mm/ long term average rainfall per year (blue class in Figure 30) this would affect 3 to 6 million pixels. In conclusion and on basis of these class allocations a very rough approximation would range between 28 - 46 million pixels. (The lower range is all classes beyond RMSE minus up to 6 million pixels for forests. The higher range is all pixels beyond 10,000 ETTE units including uncertain pixels minus at least 3 million pixels for forests). As explained, this is a subjective assumption, that is based on correlation of 0.2 against the in-situ reference data, with a RMSE of 24,000 ETTE/ha. Because of the limitations of these given uncertainty ranges, independent verifications for instance in comparison to systematic field information should take place. Nevertheless it independently supports the previous approximation of 30-45 million hectares of bush encroachment in Namibia (see chapter 4.3.1). There should be further investigations in comparison to the BIS products and the MaxENT models (see chapter 3.1.3).
4.3 Review to previous Bush Encroachment estimations
In the following section, the above BIS assessment is brought into the context of the existing state of estimations in order to explore the potential added value and to identify the necessary next steps.
4.3.1 Latest estimation on bush encroachment
Before going into the details of the EO assessments, the following section is aimed to provide the latest approaches in the approximation of bush encroachment areas in Namibia. Prior to BIS, expert estimates of bush encroachment in Namibia varied from 20% to 60% of the country’s 824,000 km2 land surface being bush-encroached. Some of this variation may be explained by the intensity of bush encroachment: when is an area counted as “bush-encroached”? Different observers and experts have different tolerance levels of bush encroachment and what may be “encroachment” to one is “the sub-climax state” to another.
On basis of an extended systematic approach that combined investigations through accumulated experts-judgement with the investigations of the work of the Tree Atlas of Namibia (Curtis & Mannheimer, 2005), the initial approximation of 26 – 30 million hectares had been adopted towards 30-45 million hectares as shown in Figure 31 (SAIEA, 2016). This approach used the systematic quarter degree grid of Curtis & Mannheimer, while qualitatively grouping the relative abundance in each square per main encroacher species. Similarly as the above ETTE approach, this is a pixel counting approximation on basis of the quarter-degree square grid. However comparing Figure 31 and Figure 30a, the BIS map seems to broadly support the SAIEA estimation.
Figure 31: Total extent of Bush Encroachment according to SAIEA (2016).

Short Report BIS Namibia EFTAS Fernerkundung Technologietransfer GmbH 32 / 51
4.3.2 Discussion
The BIS has consistently used the bush density formula based on the long-term average annual rainfall (LTAAR) as an indication of bush encroachment (Figure 26), as recommended by the strategic environmental assessment of bush encroachment (SAIEA, 2016). If this recommendation of “ideal/natural/optimum” bush density is contrasted with existing bush, the difference between the two maps would be the extent of bush encroachment in Namibia, based on bush density in tree equivalent per hectare (TE/ha) and LTAAR. Unfortunately, the correlation between a first BIS Bush Equivalent map and the reference observations on the ground were too poor to be published, but the bush density reference map (Figure 26) of “ideal/natural/optimum” bush densities based on BE/ha has such low values compared to real bush densities that it is clear that most parts of Namibia’s land surface are encroached. Currently, the comparison between “ideal/natural/optimum” and real bush densities is made more difficult because experts differ on which unit of bush density to use:
➢ TE/ha is used in the SAIEA (2016) assessment and is the most common unit of how many bushes there should be per area, based mainly on LTAAR but often amended due to the soil type (e.g. coarse Kalahari sands) and general woodiness (e.g. in NE Namibia) of an area. Admittedly, a TE is an over-simplification of a woody plant based solely on its height, but is easy to measure directly in the field and to understand.
➢ ETTE/ha is based on the water used by a woody plant based on its leaf volume as measured by its canopy dimensions. The density of bush encroachment based on ETTE/ha is presented in Figure 11 and is surprisingly low. While it may be a more accurate description of a woody plant, it is again based solely on one characteristic of the plant (its water use by evaporation and transpiration as modelled on Zea mays, a cultivated grain plant and Pinus pinaster, a temperate-zone conifer with little resemblance to sub-tropical hardwoods, adapted to Acacia karoo, see chapter 4.2.2) and is impossible to measure directly in the field. Even though the BIS attempted, with the given uncertainty, to determine the actual situation against the “natural/ideal/optimum” ETTE/ha (Figure 27), it is not a convincing standard due to its abstractness.
Hence, although the BIS contributes with some more and measurable objectivity at a finer spatial resolution, it is not able to precisely quantify and answer the question “how much of Namibia is bush-encroached” accurately. None of both attempted concepts to quantify bush density, was fully capable to sufficiently correlate field observations with the BIS EO products (TE/ha) or to be applicable in the field (ETTE/ha). It is recommended that Namibians achieve agreement on this basic parameter as soon as possible that serves both: applicability in the field and EO suitability through significant correlations. For example, TE/ha could be used when the absolute density of woody plants is desired and ETTE/ha when their impact on ground moisture is desired. Until then, indirect assessments of bush encroachment do allow a tentative answer to this basic question. Consider the following products of the BIS:
➢ Figure 10 depicts the change in % canopy cover of woody plants from 2015 to 2018. These were relatively dry rainfall years in Namibia and yet the canopy cover of woody plants increased dramatically, most often between 30 and 70%. That is a huge increase in bush cover over a three-year period, especially if one considers that many parts of central and northern Namibia were already more than 50% covered by bush in 2015 (Figure 9) and thus were not able to increase their density by more than 50%. According to this indicator, bush encroachment in Namibia is hugely extensive and closer to 60% of the land area than to 20%.
➢ Figure 7 depicts the above-ground biomass (AGB) of woody plants in t/ha and indicates that for most of Namibia’s most encroached regions, the AGB is above 30 t/ha. This matches well with the total woody biomass determined directly (by BECVol method) in nearly 70 transects, which averaged 41.5+53.13 t/ha. Normally, BECVol transects measure a mere 100 m2 and would be

Short Report BIS Namibia EFTAS Fernerkundung Technologietransfer GmbH 33 / 51
presumed to be less representative of a full hectare than the BIS pixels. Bush harvesters reckon that any area with more than 15 t/ha of extractable wood is bush-encroached and commercially exploitable. By this measure too, the area of Namibia that is bush-encroached tends towards the higher estimates.
➢ With several products, the BIS methodology acknowledges the probable under-estimation of bush density. For example, both the TE/ha assessment (section 4.2.1 of the report) and the ETTE/ha assessment (in section 4.2.2 of the report) indicate that the bush density in central Namibia is under-estimated, sometimes vastly so (as with ETTE/ha). This observation confirms that more of Namibia is bush-encroached, rather than less.
It appears that the only way to bring certainty to this debate, as well as the density of individual encroacher bush species and their distribution in Namibia, is a systematic and extensive field survey, which can properly ground-truth a range of more-or-less suitable earth observation parameters. As long as this “hard option” is avoided for its high cost, the question of how bush encroached Namibia really is will not be answered quantitatively and objectively, but rather biased by subjectivity, as applied in chapter 4.2.2.
5. Conclusion and Outlook
In conclusion and on basis of the above explorations, the achievements of this BIS project are contributing with a systematic EO upscaling approach cutting edge solutions to the assessment of bush encroachment for the entire Namibian territory. Moreover, it is a unique approach for bush monitoring by means of geo information technology with eventual relevance across the southern African region. It provides the compilation of a) systematic sets of EO based mapping products (chapter 3.1), b) the transfer of the open source BIS-WebGIS to the government of Namibia (chapter 3.2) and c) the related capacity building (chapter 3.3). Beyond this, the project specifically contributed with the introduction and consolidation of a comprehensive remote sensing workflow, including a concept for stratified ground truthing (see Buck et al., 2019b and Buck et al., 2019a), and consultancy on the adequate use and interpretation of the EO results (chapter 4), which was new in the recent bush encroachment discourse. Specific emphasis was on the stakeholder participation via the BCBU advisory board throughout the project, aiming to ensure the understanding and to determine the technical feasibility of the specified user requirements (chapter 1.3).
Although there are still aspects to be further worked on such as higher product consistencies, WebGIS improvements and advanced capacity building, this Bush Information System provides now new geo information data in a seamless way for the stakeholder community in Namibia. This has not been available before and opens fields for various further researches on bush encroachment. The following sections reflect the recommendations on basis of the findings and identified shortcomings (chapter 5.1) and provide an outlook for future BIS evolutions.
5.1 Recommendations
The following list aims to provide guidance on the future development of the BIS project.
I. Product consistencies
Although the BIS canopy cover, the above ground biomass and the tree height products could have been produced with reasonable correlations (Buck et al., 2019a), the ETTE product still requires higher accuracies in order to strengthen its usability. The given approach now creates a homogenous product frame over the entire Namibia, which could be possibly improved through a well-coordinated processing at regional level. This would increase the workload for EO processing, ground truthing and validation, but would allow to better address spatial inconsistencies in the products, as discussed in chapter 4.2 with the ETTE product along the B2 highway.

Short Report BIS Namibia EFTAS Fernerkundung Technologietransfer GmbH 34 / 51
Recommendation:
• Carefully investigate and plan more regionalized EO processing approaches considering the BIS Potential Main Encroacher Species Composition map and the MaxENT BIS Probability Maps per Main Encroacher Species
• Adopt and develop a suitable field sampling accordingly
II. BIS WebGIS System improvements – to improve user friendliness to farmers and target users
II.I AOI creation
A key criterion for the BIS system is the usability of stakeholder groups who are non GIS-experts. The principal strategy of the BIS to allow access to the BIS data and easy to use functions is to interactively assess and create PDF reports and maps of Areas of Interest (AOI) that are requested by the users. These AOIs are to be defined and selected by the users. Those could be farms, part of farms, districts or any other kind of area and these AOIs must be available for the WebGIS as digital GIS vector data. Via the BIS layer catalogue those can be uploaded into an individualized BIS user account or created via several steps within the BIS WebGIS itself. Once uploaded, the different BIS EO products (chapter 3.1.1), the BIS information packages (chapter 3.1.2) or individualized maps are generated interactively for this area.
On one hand this simplified approach allows to access comprehensive EO data that has been greatly appreciated during the stakeholder assessments and proved to serve the envisaged strategy, as long as the right AOI is available. On the other hand, the availability of AOIs as digital vector data turned out to be an issue, as working with GIS is not yet common within the stakeholder groups in Namibia and official farm boundary data sets are not yet released. Thus, these must be created via a separate GIS working step, which is not self-explaining. The digitization of farm boundaries requires GIS vector editing capabilities with an adequate geo data source at an appropriate scale, such as DOPs or VHRs, and the assurance that the AOI is created correctly. From a technical point of view, this would have required access to licensed remote sensing data and would have overloaded the BIS system. Although, there are vector creation functions within the BIS WebGIS, the more efficient way is to create those outside the BIS.
Therefore it is crucial to ensure that:
• The users understand the importance of the AOI creation and
• Are provided with due support to organize their relevant AOIs.
Solutions:
• In a first place help is prominently provided through a) online FAQ entries, b) dedicated hands on manual with work flow for AOI creation and c) references to hands on support via NSA or other national GIS experts and consultants
• A final solution would be the release of an official farm boundary layer that is introduced into the BIS as soon as possible.
II.II BIS advanced editing
In opposition to the above need for facilitation, some concerns had been raised to provide more options to modify the BIS reports and information packages according to interest and new use cases. Besides the option for experts to individually compose maps within the BIS WebGIS, or to introduce the BIS layers as WMS layer into their desktop GIS, the idea of the predefined BIS reports and information packages are to ensure access to the BIS products for non-GIS-experts and to serve them with predefined use cases. I.e. there is room for advanced GIS assessments, as well via an application to receive the physical data layers from the NSA, but complete flexible styling of raster products is not recommended. This would contradict the above strategy for user friendliness and simplification and would overload the system. Nevertheless there could be some different styles for a limited number of selected layers, so as possibly new use cases and BIS Information packages. Therefore there should be an ongoing review and expansion of BIS reports

Short Report BIS Namibia EFTAS Fernerkundung Technologietransfer GmbH 35 / 51
and information packages, which require to a certain extent programming capabilities for specific WebGIS components.
Therefore it is recommended to:
• Follow up and evolve the BIS portfolio of use cases and information packages and
• To provide web development training on new BIS information packages
II.III BIS management
With GeoNode as the web based platform, the BIS WebGIS contains comfortable cataloguing functions and invites to collate various GIS layers. Various layers have been already uploaded into the BIS on basis of user requests; others and more were recommended to be uploaded. However, it must be considered, that all data have to comply with the applicable Meta data standards, and are crucially to be kept up to date. In order to prevent a loss of overview, the content of the uploaded layers should be coordinated and planned carefully. As a recommendation, the list of GIS layers within the BIS should be regularly reviewed, the intended use should be justified and described in the Meta data, and preferably external data should be harvested as WMS service. In case data are uploaded into the BIS because of a lack of other suitable web platforms, it is recommended to setup a separate GIS web catalogue by means of for instance GeoNode.
Recommendation
• Carefully plan and coordinate BIS data layers and nominate a BIS manager
• Possibly provide an extra training on data cataloguing, data harvesting and meta data documentation
Besides this the available data and products contain different options to analyse the data. As the system is aiming to address non-GIS-experts, advanced users can use the BIS data within the WebGIS, their desktop GIS or via a request for the full physical data. In order to effectively administrate what is being done with the data, to optimize support and to follow up the evolution and added value it is recommended to systematically manage the BIS users. The underlying functions of the BIS WebGIS allow a comprehensive user management, which is recommended to carefully plan and coordinate.
Recommendation
• Carefully plan and coordinate BIS user management and nominate a BIS manager
III. Field data collection/EO modelling
One important achievement of this BIS project was the establishment of a systematic EO compatible field data collection approach including survey instructions following a data collection protocol, stratified sampling, and data collection apps for smart phones that were up scaled with drone and LIDAR data (chapter 3.2.1 above, Buck et al., 2019b and Buck et al., 2019a). Although tremendous efforts were done in Namibia to collect field data on vegetation and bush encroachment, its usability for EO upscaling was only limited. Reasons were in some cases a lack of geo references via GPS records, inappropriate spatial coverages that do not match the relevant satellite resolution or missing correlations with the BIS EO products. Investigations were made with the Namibia Tree Atlas data, the field data of the “land degradation project” and field data protocols of the CSIR approach. Out of these activities the following recommendations are important:
For future updates of the BIS products ground-truthing is essential! Besides the new collected field and drone data, some interesting sources had been mentioned for the BIS, but only LIDAR data from NamPower via CSIR and archive digital orthophotos from Strydom and Associates were available. For future updates it is important
• To adequately reserve resources for ground truthing data in the budgets.
• To ensure as much as possible synergise with other activities and projects

Short Report BIS Namibia EFTAS Fernerkundung Technologietransfer GmbH 36 / 51
• And to plan for more and new sources of ground truthing data, such as FSC information or Biomass removal data of harvesters, which could add value to improve the EO outcomes.
It is crucial to ensure that future field work in Namibia is EO compatible
An important aspect to consider is the field survey should be designed to collect relevant parameters to fit the expected outputs, and to enable maximize data collection efforts and have more samples
In order to apply this, there should be
• A common understanding to collect field survey in a suitable form for EO upscaling, i.e. always geo tagged, with photos and a defined spatial extent that suites to the chosen spatial resolution of the remote sensing data, e.g. for Sentinel 1 and 2 a plot size of 50*50m would fit.
• Systematically investigate new studies and research to collating extended reference data sets, covering different bush encroachment stadia for different encroacher species over various places in Namibia
• This would help to investigate further EO processing and training for future work
Take advantage of the field survey developments
• The developed sampling frame and design (Buck et al., 2019b) including the stratification approach serves as a sound basis to plan and organize survey campaigns. Furthermore, it allows assessments, quality assurance and comparability between different campaigns and projects. This should be further advanced with new data sources as well as the BIS EO products.
• The EO upscaling through combination of field data collection with drone or aerial image surveys proved a substantial efficiency increase.
• The BIS field apps should be further used and employed, whereas the following parameters are most relevant for the employed BIS EO modelling.
The above list of survey components such as the sampling design and sampling frame, and the survey parameters that are summarized in Table 2 and in detail in Annex VII below shall be considered in order guide the implementation of other field data surveys.
Table 2: Most important field survey parameters for BIS EO modelling
Survey component Survey parameter Purpose
Sample plot survey application
Header parameters Relevant of survey organisation and interpretation
Accessibility of sample plot Crucial for quality control
GPS waypoints and photos of plot These parameters are the key link between in situ and EO scales
Indication on de-bushing activities / bush encroachment
Supporting information on individual perception of surveyors
Vegetation structure of sampled plot Key information for BIS Canopy Cover, AGB and tree height
Information on up to 5 different woody layers
Total number of species individuals >0.75m
Key information for BIS ETTE product
BECVOL parameters application All parameters Those are applicable for the BECVOL 3 modelling and shall be collected in a representative number per vegetation layer in order to allow extrapolation

Short Report BIS Namibia EFTAS Fernerkundung Technologietransfer GmbH 37 / 51
IV. BIS Capacity building
In review to the capacity building component (chapter 3.2.3), most important feedbacks were gained during the trainings. The general aim of the BIS user trainings was to introduce the handling of the BIS to trainers from the stakeholder group, based on the underlying methodologies. Therefore field data collection, EO processing, and the data interpretation via GIS have been introduced. The outcomes of these training feedbacks were the appreciation of the general BIS approach, as it introduces new seamless data for the entire country. As improvements, the participants wished more time for exercises in applicable GIS and EO processing’s. Although this would have gone beyond the scope of this project (see as well point V. below), it showed the strong interest and commitment that the training participants demanded to improve their GIS capabilities. It is recommended to arrange such trainings with adequate time to elaborate and investigate applied GIS and EO trainings with particular focus to their tasks related to bush encroachment. In order to ensure and sustain the objectives of the employed training for trainer concept, an additional training cascade by these trained BIS trainers should be held in future with the applied stakeholder group and the focus that these users really understand the system.
The outcome of the web administrators training was similarly the expectation for more Web development training. Although the WebGIS is rather the platform than the BIS portfolio itself, there was a strong request to gain the ability to adapt the GeoNode WebGIS frame of the BIS or to develop new platforms. In the course of the system transfer to the NSA specific training components web development training is:
• BIS Content management (Upload / share new layers, meta data cataloguing, …
• Work flow user registration
• Change GeoNode frame (landing page, footer, …)
• Create new BIS information packages
• Revise GeoNode frame
V. BIS EO product updates
Although all processing and developing steps are based on open source solutions, the provision of the BIS itself was not designed as capacity building itself. Conversely an advanced EO know how transfer or the development of institutional EO processing mechanisms would require dedicated focus via multiple years’ projects by itself. The free availability of EO data and processing algorithms such as R’, Google Engine or others, may invite to underestimate the real workload and necessary experience to deliver useful products, but bear the risk to disappoint expectations and to exceed project feasibilities. Specific attention has been brought to this discussion during the inception phase, where it was agreed, that all EO processing steps will be documented so that future updates by suitable remote sensing experts can build on the projects achievements. This is done in the BIS Methods Compendium (Buck et al., 2019b) and was demonstrated during the user trainings. Nevertheless, re-use of the EO processing has to take place in dependence of the then prevailing weather conditions, the constitution of the then available satellite mosaics and the availability of ground truthing it is essential to adapt the R-models with care and requires expertise. A successful EO processing uptake would furthermore require employing the entire EO work flow including ground truthing and validation (Buck et al., 2019a) and a careful assessment of the EO outcomes as shown in chapter 4 above.
For future BIS product updates it is recommended to a) either outsource the EO processing component to institutions or service providers with suitable remote sensing expertise on basis of the BIS project documentations, to b) explore the option to establish such a suitable remote sensing expertise within the relevant government authority of Namibia with sufficient resources and understanding of the related complexity or c) to combine both. The first option would ensure the highest cost efficiency and the ability to allocate the responsibility to achieve the required quality standards in the hands of organisations that are specified to keep their expertise and capabilities always at latest state of science and technology. The second option would require a major strategic decision, given that the establishment of suitable EO capabilities that is able to serve the institutional demand of a government authority actually requires the

Short Report BIS Namibia EFTAS Fernerkundung Technologietransfer GmbH 38 / 51
willingness to organisationally setup and maintain an EO working group including sufficiently graduated experts, adequate hard and software infrastructure and most important a sustained hard and software maintenance and continuation beyond the projects lifetime. Successful technology transfer projects of EFTAS proved the need for willingness, long term vision and very close cooperation on a par. The third option could be a compromise that combines the training and consultancy to establish the expertise and understanding to control applicable EO procedures, but to outsource the actual EO processing.
Recommendation
• To carefully explore the most suitable way for EO know how transfer among the above described scenarios.
However, it is important to also consider the dynamic of bush growth versus the visibility in remotely sensed data. Since the growths rate of the relevant encroacher species is very small over years, this becomes only visible as soon as the biomass increase exceeds the applied uncertainty of chosen EO data that is necessary to cover the entire Namibia. In other words, if bushes need more than one year to grow about 2-3 cm, and the RMSE of the Sentinel data is 0.7 m, significant changes might become visible after 20 to 30 years. Rather than a frequent update of the BIS EO products, there could be other more suitable and more easy to create EO means to monitor changes that are mainly caused by harvesting or de-bushing, or that focus on the monitoring of the rangeland biomass below the woody layers. There are various EO services and sources at different scales that provide time series profiles of biophysical indicators. Those are for instance from EU Copernicus, European Space Agency, Global Monitoring for Environment and Security for Africa but also Namibia service platforms as from Agri Ecological Services Namibia.
Recommendation:
• Investigations should be addressed to test and compare this type of seasonal products for Bush monitoring and to explore ways to embed those into the BIS WebGIS
• The BIS web development should be expanded towards seasonal monitoring products including the elaboration of meaningful new use cases and information packages, as the current specifications provides a rather static frame.
5.2 Outlook
With the successful transfer of the system to the NSA server, actually the real work for the users and stakeholders with the BIS data has to come now. All relevant BIS components are elaborated and delivered, recommendations for improvement are described (chapter 5.1) and first explorations of the data are done (chapter 4) with the achievement of this project. For the future evolution it is important (i) that the stakeholders work with and understand the new type of data in the light of (ii) the reflection of the status of the previously available information. Mostly the products are described and shown as national maps at a very coarse scale, whereas the full level of information becomes aware once working with the BIS data within the WebGIS at the working scale that allows detailed regional assessments and a comparison of the different BIS products. In this view, it is important to note, that the BIS maps do contain much more information than just displayed with the national maps! As an example shows Figure 32 the AGB product closed to Okahandja at a scale of about 1:150,000 overlaid with the BIS Potential Main Encroacher Species Composition map compared to the full national coverage at a scale of about 1:9,000,000.

Short Report BIS Namibia EFTAS Fernerkundung Technologietransfer GmbH 39 / 51
Figure 32: BIS working scale (left AGB product at about 1:150,000 scale close to Okahandja compared to full national map at about 1:9,000,000).
Furthermore, Figure 33 shows the achievements of the BIS spatial information compared to the status of the related data before the BIS project. Previous questions and assumptions on bush encroachment in Namibia can be brought now into a new context. For instance, the BIS Potential Main Encroacher Species Composition map provides a harmonized map covering all nine species distribution of the main encroacher species as a digital GIS layer, as an evolution and on basis of the previous efforts of Bester and Lubbe. Now the entire country is covered in a comparable way and shows more details at a finer cartographic scale. Or, the assessment of bush encroachment via the BIS ETTE map, that although it is still a matter of subjectivity and simple pixel counting, provides an independent and more detailed scenario to the latest bush encroachment quantifications from SAIEA (2016), with measurable uncertainties.
Bester and Lubbe maps on bush encroachment BIS Potential Main Encroacher Species Composition map

Short Report BIS Namibia EFTAS Fernerkundung Technologietransfer GmbH 40 / 51
Total extent of Bush Encroachment according to SAIEA (2016).
BIS ETTE assessment map
Figure 33: Available spatial information on bush encroachment in Namibia before (left) and now with the BIS (right).
These are just some examples on how the BIS opens new ways to assess and analyse bush encroachment with new viewing angles. Besides the more technical recommendations above, there are major strategical aspects that could guide the future development and use of the BIS:
VI. Explore BIS data with systematic research
The new type of geo information that is provided through the BIS products allow assessments, that haven´t been possible before. It is recommended to explore these new opportunities through systematic investigations and a dedicated scheme of research studies in contribution to the ongoing experts’ discourses on bush control. For instance, would it be interesting to combine canopy cover with above ground biomass in view to the ETTE assessment and compared with species distributions, or to compare these with MaxENT modelled maps (chapter 3.1.1) and the Namibian Tree Atlas maps.
VII. Elaborate adequate monitoring scale
There is tremendous work and a powerful expert’s community on bush control and rangeland monitoring in Namibia. Various monitoring and mapping efforts had been made mostly based on fieldwork that either is representing the country only partially, or is accumulated at a very coarse grid of cells, as in the Tree Atlas. The BIS contributes now satellite based information that covers the entire country seamlessly, whereby the BIS upscaling steps (chapter 3.2.1) proved aerial or drone data as the most effective scale to map and measure bush encroachment. It is recommended to further discriminate the spatial resolution and geographical scale that is most suitable to capture the needed botanical level of detail in view to the dimension of the Encroacher species. An approach could be to:
Make use of Digital Ortho Photos, VHRS images or UAV Use existing coverages Linked with well-planned new acquisitions Make use of systematic assessments including Automated processing Visual interpretation Considering Area Frame Approaches
VIII. Elaborate EO applicable definitions on bush density
Specifically for the most important question on how to objectively measure bush encroachment different concepts such as tree equivalents (TE) or Evapo-Transpiration Tree Equivalents (ETTE) have been elaborated. Possibly, the BIS information may help to review and consolidate these definitions, given that the TE has limitations in EO assessments and the ETTE concept is not suitable for field observations.

Short Report BIS Namibia EFTAS Fernerkundung Technologietransfer GmbH 41 / 51
Furthermore, could there be now investigations to explore, if the established critical thresholds for bush encroachment (e.g. the 10th of the long term average rainfall of ETTE, …) are actually suitable.
IX. Introducing statistical concepts
Finally, the reliable quantification of bush encroachment in Namibia is of utmost importance and is crucial for decision-making and policy development. So far, previous investigations where rather subjective experts assessments, than objective estimations. With the BIS, the assessment on the extent of bush encroachment is still subjective and due to the various uncertainties only an approximation, instead of a precise measurement, but is allows one to describe the range of uncertainties. For future steps, it is important to carefully distinguish between a spatial approximation by means of GIS and sound area estimations that are to be applied with an expected CV range at a targeted administrative level. However, further project evolutions should employ statistical approaches, such as Area Frame Surveys, which will help to strengthen objectivity and to increase efficiency. This would allow to:
Improve precision Reduce costs Ensure sufficient representation Based on the BIS framework
X. Continued consultancy and support to the BIS host
As expressed during the training events and as learned during the process to transfer the system, it is recommended to arrange a continuous consultancy and support in order to back and sustain the BIS maintenance that could cover:
Follow up relevant open source improvements to update and future advance the BIS Provide Web development trainings Provide BIS training supervision, assistance and follow Follow up relevant EO innovations and services [e.g. seasonality NDVI service]

Short Report BIS Namibia EFTAS Fernerkundung Technologietransfer GmbH 42 / 51
References
O. Buck, C. Haub, M. Kobs, L. Kleinewillinghöfer, C. Timm, R. Mathieu, L. Naidoo, H. Strydom, C. van der
Waal, A. Rothauge, D. Joubert (t) (2019a): „BIS Product validation report”, project report: Development of a Bush Information System (BIS) for mapping and quantification of bush encroachment and woody biomass potential in Namibia, BCBU Windhoek, Namibia.
O. Buck, C. Haub, M. Kobs, L. Kleinewillinghöfer, C. Timm, R. Mathieu, L. Naidoo, H. Strydom, C. van der
Waal, A. Rothauge, D. Joubert (t) (2019b): „Methods compendium”, project report: Development of a Bush Information System (BIS) for mapping and quantification of bush encroachment and woody biomass potential in Namibia, BCBU Windhoek, Namibia.
Curtis B.A. & Mannheimer C.A. (2005): “Tree Atlas of Namibia” Windhoek: National Botanical Research Institute.
De Klerk, JN (2004): “Bush Encroachment in Namibia”, Report on phase 1 of the Bush Encroachment Research Monitoring and Management Project. Windhoek: Ministry of Environment and Tourism, Government of Namibia. ISBN 0-86976-620-1.
Gallego, J., Carfagna, E., Baruth, B. (2010): “Accuracy, objectivity and efficiency of remote sensing for agricultural statistics”, in: Benedetti, R., Bee, M., Espa, G., Piersimoni, F. (Eds.), Agricultural Survey Methods. John Wiley & Sons, Chichester, U.K., pp. 193–211.
Gallego, J., Delincé, J. (2010): “The European land use and cover area-frame statistical survey”, in: Benedetti, R., Bee, M., Espa, G., Piersimoni, F. (Eds.), Agricultural Survey Methods. John Wiley & Sons, Chichester, U.K., pp. 151–168.
Global Strategy to improve Agricultural and Rural Statistics (GSARS) (2017): “Handbook on Remote Sensing for Agricultural Statistics”. Rome: GSARS Handbook, 2017.
Government Gazette of the Republic of Namibia (2011): Statistics Act 2011, No. 9 of 2011.Government Gazette No. 4777, 18 August 2011.
Government Gazette of the Republic of Namibia (2015): National Spatial Data Infrastructure Policy. Government Gazette No. 5684, 06 March 2015.
Rothauge A (2014). Controlling encroacher by planned fire. The Namibian, 14 Oct. 2014. http://www.namibian.com.na/indexx.php?id=18903&page_type=story_detail&category_id=1
SAIEA (2016): “Strategic environmental assessment of large-scale bush thinning and value-addition activities in Namibia”. Main Report. Prepared by Southern African Institute for Environmental Assessment, for MAWF/GIZ Support to De-bushing Project.
Smit, G. N. (2014): “BECVOL 3: An expansion of the aboveground biomass quantification model for trees and shrubs to include the wood component”, Afr. J. Range Forage Sci., vol. 31.

Short Report BIS Namibia EFTAS Fernerkundung Technologietransfer GmbH 43 / 51
ANNEX
Annex I – Stakeholder assessment
Summary of the stakeholder discussions held between the 12th and the 16th November 2018 in Windhoek.
Intended list of products Identified key stakeholder demand Current approach
1 Yield (tonne/ha):
a. Woody yield (which needs to capture the woody yield for classes 5-25mm – rangeland management, 2.5-18cm for charcoal productivity, >18cm for forestry services)
• Go / no go decision to harvest, i.e. 15 t/ha extractable biomass
• Assist Directorate of Forestry (DoF) with monitoring Harvesting activities and permit issuance
Expert judgement by means of open VHR data, aerial surveys, or others.
b. Browse (i.e. leaf/twig – unusable for many stakeholders)
Support rangeland management n.n.
2 Canopy cover (% cover/ha for all woody species)
Plan and monitor sustainable balance of bushes, i.e. about 30% clearance,
Expert judgement by means of open VHR data, aerial surveys, or others. 3 Quantity (Bush Equivalents/ha, or ideally
ETTE/ha)
4 Woody species composition Key discrimination of dominating species, or species groups, in order to better estimate harvesting costs and to reduce collateral damage.
Bester maps
5 Tree height (Average/ha for all woody cover)
Both are connected to protect trees with >18 cm DBH. It is expected that anything < 4m height is below 18 cm
On the spot and BecVol
6 Diameter at Breast Height (DBH) (average/ha)
7 Woody cover for the year 2014 (%/ha). If this could be woody yield that would be preferable, but may be unrealistic if no field data is available to validate the product
It is accepted to shift to 2015 given a significantly better EO data coverage.
n.n.
8 Woody cover change between the years 2014 and 2018
Change map between both years to monitor and assess harvesting measures
n.n.
Further demand
• Road network
• River layer
• Digital elevation models
• Soil conditions
To adequately plan harvesting in view to environmentally protected area (>12° slope, along rivers, …) and transport logistics (carriage capacity of roads and tracks, access through other properties, etc.)
Local knowledge, in field, open VHR data

2021-07-20_short report_bis_namibia_v4.2
EFTAS Fernerkundung Technologietransfer GmbH Confidential! 44 / 51
Annex II – Use case assessment
BIS Information Package (Sub-)Issues Procedure Specifications Source Open Issues Request to
I. Harvest - Clearance planning
Support for clearance permit management (application / approval)
Quantification of harvestable biomass at site
Query on
Above Ground Biomass (AGB) → Min / max / mean
→ Highlight / restrict to threshold 45t/ha
AGB > 45 t/ha
(min. 15 t/ha while max. clearance of 30 % in total)
→ Questionable, if this specification is valid for all cases. Other thresholds might be useful as well!
BIS Inception Report (IR), p.10, Table 1
BIS Terms of relevance (TOR), Appendix 2
-
Request for BE per ha BE / ha product turned out to be technically not feasible with given data sources
→ An alternative might be possibly explored
BIS IR, p.10, Table 1
BIS TOR, Appendix 2
Usage of BE (due to poor validation accuracy)
BCBU
Composition of harvestable biomass at site
a) Woody yield classes:
5-25mm – rangeland management,
2.5-18cm for charcoal productivity, >18cm for forestry services
b) Browse (i.e. leaf/twig - unusable for many stakeholders)
Query in DBH
(alternatively, if no approval of DBH product, query on Above Ground Biomass (AGB) + height using Colgan et al., 2012 formula)
Usability of Biomass:
- Query on max, mean, min of DBH / AGB
- Query on AGB > 45t + height > 4m = >18cm DBH
- And invers - <2.5 cm - Browse questionable
BIS IR, p.10, Table 1
Create DBH style (<2.5cm, 2.5-18cn, >18cm)
Usage of DBH (due to poor validation accuracy)
EFTAS
BCBU
Bush coverage at site Query on CC 2015 and 2018 product → Min / max / mean
BIS IR, p.10, Table 1
BIS TOR, Appendix 2
-
Bush encroachment degree at site
Query on (intermediate) “BE degree map”
Bush encroachment given, if BE / ha of encroacher species exceeds twice the long-term average rainfall (mm / year).
If area more woody or with sandy, dystrophic soils only problematic if BE / ha exceeds three times the long-term average rainfall (mm / year).
BIS TOR, Appendix 2 Create “BE degree map” (binary info) taking into account soil and rainfall
Data on sandy soils can be derived from ISRIC soil database
EFTAS

2021-07-20_short report_bis_namibia_v4.2
EFTAS Fernerkundung Technologietransfer GmbH Confidential! 45 / 51
BIS Information Package (Sub-)Issues Procedure Specifications Source Open Issues Request to
NES & AC
Dominating species at site Product currently not feasible BIS IR, p.10, Table 1
BIS TOR, Appendix 2
Currently not feasible. Maybe output from probability maps by Cornelis
NES & AC
II. Transport logistics: Harvesting site & accessibility
Road carriage capacities
Query on classified road network layer
Classes: Trunk roads N11 / Main roads N11 / District Roads N11 / Tracks
BIS IR, p.10, Table 1
BIS TOR, Appendix 2
Proposal to verify: Include road types in reports as additional map
Amount of road length / type for AOI useful?
NES & AC
Distance to market / off-taker / other relevant infrastructure
Queries not directly within the WebGIS
- BIS TOR, Appendix 2 Not feasible. WMS services can be used in QGIS for further analysis
III. Environmental protection: Harvesting site location
Protection regulations: size of bush/tree
Query on DBH
DBH >18cm
Alternatively: No harvesting if height > 4m (based on the assumption that DBH is < 18cm for all trees < 4m)
BIS IR, p.10, Table 1
Protection regulations: terrain
Query on slope at harvesting site (DEM)
No harvesting if slope > 12.5 % BIS IR, p.10, Table 1
Protection regulations: location
Query on river proximity layer
Distance to river >100m BIS IR, p.10, Table 1
IV. Efficiency assessment of harvesting / clearing activities
Evaluation / Monitoring of biomass changes at sites
Query on difference of products 2018 vs. 2015
BIS IR, p.10, Table 1
BIS TOR, Appendix 2

2021-07-20_short report_bis_namibia_v4.2
EFTAS Fernerkundung Technologietransfer GmbH Confidential! 46 / 51
Annex III – List of BIS field survey parameter
Annex III.I Sample plot survey application
Collection of general parameters (land use, accessibility, topography,…) and woody vegetation parameters in sample plots of 50x50m
Name Description Choices
Header parameters
survey_date Date of survey Date
surveyor_id Surveyor ID Unique ID from list e.g. D2
sample_id Sample ID Selection from list of sample IDs e.g.: 9358_7165
plot_id Plot ID Selection from list of plot IDs: e.g.: A1
full_census Full census plot? Yes or No
Accessibility of sample plot
access Is the sample plot accessible and observed?
Yes or No
ac_rem Remarks on accessibility Free text
ac_reason In case the plot / quadrant was not observed, provide the reasons why!
No or bad, broken road/path
Seasonally flooded areas/riversides
River / wetland
Gully / Cliff / Slope
Fence / Wall
Restricted area / Authority needed
Other reason
ac_other Provide other reason for not accessing the plot.
Free text
sub_sam Subsampling with 4 times 10x10m plots required?
Yes or No
sub_id Subsample plot ID
Subsample 1
Subsample 2
Subsample 3
Subsample 4
GPS waypoints and photos of plot
Corner_GPS GPS waypoint at all 4 corners GPS waypoint: Long / Lat, Altitude, Accuracy
Corner_Photo
Take a photo of each marked corner Photo(s)
Centre_GPS GPS waypoint at centre of plot (position from which landscape photos were taken)
GPS waypoint: Long / Lat, Altitude, Accuracy
Landscape_photos
Landscape photo from centre of plot in all 4 cardinal directions
Photo(s)

2021-07-20_short report_bis_namibia_v4.2
EFTAS Fernerkundung Technologietransfer GmbH Confidential! 47 / 51
Topography and surface
topo_type Describe topography at the sample plot
level (flat)
undulating
hilly
mountainous
topo_slope Enter slope at sample plot
0 to 5
>5 to 10
>10 to 15
>15 to 30
>30 to 60
>60
topo_expo Exposition
North
North-East
East
South-East
South
South-West
West
North-West
not relevant
stones Rocks or gravel on the surface?
rocks > 6 cm
gravel > 2 cm
no gravel or rocks
stones_pct Percentage of stones and/or gravel on the surface
None (0 %)
1 to 10 %
11 to 20 %
21 to 30 %
31 to 40 %
41 to 50 %
51 to 60 %
61 to 70 %
71 to 80 %
81 to 90 %
91 to 100%
unknown
topo_text Other remarks on topography or soil condition
Free text
Land use and site description
lu Land use of the sample plot
commercial livestock
commercial livestock & game (mixed)
commercial game
communal conservancy (mixed)
commercial conservancy (mixed)
protected area
state forest
communal forests
communal rangeland - open access = unfenced
communal rangeland - for private use / under managerial control = fenced
built-up areas
agriculture rainfed
agriculture irrigated
subsistence agriculture

2021-07-20_short report_bis_namibia_v4.2
EFTAS Fernerkundung Technologietransfer GmbH Confidential! 48 / 51
other use
unknown
lu_remarks Remarks on land use Free text
clear Signs of debushing / clearance at the plot
clearance full
clearance partially
clearance selective
none
unknown
clear_meth If yes, method of clearance
chemical
mechanical
arboricide
unknown
not relevant
clear_rem Remarks on clearance or actual encroachment
Free text
remarks Other relevant remarks on survey plot and differences to field map.
Free text
Vegetation structure of sampled plot
pl_closure Tree/bush closure in %
None (0 %)
1 to 10 %
11 to 20 %
21 to 30 %
31 to 40 %
41 to 50 %
51 to 60 %
61 to 70 %
71 to 80 %
81 to 90 %
91 to 100%
Information on up to 5 different woody layers
wl_x_sp Layer_x most abundant species
A. luederitzii
A. mellifera
A. nilotica
A. reficiens
C. mopane
Dichrostachys cinerea
Rhigozum trichotomum
Terminalia prunioides
Terminalia sericea
Other
No woody vegetation in plot
wl_x_oth_species
Other species name if not in the list Free text
wl_x_height Woody layer_x average height in m number
wl_x_num Number of all woody individuals in Layer_x
number
wl_x_cov Woody layer_x canopy closure in % 1 to 10 %
11 to 20 %

2021-07-20_short report_bis_namibia_v4.2
EFTAS Fernerkundung Technologietransfer GmbH Confidential! 49 / 51
21 to 30 %
31 to 40 %
41 to 50 %
51 to 60 %
61 to 70 %
71 to 80 %
81 to 90 %
91 to 100%
wl_x_rem Remarks on woody layer_X Free text
record_w_x Record another woody layer? Yes or No
Total number of species individuals >0.75m
num_al A. luederitzii number
num_am A. mellifera number
num_an A. nolitica number
num_ar A. reficiens number
num_cm C. mopane number
num_dc Dichrostachys cinerea number
num_rt Rhigozum trichotomum number
num_tp Terminalia prunioides number
num_ts Terminalia sericea number
num_oth Other species number
num_dead Dead woody plants number
Count_photo
Take a photo of the filled census paper form
Up to 4 photos of the filled census matrix

2021-07-20_short report_bis_namibia_v4.2
EFTAS Fernerkundung Technologietransfer GmbH Confidential! 50 / 51
Annex III.II BECVOL parameters application
Recording relevant BECVOL parameters for individual trees / bushes in the sample plot.
Name Description Choices
Surveyor and sample identification
survey_date Date of survey Date
surveyor_id Surveyor ID Unique ID from list e.g. Su21
sample_id Sample ID Selection from list of sample IDs e.g.: 9358_7165
plot_id Plot ID Selection from list of plot IDs: e.g.: A1
sub_id Subsample plot ID if applied
Subsample 1
Subsample 2
Subsample 3
Subsample 4
BECVOL records for individual trees
tx_layer Select the woody layer the tree/bush
belongs to
Woody Layer 1
Woody Layer 2
Woody Layer 3
Woody Layer 4
Woody Layer 5
Woody Layer 6
Full census trees > 4m
tx_species Species name of tree x
A. erioloba
A. erubescens
A. fleckii
A. karroo
A. luederitzii
A. mellifera
A. nebrownii
A. nolitica
A. reficiens
Albizia anthelmintica
Baphia massaiensis
Boscia albitrunca
Catophractes alexandri
C. mopane
Combretum apiculatum
Dichrostachys cinerea
Grewia flava
Philenoptera nelsii
Pterocarpus angolensis

2021-07-20_short report_bis_namibia_v4.2
EFTAS Fernerkundung Technologietransfer GmbH Confidential! 51 / 51
Rhigozum trichotomum
Tarchonanthus camphoratus
Terminalia prunioides
Terminalia sericea
Other
Unknown
tx_oth_sp Enter other species name not in list Free text
tx_photo Photo of tree/bush Photo
tx_A_heigh
t Height of tree (A) in m Number
tx_B_heigh
t Height of max canopy diameter (B) in m Number
tx_C_heig
ht Height of first leaves (C) in m Number
Canopy at maximum diameter D (two measurements a & b)
tx_Da_dia
m Canopy at max diameter (Da) in m Number
tx_Db_dia
m Canopy at max diameter (Db) in m Number
tx_D_diam
_av Calculated average Canopy D (tx_Da_diam + tx_Db_diam)*2
Canopy diameter at first leaves E1 (two measurements a & b)
tx_E1a_dia
m
Canopy diameter at first leaves (E1a) in
m Number
tx_E1b_dia
m
Canopy diameter at first leaves (E1b) in
m Number
tx_E1_dia
m_av
Calculated average Canopy diameter at
first leaves E (tx_E1a_diam + tx_E1b_diam)*2
Diameter of stem above ground E (two measurements a & b)
tx_Ea_cm Diameter of stem (Ea) in cm Number
tx_Eb_cm Diameter of stem (Eb) in cm Number
tx_E_av_c
m
Calculated average diameter of stem
(Eb) in cm (tx_Ea_diam + tx_Eb_diam)*2
GPS waypoint
tx_gps_wp GPS waypoint position of sample tree/bush GPS waypoint: Long / Lat, Altitude, Accuracy