Development indicators Gianni Vaggi University of Pavia September 2013
26
Development indicators Gianni Vaggi University of Pavia September 2013 On the causes of economic growth
-
Upload
baker-harmon -
Category
Documents
-
view
22 -
download
0
description
Development indicators Gianni Vaggi University of Pavia September 2013. On the causes of economic growth. US employment, major sectors. GDP by sector in East South Africa Source: Schoening 2007. Data from African Development Bank, Selected Statistics on African Countries 2007. - PowerPoint PPT Presentation
Transcript of Development indicators Gianni Vaggi University of Pavia September 2013

Development indicators
Gianni VaggiUniversity of Pavia September 2013
On the causes of economic growth

US employment, major sectors

GDP by sector in East South AfricaSource: Schoening 2007. Data from African Development Bank, Selected Statistics on African Countries 2007
0% 20% 40% 60% 80% 100%
East South Africa
Zimbabwe
Zambia
Uganda
Sudan
Seychelles
Rwanda
Mauritius
Malawi
Madagascar
Kenya
Ethiopia
Eritrea
Djibouti
Comoros
Burundi
Share of GDP
Agriculture Industry without Manufacturing Manufacturing Services


1960
1961
1962
1963
1964
1965
1966
1967
1968
1969
1970
1971
1972
1973
1974
1975
1976
1977
1978
1979
1980
1981
1982
1983
1984
1985
1986
1987
1988
1989
1990
1991
1992
1993
1994
1995
1996
1997
1998
1999
2000
2001
2002
2003
2004
2005
2006
2007
2008
2009
2010
0
5
10
15
20
25
30
35
40
45
50
Gross fixed capital formation (% of GDP)
BRA
RUS
IND
CHN
SAF
EAS

Primary Completion Rate, total (% relevant age group)
30
40
50
60
70
80
90
100
110
1970
1972
1974
1976
1978
1980
1982
1984
1986
1988
1990
1992
1994
1996
1998
2000
2002
2004
2006
2008
2010
East Asia & Pacific (all income levels)
Europe & Central Asia (all income levels)
Latin America & Caribbean (all incomelevels)
Middle East & North Africa (all incomelevels)
North America
Sub-Saharan Africa (all income levels)
South Asia

Patent Application, residents
0
100000
200000
300000
400000
500000
600000
700000
800000
900000
1960
1963
1966
1969
1972
1975
1978
1981
1984
1987
1990
1993
1996
1999
2002
2005
2008
2011
East Asia & Pacific (all income levels)
Europe & Central Asia (all income levels)
Latin America & Caribbean (all incomelevels)
Sub-Saharan Africa (all income levels)
North America
Sub-Saharan Africa (all income levels)Patent applications, residents
South Asia

GDP Growth rates
-30
-20
-10
0
10
20
30
1961
1963
1965
1967
1969
1971
1973
1975
1977
1979
1981
1983
1985
1987
1989
1991
1993
1995
1997
1999
2001
2003
2005
2007
2009
2011
China
Korea, Rep.
Mexico
Brazil
South Africa
Vietnam
Malaysia
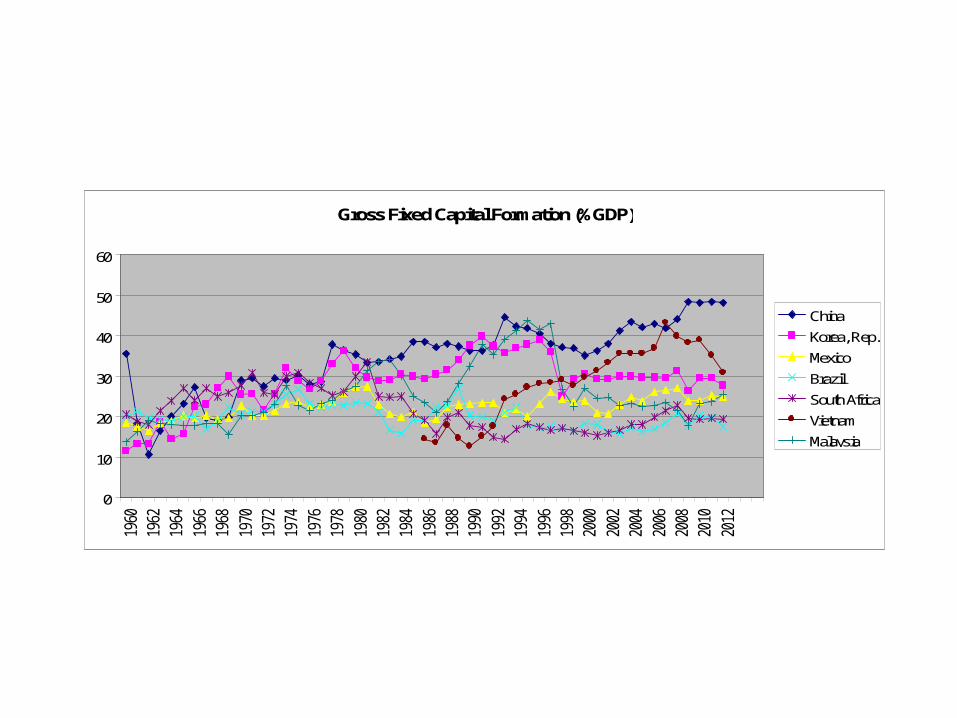
Gross Fixed Capital Formation (%GDP)
0
10
20
30
40
50
60
1960
1962
1964
1966
1968
1970
1972
1974
1976
1978
1980
1982
1984
1986
1988
1990
1992
1994
1996
1998
2000
2002
2004
2006
2008
2010
2012
China
Korea, Rep.
Mexico
Brazil
South Africa
Vietnam
Malaysia

Manufacture, valued added (constant LCU)
0
5E+13
1E+14
1,5E+14
2E+14
2,5E+14
3E+14
3,5E+14
1960
1962
1964
1966
1968
1970
1972
1974
1976
1978
1980
1982
1984
1986
1988
1990
1992
1994
1996
1998
2000
2002
2004
2006
2008
2010
2012
China
Korea, Rep.
Mexico
Brazil
South Africa
Vietnam
Malaysia

BRICS Capital accumulation


The Asian Miracle•World Bank 1993
•UNCTAD Trade and Development Report 1996, 1997,
•Robert Wade Governing the market, 1990

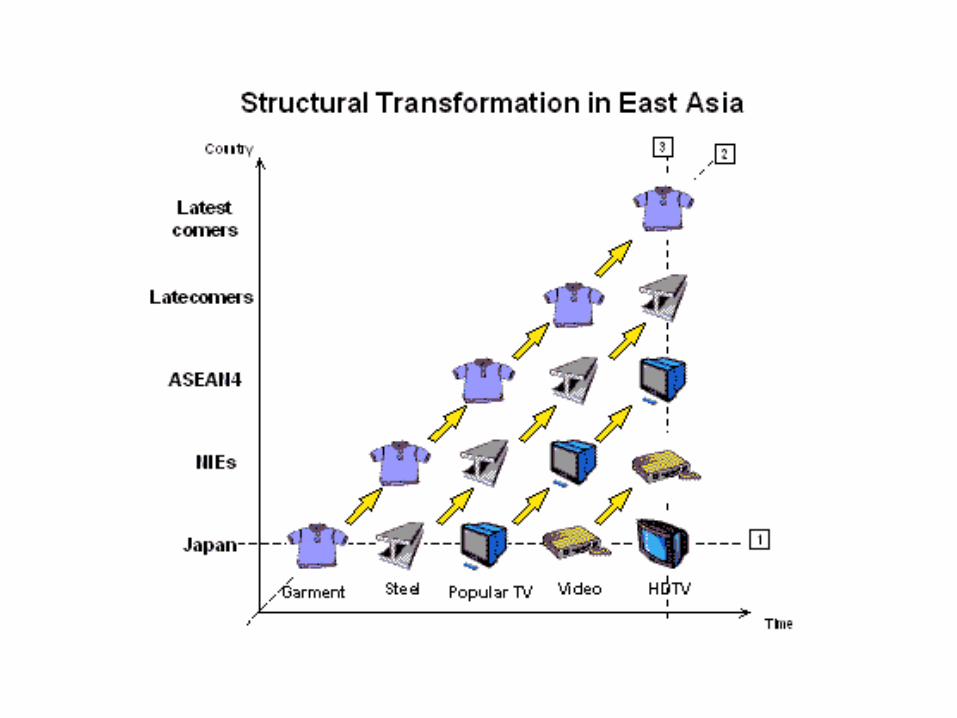
The Flying Geese Model (AKamatsu 1958)
The engine for growth-1
The role of the governments:– Policies ensuring macroeconomic stability– Government and financial markets– Policies promoting equality(education, land reform)

The engine for growth-2
•The profit-saving-investmenet nexus
•Industrial policies (promoting accumulation of physical and human capital)
•activities (altering the allocation of resources) Export promotion-SEZ