
DEVELOPMENT IN THE AMERICAS Better Spending for Better Lives
24
Better Spending for Better Lives Edited by Alejandro Izquierdo, Carola Pessino, and Guillermo Vuletin DEVELOPMENT IN THE AMERICAS How Latin America and the Caribbean Can Do More with Less Chapter 1
Transcript of DEVELOPMENT IN THE AMERICAS Better Spending for Better Lives
Better Spending for Better Lives
Edited byAlejandro Izquierdo,Carola Pessino, and Guillermo Vuletin
DEVELOPMENT IN THE AMERICAS
How Latin America and the Caribbean CanDo More with Less
Chapter 1

Better Spending forBetter LivesHow Latin America and the Caribbean Can Do More with Less
This chapter is part of an upcoming IDB flagship publication on public spending. Sign up to be among
the first to receive a free copy of the book: www.iadb.org/DIA2018spending

Public Spending: From Bigger to Better
Since the early 1900s, the role of governments and their participation in the economy has steadily increased around the world. Typical ratios of pub-lic spending to gross domestic product (GDP) have crept up from about 5 percent in the early 1900s to about 22 percent in 2018. Government par-ticipation is almost twice as large in the developed world as in developing countries, including in Latin America and the Caribbean (40 percent vs 20 percent of GDP, respectively). The latest commodity boom of the 2000s pushed the size of government to 25 percent in Latin America and the Caribbean as a whole, and to 30 percent in the LAC-7 (that is, the seven largest regional economies) plus commodity producers. Moreover, follow-ing the Great Recession in the United States and its repercussions in the developing world, many countries in the region followed expansionary pol-icies in an effort to bolster aggregate demand. However, many of these expansionary policies, which were considered countercyclical at the time, led to permanent increases in expenditure, mostly through higher wages and transfers, which are very difficult to reverse.
This upward spending trend raises the question, how large should gov-ernment participation in the economy be? The answer depends on a myriad of issues ranging from ideological and economic to demographic. However, a key determinant is the country’s degree of economic development, typically proxied by GDP per capita. In a nutshell—and following the so-called Wag-ner’s Law—as GDP per capita increases, public spending tends to increase, both at the extensive margin (i.e., new activities and services are undertaken) and intensive margin (i.e., existing activities and services are expanded).
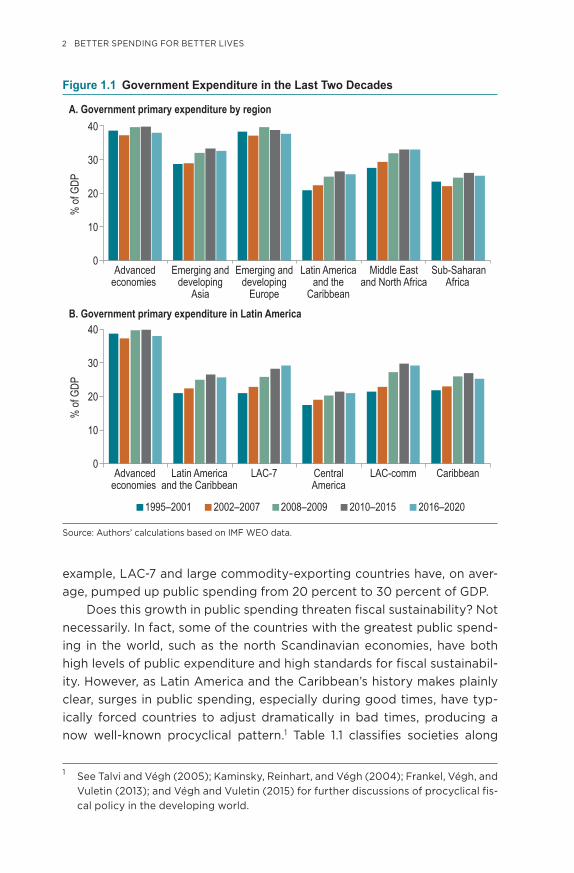
Focusing on the more recent past, since the mid-1990s, the speed of public spending growth has varied widely across regions and groups of countries in the world (see Figure 1.1, Panels A and B). Specifically, as shown in Figure 1B, public spending has increased relatively rapidly in Latin American economies and those with large commodity-exporting sectors, compared to Central American and Caribbean economies. For
1
2 BETTER SPENDING FOR BETTER LIVES
example, LAC-7 and large commodity-exporting countries have, on aver-age, pumped up public spending from 20 percent to 30 percent of GDP.
Does this growth in public spending threaten fiscal sustainability? Not necessarily. In fact, some of the countries with the greatest public spend-ing in the world, such as the north Scandinavian economies, have both high levels of public expenditure and high standards for fiscal sustainabil-ity. However, as Latin America and the Caribbean’s history makes plainly clear, surges in public spending, especially during good times, have typ-ically forced countries to adjust dramatically in bad times, producing a now well-known procyclical pattern.1 Table 1.1 classifies societies along
1 See Talvi and Végh (2005); Kaminsky, Reinhart, and Végh (2004); Frankel, Végh, and Vuletin (2013); and Végh and Vuletin (2015) for further discussions of procyclical fis-cal policy in the developing world.
Figure 1.1 Government Expenditure in the Last Two Decades%
of G
DP
20
0
10
30
40
Advancedeconomies
Emerging anddeveloping
Asia
Emerging anddeveloping
Europe
Latin Americaand the
Caribbean
Middle Eastand North Africa
Sub-SaharanAfrica
% of
GDP
20
0
10
30
40
Advancedeconomies
Latin Americaand the Caribbean
LAC-7 CentralAmerica
LAC-comm Caribbean
A. Government primary expenditure by region
1995–2001
B. Government primary expenditure in Latin America
2002–2007 2008–2009 2010–2015 2016–2020
Source: Authors’ calculations based on IMF WEO data.
PUBLIC SPENDING: FROM BIGGER TO BETTER 3
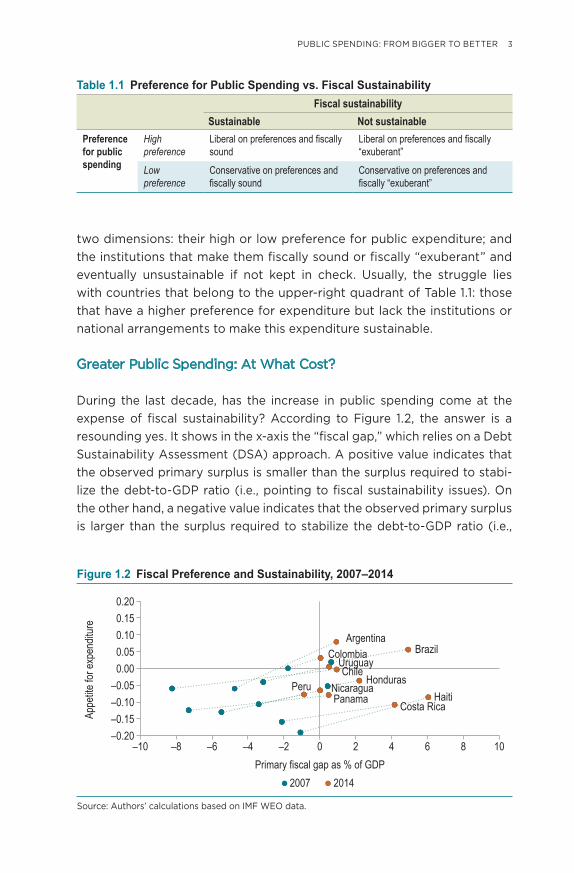
two dimensions: their high or low preference for public expenditure; and the institutions that make them fiscally sound or fiscally “exuberant” and eventually unsustainable if not kept in check. Usually, the struggle lies with countries that belong to the upper-right quadrant of Table 1.1: those that have a higher preference for expenditure but lack the institutions or national arrangements to make this expenditure sustainable.
Greater Public Spending: At What Cost?
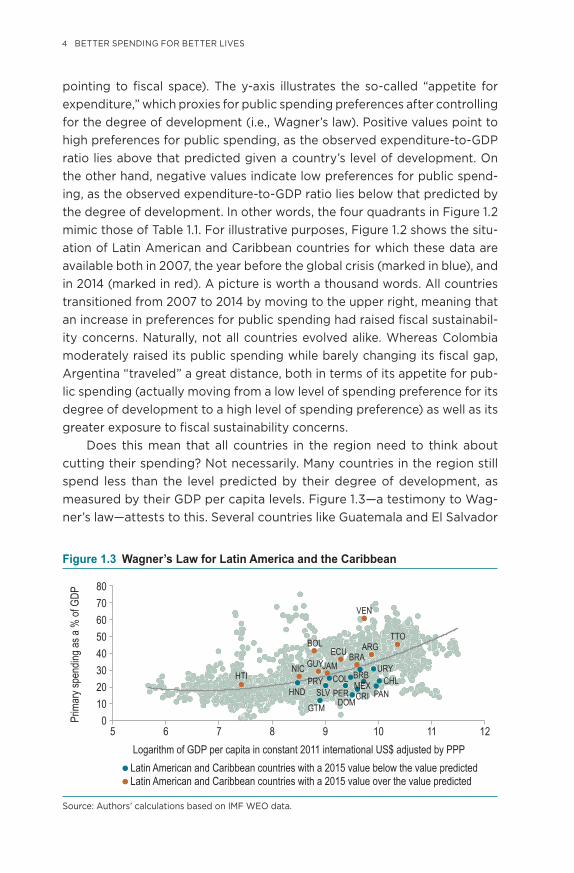
During the last decade, has the increase in public spending come at the expense of fiscal sustainability? According to Figure 1.2, the answer is a resounding yes. It shows in the x-axis the “fiscal gap,” which relies on a Debt Sustainability Assessment (DSA) approach. A positive value indicates that the observed primary surplus is smaller than the surplus required to stabi-lize the debt-to-GDP ratio (i.e., pointing to fiscal sustainability issues). On the other hand, a negative value indicates that the observed primary surplus is larger than the surplus required to stabilize the debt-to-GDP ratio (i.e.,
Table 1.1 Preference for Public Spending vs. Fiscal SustainabilityFiscal sustainability
Sustainable Not sustainablePreference for public spending
High preference
Liberal on preferences and fiscally sound
Liberal on preferences and fiscally “exuberant”
Low preference
Conservative on preferences and fiscally sound
Conservative on preferences and fiscally “exuberant”
Figure 1.2 Fiscal Preference and Sustainability, 2007–2014
Appe
tite fo
r exp
endit
ure
–0.20–0.15–0.10–0.050.000.050.100.150.20
–10 –8 –6 –4 –2 0Primary fiscal gap as % of GDP
2 4 6 8 10
2007 2014
ArgentinaBrazil
ChileColombia
Costa Rica
HondurasHaiti
NicaraguaPanama
Peru
Uruguay
Source: Authors’ calculations based on IMF WEO data.
4 BETTER SPENDING FOR BETTER LIVES
pointing to fiscal space). The y-axis illustrates the so-called “appetite for expenditure,” which proxies for public spending preferences after controlling for the degree of development (i.e., Wagner’s law). Positive values point to high preferences for public spending, as the observed expenditure-to-GDP ratio lies above that predicted given a country’s level of development. On the other hand, negative values indicate low preferences for public spend-ing, as the observed expenditure-to-GDP ratio lies below that predicted by the degree of development. In other words, the four quadrants in Figure 1.2 mimic those of Table 1.1. For illustrative purposes, Figure 1.2 shows the situ-ation of Latin American and Caribbean countries for which these data are available both in 2007, the year before the global crisis (marked in blue), and in 2014 (marked in red). A picture is worth a thousand words. All countries transitioned from 2007 to 2014 by moving to the upper right, meaning that an increase in preferences for public spending had raised fiscal sustainabil-ity concerns. Naturally, not all countries evolved alike. Whereas Colombia moderately raised its public spending while barely changing its fiscal gap, Argentina “traveled” a great distance, both in terms of its appetite for pub-lic spending (actually moving from a low level of spending preference for its degree of development to a high level of spending preference) as well as its greater exposure to fiscal sustainability concerns.
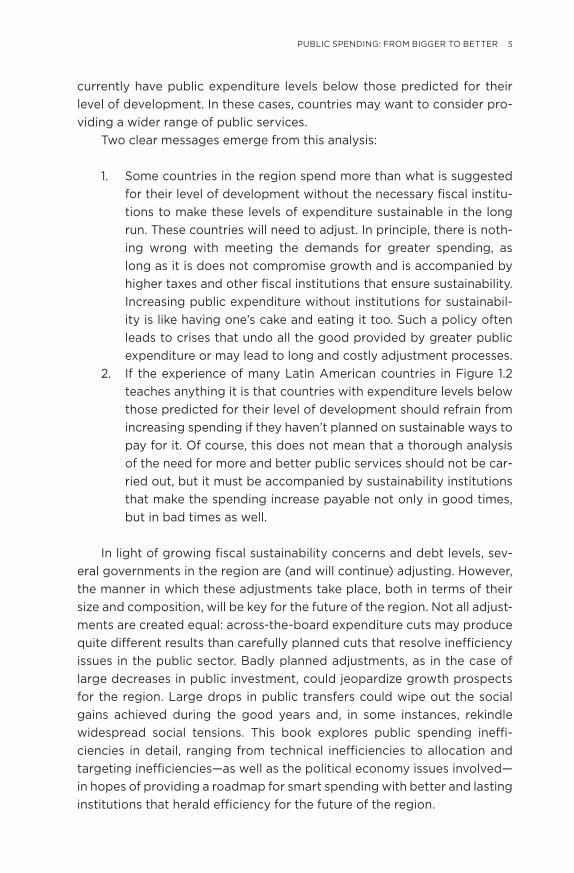
Does this mean that all countries in the region need to think about cutting their spending? Not necessarily. Many countries in the region still spend less than the level predicted by their degree of development, as measured by their GDP per capita levels. Figure 1.3—a testimony to Wag-ner’s law—attests to this. Several countries like Guatemala and El Salvador
Figure 1.3 Wagner’s Law for Latin America and the Caribbean
Prim
ary s
pend
ing as
a %
of G
DP
Logarithm of GDP per capita in constant 2011 international US$ adjusted by PPP
01020304050607080
5 6 7 8 9 10 11 12
Latin American and Caribbean countries with a 2015 value below the value predicted Latin American and Caribbean countries with a 2015 value over the value predicted
HTIHND
NIC JAMGUYBRAECU ARGBOL
TTO
VEN
GTM DOMCRI PANPERSLVMEX CHLPRY COL BRB
URY
Source: Authors’ calculations based on IMF WEO data.
PUBLIC SPENDING: FROM BIGGER TO BETTER 5
currently have public expenditure levels below those predicted for their level of development. In these cases, countries may want to consider pro-viding a wider range of public services.
Two clear messages emerge from this analysis:
1. Some countries in the region spend more than what is suggested for their level of development without the necessary fiscal institu-tions to make these levels of expenditure sustainable in the long run. These countries will need to adjust. In principle, there is noth-ing wrong with meeting the demands for greater spending, as long as it is does not compromise growth and is accompanied by higher taxes and other fiscal institutions that ensure sustainability. Increasing public expenditure without institutions for sustainabil-ity is like having one’s cake and eating it too. Such a policy often leads to crises that undo all the good provided by greater public expenditure or may lead to long and costly adjustment processes.
2. If the experience of many Latin American countries in Figure 1.2 teaches anything it is that countries with expenditure levels below those predicted for their level of development should refrain from increasing spending if they haven’t planned on sustainable ways to pay for it. Of course, this does not mean that a thorough analysis of the need for more and better public services should not be car-ried out, but it must be accompanied by sustainability institutions that make the spending increase payable not only in good times, but in bad times as well.
In light of growing fiscal sustainability concerns and debt levels, sev-eral governments in the region are (and will continue) adjusting. However, the manner in which these adjustments take place, both in terms of their size and composition, will be key for the future of the region. Not all adjust-ments are created equal: across-the-board expenditure cuts may produce quite different results than carefully planned cuts that resolve inefficiency issues in the public sector. Badly planned adjustments, as in the case of large decreases in public investment, could jeopardize growth prospects for the region. Large drops in public transfers could wipe out the social gains achieved during the good years and, in some instances, rekindle widespread social tensions. This book explores public spending ineffi-ciencies in detail, ranging from technical inefficiencies to allocation and targeting inefficiencies—as well as the political economy issues involved—in hopes of providing a roadmap for smart spending with better and lasting institutions that herald efficiency for the future of the region.

6 BETTER SPENDING FOR BETTER LIVES
Even if cuts are not needed from a sustainability point of view—the privilege of a few countries in the region—governments should nonethe-less battle gross inefficiencies in public expenditure. A key concern in many Latin American countries is that as they reach the middle-income devel-opment stage, citizens begin to demand new and better services, ranging from access to high quality tertiary education to better health care. Yet, in the context of low growth, there is little room for increasing expendi-ture to satisfy these demands; instead, governments need to do more with the same resources. This means obtaining efficiency gains in many areas of government so that resources can be freed up and put to better use to meet new demands.
Even when countries plan to expand expenditures—as would be the case when ratios of public expenditure to GDP drop below those sug-gested by Wagner’s law—it is important to focus on efficiency gains. Usually, countries with low spending levels for their stage of devel-opment find it difficult to raise taxes to finance higher expenditures. Typically, their citizens are unwilling to pay higher taxes as they don’t believe their governments will spend those additional resources effi-ciently by providing them the services they need. Thus, a precondition for tax increases and higher spending seems to be a government’s abil-ity to deliver efficient services and leave nothing to waste. Citizens that trust their governments may be willing to pay for services, particularly those that take more time to deliver, as is the case of education or infra-structure (see Chapter 10).
Composition of Public Expenditure
The most common approach to analyzing the participation of the pub-lic sector in the economy is to focus on the level of public spending. This focus is also used to answer questions about public spending sus-tainability, or how public spending is financed, as well as issues related to social demands for publicly provided goods. However, a less explored, but equally relevant, approach to complement the analysis focuses on the composition of public spending. The framework based on the amount of spending can shed light on people’s preferences for public expenditure and the size of government. Yet, it provides little information about which expenditures are prioritized, or how they are combined to achieve effi-ciency and equity objectives. The level of total spending does not indicate whether a government is investing much or little, whether it is actively pursuing redistributive policy, or whether it spends more on health, edu-cation, or infrastructure. Nor does it answer whether expenditures on
PUBLIC SPENDING: FROM BIGGER TO BETTER 7
public employees are high, whether retirees receive reasonable pensions, or whether money is well spent on poverty reduction programs.
To study public spending composition, spending must be classified. Two widely used classifications distinguish spending components by their function or purpose and by economic characteristics. The former is called the functional classification of government expenditure and it breaks total expenditure into categories such as health care, education, and defense. The latter is called the economic classification of government expenditure; it separates total spending into current and capital expenditure. Usually, the literature looks at determinants of public spending composition using the first classification. In an interesting contribution, Shelton (2007) tests the relevance of several leading hypotheses on determinants of public spending using a double disaggregation: i) by categories of spending (i.e., health, education, and defense), and ii) by level of government (i.e., central and local). The results suggest that much of the expenditure associated with greater trade openness is not in categories that explicitly insure for risk, and there is evidence that both political access and income inequality affect the extent of social insurance. However, to date little has been done to analyze the determinants of public spending composition using the eco-nomic classification view. This chapter strives to fill that gap by looking into current versus capital public spending trends and their determinants, including some novel variables such as trust in government.
Today vs. Tomorrow: Current vs. Capital Spending
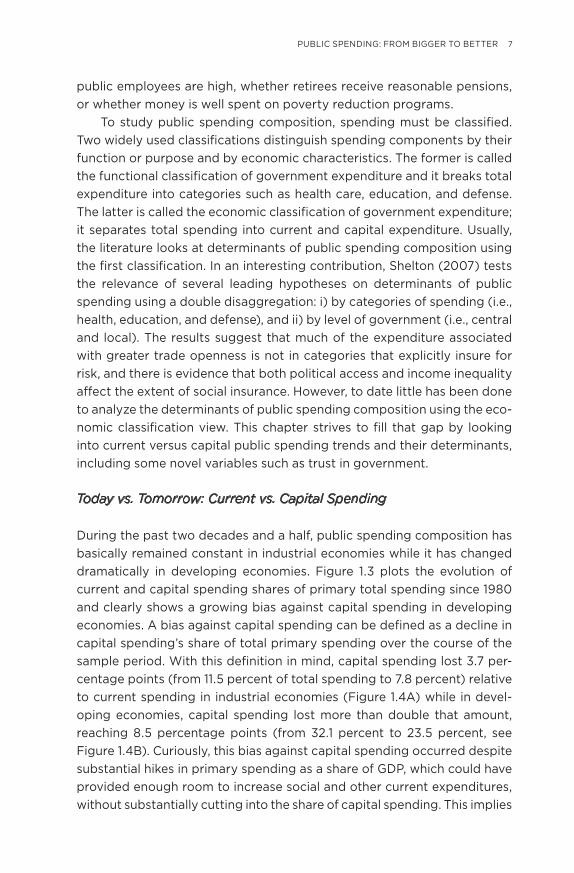
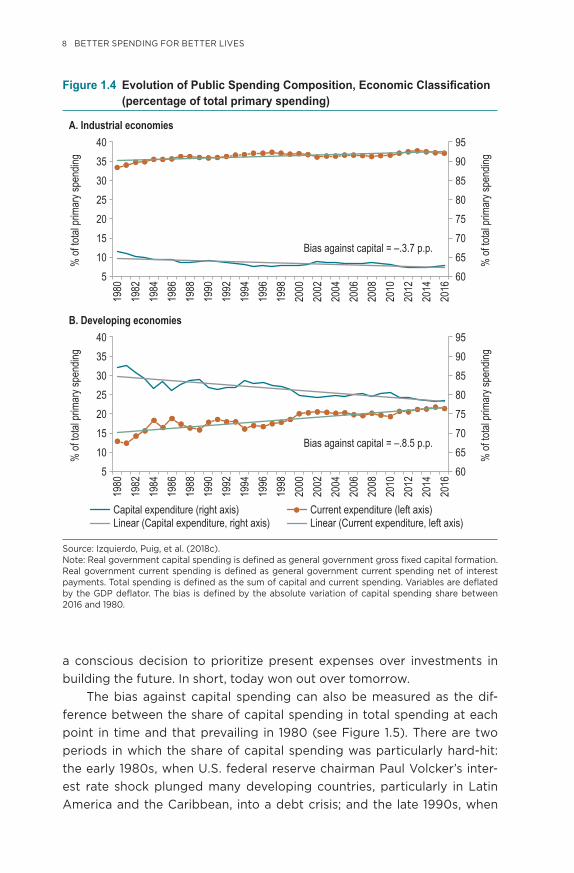
During the past two decades and a half, public spending composition has basically remained constant in industrial economies while it has changed dramatically in developing economies. Figure 1.3 plots the evolution of current and capital spending shares of primary total spending since 1980 and clearly shows a growing bias against capital spending in developing economies. A bias against capital spending can be defined as a decline in capital spending’s share of total primary spending over the course of the sample period. With this definition in mind, capital spending lost 3.7 per-centage points (from 11.5 percent of total spending to 7.8 percent) relative to current spending in industrial economies (Figure 1.4A) while in devel-oping economies, capital spending lost more than double that amount, reaching 8.5 percentage points (from 32.1 percent to 23.5 percent, see Figure 1.4B). Curiously, this bias against capital spending occurred despite substantial hikes in primary spending as a share of GDP, which could have provided enough room to increase social and other current expenditures, without substantially cutting into the share of capital spending. This implies
8 BETTER SPENDING FOR BETTER LIVES
a conscious decision to prioritize present expenses over investments in building the future. In short, today won out over tomorrow.
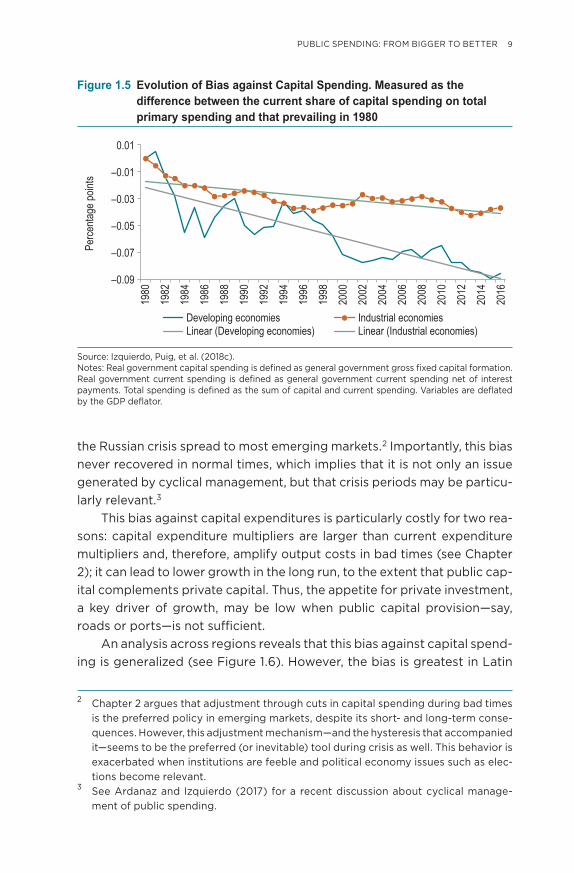
The bias against capital spending can also be measured as the dif-ference between the share of capital spending in total spending at each point in time and that prevailing in 1980 (see Figure 1.5). There are two periods in which the share of capital spending was particularly hard-hit: the early 1980s, when U.S. federal reserve chairman Paul Volcker’s inter-est rate shock plunged many developing countries, particularly in Latin America and the Caribbean, into a debt crisis; and the late 1990s, when
Figure 1.4 �Evolution�of�Public�Spending�Composition,�Economic�Classification�(percentage of total primary spending)
Capital expenditure (right axis)
Bias against capital = –.8.5 p.p.
Bias against capital = –.3.7 p.p.
Current expenditure (left axis) Linear (Capital expenditure, right axis) Linear (Current expenditure, left axis)
% of
total
prim
ary s
pend
ing
40
5101520253035
% of
total
prim
ary s
pend
ing
60 65 70 75 80 85 90 95
1980
19
82
1984
19
86
1988
19
90
1992
19
94
1996
19
98
2000
20
02
2004
20
06
2008
20
10
2012
20
14
2016
% of
total
prim
ary s
pend
ing
40
5101520253035
% of
total
prim
ary s
pend
ing60 65 70 75 80 85 90 95
1980
19
82
1984
19
86
1988
19
90
1992
19
94
1996
19
98
2000
20
02
2004
20
06
2008
20
10
2012
20
14
2016
A. Industrial economies
B. Developing economies
Source: Izquierdo, Puig, et al. (2018c). Note: Real government capital spending is defined as general government gross fixed capital formation. Real government current spending is defined as general government current spending net of interest payments. Total spending is defined as the sum of capital and current spending. Variables are deflated by the GDP deflator. The bias is defined by the absolute variation of capital spending share between 2016 and 1980.
PUBLIC SPENDING: FROM BIGGER TO BETTER 9
the Russian crisis spread to most emerging markets.2 Importantly, this bias never recovered in normal times, which implies that it is not only an issue generated by cyclical management, but that crisis periods may be particu-larly relevant.3
This bias against capital expenditures is particularly costly for two rea-sons: capital expenditure multipliers are larger than current expenditure multipliers and, therefore, amplify output costs in bad times (see Chapter 2); it can lead to lower growth in the long run, to the extent that public cap-ital complements private capital. Thus, the appetite for private investment, a key driver of growth, may be low when public capital provision—say, roads or ports—is not sufficient.
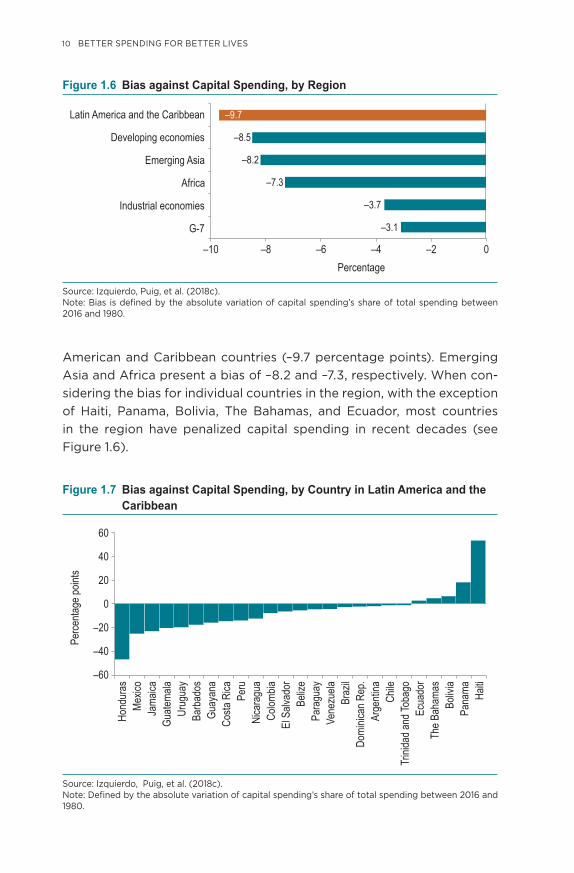
An analysis across regions reveals that this bias against capital spend-ing is generalized (see Figure 1.6). However, the bias is greatest in Latin
Figure 1.5 Evolution of Bias against Capital Spending. Measured as the difference between the current share of capital spending on total primary spending and that prevailing in 1980
Developing economies Industrial economies Linear (Developing economies) Linear (Industrial economies)
Perce
ntage
point
s
1980
1982
1984
1986
1988
1990
1992
1994
1996
1998
2000
2002
2004
2006
2008
2010
2012
2014
2016
–0.09
–0.07
–0.05
–0.03
–0.01
0.01
Source: Izquierdo, Puig, et al. (2018c). Notes: Real government capital spending is defined as general government gross fixed capital formation. Real government current spending is defined as general government current spending net of interest payments. Total spending is defined as the sum of capital and current spending. Variables are deflated by the GDP deflator.
2 Chapter 2 argues that adjustment through cuts in capital spending during bad times is the preferred policy in emerging markets, despite its short- and long-term conse-quences. However, this adjustment mechanism—and the hysteresis that accompanied it—seems to be the preferred (or inevitable) tool during crisis as well. This behavior is exacerbated when institutions are feeble and political economy issues such as elec-tions become relevant.
3 See Ardanaz and Izquierdo (2017) for a recent discussion about cyclical manage-ment of public spending.
10 BETTER SPENDING FOR BETTER LIVES
American and Caribbean countries (–9.7 percentage points). Emerging Asia and Africa present a bias of –8.2 and –7.3, respectively. When con-sidering the bias for individual countries in the region, with the exception of Haiti, Panama, Bolivia, The Bahamas, and Ecuador, most countries in the region have penalized capital spending in recent decades (see Figure 1.6).
Figure 1.6 Bias against Capital Spending, by Region
Percentage–10 –8 –6 –4 –2 0
G-7
Industrial economies
Africa
Emerging Asia
Developing economies
Latin America and the Caribbean
–3.1
–3.7
–7.3
–8.2
–8.5
–9.7
Source: Izquierdo, Puig, et al. (2018c). Note: Bias is defined by the absolute variation of capital spending’s share of total spending between 2016 and 1980.
Figure 1.7 Bias against Capital Spending, by Country in Latin America and the Caribbean
Mexic
oHo
ndur
as
Jama
icaGu
atema
laUr
ugua
yBa
rbad
osGu
ayan
aCo
sta R
ica Peru
Nica
ragu
aCo
lombia
El S
alvad
orBe
lize
Para
guay
Vene
zuela
Braz
ilDo
minic
an R
ep.
Arge
ntina
Chile
Trini
dad a
nd To
bago
Ecua
dor
The B
aham
asBo
livia
Pana
ma Haiti
–60
–40
–20
0
Perce
ntage
point
s
20
40
60
Source: Izquierdo, Puig, et al. (2018c). Note: Defined by the absolute variation of capital spending’s share of total spending between 2016 and 1980.
PUBLIC SPENDING: FROM BIGGER TO BETTER 11
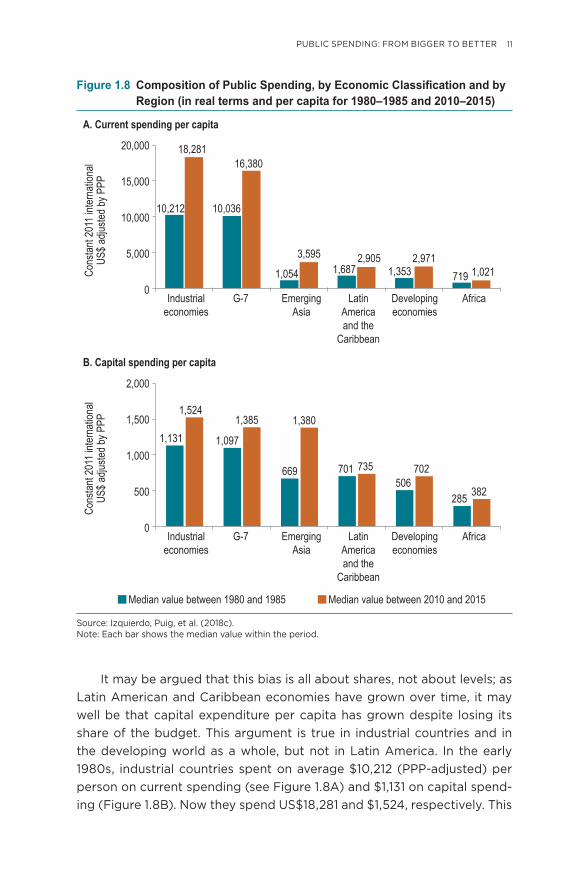
It may be argued that this bias is all about shares, not about levels; as Latin American and Caribbean economies have grown over time, it may well be that capital expenditure per capita has grown despite losing its share of the budget. This argument is true in industrial countries and in the developing world as a whole, but not in Latin America. In the early 1980s, industrial countries spent on average $10,212 (PPP-adjusted) per person on current spending (see Figure 1.8A) and $1,131 on capital spend-ing (Figure 1.8B). Now they spend US$18,281 and $1,524, respectively. This
Figure 1.8 �Composition�of�Public�Spending,�by�Economic�Classification�and�by�Region (in real terms and per capita for 1980–1985 and 2010–2015)
1,097
669 701506
285
1,385 1,380
735 702
382
1,131
1,524
10,212 10,036
1,054 1,6872,905
1,3532,971
719 1,021
18,28116,380
3,5955,000
0
10,000
15,000
20,000
A. Current spending per capita
B. Capital spending per capita
Industrialeconomies
G-7 EmergingAsia
LatinAmericaand the
Caribbean
Developingeconomies
Africa
Cons
tant 2
011 i
ntern
ation
alUS
$ adju
sted b
y PPP
Median value between 1980 and 1985
500
0
1,000
1,500
2,000
Industrialeconomies
G-7 EmergingAsia
LatinAmericaand the
Caribbean
Developingeconomies
Africa
Cons
tant 2
011 i
ntern
ation
alUS
$ adju
sted b
y PPP
Median value between 2010 and 2015
Source: Izquierdo, Puig, et al. (2018c). Note: Each bar shows the median value within the period.
12 BETTER SPENDING FOR BETTER LIVES
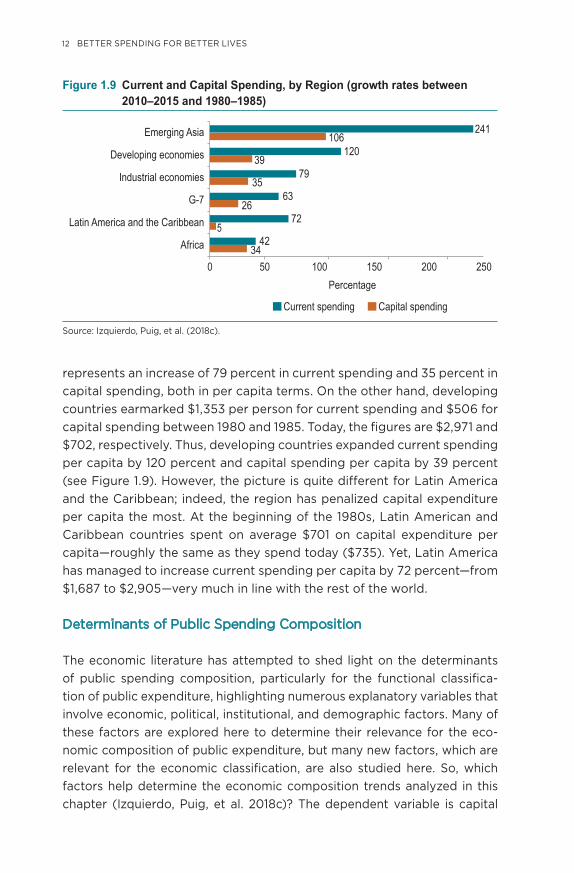
represents an increase of 79 percent in current spending and 35 percent in capital spending, both in per capita terms. On the other hand, developing countries earmarked $1,353 per person for current spending and $506 for capital spending between 1980 and 1985. Today, the figures are $2,971 and $702, respectively. Thus, developing countries expanded current spending per capita by 120 percent and capital spending per capita by 39 percent (see Figure 1.9). However, the picture is quite different for Latin America and the Caribbean; indeed, the region has penalized capital expenditure per capita the most. At the beginning of the 1980s, Latin American and Caribbean countries spent on average $701 on capital expenditure per capita—roughly the same as they spend today ($735). Yet, Latin America has managed to increase current spending per capita by 72 percent—from $1,687 to $2,905—very much in line with the rest of the world.
Determinants of Public Spending Composition
The economic literature has attempted to shed light on the determinants of public spending composition, particularly for the functional classifica-tion of public expenditure, highlighting numerous explanatory variables that involve economic, political, institutional, and demographic factors. Many of these factors are explored here to determine their relevance for the eco-nomic composition of public expenditure, but many new factors, which are relevant for the economic classification, are also studied here. So, which factors help determine the economic composition trends analyzed in this chapter (Izquierdo, Puig, et al. 2018c)? The dependent variable is capital
Figure 1.9 Current and Capital Spending, by Region (growth rates between 2010–2015 and 1980–1985)
Percentage0 50 100 150 200 250
G-7
Emerging Asia
Developing economies
Latin America and the Caribbean
Industrial economies
Africa
Current spending Capital spending
34
5
26
35
39
106241
42
72
63
79
120
Source: Izquierdo, Puig, et al. (2018c).
PUBLIC SPENDING: FROM BIGGER TO BETTER 13
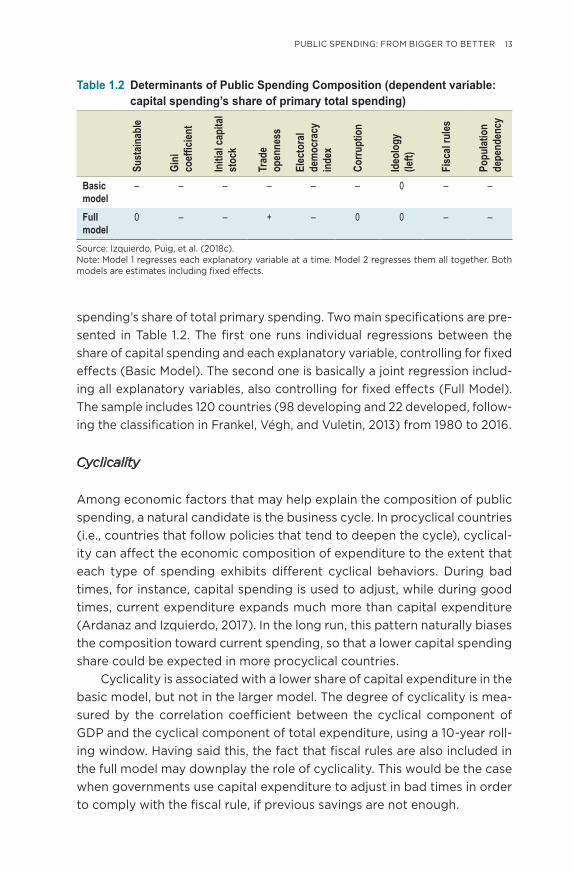
spending’s share of total primary spending. Two main specifications are pre-sented in Table 1.2. The first one runs individual regressions between the share of capital spending and each explanatory variable, controlling for fixed effects (Basic Model). The second one is basically a joint regression includ-ing all explanatory variables, also controlling for fixed effects (Full Model). The sample includes 120 countries (98 developing and 22 developed, follow-ing the classification in Frankel, Végh, and Vuletin, 2013) from 1980 to 2016.
Cyclicality
Among economic factors that may help explain the composition of public spending, a natural candidate is the business cycle. In procyclical countries (i.e., countries that follow policies that tend to deepen the cycle), cyclical-ity can affect the economic composition of expenditure to the extent that each type of spending exhibits different cyclical behaviors. During bad times, for instance, capital spending is used to adjust, while during good times, current expenditure expands much more than capital expenditure (Ardanaz and Izquierdo, 2017). In the long run, this pattern naturally biases the composition toward current spending, so that a lower capital spending share could be expected in more procyclical countries.
Cyclicality is associated with a lower share of capital expenditure in the basic model, but not in the larger model. The degree of cyclicality is mea-sured by the correlation coefficient between the cyclical component of GDP and the cyclical component of total expenditure, using a 10-year roll-ing window. Having said this, the fact that fiscal rules are also included in the full model may downplay the role of cyclicality. This would be the case when governments use capital expenditure to adjust in bad times in order to comply with the fiscal rule, if previous savings are not enough.
Table 1.2 Determinants of Public Spending Composition (dependent variable: capital spending’s share of primary total spending)
Sust
ainab
le
Gini
coefficien
t
Initi
al ca
pita
l st
ock
Trad
e op
enne
ss
Elec
tora
l de
moc
racy
in
dex
Corru
ptio
n
Ideo
logy
(le
ft)
Fisc
al ru
les
Popu
latio
nde
pend
ency
Basic model
– – – – – – 0 – –
Full model
0 – – + – 0 0 – –
Source: Izquierdo, Puig, et al. (2018c). Note: Model 1 regresses each explanatory variable at a time. Model 2 regresses them all together. Both models are estimates including fixed effects.
14 BETTER SPENDING FOR BETTER LIVES
Capital Stocks
The initial stock of capital could also affect decisions on public expendi-ture composition. Lower starting capital stocks may lead to more capital spending as capital is highly productive at very low levels, given decreas-ing marginal returns to capital spending. Thus, when capital stock levels are lower, the share of capital expenditure in total expenditure could be larger.
In line with this theoretical prediction, regressions show that a large initial stock of capital reduces the share of capital spending. The mea-sure used here is the capital stock at constant national prices provided by Penn World Tables. This finding is relevant since Latin American and Carib-bean countries present the lowest levels of capital stock after Africa. If Latin American and Caribbean countries were to behave like the rest of the sample, the share of capital spending in the region should be higher—not lower—given its low starting capital stocks.
Inequality
Factors reflecting income distribution, such as the Gini coefficient, are also pertinent since inequality in pretax income can lead to high demand for redistributive policies (Romer, 1975) and, therefore, greater social spend-ing.4 Thus, an inequality measure like the Gini coefficient may be negatively associated with the share of capital spending in total spending.
Results confirm that inequality, as measured by the Gini coefficient, reduces capital spending’s relative participation. This finding may well explain part of the observed bias against capital expenditure in Latin America and the Caribbean, given that the region is the most unequal in the world.
Openness
Openness to international markets can also be a key determinant of expen-diture composition. Countries that are more internationally integrated face greater domestic volatility during times of global economic turbulence. When global markets gyrate, governments may need to compensate for this external risk by providing public insurance in the form of social transfers (Rodrik, 1998), or by increasing public employment. Thus, more open coun-tries would be expected to spend more on these policies, thereby adding to
4 See Meltzer and Richard (1983) and Shelton (2007).
PUBLIC SPENDING: FROM BIGGER TO BETTER 15
current expenditures and establishing a negative association between open-ness and the share of capital expenditure in total expenditure. However, if developing countries do not have good mechanisms for making transfers to the losers of reform, the expected negative relation between capital spend-ing’s relative participation and openness could be zero or even positive.
The effect of openness to international markets is less clear since ambiguous signs are found in both models. Openness is measured as the sum of exports and imports over GDP, with data provided by the World Bank. In the basic model, no relation is found between public spending composition and openness, but in the larger model a positive relation emerges, which may point to the presence of weak mechanisms to com-pensate the losers of trade reforms.
Political and Institutional Factors
Among political and institutional factors, ideology could play a prominent role. Leftist-oriented governments usually attach greater importance to social security and health care, while rightist-oriented governments favor infrastructure and defense (Van Dalen and Swank, 1996). Thus, capital expenditure’s share is expected to be lower in left-leaning governments.
Corruption could also affect spending. Corrupt countries have more frequently been associated with low public spending in public education and health since it is easier to collect hefty bribes on large infrastructure projects or sophisticated defense equipment than on textbooks or teach-ers’ salaries (Mauro, 1998). Tanzi and Davoodi (1998) argue that corruption could increase public investment given rent-seeking opportunities.
Finally, democracy may affect public spending composition, as a median voter in favor of redistributive policies may push for a larger share of current expenditure (Kotera and Okada, 2017).
In fact, democratic systems seem to favor current expenditure over cap-ital expenditure. The variable used here is the electoral democracy index, published by the V-Dem Project. Results imply that median voters—key par-ticipants in democratic outcomes—may prefer redistributive policies and, therefore, demand greater social spending.
On the other hand, based on the measure of corruption provided by the International Country Risk Guide, and contrary to what was expected, corruption punishes capital spending. However, in the larger model with other controls, the coefficient is zero.
Ideology, as measured by data from the Inter-American Development Bank’s 2017 Database of Political Institutions, does not seem to affect composition either.
16 BETTER SPENDING FOR BETTER LIVES
Fiscal Rules
The adoption of fiscal rules can also bias public expenditure composition. The principal goal of fiscal rules is to ensure the sustainability of a govern-ment’s fiscal accounts by appropriately managing the business cycle. Thus, one of its objectives is to reduce procyclicality or to achieve countercycli-cality (i.e., ensure savings in good times to spend in bad times). But these rules do not usually specify what type of expenditure should be used in the different phases of the cycle. If public expenditure needs to be adjusted to comply with a fiscal rule—particularly given Latin America and the Carib-bean’s performance in the past—capital expenditure cuts will be used to meet the rule’s demands. Thus, fiscal rules with no additional conditions on expenditure composition may be negatively associated with capital expen-diture’s share of total expenditure.
Fiscal rules are a key determinant of public spending composition and seem to bias public spending toward current spending. Although fiscal rules have been mostly implemented in industrial countries, in the past decade, Latin American and Caribbean countries have increasingly imple-mented them. In this context, the design of fiscal rules that protect public investment, beyond representing good management of the business cycle, becomes a central issue in the makeup and efficiency of public spending (see Chapter 9).
Demographics
Large population dependency ratios—measured as the sum of young (under 15 years of age) and old (65 years of age and above) over total population—may favor current spending, especially for social purposes. The young may push for more health and education spending, while the elderly may prefer increases in health and social security spending. Moreover, to the extent that the elderly are not fully altruistic about their progeny, they may bias their preferences in favor of current spending instead of capital spending, which benefits future generations. Thus, the share of the elderly, as well as their intergenerational altruism, may be a determining factor in the composition of public spending (Izquierdo and Kawamura, 2015).
As expected, population dependency ratios pull for more current spending. Policymakers should carefully consider the implications of this trend; although the region is currently enjoying a demographic dividend, in the near future this dividend will end and countries will need to contem-plate the effects of an aging population (see Chapter 3).
PUBLIC SPENDING: FROM BIGGER TO BETTER 17
Trust, or the Lack Thereof
Lack of trust in politicians is another key determinant of public spending composition, as it may bias preferences toward certain, short-term spend-ing such as transfers instead of uncertain, but perhaps more profitable, long-term spending such as infrastructure. Thus, the lack of credibility may lead citizens to prefer “a bird in hand (transfers) than two in the bush (infrastructure).
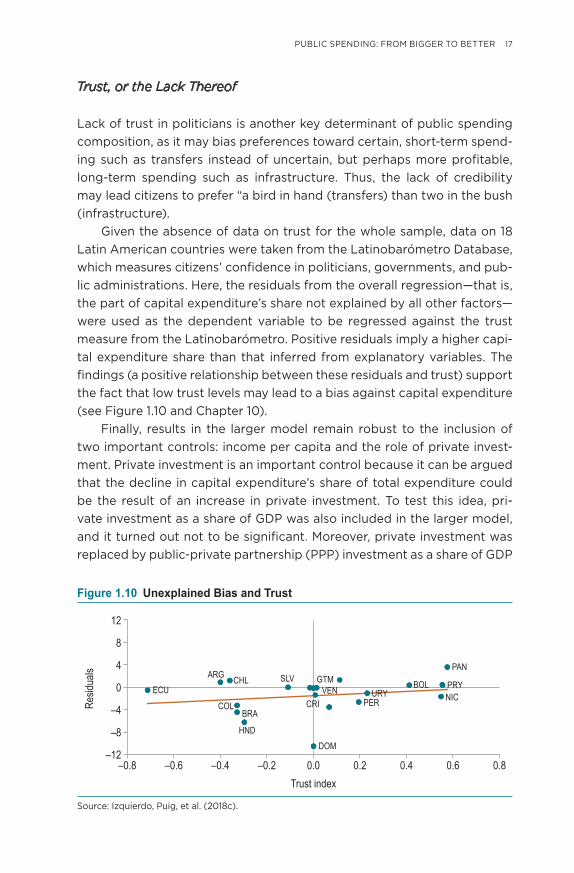
Given the absence of data on trust for the whole sample, data on 18 Latin American countries were taken from the Latinobarómetro Database, which measures citizens’ confidence in politicians, governments, and pub-lic administrations. Here, the residuals from the overall regression—that is, the part of capital expenditure’s share not explained by all other factors—were used as the dependent variable to be regressed against the trust measure from the Latinobarómetro. Positive residuals imply a higher capi-tal expenditure share than that inferred from explanatory variables. The findings (a positive relationship between these residuals and trust) support the fact that low trust levels may lead to a bias against capital expenditure (see Figure 1.10 and Chapter 10).
Finally, results in the larger model remain robust to the inclusion of two important controls: income per capita and the role of private invest-ment. Private investment is an important control because it can be argued that the decline in capital expenditure’s share of total expenditure could be the result of an increase in private investment. To test this idea, pri-vate investment as a share of GDP was also included in the larger model, and it turned out not to be significant. Moreover, private investment was replaced by public-private partnership (PPP) investment as a share of GDP
Figure 1.10 Unexplained Bias and Trust
Resid
uals
Trust index
–12
–8
–4
0
4
8
12
–0.8 –0.6 –0.4 –0.2 0.0 0.2 0.4 0.6 0.8
ARG
BRA
CHL
COL
DOM
ECUSLV
HND
VEN URYPER
PAN
PRYBOLNIC
CRI
GTM
Source: Izquierdo, Puig, et al. (2018c).
18 BETTER SPENDING FOR BETTER LIVES
(as published by the International Monetary Fund), which is potentially a better measure of the substitution effect that emerging PPPs could have had on public investment. This variable is not significant either in explain-ing the fall in capital expenditure’s share.
Policy Implications
The bias against capital spending can be explained by several economic, political-institutional, and demographic factors that policymakers should consider when contemplating the composition of public expenditure.
The management of public spending policy over the business cycle must be taken into account, particularly since inequality contributes to biasing the composition toward current spending. Thus, it is crucial to carefully manage redistributive spending demands throughout the cycle, particularly during good times, when a “voracity effect” may push expen-ditures above trend and toward more inflexible spending (i.e., transfers) that may be difficult to sustain during the next stage of the business cycle.
In addition, policymakers should focus on how to allocate spending to the most profitable sectors given the stock of public capital. In countries with a low public capital stock, capital expenditure should be given priority as returns will typically be large for this type of expenditure.
Fiscal rules are mute about the composition of public spending, rais-ing the issue of potentially redesigning fiscal rules. Although the primary objective of fiscal rules is to achieve sustainable spending throughout the business cycle, they should not penalize public investment during bad times. This warning is particularly relevant because many countries in the region are currently implementing fiscal rules (see Chapter 9).
Since larger dependency ratios bias public expenditure composition toward current spending, today’s demographic moment calls for revisit-ing policy options for budget allocation. This issue will become particularly relevant as an aging population signals an end to the demographic divi-dends the region has been enjoying. Policymakers must be proactive and anticipate future demands for current expenses (e.g., pensions) that will bias the composition against public investment even more (see Chapter 3).
Finally, rebuilding citizens’ trust in government is crucial. Individu-als in the region do not trust their governments to deliver over the long term, which leads them to demand transfers that offer immediate gratifi-cation. These short-term payments may be less beneficial than long-term investments such as capital expenditures; however, citizens are unwilling to believe in promises whose fruits will not be reaped for years to come.
PUBLIC SPENDING: FROM BIGGER TO BETTER 19
Public spending has climbed in Latin America and the Caribbean. Rid-ing a worldwide spending trend and a commodity windfall, governments around the region tried to spend their way into the future. Unfortunately, the party is over and policymakers must find a way to keep their econo-mies growing and their citizens happy in a fiscally sustainable manner. The traditional answer to this moment of truth has been to simply cut spend-ing. This book suggests there is another way out. Even if governments need to spend less in aggregate, the same or even more services could be provided if ways are found to be smarter about spending, to be more efficient, to make every penny count. The first step is to achieve better outcomes with the same or fewer resources. The second is to allocate bet-ter, by analyzing the composition of spending and finding the right mix of transfers to meet today’s needs and investments to prepare for tomorrow. Now that governments are bigger, it’s time to make them better.


