DEVELOPMENT IN THE AMERICAS Better Spending for Better Lives · better to dissect the budget sector...
60
Better Spending for Better Lives Edited by Alejandro Izquierdo, Carola Pessino, and Guillermo Vuletin DEVELOPMENT IN THE AMERICAS How Latin America and the Caribbean Can Do More with Less Chapter 3
Transcript of DEVELOPMENT IN THE AMERICAS Better Spending for Better Lives · better to dissect the budget sector...

Better Spending for Better Lives
Edited byAlejandro Izquierdo,Carola Pessino, and Guillermo Vuletin
DEVELOPMENT IN THE AMERICAS
How Latin America and the Caribbean CanDo More with Less
Chapter 3


Better Spending forBetter LivesHow Latin America and the Caribbean Can Do More with Less
This chapter is part of an upcoming IDB flagship publication on public spending. Sign up to be among
the first to receive a free copy of the book: www.iadb.org/DIA2018spending


The (In)Efficiency of Public Spending
Public expenditure in Latin America and the Caribbean grew on average 7 percentage points during the past 20 years—an increase that, unfortu-nately, is not reflected in a similar increase in quality physical and human capital, or lasting social outcomes. This is particularly the case in countries where public expenditure increased the most, which today are struggling with fiscal sustainability and low growth. Big and small countries alike have experienced huge problems achieving efficiency.
Given that public budgets in all Latin American and Caribbean countries are likely to remain tight for some time to come, all levels of government will have to learn to spend more wisely. Growing citizen con-cerns, aging populations, tax burdens that have reached efficiency limits, plus international economic volatility have put pressure on governments to increase the value for money of public services.
Countries have options beyond the oft-cited either-or dilemma of tax increases and spending cuts. Latin America and the Caribbean needs to spend better by switching from wasteful, inefficient expenditure to effi-cient expenditure that contributes to growth without adding to inequality. Adjusting government expenditure can be a painful process; however, identifying inefficiencies in public spending can help reduce the burden. This process is known as “smart” spending. Instead of cutting expendi-tures across the board—as has been done many times in the past—it is better to dissect the budget sector by sector, sort out technical and alloc-ative inefficiencies, and switch spending if warranted.1 It is important to build diagnostics based on evidence, perform cost-benefit analysis, and obtain rates of return in order to assign spending where it is most produc-tive and efficient in achieving social welfare.
Efficiency is about doing more with less. It involves maximizing out-puts such as the volume of services provided, minimizing inputs such as
3
1 See Cavallo and Serebrisky (2016), particularly Chapter 8 on smart spending.
2 BETTER SPENDING FOR BETTER LIVES
the amount of resources, time, or capital required to produce those ser-vices, and maintaining or improving quality. Public spending efficiency can be classified into technical efficiency, which deals with the inefficiencies in each expenditure component, and allocative efficiency, which aims to pri-oritize between alternative spending items based on evidence and allocate expenditure to programs with higher social rates of return. The allocative and technical efficiency of public spending are critical to fostering long-term economic growth and improving equity. Recent theoretical and empirical lit-erature concentrated almost exclusively—if at all—on technical efficiency, assuming that spending allocations are either optimal or too difficult to change or manage. However, doing the wrong things right might entail high allocative efficiency costs and may even surpass technical efficiency losses.
Most Latin American and Caribbean countries spend inefficiently. While the amount of goods and services produced annually in the 26 countries in the region surpassed $5.3 trillion in 2016, public spending exceeded $1.9 trillion (about the size of Brazil’s gross domestic product, GDP), leaving little room for mistakes. Lack of professionalism, negligence, corruption, or a combination thereof, inflate the cost of inputs used to pro-duce those services. Moreover, spending is inefficiently allocated among government sectors, programs, and populations, and over time.
This chapter addresses spending efficiency in general, as well as by sector, using the Data Envelopment Analysis (DEA) popularized by Afonso, Schuknecht, and Tanzi (2005, 2010). This method is useful to benchmark efficiency relative to a frontier where advanced countries are usually sit-uated. Within each sector, the efficiency analysis can explain why some Latin American and Caribbean countries are far from the frontier; however, it is not easy to pinpoint the technical or allocative efficiencies of each. This chapter does not rely on a single technique, but rather dissects sepa-rately issues of technical and allocative efficiency.
How can technical inefficiencies be identified? Technical efficiency in government spending explores how many more inputs are used than needed to obtain an outcome; or how much it costs to deliver a program while maintaining a certain level of quality compared to benchmark years or to other countries; or how governments obtain different outcomes from a certain level of expenditure. Efficiency can be measured by determin-ing the amount of public resources wasted in delivering outcomes of a given quality. This chapter first provides estimates of how much the region loses by spending inefficiently on wages, procurement, and subsidies and transfers.
Regarding allocative efficiency, this chapter focuses on four of the most pressing problems in assigning public spending in Latin America and the

THE (IN)EFFICIENCY OF PUBLIC SPENDING 3
Caribbean. First, it examines the allocation of spending between older and younger generations. The region is aging much faster than developed coun-tries; in other words, it is becoming old (and increasing its old-age spending) before becoming rich. Are countries assigning spending efficiently to cur-rent and future generations? Second, some countries in the region “ate” the commodity boom of the 2000s; that is, they spent the windfall largely on increasing subsidies, transfers, and wages, instead of improving physi-cal and human capital. The trade-off is between public spending aimed at income redistribution (via social spending)2 and that aimed at raising growth. How efficiently is spending allocated between physical capital (investment), human capital, and transfers? Third, as a means for tackling the problem of low-quality human capital in the region, allocative efficiency of spending for skills formation along the life cycle is analyzed. What do rates of return reveal about the current assignment of spending from early childhood programs to youth and adult training? Fourth, the increasing share of subnational spending in consolidated spending in the region raises the question whether the efficiency gains of putting services closer to con-stituents will be realized or if some prerequisites are needed in the process to improve it.
Poor governance, the short-sightedness of politicians, and weak bud-get institutions can all contribute to inefficiency. Latin American and Caribbean governments are falling short in their use of fiscal policy as a development tool that can boost growth, reduce poverty and inequality, and provide high-quality public goods and services. The main finding of chapters 3–8 of this book is that some government programs are managed ineffectively, leading to waste; some programs are not allocated to the most efficient and growth-enhancing alternatives; some benefit the rich more than the poor, and do not achieve their goals effectively. As a result, it would be possible to save an important part of the budget or switch spending without reducing access to public services that benefit the poor-est sectors of the population.
Technical Efficiency: Doing the Right Things, Right
Some of the waste in public expenditure relates to technical inefficiencies: governments do the right things badly, using more resources than needed to achieve a given outcome. What is the optimal mix of labor, goods and
2 Chapter 4 concludes that social spending is not efficient in Latin America and the Caribbean to redistribute income when benchmarked with more developed countries.

4 BETTER SPENDING FOR BETTER LIVES
services, construction, and transfers to deliver services to citizens? To produce public services, the government should combine its inputs effi-ciently at the lowest cost. The economic classification of public spending focuses on inputs: goods and services, investment, labor, and transfers. Inefficiencies stem not only from the amount of labor but also from their cost. For example, if for a given job qualification, wages are much higher in the public sector than the private sector, then there is room for improve-ment. Wages and the cost of goods and services relate to the costs of production undertaken by government itself. Subsidies, grants, and social benefits relate to transfers in cash or in kind and purchases from third par-ties of goods and services for delivery to other parties, usually firms and households.3
A novel dataset of consolidated general government spending for 24 countries collected by the IDB (IMF, 2014) shows total spending and its economic composition as a percentage of GDP in Latin America and the Caribbean (Figure 3.1).
Consolidated general public spending is 29.7 percent of GDP in Latin America and the Caribbean compared to 43.5 percent in the Organisation for Economic Co-operation and Development (OECD). However, spend-ing is uneven in the region: the big spenders include Argentina, Brazil, Ecuador, Trinidad and Tobago, and Uruguay (more than 35 percent of GDP); low spenders include the Dominican Republic and Guatemala (less than 20 percent of GDP); the rest are intermediate spenders (between 20 and 35 percent). The two highest spenders in the region spend more than or equal to the median country in the OECD, but their GDP per cap-ita (right axis) is less than half that of the median country in the OECD.
Technical efficiency is analyzed for three key components of govern-ment production costs: procurement spending, which is the cost of goods and services including capital expenditure; the costs of compensating civil service employees; and part of the cost of subsidies and transfers, which suffer from leakages to the nonpoor. This technical efficiency analysis assumes a reasonable allocation of expenditure by function and, hence, provides estimates of the direct waste of resources reflecting overcost or overuse of inputs for a given outcome.
3 Consolidated general government should include at a minimum central government, state and local government activities, and social security funds. It excludes transfers between these levels of government to avoid double counting. Besides economic classification, the dataset includes the functional classification and crossed classifi-cation for a sample of countries (Pessino Badin et al, 2018).

THE (IN)EFFICIENCY OF PUBLIC SPENDING 5
Figu
re 3
.1 T
otal
Spe
ndin
g as
Per
cent
of G
DP b
y Ec
onom
ic C
lass
ifica
tion
and
GDP
per
cap
ita P
PP, 2
015–
2016
Spending as a % of GDP
Thousand dollars PPP
0
Wag
e bill
Othe
rCa
pital
expe
nditu
re
Tran
sfers
GDP
per c
apita
PPP
2016
Good
s and
servi
ces
1020304060 50
020406080120
100
Guatemala Dominican Rep. Peru Panama Haiti Paraguay The Bahamas Chile El Salvador Nicaragua Honduras Jamaica Latin America and the Caribbean Mexico Costa Rica Belize Colombia Suriname Bolivia Barbados Uruguay Trinidad & Tobago Ecuador Brazil Argentina Ireland Korea Turkey Switzerland Latvia Australia United States Japan New Zealand Czech Rep. Israel Estonia Iceland Canada Poland Spain United Kingdom Slovakia OECD Luxembourg Netherlands Germany Portugal Slovenia Italy Hungary Greece Sweden Austria Belgium Denmark Norway Finland France
Sour
ce: A
utho
rs’ c
alcu
lati
on b
ased
on
OE
CD
Nat
iona
l Acc
ount
s, F
MM
Sp
end
ing
dat
abas
e, IM
F-W
EO
, and
Pes
sino
, Bad
in, e
t al
. (20
18).
Not
e: S
pen
din
g d
ata
follo
ws
the
conc
epts
of
the
Gov
ernm
ent
Fin
ance
Sta
tist
ic M
anua
l (G
FSM
). W
age
bill
ref
ers
to a
ll co
mp
ensa
tion
in c
ash
or in
kin
d in
ret
urn
for
wor
k,
calle
d C
omp
ensa
tion
of
Em
plo
yees
in G
FSM
. Goo
ds
and
Ser
vice
s re
fer
to t
he u
se o
f g
ood
s an
d s
ervi
ces
in t
he G
FSM
. Cap
ital
exp
end
itur
e in
clud
es c
apit
al t
rans
fers
plu
s in
vest
men
t. Tr
ansf
ers
are
defi
ned
as
soci
al b
enefi
ts p
lus
sub
sid
ies
and
gra
nts.
Oth
er is
defi
ned
as
othe
r cu
rren
t ex
pen
dit
ure.
Bel
ize,
Bar
bad
os, J
amai
ca, S
urin
ame,
The
B
aham
as, a
nd T
rini
dad
and
Tob
ago
refe
rs t
o ce
ntra
l gov
ernm
ent
spen
din
g a
nd H
aiti
ref
ers
to t
he n
on-fi
nanc
ial p
ublic
sec
tor.
The
only
dat
a av
aila
ble
for
Hai
ti, J
amai
ca,
and
Sur
inam
e ar
e to
tal s
pen
din
g a
nd t
hey
are
not
incl
uded
in t
he L
atin
Am
eric
a an
d t
he C
arib
bea
n av
erag
e. M
exic
o an
d C
hile
are
not
incl
uded
in t
he O
EC
D a
vera
ge.

6 BETTER SPENDING FOR BETTER LIVES
The composition of Latin American and Caribbean spending differs from OECD averages in several ways. First, compensation of employees accounts for 29 percent of spending in the region, which is higher than the 24.2 percent in the OECD. Second, total procurement constitutes 29.8 percent of spending in Latin America and the Caribbean compared to 32.5 percent in the OECD. The share of transfers, including subsidies, grants, and pensions, is larger in the OECD (32.8 percent) than in Latin America and the Caribbean (29.4 percent). This spending on transfers, together with lower spending on capital goods, point to an older population than in Latin America and the Caribbean (Figure 3.2).
Adjusting government expenditures can be painful; however, under-standing their composition and identifying inefficiencies within them can be very useful. This process is known as “smart” spending. But how can inefficiencies be identified? How much is wasted in procurement, wages, and transfers? Inefficiencies in procurement can be measured by the dif-ference between the market and purchase prices of different goods and services and can even be measured by goods of the same price but
Figure 3.2 Share of Wage Bill, Procurement, and Transfers in Government Spending, 2015–2016
A. Latin America and the Caribbean B. OECD
Wage bill
29.0%
16.2%13.6%
29.4%
11.8%24.2%
9.3%
23.2%
32.8%
10.5%
OtherCapital expenditure(procurement)
Goods and services(procurement)
Transfers
Source: Authors’ calculation based on OECD National Accounts, FMM Spending database, IMF-WEO (2015–2016), and Pessino, Badin, et al. (2018).Note: Spending data follows the concepts of Government Finance Statistic Manual (GFSM). Procurement is defined as the sum of use of goods and services and total capital expenditure (capital transfers plus invest-ment). Wage bill refers to all compensation in cash or in kind in return for work, called compensation of employees in GFSM. Goods and services refer to the use of goods and services in the GFSM. Capital expen-diture includes capital transfers plus investment. Transfers are defined as social benefits plus subsidies and grants. Other is defined as other current expenditure. Belize, Barbados, Jamaica, Suriname, The Bahamas and Trinidad and Tobago refer to central government spending and Haiti refers to nonfinancial public sec-tor. The only data available for Haiti, Jamaica, and Suriname are total spending and they are not included in the Latin American and Caribbean average. Mexico and Chile are not included in the OECD average.

THE (IN)EFFICIENCY OF PUBLIC SPENDING 7
different quality. It can also be measured indirectly with corruption studies or by how much procurement processes can diminish waste and inefficien-cies. Both the number of workers (usage of inputs) and wage differentials in the public and private sectors provide indications of inefficiency in the public bill. And waste in transfers can be estimated through the cost of leakages to the nonpoor population.
Inefficiency in Procurement: Corruption Matters
In 2016, Latin American and Caribbean governments spent approximately $450 billion on public procurement including the purchase of goods and ser-vices and capital equipment. Examples of public procurement include buying computers for primary schools; providing water, gas, and electricity to people; and building a highway or an airport. But, is public procurement efficient and effective? Are the prices paid competitive with the private sector, and simi-lar across government offices and throughout the country? Do the goods and services delivered meet high quality standards? These questions are relevant, since public procurement spending is not only large, but affects the functional areas of government including education, health, and infrastructure.
On average, public procurement represented 32.5 percent of general government expenditure in OECD countries (14 percent of GDP) and 29.8 percent in Latin American and Caribbean countries (8.6 percent of GDP). However, the size of procurement spending varies across the region from about 15 percent of total spending on average in Argentina and Uruguay to 47 percent in Bolivia and Peru, due to the larger share of capital expendi-ture in total spending. In fact, spending on procurement of capital goods is more important in Latin America and the Caribbean (16.2 percent) than in the OECD (9.3 percent). In terms of GDP it is 4.7 percent in Latin America and the Caribbean and 4 percent in the OECD (Figure 3.3).
While subnational (provincial and municipal) spending is about 19 percent of consolidated general spending,4 procurement spending at the state and local levels accounts for 27 percent of general procurement spending, and 32 percent of infrastructure. This is particularly impor-tant in Argentina, Bolivia, and Brazil, where subnational spending is about 45 percent on average in the federal countries Argentina and Bra-zil, and about 32 percent in Bolivia, but whose subnational governments (SNGs)account for more than 60 percent of total general government
4 From the sample of 21 countries, 17 listed in the last section of the chapter include detailed subnational spending.

8 BETTER SPENDING FOR BETTER LIVES
procurement. Procurement spending at the state level is also notable in Peru and Colombia at about 42 percent.
Procurement is a magnet for inefficiencies in management and corrup-tion. The large volume of transactions along with the close and complex interaction between the public and private sectors expose public pro-curement to various risks of waste, mismanagement, and corruption. Few
Figure 3.3 Public Procurement Spending as a Percentage of GDP and of Government Spending, 2016
32.514.029.88.6
Procurement as % of total spendingProcurement as % of GDP
EcuadorBoliviaBelizePeru
ColombiaMexico
HondurasNicaraguaPanama
ParaguayTrinidad and Tobago
ArgentinaEl Salvador
BrazilChile
BarbadosCosta Rica
The BahamasUruguay
Dominican RepublicGuatemala
Latin America andthe Caribbean
OECD
Capital expenditureGoods and services
0 10 20 30 40 6050020 18 16 14 12 10 8 6 4 2
Source: Authors’ calculation based on OECD National Accounts, FMM Spending database, IMF-WEO (2015–2016), and Pessino, Badin, et al. (2018).Note: Spending data follows the concepts of Government Finance Statistic Manual (GFSM). Procure-ment is defined as the sum of use of goods and services and total capital expenditure (capital transfers plus investment). Goods and services refer to the use of goods and services in the GFSM. Capital ex-penditure includes capital transfers plus investment. Belize, Barbados, The Bahamas and Trinidad and Tobago refer to central government spending. Mexico and Chile are not included in the OECD average.

THE (IN)EFFICIENCY OF PUBLIC SPENDING 9
government activities offer greater temptation or more opportunity for corruption.5 Public investment is particularly vulnerable to corruption and waste: it represents a larger share of total procurement in Latin America than in the OECD and operates with weaker institutions. But how much is that waste? With only scarce data on procurement corruption and waste by country, the option is to extrapolate estimates from the few existing studies.
Although it is difficult to measure the exact cost of corruption due to its hidden nature, an estimated 10–30 percent of investment in pub-licly funded construction projects may be lost through mismanagement and corruption (CoST, 2012); the OECD estimates 20–30 percent of proj-ect value is lost through corruption (OECD, 2013a). Within the European Union (EU), corruption more generally was estimated to cost €120 billion per year (European Commission, 2014b), which represents approximately 1 percent of the EU GDP. However, a new RAND study estimated a higher cost of corruption in Europe: up to €990 billion (about 6 percent of EU GDP) is lost annually (Hafner et al., 2016). About 57 percent of briber-ies prosecuted involved bribes to obtain public contracts, mostly in the extractive, construction, transportation, and information and communica-tions sectors (OECD, 2014a). Hence, about 3.5 percent of GDP, or between 7 percent and 25 percent of total procurement, is lost to corruption and other waste in the EU.6
The largest corruption investigation in Latin America’s history—involving bribes paid by the Brazilian construction giant Odebrecht to secure government contracts with Petrobras—has spread to 14 countries. The Odebrecht scandal is part of a sweeping corruption probe, known as “Operation Car Wash” (Lava Jato), launched by crusading Brazilian pros-ecutors in 2014. The U.S. Justice Department tracked bribes from Brazil’s Odebrecht construction company to officials in Latin America. The com-pany admitted paying $737 million in bribes between 2011 and 2016 to secure contracts worth $2.8 billion involving some 100 projects in 10 countries.7
5 As a seminal paper of Becker and Stigler (1974) showed, the temptation of mal-feasance is proportional to the amount at stake, the lack of controls, the possible punishment, and the probability of detection.
6 The lower bound estimate of corruption for the EU was 1 percent of GDP (7 percent of procurement). The World Economic Forum (WEF) estimates the global cost of corrup-tion (including procurement) to be more than 5 percent of global GDP ($2.6 trillion).
7 https://www.washingtonpost.com/world/the_americas/the-corruption-scan-dal-started-in-brazil-now-its-wreaking-havoc-in-peru/2018/01/23/0f9bc4ca-fad2-11e7-9b5d-bbf0da31214d_story.html?utm_term=.a4727cc036e8.

10 BETTER SPENDING FOR BETTER LIVES
The waste of public funds in bribes and padded budgets appears to be enormous—about 26 percent over the cost of projects. Thus, for Latin America and the Caribbean, losses may approach the upper end of the EU estimates (between 7 and 25 percent of procurement contracts).8 With procurement spending accounting for 8.6 percent of GDP, waste in pro-curement amounts to 0.9 percent to 2.6 percent in the region on average. Just how much could be recovered with good procurement and anticor-ruption practices depends on the country.9 While several studies found little correlation between a country’s corruption perception score and the experience of corruption, corruption indicators are still useful to estimate corruption in the EU context (Charron, 2016). The Corruption Perception Index (CPI) and Diversion of Public Funds (DPF) indices (Figure 3.4) are highly correlated, and show a similar picture of corruption and bribes in the region and in developed countries: the higher the values, the less the
Figure 3.4 Corruption Perception Index (CPI) and Diversion of Public Funds (DPF) Index, 2017
Corru
ption
Per
cepti
on In
dex
0
Diversion of public funds0 21 43 65 7
102030405060708090
100
AlbaniaBosnia BulgariaCroatia
Czech Republic
GhanaGreeceHungaryItaly
LatviaLithuania
RomaniaSlovak RepublicSpain
ArgentinaBrazil Colombia
Costa Rica
Dom. Rep.
Ecuador
El Salvador
GuatemalaHaiti Honduras
Mexico NicaraguaPanama
ParaguayPeru Trinidad and Tobago
Venezuela
Armenia
AustraliaAustria Belgium
Canada
Cyprus
DenmarkEstonia
Finland
Georgia
IcelandIreland
Israel
Japan
Korea
Netherlands New ZealandNorway
PolandPortugal
United KingdomUnited States
Chile
Jamaica
Uruguay
Source: Authors’ calculations based on Transparency International and World Economic Forum.Note: Triangles correspond to Latin America and the Caribbean.
8 The literature refers to “active waste” when a public official benefits by inflating the price in exchange for a bribe; “passive waste” is when there is no apparent corruption but lack of skills or capacity results in bad administration.
9 Another way to contrast the range of waste in procurement is to estimate the effects of improving procurement institutions on savings in spending. In the EU, implement-ing a full e-procurement system could reduce the costs of corruption in procurement by €924 million annually, equivalent to a reduction of almost 20 percent of current costs (Hafner et al., 2016).

THE (IN)EFFICIENCY OF PUBLIC SPENDING 11
corruption. Latin American and Caribbean countries, except Chile, Uru-guay, Costa Rica and Jamaica in the middle, are mostly countries with lower indices and on the high end of corruption. Assuming these indices are imperfect but reasonable proxies for observed corruption and that average waste due to corruption in EU countries is a moderate 10 percent, a rough estimate of waste in procurement in Latin American and Carib-bean countries is about 17 percent on average, implying a waste of 1.4 percent of GDP.10
Inefficiency in Civil Services: Does It Pay to Work for Government?
The government wage bill, about $400 billion each year in Latin America and the Caribbean, is another key input in the production of government goods and services. A large part of the inefficiency of public spending derives from the functioning of a civil service that is not always based on optimal criteria. Efficiency and effectiveness in government performance depend on the talent of public employees and the quality of their knowl-edge and skills compared to their total compensation. In fact, for many institutions, their greatest asset is their people. In the case of the public sector, the workforce is responsible for the design and implementation of public policies.
But the relevance of human resources in the public sector is also reflected in its cost to taxpayers, that sometimes can surpass its pro-ductivity. The general government’s wage bill in Latin America and the Caribbean represented, on average, 29.0 percent of public expendi-tures and 8.4 percent of GDP. This is a higher proportion of wages in total spending than in OECD countries (24.2 percent, or 10.6 percent of GDP; Figure 3.5). However, countries in the region vary widely; some countries, such as El Salvador, Costa Rica, Paraguay, Guatemala, Bolivia, and Argentina,11 are high wage bill spenders (more than 29 percent of government spending), ranking even higher than the average of OECD countries.
While the wage bill consumes 29.0 percent of general government spending, its share is much higher for local governments than for the
10 EU countries have an index of corruption perception (computed as 100-CPI) of 36.3 with an estimated average “waste” of 10 percent. Latin American and Caribbean countries have a higher corruption perception of 61.1, projecting linearly to an esti-mated waste of 17 percent.
11 Some of them engaged recently in civil service reforms, especially in freezing wages and hiring.

12 BETTER SPENDING FOR BETTER LIVES
central government in several countries. In Argentina, 76 percent of the wage bill corresponds to provincial and municipal spending, making up more than half of all provincial spending. In Brazil, the wage bill is almost 54 percent, while in Peru and Mexico, it is 42 percent.
Do Latin American and Caribbean countries spend more on wages because of larger public payrolls, higher wage rates, or both? There is no “right size” of the public service workforce (OECD, 2011b). The share of government employment varies widely across countries, reflecting differ-ent choices with regard to the scope, level, and delivery of public services. The proportion of the labor force employed in general government was an
Figure 3.5 Wage Bill in Selected Countries, 2016
24.210.629.08.4 Latin America and
the CaribbeanOECD
ArgentinaCosta RicaHonduras
Bolivia El Salvador
EcuadorParaguay
BelizeBrazil
BarbadosUruguay
The BahamasPanama
NicaraguaMexico
Trinidad and TobagoChile
ColombiaPeru
Dominican RepublicGuatemala
Wage bill as % of total spendingWage bill as % of GDP
0 10 20 25 30 35 40 455 15016 14 12 10 8 6 4 2
Source: Authors’ calculation based on OECD National Accounts, FMM Spending database, IMF-WEO (2015–2016), and Pessino, Badin, et al. (2018).Note: Spending data follow the concepts of Government Finance Statistic Manual (GFSM), IMF. Wage bill refers to all compensation in cash or in kind in return for work, called compensation of employees in GFSM. Belize, Barbados, The Bahamas and Trinidad and Tobago refer to central government spending. Mexico and Chile are not included in the OECD average.

THE (IN)EFFICIENCY OF PUBLIC SPENDING 13
average 12.7 percent in Latin America and the Caribbean, less than the 17.4 percent public employment in the OECD in 2015–2016 (Figure 3.6A). Cer-tainly, these averages vary in both regions: in the OECD, public employment ranges from 5.9 percent in Japan and 15.3 percent in the United States to nearly 30 percent in Sweden, Norway, and Denmark. In Latin America, the range runs from 4 percent in Colombia to about 10 percent in Paraguay, Mexico, and Chile, to over 20 percent in Argentina, Trinidad and Tobago,
Figure 3.6 Public Employment as a Share of Total Employment and Public-Private Sector Estimated Wage Gap
Publi
c emp
loyme
nt as
% of
total
emplo
ymen
t
A. Public employment as a share of total employment, 2015
200820072006200520042003200220012000 2009 2010 2011 2013 20142012
Estim
ated
wage
gap
B. Public-private estimated wage gap, without and with control for selection, 2000–2014
10%5%
20%25%
15%
35%30%
40%
Without Heckman selection correction With Heckman selection correction
0
5
10
15
20
25Ba
rbad
osTr
inida
dan
d Tob
ago
Arge
ntina
Domi
nican
Repu
blic
Pana
maUr
ugua
yBr
azil
Costa
Rica
Beliz
eCh
ileMe
xico
Para
guay
Peru
Ecua
dor
El S
alvad
orGu
atema
laCo
lombia
Latin
Ame
rica
and t
he C
aribb
ean
OECD
12.7
17.4
Source: Panel A: Authors’ calculation based on Hanushek and Woessmann (2015), OECD (2017d), and ILOSTAT. Panel B: Cerda and Pessino (2018a) using household surveys from Busso et al. (2017).Note: Panel A: This series considers the average for the 17 LAC countries included and the average share of public employment of 29 OECD countries from Figure 3.1 in OECD (2017d). Panel B: The parameter of interest was estimated by using a Mincer equation with OLS and including age, age-squared, years of education, country, and year effects. It also estimated an ATE corrected by selection bias with Heckman correction. Dashed lines display both confidence intervals at the 95% significance level for the equations estimated.

14 BETTER SPENDING FOR BETTER LIVES
and Barbados.12 There is a positive (weak) relationship between the share of public employment in total employment and the level of development.13 But, SNGs have higher levels of public employment than central govern-ments, especially in federal countries: for the OECD the proportion is 57.7 percent while for Brazil it is 88 percent, Argentina, 84 percent, Mexico, 65 percent and Costa Rica, 37 percent. While the high subnational spending on wages might be explained by the hiring of teachers and doctors in sev-eral countries at the subnational level, it might also signal lower governance and accountability to overstaffing and even the hiring of ghost workers. It may also reflect a lack of incentives and capacity to invest in productive spending.14
While public employment is not uniformly higher in Latin America and the Caribbean than in the OECD, even controlling for development, much of the larger wage bill in Latin American and Caribbean countries can be attributed to a high public wage premium, that is, the average wages of public sector workers are greater than those of the private sector. Public wage premiums might occur for several reasons: 1) skills (such as education and experience) might differ between both sectors, 2) the government’s monopolistic power or focus on vote maximization may explain a noncom-petitive wage-setting process (Reder, 1975),15 3) higher union density in the public sector may lead to greater worker bargaining power (European Commission, 2014a), 4) election periods may increase wage premiums (IMF, 2016).
Since the public wage premium or gap could be due to higher skill levels in the public sector, wages between the public and private sectors are compared controlling for observable differences in productivity and skills. For the same levels of human capital, wages in the public sector in 2014 were an average 25 percent higher than in the private sector. Control-ling for selection bias with an endogenous treatment-regression model the
12 However, some countries in the region are still guilty of overhiring. A recent study in Central America shows that administrative staff per teacher and per health sector professional increased irrationally in most countries between 2007 and 2013, raising questions about the efficiency of expanding the public sector to improve delivery of much-needed public services (Dumas and Lafuente, 2016).
13 A 25 percent increase in GDP per capita in the Latin America–OECD sample is associ-ated with a 1 percentage point increase in public employment. In Latin America and the Caribbean, it is associated with a 2 percentage point increase in public employment.
14 This issue is tackled later in the chapter.15 For a set of OECD countries, a recent study found that openness to international
trade and improvements in the institutional quality of governments are associated with decreases in the public-private wage gap (Campos et al., 2017).

THE (IN)EFFICIENCY OF PUBLIC SPENDING 15
average wage premium increases to about 34 percent (Cerda and Pessino, 2018a).16 The wage premium in favor of public sector employees in Latin America and the Caribbean is one of the highest in the world (IMF, 2016). Moreover, this premium increased over the last 15 years, perhaps fueled by the 2003–2009 commodity boom (Figure 3.6B).
Interestingly, most studies uncovered heterogeneous results related to the increase in the wage differential in favor of public workers: whereas the wage gap is more than 20 percentage points for employees with less than 13 years of education, the wage gap falls sharply for those with more than 13 years of education.17 Qualified workers may be figuratively paying in some countries to work in the public sector, or strong unions in the public sector may be protecting the wages of the less skilled. In addition to higher wages, public sector employees usually enjoy many nonwage benefits such as health care and retirement plans, as well as greater job security, implying that the differential in the total compensation package may go beyond just wage earnings.
The factor affecting efficiency in most countries is the public-sector wage gap, particularly for less-skilled workers, even when controlling for productivity. These estimates do not consider the number of workers, which is a problem in some countries at the national or subnational level.
Under a moderate scenario,18 overall wage bill inefficiency is on aver-age 1.2 percentage points of GDP (14 percent of wage spending or about $52 billion).19 The countries that waste the most are those with higher wage premiums and a lower proportion of unskilled workers: El Salva-dor, Guatemala, Honduras, Mexico, and Ecuador (higher than 20 percent),
16 The average wage premium in Cerda and Pessino (2018a) of 25 percent varies widely across countries (from 5 percent in the Dominican Republic to more than 60 percent in Colombia and Ecuador). Results are similar to Gasparini et al. (2015), who found an average wage premium with private formal labor workers of 22 percent in 2012 (from 5 percent in Venezuela to 41 percent in El Salvador). Earlier, Mizala, Romaguera, and Gallegos (2011) estimated a wage gap for seven Latin American countries of approxi-mately 22 percent.
17 See Gasparini et al. (2015); Mizala, Romaguera, and Gallegos (2011) also found that public sector workers in Latin America and the Caribbean are better paid than those from the private sector and that the public sector wage premium is negative for the most-qualified workers and positive for the less skilled.
18 The average premium for each country found in the latest studies is applied to the proportion of low-skilled workers and the change in the overall wage bill is equated to the change in compensation, assuming employment remains constant.
19 At the other extreme, incorporating differentials in nonobservable characteristics such as work ethic and effort, and applying the change to the entire wage bill, the waste would climb to about 3.1 percent of GDP ($140 billion).

16 BETTER SPENDING FOR BETTER LIVES
and Colombia and Costa Rica (higher than 15 percent).20 Using a different methodology, the inefficiency loss in the wage bill in the education and health sectors was found to be about 0.9 percent of GDP, which is consis-tent with the 1.2 to 3.1 percent loss for the overall wage bill estimated here (Cavallo and Serebrisky, 2016).
Targeted Transfers: Still Leaking?
About 29.4 percent of government spending on average in Latin Amer-ica and the Caribbean are transfers including social programs (conditional cash transfers and noncontributory pensions), firm subsidies (mostly energy subsidies), and contributory pensions (Figure 3.2). This amounts to about $700 billion—the largest expenditure item.
Error, fraud, or corruption reduces the economic efficiency of these interventions by decreasing the amount of money that goes to the intended beneficiaries. An international benchmark study estimates the range of fraud and error in social protection systems at between 2 and 5 percent of overall government expenditure on these transfers. They are more common in the social protection programs of less-developed coun-tries than in OECD countries due to limited administrative capacity and absence of adequate monitoring and evidence-based strategies to com-bat the problem (van Stolk and Tesluic, 2010).
Targeting error is the fraction of program funds that do not reach the poor. The extent of targeting error indicates whether the program achieves its (poverty alleviation) objective or not. The error may be due to program design (as when, for administrative reasons, the program uses imperfect poverty proxies to identify poor beneficiaries) or to program implementation (as when eligibility decisions diverge from program rules). Implementation errors are, in turn, due to error, fraud, or corruption. For those social protection programs whose primary objectives are not direct and targeted poverty alleviation (for example, pensions, unemployment insurance, or other social insurance programs), targeting errors are less relevant and will be considered in the context of allocative inefficiency, especially in the case of pension spending, which accounts for about 30 percent of total social spending on average and more than 40 percent in several countries.
20 Teachers’ unions wield considerable power in most countries by virtue of either the density of the unions, their monopolistic power, or the disruptive behavior they engage in (Bruns and Luque, 2015).

THE (IN)EFFICIENCY OF PUBLIC SPENDING 17
A key tool for reducing inefficiencies is appropriate targeting of transfers. Typically, transfers will target a particular low-income group. However, in practice many recipients of these subsidies are not poor. The receipt of the subsidy by a higher-income household is considered leak-age, and an inefficiency because people outside the target group are benefiting from the subsidy. Consider an exemption on the value added tax on food, also called a tax expenditure. Although it aims to make food more affordable to the poor, it also benefits higher-income households and, thus, constitutes an inefficiency.
Energy subsidies: Fueling inefficiency. By 2015, about 61 percent of total subsidies in the region were energy subsidies. According to FIEL (2015, 2017), Izquierdo, Loo-Kung, and Navajas (2013), and Cavallo and Serebrisky (2016), energy subsidies in the region were unevenly distributed in 2013 in a sample of 18 Latin American and Caribbean countries with average spend-ing on subsidies to energy of 0.85 percent of GDP. Some countries reduced these subsidies when energy prices fell after the global recession, especially after 2014. By 2015, average energy subsidy spending fell to 0.54 percent of GDP (spending in Bolivia, Honduras, El Salvador, Mexico, and Nicaragua dropped substantially, in most cases transforming the untargeted subsidies into a social tariff). In 2015, Argentina was one of the few countries that con-tinued to increase subsidies, until 2016 when the government let tariffs begin to rise. Figure 3.7B shows average government spending and leakages to the nonpoor in each of 18 Latin American and Caribbean countries.21 Although they vary widely across countries, on average more than four-fifths of these energy subsidies leak out to nonpoor households. The magnitude of this inefficiency—and therefore the margin for improvement—is huge.
Social programs. The two main social program expenditures are conditional cash transfers and noncontributory pensions.22 While social programs on average in the sample of 18 countries was about 1.2 percent of GDP in 2015, not all spending on social programs has been properly targeted to the poor. Leakage tends to be less in Central American countries, averaging 0.27 per-cent of GDP, and much higher for South American countries, averaging 0.86 percent of GDP. The striking feature about expenditures on social programs
21 No data are available for Venezuela, which is the largest energy producer in the region and offers large subsidies to domestic consumption of gasoline.
22 See Chapter 4 on the impact of public spending on equity for a complete description of these programs, their large increase in recent decades, and their impact on reduc-ing poverty and inequality.

18 BETTER SPENDING FOR BETTER LIVES
is how high leakage is as a share of total expenditures: 45 percent, on aver-age, for the region. But leakages are higher for less-targeted transfers such as tax expenditures and energy subsidies.
Tax expenditures. Instead of transferring resources directly to needy households through budgetary spending, governments often transfer resources indirectly through tax exemptions. Usually, basic food, med-icines, and rents are exempted from consumption taxes. This policy is one of the most prone to leakage since better-off individuals spend more (and hence benefit more) than the poor. Most countries in the region offer
Figure 3.7 Targeted Spending and Leakages (Social Programs, Energy, and Tax Expenditure), 2015
B. Leakages in target expenditures
% G
DP%
GDP
A. Average spending and leakages in Latin America and the Caribbean
0.5
0.0
1.5
2.0
1.0
2.5
3.0
0.50.0
1.52.0
1.0
2.53.03.54.04.55.0
Energy subsidies Social programs Tax expenditure AllLeakageSpending
Social programsEnergy subsidies
0.5
1.20.8
4.5
2.92.4 2.2 2.2
1.9 1.91.6 1.6 1.5 1.5 1.3
0.9 0.8 0.80.4 0.4
0.1
1.7
2.6
0.4 0.50.7
1.7
Tax expenditure
Arge
ntina
Domi
nican
Repu
blic
Boliv
iaUr
ugua
yNi
cara
gua
Costa
Rica
Colom
biaBr
azil
El S
alvad
orPa
nama
Mexic
oPa
ragu
ayCh
ileJa
maica
Guate
mala
Beliz
ePe
ruHo
ndur
as
Latin
Ame
rica a
ndthe
Car
ibbea
n
Source: Authors’ calculations based on Izquierdo, Loo-Kung, and Navajas (2013) and FIEL (2015, 2017).

THE (IN)EFFICIENCY OF PUBLIC SPENDING 19
either VAT reductions or exemptions for food, medicine, and rent, irre-spective of income. Household surveys and studies on tax expenditures in the region are used to estimate how much the nonpoor consume in exempted goods. This information allows for estimating the leakage in tax expenditures. On average, total tax expenditures amount to 2.1 percent of GDP, of which 0.84 percentage points correspond to food, medicine, and rent (Figure 3.7A). Nearly four-fifths of tax expenditure on these items benefits nonpoor households (equivalent to 0.7 percent of GDP). Over-all, tax expenditures are the most inefficient item in the subsidy agenda. In the targeted area of transfers, including energy subsidies, social pro-grams, and tax expenditures, overall efficiency loss and, hence, savings could amount to up to 1.7 percent of GDP.
Adding It All up: Technical Inefficiencies in Procurement, Wages, and Subsidies
Smart spending can yield big payoffs. Latin America and the Caribbean loses billions of dollars annually on spending that could be switched to other more profitable spending or simply be used to decrease liabilities. Policymakers seeking to rein in spending and budget deficits should begin by decreasing this least-justifiable spending while addressing long-term entitlement costs.
Taking a moderate estimate of inefficiencies in procurement, civil ser-vice, and targeted transfers, the total average amount of waste in the region is approximately 4.4 percent of GDP and amounts to about 16 per-cent of average government spending (Figure 3.8).23 However, estimates vary widely across countries, ranging from potential inefficiencies of more than 7 percent of GDP in Argentina to a low of 1.8 percent of GDP in Chile. The average estimate of 4.4 percent of GDP is larger than current average spending in health (4.1 percent) and almost as large as average spending in education (4.8 percent) in the region. At $220 billion, regional ineffi-ciencies surpass the total GDP of Peru ($190 billion) and almost reach the total GDP of Chile ($250 billion). Correcting these inefficiencies would be more than enough to eliminate the extreme poverty gap and even diminish moderate poverty in many countries (see Chapter 4). Or the savings could
23 These estimates represent a first attempt in the extremely difficult exercise of cap-turing inefficiencies in sectors that although sharing some trends are quite different across countries and demands a detailed country diagnostic that goes beyond the scope of this study and data availability restrictions. However, these caveats do not make the analysis any less relevant. To date there is no comparative analysis of potential inefficiencies in all inputs used by the government.

20 BETTER SPENDING FOR BETTER LIVES
be used to build 1,225 hospitals with 200 beds (about 47 hospitals more per year in each of the 26 countries).
Allocative Inefficiency: Doing the Wrong Things, Right
While doing the right things wrong can incur large losses, doing the wrong things right can incur even larger losses. In the simplest terms, allocative efficiency refers to how governments allocate their spending across differ-ent functions—education, health, social promotion, investment, defense, across generations, across levels of government, etc.—in order to maxi-mize productivity and growth in the economy.
A basic goal of economics is to channel resources to their most pro-ductive use. The government, which commands between 13 percent and 47 percent of GDP, should at least conduct cost-benefit analysis and rate-of-return estimations on all the major components of spending if possible. It should then prioritize spending components; if one sector’s rate of return is higher, its spending should increase. Nobel Prize Laureate James J. Heck-man said in a letter to Congress: “Fiscal responsibility is not simply reducing costs. Fiscal responsibility is looking at costs and returns—and investing resources where returns are the greatest with the least amount of risk. The question is not where to cut. The question is where to invest—and in what.”
Doing the wrong things right entails allocative inefficiency costs, and policymakers face some crucial trade-offs when allocating expenditure
Figure 3.8 Technical Inefficiency in Targeted Transfers, Procurement, and Wage Bill%
GDP
012345678 7.2
6.5 6.3
5.0 4.8 4.7 4.7 4.63.9 3.9 3.8 3.8 3.7
2.7 2.51.8
4.4
Arge
ntina
Domi
nican
Repu
bic
Boliv
ia
Urug
uay
Nica
ragu
a
Costa
Rica
Colom
bia
El S
alvad
or
Pana
ma
Mexic
o
Para
guay
Chile
Guate
mala
Peru
Hond
uras
Latin
Ame
rica
and t
he C
aribb
ean
Leakages in Transfers Procurement Waste Wage Bill Inefficiency
Braz
il
Source: Authors’ calculations adding the estimated waste in procurement, wages, and targeted trans-fers based on Figures 3.1, 3.4, 3.6, and 3.7 and the explanation in the text. For most countries the data correspond to year 2015 or 2016 or the latest available.

THE (IN)EFFICIENCY OF PUBLIC SPENDING 21
by function; here we consider some of the most important: 1) allocat-ing spending on the elderly rather than youth; 2) allocating expenditure among physical capital, human capital, and transfers; 3) allocating spend-ing to maximize skills formation in the region, and; 4) allocating spending between central and subnational governments.
Age-Related Spending: Favoring the Elderly over the Young
The good news: people in Latin America and the Caribbean are living lon-ger and healthier. The region’s advances in health and life expectancy are a major accomplishment. The bad news: a longer-living, aging population poses long-term fiscal challenges and, unlike Europe, Latin America and the Caribbean is growing older before its incomes rise sufficiently. Many Latin American and Caribbean countries spend heavily on pension and health benefits today, even though their populations are still relatively young. This fiscal burden is going to increase further over the coming decades as the number of old people rises much more rapidly than it did in Europe.
The worldwide decline in birth rates and increase in life expectancy (or lower mortality rates) is known as the demographic transition. In Latin America and the Caribbean, the percentage of the population aged 65 and above jumped from about 3.5 percent in 1950 to 7.6 percent in 2015 and will climb to 19.4 percent in 2050 (Figure 3.9A). In fact, the number of people over 65 will triple in the region in the next 35 years from 48 mil-lion to 150 million. Given the current retirement age, more people will have to be supported for a longer period of time by fewer people (if there is no change in the labor force of older people). In Europe, the population aged 65 and above took 65 years to triple from 1950 to 2015, giving more time to accommodate the older generation (Figure 3.9B).
In fact, as the population transitions from high to low levels of fertil-ity and mortality rates, a country can enjoy the “demographic dividend” (Mason and Lee, 2006), that is, the result of a temporary, proportionately higher working-age population growth relative to the economically depen-dent population.24 As fertility levels decline, the dependency ratio falls initially because the proportion of children decreases while the propor-tion of the working-age population increases, and the older cohort is still small. This window of opportunity for Latin America and the Caribbean is
24 The exact definition may vary. The demographic window for the dividend is defined by the United Nations as open when the proportion of the population aged 0–14 is below 30 percent and the proportion of the population aged 65+ is still below 15 per-cent. It coincides mostly with the period when the total dependency ratio declines.

22 BETTER SPENDING FOR BETTER LIVES
much smaller than in Europe; it started approximately in 2005 and will last about 30 years until 2035–2040 (Figure 3.9A). The window of opportunity in Europe lasted longer, from 1950 to 2000 (Figure 3.9B).
Is the window an asset or a liability? This will largely depend on how governments use it to their advantage. Without major reform that induces older people to work longer, human capital to increase, or tax rates to increase unacceptably, pension programs will either go into an increasing deficit or pay a much-reduced pension. Before the declining trend ends, the region could exploit this bonus by raising the skills and productivity of the workforce, thereby alleviating the burden of dependents on workers.
Figure 3.9 Evolution of the Distribution of Population by Age Groups and the Window of Opportunity, 1950–2100
% of
popu
lation
B. Europe
20
010
4050
30
7060
80
15–640–14 65+ 0–14 or 65+
1950
1955
1960
1965
1970
1975
1980
1985
1990
1995
2000
2005
2010
2015
2020
2025
2030
2035
2040
2045
2050
2055
2060
2065
2070
2075
2080
2085
2090
2095
2100
Window of opportunity
% of
popu
lation
A. Latin America and the Caribbean
20
010
4050
30
7060
80
1950
1955
1960
1965
1970
1975
1980
1985
1990
1995
2000
2005
2010
2015
2020
2025
2030
2035
2040
2045
2050
2055
2060
2065
2070
2075
2080
2085
2090
2095
2100
Window of opportunity
Source: Authors’ own calculations based on UN medium projection scenario (2017).Note: The demographic window is open when the proportion of the population aged 0–14 is below 30 percent and the proportion of the population aged 65+ is still below 15 percent (as defined by the United Nations).

THE (IN)EFFICIENCY OF PUBLIC SPENDING 23
Pension spending continued to increase to reach 4.4 percent of GDP in 20 Latin American and Caribbean countries. Not surprisingly given the region’s younger population, this is below the EU average of 9 per-cent. However, even with fewer old people, Brazil, Uruguay, and Argentina spend more than the OECD average (Figure 3.10A). The differences in cur-rent public pension spending across countries reflect mainly differences in old-age dependency ratios, the generosity of benefits, and coverage rates. European economies have replacement rates25 of between 40 and 60
25 Replacement rates are the percentage of a worker’s pre-retirement income that is paid out by a pension program upon retirement; it serves to evaluate if the benefit is adequate to smooth consumption across active and passive life stages.
Figure 3.10 Pension Spending (% of GDP) and the Old Age Dependency Ratio (OAD), 2017
B. OAD in Latin America and the Caribbean, 2015–2065
Total
pens
ion ex
pend
iture
(% G
DP)
Old a
ge de
pend
ency
ratio
(%)
A. Pension spending increases with OAD
20
68
4
1012141618
0 0
20
10
30
40
60
50
100
200
300
400
500
600
HTI
BLZ
GUY
GTM
BOL
SUR
PRY
HND
VEN
DOM
ECU
PAN
ARG
PER
TTO
SLV
NIC
MEX
URY
BHS
COL
BRB
BRA
CHL
CRI
JAM
2015 2065 Percentage change
Europe LAC
Old age dependency ratio0 5 10 15 20 25 30 35 40
R² = 0.5314
ISL
IRL
LUX
NORSVK
ARG
BHS BRBBLZ
BOL
BRA
CHL
COL CRI
DOM
ECU
SLVGTMHND
JAMMEXNICPANPRY
PER TTO
URY
VEN
AUT
BELCZE DNK
FIN
FRA
DEUHUN
ITA
NLDNOR
PRTESP
SWECHEGBR
EST
SVN
LVA
Source: Authors’ calculation based on UN (2017), IDB-FMM Public Spending Database, IMF-WEO da-tabase (2018), and OECD, Social Expenditure Dataset, OECDstat 2017.

24 BETTER SPENDING FOR BETTER LIVES
percent, near universal coverage, and old-age dependency ratios above 20 percent. Latin American and Caribbean replacement rates in defined benefit systems are higher than 60 percent and, in some countries, almost 100 percent (Berstein et al., 2018); coverage in direct benefit (DB) systems is less than 50 percent and, hence, compensated with more noncontribu-tory pensions coverage, and old-age dependency,26 will increase rapidly from 11.5 percent in 2015 to 27.6 percent in 2065 (Figure 3.10B).27
In theory, the contributory pension system covers employed and some-times self-employed persons and is financed by contributions levied on employment earnings. Most countries in Latin America and the Caribbean (16) have a DB pension system committed to paying a pension based on the last wage or an average of wages in the last five or 10 years. Five of the 26 IDB countries (Bolivia, Chile, El Salvador, Mexico, and the Domini-can Republic) have a defined contribution (DC) system (in transition), where each worker contributes to their pension through their individual account and receives what he has contributed at the end of his working life. Another five countries (Colombia, Costa Rica, Panama, Peru, and Uruguay) have a mixed DB and DC system. One of the main reasons to shift from a DB to a DC pension plan is that the DC plan provides a clear and direct link between contributions and benefits. However, changing systems did not correct the original design flaw. Pensions are still associated with workers’ formal status. Thus, despite the change, informal workers continue to have low coverage.28 Also, since mandatory payroll contributions are required for both systems, the government has an implicit contingent liability in case the private system does not deliver a pension or the threshold of a predefined minimum pen-sion. In fact, in the last decade most of the DC systems, confronted with lower real rates of interest29 and, hence, low replacement rates, enacted minimum pension guarantees financed by the government,30 converting implicit into
26 Persons aged 65 and older for every 100 people aged 15–64.27 Hence, Latin America and the Caribbean would go from having 9 working-age peo-
ple per person aged over 65 years to only 2.7 working-age persons.28 Mandatory payroll contributions remained high and conditions for receiving a pen-
sion tightened, without giving incentives to informal employees. Hence, coverage rates for these systems and the overall contributory system in the region remain low.
29 When capitalization systems started in Chile in 1981, and then in the early 1990s in Peru, Colombia, and Argentina (which in 2008 reverted back to a DB system), returns on portfolios were in excess of 8 percent. But then average returns deteriorated, especially after the 2007 crisis, to at most 3 percent, depending on the portfolio composition.
30 Except Uruguay, the other nine countries with DC systems, confronted with low interest rates and expecting low replacement rates, enacted a guaranteed minimum pension. In some cases, the guarantee is fixed at some level of the minimum wage.

THE (IN)EFFICIENCY OF PUBLIC SPENDING 25
explicit contingent liabilities. Risks to financial sustainability in DC systems arise, then, from the transition, the social pension, and guaranteed minimum pensions. During the transition, the challenge is how to finance the ben-efits to workers who have already retired or will retire soon but belong to the old system.31 In some countries, a social security fund has given rise to the notion that it is a self-sustaining program that poses no threat to the broader fiscal outlook. The reality, however, is that social security spending is part of consolidated government spending, although sometimes it is off-budget. To gauge the importance of future liabilities on spending for aging, projections are elaborated through a stylized accounting model. The differ-ent scenarios32 draw on demographic projections from the United Nations and methodologies from the European Commission (2009) and IMF (2011) to derive spending projections (Pessino and Zentner, 2018). For DB pen-sions, the simplest scenario is that pension spending as a percentage of GDP changes only with the OAD ratio and the employment rate.33 These are rough estimates than using an actuarial model that is more detailed in terms of the earning and history of contributions of the different cohorts. This baseline model assumes all the other parameters of the system remain constant: the coverage and the replacement ratio do not change. For most countries, pension spending in the latest year available includes the main public pension system, the noncontributory system, and the most important civil service systems and state systems. The difficulty arises with the projec-tion of the DC systems. If there were no contingent liabilities, just estimating the spending on the transition of the pensioners that are unfunded would be
31 In some cases, the interest rate paid on government debt is lower than the market rate, subsidizing the public sector at the expense of workers’ retirement savings. This was the case in El Salvador, which underwent a reform in 2017 and improved the return on savings.
32 These projections do not predict the most probable event but provide better infor-mation and are hence a good planning tool to evaluate current policies and changes.
33 The identity decomposes public pension expenditure (PE) as a share of GDP (PE/GDP) into four main drivers: aging (measured by the OAD ratio); eligibility rates (the number of pensioners as a proportion of the population 65 and older); replacement rates (the ratio of average pensions to average wages); and labor force participation rates (see IMF [2011] for more details):
PEGDP
=population 65+
p
Old-Age Dependency Ratio
opulation 15–64*
pensionerspopulation 65+
*average pensionaverage wage
*population 15–64
workers*
compensation
GDPCompensation share
Replacement Rate Inverse of Employment RatioEligibility Ratio

26 BETTER SPENDING FOR BETTER LIVES
enough. But with the potential payment minimum pensions, the government steps in and may end up paying part of the pension of future retirees.34, 35
On average, pension spending increases two and a half times from 2015 to 2065.36 As seen in Figure 3.11A, projected pensions for 2065 vary widely: in countries with DC systems pension’s growth will be lower than in DB countries, but continue to rise. Outstanding spending in Brazil’s DB system will increase four times owing to the high aging gradient as well as the fact that most people retire before 60 or 65 years old and receive at least the minimum wage as a pensioner.37
Health spending is also growing significantly faster than are econo-mies overall. As of 2015, average spending in Latin America was 4 percent of GDP (Figure 3.11B). The region is still only beginning the demographic transition and has not found an efficient health system combination.38 The literature has identified both aging and nondemographic factors such as income, technological advance, productivity, and health policies (called excess cost growth or ECG) as the key factors behind rising health-spend-ing-to-GDP ratios. Currently, there is almost no actuarial analysis of health expenditure. The health expenditure projection presented here uses UN demographic projections and relative average health-care costs by age39 to illustrate that long-term healthcare spending in the region could rise significantly over the next five decades.40 It assumes that demographic
34 Since this probability increases for low-wage workers, a rough assumption is that for the countries with minimum pensions, half of the current pension expenditure will not disappear but will grow in the same way as DB systems. For countries without guarantees (i.e., Uruguay), the assumption is that 25 percent of current spending will be subject to pay (implicit) minimum pensions. A probabilistic model to better cap-ture these contingencies is under construction.
35 The actual replacement rate for an average worker in a DB system is 43 percent of the average wage, significantly higher than that estimated in a pure capitalization system (29 percent) without minimum pensions (Berstein et al., 2018).
36 It is less than triple the OAD because of mainly three events: 1) the increase in labor force participation of older cohorts; 2) the lower increase in pension spending as the transition from DB to DC systems ends; and 3) limits placed by some countries on the indexation of pensions to, at most, the level of inflation.
37 Other recent studies project pensions for a subset of countries (Acosta-Ormaechea, Espinosa-Vega, and Wachs, 2017) and for health (Glassman and Zoloa, 2014).
38 See Chapter 8 and Pessino, Pinto, et al. (2018).39 See National Transfer Accounts (NTAs), a system of portraying official national
accounts with demographic patterns by age.40 See Panadeiros and Pessino (2018) for the full methodology and alternative sce-
narios. Significant uncertainty surrounds health-care projections, not only with risks associated with demographic and nondemographic factors but about uncertainties regarding how health status will change as life expectancy increases.

THE (IN)EFFICIENCY OF PUBLIC SPENDING 27
factors will not be the only important driver of future health-care expen-ditures, but that nondemographic factors will play a critical role over the long run. On average, health spending doubles in the next 50 years, 27 percent due to demographic factors and the rest to ECG. Countries that increase proportionally more are because they are aging faster or because health costs, particularly for the old, tend to grow faster than GDP.
Without reforms, public spending on aging in the region (pensions, health care, and education), is expected to increase from 16 percent to
Figure 3.11 Pension and Health Expenditure Projections, 2015–2065
B. Health spending
A. Pension spending
% G
DP%
GDP
0
5
0
15
10
102030405060
2015 2065
Arge
ntina
Domi
nican
Repu
blic
Boliv
ia
Urug
uay
Nica
ragu
aCo
sta R
ica
Colom
bia
Braz
il
El S
alvad
or
Pana
ma
Mexic
oPa
ragu
ay
Chile
Guate
mala
Beliz
e
Peru
Hond
uras
Barb
ados
Ecua
dor
Baha
mas
12.5 11.4 4.412.1
3.0 5.5 3.0 5.5 2.4 3.1 3.1 3.0 1.7 3.5 4.1 3.0 2.1 2.2 1.2 0.9
50.1
21.0 18.0 16.7 14.1 13.1 10.2 9.8 9.1 8.0 7.3 6.7 6.3 6.2 5.7 5.0 4.4 4.2 2.7 1.4
Costa
Rica
El S
alvad
or
Urug
uay
Colom
bia
Hond
uras
Arge
ntina
Chile
Braz
il
Mexic
o
Peru
6.84.5 6.1 5.5 4.4 6.4
3.9 4.2 3.3 3.3
13.1 12.9 12.1 11.4 10.9 10.38.9 8.1
7.0 6.0
Source: Authors’ calculation based on Pessino and Zentner (2018) and Panadeiros and Pessino (2018). Note: Panel A: The pension projection assumes a) DB systems are aggregated with noncontributory sys-tems and government spending in DC systems assumed to grow in part as DB systems depending on the existence of minimum pensions or a mixed system; b) the old age dependency ratio was modified accord-ing to the population and the inverse of employment ratio projections; and c) in case of a recent reform in pension indexation a change is introduced in the replacement ratio. All the other components of the formula are kept constant.Panel B: The health projection corresponds to Scenario IV in Panadeiros and Pessino (2018) and assumes spending increases because of aging and because there is excess cost-growth, defined as the excess of growth in health expenditure to GDP attributable to the combined effect of nondemographic factors.
28 BETTER SPENDING FOR BETTER LIVES
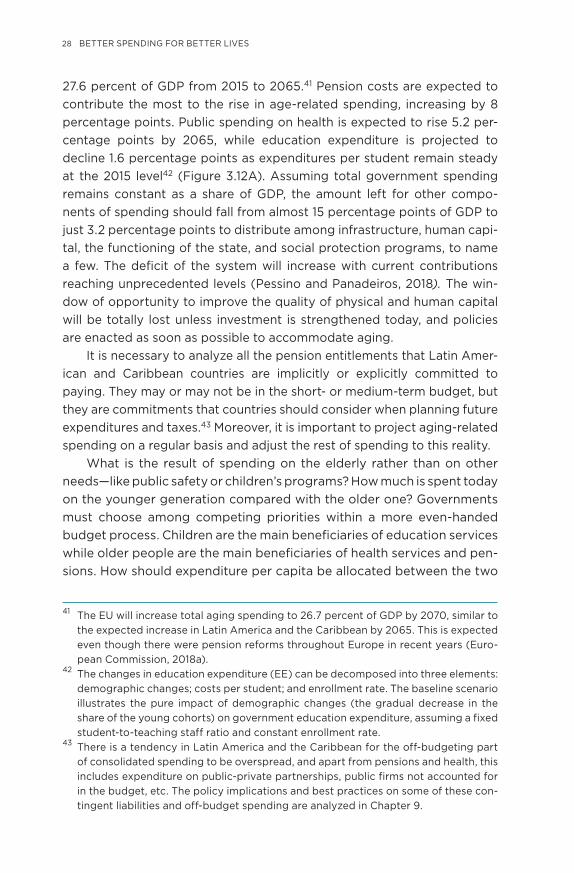
27.6 percent of GDP from 2015 to 2065.41 Pension costs are expected to contribute the most to the rise in age-related spending, increasing by 8 percentage points. Public spending on health is expected to rise 5.2 per-centage points by 2065, while education expenditure is projected to decline 1.6 percentage points as expenditures per student remain steady at the 2015 level42 (Figure 3.12A). Assuming total government spending remains constant as a share of GDP, the amount left for other compo-nents of spending should fall from almost 15 percentage points of GDP to just 3.2 percentage points to distribute among infrastructure, human capi-tal, the functioning of the state, and social protection programs, to name a few. The deficit of the system will increase with current contributions reaching unprecedented levels (Pessino and Panadeiros, 2018). The win-dow of opportunity to improve the quality of physical and human capital will be totally lost unless investment is strengthened today, and policies are enacted as soon as possible to accommodate aging.
It is necessary to analyze all the pension entitlements that Latin Amer-ican and Caribbean countries are implicitly or explicitly committed to paying. They may or may not be in the short- or medium-term budget, but they are commitments that countries should consider when planning future expenditures and taxes.43 Moreover, it is important to project aging-related spending on a regular basis and adjust the rest of spending to this reality.
What is the result of spending on the elderly rather than on other needs—like public safety or children’s programs? How much is spent today on the younger generation compared with the older one? Governments must choose among competing priorities within a more even-handed budget process. Children are the main beneficiaries of education services while older people are the main beneficiaries of health services and pen-sions. How should expenditure per capita be allocated between the two
41 The EU will increase total aging spending to 26.7 percent of GDP by 2070, similar to the expected increase in Latin America and the Caribbean by 2065. This is expected even though there were pension reforms throughout Europe in recent years (Euro-pean Commission, 2018a).
42 The changes in education expenditure (EE) can be decomposed into three elements: demographic changes; costs per student; and enrollment rate. The baseline scenario illustrates the pure impact of demographic changes (the gradual decrease in the share of the young cohorts) on government education expenditure, assuming a fixed student-to-teaching staff ratio and constant enrollment rate.
43 There is a tendency in Latin America and the Caribbean for the off-budgeting part of consolidated spending to be overspread, and apart from pensions and health, this includes expenditure on public-private partnerships, public firms not accounted for in the budget, etc. The policy implications and best practices on some of these con-tingent liabilities and off-budget spending are analyzed in Chapter 9.

THE (IN)EFFICIENCY OF PUBLIC SPENDING 29
groups? The decision of how to allocate lifesaving resources between the young and the old is as much about equity as it is about efficiency. Latin American and Caribbean governments spend an average $4,000 per capita on people aged 65-plus, about $500 per capita on people
Figure 3.12 Composition of Total Expenditure and Per Capita Expenditure by Age Group
Pension Health Education Other
Reduced fiscal spacefor other expenditures
B. Per capita government spending by age group in US$, 2015–2016
A. Composition of expenditure in 2015 and projection for 2065
US$
0
0–4
5–9
10–1
4
15–1
9
20–2
4
25–2
9
30–3
4
35–3
9
40–4
4
45–4
9
50–5
4
55–5
9
60–6
4
65–6
9
70+
2015
2065
0 5 10 15
10.1
5.9 4.9 5.2 14.8
13.9
27.6
16
3.6 3.2
20 25 30 35
1000
2000
3000
4000
5000
Health Socialprotection
Education Housing andcommunity amenities
Other socialspending
Source: Panel A: Authors’ calculation based on Figure 3.11 and education projections (see text). Panel B: Authors’ calculation based on FMM/IDB database on Public Expenditure, and National Trans-fer Accounts (NTAs).Note: Panel A: See Note to Figure 3.11A for pension projections and to Figure 3.11B for health projec-tions. The average spending includes 10 countries: Costa Rica, Brazil, Honduras, Argentina, Mexico, Colombia, Chile, Uruguay, Peru, and El Salvador. Panel B: Spending on health, education, and social protection is attributed to different age groups according to National Transfer Accounting Data, the proportion of education spending by level of education, and in social protection imputing pensions to older groups, unemployment insurance to working individuals, and conditional cash programs to children. The resulting spending per category is divided by the population in each age group. Fifteen countries are included in the average: Argentina, Bolivia, Brazil, Chile, Colombia, Costa Rica, the Dominican Republic, El Salvador, Guatemala, Honduras, Mexico, Nicaragua, Paraguay, Peru, and Uruguay.

30 BETTER SPENDING FOR BETTER LIVES
aged 30 to 49, $1,000 on young people between 10 and 25 years, and $1,500 from birth to 10 years of age. That is, they spend about four times more on older people than on younger people (Figure 3.12B). The cur-rent system of public expenditures is unfair to younger generations: the vast and growing size of unfunded health and retirement benefits will require today’s children to bear a heavy tax burden when they grow up to be working-age adults. For the younger cohort’s sake, elderly benefits should pay their share of taxes before transferring it to the next gener-ation. While equity is undoubtedly affected by the allocation of public monies across age groups44 and across generations, efficiency is also very much affected. A lower accumulation of human capital among dis-advantaged families leads to losses in the social rates of return to early childhood investments and impacts growth.
Spending on Physical Capital, Human Capital, and Transfers
In the last 60 years, growth in Latin America and the Caribbean has been low compared to much of the rest of the world. Most Latin American and Caribbean countries did not converge to the expected “higher-income country” category. In 1960, the region was expected to be on the verge of significant economic growth. Both school attainment and income were well ahead of those of East Asia. But by 2000, growth and income per capita in East Asia were far ahead of Latin America. The reason for this disappointing performance seems to lie in the low quality of human and physical capital, and total factor productivity (TFP), or “efficiency.” The hypothesis is that inefficient government spending in the region did not contribute to convergence. This section concludes that fiscal policy could contribute to reduce the persistent income gap by: 1) improving the quantity, but mainly the quality, of factor accumulation, in particu-lar accumulation of skills; 2) improving the allocative efficiency of public spending; 3) eliminating distortions that cause misallocation of resources and focusing more on closing the efficiency gap; and 4) avoiding too
44 For example, in Brazil, pensions played a significant (albeit inefficient) role in the quest against old-age poverty, and have been successful in reducing it well below the populationwide average. At present, all pension recipients receive at least the mini-mum wage, which is almost 10 times as much as the extreme poverty line. Further real increases in the level of the minimum pension will hence have hardly any pov-erty impact, while at the same time, poverty is significantly above average among children and youth (Barros et al., 2010). Similar considerations apply in the case of Argentina (Lustig and Pessino, 2014).

THE (IN)EFFICIENCY OF PUBLIC SPENDING 31
large a total spending ratio, especially if a country suffers from poor governance.
Physical and human capital are both important for growth, and the allocation of government spending to each of them should be based on rates of return and contribution to growth. An investment strategy that emphasizes physical capital to the exclusion of human capital fails to capture the benefits that can arise from a more balanced investment strat-egy.45 It takes skilled workers to make the most efficient use of modern digital technologies. How does each type of investment affect growth? What is gained and lost by concentrating too much on current “populist” expenditure versus investment? If Latin America and the Caribbean over-invests in one type of capital or underinvests in another, opportunities for improvement in wealth are lost.
Human and physical capital versus transfers in growth. This section tack-les the question of how physical and human capital investment, including public spending, promote growth.46 Latin America and the Caribbean has been experiencing long-term stagnation or low growth due to the low pro-ductivity of its factors of production despite an increase in the number of workers and the capital stock (Crespi, Fernández-Arias, and Stein, 2014). Fiscal policy and public spending played an important role in the region’s low growth in recent decades. There is likely to be a trade-off between pub-lic spending aimed at income redistribution (via social spending) and that aimed at raising growth and income levels. Moreover, the mix and qual-ity of physical and human capital investment also influences growth rates and income levels. Hence, this section analyzes the allocative efficiency of spending on physical capital (investment), human capital, and transfers.
The estimation of the standard and extended convergence growth model—increasing the sample of OECD countries in Fournier and Johans-son (2016) with LAC countries—is based on a conditional convergence equation that relates real growth of per capita GDP to the initial level of income per capita, the investment-to-GDP ratio, a measure of human
45 It is important to analyze both types of investment together because there is strategic complementarity in the incentives to invest. Workers invest in skills to increase their wages. But without continued improvement in the technologies used by firms, the returns to workers’ investments would decline and, eventually, be too small to justify further investment. Similarly, without continued improvement in the skills distribution of the workforce, the incentives for firms to invest in better technologies would decline. Sustained growth requires continued investment in both factors (Stokey, 2016).
46 Chapter 4 analyzes how different categories of public spending promote equity.

32 BETTER SPENDING FOR BETTER LIVES
capital,47 and the population growth rate, augmented with government expenditures (Altinok and Pessino, 2018). The estimation uses a combined IDB/OECD database on crossed economic and functional public expendi-ture. While the OECD published a database on public expenditure (Bloch et al., 2016), a more recent work (Pessino, Badin, et al., 2018) extended the same data for Latin American countries (Argentina, Brazil, Chile, Costa Rica, El Salvador, Guatemala, Honduras, Mexico, Peru, Paraguay, and the Dominican Republic).48 The extended government expenditure variables are the size of the government (total underlying primary spending to GDP), and the structure of primary spending.
The estimated growth equations show significant positive effects of the production factors on growth and plausible convergence rates. The esti-mated effect of human capital proxied by school attainment interacting with quality is always significant; a 1 percent increase in human capital would increase long-run GDP by close to 1 percent. Moreover, the effect is some-what larger for Latin American countries. The effect of the investment rate is also positive and significant; a 1 percent increase in the rate would increase GDP close to 0.9 percent. According to the “iron law of convergence,” countries converge to the productivity frontier at about 2 percent per year (Barro, 2015), which is roughly the rate estimated in the regressions. Thus, it takes approximately 35 years to close half of the initial GDP per capita gap. However, the rate of convergence is much higher for the OECD countries.
When public spending size and shares are added, first, larger govern-ments are significantly and negatively associated with long-term growth but the more effective the government, the less harmful its size for long-term growth.49 Keeping total spending of GDP constant, the share of spending on productive items (education and investment) rather than
47 The human capital variable is constructed as the interaction between years of schooling and quality. The quality of education variable is proxied by PISA scores in the OECD and harmonized with Latin American scores according to Altinok, Angrist, and Patrinos (2018). It is a newly updated data set of 80 countries including 18 Latin American and Caribbean countries that have ever participated in a worldwide stu-dent achievement test, covering more than 95 percent of the region’s population .
48 Expenditure categories are based on crossed economic-functional classifications, following the methodology used by the OECD. Latin American countries do not pres-ent homogenous classifications and many of them have not adopted COFOG yet. Thus, specific adjustments were made in each country according to data availability (Pessino, Badin, et al., 2018).
49 Fournier and Johansson (2016), to test the hypothesis that the impact of government size on growth may vary according to public-sector effectiveness, consider various indicators of government effectiveness from the World Bank’s World Governance Indicators (WGI) database.

THE (IN)EFFICIENCY OF PUBLIC SPENDING 33
transfers boosts long-term economic growth. When education and pub-lic investment are separated, only public investment has a significant and , positive effect on economic growth, while the effect of education spend-ing is positive but not significant. This implies that reallocating spending to infrastructure and improving quality education spending can raise growth rates over the long run. Importantly, when it comes to education, the key is to increase quality, not just school attainment or spending. The effect of public investment on growth is high: a 1 percentage point increase in the share of public investment spending would increase the long-term GDP level by more than 8 percent. However, when social spending, excluding education, is increased at the expense of productive investment, growth decreases. Relative to total spending, transfer spending may have growth reducing effects.50
Hence, while allocative efficiency among spending components is important for growth, when considering high-quality human capital rather than higher education spending, total investment, and spending on infra-structure, a government that is too big or that spends heavily on transfers may actually diminish growth.51 How can governments make room in their budgets to increase human and physical capital expenditures? One way is by decreasing waste in transfers, civil service, and procurement. They can also switch expenditures, largely transfers and particularly those that are less effective in reducing extreme poverty and inequality (see Chapter 4).
Development accounting. A complementary approach that helps explain the contribution of factors of production and overall efficiency to income per capita is development accounting. It provides a means of decomposing variations in the level of GDP per capita between countries into the differ-ent components of input factors (physical and human capital) and TFP (the
50 Holding constant the total budget, the estimated parameter from introducing each spending component separately is interpreted as the effect of increasing that com-ponent and decreasing the rest, maintaining total spending constant (Gemmell, Kneller, and Sanz, 2016).
51 Wagner’s Law suggests that during the process of economic development, the share of public spending in national income tends to expand. Thus, the direction of cau-sality between these two variables is unclear. Since this negative relationship might be also explained by the structural difference between Latin American and OECD countries, robustness checks were conducted: a) for potential reversal causal issues for government size by using IV estimation; b) for the impact of government size on economic growth by restricting the data to the period before the 2008 crises; and c) country-fixed effects were used to purge any country-specific characteristic from the analysis. Results were mostly robust to these tests (Altinok and Pessino, 2018).

34 BETTER SPENDING FOR BETTER LIVES
residual, sometimes referred to as the “measure of our ignorance”). Much recent research about the determinants of income differences has aimed to understand the reasons for Latin America and the Caribbean’s failure to reduce its income gap of about one-fifth of the output per worker with the United States (and other high-income countries). According to earlier development accounting studies, both capital gaps and efficiency gaps were very large: the average Latin American and Caribbean country has less than half the capital (human and physical) per worker of the United States and uses it less than half as efficiently. Differences in TFP, or effi-ciency in using the production factors, explained the largest part of Latin America and the Caribbean’s persistent income gap (Bils and Klenow, 2000; Hsieh and Klenow, 2010; Caselli, 2016). The region’s TFP was about 0.86 that of the United States in 1960 and began to fall in the 1970s to about 0.56 of TFP in the United States in 2014. In contrast, the four Asian Tigers (Taiwan, China; the Republic of Korea; Hong Kong SAR, China; and Singapore), had a TFP gap of 0.47 in 1960, and grew steadily to duplicate and reach a TFP relative to the United States of 0.89 in 1990 and stabilize to 0.73 in 2014 (Figure 3.13A).
Recent development accounting work52 suggests that the role of human capital is higher than the 20 to 30 percent initially estimated in accounting for income differences. The earlier literature ignored differ-ences in human capital quality, using average years of schooling as the only input, implicitly assuming that one year of schooling in high-income
52 Hanushek and Woessmann (2012), Schoellman (2012), Manuelli and Seshadri (2014).
Figure 3.13 Evolution of Total Factor Productivity (TFP), ratios to U.S. TFPTF
P ra
tio to
US
TFP
(%)
40
60
80
50
70
90
100
Latin America and the Caribbean 4 Asian Tigers EU Oceania
1960
19
61
1962
19
63
1964
19
65
1966
19
67
1968
19
69
1970
19
71
1972
19
73
1974
19
75
1976
19
77
1978
19
79
1980
19
81
1982
19
83
1984
19
85
1986
19
87
1988
19
89
1990
19
91
1992
19
93
1994
19
95
1996
19
97
1998
19
99
2010
20
11
2012
20
13
2014
Source: Authors’ calculation based on Penn World Tables 9.0.

THE (IN)EFFICIENCY OF PUBLIC SPENDING 35
countries is as productive as one year of schooling in low-income coun-tries. But if it is more productive, human capital may be able to account for a larger share of income differences than previously thought. Account-ing for human capital quantity and quality for 50 countries, Hanushek and Woessmann (2012) find that about 60 percent of the differences in income between Latin America and the Caribbean and the rest of the world can be attributed to human capital. This leaves the residual, that is TFP, with a lower “accounting” role in determining income differences. In other words, its contribution to growth is underestimated and what is pure TFP gap may be overestimated. New literature found that human capital accounts for anywhere from 0.2 to 0.8 cross-country income differences, with TFP, in turn, accounting for anywhere from 0.6 to none (and capital in 0.2).53
But lower GDP per capita in Latin America and the Caribbean com-pared to the United States also depends on distortions in the allocation of labor due to incentives to hire workers in the informal sector. This has the potential to distort another very important component of human capital—on-the-job training (OJT).54 The excessive tax burden on formal employment, with a social security system that discriminates in favor of for-mal workers, has forced the region to create parallel noncontributory social security programs for health, pensions, and social transfers. Consequently, the region has reached a point where it levies various fiscal charges (labor related and otherwise) on formality and subsidizes informality, promoting in turn more informality because it creates incentives for businesses and
53 By how much would income per capita increase in Latin American and Carib-bean countries if school attainment and cognitive skills were increased? Increasing enrollment would have an average 134 percent effect on GDP, and improving basic cognitive skills for all students by almost fivefold would increase projected output by 550 percent (with GDP in Honduras increasing more than 12 times, in Peru 9 times, and in Argentina 7 times). This is four times larger than a similar increase in OECD countries. These simulations do not necessarily reflect a rise in education spending; they could reflect education policy reforms, increasing the technical and allocative efficiency of education (Hanushek and Woessmann, 2012, 2015).
54 The most plausible reason for the low OJT of informal workers is that training has a cost while benefits accrue in the future with higher labor productivity (Becker, 1964). Since usually informal labor and firms are expected to be more short-lived than for-mal firms, OJT will have lower benefits and, hence, less provided in them. Also, costs of OJT tend to be lower in the formal sector, since usually workers are more educated and learning begets learning (Heckman and Masterov, 2007). OJT for active work-ers takes place largely in formal firms for workers with some degree of education. Alaimo et al. (2015) analyze this pattern for Chile, Ecuador, and El Salvador, finding that the difference in the incidence of OJT between formal and informal workers is striking. In Ecuador and El Salvador, hardly any informal workers receive training, in contrast to 20 percent and 30 percent of formal workers.

36 BETTER SPENDING FOR BETTER LIVES
workers to continue to operate in the informal sector in low-productivity activities (Levy, 2015; Busso, Fazio, and Levy, 2012). In fact, informality in the region, defined as the percentage of workers not contributing to social security, is between 40.6 percent (including only salaried workers) and 56.9 percent (including all workers). Given the small proportion of productive capital in the informal sector and the limited size of informal enterprises or firms, largely to avoid labor or other taxes, productivity is extremely low in these economic activities. Through quantification of the dispersion of pro-ductivity and distortions, the potential gains in TFP of reallocating resources more efficiently across firms in Latin America and the Caribbean to equalize marginal products in manufacturing would be to raise aggregate TFP in the region between 40 and 120 percent, depending on the countries and years considered (Busso, Madrigal, and Pagés, 2013).
But returns to work experience are also lower in the informal sector, suggesting that not only TFP but human capital accumulation is impaired by informality. Estimating Mincerian wage profiles for countries in the region using household data shows that they are flatter for informal sec-tor workers.55, 56
Hence, in an economy with high levels of informality, the stock of human capital is lower, inasmuch as the share of informal labor is high and the return to experience in the informal sector is lower than in the formal sector. OJT is an important source of human capital: in rich countries it accounts for 43 percent of all available human capital and in poor coun-tries it represents 32 percent of the total, suggesting that policies that influence OJT can have a potentially large impact on output per worker (Manuelli, 2015). In short, pervasive informality in the region affects labor productivity through two channels: lowering TFP through misallocation to less-productive informal firms in the region, and negatively affecting the amount of human capital. When experience is included in the human capital production function, the importance of human capital increases
55 In Mexico the return to experience is about double the size in the formal than in the informal sector by at least 1 percentage point (Arias et al., 2010) and preliminary cal-culations show a similar pattern for most countries in Latin America.
56 What is the implication of this formal-informal experience return gap to OJT in terms of human capital accumulation? Using the Mincer representation of an earnings func-tion, aggregate human capital h combines years of schooling S and test scores T according to returns in the labor market, which is added to experience E to obtain a function h erS wT E= γ+ + . The three parameters r, w, and γ are the earnings gradi-ents for each component of h and are used as weights to map years of schooling S, test scores T, and potential experience E (OJT) into a single human capital indicator, according to their effect on individual earnings.

THE (IN)EFFICIENCY OF PUBLIC SPENDING 37
while that of TFP decreases. Integrating flatter experience wage profiles in development accounting, human capital accounts for 60 percent instead of 40 percent of cross-country income differences (Lagakos et al., 2012).57 If one accounts for all the components of human capital—quantity, quality, and experience—the role of TFP and physical capital decreases even fur-ther and that of human capital increases, likely to more than 60 percent. In the case of Latin America and the Caribbean, while school enrollment has increased in most countries, improving skills and reducing fiscal incentives to informality to increase productivity and the amount and returns to OJT seem to have the highest payoff to converge to higher income.58
A Budget for Skills Formation over the Life Cycle
As growth and income per capita depend to a large extent on the qual-ity of workers’ skills, this section analyzes how to improve the allocative efficiency of public spending on skills, considering that skills are formed initially within the family, later in school, and finally at work. Identifying the optimal allocation of public resources to skills formation at different stages of the life cycle is crucial to improving the quality of human capital, and the region should be guided by the best available evidence on the returns to different interventions.
Latin American and Caribbean countries have improved educational enrollment rates in recent decades, and educational attainment has risen from about three years of schooling on average in 1950 to nine years in 2010. The expansion in enrollment rates was fueled by significant increases in public spending. The region spends on average 3 percentage points more of its GDP on education than it did 25 years ago, and it is catching up with the spending of developed countries. Skills, however, seem to have improved much less (see Busso et al. [2017]; and Chapters 6 and 9 of this report). Additional efforts are thus needed to improve access to quality skills, especially for the less advantaged, and it is of the utmost importance to increase the effectiveness of spending.
57 They use international household-survey data to document that experience-wage profiles are flatter in poor countries than in rich countries (although not mentioned, likely the effect also of higher informality).
58 Individuals “choose” quantity and quality of schooling by maximizing lifetime income and hence human capital increases with wages, and in turn wages increase with TFP. Hence, the exogenous determinant of more demand for human capital is higher pro-ductivity (Manuelli, 2015). Digital technological progress, more efficient investment in capital, and lifting of distortions, might be potential exogenous drivers.

38 BETTER SPENDING FOR BETTER LIVES
Skills can be of different types—socioemotional, cognitive, or aca-demic—and they are not entirely determined by genetics. The benefits of skills are well documented: they raise productivity, promote opportu-nity, enhance workers’ and citizens’ flexibility, and hence affect growth. The importance of skills has become even more pronounced in the digital economy, as skill-biased technical change has shifted demand toward the more skilled. The wages of high-skilled labor are consequently expected to increase much faster than those of less-skilled labor in the new digital economy (Heckman and Mosso, 2014; Heckman, 2016).
Differences in skills between the advantaged and disadvantaged begin to appear at very early ages, even well before kindergarten, and there is evidence that these differences persist over time. This early divi-sion is hardly surprising, as families produce cognitive and socioemotional skills; in fact, the quality of home environments by family type is highly predictive of child success. The evidence shows dramatic differences in achievement test scores and in social and character skills across children from different economic and social groups. For the United States, Heck-man (2008) shows that differences in mathematics tests by income and education of the mother that existed at 6 years old are unchanged at 12 years old. Skills gaps likewise manifest themselves from an early age in Latin America. Enrollment rates for three- to four-year-olds increase sig-nificantly according to the parental income quintile (Figure 3.14A), and the enrollment rate for lower-income households is significantly lower than in higher-income quintiles. While all quintiles have increased their enrollment rates over time, a significant gap persists for ages 13 to 17 (sec-ondary education) and an even greater discrepancy for tertiary education. In fact, although government spending has focused on closing the gap in enrollment, skills continue to diverge throughout the life cycle. This divide is manifested in enrollment at critical levels for disadvantaged children, in secondary and tertiary education, and most dramatically in cognitive skills gaps among secondary school students. The region’s difference in mathematics skills, for example, is the widest in the world. A student from the poorest households in the region has only an 18 percent probability of performing above level 2 in mathematics, compared to 62 percent for a student from the richest households (Figure 3.14B). In turn, a student from the richest household in the region performs, on average, approximately as well as the poorest students in advanced-country households. Further-more, the best Latin American country performs on average worse than the worst advanced country; in terms of inequality of performance by socioeconomic status, the absolute gap in performance is even greater. Data from PISA 2015 also show a strong relationship between the number

THE (IN)EFFICIENCY OF PUBLIC SPENDING 39
of years that 15-year-old students spent in early childhood education and their scores on the PISA science assessment.
Such interventions during the early years have high returns because they take full advantage of brain sensitivity peaks and facilitate future learning, a phenomenon called “dynamic complementarity” (Cunha et al., 2006). Figure 3.15 shows the rates of return to one dollar invested in edu-cational interventions for disadvantaged and well-off children at different stages of the life cycle. Both lines show a similar pattern: the rate of return
Figure 3.14 Gaps in Skills by Socioeconomic Status of Parents
Top quintile Third quintile Bottom quintile
0
B. Math PISA assessment by socioeconomic status of parents, 2015100%
Enro
llmen
t rate
(%)
20
A. Enrollment rates by income and age group, Latin America and the Caribbean
3040
60
80
50
70
90100
Quintile 1 Quintile 2 Quintile 3 Quintile 4 Quintile 5Age 3-4 Age 5-6 Age 7-12 Age 13-17 Age 18-23
Domi
nican
Rep
ublic
Br
azil
Peru
Co
lombia
Ar
genti
na
Costa
Rica
Me
xico
Urug
uay
Trini
dad a
nd To
bago
Ch
ile
Gree
ce
Unite
d Stat
es
Portu
gal
Italy
Icelan
d Sp
ain
Fran
ce
Swed
en
Austr
ia Be
lgium
Ne
therla
nds
Norw
ay
Irelan
d Ge
rman
y Sw
itzer
land
Cana
da
Denm
ark
Finlan
d
Source: Panel A: Authors’ calculation based on Cerda and Pessino (2018b). Panel B: Authors’ calculation based on UNESCO, World Inequality Database on Education.

40 BETTER SPENDING FOR BETTER LIVES
decreases as age increases. However, in the first stages of life, the rates of return are much higher for interventions directed to disadvantaged chil-dren than to well-off children. At later stages, however, returns are higher when investing in education for wealthier children, although early inter-ventions for the disadvantaged can reduce this gap. Later interventions are less efficient because they take place after a crucial “development win-dow” closes, and they have lower returns if the student lacks the abilities to succeed at later stages. Children from advantaged backgrounds have often already developed these abilities due to major parental investments that disadvantaged children do not receive.
Further evidence suggests that the economic returns are low for the education of low-ability adolescents but higher for more-advantaged high-ability adolescents. Interventions for low-ability adolescents have positive effects, but they generally cost more than early remediation to achieve the same level of adult performance (Cunha and Heckman, 2007, 2008). Indeed, evidence points to returns in the later stages of child schooling being higher for high-ability children from more-advantaged environ-ments, while interventions at very early ages have higher returns for the most disadvantaged.59 Recent estimates from Heckman’s research team show that the internal rate of return to high-quality early childhood invest-ments, such as the Pre-Preschool or Abecederian programs in the United States, is on the order of 13 percent, for a cost-benefit ratio of about 7.60 Data from Latin America and the Caribbean suggest that, at current lev-els of public expenditure, investments in early childhood have even higher returns than in the United States, especially when targeted to disadvan-taged children. The Jamaica early childhood study (Gertler et al., 2014), found that the intervention increased adult earnings by 25 percent, imply-ing an internal rate of return of about 21 percent (Carneiro and Flores, 2018). Later interventions, such as pre-primary schooling in Uruguay, have a high but nonetheless lower rate of return at 16 percent (Berlinski, Galiani, and Manacorda, 2008).
How should governments prioritize investment in skills? In the case of skills investment, rates of return for the disadvantaged and not for
59 This literature does not suggest that no investments should be made in schooling or subsequent on-the-job training, which are major sources of skills formation. Indeed, the complementarity or synergy between investments at early and later ages suggests that early investment must be complemented by later investment to be successful.
60 There have very substantial long-term benefits not only in terms of the employment and earnings of program participants, but also in terms of their health and criminal behavior (García et al., 2016).

THE (IN)EFFICIENCY OF PUBLIC SPENDING 41
everybody in the population should be compared along the life cycle. Obviously, the returns to secondary or tertiary education for marginal stu-dents, for average students, and for those who do not go to school at that level are very different.61
In fact, as shown in Figure 3.15, average returns to early education underestimate true returns for low-skilled children, while comparable figures for later education overestimate returns for low-ability children. The opposite is true for students coming from more-advantaged back-grounds, as suggested by evidence from the United States and Europe. Carneiro, Heckman, and Vytlacil (2011) estimate the returns to college for persons at the margin of attending college (MTE, the marginal treat-ment effect), as well as the average return of those who go to college (ATE, average treatment effect), and what the return would be for those who do not go to college (TUT, average treatment on the untreated effect). The differences are substantial: returns can vary from −15.6 per-cent (for low-ability individuals who would lose from attending college) to 28.8 percent per year of college (for those with high ability and a high propensity to attend college). Thus, individuals positively select into col-lege in the United States based on gains, and expansion of college to
Figure 3.15 Returns to a Dollar Invested in the Skills of Disadvantaged Children (Compared to Well-Off Children) at Different Stages of Life Cycle
Disadvantaged children
Well-off children
Prenatal programs Programs targeted toward the earliest years Preschool programs Schooling Job training
Rate
of re
turm
to inv
estm
ent
in hu
man c
apita
l (%)
Prenatal 0–3 4–5 School Postschool
Source: Authors’ elaboration adapted from Heckman (2008, 2016) and Woessmann (2008).
61 Carneiro, Heckman, and Vytlacil (2011) studied the impact of higher education on wages in the United States and show that the marginal student induced to attend university by a policy expanding college attendance has lower returns to college than the average individual attending college.

42 BETTER SPENDING FOR BETTER LIVES
individuals who currently do not attend would not be effective. On the other hand, a study on preschool in Germany found a pattern of reverse selection on gains. Whereas children with high propensity to attend—usually the well-off—do not gain, improvements in skills are substantial for children with low propensity to attend, and usually for low-ability chil-dren. Consequently, the TUT of childcare exceeds the ATE and Treatment on the treated (TOT) by 17.3 percentage points (Cornelissen et al., 2016; Schönberg et al., forthcoming). Thus, policies that successfully attract children not currently enrolled in early childhood education may yield large returns. Likewise, programs targeting minority and disadvantaged children are likely to be more cost-effective and beneficial than universal childcare programs. In other words, there is reverse selection on gains for preschool attendance, while there is positive selection on gains for high school and college attendance.
Although the average returns to education in the region vary, the con-sensus is that average tertiary education has a large return (about 16.6 percent) (Busso et al., 2017).This average, however, masks the wide varia-tion in individual returns. As expansion of access to secondary and higher education is at the center of public policy in the region, it is necessary to know the impact of education on earnings for those affected by the expansions—i.e., marginal rather than average returns. Despite the impor-tance of this topic, there are hardly any estimates of marginal returns to schooling in the region. For Peru and Chile, it was possible to estimate MTE to tertiary education (Figure 3.16). The estimates show ATE of 19 percent in Chile and around 8 percent in Peru, which suggests a potential bias in the Mincerian estimates for tertiary education reported elsewhere (Cerda and Pessino, 2018b).62 The MTE declines for individuals whose unobservable characteristics made them less likely to attend university. The range of the MTE goes from 2 to 35 percent in Chile and from –6 to +26 percent in Peru.63 Hence, it is not obvious that policies that seek uni-versal access to tertiary education have positive returns, as individuals with negative private returns might be covered by tuition subsidies. Coun-tries should be cautious when increasing spending on tertiary education, however, as marginal individuals might have lower returns than individuals already attending (from whom average rates of return are large). In fact,
62 Montenegro and Patrinos (2014) reported an ordinary least square (OLS) rate of return to tertiary education of 17.6 percent for Chile and 12.8 percent for Peru.
63 The “treated” have rates of return from 20 percent to 35 percent in Chile, and from 10 to 20 percent in Peru. The “untreated” have rates lower than 15 percent in Chile and as low as 2 percent; for Peru those rates are very low or even negative.

THE (IN)EFFICIENCY OF PUBLIC SPENDING 43
both lower readiness for tertiary studies and credit constraints seem to explain lower rates of return for marginal entrants.64
In Latin American and Caribbean countries, much more is spent on pri-mary, secondary, and tertiary education than on early childhood education. Expenditure in preprimary education on children under 6 is only about a
Figure 3.16 Heterogeneity: Marginal versus Average Treatment Effects for Returns to Tertiary Education
A. Chile
0.0 0.1 0.2 0.3 0.4 0.5Propensity not to attend
0.6 0.7 0.8 0.9–0.10.00.10.20.30.4
B. Peru
0.0 0.1 0.2 0.3 0.4 0.5Propensity not to attend
0.6 0.7 0.8 0.9–0.10.00.10.20.30.4
Marginal treatment effect Average treatment effect
Source: Authors’ elaboration based on Cerda and Pessino (2018b).Note: The MTE is estimated using household data from Chile and Peru for 2015 on individuals aged 28–34 years for Chile and 26–32 years for Peru. To correct for ability bias, parents’ educational level is used as an instrument. To control for the selection of gains, the instruments used are the unem-ployment rate of individuals aged 18–24; average income of individuals aged 18–24; and the fraction of individuals aged 18 to 24 currently attending higher education, apart from parents’ educational level and birth-year cohort dummies. The first two instruments seek to capture relevant labor market characteristics, and the third, the presence of a higher education institution in the region where an individual was living at the time he was 17. The ex-ante probabilities of enrollment are used to correct for the selection on gains (Carneiro, Heckman, and Vytlacil, 2011; Cerda and Pessino, 2018b).
64 Part of the reason for not attending higher education appears to be due to credit con-straints. Evidence from Chile (Rau, Rojas, and Urzúa, 2013; Solis, 2017) and Colombia (Melguizo, Sánchez, and Velasco, 2016) suggest positive enrollment effects from credit availability. Data from Colombia, however, point to incoming students’ lack of academic readiness affecting quality. While quality remained stable in education in the 2000s, students have on average lower ability levels (Camacho, Messina, and Uribe, 2016).

44 BETTER SPENDING FOR BETTER LIVES
fifth of that of children 6–12 years of age or older. As a percentage of GDP, pre-primary spending is 0.4 percent, primary 1.9 percent, secondary 1.6 percent, and tertiary 1.1 percent (World Bank, 2018). For a GDP per capita that is one-third that of the OECD, Latin America and the Caribbean should spend more on the early years than on the late years since the region has a higher percentage of disadvantaged low-income families. Attendance in pre-primary education is about 60 percent in Latin America and the Carib-bean for children between 3 and 5, and enrollment (which is lower than attendance) is about 20 percent for children aged two years, and much lower for younger ages. Hence, although expenditure per student is fairly high in pre-primary years (at about 12 percent of GDP per capita), spending per child in early childhood is just 4.3 percent of GDP per child.65 There are even more possibilities to shift spending from upper education spending. Tertiary spending per graduate, considering that the average tertiary drop-out rate is greater than 50 percent,66 is 40 percent of GDP per capita and, hence, almost 10 times higher than pre-primary spending per child (and usually on children of relatively wealthy families).
A shift in resources from higher education toward younger and dis-advantaged children would additionally result in a more-efficient (and equitable) allocation of resources. Smart investments in early interven-tions targeting lower-ability children have much higher economic returns (as they tend to equalize abilities and subsequent rates of return) than remediation programs later in life, such as public job training, adult literacy programs, tuition subsidies, or expenditure on police to reduce crime. Data also show that investing in the developmental growth of at-risk young chil-dren is important for economic growth.67 To increase allocative efficiency, it is first important to prioritize investment in high-quality early childhood
65 Besides, attendance in early childhood is much lower for less-well-off children (UNESCO databank and OECD statdata).
66 Dropout rates in Latin America are remarkably high, ranging from 40 percent to almost 70 percent (Busso et al., 2017; Ferreyra et al., 2017).
67 By using standardized benchmarks for minimum and advanced skill levels, Altinok (2018) finds that while advanced skills have a significant effect on economic growth of high-income countries, the share reaching the basic proficiency level is positive but significantly higher in lower- and middle-income countries. In the same spirit, Izquierdo et al. (2016), in a study analyzing productivity determinants for growth in income per capita, find that education as measured by basic school attainment indi-cators is one of the most-important determinants for less-developed countries to advance to the second of four cluster groups. However, health (measured largely by quality outcomes such as infant mortality and life expectancy), used as a proxy for quality of human capital, helps in advancing all levels, even to the highest-income cluster. See also Manuelli (2015).

THE (IN)EFFICIENCY OF PUBLIC SPENDING 45
education for at-risk children. Afterwards, it is important to sustain gains with effective education through adulthood. Investments for disadvan-taged youth have lower rates of return, meaning that they are more-costly interventions, but to level the playing field, more resources should be devoted to enhance their skills and chances in life.68 For severely disad-vantaged adults with low ability levels, subsidizing work and welfare may be a better response for alleviating poverty than investing in their skills with job training programs.69 The literature on the financing of tertiary education argues for an increase in private funding, and for the introduc-tion of fees, coupled with well-designed student loans and grants. The latter would ensure that able students from disadvantaged families are provided the financial means to cover tuition and costs. In general, though, such students have a lower probability of entering university. However, the cause seems to be more a lack of basic skills to advance to university, due to insufficient earlier investments, rather than credit constraints, as is the case in some countries such as Chile.
Allocative Efficiency in Centralized and Decentralized Spending
Is the current allocation of expenditure between the central govern-ment and SNGs efficient? This is an important question, since during the last 30 years, countries in Latin America and the Caribbean decen-tralized a growing amount of spending. The rationale was to bring governments closer to citizens and allocate public resources more efficiently70 (the classical theory of fiscal federalism). Potential bene-fits of fiscal decentralization include: improving spending efficiency by
68 Programs for primary school targeted to disadvantaged students have rates of return that range from 16 percent (estimated on the adoption of structured teach-ing methods from kindergarten to 4th grade in Brazil by Leme et al., 2012), to a 10 percent return from reduction in class size in Bolivia (Urquiola, 2006). However, few remedial programs have important returns. The Heckman team estimates basi-cally zero rates for high school remediation programs in the United States. For Indonesia, Carneiro, Lokshin, and Umapathi (2017) report rates of return to sec-ondary schooling for treated students at 27 percent, but a much lower return for marginal students at 14 percent.
69 Typical training programs for the unemployed have much lower impacts on skills and earnings, or even zero returns (Heckman, 2016). An exception in Latin America is Colombia’s successful training program, Jóvenes en Acción, with an internal rate of return (IRR) of 10 percent. This is not a typical training program, however, as it is provided by private firms with a large incentive to place the trainees in formal jobs.
70 Political and historical reasons also played a key role in the decision to pursue decen-tralization in Latin America.

46 BETTER SPENDING FOR BETTER LIVES
better aligning SNGs’ spending to local needs; reducing expenditure waste by better prioritizing the provision of public goods (Hayek, 1945; Tiebout, 1956; Musgrave, 1969); and bolstering accountability between those who produce public goods and services and those who consume them (Faguet, 2012).71 However, capitalizing on these benefits requires effective fiscal autonomy (the level of control that SNGs exert on their budget expenditures and revenues) on the part of local governments, as well as institutional capacity, accountability, and well-defined spend-ing functions between the different levels of government. These are all critical preconditions for the allocative efficiency hypothesis to oper-ate. Absent these conditions, as is the case in many Latin American and Caribbean countries, fiscal decentralization can worsen the efficiency of public service delivery, as the decentralization process provides SNGs with a significant role in the financing and provision of public goods.72 In this context, understanding how to make government spending smarter at the local level is crucial.
While the decentralization process has been disparate among coun-tries, reflecting differences in size, history, and economic geography, Latin American countries are clearly more politically and fiscally decentralized today than they were decades ago. Today, there are 17,422 subnational governments: 391 intermediate and 17,031 local governments. On aver-age, they spent 6.2 percent of GDP in 2016, amounting to 19.2 percent of general government spending, compared to 14 percent and 31.8 per-cent, respectively, in OECD countries. Brazil and Argentina, two federal countries, administer the largest share of SNG spending, which accounts for more than 40 percent of general government expenditures. Mexico, another federal country, administers about 34 percent through SNGs. But Colombia, Bolivia, and Peru also stand out because they are politi-cally unitary countries that display a high level of local spending—about 36 percent of general government spending (Figure 3.17B). These coun-tries’ decentralization in spending is the most pronounced in the region,
71 Some studies find that decentralization had a positive effect on the provision of pub-lic goods. In Bolivia, public investment in education was more responsive to local needs (Faguet, 2004). In Colombia, decentralization improved school enrollment (Faguet and Sánchez, 2014). In Argentina, decentralization contributed to a decrease in infant mortality (Habibi et al., 2003).
72 Of course, this list is far from exhaustive, and factors beyond the nature of intergovern-mental fiscal arrangements are of crucial importance. For example, levels of political competition, voter participation, extent of elite capture, or more generally, the func-tioning of local democracies are important contextual features of decentralization processes (Bardhan and Mookherjee, 2005).

THE (IN)EFFICIENCY OF PUBLIC SPENDING 47
surpassing the average level in OECD economies. The rest of the region has undergone some degree of decentralization but remains highly centralized.
Not surprisingly, these entities vary greatly in their ability to raise the revenues needed to comply with their responsibilities. With few excep-tions, SNGs have limited tax autonomy, but even in countries with higher degrees of tax autonomy, subnational revenue collection efforts remain
Figure 3.17 Subnational Government Expenditure, circa 2016
A. SNG spending as a % of GDP
% GDP0 5 10 15 20 25
Latin America and the Caribbean OECD
Dominican Republic Costa Rica
Panama Nicaragua
El Salvador Paraguay
Guatemala Honduras
Uruguay Chile
Ecuador Colombia
Mexico Bolivia
Peru Brazil
Argentina
B. SNG spending as a % of general government spending
% General government total expenditures0 10 20 30 40 6050
Latin America and the Caribbean OECD
Panama Dominican Republic
Costa Rica Nicaragua
El Salvador Paraguay Uruguay
Honduras Ecuador
Chile Guatemala
Bolivia Mexico
Peru Colombia Argentina
Brazil
0.5 0.5
1.2 1.3
2.2 2.2 2.4 2.5 3.1
3.7 4.1
7.7 10.4 10.9
11.7 20.2
20.7
6.2 14.0
2.0 3.0
4.1 4.4
8.5 8.6 8.7 9.1
10.8 14.4
18.0 32.3
33.9 36.4 36.5
44.0 47.9
19.2 31.8
Source: Authors’ calculation based on data from FMM/IDB Public Expenditure Data, Pessino, Badin, et al. (2018) and OECD (2018c).

48 BETTER SPENDING FOR BETTER LIVES
below their potential (Corbacho, Fretes Cibils, and Lora, 2013).73 This reduces the transparency and accountability of local policy and, there-fore, the incentives to spend efficiently.74 In fact, Latin American spending decentralization outpaced revenue decentralization, creating vertical fis-cal imbalances (VFIs), a measure of the gap between SNG spending and SNGs’ own revenues. VFIs are larger in Latin America than in OECD coun-tries (Figure 3.18B): approximately two-thirds of SNG spending depends on transfers in the region, while in the OECD it is slightly less than half.
In federal states, where spending has been substantially decentralized, only Mexico’s SNGs continue to rely heavily on federal sources of revenue, whereas those in Brazil and to a lower extent in Argentina have more revenue autonomy. On the other hand, unitary states tend to be less decentralized and exhibit high levels of VFIs as a share of spending, meaning that they are heavily dependent on central government transfers. SNGs in Honduras and Guate-mala, for example, rely almost exclusively on central government transfers.
Expenditure decentralization on its own is insufficient to improve the efficiency of public service delivery. It must be accompanied by other conditions, particularly revenue decentralization, which shows positive and significant impacts on public service delivery that are not observed with spending decentralization alone75 (Sow and Razafimahefa, 2015). In Brazil, increases in revenue from local taxes are seen to improve the quantity and quality of local education infrastructure, in contrast to when such increases come from central government transfers (Gadenne, 2017). Panel data on Argentine SNGs from 1990 to 2015 suggest that decreas-ing VFI by two standard deviations (reducing fiscal imbalance on average from 54 percent to 17 percent) reduces the share of SNG public employ-ment by 2.6 percent (Figure 3.19A) and translates into decreasing public employment by 9.8 percent (Pessino and Benítez, 2018).76 Therefore, by
73 For example, the collection of the real estate property tax barely amounted to 0.5 per-cent of GDP on average during 2015. This is close to half of what is collected in other developing regions and merely one-fourth of the figure for the OECD (IDB, 2018).
74 On average, for each 10 percentage point decrease in vertical fiscal imbalances, the general government fiscal balance improves by 1 percent of GDP (Eyraud and Lusin-yan, 2013).
75 In OECD countries, spending decentralization has adversely affected economic growth but revenue decentralization has encouraged it. The empirical results sup-port the prediction that efficiency gains can be improved by a closer match between spending and revenue decentralization (Gemmell, Kneller, and Sanz, 2016).
76 This finding is consistent with Martínez-Vázquez and Yao (2009), who show that the increase of SNG public employment often exceeds the decrease in that of the central government. Similar findings for Spain are discussed by Marqués Sevillano and Ros-selló Villallonga (2004).

THE (IN)EFFICIENCY OF PUBLIC SPENDING 49
decentralizing spending and decentralizing taxation to cover most of the expenditure, the provinces would create about 10 percent less (unpro-ductive) employment on average, saving 0.9 percentage points of GDP on the wage bill, which is about 10 percent of GDP at the subnational level in Argentina. In Colombia, SNGs that increased total revenues through royalties and transfers have lower efficiency scores—3.2 per-cent and 0.2 percent, respectively—in the water and sanitation sector and by 2.2 percent and 6.8 percent in the health sector. Conversely, as
Figure 3.18 Vertical Fiscal Imbalances, circa 2016
A. Vertical fiscal imbalance as a share of GDP
% GDP0 5 10 15
Costa Rica Paraguay
El Salvador Uruguay
Chile Guatemala
Honduras Ecuador
Peru Colombia
Mexico Bolivia Brazil
Argentina
Latin AmericaOECD
4.96.8
66.349.4
B. Vertical Fiscal Imbalance as a Percentage of Subnational Government Spending
% of total SNG expenditure
Latin AmericaOECD
Costa Rica Uruguay
Paraguay Brazil Chile
El Salvador Argentina Colombia Ecuador
Bolivia Mexico
Peru Guatemala
Honduras
0 10 20 30 40 50 60 70 80 90 100
Source: Authors’ calculation based on data from FMM/IDB Public Expenditure Data, Pessino, Badin, et al. (2018), IDB (2018), OECD (2018c), SNG Structure and Finance Dataset, and OECD et al. (2018).

50 BETTER SPENDING FOR BETTER LIVES
shown in Figure 3.19B, higher property taxation at the subnational level improved the efficiency scores in health (1.6 percent) and water and sanitation (3 percent) in Colombia (Ardanaz and Tolsá Caballero, 2015; Martínez, 2017). In Brazil, intergovernmental transfers induce an extreme form of inefficiency, that is, pure waste from a greater level of corrup-tion as measured by random municipal audits (Brollo et al., 2013). At the margin, higher exogenous revenues induce more corruption because incumbents have greater opportunity to appropriate rents without dis-appointing voters, and additional resources are often given precisely to those regions with weak institutions. A natural experiment of windfall resources to SNGs occurred in Brazil during the latest commodity price cycle, suggesting that while oil royalties increase municipal spending
Figure 3.19 The Effect of Revenue Sources on Allocative and Technical Efficiency of Spending
–3.2 –2.2
3.0 1.6
–0.2
–6.8
SNG
publi
c emp
loyme
ntas
a sh
are o
f total
emplo
ymen
t
A. Provincial vertical imbalances and public employment, Argentina (1990–2015)
National transfers as a share of SNG total revenue
0.0
0.1
0.2
0.3
0.4
0.5
0 0.2 0.4 0.6 0.8 1.0
B. Changes in efficiency scores in Colombia
Water and sanitation (IRCA) Health (infant mortality rate)–8
–6
–4
–2
0
2
4
Royalties TransfersOwn revenues (taxes)
y = 0.1552x + 0.1762
Source: Panel A: Authors’ calculation based on Pessino and Benítez (2018). Panel B: Authors’ calculation based on Ardanaz and Tolsá Caballero (2015).

THE (IN)EFFICIENCY OF PUBLIC SPENDING 51
levels across oil-benefited municipalities, such fiscal expansions were not mostly accompanied by improvements in useful local public good provi-sion projects (Caselli and Michaels, 2013). Why not? It may be that paying taxes provides citizens with incentives to demand greater accountabil-ity from elected politicians, and, in turn, provides elected officials with more incentives to invest public monies instead of just increasing current expenditure, since for vertically balanced governments, marginal collec-tion of taxes accrues almost entirely to them. Citizens will thus prefer spending that maximizes growth and revenue. Hence, VFIs are detrimen-tal to allocative spending efficiency as policymakers fail to fully internalize the cost of local spending financing. In fact, tax decentralization provides incentives for growth-enhancing policies that reduce rent-seeking and waste in government (Weingast, 2009; Dynes and Martin, 2017; Paler, 2013).77 In short, strengthening revenue decentralization and autonomy provides local governments with incentives to spend better.
SNG institutional capacities. Decentralization will not increase efficiency if SNGs do not have adequate administrative capacity. Localities with better institutional capacity secured more infrastructure projects and grants in Chilean municipalities (Piña and Avellaneda, 2017). Similarly, SNGs might not attract investments or provide quality public services if they lack the institutional capacity to engage in good budget planning, revenue manage-ment, and spending focalization practices (de la Cruz, Pineda Mannheim, and Pöschl, 2011). In Latin America, spending responsibilities have often been transferred to SNGs without considering disparities in institutional and technical capacity or the small scale at which many SNGs operate (Bonet and Fretes Cibils, 2013). In fact, SNGs vary in the delivery of service outcomes, some of which can be attributed to differences in institutional capacity. A first approximation to measure them is to compare local gov-ernments’ ability to disburse budget allocations with that of the central government. In Peru, overall disbursement rates of SNGs were 10 percent-age points lower than those of the central government in 2008—that is 73 percent compared to 83 percent of budget execution (World Bank, 2010). In turn, municipalities’ execution rate of public investment during 2014–2016 was 73 percent of their capital budget, which ranged from less than
77 Because the value of public goods is capitalized into the value of local property, maximizing revenue from property taxation leads local politicians to choose public goods that maximize local property values. Another reason why large fiscal imbal-ances can incentivize inefficient spending is that some provinces with larger deficits receive larger transfers (Weingast, 2009).

52 BETTER SPENDING FOR BETTER LIVES
10 percent to more than 95 percent across almost 1,900 localities (Maldo-nado, 2015), highlighting differences in capacity.
Spending concurrency. Spending decentralization has led to an overlap in many government functions, potentially creating waste. Expenditure assignments are more often shaped by history and motivated by political and social dynamics than by efficiency (i.e., the principle of subsidiar-ity).78 In Latin America, at least 30 percent of countries have concurrent functions in the areas of security and social protection, but principally in primary education and primary healthcare.79 Whereas concurrency is a common feature, when spending assignments overlap excessively, effi-ciency is affected. In European countries, a 1 percent of GDP increase in subnational spending resulted in a 0.5 percent of GDP increase in national spending, revealing that subnational spending did not com-pletely substitute for national spending (Eyraud and Moreno Badia, 2013). Moreover, concurrency may lead to situations in which citizens are unsure from whom to demand service improvements, and public officials operate without a clear notion of the scope of their responsi-bilities or strategically blame one another for lackluster performance. Mexico is a case in point: fewer than half of those interviewed in a survey on SNG spending knew that mayors are responsible for sewage systems, water supply, and lighting (Chong et al., 2015). Residents of a given SNG would presumably better identify the level of government that provides the service if they bore the full cost of raising the marginal dollar of tax revenue used to finance its public expenditures. In the case of Argen-tina, teachers’ unions directed their demands for a wage increase to the federal government rather than local governments, as the former has greater capacity and incentives to increase revenues.
For better or for worse, SNG spending represents an important and growing amount of total government expenditure. To improve overall efficiency, spending decentralization should be accompanied by better administrative capacity at the local level, better definitions of concurrent spending, and revenue decentralization to ensure greater accountability and to preclude extreme situations where government officials engage in nonproductive expenditure or corrupt behavior.
78 Ter-Minassian and de Mello (2016). Based on SNG surveys. In a similar vein, Fedelino and Ter-Minassian (2010) review country case studies in Bolivia, Colombia, and Mexico. A common finding is that spending responsibilities overlap in health and education and that spending responsibilities are not clearly defined.
79 FMM/IDB Subnational Platform.

THE (IN)EFFICIENCY OF PUBLIC SPENDING 53
Toward Greater Efficiency
Even though Latin America and the Caribbean displays some of the most inefficient public spending in the world, this spending has been increasing strongly in recent decades to reach 29.7 percent of GDP in 2016. In fact, some countries in the region currently spend more than the average OECD country. The issue can be further divided into two separate sets of questions. The first involves technical efficiency, or the inefficiencies within each expenditure component. The second involves allocative efficiency, which entails prioritizing among alternative spend-ing items and allocating expenditure to programs with higher social rates of return.
This chapter first estimated technical inefficiency from the losses incurred by spending inefficiently in procurement, wages, and subsidies and transfers. Waste in procurement is estimated at about 16.7 percent of procurement spending, or 1.4 percent of GDP for the average country. Waste in wages is another important issue. Latin America has one of the world’s highest public-private wage gaps in favor of public sector work-ers. Considering that part of the gap is not warranted, about 14.2 percent of the wage bill spending for the average country is waste. Finally, leak-ages in energy subsidies, social programs, and tax expenditure amount to 65 percent of theoretical targeted spending. Overall, in procurement, civil service, and targeted transfers, the total average amount of waste is approximately 4.4 percent of GDP and about 16 percent of average gov-ernment spending. This is equivalent to $220 billion, somewhere between the GDP of Peru ($190 billion) and Chile ($250 billion), two of the region’s largest economies. These inefficiency estimates represent a first attempt at the extremely difficult exercise of capturing inefficiencies in sectors that, although sharing some trends, are quite different among countries and require detailed country diagnostics. Such caveats, however, do not make the analysis any less relevant: to date, no comparative analysis of inefficiencies in all inputs used by the government, including the wage bill, is available for the region.
Second, while allocative inefficiency of public spending is pervasive in the region, policymakers face several crucial trade-offs in allocating expen-diture by function: 1) between older and younger generations; 2) among physical capital, human capital, and transfers; 3) across ministries and along the life cycle of individuals to maximize much-needed skills formation in the region; and 4) between central and subnational levels. The total allocative inefficiency of these programs is substantial and difficult to estimate in most cases, but some indication of the size is provided in some case studies.

54 BETTER SPENDING FOR BETTER LIVES
In regard to the first trade-off, several Latin American countries spend heavily on the elderly, some four times what is spent per capita on the youngest cohorts, as coverage and replacement rates of pension systems have increased to levels that rival or exceed those of developed countries. As the population ages, both pension and health spending are expected to more than double. Under these circumstances, it is critical for Latin Amer-ica and the Caribbean to address this intertemporal budget constraint. In the medium term, even if spending on the elderly increases for demo-graphic reasons alone, other public spending will have to shift or decrease to accommodate that change if no reforms are enacted; and given current contribution levels (high in many countries already), pension systems’ defi-cits may rise to unprecedented proportions. At the same time, the window of opportunity for improving the quality of physical and human capital will be totally lost unless investment is strengthened today and policies are enacted soon to accommodate aging and assure the well-being of current and future generations.
Fiscal policy, particularly the composition or allocative efficiency of public spending, has played an important role in the region’s low growth in recent decades. Improving the quality and investment in human capital are important determinants for increasing long-run growth. Moreover, certain public spending items (public investment) boost potential growth, while others (mainly current spending on pensions and transfers) lower potential growth. In addition, spending more on education does not have a direct effect on economic growth, confirming that the link between the qual-ity-adjusted years of schooling indicator is more suited for estimating the impact of education on economic growth. This implies that reallocating spending toward infrastructure and improving quality education spend-ing can raise growth rates over the long run. However, higher spending beyond a particular threshold can decrease growth if not accompanied by better government institutions.
Until recently, Latin America’s relative long-term stagnation or low growth was blamed largely on low productivity of factors of produc-tion despite an increase in the number of workers and the capital stock. Recent research, however, shows that when human capital is properly accounted for (including not only quantity but quality and OJT), the relative importance of human capital (or labor augmented by quality) explains a larger part of the difference in income per capita. Physical capital and TFP are important in triggering demand (and more produc-tivity) for human capital in the first place. Latin American and Caribbean countries should start to improve conditions for acquiring skills rather than just spending on education and should aim to facilitate OJT by

THE (IN)EFFICIENCY OF PUBLIC SPENDING 55
lifting distortions in the labor market, especially incentives to informal-ity. While school enrollment has increased in most countries, improving cognitive (and noncognitive) skills and reducing fiscal incentives to informality to increase productivity and the amount and returns to OJT seems to have a higher payoff and greater potential for permanently increasing incomes.
Since skills need to be enhanced in the region at the family, school, and work levels, improving the allocative efficiency of public spending on skills is paramount. To maximize returns at minimum costs, spending should be allocated to the highest social return at each stage in the life cycle. But today only a fifth of spending is allocated to children under 6 compared to primary school children. Average rates of return to early education are underestimated for low-skilled children from disadvantaged families, while average returns to secondary and tertiary education over-estimate the return to disadvantaged children. The opposite is true for students from more advantaged backgrounds. Since average returns are often perceived as being based on skills acquired along the life cycle rather than at particular crucial times, public spending tends to overemphasize higher learning and underemphasize spending on the earlier years of the life cycle when disadvantaged students will gain the most. Hence, public spending on skills suffers from tremendous allocative inefficiency, affect-ing growth and equity.
Finally, unless governments decentralize both spending and rev-enues efficiently, improve the definition of functions between central and subnational governments, and enhance the capabilities of local governments, it will be difficult to advance the regional allocative effi-ciency of public spending. The average Latin American country spends 19 percent of consolidated spending at the subnational level; with six countries spending between 32 and 47 percent. However, SNGs rely on central government transfers for about two-thirds of their spending. The region’s current decentralization structure is not conducive to allocative efficiency in spending, as SNGs are more efficient when they spend rev-enues that they levy themselves through subnational taxes rather than central government transfers or natural resource windfalls.
Governments in the region risk low, stagnant growth and fiscal sus-tainability problems. They do so by being excessively large or by spending heavily on transfers and pensions before their populations become rel-atively old and wealthy without at the same time improving the quality of investment in infrastructure and human capital—especially skills. How, then, can governments make room in their budgets to increase human and physical capital expenditures? One way is to reduce waste in procurement,

56 BETTER SPENDING FOR BETTER LIVES
civil service payrolls, and transfers, which currently equal about 4.4 per-cent of GDP. Another is to reallocate expenditures away from transfers, particularly those that have proven least effective in reducing poverty and inequality. Chapter 9 of this report, which focuses on institutions, presents lessons learned from countries in the region and elsewhere to improve the design of public expenditure policy and management in order to increase the efficiency of public spending.