Development and Validation of Cryogenic Foam Insulation ...
79
ret 1 'UÄftac—... ^«ssnKEsrz i WJ WUMUWJWjunngv^nmanm NASA Contractor Report 3404 Development and Validation of Cryogenic Foam Insulation for LH2 Subsonic Transports F. M. Anthony, J. Z. Colt, and R. G. Helenbrook CONTRACT NAS1-10969 FEBRUARY 1981 .BHC Qtr4UW Ä^CTEi , : A^. 'J': . \ i tC M- ^* C'CC,* l\J/\SA 19960312 079 » ;'« .£.' ; A'-i tf ** 3 «a .. sr *-> ^
Transcript of Development and Validation of Cryogenic Foam Insulation ...

ret1 'UÄftac—... ^«ssnKEsrz i WJ WUMUWJW junngv^nmanm
NASA Contractor Report 3404
Development and Validation
of Cryogenic Foam Insulation
for LH2 Subsonic Transports
F. M. Anthony, J. Z. Colt, and R. G. Helenbrook
CONTRACT NAS1-10969 FEBRUARY 1981
.BHC Qtr4UW Ä^CTEi
,:A^. 'J': .■\itC ■ M- ^* C'CC,*
l\J/\SA 19960312 079
»■;'«■.£.'■; A'-i
tf ** 3
■«a .. sr
*->
^

NASA Contractor Report 3404
Development and Validation
of Cryogenic Foam Insulation
for LH2 Subsonic Transports
F. M. Anthony, J. Z. Colt, and R. G. Helenbrook Bell Aerospace Textron Buffalo, New York
Prepared for Langley Research Center under Contract NASl-10969
NASA National Aeronautics and Space Administration
Scientific and Technical Information Branch
1981
CONTENTS
Section Page
SUMMARY 1
INTRODUCTION 1
SYMBOLS 3 SI Units 4 SI Prefixes 4
TEST SPECIMENS 5 Design 5 Materials 8
TEST FACILITIES 10 Test Apparatus 10 Instrumentation 10
TEST OPERATION 12 Conditions and Procedures 12 Insulation Inspection 14
DATA REDUCTION 15
RESULTS AND DISCUSSIONS 15 Polyurethane 21 Polymethacrylimide 21 Polybenzimidazole 22 Modified Polyisocyanate 24 Polyisocyanurate 24 Insulation Systems 24
CONCLUDING REMARKS 25
REFERENCES 27
APPENDIX A - MATERIAL IDENTIFICATION AND LABELING 28
APPENDIX B - ADHESIVE EVALUATION 29
APPENDIX C - THERMAL STRESS ANALYSES 33
APPENDIX D DETAILS OF TEST APPARATUS 45
APPENDIX E - PICTORIAL RESULTS 51
APPENDIX F - DATA REDUCTION 66
i i i

ILLUSTRATIONS
Figure Page
1 Conditions Found In Insulation Bonded to Aluminum Plate at LH2 Temperature 6 2 Maximum In-Plane Tensile and Compressive Thermal Stresses for Square, 15 cm
(6 in.) Thick Foam Insulation Bonded to Aluminum at LH2 Temperature 7 3 Comparison of Three-Dimensional Thermal Stresses in Insulation Foam Bonded
to an Aluminum Tank Wall at LH2 Temperature 7 4 Cryogenic Insulation Test Apparatus - Environmental Control System 11 5 Cryogenic Insulation Test Specimen Assembly 11 6 Cryogenic Insulation Surface Temperature for Typical LH2 Fueled Subsonic
Transport Mission Cycles 10,180 km (5500 nm) Range, 152 mm (6 in.) Thick Insulation (Reference 2) 13
7 Air and Insulation Surface Temperature Histories for a Typical Test Cycle with Tank Wall at LH2 Temperature 13
8 Boil-Off Times For All Six Compartments 16 9 Insulating Performance versus Number of Thermal Cycles 20
10 Typical Structural Failures in Foam Insulations 23 11 Peel Strength versus Temperature For Candidate Adhesives 30 12 Tensile Shear Strength versus Temperature For Candidate Adhesives .' 30 13 Insulation and Adhesive Test Configurations 32 14 Temperature and Stress Histories During Cooldown and Operation of Insulated
LH2 Tank 34 1 5 Influence of Tank Diameter on Thermal Stress, 12 Minutes After LH2 Fill,
Insulation Thickness = 15 cm (6 in.) 35 16 Temperature Distribution Through 51 mm (2 in.) of Rohacell-31 Insulation 36 17 Finite Element Model for Thermal Structural Analysis of Insulation Test
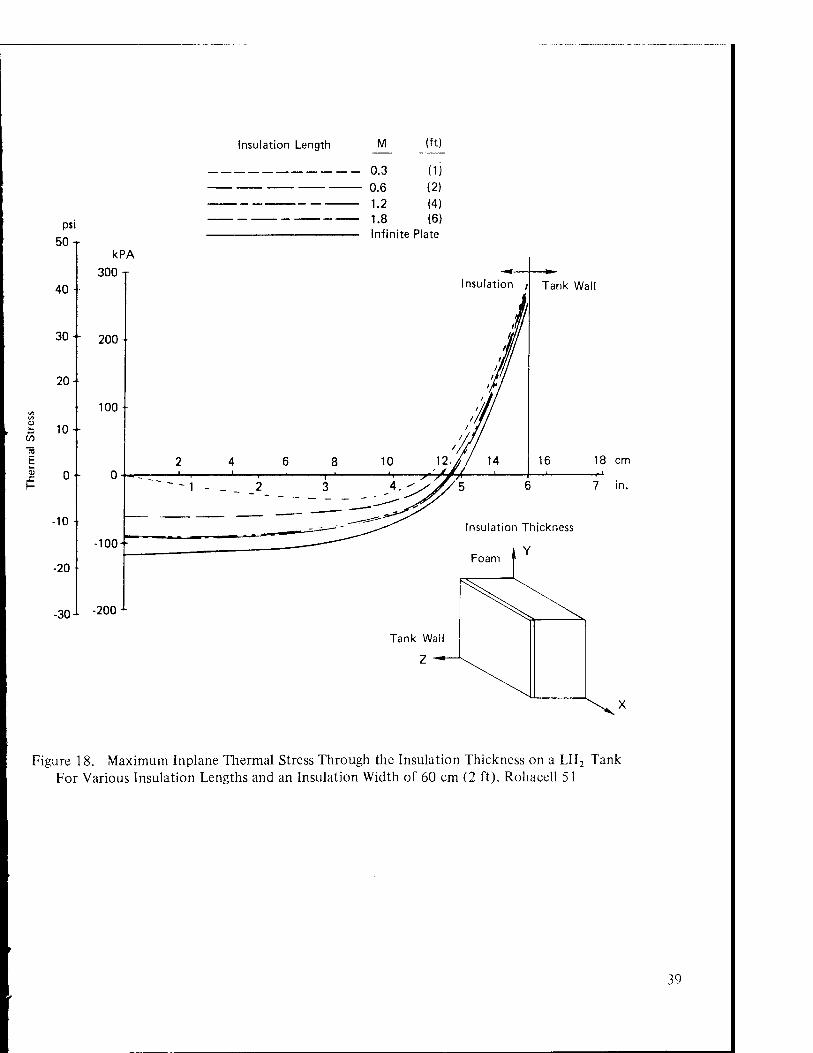
Specimen 38 18 Maximum In-Plane Thermal Stress Through the Insulation Thickness on a LH2
Tank For Various Insulation Lengths and an Insulation Width of 60 cm (2 ft), Rohacell 51 39
19 Maximum In-Plane Tensile and Compressive Thermal Stress for an Insulation Thickness of 15 cm (6 in.) and an Insulation Width of 60 cm (2 ft), Rohacell 51. 40
20 Thermal Stresses for Two Different Sample Sizes of Insulation, Rohacell 51 41 21 Thermal Stresses for Two Different Insulation Sample Sizes and Thicknesses,
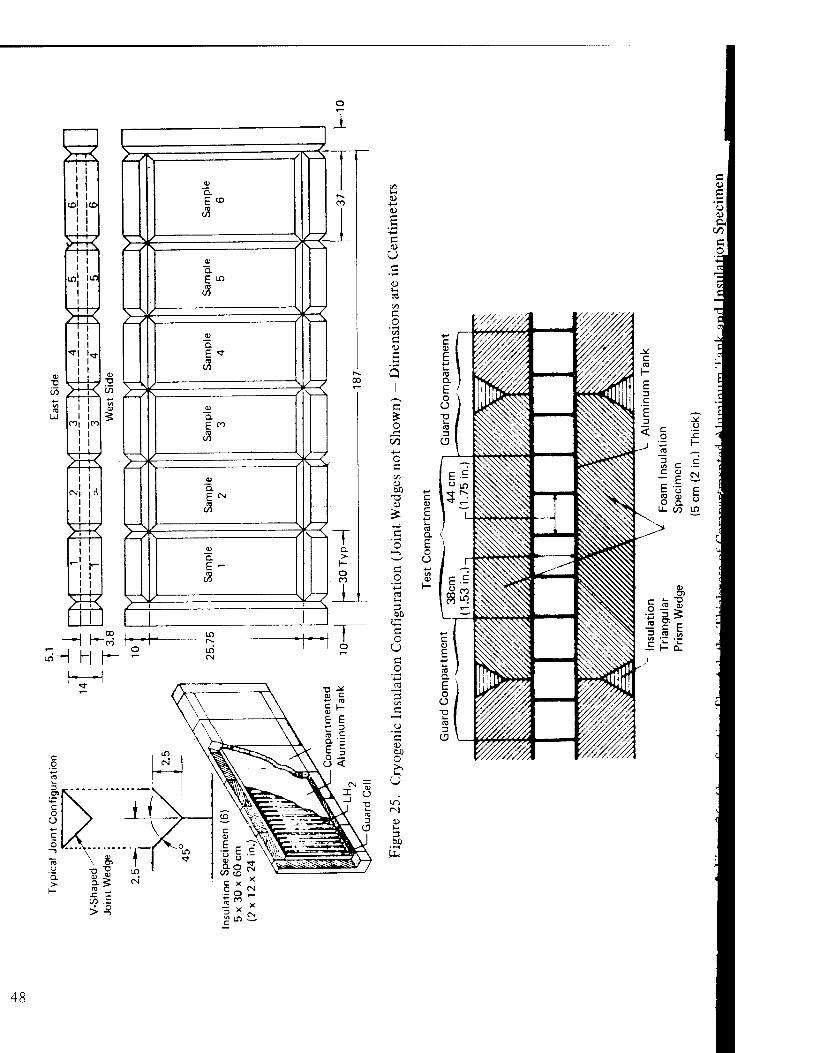
Rohacell 51 42 22 Effect of Elastic Modulus on Thermal Stress Distribution, Rohacell 51 44 23 Test Chamber 46 24 Cell Instrumentation 47 25 Cryogenic Insulation Configuration (Joint Wedges Not Shown) - Dimensions are
in Centimeters 48 26 Cross Section Through the Thickness of Compartmented Aluminum Tank and
Insulation Specimen 48 27 LH2 Vessel Prior to Mounting of Specimens 52 28 Initial Mounting of Specimens 52
TV

ILLUSTRATIONS (CONT)
Figure Page
29 View of East Side After 360 Cycles 53 30 Rohacell 41S After 360 Cycles 53 31 Shuttle Prime CPR-488-1 After 1102 Cycles 54 32 Stepan Foam, Brand (X) GE After 2409 Cycles 54 33 Rohacell 31 After 1990 Cycles 55 34 Rohacell 51 After 3025 Cycles 55 35 Last-A-Foam After 2409 Cycles 56 36 Marvacell MM-15-05 After 1559 Cycles, Marvacell No. 1 and Marvacell No. 2 at
Zero Cycles 56 37 Marvacell No. 1 at 431 Cycles 57 38 Upjohn Without Fibers After 1559 Cycles 57 39 Texane 333 and ADL System 2 at 738 Cycles, Rohacell 51 at 1109 Cycles 58 40 East Side After Completion of Testing 58 41 Cold Inspection After Series 2 59 42 Cold Inspection After Series 4 60 43 Cold Inspection After Series 8 61 44 Cold Inspection After Series 9 62 45 Cold Inspection After Series 11 63 46 Cold Inspection After Series 12 64 47 Cold Inspection After Series 13 65 48 Analytical Model of Aluminum Cryogen Vessel 67 49 Heat Flow from Test Zone Insulated by Degraded Foam Material 67 50 Analytical Corrected Data 69
TABLES
Number
I Insulations Selected for Testing
II Test Summary
Page
9
19

SYMBOLS
k
M
t
T
Z
Z max
Subscripts
o, 1, 2, 3
thermal conductivity, W/m K (Btu in /hr ft2°F)
Mach number
time, s, hr
Temperature, K (°F)
distance in the insulation from the outer surface, cm (in.)
insulation thickness, cm (in.)
strain
mass density kg/m3 (lbm/ft3)
stress kN/m2 (lbf/m2)
increment of time
1 initial
f final
X length direction
y width direction
z thickness direction
AMB Ambient
out outer

SI UNITS
g Gram (mass)
K Kelvin (temperature)
m Meter (length)
N Newton (force)
Pa Pascal (pressure and stress)
W Watt (power)
s Second (time)
SI PREFIXES
m Milli(l(r3)
c CentidCT2)
k Kilo(103)
M MegaOO6)

TEST SPECIMENS
Design
When many insulations are to be compared it is desirable to use relatively small specimens for the experimental evaluation of thermal cyclic life to reduce the cost of the test equipment and of the liquid hydrogen used. If the thickness of insulation used for testing is the same as the opti- mum operational thickness, a large planform size is needed to achieve necessary stress levels because of the stress relief due to edge effects. Stress distributions representative of those in a full scale application, however, can be obtained with smaller specimen sizes by reducing the specimen thick- ness while maintaining the same overall temperature difference across the insulation thickness. Thermal stress analyses were performed to relate temperature difference, thickness, planform dimen- sions, and triaxial stresses in order to insure that the small specimen size selected would realistically represent the actual application. Results are summarized here; details are provided in Appendix C.
The qualitative timewise variation of temperature, strain and stress through a thickness of foam insulation bonded to an aluminum tank surface is illustrated in Figure 1. At time zero, t0, there is a step change in temperature in the aluminum plate from ambient temperature to LH2
temperature as shown in Figure la. After a short time, tj, there is a very steep temperature gradient in a very thin layer of foam immediately adjacent to the aluminum. As time passes t2 and t3, the temperature gradient flattens. Initially, at t0. the aluminum plate cools, contracts and compresses the warmer foam creating the strain distribution pattern shown in Figure lb. As time progresses, t x, t2 and t3, the insulation cools and contracts in accordance with the local temperature and its coefficient of thermal expansion. Near the tank surface, however, the insulation is constrained from contracting by the stiffer aluminum plate. The tank wall experiences less contraction than the insu- lation because of its lower coefficient of thermal expansion. Ultimately, the combination of the thermal contraction mismatch between the insulation and the aluminum tank and the temperature distribution through the insulation leads to a pseudo-steady state in-plane stress pattern t3 in Figure lc, which consists of large tensile stress in the insulation near the tank surface and smaller compres- sive stress at its free surface.
The magnitude of the tensile stress is determined primarily by the thermal contraction mis- match between the aluminum and foam insulation. The length, width and thickness of the insula- tion were believed to influence the magnitude of compressive stresses and an analysis of the effect of these dimensions was undertaken. Figures 2 and 3 illustrate the results of this investigation. Both figures used properties of a polymethacrylimide insulation bonded to an aluminum tank whose temperature is 20K (-423°F) while the insulation surface temperature is at 317K (110°F); However, the results are characteristic of other insulations.
As shown in Figure 2, smaller insulation specimens, 15 cm (6 in.) thick, have significantly reduced compressive stresses due to edge effects. A 30 cm ( 1 ft) square insulation specimen experiences a maximum compressive stress that is approximately 1/3 the stress in a 183 cm (6 ft) square piece of insalation. The stress in the latter specimen size approaches the stress level for specimens of infinite length and width, shown as circles at the right end of the plot.

Outer Surface Tank Surface Ambient-
Temp.
(a) Temperature Distribution
Stress
j 0 1.0
Thickness Ratio, Z/Z
BTank
max
(c) In-Plane Stress Distribution
Figure 1. Conditions Found in Insulation Bonded to Aluminum Plate at LH2 Temperature.

psi kPa
50 -r
40 - 300 -, ■ . r
Tension
= v-o in 0) L_
■«-» (/> ~cÖ E u. 0)
JZ 1- E E X
30 -
20 -
10 -
0 ■
"200-
100 -
- 0- 0.5 1.0 1.5 2.0 00 Meters
1 1 1, , , , 1 A . 1 5 - ' I 1 1 1 1 ! V ■
1, 2 3 4 5 6 °° Feet
-10 - -100 ■
-——^^_^ Edge Length
A. _/^ '\-u -20 - L— Compression
-30 - _-200-
igure 2 . Maximum In-Plane Tensile and Compressive Thermal Stresses for Square, 15 cm (6 in.) Thick Foam Insulation Bonded to Aluminum at LH2 Temperature.
psi kPa 50 n
40 300-]
YxK
y— Tank
I/»
a «-»
CO
"5 E cu x: r-
30 -
20 -
10 -
0 J
-10 -
-20 -
' 200-
100-
- 0-
-100-
^— Foam II 1
1
Infinite Planform, 15 cm Thick
5 x 30 x 60 cm
-J^S^ \— ax, oo or ay_ «
Insulation Tank Wall
0 0.2 0.4 0.6 0.8 1.0
Figure 3. Comparison of Three Dimensional Thermal Stresses in Insulation Foam Bonded to an Aluminum Tank Wall at LH2 Temperature.
7

Figure 3 compares the thermal stress distribution for a 5 x 30 x 60 cm (2 x 12 x 24 in.) specimen with stresses for a 15 cm (6 in.) thick, infinitely long and wide specimen. The in-plane thermal stresses of the smaller specimen closely approximate the larger specimen. The maximum tensile stresses (at the cold tank wall) are equal for both cases. The maximum compressive stress in the 60 cm (2 ft) direction, ay, is 95% ofthat of the 15 cm (6 in.) thick plate with an infinite planform. The compressive stress in the 30 cm (1 ft) direction, ax, is not as large as ay. (This is in agreement with Figure 2 which shows the stresses decrease as specimen size decreases.) Out-of- plane stresses, az, for the smaller specimen, although larger than those for the infinite plate, are much smaller than the in-plane stresses.
Cryogenic temperature properties of two potential foam insulation materials, polyurethane and polymethacrylimide, were available. Comparison of the thermal stresses with the allowable stresses for these two materials showed that the in-plane stresses are more critical than out-of-plane stresses.
Thus, based on this analysis the selected size for the foam insulation test specimens [5 x 30 x 60 cm (2 x 12 x 24 in.)] appears to yield an adequate representation of the critical stresses for the operational insulation.
Materials
Candidate foam insulations for liquid hydrogen aircraft systems were selected on the basis of information in the open literature; those chosen for testing were selected on the basis of availabil- ity, properties, and the desire to include candidates of different chemical types. The selected insula- tions are identified in Table I. It should be remembered that all of the insulations tested were avail- able materials, none had been developed specifically for LH2 service. The choice of test materials does not imply recommendation or endorsement of any material by NASA or Bell Aerospace Textron.

TABLE I INSULATIONS SELECTED FOR TESTING
Density
Material Insulation No. Material Type kg/m3 lbm/ft3
1 Stepan Foam BX250A Polyurethane 37 2.3
2 Last-A-Foam Polyurethane 63 3.9
3 General Electric Polyurethane 68 4.2
4 PBI Polybenzimidazole 28 1.8 5 Rohacell 41S Polymethacrylimide 35 2.2
6 Rohacell 51 Polymethacrylimide 50 3.1 (1)
7 ADL System (Upjohn) Polymetric Isocyanate 41 2.60[2.13K2)
8 Texthane 333 Polyisocyanurate 43 2.72
9 ADL System (Stafoam) Toluenedi Isocyanate 43 2.70[1.9](2)
10 CPR-488-1 Polyisocyanurate 36 2.26 11 Rohacell 31 Polymethacrylimide 30 1.9
12 Upjohn 452 w/o Fibers Polymetric Isocyanate 41 2.07 (3)
13 Upjohn 452 with Fibers Polymetric Isocyanate 41 2.13(4)
14 Marvacell TRD (Commercial, MM15-05)
Polyisocyanate 96 6.0
15 Marvacell Polyisocyanate 75 4.70
16 Marvacell Polyisocyanate 71 4.40
(1) Reference in the text to 6E and 6W indicates Rohacell 51 specimens mounted on the east and west sides of the LH2 container, respectively.
(2) [xx] is for foam only.
(3) Material 12 was mounted on east side of LH2 container
(4) Material 13 was mounted on west side of LH2 container

TEST FACILITIES
Test Apparatus
The apparatus was designed to simulate thermal conditions which represented ground-air- ground temperature changes associated with flight of a subsonic transport. Temperature variations on the outer surface of the insulation of 317 - 267 - 317K (110 - 20 - 110°F) etc., were considered to be typical. This apparatus consisted of an environmental control system and a cryogenic insulation test specimen assembly, Figures 4 and 5 respectively. As shown in Figure 4 the environmental control system included a test chamber, a centrifugal blower, a diverter valve, hot and cold heat exchangers, and ducting to direct the heated (or cooled) air onto the specimen assembly and then back to the blower. The test chamber was manifolded to permit air to enter both sides of the cham- ber. Perforated plates diffused the air before it impinged on the insulation. Three ports on the bottom of the chamber provided the exit path for the air flow. A detailed description is provided in Appendix D.
The insulation test specimen assembly, Figure 5, consisted of a flat compartmented alumi- num cryogen storage vessel, and the specimens bonded to it. Provisions were incorporated for filling with LH2, venting GH2 and purging with gaseous nitrogen. The cryogen vessel accommo- dated six insulation specimens of approximately 5 x 30 x 60 cm ( 2 x 12 x 24 in.) on each of its two major surfaces. It was compartmented so that the thermal performance of the individual insu- lation specimens could be measured by monitoring the liquid hydrogen level in each of the six major compartments. These major compartments were separated by guard zones whose purpose was to minimize the thermal interaction between adjacent insulation specimens. As will be discussed later the guards were not as effective as had been anticipated. The insulation specimens were bonded to the aluminum container with a polyurethane adhesive. Adhesive selection details are documented in Appendix B.
Testing of the insulation specimens was conducted in the Hazardous Test Facility at the Bell Aerospace Textron Laboratories. Cells at this facility are isolated from working and monitoring areas and are provided with a blow-out wall for additional personnel safety. The cell selected for cryogenic testing provides for distribution of the liquid cryogen test fluid from an outside, isolated cryogenic source tank. Hydrogen detection instrumentation is provided inside the cell as an addi- tional personnel safeguard.
Instrumentation
The apparatus was instrumented with 25 thermocouples. Four monitored the outer surface temperature of the insulation specimens, three measured the temperature of the air in the two inlet and one outlet ducts and eighteen measured the temperature at the top, middle and bottom of each of the six cryogen compartments in the aluminum container. These six sets of three thermocouples were mounted along the vertical centerline of each of the six compartments and were used to detect hydrogen liquid or gas and thus the liquid level in the compartments.
10

Test Specimen Liquid In Assembly
Test Chamber
Blower
Heat Exchanger (Cold)
Figure 4. Cryogenic Insulation Test Apparatus-Environmental Control System.
nsulation (0.3 m x 0.6 m x 5 cm Specimen (6) (1 ft x 2 ft x 2 in.)
Compartmented Aluminum Tank
Guard Cell
Figure 5. Cryogenic Insulation Test Specimen Assembly.
TEST OPERATION
The test sequence was started by flowing liquid hydrogen into the test chamber until all compartments were filled. The source was shutoff and the cryogen allowed to reach a steady state temperature condition. Then the tank was refilled and the thermal cycle system activated. This system varied the insulation surface temperature from 317K to 267K (110°F to 20°F) at an aver- age rate of 12 minutes per cycle. Thermal cycling was conducted on an around-the-clock schedule during the normal work week. At the end of each test period (normally at the weekend), hydrogen was purged from the aluminum container, all systems were secured and the test tank was allowed to return to ambient temperature.
Conditions and Procedures
Temperature histories for the external surface of the cryogenic insulation on a M = 0.85, long range, hydrogen fueled transport during typical mission cycles, Reference 2, are presented in Figure 6. The histories are representative of the upper and lower limits for 95 percent of the flights such a vehicle will experience. The maximum thermal stresses which were presented in Figure 2 are encountered shortly after the maximum external surface temperature is reached. An exact stimula- tion of the time dependent temperature distribution through the depth of the insulation for the complete life of a typical commercial aircraft (approximately 15 years) would be costly and time consuming. However, if the aircraft is refueled almost immediately after each flight such that the tank is maintained near LH2 temperature the primary effect of a typical flight cycle is to impose a perturbation on the compressive thermal stresses near the external surface of the insulation, see Figure 1. This situation can be simulated by a relatively short thermal cycle, of about 10 minutes, such as the typical test temperature history presented in Figure 7. A less frequent but more severe stress variation is encountered when the aircraft is removed from service for periodic maintenance or overhaul and then returned to service. During the overhaul/reinstatement sequence, the tanks and inner portion of the insulation will be cycled from LH2 temperature, to ambient temperature, and back to LH2 temperature. Based on current airline practice, the overhaul periods are sufficiently infrequent that they were simulated in the present test program by simply suspending cryogenic testing, allowing the tank to reach ambient temperature, and then resuming cryogenic testing.
During a test period the tank was filled with liquid hydrogen and the temperature history of the exterior of the insulation was cycled repeatedly as the hydrogen was allowed to boil-off. Four thermocouples strategically distributed over the insulation surfaces indicated the temperatures of the outer surface, the cycle time was controlled by the thermocouple which last reached the desired temperature. (The initial test cycles were monitored closely to prevent over heating the specimens, and to verify that the temperature distribution over the outer surface of the specimens was essen- tially uniform). The tank was refilled when the thermocouples at the lowest location indicated that all tank compartments emptied to a residual LH2 depth 25.4 mm (1 in.) or less. The times for refill ranged from 20 to 50 minutes depending on the thermal efficiency of the insulation being tested. Thus, in contrast to an aircraft application for which the tank would be filled and emptied once per flight, the external temperature and hydrogen level cycled independently during the tests. There was a wide variation between specimen hydrogen boil-off rates as indicated in the results and discussion.
12

UF K
100
90
310r- i
Refuel and Repeat T r 1
Mission
y- Initial
80
70
300 _ Fueling
\ V
Skin 60 — 290
\* *
Ground
Temperature
50
40
280
Hold
Climb J
30 270 -
20 \ \_
10 — 260
\— f)p<;r:ent and Annroach
I I
Cruise
I 1 1 1 1 0 10 20 30 40 50 60
Time, hr
Figure 6. Cryogenic Insulation Surface Temperature for Typical LH2 Fueled Subsonic Transport Mission Cycles 10, 180 km (5500 nm) Range, 152 mm (6 in.) Thick Insulation (Ref.2)
K
340 T
"F 160 T
140 -
Temperature
120 480 600 240 360 Time, sec
Figure 7. Air and Insulation Surface Temperature Histories for a Typical Test Cycle with Tank Wall at LH9 Temperature
13

Even with the guard sections of the tank, which were intended to reduce heat flow between neigh- boring compartments, some specimens exhibited such poor performance that the performance of neighboring insulations was strongly affected.
Tests were conducted on a three shift basis; once a test series began it continued twenty- four hours a day for five days or until deteriorating performance indicated that the testing should stop and specimens should be examined. The shutdown periods represented the time an airplane would be overhauled; the test tank was allowed to warm to the test cell ambient. While the tank was warming, decisions were made pertaining to sample replacement or continuation of cyclic thermal loading on each individual test specimen. The criteria for sample replacement was poor thermal performance and/or extensive visually observed structural damage to the insulation.
Insulation Inspection
During the initial phase of the test program, it was established that the best time for visual inspection of the test insulation was immediately following the purging of the LH2 while the tank was still cold (-200 to -250°F). All cracks and high thermal leaks were clearly defined by frost lines and frost areas. Warm inspection showed only the major cracks. Appendix E contains sketches of the surface conditions as observed during cold inspections where significant changes occurred from the previous inspection. Photographs after warm-up of the samples are shown also in Appen-
dix E.

DATA REDUCTION
When the experimental data was examined it was apparent that the guard cells were not as effective as expected in isolating thermal interactions among the different insulation samples. When poor insulating performance was exhibited by one insulation, either because of its basic character or because of structural degradation, the rate of LH3 boil-off was increased not only at that particular insulation location but also at adjacent insulation locations. Therefore, it was necessary to correct the raw experimental data by analytical means in order to obtain a more accurate evaluation of the thermal performance of the test materials. A lumped parameter finite difference procedure was used. In addition to the analytical correction it was necessary to use engineering judgment to fair some portions of the performance curves. Details of the correction procedure are discussed in Appendix F. This treatment of the data constitutes a refinement as compared to the data analysis used in Refer- ences 6 and 7. The nature of the test data and its correction is summarized here to aid in the assess- ment of the results which are discussed next.
The behavior of all six compartments was considered in analyzing the test data. The extent of the correction to the data is illustrated in Figure 8 where the raw data is shown as circles for all six compartments covered by insulations with different thermal performance and lines are used to show the corrected performance. Each circular data point on the curves of Figure 8 represents every fourth tank boil-off cycle. The triangles and vertical lines on the figure represent the times when the tank was allowed to warm up for inspection and weekend shutdown. It is readily apparent from a comparison of the boil-off histories, defined by raw test data for the compartments, that boil-off times for a better insulation (compartment 3) tend to mirror the performance of the poorer perform- ing adjacent insulations (compartments 2 and 4). It is only when insulations of comparable thermal performance are installed on compartments 2 and 4 (at approximately 2400 cycles) that the true performance of the insulation on compartment 3 is apparent. It is inconceivable that the initial per- formance of the insulation on compartment 3 was poorer than the performance at 2400 cycles. In fact, the thermal performance of closed cell Freon blown polyurethane foams decreases with time due to the diffusion of air into the insulation, Reference 8.
Since the heat going into better insulated compartments from poorly insulated compartments decreases the boil-off time for the better insulation compartments, and increases the boil-off time in the poorly insulated compartments, correction of the data increases the spread in the performance of insulations. The performance of the good insulations is even better than indicated by the raw data while the performance of the poorer insulations is even poorer. This is indicated by the position of the line that defines the corrected performance relative to the raw data.
RESULTS AND DISCUSSIONS
The results of the experimental investigation are summarized in Table II. The table, which covers the 13 test periods, indicates the number of warm up cycles, thermal cycles, and hydrogen fill cycles, the location of the insulation specimens, and specimen condition at the beginning and end of each test period. Figure 9 presents insulating performance, as a function of cyclic thermal exposure, expressed as boil-off times for the various insulations normalized by the initial value for the best
15

Stepan Foam
Boil-Off Rate, Minutes
,
i—*
> < A 8 o o f "1
O 0 0 0
100.00
80.00
60.00 0
° 0 OD OO
0
1
'• o *%
0 "
% 0
0
r o r
(
(
0
*£3 0
(
0
0
Q «0% 0
« 0
0° 0
oH*4 40.00
20.00
> o « I # * 0 0 0 8 ,0
o o
0
•
0.00 —1 ' t- fJ 1 r -t fj *
0
-i —1 1
A — Inspection
o — Test Data
0.00 500 1000 1500 2000 2500 3000 3500 4000 4500 5000
Cycle Number
(a) Compartment No. 1.
Last-a-Foam Rohacell 31
100.00
80.00
Boil-Off 60.00 Rate, Minutes
40.00 ^
20.00
0.00 t 1
0.00 500 1000 1500 2000 2500 3000 3500 4000 4500 5000
Cycle Number
fb) Compartment No. 2.
Figure 8. Boil-Off Times For All Six Compartments.

General Electric
100.00
80.00
Boil-Off Rate, Minutes 60-00
40.00
20.00 '^ftfe
0.00 < t
0.00 500 1000 1500 2000 2500 3000 3500 4000 4500 5000
A — Inspection
o - Test Data
Cycle Number
(c) Compartment No. 3.
ADL PBI Upjohn
ADL (Sta-Foam
Upjohn with Fibers West Marvacell
-*—»-
100.00
80.00
Boil-Off 60.00 Rate, Minutes
40.00
20.00
* Boil-off Time ncreased
by 2/1.5 to Account for Lesser Thickness than other Foams
0.00 f**^ , ,
0.00 500 1000 1500 2000 2500 3000 3500 4000 4500 5000
Cycle Number
(d) Compartment No. 4.
Figure 8. Boil-Off Times For All Six Compartments (Continued).
17

Rohacell Texane CPR 488
41S 333 Shuttle Prime U »+• >•+*-
MarvacellTDR
Boil-Off Rate, Minutes 60-00
Boil-off Time Increased to Account for Thickness Difference
20.00
i — Inspection
o - Test Data
0.00 500 1000 1500 2000 2500 3000 3500 4000 4500 5000
Cycle Number
(e) Compartment No. 5.
RohaCell 51
120.00
Boil-Off Rate, Minutes
Boil-off Time Increased to Account for Thickness Difference
20.00
0.00 500 1000 1500 2000 2500 3000 3500 4000 4500 5000
Cycle Number
(f) Compartment No.6.
Figure 8. Boil-Off Times For All Six Compartments (Concluded),

TABLE II TEST SUMMARY
Test Period Varm-Up "Cycles
Number of Days
Thermal Cycles LH2 Fills
Compartments
1 2 3 4 5 6
Per Test Period Total
Per Test Period Total
Insulation Specimen/Initial Condition - Final Condition (See Codes)
1 1 11 11 4 4 1/N-G 2/N-G 3/N-G 4/N-G.F 5/N-C 6/N-G
2 3 360 371 81 85 1/G-G 2/G-G 3/G-G 4/G,F-G,F 5/G-M 6E/G-S 6W/G-G
3 4 403 774 83 168 1/G-G 2/G-G 3/G-G 7/N-F 8/N-J 6E/S-S 6W/G-G
4 3 335 1109 71 239 1/G-G 2/G-G 3/G-G 7/F-F 8/J-J.M 6E/S-M 6W/G-G
5 2 198 1307 47 286 1/G-G 2/G-G 3/G-G 7/F-F 8/J,M-J,M 6E/M-M 6W/G-G
6
- 0.5 5 1312 2 288 1/G-U 2/G-U 3/G-U 9/N-U 10/N-U 6E/N-U
6W/G-U
7 2 224 1536 47 335 1/U-G 2/U-S 3/U-G 9/U-F 10/U-J 6E/U-S 6W/G-G
8 5 497 2033 136 471 1/G-G 2/S-M 3/G-G 9/F-F 10/J-J.S 6E/S-S 6W/G-G
9 3.5 376 2409 104 575 1/G-G 2/M-M 3/G-G 9/F-F.J 10/J,S-J,S 6E/S-M 6W/G-S
10 5 616 3025 112 687 1/G-G 11/N-S 3/G-G 12/N-G 13/N-S.F
14/N-S 6E/N-G 6W/S-M
11 5 598 3623 123 810 1/G-G 11/S-S 3/G-G 12/G-S 13/S,F-M,F
14/S-S 6E/G-M 6W/M-M
12 3 345 3968 72 882 1/G-G 11/S-S 3/G-G 12/S-S.F 13/M,F-M,F
14/S-S 6E/M-M 6W/M-M
13 3.5 431 4399 106 988 1/G-G L
11 /S-S 3/G-G 15/N-SC 14/S-SC 16/N-SC
INSULATION SPECIMEN CODE - NAME/DENSITY, kg/m3 (lbm/ft3)
1 - Stepan Foam BX250A/37 (2.3)
2 - Last-A-Foam/63 (3.9)
3 - General Electric/67 (4.2)
4 - PBI/28 (1.8)
5 - Rohacell 415/35(2.2)
6 - Rohacell 51/50 (3.1) (6E-East Side: 6W-West Side)
7 - ADL System (Upjohn)/41 (2.6)
8 - Texthane 333/43 (2.72)
9 - ADL System (Stafoam)43 (2.70)
10 - CPR-488-136 (2.26)
11 - Rohacell 31/30 (1.9)
12 - Upjohn 452 W/O Fibers/41 (2.07) East Side
13 - Upjohn 452 with Fibers/41 (2.13) West Side
14 - MarvacellTRD/96(6) (Commercial, MM15-05)
15 - Marvacell/75(4.7)
16 - Marvacell/71 (4.4)
CONDITION CODE, 30 X 61 cm SPECIMEN
N — New
G - No Visable Cracks
S - Slight Cracks
SC — Many Surface Cracks
M — Major Cracks
J — Cracks at "V" Joint
U — Not Inspected

■o c <o « *-> *- = % oS* *
oo = s <§ = =
^ « .c ^ to to
i o a £ « « O DC D 5 5 S
o 4- to
Q <"
I I I I
o) o »- co
c3
I I
Tt CO
LO
E to 0
LL
E to O
II E to
to v—
•<* LO
o 'a
CO co CO a r <u CU
L to < LL o
to u to _l j=
a tu LL! CO o S Q
C/3 _l o Q. cr tr < h-
in S ^^ > o -a </,
a ü -c 228
■a S 2 2 -1 7 3 J) I
£« | «its- » o E c o ii EU
1 8 S ? u E = < to 3 " ° m SL£
I I I I I
r-Nn^-inior-ixi
"o
U
u
- I tu 3 ü Z o ig
!: c o OS
-Q O
Z OH M C
3 C
XBUJV* '3lu!l W0-l!°8 9ft!ie|9y
20

performing insulation. The behavior of each material, as summarized with the aid of Table II and Figure 9, is discussed here; more detailed behavioral characteristics are provided in Appendices E and F.
Polyurethane
Two polyurethane foams (Stepan BX 250A, Material 1, and General Electric Polyurethane, Material 3) exhibited the best overall durability and performance. Both of these insulations survived the entire test series (4400 thermal cycles or the equivalent of approximately 15 years of airline ser- vice) with no evidence of serious structural failure. The decreases in boil-off time observed for these two insulations correspond to indications of cracking and frost near edges and may be related more to joint design than to insulation characteristics. The thermal performance of these insulations was initially very good and degraded very slowly. Final performance was still relatively high, see Figure 9. Note that the density of the General Electric foam is 180% that of the Stepan foam so the latter has the higher thermal efficiency (pk product) throughout the entire test duration.
The third polyurethane material, Last-A-Foam, Material 2, exhibited fair thermal performance for approximately 1200 cycles (approximately 4 years of airline service) before experiencing a signifi- cant degradation in thermal performance. The failure of the Last-A-Foam was first detected by a sig- nificant increase in the hydrogen boil-off rate. Visual examination of the warm insulation at that time revealed no cracks in the 30 x 60 cm (12 x 24 in.) insulation specimens but a few very fine tribu- tary type cracks in the upper and lower insulation blocks. When the insulation was examined immedi- ately after the next test period, the insulation was still cold so that a significant frost and streams of white vapor buildup were observed around these few cracks. This suggested that the cracks propa- gated all the way through the insulation and that air was cryopumping to the tank surface. The cold inspection after 1536 cycles revealed slight cracking on one of the 30 x 60 cm (12 x 24 in.) slabs. These grew to major cracks after 2034 cycles and extended further after 2409 cycles. Slight cracking observed on the other 30 x 60 cm (12 x 24 in.) slab at 2034 cycles grew slightly after 2409 cycles. The through - thickness nature of the cracking was confirmed during sample removal after the 2409 cycles, the samples separated along the cracks. Similar failure modes occurred for polyurethane ma- terials in Reference 5.
Polymethacrylimide
Based on previous experience with cryogenic foams for a hypersonic application, Reference 5, and calculations which indicated the highest margin of any of the foams between the ultimate stress of the foam and the anticipated thermal stress, the polymethacrylimide foam insulations (Rohacell 31, 51, and 4IS) were leading candidates for the subsonic transport application at the onset of the test program. However, the thermal cycle performance as shown in Figure 9 was poorer than that shown for the best polyurethane foams.
Rohacell 31, Material 11, a 30 kg/m2 (1.9 lbm/ft3) density foam, displayed the best thermal performance of the polymethacrylimide materials. After 616 thermal cycles, short curved hairline
21

surface cracks were observed on one of the two slabs. These grew with increasing number of thermal cycles but no cracks were observed on the other slab. However, this material sustained 1990 thermal cycles with only modest degradation of the thermal performance. Frost was noted only after 1990 cycles, suggesting that crack growth through the thickness of the insulation was slow.
The Rohacell 51, Material 6, indicated a slight crack on one side (east side - Table II) after the first 371 cycles. However, because the thermal performance had not degraded significantly the speci- men was retained until 1307 cycles at which time the cracked side was removed and another Rohacell 51 specimen installed; the other side was still unblemished and was retained. The newer piece of insul- ation was observed to be cracked on the next warm-up cycle, apparently because of voids in the bond under the foam, but was not removed until it had undergone a total of 1102 cycles. A third piece was bonded to the troublesome side and the cycling resumed. After 1559 cycles on the newest piece and a total of 3968 cycles on the side with the original insulation (west side - Table II), the insulation was cracked badly on both sides and its useful life was over. Although the Rohacell 51 failed structurally, the thermal performance of the insulation degraded slowly.
Rohacell 4IS, Material 5, which contains a flame retardant additive, was badly damaged at the time of first inspection and, therefore, the specimen was removed after only 371 thermal cycles. The initial performance was only fair; the structural failures were extensive.
The Rohacell foam insulations all failed in a similar manner. The first indication was a curved hairline surface crack which had a very shallow inclination angle with respect to the surface of the insulation, see Figures 10a and 10b. As the insulation was exposed to more thermal cycles the crack grew in length and depth and began to lift on the concave side of the crack until after repeated cyclic exposure both ends of the crack met and a circular piece separated from the main panel. This left a dish-like failure of the panel surface. The lack of an initial through crack to the tank surface is con- sistent with the gradual deterioration of the thermal properties of the polymethacrylimide foams.
Polybenzimidazole
The polybenzimidazole (PBI) foam, Material 4, was developed by NASA Ames Research Center to be used as a flame retardant material for helicopters. Previous experience, Reference 5, indicated that the material is permeable. In an effort to seal the material two approaches were taken: A poly- ethylene sheet was bonded to the outer surface of the insulation on one side of the tank and a cryo- genic polyurethane adhesive, Crest 7450, was buttered on the outer surface of the insulation on the opposite side of the tank. This adhesive, which is the same as that used to bond the specimens to the tank, formed a tough, tenacious skin. However, the thermal performance of the polybenzimidazole material was still very poor, by far the worst tested, see Figure 9. When the specimen was examined after 371 cycles it was found to be saturated with ice crystals even under the polyethylene sheet. The performance of this specimen was so poor (boil-off times less than 10% those of the better insulations) that it affected the performance of all of the specimens, especially those adjacent to it. Therefore, the specimen was removed even though no structural damage was observed.
22

cm
in.
10
I 4
(a) Rochacell 51,1109 Cycles.
cm 10 i I h ■—H &~ i
0 in. 4
(b) Rochacell 41S, 371 Cycles.
(c) Texthane and ADL (Upjohn) System (0 Cycles).
(d) Texthane and ADL (Upjohn) System (748 Cycles).
Figure 10. Typical Structural Failures in Foam Insulations.
23
Modified Polyisocyanate
Marvacell is a modified isocyanate foam which is nonflammable. Normally, Marvacell is avail- able in several densities and thicknesses; however, at the time of the investigation only 3.8 cm (1.5 in.) thick, 96 kg/m3 (6 lbm/ft3) density specimens were available, Material 14. Because of relatively higher density, the pk product of this foam was high relative to the other foams. Normalized boil-off times for this insulation presented in Figure 9 should be increased by a factor of approximately 1.3 (the ratio of specimen thickness) to provide an assessment of the thermal performance of this insul- ation relative to other insulations. Although the initial boil-off times were very high (considering the thickness adjustment) the thermal performance decreased markedly with thermal cycles, apparently due to progressive cracking which was first observed after 616 cycles; the insulation ultimately failed structurally after approximately 2200 thermal cycles.
Lighter densities of this material became available toward the end of the test program, Materials 15 and 16. Although given different material numbers because of slightly different densities, these materials were nominally the same. Their poor performance as compared to the more dense Material 14 suggests a significant loss in structural properties as the density of this formulation is decreased.
Polyisocyanurate
The two polyisocyanurate materials examined in this study were the prime and backup insul- ations for the single use, throw-away LH2 fuel tank for the boost stage of the space shuttle at the time this test program started. These two insulations, Texthane 333 and CPR 488, Materials 8 and 10, exhibit moderatly good thermal performance, Figure 9, but both foams deteriorated structurally and had to be removed after a relatively short time by aircraft standards. Although developed for a single flight application, the Texthane material survived 909 cycles and the CPR 488 survived 1100 cycles before being replaced due to poor performance.
These foams were either poured or sprayed in layers. Their failure was characterized by rela- tively wide and ragged cracks along the 60 cm (2 ft) edges of the specimen, see Figure 10, and other smaller cracks that propagated under the surface of the specimen into the interior. As the specimens were exposed to repeated cycling, the width and depth of the cracks increased, but no pieces of insul- ation separated from the main panel. Upon removal of the specimens from the apparatus, a slight handling load caused the insulations to delaminate at the interfaces between the layers. In addition, the insulation that was nearest the tank wall was relatively spongy with a very low abrasive resistance suggesting a complete disintegration of the foam cells.
Insulation Systems
Two foam insulation systems prepared by the A.D. Little Company of Cambridge, Mass Reference 11, were tested. These systems had two vapor barriers, one on the outer surface (Z/Z. = 0) and one at Z/Zmax = 0.62. Each vapor barrier was a laminate composed of one layer of mylar
max
24

0.013 mm (0.0005 in.) thick, two layers of aluminum 0.025 mm and 0.013 mm (0.001 in. and 0.0005 in.) thick, another 0.013 mm layer of mylar, and a layer of 33.9 g/m2 (1.0 oz/yd2) dacron woven fabric. The two layers of mylar offer tensile strength, the two layers of aluminum resist gas diffusion and the dacron cloth resists tearing. Both systems used foams which had chopped fiberglass added for reinforcement. One system, Material 7, used Upjohn 452 (a polymetric isocyanate) while the other, Material 9, used Stafoam AA 1602 (a toluenet isocyanate). As can be seen from Figure 9, both systems had fair thermal performance initially but the performance deteriorated rapidly with thermal cycles.
Initially, the exterior vapor barrier of the ADL Upjohn system appeared relatively smooth, Figure 1 Oc. After the first set of cyclic tests the vapor barrier was drawn tight against the outer sur- face of the foam insulation, Figure lOd, and had a cratered appearance. This behavior indicated that the insulation was permeable and some cryopumping was occurring. After a week of cyclic testing, visual examination when the specimen was cold showed that both sides of the insulation were com- pletely covered with frost within 7.6 mm (3 in.) of the edge of the sample. A cold surface is consis- tent with the high boil-off rate recorded for these insulations. During post test examination no cracks were detected.
The ADL Stafoam system, which did not draw the vapor barrier taut as did the Upjohn system, was found to be uncracked and non-permeable after testing. Nevertheless the thermal performance was unsatisfactory.
In an effort to determine the effect of chopped fiberglass reinforcement and vapor barriers on foam thermal performance and strength, two specimens of Upjohn 452, Materials 12 and 13, were bonded to a single test compartment (one on each side); one of the specimens had fiberglass reinforce- ment, Material 13, but neither had a vapor barrier. The thermal performance of this "composite specimen" is shown in Figure 9. Even though the foam in the composite specimen cracked, the thermal performance was better than the ADL Upjohn system. The fiberglass reinforced side cracked at more locations than the unreinforced side. Furthermore, a great deal of frost was observed on the reinforced side after 616 cycles and it was steaming from cold air after each test period while the unreinforced side had no frost until after 1559 cycles. Therefore, it was concluded that the fiberglass reinforce- ment degraded both the thermal and structural performance of the foam. In contrast, vapor barriers, while not improving the thermal performance apparently improved the structural integrity since the insulation specimens without a barrier cracked while the insulation system which had barriers did not crack.
CONCLUDING REMARKS
Fourteen commercially available organic foam insulations were evaluated to determine their suitability for insulating liquid hydrogen tanks of subsonic hydrogen fueled aircraft. Materials in- vestigated were polyurethane, polymethacrylimide, polyisocyanurate, polymetric isocyanate, poly- benzamidazole, toluenedi isocyanate and isocyanate foams. The test specimens included foams with incorporated chopped fiberglass reinforcements, others which contained flame retardants, and some which were covered with vapor barriers. Insulation specimens were bonded to a thin, flat aluminum tank. Foam thickness was scaled to simulate conditions encountered by insulation on a tank of large
25

diameter. The tests were conducted by filling the tank with liquid hydrogen and exposing the outer surface of the insulation to a cyclic thermal environment representative of repeated subsonic aircraft flights. The boil-off rate in each compartment indicated insulation thermal performance.
The thermal performance of all insulations deteriorated with increased flight cycles although, in some cases, the deterioration was slight. Two unreinforced polyurethane foams survived 4400 thermal cycles (representative of approximately 15 years of airline service) with evidence of very little structural deterioration. The polyurethane foam insulations also exhibited excellent thermal per- formance. The Stepan foam was particularly attractive because of its much lower density and only slightly faster boil-off.
The addition of chopped fiberglass reinforcement or flame retarding materials during foam formulation proved harmful to thermal performance and/or the useful life of the foams. Vapor barriers had little influence on the thermal performance; however, they seemed to enhance structural integrity.
Each generic foam type had a characteristic failure mode. Polyurethane foams exhibited fine hairline through cracks which grew in length and width; polymethacrylimide foams exhibited arc shaped surface cracks which grew in depth and length, and polyisocyanurate foams became soft and mushy on the side bonded to the tank. Insulation poured or sprayed in layers failed at the interlayer boundaries. Nine of the sixteen material samples tested indicated some damage near the joint regions either as cracks or as frost.
26

REFERENCES
1. Witcofski, Robert D., Alternate Aircraft Fuels-Prospects and Operational Implications; NASA TMX-74030, May 1977.
2. Brewer, G.D., Morris, R.E., Lange, R.H., and Moore, J.W., Volume II - Final Report: Study of Application of Hydrogen Fuel to Long-Range Subsonic Transport Aircraft. NASA CR-132559, January 1975.
3. Brewer, G.D., LH2 Airport Requirements Study. NASA CR-2700, March 1976.
4. Anon: An Exploratory Study to Determine the Integrated Technological Air Transportation System Ground Requirements of Liquid-Hydrogen-Fueled Subsonic, Long-Haul Civil Air Transports, NASA CR-2699, May 1976.
5. Helenbrook, R.G., and Colt, J.Z., Development and Validation of Purged Thermal Protection Systems for Liquid Hydrogen Fuel Tanks of Hypersonic Vehicles; NASA CR 2829, June 1 977.
6. Sharpe, EX., and Helenbrook, R.G., Durability of Foam Insulation for LH2 Fuel Tanks of Future Subsonic Transports, Presented at the International Cryogenic Materials Conference on Nonmetallic Materials and Composites at Low Temperatures, Munich, West Germany, July 10-11, 1978.
7. Sharpe, E.L. and Helenbrook, R.G., "Cryogenic Foam Insulation for LH2 Fueled Subsonic Transports" Presented at the 2nd AIAA/ASME Thermophysics and Heat Transfer Conference, Palo Alto, California, May 24-26, 1978.
8. Schroeder, C.J., Insulation Commonality Report. Volume I - Multilayer Insulation Synopsis. NASACR-161314, 1973. Volume II - Internal Insulation Ablators and Vacuum Jacketed Tanks Synopsis. NASA CR-161315, 1973.
9. Lemons, C.R., and Salmassy, O.K., Advanced Material Composites for Use as Insulations on Space Shuttle LH2 Tanks. NASA CR-124388, 1973.
10. Dixon, R.R., Edelman, L.E., and McLain, D.E., Effect of Aging on Thermal Conductivity of Cellular Materials, Journal of Cellular Plastics, Jan., Feb. 1970.
11. Ruccia, F.E., Lindstron, R.S. and Lucas, R.M. "Study of Thermal Insulation for Airborne Liquid Hydrogen Fuel Tanks., NASA CR-158920, September 1978.
27

APPENDIX A MATERIAL IDENTIFICATION AND LABELING
Material
Stepan Foam BX 250A
Last-A-Foam
General Electric
PBI
Rohacell 31, 41S, 51
ADL System (Upjohn)
Texthane 333
ADL System (Stafoam)
CPR-488-1
Upjohn W/O Fibers
Upjohn With Fibers
Marvacell
Type
Polyurethane
Polyurethane
Polyurethane
Polybenzimidazole
Polymethacrylimide
Polymetric Isocyanate (Upjohn 452) with Chopped Glass Fibers
Polymetric Isocyanate
Toluenediisocyanate (Stafoam AA1602) with Chopped Glass Fibers
Polymetric Isocyanate
Upjohn 452 (Polymetric Isocyanate)
Upjohn 452 (Polymetric Isocyanate)
Modified Isocyanate
Company or Source of Material
Stepan Chemical Co.
General Plastics Mfg. Co.
General Electric Co. (Tacoma, WA)
NASA Ames
ROHM, GMBH, Germany
CPR Division, The Upjohn Co. Actual Test Material was Supplied by Arthur D. Little, Inc.
J.E. & Sons, Inc. Actual Test Material was Supplied by MSFC
Expanded Rubber & Plastics Co. Actual Test Material was Supplied by A.D. Little, Inc.
CPR Division, The Upjohn Co. Actual Test Material was Supplied by MSFC.
CPR Division, The Upjohn Co. Actual Test Material was Supplied by A.D. Little, Inc.
CPR Division, The Upjohn Co. Actual Test Material was Supplied by A.D. Little, Inc.
Technology Resources Development Inc.
28

APPENDIX B ADHESIVE EVALUATION*
A review of literature and brochure data identified seven candidate adhesives for use in apply- ing polymeric foam insulation to a cryogenic tank wall. These adhesives were:
APCO 1252(Urethane)
Solithane Cl 13 (Urethane)
Hysol ADX-394-1 (Filled Epoxy)
Hysol EA9309 (Epoxy)
Crest 7343 (Urethane)
Crest 7450 (Urethane)
Crest 7410 (Urethane)
- Applied Plastics Co., Inc. El Segundo, CA
- Thiokol Chemical Corporation Trenton, NJ
- The Dexter Corporation, Olean, NY
- The Dexter Corporation, Olean, NY
- Crest Products Company, Santa Ana, CA
- Crest Products Company, Santa Ana, CA
- Crest Products Company, Santa Ana, CA
Peel and shear strengths of these materials were plotted from manufacturer's data over the recom-
mended temperature range, see Figures 11 and 12.
Other assessments of these adhesives for our application were made as follows:
APCO 1252 has a solvent evaporation curing system, and consequently, is only recommended for relatively small areas.
Solithane Cl 13 requires primers and plasticizers in addition to resin and a catalyst for its cure. The manufacturer could not recommend the use of the system at temperatures below 237K (-33°F).
Hysol ADX-394-1 has the lowest peel strength in the lower temperature ranges of the candi- dates. There is no data for this adhesive at temperatures below 219K (-65°F).
Hysol EA9309 has high shear and peel strengths at room temperatures but the peel strength degrades rapidly below room temperature and no strength data is available for temperatures below 219K(-65°F).
Crest 7343 has excellent low temperature properties. Bell's previously experienced difficulty in its application. The manufacturer suggested the use of either of the following for easier application.
Crest 7450 has excellent low temperature properties also. It requires melting of a catalyst prior to mixing the resin.
Crest 7410 has properties which are similar to Crest 7450. It uses a liquid catalyst which does not require heating.
♦Commercial products are identified to adequately specify the materials used; in no case does this imply recommenda- tion or endorsement of the materials by NASA or by Bell Aerospace Textron.
29

Peel Strength
(lb/in.) (kN/m)
80 r 14
12
60 10
8
40 6
20 4
2
n 0
Tensile Shear Strength
ksi MPa
10 r 70 r
O Crest 7343 (urethane)
A Hysol ADX-394.1 (epoxy)
□ Hysol EA - 9309 (epoxy)
O Crest 7410 (urethane)
V Crest 7450 (urethane)
50 100 150 200 250 300 350 400
-400 -300 -200 100 200 300 -100 0
Temperature
Figure 11. Peel Strength versus Temperature for Candidate Adhesives
450 K
-400 -300 -200 -100 0
Temperature
100 200 300
Figure 12. Tensile Shear Strength versus Temperature for Candidate Adhesives

From this preliminary evaluation, Crest 7410 and Crest 7450 were the adhesives selected for comparative evaluation. Testing was conducted to verify materials and procedures that were to be used on the full scale insulation assembly. The insulations used and the adhesives are shown in the test configuration of Figure 13. The insulation specimen holder itself was fabricated from aluminum box core extrusion, the same type as used for the larger test vessel. Four different insulations were bonded onto this container, Rohacell 31, 41S, and 51, and BX250A. The external surfaces of the aluminum cryogen container were prepared by solvent cleaning with Chlorothene NU (Dow Chemical Company, Midland, Michigan) abraded with 120 grit emery paper, solvent cleaned with Chlorothene, scowered with a damp cloth, water, and Gibson cleaner (Parex Corp., Ltd., Lakewood, CA) rinsed with demineralized water, etched with sulfuric acid/sodium dichromate solution thickened with Cabosil to form a paste, rinsed with demineralized water to obtain a continuous water film without a water break, and air dried. The selected adhesive was applied to both the surface of the cryogen container and the surface of the insulation; a plastic trowel was used for spreading. As each side of the vessel was coated with adhesive the test insulation was pressed in place. After the first layer of foam was installed, the second layer was added to the top and bottom of the assembly. Light pressure was applied with wooden cover plates and clamps on four sides of the assembly; weights were used to load the other two sides. The adhesives were cured at room temperature for 72 hours.
Testing consisted of thermal cycling followed by the application of a cleavage force to each of the bond lines. Prior to the start of thermal cycling, the aluminum vessel was filled with liquid nitro- gen and held at room temperature for 30 minutes. Then the test vessel was placed alternately in an oven environment of 344K (160°F)for 10 minutes. inspected,exposured in a cold chamber at 219K (-65°F) for 10 minutes, and inspected again. After repeating this cycle six times, the liquid nitrogen was drained from the container and the assembly was allowed to reach room temperature. Then, a prying force was applied to each insulation bond line.
The bonds of Crest 7410 appeared to be only partially cured, they showed poor adhesion with 100% cohesive failure of the adhesive. The Crest 7450 bonds all exhibited excellent adhesion and failures were 80 to 100% cohesive failure of the foam insulation. These bond lines were void free and no insulation cracks were observed. Based on these results the Crest 7450 was selected for use in bonding the test insulations to the large cryogenic test vessel for the full scale insulation test program. When the tacky condition of the Crest 7410 bond lines was discussed with the supplier he suggested that the particular batch of adhesive was defective. While a good batch of Crest 7410 may have been suitable for the application, it was not retested because the Crest 7450 was adequate for purposes of the program.
31

LN2'Fill Tube
(2.38)1
5.1 (2.0) Typical
!;;;;;;;! BX25OA
(5^9 Rohacell 31
*\ y^ Rohacell 41S
Rohacell 51
Crest 7450
\//////\ Crest 7410
XX(XX) mm (in.)
Figure 13. Insulation and Adhesive Test Configuration
32

APPENDIX C THERMAL STRESS ANALYSES
As cryogen is added to an insulated storage tank, the interior of the tank wall will chill and the temperature at various locations within the insulation will decrease gradually until equilibrium is established. Subsequent changes in ambient temperature will cause slight perturbations in the temper- ature distribution through the insulation. Unless external temperature changes are very large, these variations will not influence the temperature of the cryogenic insulation near the tank wall. Figure 14 presents temperature and stress histories in a schematic fashion. Initially, the tank wall and insu- lation are at ambient temperature, Figure 14a. As LH2 is added, the tank wall chills rapidly; in the matter of a few seconds, it reaches LH2 temperature. As the tank wall chills it experiences an increas- ing tensile stress because the insulation has not changed in temperature and tries to resist contraction of the tank wall. As a result, compressive stresses are induced in the insulation, Figure 14b. As time passes, insulation begins to cool also, Figure 14c, and because the coefficient of thermal expansion for the insulation is much higher than for the tank wall, the insulation nearest to the tank wall tries to shrink more than the tank wall, thus inducing a tensile stress in this portion of the insulation. The tensile stress in the tank wall decreases slightly and the compressive stress in the warmer portion of the insulation increases slightly. Finally, an equilibrium temperature distribution is established through the tank wall and insulation system, Figure 14d. At this time, the compression stress in the outer sur- face of the insulation system reaches a maximum. There has been little change in the tensile stresses in the tank wall or in the insulation because there has been only a modest change in the temperature distribution and the resultant stress distribution. Now, if the ambient temperature changes as shown in Figure 14e, the resultant stress changes are primarily in the warmer region of the insulation. Temp- erature cycling associated with ground-air-ground operation involves relatively small variation in com- pressive stresses in the outer surface of the insulation and almost no variation in the tensile stress in the insulation at the tank wall. Much larger variations in stresses in the insulation, at both the outer surface and tank wall are induced by the warm-up/chill-down cycle if the tank is allowed to return to ambient temperature before being refilled by the cryogen.
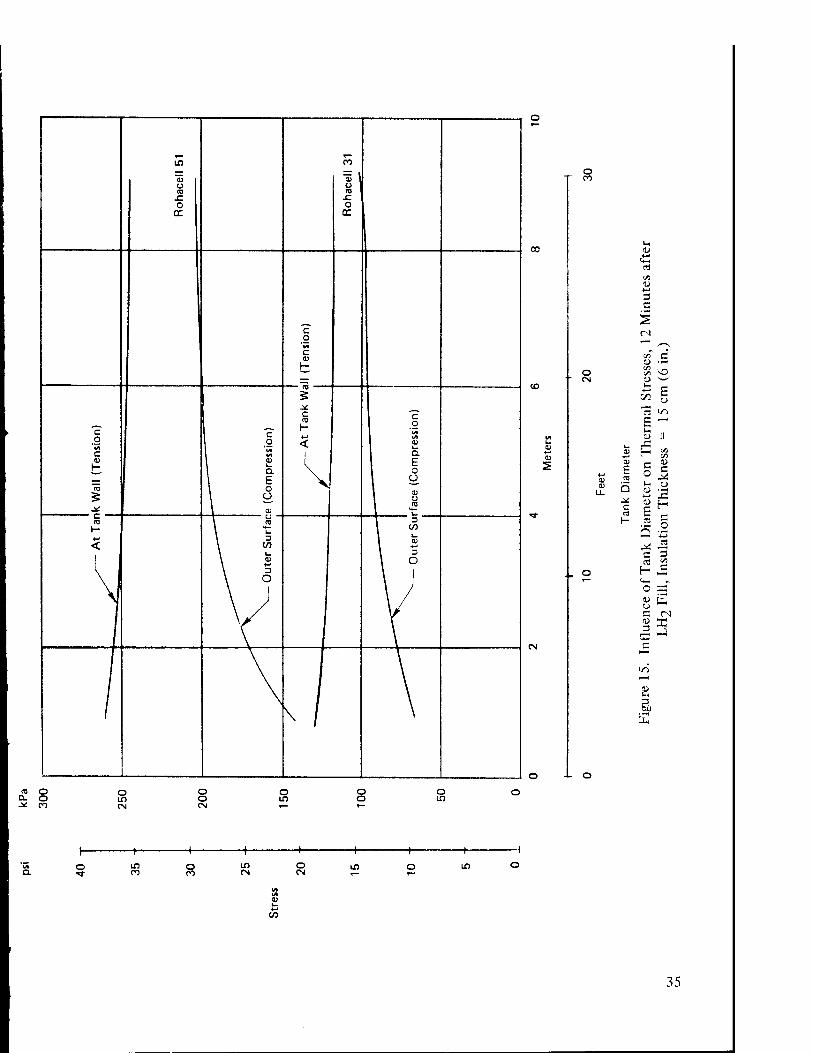
The influence of tank diameter on thermal stresses is shown in Figure 15 for two different insulations. For diameters greater than about 3 meters, the stress levels are essentially constant; tanks of smaller diameter induce rather different stress levels. As the diameter decreases, the tensile stress in the insulation at the tank wall interface increases while the compressive stress in the outer surface of the foam insulation decreases. The increase in tensile stress is quite small, only about 5% as the tank diameter decreases from 3 meters to 1 meter. The change in compressive stress is much greater, about 20% decrease as the diameter decreases from 3 meters to 1 meter. The greater stiffness of the high density Rohacell 51 results in higher stresses as compared to Rohacell 31.
To quantitize temperature trends, a series of finite difference thermal analyses were conducted for insulations of various thicknesses. Typical results are presented in Figure 16 for a 51 mm (2.0 in.) thickness of insulation. Initial conditions for each of these sets of results were the final conditions of the preceeding set. Figure 16a shows the temperature history of the insulation, initially at 294K (70° F), after the storage tank has been filled with liquid hydrogen and the ambient temperature has been reduced to 255K (0°F). As time passes, there is relatively little change in the total temperature difference, but a radical change in the temperature gradient occurs. If the surface temperature is
33

Temperature Stress History History
t t
1 nsulation
I Insulation
Tank 1 Tank 1
Wall j 0 300 K wa" | ■ 0 + kP
a. Initial Equilibrium Conditions
ZL 0 300 K - 0 + kPa
b. Tank Wall Just Chilled to LH2 Temperature
0 300 K
c. Insulation Partially Cooled
300 K
d. Equilibrium
Range of Variations in Ambient Conditions
300 K
e. Effect of Ambient Variations
0 + kPa
0 + kPa
0 + kPa
Figure 14. Temperature and Stress Histories During Cooldown and Operation of Insulated LH2 Tank
34
in cö % \ 0)
o a to ra .c .c O 0
0C cc
c o vt c a H _
PO '
5 _*
_arm^ _ c CO
H 1 "c 1 -2 c
.2 1 c
o < 1 'vi \ "* 1 tu
*A 1 L. c 1 **
1 v* 1 1 °- CD 1 a>
1 o. k E — E V 1 o ^^ ra 1 o 5 I —
1 QJ 1 u 1 ra .* I <u
to 1 u 1 D
H \ k- I "* +_t \ D
1 ^ < \ ^ \ L. \ D
1 \ ° V. \ D \ 1
\ ° y 1 J
\
2
O CO
t-i CD
3 C
S rJ —' ^ t/i rt (U
o t/3 c/1 VO
CM 1) '■■w'
E
« lO
E —' ■-
<i> II x:
a H V5 c/3
tU
E "3
c o c
tu Li. Q a>
c to
tL>
E H c o H «
Q 4-i
^ ea
c 3 Tl t/5
O H c T— "*H „
o =3 tu li,
c «N
H-l
c
3
tu
to O D. o -* CO
O IT) CM
O O CM
o Lf)
O o o LO
o If) co o
CO in CM
O CM
tu L-
CO
35

a E H
100
0
-100
-200
-300
-400
-500
Time, Seconds
0
0 1.0 1.2 3.0 4.0 5.0 6.0
Centimeters
0 0.4 0.8 1.2 1.6 2.
Inch
Insulation Thickness
0 2.4
L Tank Wall
UF
100
0
B -100
E -200 V H
-300
-400
-500
Time, Seconds
600
1.0 2.0 3.0 4.0 5.0 6.0
Centimeters
0 0.4 0 1.2 1.6 2
Inch
nsulation Thickness
0 2.4
L- Tank Wall
a. During Initial Cool-Down, TQUt = 255 K (0 F) b. During Initial Warm-Up, Tt = 316 K (110 F
UF
100r
0 -
-100
« -200
-300
-400
-500
K
350
Time, Seconds
0
0 1.0 2.0 3.0 4.0 5.0 6.0
Centimeters
' ' ' ' ' } ' 0 0.4 0.8 1.2 1.6 2.(0 2.4
Inch Ljank
Insulation Thickness
Time, Seconds
,600
,30
Wall
0 1.0 2.0 3.0 4.0 5.0 6.0
Centimeters i i J i i i 1
0 0.4 0.8 1.2 1.6 2.0 2.4
Inch Tank Wall Insulation Thickness
d. During Second Warm-Up, TQUt = 344 K(165°F)
Figure 16. Temperature Distribution Through 51mm (2 in.) of Rohacell-31 Insulation
c. During Second Cool-Down, Tout = 219 K(-65 F
36

raised after thermal equilibrium has been established through the insulation thickness, the change in temperature distribution is as indicated in Figure 16b. Note the modest change in the temperature difference and gradient. The surface of the insulation reaches the new ambient temperature within about one minute. The cooling trend, as the surface temperature is reduced from 316K (110°F) to 219K (-65°F), is shown in Figure 16c. Again, the surface temperature change is quite rapid and the equilibrium distribution through the insulation thickness is achieved rather quickly - in about 10 minutes. The nature of the temperature distribution is changed more radically if the external environ- ment temperature is raised to 344K (169°F). Figure 16d shows the response of the insulation material to such a change. After about 10 minutes, equilibrium has been achieved.
The temperature distributions within the insulation material were shown to vary as the ambient temperature changes. Even larger temperature changes in the insulation occur as the cryogen is used and the tank wall is warmed by the inward flow of heat from the ambient environment. The tempera- ture differences produce thermal stresses. The repetitious nature of the temperature changes constitutes a cyclic change of loading so that fatigue of the insulation material is of concern.
Using temperature distributions generated from the thermal analyses, a series of finite element structural analyses were conducted to investigate the magnitude of the thermal stresses induced. The intent was to permit comparison with strength data for typical closed cell plastic foams, thereby allowing an assessment of their structural integrity and durability. Because of symmetry considerations, only one fourth of one insulation specimen was modeled with finite elements (see Figure 17). The W and L dimensions were varied to examine the sensitivity of stress distributions to the planform pro- portions of this foam. Rohacell 51 properties were used because of their completeness. Trends for other insulations were similar.
Figure 18 shows the influence of insulation length on the stress distribution through the 15.5 cm (6.0 in.) thickness of the foam. Tensile stresses at the wall of the cryogenic tank are not influ- enced significantly but compressive stresses on the external surface of the insulation are changed quite drastically. Figure 19 presents the same data plotted as a function of insulation length. For these analyses the insulation width was kept constant at 60 cm and the length was changed. Trends are similar, but not identical, to the analyses for the square planform, compare Figures 2 and 19. Lengths beyond about 1.2 meters (4 ft) produce tensile and compressive stress magnitudes which are essentially those for infinite length. Tensile stress magnitude is almost independent of insulation length. By conducting analyses on blocks of rectangular shapes, it was possible to define the relative magnitude of stresses in the two orthogonal inplane directions with a minimum of computer runs. Figure 20 illustrates the effect. The magnitude of the stress is related to the length of the side parallel to the stress axis. Therefore, one-dimensional thermal stress analyses would be adequate for establish- ing approximate magnitudes of the induced thermal stresses for inplane directions. For thick insula- tion there will be a stress induced through the thickness of the insulation material. Because of the methods used to produce foam, the strength properties are usually different for the inplane and through thickness directions. The out-of-plane stresses for two different planform sizes of 15 cm (6 in.) insulation are presented in Figure 20, also. The smaller the insulation block the higher the out-of-plane stress will be. However, its magnitude is less than the inplane stress.
The influence of insulation thickness on thermal stresses is illustrated in Figure 21 for in- plane and out-of-plane thermal stresses. Magnitudes of the maximum stresses are not influenced significantly by the insulation thickness but, by reducing the insulation thickness, the magnitude of the two orthogonal in-plane stress approach each other quite closely and approximate those for the larger and thicker size. The 5 cm (2 in.) thickness selected allows the use of a relatively small speci- men planform to induce inplane stress levels expected on large LH2 tankage.
37

o 3
£ m
l-i U
-^ c <U O
S3 *" e
•"£ e«
tu <q
u 3 60
38
Insulation Length M (ft)
psi
50 T
40 ■
30- 200-
20-
iz 10
01
-10
-20
-30
0.3 0.6 1.2 1.8
(1) (2) (4) (6)
Infinite Plate
Tank Wall
1 -200
18 cm
7 in.
-100--
Figure 18. Maximum Inplane Thermal Stress Through the Insulation Thickness on a LH2 Tank For Various Insulation Lengths and an Insulation Width of 60 cm (2 ft), Rohacell 51
39

h- E
E
psi
50 -r
40 ■■
30 ■ • 200 - -
20 ■■
10--
0--
-10--
-20 ■•
-30 J-
kPa
300
100--
-100--
-200 J-
0.2 0.4 i—
0.6 —V-
0.8 i
1.0 1.2 —V-
1.4 i
3 4
Length of Insulation
1.6 i
Infinite Plate
Analysis
1.8 —V-
2.0 Meters
Feet
\ \_ Infinite Plate
Analysis
Figure 19. Maximum Inplane Tensile and Compressive Thermal Stress in Rectangular Planforms With An Insulation Thickness of 15 cm (6 in.) and an Insulation Width of 60 cm (2 ft), Rohacell 51
40

psi
50"
40 ■-
30-- 200--
20--
10--
0 -
-10 -■
-20 -
-30 -L
kPa
300 T
100--
-100-'
-200 i
Figure 20. Thermal Stresses for Two Different Sample Sizes of Insulation, Rohacell 51

psi
50 T
40--
30-
£ 20 +
« 10T
15 x 180 x 180 cm
— 5 x 30 x 60 cm
0 -
-10--
-20--
-30 L
Insulation Thickness
-100
-2001-
ax & ay
18 cm
in.
Figure 21. Thermal Stress for Two Different Insulation Sample Sizes and Thicknesses, Rohacell 51
42

The thermal stress results presented in Figures 18 through 21 assumed the modulus of elasticity to be different in tension and compression. Early in the course of the investigation, only tensile mod- ulus data were found in the literature. As the literature review of property data was continued, infor- mation was found indicating a significant difference in modulus for the two types of stress. There- fore, additional thermal stress analyses were conducted for a typical temperature distribution to identify the influence of modulus of elasticity differences on resultant thermal stresses. Results are summarized in Figure 22 for the two cases: (1) the tensile modulus applied for both tension and compression, (2) the modulus as a function of whether the stress is tensile or compressive. In both cases, the modulus values were dependent upon temperature. When a single modulus value is used for both tension and compression, only one of the types of stress is predicted accurately. Therefore, it is important that all thermal stress analyses of foam insulation materials utilize the proper tensile and compressive modulus values as functions of temperature.
It should be noted that the stresses reported in References 6 and 7 were based on analyses which used only the tensile modulus. Therefore, the compressive stress levels are over-predicted. However, the major conclusion drawn from these early analyses did not change when the results were corrected for the appropriate tensile and compressive modulii; reducing the thickness of the test foam allows a relatively small planforrn sample to experience the stress levels associated with a thicker foam insulation installed on a large liquid hydrogen fuel tank.
43

Figure 22. Effect of Elastic Modulus on Thermal Stress Distribution, Rohacell 51

APPENDIX D
DETAILS OF TEST APPARATUS
Facility
The test apparatus is located in a test cell designated for hazardous duty at the main plant of Bell Aerospace Textron in Wheatfield, New York. It is possible to remotely control and monitor the liquid hydrogen loading system, the cryogen container level indicating system, the air delivery system for thermal cycling and the insulation surface temperature system. The liquid hydrogen was piped to the apparatus from a hydrogen trailer located a distance away from the cell.
Test Apparatus
The cryogenic insulation test apparatus, Figure 4, consists of a test chamber, the test specimens mounted on the LH2 vessel, a centrifugal blower, a diverter valve, hot and cold heat ex- changers, and the ducting required for a closed thermal cycling system. The centrifugal blower was adjusted to provide a continuous, recirculating air flow at a rate of 736 liters/second (1560 cfm). The diverter valve shunted the air flow to either the hot or cold heat exchanger when the specimens reached the desired minimum and maximum temperatures of the thermal cycle. In the hot heat ex- changer, the circulating air passed over coils through which a liquid flowed at the rate of 1.5 liter/ second (24 gpm). The liquid was heated by electric heaters of 16 kW capacity. In the cold heat ex- changer, the circulating air passed over refrigerant coils which contained freon cooled by a 17.6 kW refrigeration system. The system consisted of the freon compressor (with a standard expansion valve), a freon shutoff valve and an automatic pumpdown control system. The expansion valve was adjusted to be compatible with the heat exchanger size and air flow so that a temperature controller was not required.
After the air passed through one of the heat exchangers, it was manifolded into the test chamber through three ports on each side. These ports, and the transfer ducting, were 20.3 cm (8 in.) in diameter. The ducted air was diffused into the chamber and over the insulation specimen surfaces by perforated aluminum plates which covered a plenum. After passing over the insulation, the air left the test chamber through ports at the bottom. These ports were manifolded to a duct that returned the air to the blower. The ducting, heat exchangers and test chamber were insulated, see Figure 23. Monitoring instrumentation outside the test cell is shown in Figure 24.
The insulated test chamber housed the cryogenic insulation test specimen assembly. This consisted of a compartmented aluminum cryogen vessel to which the insulation specimens were bonded. The container accommodated six specimens per side as shown in Figure 25. These speci- mens could be up to 5.0 cm (2 in.) thick. The container was made from 60 cm (2 ft) sections of extruded web core structural aluminum plank. The webs form a series of cells which measure 3.9 x 4.5 x 61 cm (1.5 x 1.8 x 24 in.). The cells are connected selectively at the bottom of the tank to form six test and seven guard compartments which were separated as shown schematically in Figure 26. Each insulation specimen spans a test compartment and extends over the guard cells at both ends. This arrangement makes it possible to measure the thermal performance of each in- dividual insulation by monitoring the rate of liquid hydrogen boil-off in each test compartment.
45

x> a u 4-» CO U H CO
b
46

c o
c 9>
3
47
o
I I
>
v •a
1
1
I
i
^
> i-
i 1 X
Ö£
■a
y K
ö<
%
%
X
1^1
H h h-
a E <o (3
a E ^
a E <*
<8
a E "
c8
a E ™
c25
a E -
«8
in
LO CN
n
^
30
<
^<3
?ä
^IZ s
T a >
n
I
a > H o CO
T
Ü E c U
S3 «a c
_o '«
£ Q
I
o
o c C/5 U
C 'o
e o
3 60
in c o U c o
a at) o >. U
in
3 6C
E
QJ
48

Insulation specimens were bonded to the aluminum tank with a polyurethane adhesive, see Appendix B for adhesive evaluation details. Triangular prism insulation sections were fitted and bonded at the insulation specimen joints, Figure 26. This technique provided good contact at specimen joints during bonding. Photographs of insulation specimens mounted on the container are provided in Appendix E.
The six test compartments along with five guard compartments between them and two end guard compartments are filled by individual tubes which enter the central cell of each compartment and go to the bottom of that compartment. The fill tubes are all connected to a common tube which passes through an open area over the cells. The open space over the top of the tank cells, see Figure 25, acts as a manifold for the hydrogen boil-off gas and is connected to a stack which rises 12.2 m (40 ft) above the test area. The test tank is vented to ambient pressure through the stack during boil-off.
Operational experience indicated that it was not necessary to continuously monitor system humidity during a test run. Initial frost formation was prevented by providing a positive pressure of cold nitrogen inside the ducting during startup. During long term temperature cycling, an increase in time to reach the low temperature limit would indicate an excessive buildup of frost on the coils of the low temperature heat exchanger. When this occurred, a defrost operation was performed by shutting off the cycling timer. This put the duct valve in the cold position and allowed the heated air to go through the low temperature exchanger with the refrigerant liquid freon valve closed. The heated air was circulated for approximately 20 minutes before normal cycling was resumed.
Instrumentation
The instrumentation that was used during the-test program consisted of two systems: 1) a re- cording system of the warm side surface temperature of the insulation specimens and of the inlet and outlet air, and 2) a fluid level indication system for liquid hydrogen in the test tank/sample holder.
Four thermocouples were bonded to the warm surface of the insulation sample at locations shown in Figure 25. The locations were selected to show the uniformity of heating and cooling by the air flow distribution across the sample surface during the thermal cycling. The output of the five specimen surface thermocouples along with the thermocouple located in the air inlet duct were continuously recorded during the thermal cycling. These temperatures were visually monitored and the cycling rate was periodically adjusted to ensure the specimen thermocouples were within the thermal cycling limits of 267K (+20° F) and 316K (+110°F).
Each of the six test compartments of the liquid hydrogen tank/sample holder contained three thermocouples that were used to determine the level of the cryogen. A thermocouple was mounted at the top, center, and bottom along the vertical centerline of the compartment. The 18 thermo- couples were routed through a sealed fitting to a manual selector switch that was arranged to allow bucking of the output of each thermocouple with the output of a 273K (32°F) reference junction. The net voltage output was displayed on a digital voltmeter. Any thermocouple that was covered with liquid hydrogen had an output of-6.10 millivolts; when all of the thermocouples in each tank compartment indicated this reading, the tank was full. During the test cycle, these thermocouples were monitored and timed. A reading of-6.0 millivolts indicated the thermocouple was exposed to
49

hydrogen gas rather than liquid. The elapsed time required to attain this condition provided the basis for the boil-off rate calculation.
Hydrogen detection instrumentation was located inside the test cell and between the test sample holder (cryogen vessel) and the test chamber. The detection system was set to provide an audio alarm if the environment reached 25% of the allowable lower exposure limit and to provide an automatic shutdown of the test system if the environment reached 50% of the allowable lower exposure limit.
50

APPENDIX E
PICTORIAL RESULTS
This appendix contains photos and sketches of the changes to the specimen's surfaces as the result of thermal cycling. The closeness of the west wall prevented photographing that side of the installation. The photos selected depict the insulation buildup and typical results of cumulative cycling, Figures 27 through 40.
The sketches are of the observations after the cold inspections following test series 2,3,8, 9, 11, 12 and 13, Figures 41 through 47. Some results of the cold inspection are not shown because the observations were essentially the same as for prior inspections or could be inferred from the re- sults of the prior and later inspections.
51

ft *. -i
Figure 27. LH2 Vessel Prior to Mounting of Specimens
Figure 28. Initial Mounting of Specimens
52

Hgure 29. View of üast Side Alter 360 Cycles
Figure 30. RohaceU 41S After 360 Cycles
53

i_
v ..j
Figure 31. Shuttle Prime CPR-488-1 After 1102 Cycles
^Hü^^^i^l^ .-«■»J
0.1 K-, u»a*»K;
Figure 32. Stepan Foam, Brand (X) GE After 2409 Cycles with Rohacell 31 at Zero Cycles
54

Figure 33. RohaceU 31 After 1990 Cycles
Figure 34. RohaceU 51 After 3025 Cycles
55

311111 isllilllllli
llSjiPii
Figure 35. Last-A-Foam After 2409 Cycles
i ,-M
1
M II Figure 36. Marvacell MM-15-05 After 1559 Cycles Marvacell No. 1 and Marvacell No. 2 at Zero Cycles
56

Figure 37. MarvacellNo. I at43l Cycles
H|
IMIIHR ^^^H^H
* i f.' ~ s L "-:
Figure 38. Upjohn Without Fibers After 1559 Cycles
57
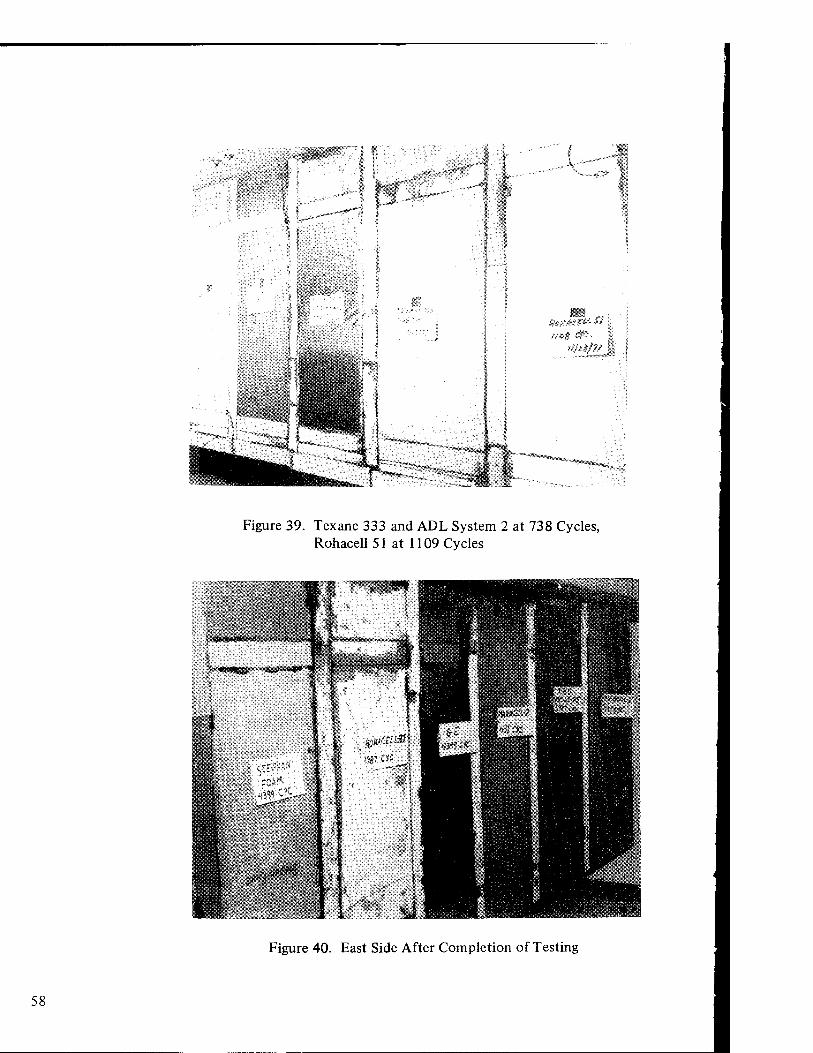
t 1 j
i'--'
! t
tff»tf?/
Figure 39. Texane 333 and ADL System 2 at 738 Cycles, Rohacell51 at 1109 Cycles
Figure 40. East Side After Completion of Testing
58

East Side Cells
1 2 3 4 5 6
V
V
urn
Total Cycles
Stepan Foam
371
Last-A- Foam
371
G.E. Foam
371
PBI + Crest Cover
371
Rohacell 41S
371
Rohacell 51S
371
West Side Cells
fr 1/11/
V
\
Total Cycles
Stepan Foam
371
Last-A- Foam
371
G.E. Foam
371
PBI + Mylar Cover
371
Rohacell 41S
371
Rohacell 51
371
Symbols
Crack y Frost ////
Figure 41. Cold Inspection After Series 2
59

East Side Cells
////////
/
www m
V /
IT Y
Total Cycles
Stepan Foam
1109
Last-A- Foam
1109
G.E. Foam
1109
ADL Sys 2 (Upjohn)
738
Texane 333
738
Rohacell 51
1109
West Side Cells
Total Cycles
1109
I i
m N /i i i
Stepan Last-A- G.E. ADL Texane Rohace Foam Foam Foam Sys 2
(Upjohn) 333 51
1109 1109 738 738 1109
Symbols
Crack y Frost ////
Figure 42. Cold Inspection After Series 4
60

East Side Cells
Total Cycles
Stepan Foam
2033
Last-A- Foam
2033
G.E. Foam
2033
ADL Sys 1 Sta-Foam
2033
CPR 488 Shuttle Prime
924
Rohacell 51
924
West Side Cells
\
jiinin \ /////// W\\YW \\\\\\
/////
t mil
Total Cycles
Stepan Foam
2033
Last-A- Foam
2033
Q.E. ADL CRP488 Foam Sys 1 Shuttle
Sta-Foam Prime
924 924 924
Rohacell 51
2033
Symbols
Crack J~ Frost ////
Figure 43. Cold Inspection After Series 8

East Side Cells
Stepan Last-A- G.E. ADL CPR488 Rohacell Foam Foam Foam Sys 1
Sta-Foam
Shuttle
Prime 51
Total Cycles
2409 2409 2409 1300 1300 1300
West Side Cells
) i< 1111,111 \IIII(((IIIL.
( IF Stepan Last-A- G.E. ADL CPR 488 Rohacell Foam Foam Foam Sys 1
Sta-Foam Shuttle Prime
51
Total Cycles
2409 2409 2409 1300 1300 2409
Symbols
Crack _/" Frost ////
Figure 44. Cold Inspection After Series 9
62

East Side Cells
WWWW
(■
\ \
1 ^
Total Cycles
Stepan Foam
3623
Rohacell 31
1214
G.E. Foam
3623
Upjohn Without Fibers
1214
Marvacell MM-15-05
1214
Rohacell 51
1214
West Side Cells
Total Cycles
Stepan Rohacell G.E. Upjohn Marvacell Rohacell Foam 31 Foam With MM-15-05 51
Fibers
3623 1214 3623 1214 1214 3623
Symbols
Crack _/~ Frost ////
Figure 45. Cold Inspection After Series 11
63

East Side Cells
J
', JJUA
/ I'll
III
I
1A
Total Cycles
Stepan Foam
3968
Rohacel
31
1401
G.E. Upjohn Foam Without
Fibers
3968 1559
West Side Cells
Marvacell Rohacell MM-15-05 51
1559 1559
II UlUL. www/
H (
$
4, X" ̂
\'/, I
Total Cycles
Stepan Foam
3968
Rohacell 31
1559
G.E. Foam
3968
Upjohn With Fibers
1559
Marvacell MM-15-05
1559
Rohacell 51
3968
Symbols
Crack y Frost ////
Figure 46. Cold Inspection After Series 12
64

East Side Cells
;
/////////// \\w\w\ m
Total Cycles
Stepan Foam
4399
Muk
Rohacell 31
1990
fU!
V
G.E. Foam
4399
75 kg/m3
431
\
)
^ M / Marvacell Marvacell Marvacell
MM-15-05 71 kg/m3
1990 431
West Side Cells
Total Cycles
Stepan Foam
4399
Rohacell 31
1990
G.E. Marvacell Marvacell Marvacell Foam 75 kg/m3 MM-15-05 71 kg/m3
4399 431 1990 431
Symbols
Crack s Frost ////
Figure 47. Cold Inspection After Series 13
65

APPENDIX F DATA REDUCTION
The original objective of the testing was to define the relative performance of candidate insulations and to define trends of degradation with the number of thermal cycles. To isolate the insulations, guard cells were incorporated between regions of different insulations, see Figure 5. Unfortunarely, the thermal performance of some insulation materials was so poor, or degraded so rapidly, that the liquid hydrogen behind that insulation specimen, and in its guard cells, evaporated quickly and interaction was initiated with the adjacent test zones. In many instances the true behavior] of the insulation materials adjacent to one which had degraded severely was totally masked by the interaction.
In order to obtain a clearer indication of the true performance capability of each insulation, the experimental results were corrected using a finite difference analytical model which accounted for interaction among adjacent test locations. The analytical model was based on a multinode ideal- ization of the cryogen vessel and the instulation materials attached thereto, see Figure 48. At each test specimen location the cryogen vessel was modeled with three thermal nodes on the lateral centerline of the test zone and at vertical heights which correspond to the locations of the three internal thermocouples. Six test zones were modeled in this way. The insulation material was modeled in a similar fashion. Because there are only three internal thermocouples it was necessary to consider the average behavior of each insulation. Variations of behavior were observed from one side to the other, see Appendix E, but could not be modeled analytically. Heat was assumed to flow through the insulation thickness to the aluminum wall of the cryogen vessel. Heat flow was not per- mitted in the plane of the insulation but was permitted in the plane of the container wall. The heat that reached the aluminum wall could be transferred to the liquid or gaseous hydrogen in the test zone. The heat absorbed by the liquid hydrogen would cause a portion to evaporate. The poorer heat transfer to gaseous hydrogen causes the wall temperature to increase locally. The inplane tem- perature rise forced heat to be conducted in the plane of the wall to the adjacent nodes or test zones as appropriate, see Figure 49.
At time zero, the aluminum container is full of liquid hydrogen. As long as the test zones are completely filled, the temperature of the aluminum container is constant at liquid hydrogen temperature and thus there is no inplane conduction. As time progresses, heat flows through each insulation in proportion to its thermal conductivity and thickness. When the thermal conductances of the insulations differ, the hydrogen will evaporate at different rates from the different test zones. This can produce different heights of LH2 in adjacent test zones which, in turn, give rise to nonuni- formity of temperature in the aluminum container wall and to lateral heat flow from one test zone to another. Thermal analysis indicated that the aluminum wall of the box core cryogen vessel allows considerable lateral heat flow with small inplane temperature differences; even when one test zone is completely dry the inplane temperature differences in the test vessel would be about IK. As the heat flow through an insulation specimen evaporates through hydrogen, the thermocouples in its zone become exposed, beginning at the top and continuing to the central and lower locations. When the top thermocouple was exposed, timing of the LH2 loss began. By recording the time required to evaporate the known quantity of hydrogen between the top, central, and lower thermocouples, the average heat flow can be computed.
66

Node (T/C Location)
Figure 48. Analytical Model of Aluminum Cryogen Vessel
Indicates Dry Portion of Test Zone
Indicates Inplane Heat Flow from Dry Portion of Test Zone
Figure 49. Heat Flow from Test Zone Insulated by Degraded Foam Material
67

Because of the high thermal conductance of the cryogen vessel, the analysis assumed its tem- perature to remain at LH2 temperature regardless of the height of the liquid hydrogen. The first step in implementing the forward finite difference solution for a particular test run involved the computation of the apparent thermal conductivity of the insulation material in the cell where the thermocouples indicated the beginning of dryout, exposure of both the first and second thermo- couples. For purposes of analysis, each test zone was divided into three vertical sub-zones. An average boil off time was computed for each of the three zones using the two average times measured from exposures of the top, t , center, tr, and lower, t2, thermocouples. The average time to evapo- rate the LH2 from the upper0sub-zone was equal to (8/12) (t1 -t0). The time required to evaporate LH2 from the central sub-zone was computed as (1/2) [(8/12) (tj -t0) + (8/12) (t2 -tt)]. The time to evaporate LH2 from the lower sub-zone was (8/12) (t2 - tx). In addition to the time required to dry out each sub-zone of any test zone, the volume (mass) of liquid hydrogen which must be evapo- rated from each sub-zone and the surface area and thickness of insulation are known. From this information and the temperature difference through the insulation thickness, the apparent thermal conductivity of the foam insulation in this zone at the particular location can be calculated.
Once a portion of the test zone has lost the liquid hydrogen behind it, its local temperature begins to rise. The rise in the temperature of the aluminum cryogen is small; a IK rise is sufficient to transfer all of the inward flow of heat from a dried out zone to its two adjacent zones. Neverthe- less, heat begins to flow laterally and vertically in the plane of the aluminum vessel to neighboring regions. These components of heat flow from the dried out region contribute to the boil-off rate in other regions. When apparent thermal conductivity values are computed for these adjacent regions, account is taken of these additional heat flows which add to the heat flow through the insulation thickness of these adjacent regions. In a sequential manner, the thermal calculations are carried out until the cryogenic vessel is completely emptied and an apparent conductivity is computed from each zone. These calculations are done for each fill cycle.
Reference to the uncorrected boil-off times of Figure 8. clearly illustrates the need for correc- tion of boil-off times. Reference to the G.E. material indicates that its apparent thermal conductivity improves in a step-wise manner after 2400 cycles. A physical explanation for such occurrence would be difficult to formulate if it were not for the recognition that the apparent improvement in thermal performance coincided with the replacement of the ADL (AA1602) and Last-A-Foam materials which were adjacent to the G.E. materials and which indicated poor thermal performance. ,
Even when the computational procedure described herein was implemented, the calculated boil-off times, though considerably improved, required some fairing to provide the trends illustrated in Figure 9. The analytical corrections and the fairing of the data for the various materials are illus- trated in Figure 50. When poor performance is indicated by adjacent foams, the experimental results are distorted quite significantly. The analytical correction procedure does improve the interpretation of the data. However, the very poor performance of the PBI and ADL (Upjohn) made correction difficult at the early test times, less than 1200 cycles. It is apparent also that the correction proce- dures could stand improvement. More instrumentation would be beneficial also in reducing the time interval used for computing average heat flow conditions.
It is important to note that when materials of relatively good thermal conductance are tested in adjacent locations there is relatively little interaction between the test zones. Large potential errors are introduced only when materials with poor thermal performance or rapid degradation characteristics are evaluated at locations adjacent to materials possessing good thermal behavior characteristics. Therefore, an alternative to a more refined analytical model is the evaluation of each material on its own test vessel.
68

Boil-Off Time versus Cycle Number
Material 1
Cell No. 1
o Test Data
- Corrected Data
Corrected and Faired Data
fftfFmfr \ I
—i 1 1 1 1 1 1 1 • 1 500 1000 1500 2000 2500 3000 3500 4000 4500 5000
Exposure Cycles
Boil-Off Time versus Cycle Number
Material 2
Cell No. 2
500 1000 1500 2000 2500 3000 Exposure Cycles
3500 4000 5000
Figure 50. Analytically Corrected Data
69

1.25
« 0.25
Boil-Off Tim« vtnu« Cyd« Numbtr
Material 3
Call No. 3
• Tait Data
- Corractad Data
— — Corractad and Fairad Data
500 1000 1500 2000 2500 3000 3500 4000 4500 5000 Exposure Cycles
1.25i
I 1.00
0.75
o no
0.50
£|0.25.
0.00
Boil-Off Time versus Cycle Number
Material 4
Cell No. 4
—«•— 500 1000 1500
f 2000 2500
Exposure Cycles
1 'i 'i 3000 3500
i- e . 4000 4500 5000
1.25
1.00
it O 0.75 1
« 0.50
<r 0.25
0.00
Boil-Off Time versus Cycle Number
Material 5
Cell No. 5
\
500 1000 1500 2000 2500 3000 Exposure Cycles
3500 4000 4500 5000
Figure 50. Analytically Corrected Data (Continued)
70
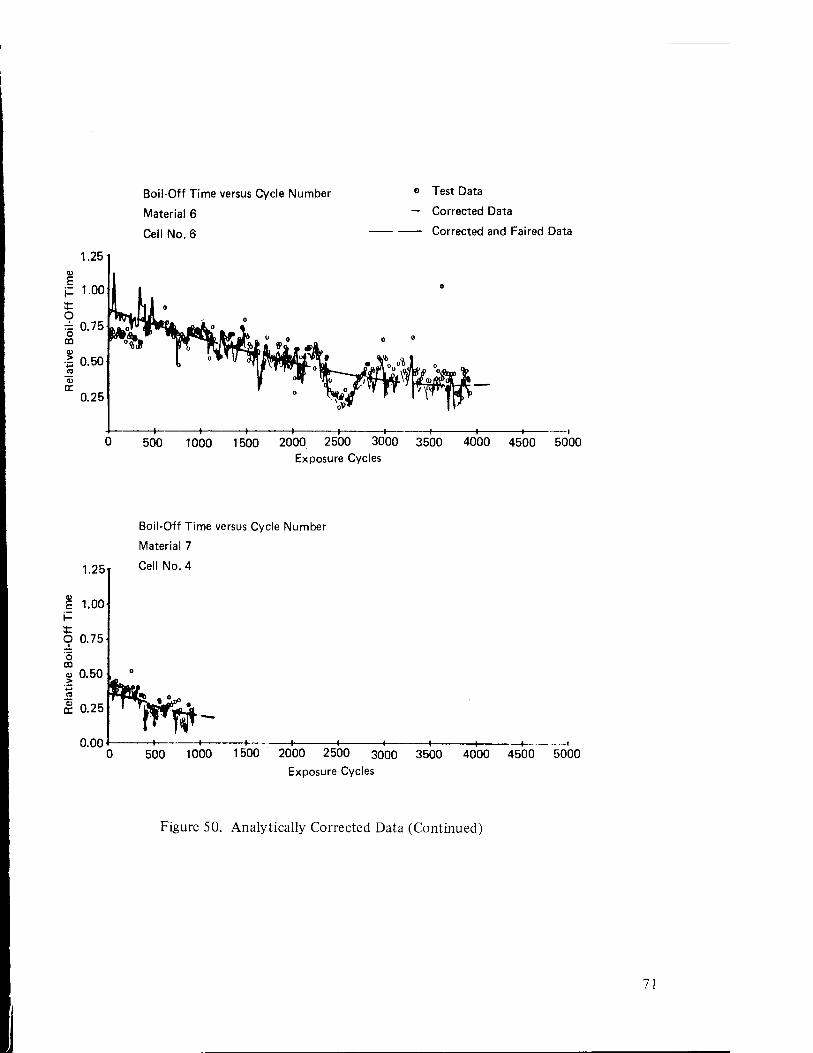
Boil-Off Time versus Cycle Number
Material 6
Cell No. 6
•> Test Data
— Corrected Data
— Corrected and Faired Data
1.25i
500 1000 1500 2000 2500 3000 3500 4000 4500 5000 Exposure Cycles
Boil-Off Time versus Cycle Number
Material 7
1 25 Cell No. 4
1.00
9 0.75
ö CO g 0.50 ,
ä 0.25
0.00 0 500 1000 1500 2000 2500 3000 3500 4000 4500 5000
Exposure Cycles
Figure 50. Analytically Corrected Data (Continued)
71

1.25
0) E \- 4-
O
o DQ
Boil-Off Time versus Cycle Number
Material 8
Cell No. 5
o Test Data
- Corrected Data
Corrected and Faired Data
500 1000 1500 2000 2500 3000 3500 4000 4500 5000 Exposure Cycles
Boil-Off Time versus Cycle Number
Material 9
Cell No. 4
mm- 500 1000 1500 2000 2500 3000 3500 4000 4500 5000
Exposure Cycles
Figure 50. Analytically Corrected Data (Continued)
72

1.25
Boil-Off Time versus Cycle Number
Material 10
Cell No. 5
• Test Data
— Corrected Data
Corrected and Faired Data
500 1000 1500 2000 2500 3000 3500 4000 4500 Exposure Cycles
Boil-Off Time versus Cycle Number
Material 11
1.25 Cell N 0. 2
ativ
e B
oil-
Off T
ime
P
o
-*
o
S
i
o
) . 'J°
0
Jo 0
cc 0.25
0.00 1— (— 1 1 1
500 1000 1500 2000 2500 3000 Exposure Cycles
3500 4000 4500
Figure 50. Analytically Corrected Data (Continued)
73

1.25i
Boil-Off Time versus Cycle Number
Material 12/13
Cell No. 4
o Test Data
— Corrected Data
Corrected and Faired Data
500 1000 1500 2000 2500 3000 3500 4000 4500 500C
Exposure Cycles
1.25T
Boil-Off Time versus Cycle Number
Material 14
Cell No. 5
(T 0.25
500 1000 1500 2000 2500 3000 3500 4000 4500 500| Exposure Cycles
Figure 50. Analytically Corrected Data (Continued)
74
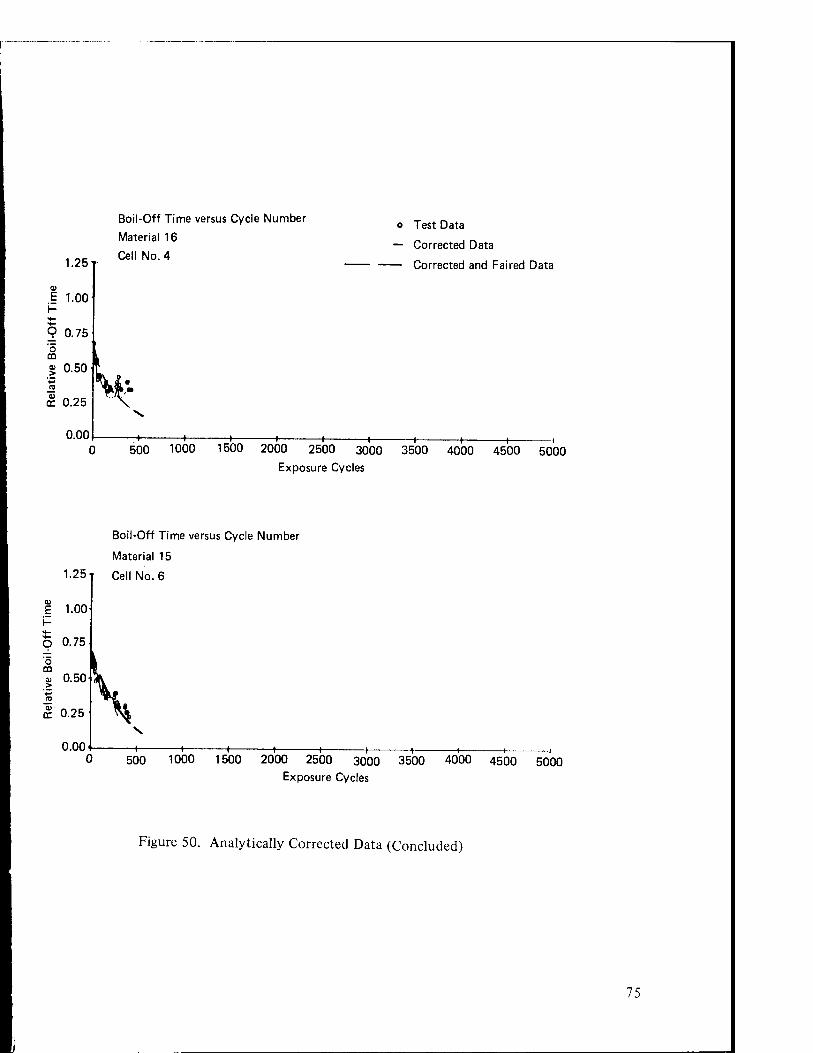
1.25 T
E 1.00
9 0.75 o .
g 0.50 T
1 X <r 0.25
0.00
Boil-Off Time versus Cycle Number
Material 16
Cell No. 4
o Test Data
— Corrected Data
— Corrected and Faired Data
^
500 1000 1500 2000 2500 3000 3500 4000 4500 5000
Exposure Cycles
1.25T
03 E 1.00
O 0.75
'5 m CD 0.50
£' 0.25
0.00
Boil-Off Time versus Cycle Number
Material 15
Cell No. 6
500 1000 1500 2000 2500 3000 Exposure Cycles
3500 4000 4500 5000
Figure 50. Analytically Corrected Data (Concluded)
75

1. Report No.
NASA CR-3404
2. Government Acceuion No.
4. Titlt and Subtitlt
DEVELOPMENT AND VALIDATION OF CRYOGENIC FOAM INSULATION FOR LH2 SUBSONIC TRANSPORTS
7. Author(s)
F. M. Anthony, J. Z. Colt, and R. G. Helenbrook
9. Performing Organization Nam« and Address
Bell Aerospace Textron P.O. Box One Buffalo, NY 14240
12. Sponsoring Agency Name and Address
National Aeronautics and Space Administration Washington, DC 20546
3. Recipient's Catalog No.
5. Report Date February 1981
6. Performing Organization Code
8. Performing Organization Report No.
8654-927001
10. Work Unit No.
11. Contract or Grant No.
NAS 1-10969
13. Type of Report and Period Covered
Contractor Report
14. Sponsoring Agency Code
15. Supplementary Notes
Langley Technical Monitor: Final Report
Robert D. Witcofski
Abstract
This experimental investigation evaluated the life of closed cell organic foams as cryogenic insulation for LH2 tanks under thermal conditions representing airline type operations. Emphasis was placed on commercially available foam materials but some modified materials and some foam/barrier film combinations were evaluated also. The original objective was to determine if any available materials could survive more than a few hundred mission thermal cycles. In addition to satisfying this goal it was possible to assess the progress of degradation and to identify failure modes. The polyurethane foam insulations ex- hibited the best cyclic life and excellent thermal performance. Two insulations of unreinforced polyurethane foam attained 4400 thermal cycles (equivalent to approximately 15 years of airline service) without serious thermal or structural degradation.
Fourteen foam insulation specimens were tested. Some were plain foam while others contained flame retardants, chopped fiberglass reinforcement and/or vapor barriers. The thermal performance of the insulation was determined by measuring the rate at which LH2 boiled from an aluminum tank insulated with the test material. The test specimens were approximately 50 mm (2 in ) thick. They were structurally scaled so that the test cycle would duplicate the maximum thermal stresses predicted for the thicker insulation of an aircraft liquid hydrogen fuel tank during a typical subsonic flight. The simulated flight cycle of approximately 10 minutes duration heated the other insulation surface to 316K (110 F) and cooled it to 226K (20 F) while the inner insulation surface remained at liquid hydrogen temperature of 20K (-423 F).
Two urethane foam insulations exceeded the initial life goal of 2400 simulated flight cycles and sustained 4400 cycles with only minor damage The addition of fiberglass reinforcement of flame retardant materials to an insulation degraded thermal per- formance and/or the life of the foam material. Installation of vapor barriers enhanced the structural integrity of the material but did not improve thermal performance.
In reviewing the results it should be remembered that all of the insulation tested were available materials, none had been developed specifically for LH2 service.
17. Key Words (Suggested by Author(s))
Cryogenic Insulation Liquid Hydrogen Plastic Foam Thermal Cycle Testing
18. Distribution Statement
Unclassified - Unlimited
Subject Category 31
19. Security Oassif. (of this report)
Unclassified
20. Security Classif. (of this page)
Unclassified
21. No. of Pages
79
22. Price
A05
For sale by the National Technical Information Service, Springfield. Virginia 22161
NASA-Langley, 198