Development and testing of a community flood resilience ...pure.iiasa.ac.at/13279/1/Development and...
39
1 Development and testing of a community flood resilience measurement tool Adriana Keating 1 , Karen Campbell 2 , Michael Szoenyi 3 , Colin McQuistan 4 , David Nash 3 , Meinrad Burer 5 1 International Institute for Applied Systems Analysis, Laxenburg, 2361, Austria 5 2 University of Pennsylvania, Wharton Center for Risk and Decision Processes, USA 3 Zurich Insurance Group, Zurich, 8002, Switzerland 4 Practical Action, Climate Change and Disaster Risk Reduction, United Kingdom 5 International Federation of Red Cross and Red Crescent Societies, Switzerland Correspondence to: Adriana Keating ([email protected]) 10 Nat. Hazards Earth Syst. Sci. Discuss., doi:10.5194/nhess-2016-188, 2016 Manuscript under review for journal Nat. Hazards Earth Syst. Sci. Published: 31 May 2016 c Author(s) 2016. CC-BY 3.0 License.
Transcript of Development and testing of a community flood resilience ...pure.iiasa.ac.at/13279/1/Development and...

1
Development and testing of a community flood resilience measurement tool Adriana Keating1, Karen Campbell2, Michael Szoenyi3, Colin McQuistan4, David Nash3, Meinrad Burer5
1International Institute for Applied Systems Analysis, Laxenburg, 2361, Austria 5 2University of Pennsylvania, Wharton Center for Risk and Decision Processes, USA 3Zurich Insurance Group, Zurich, 8002, Switzerland 4Practical Action, Climate Change and Disaster Risk Reduction, United Kingdom 5 International Federation of Red Cross and Red Crescent Societies, Switzerland
Correspondence to: Adriana Keating ([email protected]) 10
Nat. Hazards Earth Syst. Sci. Discuss., doi:10.5194/nhess-2016-188, 2016Manuscript under review for journal Nat. Hazards Earth Syst. Sci.Published: 31 May 2016c© Author(s) 2016. CC-BY 3.0 License.

2
Abstract. Given the increased attention on resilience-strengthening in international humanitarian and development work,
there is a growing need to invest in its measurement and the overall accountability of “resilience strengthening” initiatives.
We present a framework and tool for measuring community level resilience to flooding, built around the five capitals (5Cs)
of the Sustainable Livelihoods Framework. At the time of writing the tool is being tested in 75 communities across 10
countries. Currently 88 potential sources of resilience are measured at the baseline (initial state) and endline (final state) 5
approximately two years later. If a flood occurs in the community during the study period, resilience outcome measures are
recorded. By comparing pre-flood characteristics to post flood outcomes, we aim to empirically verify sources of resilience,
something which has never been done in this field. There is an urgent need for the continued development of theoretically
anchored, empirically verified and practically applicable disaster resilience measurement frameworks and tools so that the
field may: a) deepen understanding of the key components of ‘disaster resilience’ in order to better target resilience 10
enhancing initiatives, and b) enhance our ability to benchmark and measure disaster resilience over time, and compare how
resilience changes as a result of different capacities, actions and hazards.
Keywords: Disaster, flood, community, resilience, measurement, monitoring and evaluation.
15
Nat. Hazards Earth Syst. Sci. Discuss., doi:10.5194/nhess-2016-188, 2016Manuscript under review for journal Nat. Hazards Earth Syst. Sci.Published: 31 May 2016c© Author(s) 2016. CC-BY 3.0 License.

3
1 Introduction
The Hyogo Framework for Action, established 10 years ago, set out an ambitious framework for addressing disaster risk.
While the platform was successful in reducing disaster mortality globally, there has not been similar success in tackling the
underlying factors driving increasing exposure of people and assets to hazards (UNISDR, 2013; UNISDR, 2015). This is a
goal of the subsequent Sendai Framework (2015-2030), and arguably requires a collaboration and integration between the 5
disaster risk management field and wider investment and development planning, in particular within the international
development sector (Schipper and Pelling, 2006). At the same time, the cost-effectiveness of ex-ante risk reduction over ex-
post response is increasingly recognized (Mechler, 2015), and is increasingly relevant under conditions of funding scarcity
(Frankenberger et al., 2014). Disaster resilience has come to the fore as an integrating concept by assisting in identifying
novel ex-ante strategies for integrated approaches to disaster risk reduction and response, as well as sustainable development. 10
Disaster resilience definitions, frameworks and approaches are being developed and promoted prolifically (Frankenberger et
al., 2014; Winderl, 2014; Mitchell, 2013).
While resilience theories have informed wide-ranging disciplines for quite some time, an effort to identify operational
indicators has gained some traction only in the last decade (Carpenter et al., 2005). Given the increased attention on 15
enhancing disaster resilience, there has been growing investment in its measurement and the overall accountability of
“resilience strengthening” initiatives. As identified by National Academies of Sciences (NRC, 2012) and Levine (2014)
among many others, there is an urgent need for the continued development of theoretically anchored and practically
applicable disaster resilience measurement frameworks and tools so that the field may: a) deepen understanding of the key
components of ‘disaster resilience’, and b) enhance our ability to benchmark and measure disaster resilience over time, and 20
compare how resilience changes as a result of different capacities, actions, interventions, and hazard events.
Reviews and analyses of the state-of-the-art of disaster resilience measurement (Schipper and Langston, 2015; Winderl,
2014; Levine, 2014; Mitchell, 2013; Constas and Barrett, 2013) catalogue a plethora of offerings focused from the household
to the national scale, from single hazards to multiple hazards to general resilience, and designed for different purposes. We, 25
along with many others (Schipper and Langston, 2015; Levine, 2014), emphasize that there is no one-size-fits-all ‘resilience’
measure, and nor should there be. The development of various and varied resilience measurement frameworks should be
seen as a positive step towards understanding resilience and operationalizing the concept. At the same time, many scholars
and practitioners would like to know if there are any widely-applicable capacities which provide for disaster resilience, or
whether they are solely contextually and temporally specific. 30
Empirical evidence for the existence of such capacities is a critical gap in the field. Despite the proliferation of frameworks,
Winderl’s (2014) review concurs with many others that “no general measurement framework for disaster resilience has been
Nat. Hazards Earth Syst. Sci. Discuss., doi:10.5194/nhess-2016-188, 2016Manuscript under review for journal Nat. Hazards Earth Syst. Sci.Published: 31 May 2016c© Author(s) 2016. CC-BY 3.0 License.

4
empirically verified yet” (pg. 19). This highlights a key challenge for any resilience-building efforts: if resilience cannot be
empirically verified, how can we know we are measuring actual resilience? When most discuss “measuring resilience” they
are really aiming to measure resilient capacity before an event. Stakeholders need to know before a risk event occurs whether
they have effectively balanced risk and opportunity in building capacity to withstand and recover from the event. Related to
this is the fact that civil groups, authorities, and NGOs would like to know whether activities they have implemented with 5
the purpose of building resilience have achieved their goal. Winderl (2014) outlines the problem of circular reasoning when
it comes to measuring ex ante: if we determine a priori which characteristics make a system resilient, then design
interventions to enhance these, then measure again – we will necessarily find that resilience has been increased. However,
with no empirical evidence to justify the selection of those characteristics in the first instance, we have no real evidence that
resilience has actually been increased. As a latent property disaster resilience is only visible, or ‘revealed’ after a disaster has 10
occurred (Schipper and Langston, 2015; Frankenberger et al., 2014), yet measuring impacts or outcomes in isolation tells us
very little of what contributed to actual resilience. This is a critical distinction which is not always fully acknowledged in
disaster resilience definitions and measurement frameworks.
Yet this is precisely the distinction that is critical for empirically testing resilience measures. That is, to empirically test and 15
validate a measure of resilience, is is required that a) implementation of the measurement occurs across different contexts
and is monitored consistently over time; and b) understanding and capturing both pre-event characteristics (what we call
sources of resilience) and a set of pre-determined post-shock outcome measures, in order to learn which sources are most
effective for the realization of resilient outcomes. We know of no disaster resilience measurement frameworks or programs
which do this. It is this gap that the Zurich Alliance community flood resilience measurement framework and associated tool 20
presented below aims to fill in the context of community flood resilience.
The content of our measurement framework has been drawn from the existing literature (providing theory and evidence) and
Alliance members and peer group expertise. It is an indicator based approach consisting of 88 measures of potential sources
of resilience (listed in Appendix B) and 29 post flood outcome measures (also listed in Appendix B). At the time of writing 25
the tool is being tested by six NGOs, in approximately 75 communities across 10 country programs. The initial programme
will allow for preliminary empirical testing and feedback from implementers.
The paper proceeds as follows: first we review current thinking on measuring resilience and draw out pertinent challenges,
particularly relating to empirical validation. We then describe the measurement framework development process. Next we 30
present the content of the framework, and then describe the operationalized tool. In the conclusion we present our path
forward for undertaking much needed empirical analysis to understand community flood resilience. By documenting our
process, we hope others looking to measure resilience, or develop a resilience measurement framework of their own, can
learn from our experience.
Nat. Hazards Earth Syst. Sci. Discuss., doi:10.5194/nhess-2016-188, 2016Manuscript under review for journal Nat. Hazards Earth Syst. Sci.Published: 31 May 2016c© Author(s) 2016. CC-BY 3.0 License.

5
2 Review: The challenge of measuring resilience
Several national and international aid agencies have proposed versions of resilience indicators (Alinovi et al., 2009; USAID,
2013) and a number of regional disaster resilience indicators have also been developed (Cutter et al., 2010; Resilience
Capacity Index, n.d.). Twigg’s (2009) Characteristics of Disaster Resilience Community is designed for, and in cooperation
with, NGO and civil society organizations; it systematically and extensively explores many factors which may contribute to 5
disaster resilience. More recently the BRACED project has proposed a composite index to measure resilience based around
tracking adaptation, anticipation, absorption and transformation (Bahadur et al., 2015).
The last few years have seen a number of reviews of disaster resilience measurement frameworks (Schipper and Langston,
2015; Winderl, 2014; Ostadtaghizadeh et al, 2015; Oddsdóttir et al., 2013). Schipper and Langston (2015) review 17 sets of 10
indicators from the household to the national level. We do not aim to reproduce such a review here, but draw on these and
other critical analyses to highlight some of the challenges associated with measuring disaster resilience. There are many
substantial differences between national versus local level disaster resilience and associated measurement frameworks.
Because the framework presented here is at the community level, our review focuses on issues and challenges at this scale.
There are few examples of comprehensive community disaster resilience measurement frameworks available, only a handful 15
of which have been implemented in the field, and none that are empirically validated (Winderl, 2014); this is because
measuring resilience is not straight-forward for two main reasons: 1) it is a latent quality that is not revealed until tested; and
2) the characteristics that influence this latent quality are often a complex set of holistic characteristics.
Thus community disaster resilience measurement frameworks or indicators - including ours - share many common 20
theoretical and practical challenges. First, in doing this work, initial questions immediately confronted are 1) defining an
appropriate scale of analysis both geographically and temporally -- specifying boundaries such as ‘resilience of what to
what?’ (Carpenter et al., 2001), and 2) identifying the potential end-users (‘indicators for whom?’), and potential purposes
(‘indicators for what?’). This helps bring clarity into the complex process of measurement framework development (de
Sherbinin et al., 2013). Without these specifics it becomes increasingly difficult to distinguish disaster resilience 25
measurement frameworks from general development assessments. A key challenge, however, is balancing the need for
specific indicators (to a particular hazard in a particular place for a particular institution) and the need for wide applicability.
Other challenges include the fact that resilience to one hazard does not necessarily translate into resilience to another. In fact,
it is entirely possible that measuring and enhancing resilience to one hazard may inadvertently reduce resilience to another 30
(Schipper and Langston, 2015). Additionally, several authors (Béné et al.,2012; Frankenberger et al., 2014) have pointed out
that resilience at the community level is dependent upon changes at lower ‘levels’ i.e. individuals and groups within
Nat. Hazards Earth Syst. Sci. Discuss., doi:10.5194/nhess-2016-188, 2016Manuscript under review for journal Nat. Hazards Earth Syst. Sci.Published: 31 May 2016c© Author(s) 2016. CC-BY 3.0 License.

6
communities, as well as changes at higher municipality, national or even global levels, which are outside the scope of direct
NGO community programming initiatives. NGOs are often limited in their capacity to activate change at these scales.
As communities are dynamic complex systems, Levine (2014) argues that the modular approach to measuring resilience,
such as measuring a set of discrete characteristics, “assumes that improvements in any component of resilience score are of 5
equal importance” (pg. 8). As he suggests, this is deeply problematic when thresholds are present: an increased score in some
areas might not actually afford a benefit until it reaches a certain threshold, or unless it is combined with some other
characteristic or capacity. A further challenge is that resilience can change over time depending on changes both within and
outside the system (Holling, 2001). The extremely scale, place, and system specific nature of capacity profiles also creates
difficulties when attempting to generalize a set of key factors which enhance resilience (Tol and Yohe, 2007; Vincent, 2007). 10
Lastly, Béné et al. (2012) and Levine (2014) both put forward the critique that a resilience-focused perspective runs the risk
of diverting attention away from the most vulnerable or marginalized groups in a community, in favor of a more average
community-wide perspective. We must be cognizant of the fact that building the resilience of the majority does not
necessarily meet the development needs of the poorest. Resilience is not a pro-poor concept, in that it does not exclusively 15
apply to, or benefit, the poor. As such, resilience building does not replace poverty reduction (Béné et al., 2012) but can
rather be considered as one element in protecting current and future development gains.
3 Method: Development of the measurement framework
The Zurich Alliance community flood resilience measurement framework and associated tool presented here is focused
specifically on community level resilience to flooding, and was developed by an alliance of NGOs, academic institutions and 20
the private sector. Each member brought a unique perspective and experience on the theoretical and practical considerations
for designing and using a community flood resilience measurement tool.1 The framework has been pilot tested, reviewed and
revised, and now a beta version has been adapted into a web based platform and integrated mobile data collection
application, via which implementers collect data and assign grades for each of the indicators (pre-event ‘sources of
resilience’ and post-event impact assessment). 25
One of the early tasks of the Alliance was to identify the research gap(s) in community flood resilience. From this research
came our definition of disaster resilience as: The ability of a system, community or society to pursue its social, ecological
and economic development and growth objectives, while managing its disaster risk over time in a mutually reinforcing way. 1 The alliance members who designed and are managing the implementation of the tool are: the International Federation of Red Cross and Red Crescent Societies, (IFRC), the International Institute for Applied Systems Analysis (IIASA), the Wharton Business School’s Risk Management and Decision Processes Center (Wharton), the international development non-governmental organization Practical Action, and Zurich Insurance Group who are also funding the endeavor.
Nat. Hazards Earth Syst. Sci. Discuss., doi:10.5194/nhess-2016-188, 2016Manuscript under review for journal Nat. Hazards Earth Syst. Sci.Published: 31 May 2016c© Author(s) 2016. CC-BY 3.0 License.

7
Central to this conceptualization are the key community capitals - social, human, physical, financial and natural – which
holistically make up the socio-economic system (DFID, 1999; Keating et al., in press; Keating et al., 2014). This
conceptualization is centered on enhancing wellbeing as the goal of resilience, rather than disaster risk management, which
can be a means to resilience. This puts focus on the interplay between disaster risk management and development
trajectories, such that if one undermines the other then disaster resilience is not achieved. A key example of undesirable 5
interplay is that of erosive coping – where actions taken to respond and recover from floods erode long term wellbeing,
potentially even trapping people in a poverty cycle (Heltberg et al., 2012). Alternatively, actions which are designed to
enhance wellbeing, but lead to an unbalanced increase in disaster risk are also undesirable.
While acknowledging that national and global drivers play a significant part in flood resilience, our focus is at the 10
community level. This is the level at which flood impacts are felt most viscerally, where much action on flood resilience
needs to be taken, and are the focus of many flood and development activities. The NGO practitioners on the design team put
forward the definition of community used here. A “community” could be defined geographically (perhaps in rural contexts)
or by administrative boundaries (which may work in more urban situations). However, no single community will “feel” like
another and there are cultural aspects to consider, too. As a result we have concluded that when it comes to ground reality, a 15
community largely defines itself.
3.1 Foundations of the measurement framework
The measurement framework was conceived by integrating the underlying disaster resilience perspectives and frameworks of
the alliance members. Constas et al. (2014) identify resilience as a “multidimensional capacity” and while their suggested
dimensions differ slightly from the ones presented here, we are in full agreement that community flood resilience is about the 20
combination of capacities across different dimensions. Following the focus on overall wellbeing and development as the
overarching goal of disaster resilience in our definition, the Sustainable Livelihoods (SL) framework (DFID, 1999) was
drawn upon to capture community assets and capacities. The SL framework is an asset-based framework, representing the
core capacities (or asset base) that enables the overall community system to provide wellbeing, opportunity and risk
management. From a practical perspective, it has been widely used in community development as a conceptual device 25
(Knutsson and Ostwalk, 2006), and as such is well understood within the community development field. It is applicable for
developing and developed countries, at multiple scales, qualitatively and quantitatively.2
However, capital levels and combinations in and of themselves do not tell us explicitly how well a community may perform
in the face of the uncertain risks and opportunities. This led to the question of whether we could identify some general 30
properties or principles to look for in communities that are thought to enhance resilience over time and in various contexts.
2 These points were articulated by participants at our peer review of the framework held on 29 June -1 July 2015.
Nat. Hazards Earth Syst. Sci. Discuss., doi:10.5194/nhess-2016-188, 2016Manuscript under review for journal Nat. Hazards Earth Syst. Sci.Published: 31 May 2016c© Author(s) 2016. CC-BY 3.0 License.

8
This led to consideration of the four ‘resilience properties’ (4Rs) defined by MCEER (Bruneau, 2006; Cimellaro et al.,
2010): redundancy, resourcefulness, rapidity, and robustness (defined below).
The next step was to make this conceptual framework operational. For this we first drew on the practical and
programmatically-focused expertize of our NGOs and risk engineers within the measurement framework design team. For 5
example, the IFRC (2012) utilize the framework depicted in Figure 1, which is in line with the thinking presented above;
while high level, it places people and their agency at the literal center of thinking on disaster resilience.
[Figure 1 here]
10
Also fitting with this thinking is Practical Action’s (Pasteur, 2011) Vulnerability to Resilience (V2R) framework (Figure 2).
This is an analytical approach that can be used at community level to combine current and future risks with the capacities
and assets that the community have available to drive their development.
[Figure 2 here] 15
The NGOs assessments and data gathering processes used to inform their work within these frameworks, were emulated to
assess the sources of resilience (for example focus groups and household surveys). Secondly, our measurement approach is,
uniquely, informed by risk engineering expertise, in this case from Zurich Insurance. Risk engineering is a technical
assessment approach to identify, assess and improve risk to specific perils. Risk Engineering often works with Technical 20
Risk Grading Standards (TRGS), technical documents which offer a standardized view of risk and highlight priority actions
that could be taken to reduce risks. TRGSs are tailored to different perils, taking account of the different factors that make up
risk associated with that peril. Each TRGS includes risk factors (indicators) and defines the evidence needed to earn that
factor a grade of A, B, C, or D. Grades are assigned as follows:
25
• A: Best practice for managing the risk
• B: Good industry standard, no immediate need for improvement
• C: Deficiencies, room for visible improvement
• D: Significantly below good standard, potential for imminent loss
30
Engineers compare data, often gathered from location-specific site visits, with the definitions in the TRGS to make a
judgment on risk quality and conduct conversations with the site or company about how to manage the risks they are facing.
Clearly, a community is profoundly different from a firm. Similarly, risk is not the same as (or the inverse of) resilience. The
insight drawn from the risk engineering approach for the community flood resilience measurement framework was regarding
Nat. Hazards Earth Syst. Sci. Discuss., doi:10.5194/nhess-2016-188, 2016Manuscript under review for journal Nat. Hazards Earth Syst. Sci.Published: 31 May 2016c© Author(s) 2016. CC-BY 3.0 License.
9
the utility and benefits of having a trained assessor make a qualified judgment to assign a grade of A to D for each of the
different factors. We discuss the benefits of this approach below.
3.2 Measurement framework content development
The SL 5C framework provides a holistic perspective of wellbeing, as well as community assets and capacities. The IFRC’s
(2012) and Pasteur’s (2011) frameworks provide a highly generalized approach to features for improving disaster resilience, 5
while the 4Rs inform the quality of the community characteristics (which became known as sources of resilience). However,
as we review above, much work has been done to establish specific measures of disaster resilience. Our measurement
framework drew on the insights from this body of work via a comprehensive review of what sources of resilience have been
qualitatively shown or are widely considered to be important for community level resilience to flooding. The articles and
reports which finally contributed most substantially to the content of the measurement framework are (in alphabetical order): 10
Bahadur et al. (2015), Cutter et al. (2010), DFID (2009), DFID (2011), IFRC (2011), IFRC (2014), MCEER (2007), NRC
(2012), OECD (20114), Oxfam GB (2013), Pasteur (2011) and Twigg (2009). A further 46 documents were reviewed and
informed the content of the framework; these are listed in Appendix A. It should be noted that the development, testing and
reviewing process that the framework has gone through has seen it evolve substantially, and it would no longer be possible
to assign citations to specific sources of resilience. 15
The first version of the measurement framework – Version 1 – was piloted in 24 communities in Mexico, Nepal and Peru.
This pilot testing was undertaken by the design team in collaboration with NGO staff familiar with the communities being
assessed. The framework was then revised in response to the lessons learned from this testing. One of the first lessons
learned was that effective use of such a framework requires that all sources be discrete concepts, since multiple parts within 20
each source often resulted in an average, and hence meaningless, grade. Furthermore, some sources were assigned an
interdependency condition, i.e., they cannot be graded above a certain threshold unless a certain grade is attained or
exceeded on another, interdependent, source (interdependency is a point highlighted by Levine (2014)).
Version 1 of the measurement tool was dominated by disaster preparedness and response capacities, as opposed to risk 25
reduction and more systemic development considerations. We consider that this was due to a number of factors, including
because they a) continue to dominate the disasters field; b) are front and center of other disaster resilience measurement
frameworks; and c) are relatively easy to measure. By reflecting on our definition of disaster resilience, we saw the need to
balance preparedness and response with other important elements of disaster resilience. Many of the sources now are
concerned with the capacity of households and the community to consider disaster risk in their broader planning, and to take 30
action to reduce risk rather than just prepare for it.
Nat. Hazards Earth Syst. Sci. Discuss., doi:10.5194/nhess-2016-188, 2016Manuscript under review for journal Nat. Hazards Earth Syst. Sci.Published: 31 May 2016c© Author(s) 2016. CC-BY 3.0 License.

10
Version 2 of the measurement framework was developed by the design team in response to lessons learned from the pilot
testing. This version saw each source also assigned a number of qualities or categorizations in addition to the 5C-4Rs, these
are presented below. A peer review workshop was then convened with 10 preeminent disaster resilience and measurement
experts. The workshop led to a number of changes to Version 3 of the framework, and also crystalized a number of issues
regarding usage and feeding back information to communities. The importance of power dynamics in social capital sources 5
was emphasized, expanding the social capital section to include what might be termed ‘institutional’ or ‘political’ capital.
The review also underlined the challenge of providing suitable flexibility in how the tool could be applied to enable it to be
appropriate to context, while still maintaining enough standardization to generate comparable data. The testing version of the
tool is such that each source is graded to produce standardized data (A-D grading), yet is sufficiently general to apply across
contexts; implementers are able to choose one or more data sources as they see fit, from at least two and up to five options, 10
each with associated indicators for each source.
4 The community flood resilience measurement framework
This measurement framework applies specifically to community level resilience to flooding, and is designed to a) help guide
NGO community development and flood-based programs, and b) to provide a platform for empirical analysis of resilience.
As Frankenberger and Nelson (2013) point out, an approach to resilience measurement which measures ex-ante but does not 15
test whether what was measured was relevant once the event occurred, cannot make any claims about having measured
resilience. By tracking the sources of resilience both pre- and post-event, together with outcomes in the event of a flood, we
can observe how development, disasters, and DRM activities occurring in the community are eroding or supporting
wellbeing. Over time and studies in different contexts, this testing can build an evidence-base for what actually makes the
difference for community level resilience to flooding. 20
The 88 sources of resilience have been developed with the underlying frameworks of the 5Cs and the 4Rs. These were then
cross checked by categorizing them within three other operational frameworks commonly used by NGOs. These not only
provide a cross check that we are measuring a holistic set of sources but also that the suite of categorizations attached to each
source provide for analytical depth by allowing for multiple perspectives on the results. These also increase the ability to 25
communicate results to many different stakeholder audiences in the contexts within which they are working. We provide
examples of each of these categorizations below.
4.1 How sources are organized within the tool
The 88 sources of resilience are each categorized by the 5Cs, by the 4Rs, by 10 themes, by the two perspectives of the
system level (community and enabling environment), and by the 5 phases of the DRM cycle (Appendix B lists sources with 30
associated categorizations).
Nat. Hazards Earth Syst. Sci. Discuss., doi:10.5194/nhess-2016-188, 2016Manuscript under review for journal Nat. Hazards Earth Syst. Sci.Published: 31 May 2016c© Author(s) 2016. CC-BY 3.0 License.

11
4.1.1 Five Capitals (5C’s)
The most prominent categorization of the sources of resilience is along the five capitals (5Cs) of the SL Framework. This
framing was an inherent part of the measurement framework from inception, and strongly emphasizes the multidimensional
nature of resilience. For example, it is not enough to have a school facility which is robust and accessible in times of
flooding (physical capital), a community also needs a strategy to maintain or quickly resume schooling in the event of a 5
flood (social capital), and an intrinsic value placed on education by parents (human capital). We follow Nelson et al.’s
(2007) definition of the five capitals and provide an example source within each capital group:
Human capital is the education, skills, and health of household members.
• Flood protective behavior and knowledge: assesses people's knowledge/skills about how to behave during a flood 10
event, in order to prevent death and injury.
Social capital is the reciprocal claims on others by virtue of social relationships and networks, the close social bonds that aid
cooperative action and the social bridging, and linking via which ideas and resources are accessed.
• Community representative bodies/structures for flood management coordination: assess the degree of formal 15
organization of the community as a whole around flood risk management.
Natural capital is the natural resource base e.g. productivity of land, and actions to sustain productivity, as well as the water
and biological resources from which livelihoods are derived.
• Basin health: assesses how changes in natural habitats are exacerbating or reducing the flood risk in the target 20
community.
Physical capital is capital items produced by economic activity from other types of capital that can include infrastructure,
equipment, and improvements in genetic resources e.g. crops, livestock;
• Access to healthcare facilities: assesses the adequacy of the infrastructure to support community health and how it 25
stands up in flood situations.
Financial capital is the level, variability, and diversity of income sources, and access to other financial resources (credit,
savings, cattle) that together contribute to wealth (Nelson et al., 2007).
• Household financial savings that protect long term assets: assesses the availability of liquid assets to cover expected 30
flood losses.
Nat. Hazards Earth Syst. Sci. Discuss., doi:10.5194/nhess-2016-188, 2016Manuscript under review for journal Nat. Hazards Earth Syst. Sci.Published: 31 May 2016c© Author(s) 2016. CC-BY 3.0 License.

12
4.1.2 Four properties of a resilient system (4R’s)
The 4R properties help to evaluate where there may be weaknesses to one or more of these four areas and thus where the
communities’ systems may be vulnerable should a disaster event occur. We hypothesize that the 4R properties may be able
to shed light on why some communities fare better than others in the same disaster, despite identical capital endowments. An
examination of the financial capital profiles of the two communities might reveal that Community A has a diversified 5
income base whereas Community B is dependent on a single industry. This redundancy has been demonstrated to be a
source of quicker recovery after a disaster. The 4Rs are defined below (Bruneau, 2006; Cimellaro et al., 2010), each with an
example source:
Redundancy is the extent to which alternative elements, systems or other measures exist, that are substitutable, i.e. capable of 10
satisfying functional requirements in the event of disruption, degradation or loss of functionality.
• Household credit access (financial capital): assesses the availability of credit (both formal and informal) for
members of the community during and directly following a flood.
Resourcefulness is the capacity to identify problems, establish priorities and mobilize alternative external resources when 15
conditions exist that threaten to disrupt some element, system or other measure. Resourcefulness can be further
conceptualized as consisting of the ability to apply material (i.e. monetary, physical, technological and informational) and
human resources in the process of recovery to meet established priorities and achieve goals.
• Educational attainment (human capital): assesses the level of education attained by individuals and households in
the community. 20
Rapidity is the capacity to meet priorities and achieve goals in a timely manner in order to contain losses, recover
functionality and avoid future disruption. Rapidity takes account of learning and recovering in a more resilient way, which
may involve a transformation. While it is mostly an ex post property of resilience, investments made ex-ante can create
rapidity ex-post. 25
• Strategy to maintain or quickly resume provision of local food supplies in the event of a flood (social capital):
assesses the existence or not of a plan (including standardized operating procedures) to maintain or quickly resume
flood supply systems in the event of a flood, and evaluates to what degree it is up to date, and whether it is certified
against national standards.
30
Robustness is strength, or the ability of elements, systems and other measures of analysis to withstand a given level of stress
or demand, without suffering degradation or loss of function.
Nat. Hazards Earth Syst. Sci. Discuss., doi:10.5194/nhess-2016-188, 2016Manuscript under review for journal Nat. Hazards Earth Syst. Sci.Published: 31 May 2016c© Author(s) 2016. CC-BY 3.0 License.

13
• Communal Flood Protection (physical capital): assesses the adequacy of large scale flood protection measures
which protect the whole community from flood.
4.1.3 Themes
The realities of community development work called for more tangible categorizations. As such, we have also taken a
sectoral view where critical aspects of community life are explored in a way meaningful for NGO practitioners. The themes 5
cut across the 5Cs and in many ways link them up. The themes are:
• Life and Health
• Education
• Assets and Livelihoods 10
• Food
• Transport and Communication
• Water
• Waste
• Energy 15
• Governance
• Natural environment
The themes also helped define the outcome indicators, discussed below.
4.1.4 System level 20
Our measurement framework is concerned specifically with actions at the community level, however what happens at the
community level is dependent upon systems at both lower and higher levels (Keating et al. in press; Constas et al., 2014). At
the same time, there exist practical constraints on data collection. In response to this tension, we have focused the tool on the
community level, while including a number of ‘enabling environment’ sources of resilience which were considered critical
for the analysis. Social inclusiveness, from the social capital group, is an example of a community level source; social safety 25
nets (legislative, national schemes) are an example of a source from the financial capital group at the enabling environment
level. Enabling environment sources are understood to be outside the direct sphere of influence of the community, although
may be the target of higher level advocacy.
Nat. Hazards Earth Syst. Sci. Discuss., doi:10.5194/nhess-2016-188, 2016Manuscript under review for journal Nat. Hazards Earth Syst. Sci.Published: 31 May 2016c© Author(s) 2016. CC-BY 3.0 License.

14
4.1.5 DRM cycle
The Disaster Risk Management (DRM) cycle is a well-known concept in the disasters field. Following the UNISDR (2009),
DRM is the “systematic process of using administrative directives, organizations, and operational skills and capacities to
implement strategies, policies and improved coping capacities in order to lessen the adverse impacts of hazards and the
possibility of disaster. Disaster risk management aims to avoid, lessen or transfer the adverse effects of hazards through 5
activities and measures for prevention, mitigation and preparedness.” While we conceptualize disaster resilience to go
beyond traditional DRM, the fields are clearly interconnected.
Categorizing each source of resilience by which stage of the DRM cycle it aligns most closely to is also critical for exploring
whether action to manage disaster risk is focused unevenly at some point of the DRM cycle. A common issue facing DRM 10
and disaster resilience more broadly is a focus on ex-post crisis response, and a neglect of ex-ante risk reduction (Kellet and
Caravani, 2013). The reasons for this are many and complex, the purpose here is to shine a light on strengths and weaknesses
at the community level. Within the framework we define four stages of the DRM cycle, and provide an example source for
each:
15
Prospective risk reduction: Activities that address and seek to avoid the development of new or increased disaster risks.
• Flood exposure perception (human capital): assesses the accuracy of community perception/expectation of flood
inundation areas.
Corrective risk reduction: Activities that address and seek to correct or reduce disaster risks which are already present. 20
• Sustainable use of natural resources (natural capital): assesses whether livelihood activities impact on natural capital
are managed to minimize their negative impact on these habitats.
Crisis preparedness: action carried out before an event to build capacities needed to effectively manage the flood emergency
situation and achieve orderly transitions from response to recovery and reconstruction. 25
• Measurement and forecasting (physical capital): assesses the quality of locally accessible flood forecasting network.
Coping: the ability of a community to utilize available skills and resources to manage the adverse conditions brought on by
the flood.
• Business credit access (financial capital): assesses the availability of credit (both formal and semi-formal, and can 30
include vendor credit) for members of the community during and directly following a flood.
Nat. Hazards Earth Syst. Sci. Discuss., doi:10.5194/nhess-2016-188, 2016Manuscript under review for journal Nat. Hazards Earth Syst. Sci.Published: 31 May 2016c© Author(s) 2016. CC-BY 3.0 License.

15
The cyclical nature of the DRM cycle is a critical feature; the stages of the cycle naturally blend into one another. In
particular, the coping and recovery phase following a disaster provides an opportunity for prospective risk reduction in the
next cycle. These designations will likely be refined as the analysis proceeds.
4.2 Post-flood outcome measurement
Within this framework outcomes refer to the way in which a flood has impacted a community’s wellbeing and development 5
potential. We have identified 29 outcome measures to be collected following flood events which may occur in program
communities during the testing period. These consist of 19 flood impact measures, seven during-flood ‘action’ measures, and
three flood severity control measures. This information is required to empirically explore the effectiveness of the sources.
Outcomes were built around the 10 themes because this is where they most logically aligned, with at least one outcome
variable for each theme. We provide an example of each type of outcome measure: 10
Control variables which record the severity and extent of the flooding. These are required so that impacts can be analyzed
with control for how severe the flood was.
• Flood frequency: assesses the return period of the flood event.
15
Impact variables, which record the level of loss or damage of the flood and the time to recover on the different dimensions of
community wellbeing.
• Prevalence of post-flood illness: assesses the frequency of water and vector born disease in the post-flood period, as
compared to normal times.
20
Action variables which record what actions the community took during and following the flood, which may impact
wellbeing.
• Selling assets: assesses to what extent both productive and non-productive assets were sold in order to cope with
flood impacts.
25
Our approach aims to collect outcome measurement data within eight weeks of the event. Collecting in the first weeks
following an event was considered to be disruptive to relief efforts, yet waiting much longer than this runs the risk of lack of
priority and missing critical aspects of a resilient outcome (e.g., recovery time).
4.3 Data sources and collection
Assessors are provided with multiple options for gathering the data required to grade each source and outcome. These 30
options are: household survey questions, community consultations, key informant or interest group interviews, and third
party sources. Many sources can be collected via any of the available methods. If a data collection method is available for a
Nat. Hazards Earth Syst. Sci. Discuss., doi:10.5194/nhess-2016-188, 2016Manuscript under review for journal Nat. Hazards Earth Syst. Sci.Published: 31 May 2016c© Author(s) 2016. CC-BY 3.0 License.

16
source, the tool provides pre-defined questions such as a household survey question, or a question to ask an expert in an
interview. In the set-up phase, assessors select one or several of the data collection methods they intend to use for each
source. They make this selection depending on the local context and appropriateness, the resources available to them to
gather the data, availability of existing information, and internal NGO objectives.
4.4 Grading and weighting 5
Once all data has been collected, the 88 sources of resilience are individually graded from A-D. Grading is done by a trained
assessor drawing on their experience, training, a user manual and other associated guidance documents. The benefit of using
an A-D grading approach, rather than collecting and trying to ‘objectively’ asses raw data, is that it allows for semi-
quantitative assessment of qualitative properties. It also allows for multiple information sources to be considered, and local
understanding and context to be incorporated. Finally, it allows assessors to use their expert judgement rather than forcing 10
them to creatively generate data which is unavailable. The grading stage is finalized using a peer-review approach where a
colleague assessor sufficiently familiar with the local community context will jointly discuss the grades with the main
assessor. Grades will then be finalized and ‘frozen’, i.e. they cannot be further changed, before the results are displayed. This
is to avoid ‘engineering’ certain aspects into desired results by changing grades retrospectively.
15
A fully specified source of resilience, named ‘Access to school facilities’ from the physical capital group, is set out in
Appendix C.
The output is the list of 88 grades, plus a series of average grades along the 5Cs, 4Rs, themes, system level, and DRM cycle
breakdowns. Each group of sources is weighted equally, i.e. for the capital categorization, 20% of the final grade goes to 20
each capital group. Within each group sources are also weighted equally. It has been structured this way because some
groups have more sources than others. There is currently no empirical evidence to support a larger weight for any sources
over others, although part of this study is to explore this question. Depending on the results of the analysis of all resilience
measurement data being collected through the testing process, different weights or weighting approaches may be
incorporated in the future. 25
In the event of a flood, a similar process is undertaken to collect the data for the 29 outcome indicators. Again the data can
be collected using any of the five data collection methods (household survey, etc.). However in this case assigning an A-D
grade is too premature. For example there is no way to tell how many deaths are acceptable to warrant an A versus C grade.
Instead the raw data will be collected and the assessor will be asked on a scale of A-D what is his or her professional 30
perception of the level of resilience, where A is perceived to be an excellent or resilient outcome, and D is a bad or not
resilient outcome. Over time these perceptions matched with the raw data may allow for deeper insight into what actual flood
resilience looks like for communities.
Nat. Hazards Earth Syst. Sci. Discuss., doi:10.5194/nhess-2016-188, 2016Manuscript under review for journal Nat. Hazards Earth Syst. Sci.Published: 31 May 2016c© Author(s) 2016. CC-BY 3.0 License.

17
4.5 What the measurement framework does well and what it doesn’t do
Frankenberger et al. (2014) argue that “[a]lthough ample lip service is often given to conducting comprehensive analysis,
many NGOs rely heavily on participatory rural appraisal methods. Such reliance on qualitative data means they miss out on
capturing important contextual information that is often available through secondary sources.” They further point out that
NGOs tend to focus data collection on areas most directly related to their theory of change. One key benefit of our 5
framework and tool is that it encourages NGOs to look beyond the aspects they have traditionally focused on, and to search
out a broader variety of information sources.
Frankenberger et al. (2014) also note that NGO programming is often constrained by the rigidity of donor requirements.
There exists a strong preference for ‘visible’ programming such as flood protection infrastructure, or humanitarian food 10
distribution; less visible, or socially focused programming is less desirable because it is more difficult to quantify. At the
same time, disaster resilience programming is challenging because building disaster resilience requires an integrated
approach which crosses many traditional sectoral or thematic boundaries such as education, market access, environmental
stewardship etc. We propose that one of the key benefits of a measurement framework such as this one is that once validated
it may assist NGOs to analyze and then show how different aspects of their community development work collectively 15
contribute to building flood resilience. It may also allow for long-term incremental change to be shown within a short
funding cycle time frame.
By making a distinction between community level and enabling environment sources of resilience, using the measurement
tool has the potential to crystalize the focus of advocacy work. Sources of resilience designated community level are 20
possibly more effectively targeted by community-level action. Enabling environment designated sources on the other hand,
may be the target of higher level stakeholder engagement, or advocacy towards authorities.
As Levine (2014) argues, thresholds pose a significant problem to resilience measurement frameworks such as this one. For
many sources of resilience, it may be that they are not at all useful until they have reached a certain level, which corrupts the 25
grading approach. Our approach to this valid critique is to emphasize that we are not purporting to be presenting the
definitive community flood resilience measure; rather, we are collecting information which will enable us to empirically
analyze community flood resilience. An exploration of whether thresholds exist in sources of resilience, when it comes to
whether they impact outcomes, will be a key focus of that analysis.
30
Many scholars (Levine, 2014; Mitchell, 2013; Béné, 2012) have highlighted the at-times uneasy relationship between
resilience and vulnerability. Measuring resilience should in no way replace a vulnerability analysis. Our framework is
designed to work alongside rather than replace vulnerability and capacity assessments, or any other analysis and engagement
Nat. Hazards Earth Syst. Sci. Discuss., doi:10.5194/nhess-2016-188, 2016Manuscript under review for journal Nat. Hazards Earth Syst. Sci.Published: 31 May 2016c© Author(s) 2016. CC-BY 3.0 License.

18
processes. Indeed, we encourage the use of existing data gathering processes to collect data for measuring the sources and
outcomes.
5 From framework to tool
To test the framework at scale and collect the data required for undertaking empirical analysis of community flood
resilience, this framework was implemented into a community flood resilience measurement tool --- an integrated, hybrid 5
web-based and mobile device system for creating questionnaires based on the flexible combination of data collection
methods for each source, assigning data collection work, collecting data, undertaking grading, generating outputs, and
storing data on a (protected) central database. The 6 NGOs implementing the tool have been trained in understanding the
framework and using the tool. Over two years they will collect baseline, endline and outcome measures (if a flood occurs) in
75 communities in 10 countries. A train-the-trainer workshop was conducted with approximately 20 NGO staff from 9-13 10
November 2015. During this week the staff were trained to a) implement the tool, and b) train their colleagues to implement
the tool.
Implementing the tool includes being confident in ones understanding of the rationale behind the tool, being able to
consistently grade sources, interpret outputs, and use the internet and mobile applications. It also critically requires a sound 15
understanding of how the tool outputs should, and should not, be utilized. The measurement tool does not replace existing
processes, but fosters an open dialogue around findings. It is designed to help identify potential areas for intervention,
however choosing an intervention is a much more complex process which must consider multiple factors and perspectives.
As with all information, the implementing NGO is obliged to feed information back to the community in an accessible and 20
responsible manner. While the final decision rests with the NGO, we strongly advise against feeding back information on
quantitative scoring because of the specialist training required to accurately interpret grades. Grades on their own are largely
meaningless, what is important for analysis and communities is how different sources interact and how resilience is changing
over time in that community. Pilot testing to date has shown that the information gleaned from the measurement process,
presented in a qualitative way, can provide a very useful starting point for discussions with communities about flood 25
resilience.
Internal communication must also be carefully considered. There is the risk that the generation of a grade may result in
competition between project managers or field workers. It is up to the core assessment team to contextualize the
measurement process and resulting grades within the wider context of their community development work to ensure that the 30
grades are understood. There may be a temptation to gravitate towards interventions which one believes will increase the
resilience grade with the least amount of resources or effort. While one of the benefits of the tool is that it might identify
Nat. Hazards Earth Syst. Sci. Discuss., doi:10.5194/nhess-2016-188, 2016Manuscript under review for journal Nat. Hazards Earth Syst. Sci.Published: 31 May 2016c© Author(s) 2016. CC-BY 3.0 License.

19
relatively cost-effective “quick wins”, it should never be the case that the objective of the intervention becomes to increase
the resilience grade per se.
For the purpose of the empirical research, all data which goes into the tool system is effectively anonymized. All respondents
provide informed consent before information is collected, and no individual can be identified from the data (either in its raw 5
form or aggregated).
6 Conclusion and way forward
Schipper and Langston’s (2015) review and expert consultation report argues that measurement frameworks are “based on
assumptions about how systems work, albeit informed assumptions” (pg. 19). Measurement frameworks make assumptions
about the way in which the presence or absence of each indicator (often measured ex-ante) will impact resilience ex-post. If 10
this project is to achieve its aim of empirically exploring the critical sources of resilience, we need to do more than just
measure sources in a number of communities; we need to test those measures against outcomes. This is why we are
collecting post-flood outcome data, so that the original sources can be compared to outcomes in order to understand what
really made a difference in the flood event and recovery (i.e., actual resilience).
15
The implementation of the measurement tool described above will generate an unprecedented database of community level
information and experience with flooding, collected in a consistent way. Data will be augmented by information from
implementing NGOs regarding the community context, major events or changes in the community during the study period,
and interventions implemented. Analysis of this data will lead to insights about community flood resilience generally: what
are typical community profiles, patterns in strengths and weaknesses across the different categorizations, correlations 20
between different capacities, and effectiveness of different intervention types.
Our analysis of the validity of the sources of resilience within the framework – our hypothesis from research to-date – will
take a multi-pronged approach. Firstly, we will explore the empirical relationship between the sources (recorded in the
baseline) and outcomes (recorded in the post-flood outcome measurement). A suite of quantitative data analysis methods 25
will be used to undertake this endeavor. Furthermore, each time a source is graded (75 communities at baseline and endline),
assessors are asked two question about the source:
1. Were you confident grading this source? (Y/N)
2. Is this source relevant to assess resilience to flooding? (Y/N) 30
Nat. Hazards Earth Syst. Sci. Discuss., doi:10.5194/nhess-2016-188, 2016Manuscript under review for journal Nat. Hazards Earth Syst. Sci.Published: 31 May 2016c© Author(s) 2016. CC-BY 3.0 License.

20
In this way we are collecting quantitative information on the perspective of the practitioners working with flood prone
communities on each of the 88 sources of resilience. This quantitative information is then complemented by anonymous
structured feedback, and anonymous in-depth semi-structured interviews and focus group discussions with implementers
throughout the process. This feedback process will also explore how the process and results of the measurement tool are
informing decision-making on interventions. 5
Preliminary implementer feedback at the time of writing has indicated that the process of training staff to use the tool, and
implementing the tool, is already producing positive outcomes. In particular, implementing NGOs have reported that the
holistic view of the community system is building local staff capacity to think systemically about their work. For example, in
addition to the traditional physical infrastructure, the human and social elements required to make an early warning system 10
operational are being considered early. The data collection effort holds many co-benefits for supporting other NGO work
beyond a flood focus. The data collection technology is considered superior in its accuracy and efficiency to traditional
paper-based approaches.
Via this process we hope to be able to generate evidence for which of the sources of resilience, if any, make a difference 15
across diverse contexts. It is possible that community flood resilience is entirely contextually specific, or boils down to a few
core sources of resilience meeting a certain threshold; this is what we will explore. The extensive testing phase is also
providing a platform for the formation of a peer group of practitioners working on community flood resilience and using the
measurement tool. The insights this peer group generates together provide a critical feedback to resilience measurement and
practice, as well as builds practitioner capacity. 20
Winderl (2014) concludes his comprehensive review of measurement frameworks with a set of recommendations or lessons,
presumably for the development of future frameworks or iterations of existing ones. These recommendations are
theoretically sound, but would be impractical to implement within one framework. When working in such an applied field,
and relying on collaboration from communities, NGOs and other non-research institutions, there is little space for idealism in 25
research design. Our endeavor to date has highlighted that capacity and willingness to implement complex theoretical
frameworks are very limited at the grassroots NGO level. There is a need to appreciate that staff resources and budgets are
very limited, and implementing idealistic frameworks in a time consuming manner will distract from any interactions and
bringing tangible benefits to the communities. We are also keenly aware that communities are not there as research test beds
to study whether resilience can be observed; rather, testing frameworks need to bring a benefit to the communities working 30
with NGOs and researchers.
The measurement framework presented here is by no means perfect; the design team sacrificed a number of ‘nice-to-haves’
in order to design a framework and tool which is both functional and analytically useful. We found that designing the
Nat. Hazards Earth Syst. Sci. Discuss., doi:10.5194/nhess-2016-188, 2016Manuscript under review for journal Nat. Hazards Earth Syst. Sci.Published: 31 May 2016c© Author(s) 2016. CC-BY 3.0 License.

21
framework and tool in an alliance between practitioners, academics, and risk engineers has contributed to optimizing it
within practical constraints. Our long term vision is to develop a replicable and scalable approach to measuring community
flood resilience. The approach described here could also be adjusted to apply to different perils and different levels of social
organization. By utilizing a consistent framework, information on resilience is comparable and insights can more readily be
identified. 5
Appendix A
In addition to the documents cited in the article, the working group also reviewed and drew insight from the following
sources:
Aerts, J. C. J. H., Botzen, W. J. W., Emanuel, K., Lin, N., de Moel, H., and Michel-Kerjan, E. O. (2014) ‘Evaluating flood 10
resilience strategies for coastal megacities, Science, 344, 473–475, doi:10.1126/science.1248222.
Adger, W., Huges, T., Folke, C., Carpenter, S. & Rockstöm, J. (2005) ‘Social-Ecological Resilience to Coastal Disasters’,
Science 309(5737): 1036-1039.
15
Ainuddin, S. and Routray, J. K. (2012) Earthquake hazards and community resilience in Baluchistan. Natural Hazards
63(2):909-937
American Red Cross (2013) Community resilience Assessment Tool. Household and committee surveys for measuring
overall community resilience and for tracking changes following Red Cross integrated interventions (''Ritaline''). 20
Australian Bureau of Statistics (2004) Measuring Social Capital. An Australian Framework and Indicators. Information
paper. 1378.0.
Australian Red Cross (2013) Relationships matter: the application of social capital to disaster resilience. National Disaster 25
Resilience Roundtable report. Melbourne. Australia.
Briguglio, L., Cordina, G., Farrugia, N. & Vella, S. (2005) Economic vulnerability and resilience concepts and
measurements, Research Paper / UNU-WIDER, No. 2008.55, ISBN 978-92-9230-103-3
30
Bruneau M, Chang SE, Eguchi RT, Lee GC, Rourke TD, Reinhorn AM et al (2003) A framework to quantitatively assess
and enhance the seismic resilience of communities. Earthq Spectra 19(4):733–752
Nat. Hazards Earth Syst. Sci. Discuss., doi:10.5194/nhess-2016-188, 2016Manuscript under review for journal Nat. Hazards Earth Syst. Sci.Published: 31 May 2016c© Author(s) 2016. CC-BY 3.0 License.

22
Burton, C. G. (2012) The development of metrics for community resilience to natural disasters. Ph.D. 3523093, University of
South Carolina.
Cabell, J. and Oelofse, M. (2012) ‘An indicator framework for assessing agroecosystem resilience’, Ecology and Society 5
17(1): 18
Cannon, T., and Muller-Mahn D. (2010) ‘Vulnerability, resilience and development discourses in context of climate change'
Natural Hazards, 55:621-635.
10
CGIAR-CCAFS (2015) A Monitoring Instrument for Resilience.
Cumming, G., Barnes, G., Perz, S., Schmink, M., Sieving, K., Southworth, J., Binford, M., Holt, R., Stickler, C. & Van Holt,
T. (2005) ‘An exploratory framework for the empirical measurement of resilience’, Ecosystems 8(8):975-987
15
Cutter LS, Barnes L, Berry M, Burton C, Evans E, Tate E, Webb J (2008a) Community and regional resilience to natural
disasters: perspective from hazards, disasters and emergency management, CARRI research report 1. Community and
Regional Resilience Institute, Oak Ridge
Cutter LS, Barnes L, Berry M, Burton C, Evans E, Tate E, Webb J (2008b) A place-based model for understanding 20
community resilience to natural disasters. Glob Environ Chang 18:598–606
ICE (2008) Flooding: Engineering Resilience, report from the Institution of Civil Engineers, pp. 15
http://www.ice.org.uk/getattachment/cdcdd467-8863-49b7-9e19-393a39eff02f/Flooding--Engineering-resilience.aspx
25
IFRC (2012) Of networks, norms, and trust. The role of social capital in reinforcing community resilience.
IFRC (2014) Asia-Pacific Input Document for the post-2015 Framework for Disaster Risk Reduction (HFA2) - Key Area 1-
Building Community Resilience.
30
Jonkman, S., & Kelman, I. (2005) ‘An analysis of the causes and circumstances of flood disaster deaths’, Disaster, 29(1):
75-97
Nat. Hazards Earth Syst. Sci. Discuss., doi:10.5194/nhess-2016-188, 2016Manuscript under review for journal Nat. Hazards Earth Syst. Sci.Published: 31 May 2016c© Author(s) 2016. CC-BY 3.0 License.

23
Jones, L., Ludi, E., Levine, S. (2010) Towards a characterisation of adaptive capacity: a framework analysing adaptive
capacity at the local level. ODI Background Notes, December 2010. Overseas Development Institute: London
Kurosaki, T. & Khan, H. (2011) ‘Floods, Relief Aid, and Household Resilience in Rural Pakistan: Findings from a Pilot
Survey in Khyber Pakhtunkhwa’, Review of Agrarian Studies 2:79-107 5
Low, B., Ostrom, E., Simon, C. & Wilson, J. (2003) ‘Redundancy and diversity: do they influence optimal management?’ in
F. Berkes, J. Colding, and C. Folke (eds.) Navigating social-ecological systems: building resilience for complexity and
change, Cambridge University Press, Cambridge, pp. 83-114
10
Low, S. & Kim, L. (2014) The Role of Social Capital in Strengthening Disaster Resilience in Thailand. Prepared for the
Southeast Asia Regional Delegation (SEARD), International Federation of Red Cross and Red Crescent Societies (IFRC);
and the Thailand Red Cross Society (TRCS).
Mayunga JS (2007) Understanding and applying the concept of community disaster resilience: a capital-based approach. A 15
draft working paper prepared for social vulnerability and resilience building, Munich, Germany, pp 1–16
Norris FH, Stevens SP, Pfefferbaum B, Wyche KF, Pfefferbaum RL (2008) Community resilience as a metaphor, theory, set
of capacities and strategy for disaster readiness. Community Psychol 41:127–150
20
Olsson P, Folke C, Berkes F (2004) Adaptive co-management for building resilience in social-ecological systems. Environ
Manag 34:75–90
Rose, A. (2007) ‘Economic Resilience to natural and man-made disasters: Multidisciplinary origins and contextual
dimensions’, Environmental Hazards 7 (4): 383-398. 25
Simonovic, S.P., and Peck, A. (2013) ‘Dynamic Resilience to Climate Change Caused Natural Disasters in Coastal
Megacities: Quantification Framework’, British Journal of Environment & Climate Change, 3(3): 378-401.
Torrens Resilience Institute (2012) Developing a model and tool to measure community disaster resilience. Community 30
Disaster Resilience Scorecard Toolkit.
Nat. Hazards Earth Syst. Sci. Discuss., doi:10.5194/nhess-2016-188, 2016Manuscript under review for journal Nat. Hazards Earth Syst. Sci.Published: 31 May 2016c© Author(s) 2016. CC-BY 3.0 License.
24
Twigger-Ross, C., Kashefi, E., Weldon, S., Brooks, K., Deeming, H., Forrest, S., Fielding, J., Gomersall, A., Harries, T.,
McCarthy, S., Orr, P., Parker, D., and Tapsell, S (2014) Flood Resilience Community Pathfinder Evaluation: Rapid Evidence
Assessment. London: Defra
UN (2013) Targets and Indicators For Addressing Disaster Risk Management in the Post-2015 Development Agenda, 18-19 5
July UNDP Learning Resources Center, New York
van Kien, N. (2011) Social Capital, Livelihood Diversification and Household Resilience to Annual Flood Events in
Vietnamese Mekong River Delta. EEPSEA Research Report. No. 2011-RR10.
10
WaterAid (2013) Disasters framework. WaterAid, London, UK.
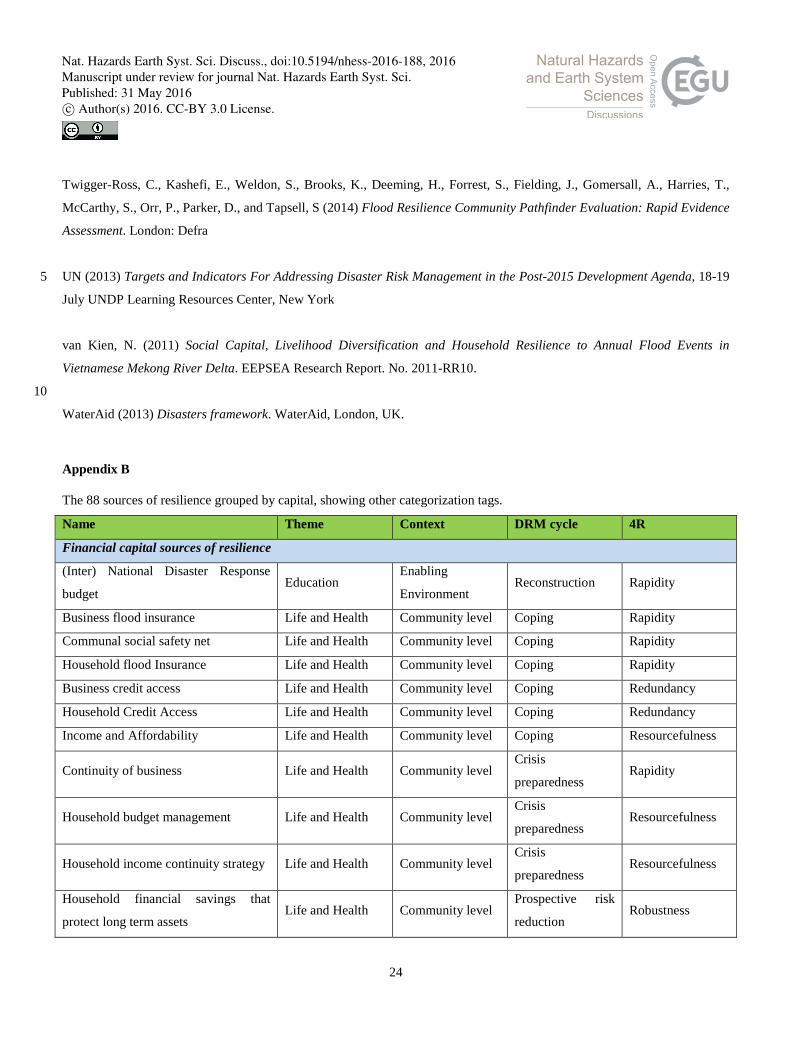
Appendix B
The 88 sources of resilience grouped by capital, showing other categorization tags.
Name Theme Context DRM cycle 4R
Financial capital sources of resilience
(Inter) National Disaster Response
budget Education
Enabling
Environment Reconstruction Rapidity
Business flood insurance Life and Health Community level Coping Rapidity
Communal social safety net Life and Health Community level Coping Rapidity
Household flood Insurance Life and Health Community level Coping Rapidity
Business credit access Life and Health Community level Coping Redundancy
Household Credit Access Life and Health Community level Coping Redundancy
Income and Affordability Life and Health Community level Coping Resourcefulness
Continuity of business Life and Health Community level Crisis
preparedness Rapidity
Household budget management Life and Health Community level Crisis
preparedness Resourcefulness
Household income continuity strategy Life and Health Community level Crisis
preparedness Resourcefulness
Household financial savings that
protect long term assets Life and Health Community level
Prospective risk
reduction Robustness
Nat. Hazards Earth Syst. Sci. Discuss., doi:10.5194/nhess-2016-188, 2016Manuscript under review for journal Nat. Hazards Earth Syst. Sci.Published: 31 May 2016c© Author(s) 2016. CC-BY 3.0 License.

25
Social safety net (legislative, national
schemes) Life and Health
Enabling
Environment Coping Redundancy
Functioning financial market Life and Health Enabling
Environment Coping Resourcefulness
Government appropriations for
infrastructure maintenance Life and Health
Enabling
Environment
Corrective risk
reduction Robustness
Community development investment
vehicles Life and Health
Enabling
Environment
Prospective risk
reduction Resourcefulness
Conservation budget Life and Health Enabling
Environment
Prospective risk
reduction Robustness
Mitigation financing (provided
through public or private) Life and Health
Enabling
Environment
Prospective risk
reduction Robustness
Human capital sources of resilience
Non-erosive flood recovery
knowledge
Assets and
Livelihoods Community level Coping Robustness
Flood Water Control Knowledge Assets and
Livelihoods Community level
Corrective risk
reduction Resourcefulness
Flood vulnerability perception and
management knowledge
Assets and
Livelihoods Community level
Corrective risk
reduction Robustness
Flood exposure management
knowledge
Assets and
Livelihoods Community level
Prospective risk
reduction Robustness
Flood exposure perception Assets and
Livelihoods Community level
Prospective risk
reduction Robustness
Understanding of future flood risk Assets and
Livelihoods Community level
Prospective risk
reduction Robustness
Value of education Education Community level Coping Resourcefulness
Educational attainment Education Enabling
Environment
Prospective risk
reduction Resourcefulness
Political awareness Governance Community level Corrective risk
reduction Resourcefulness
Personal safety Life and Health Community level Coping Resourcefulness
First aid knowledge Life and Health Community level Crisis
preparedness Robustness
Nat. Hazards Earth Syst. Sci. Discuss., doi:10.5194/nhess-2016-188, 2016Manuscript under review for journal Nat. Hazards Earth Syst. Sci.Published: 31 May 2016c© Author(s) 2016. CC-BY 3.0 License.

26
Flood protective behaviour and
knowledge Life and Health Community level
Crisis
preparedness Robustness
Population health status Life and Health Enabling
Environment Coping Robustness
Flood provisioning ecosystem services
awareness
Natural
environment Community level
Prospective risk
reduction Resourcefulness
Waste management awareness Waste Community level Coping Robustness
Flood water and sanitation (WASH)
knowledge Water Community level Coping Robustness
Natural capital sources of resilience
National legislation recognises habitat
restoration
Assets and
Livelihoods
Enabling
Environment
Corrective risk
reduction Robustness
Conservation management plan Assets and
Livelihoods
Enabling
Environment
Prospective risk
reduction Redundancy
Sustainable use of natural resources Natural
environment Community level
Corrective risk
reduction Resourcefulness
Natural habitats maintained for their
flood resilience services
Natural
environment Community level
Prospective risk
reduction Redundancy
Habitat connectivity Natural
environment
Enabling
Environment
Corrective risk
reduction Resourcefulness
Basin Health Natural
environment
Enabling
Environment
Prospective risk
reduction Resourcefulness
Physical capital sources of resilience
Communal Flood Protection (Flood
controls)
Assets and
Livelihoods Community level
Prospective risk
reduction Robustness
Individual (HH) Flood Vulnerability
Management
Assets and
Livelihoods Community level
Prospective risk
reduction Robustness
Basin Level Flood Controls Assets and
Livelihoods
Enabling
Environment
Prospective risk
reduction Robustness
Access to school facilities Education Community level Prospective risk
reduction Robustness
Energy sources Energy Community level Coping Redundancy
Food security Food Community level Coping Robustness
Nat. Hazards Earth Syst. Sci. Discuss., doi:10.5194/nhess-2016-188, 2016Manuscript under review for journal Nat. Hazards Earth Syst. Sci.Published: 31 May 2016c© Author(s) 2016. CC-BY 3.0 License.

27
Access to healthcare facilities Life and Health Community level Coping Robustness
Flood Emergency Infrastructure Life and Health Community level Crisis
preparedness Rapidity
Early Warning Systems (EWS) Life and Health Community level Crisis
preparedness Robustness
Measurement & Forecasting Life and Health Enabling
Environment
Crisis
preparedness Resourcefulness
Communication infrastructure Transport and
Communication Community level Coping Rapidity
Transportation and community access Transport and
Communication Community level Coping Redundancy
Lifelines infrastructure Transport and
Communication
Enabling
Environment Coping Robustness
Sanitation facilities Waste Community level Coping Robustness
Waste collection systems Waste Community level Coping Robustness
Water supply Water Community level Coping Redundancy
Social capital sources of resilience
Mutual assistance systems and safety
nets
Assets and
Livelihoods Community level Coping Resourcefulness
Social norms and security of assets Assets and
Livelihoods Community level Coping Robustness
Strategy to maintain or quickly resume
schooling interrupted by flooding Education Community level Coping Rapidity
Functioning and equitable education
system Education Community level Coping Robustness
Strategy to maintain or quickly resume
local energy supply in the event of a
flood
Energy Community level Coping Rapidity
Appropriate and equitable access to
energy Energy Community level Coping Robustness
Strategy to maintain or quickly resume
provision of local food supplies in the
event of a flood
Food Community level Coping Rapidity
Nat. Hazards Earth Syst. Sci. Discuss., doi:10.5194/nhess-2016-188, 2016Manuscript under review for journal Nat. Hazards Earth Syst. Sci.Published: 31 May 2016c© Author(s) 2016. CC-BY 3.0 License.

28
Functioning and equitable food supply
systems Food Community level Coping Robustness
National policy & plan for forecasting
ability Governance Community level Coping Rapidity
Village or District Flood Plan Governance Community level Coping Rapidity
Community representative
bodies/structures for flood
management coordination
Governance Community level Coping Resourcefulness
Coordination mechanism across
communities Governance Community level Coping Resourcefulness
Culture for community information
sharing Governance Community level Coping Resourcefulness
Social inclusiveness Governance Community level Coping Resourcefulness
Social leadership Governance Community level Coping Resourcefulness
Flood regulation and local
enforcement Governance Community level Coping Robustness
Government policies & planning and
mainstreaming of flood risk Governance Community level Coping Robustness
Watershed/Basin scale management
plan & structure Governance
Enabling
Environment Coping Resourcefulness
Strategy to maintain or quickly resume
healthcare services interrupted by
flooding
Life and Health Community level Coping Rapidity
Formal community emergency
services integrate flood advice and
management
Life and Health Community level Coping Resourcefulness
Social participation in flood
management related activities Life and Health Community level Coping Resourcefulness
Strategies for the delivery of
actionable information for flood
management
Life and Health Community level Coping Resourcefulness
Functioning and equitable health
system Life and Health Community level Coping Robustness
Nat. Hazards Earth Syst. Sci. Discuss., doi:10.5194/nhess-2016-188, 2016Manuscript under review for journal Nat. Hazards Earth Syst. Sci.Published: 31 May 2016c© Author(s) 2016. CC-BY 3.0 License.

29
Social norms and personal security Life and Health Community level Coping Robustness
Access to external, formal flood
related services Life and Health Community level Reconstruction Resourcefulness
National environment conservation
legislation
Natural
environment Community level Coping Resourcefulness
Community plan for the sustainable
management of natural resources and
preservation of ecosystem services
Natural
environment Community level
Prospective risk
reduction Resourcefulness
Strategy to maintain or quickly resume
provision of mobility services in the
event of a flood
Transport and
Communication Community level Coping Rapidity
Appropriate and equitable access to
mobility
Transport and
Communication Community level Coping Robustness
Strategy to maintain or quickly resume
local waste collection & disposal
services in the event of a flood
Waste Community level Coping Rapidity
Functioning and equitable waste
collection & disposal services Waste Community level Coping Robustness
Strategy to maintain or quickly resume
provision of local safe water in the
event of a flood
Water Community level Coping Rapidity
Functioning and equitable water
services Water Community level Coping Robustness
The 29 ex-post outcome measures, showing variable type and other categorization tags.
Outcome measure Variable
type Theme Context
Death and injury due to flooding Impact Life and health Community level
Building losses and damage Impact Assets and livelihoods Community level
Property losses and damage Impact Assets and livelihoods Community level
Prevalence of post-flood illness Impact Life and health Community level
Healthcare provision Impact Life and health Community level
Nat. Hazards Earth Syst. Sci. Discuss., doi:10.5194/nhess-2016-188, 2016Manuscript under review for journal Nat. Hazards Earth Syst. Sci.Published: 31 May 2016c© Author(s) 2016. CC-BY 3.0 License.

30
Education provision Impact Education Community level
Income stability Impact Assets and livelihoods Community level
Business interruption Impact Assets and livelihoods Community level
Food security Impact Food Community level
Communications infrastructure Impact Transport and
communications Enabling environment
Road and transportation infrastructure Impact Transport and
communications Enabling environment
Clean water Impact Water Community level
Sanitation Impact Waste Community level
Waste disposal Impact Waste Community level
Electricity Impact Energy Enabling environment
Social cohesion Impact Governance Community level
Property crime and looting Impact Governance Community level
Natural environment Impact Natural environment Enabling environment
Flood learning Impact Governance Community level
Early warning system function Action Governance Enabling environment
Preparatory actions Action Life and health Community level
External flood assistance Action Governance Enabling environment
Legal and regulatory constraints Action Governance Enabling environment
Selling assets Action Assets and livelihoods Community level
Risky livelihoods Action Assets and livelihoods Community level
Insurance Action Assets and livelihoods Community level
Flood frequency and severity Control n/a Enabling environment
Number of people impacted Control n/a Community level
Flood duration Control n/a Enabling environment
Appendix C
As an illustrative example, we present one of the 88 sources of resilience, fully specified.
Source name: Access to school facilities
5
Nat. Hazards Earth Syst. Sci. Discuss., doi:10.5194/nhess-2016-188, 2016Manuscript under review for journal Nat. Hazards Earth Syst. Sci.Published: 31 May 2016c© Author(s) 2016. CC-BY 3.0 License.

31
Categorizations:
• Capital group: Physical
• 4Rs: Robustness
• Level: Community level
• DRM cycle: Prospective risk reduction 5
• Theme: Education
The source is explained to the assessor with the following description and instructions: “This aspect of the education theme
considers the adequacy of the infrastructure to support provision of education and how it stands up in flood situations -
Schooling is an important aspect of daily life”. Both the interruption itself and the lost education time lead to problems 10
(children at home instead of daily rhythm at school). Schooling during floods should obviously be conducted only where and
when it is safe to do so depending on the flood scenario. For flash flood situations, rapidity and robustness is key and
schooling should resume as soon as possible. For long-standing, large-scale standing water flood situations, it is important
that schooling can continue, such as in alternate locations or safe locations.
15
Data may be collected via household survey questions, community consultation discussion topics/questions, key informant
interviews, interest group discussion topics/questions, or third party sources, as appropriate to context determined by the
implementing NGO. For the example source the data collection options are shown in the table below3:
Household survey question Household survey
answer options
Does school take place during and after flood events? (this may be due to damage to the school or
the way to get to school, but also because the school is needed for emergency shelter)
1 - Yes
2 – No
Has the school facility been damaged during the last floods so it could not operate anymore? 1 - Yes
2 – No
Can schools be reached during and after floods safely by staff and students? 1 - Yes
2 – No
Community question Community allowed
answers
3 It should be noted that while this example source allows mostly dichotomous answers for all data source options, allowed answers vary from yes/no to other response lists, and free form entry.
Nat. Hazards Earth Syst. Sci. Discuss., doi:10.5194/nhess-2016-188, 2016Manuscript under review for journal Nat. Hazards Earth Syst. Sci.Published: 31 May 2016c© Author(s) 2016. CC-BY 3.0 License.

32
Does school take place during and after flood events? (this may be due to damage to the school or
the way to get to school, but also because the school is needed for emergency shelter)
1 - Yes
2 – No
Has the school facility been damaged during the last floods so it could not operate anymore? 1 - Yes
2 – No
Can all reach the school facility during flooding? 1 - All
2 - Some
3 - None
Key informant question Key informant
allowed answers
Ask e.g. the principal: Locate school facility or where schooling / teaching takes place on a map -
Do schools get affected during floods? Do schools get used as emergency shelter and thus
schooling is interrupted?
1 - Yes
2 – No
Has the school facility been damaged during the last floods so it could not operate anymore? 1 - Yes
2 – No
Can all reach the school facility during flooding? 1 - All
2 - Some
3 - None
Interest group question Interest group
allowed answers
Ask the teachers group: Locate school facility or where schooling / teaching takes place on a
map - Do schools get affected during floods? Do schools get used as emergency shelter and thus
schooling is interrupted?
1 - Yes
2 – No
Has the school facility been damaged during the last floods so it could not operate anymore? 1 - Yes
2 – No
Can all reach the school facility during flooding? 1 - All
2 - Some
3 - None
Third party source question Third party source
allowed answers
Locate school facility or where schooling / teaching takes place on a map - Do schools get affected
during floods? Do schools get used as emergency shelter and thus schooling is interrupted?
1 - Yes
2 – No
Nat. Hazards Earth Syst. Sci. Discuss., doi:10.5194/nhess-2016-188, 2016Manuscript under review for journal Nat. Hazards Earth Syst. Sci.Published: 31 May 2016c© Author(s) 2016. CC-BY 3.0 License.

33
Has the school facility been damaged during the last floods so it could not operate anymore? 1 - Yes
2 – No
Can all reach the school facility during flooding? 1 - All
2 - Some
3 - None
The ‘Access to school facilities’ source of resilience is graded A to D with the following guidance:
A: School facility (or location where formal school setting takes place) is built robust, located away from flood zone and
accessible through safe and protected ways even during and after floods - schooling continues to take place. 5
B: School facility is impacted by flooding but maintains sufficient basic staffing and equipment to provide care. OR school
may be impacted but informal schooling is planned to go on in a safe place during and after floods.
C: School facility is impacted and cannot avoid significant lost school curriculum. OR while informal schooling may be 10
available, it is unplanned or inconvenient and leads to significant lost school curriculum
D: No schooling facility. OR school prone to damage rendering it in-operational during flood. OR school not accessible
during flood for either teachers or students.
15
References
Alinovi, L., Mane, E. & Romano, D. (2009) Measuring Household Resilience to Food Insecurity: Application to Palestinian
Households, EC-FAO Food Security Programme, Working Paper.
http://citeseerx.ist.psu.edu/viewdoc/download?doi=10.1.1.175.7411&rep=rep1&type=pdf.
20
Bahadur, A., Peters, K., Wilkinson, E., Pichon, F., Gray, K. and Tanner, T. (2015) The 3As: Tracking Resilience Across
Braced, BRACED Knowledge Manager working paper.
Béné, C., Frankenberger, T. and Nelson, S. (2015) Design, Monitoring and Evaluation of Resilience Interventions:
Conceptual and Empirical Considerations. IDS Working Paper, Issue 459. 25
Nat. Hazards Earth Syst. Sci. Discuss., doi:10.5194/nhess-2016-188, 2016Manuscript under review for journal Nat. Hazards Earth Syst. Sci.Published: 31 May 2016c© Author(s) 2016. CC-BY 3.0 License.

34
Béné, C., Godfrey Wood, R., Newsham, A. and Davies, M. (2012) Resilience: new utopia or new tyranny? Reflection about
the potentials and limits of the concept of resilience in relation to vulnerability reduction programmes. Brighton: Institute of
Development Studies.
Bruneau, M. (2006) Enhancing the Resilience of Communities Against Extreme Events from an Earthquake Engineering 5
Perspective, Journal of Security Education 1:4, 159-167, DOI: 10.1300/J460v01n04_14
Carpenter, S., Walker, B., Anderies, J. M. and Abel, N. (2001) ‘From Metaphor to Measurement: Resilience of What to
What?’, Ecosystems 4: 765-781.
10
Carpenter, S., Westley, F. and Turner, M. (2005) ‘Surrogates for Resilience of Social-Ecological Systems’, Ecosystems 8:
941-944.
Cimellaro, G., Reinhyorn, A. and Bruneau, M. (2010) ‘Seismic resilience of a hospital system’, Structure and Infrastructure
Engineering 6(1-2), 127–144. 15
Constas, M., and Barrett, C. B. (2013) Principles of Resilience Measurement for Food Insecurity: Metrics, Mechanisms, and
Implementation Plans, presented at Expert Consultation on Resilience Measurement Related to Food Security sponsored by
Food and Agricultural Organization and World Food Programme, Rome, February 19–21.
20
Constas, M., Frankenberger, T. and Hoddinott, J. (2014) Resilience Measurement Principles: Toward an Agenda for
Measurement Design. Resilience Measurement Technical Working Group Technical Series 1. Rome: Food Security
Information Network.
Cutter, S., Burton, C., and Emrich, C. (2010) ‘Disaster resilience indicators for benchmarking baseline conditions’, Journal 25
of Homeland Security 7(1), DOI:10.2202/1547-7355.1732.
de Sherbinin, A., Reuben, A. Levy, M. & Johnson, L. (2013) How Environmental Indicators Are Being Used in Policy and
Management Context, Center for International Earth Science Information Network, Yale and Columbia Universities, New
Haven and New York. 30
DFID (1999) Sustainable Livelihoods Guidance Sheets, Department of International Development, United Kingdom,
http://www.eldis.org/vfile/upload/1/document/0901/section2.pdf
Nat. Hazards Earth Syst. Sci. Discuss., doi:10.5194/nhess-2016-188, 2016Manuscript under review for journal Nat. Hazards Earth Syst. Sci.Published: 31 May 2016c© Author(s) 2016. CC-BY 3.0 License.

35
DFID (2011) Defining Disaster Resilience: A DFID Approach Paper. DFID 2011. UK Department for International
Development: London
Engle, N. (2011) ‘Adaptive capacity and its assessment’, Global Environmental Change-Human and Policy Dimensions
21(2): 647–656. 5
Frankenberger, T. and Nelson, S. (2013) Background Paper for the Expert Consultation on Resilience Measurement for Food
Security. Paper presented at Expert Consultation on Resilience Measurement Related to Food Security, Rome, February 19–
21.
10
Frankenberger, T., Constas, M. A., Nelson, S., and Starr, L. (2014) Resilience programing among nongovernmental
organizations: Lessons for policy makers. Food Policy Report.
Heltberg, R., Hossain, N. & Reva, A. eds. (2012) Living Through Crises: How the Food, Fuel, and Financial Shocks Affect
the Poor, World Bank, Washington D.C. 15
Holling, C. (2001) ‘Understanding the Complexity of Economic, Ecological, and Social Systems’, Ecosystems 4(5): 390-
405.
IFRC (2011) Characteristics of a Safe and Resilient Community, Community Based Disaster Risk Reduction Study, ARUP 20
International Development, International Federation of Red Cross and Red Crescent Societies, Geneva,
http://www.ifrc.org/PageFiles/96986/Final_Characteristics_Report.pdf
IFRC (2012) Understanding community resilience and program factors that strengthen them: A comprehensive study of Red
Cross Red Crescent Societies tsunami operation, International Federation of Red Cross and Red Crescent Societies, June 25
2012, https://www.ifrc.org/PageFiles/96984/Final_Synthesis_Characteristics_Lessons_Tsunami.pdf
IFRC (2014) IFRC Framework for Community Resilience, International Federation of Red Cross and Red Crescent
Societies, Geneva, http://www.ifrc.org/Global/Documents/Secretariat/201501/1284000-
Framework%20for%20Community%20Resilience-EN-LR.pdf 30
Keating, A., Campbell, K., Mechler, R., Magnuszewski, P., Mochizuki, J., Liu, W., Szoenyi, M. and McQuistan, C. (2016)
Disaster resilience: What it is and how it can engender a meaningful change in development policy. Development Policy
Review. (In Press)
Nat. Hazards Earth Syst. Sci. Discuss., doi:10.5194/nhess-2016-188, 2016Manuscript under review for journal Nat. Hazards Earth Syst. Sci.Published: 31 May 2016c© Author(s) 2016. CC-BY 3.0 License.

36
Keating, A., Campbell, K., Mechler, R., Michel-Kerjan, E., Mochizuki, J., Kunreuther, H., Bayer, J., Hanger, S., McCallum,
I., See, L., Williges, K., Atreya, A., Botzen, W., Collier, B., Czajkowski, J., Hochrainer, S., Egan, C. (2014)
Operationalizing Resilience Against Natural Disaster Risk: Opportunities, Barriers and A Way Forward, Zurich Flood
Resilience Alliance, 5
http://opim.wharton.upenn.edu/risk/library/zurichfloodresiliencealliance_ResilienceWhitePaper_2014.pdf
Kellett, J. & Caravani, A. (2013) Financing disaster risk reduction: A 20-year story of international aid, ODI and the Global
Facility for Disaster Reduction and Recovery at the World Bank, London / Washington.
10
Knutsson, P. and Ostwalk, M. (2006) ‘A process-oriented sustainable livelihoods approach – A tool for increased
understanding of vulnerability, adaptation and resilience’, Mitigation and Adaptation Strategies for Global Change, DOI:
10.1007/s11027-006-4421-9.
Levine, S. (2014) Assessing Resilience: Why Quantification Misses the Point. Humanitarian Policy Group Working Paper, 15
ODI.
MCEER (2007) Engineering resilience solutions from earthquake engineering to extreme events. Multidisciplinary Center
for Earthquake Engineering Research, USA.
20
Mechler, R. (2016) ‘Reviewing estimates of the economic efficiency of disaster risk management: opportunities and
limitations of using risk-based cost–benefit analysis’, Natural Hazards. pp. 1-27.
Mitchell, A. (2013) Risk and Resilience: From Good Idea to Good Practice—A Scoping Study for the Experts Group on
Risk and Resilience. Paris: Organization for Economic Co-operation and Development. 25
National Research Council (NRC) (2012) Disaster Resilience: A National Imperative. The National Academies Press,
Washington, D.C.
Nelson, D., Adger, W. and Brown, K. (2007) ‘Adaptation to environmental change: contributions of a resilience framework’, 30
Annual Review of Environment and Resources 32:395-419.
Oddsdottir, F., Lucas, B., and Combaz, É. (2013) Measuring Disaster Resilience, GSDRC Helpdesk Research Report 1045,
GSDRC, University of Birmingham, UK.
Nat. Hazards Earth Syst. Sci. Discuss., doi:10.5194/nhess-2016-188, 2016Manuscript under review for journal Nat. Hazards Earth Syst. Sci.Published: 31 May 2016c© Author(s) 2016. CC-BY 3.0 License.

37
OECD (2014) Guidelines for Resilience Systems Analysis. How to analyze risk and build a roadmap to resilience.
Ostadtaghizadeh, A., Ardalan, A., Paton, D., Jabbari, H. and Khankeh, H.R. (2015) Community Disaster Resilience: a
Systematic Review on Assessment Models and Tools. PLOS Currents Disasters, doi: 5
10.1371/currents.dis.f224ef8efbdfcf1d508dd0de4d8210ed.
Oxfam GB (2013) A Multidimensional Approach for Measuring Resilience, Oxfam GB Working Paper.
Pasteur, K. (2011) From Vulnerability to Resilience, Practical Action Publishing, Rugby. 10
Resilience Capacity Index, (n.d.) Resilience Capacity Index, University of California, Berkeley, http://brr.berkeley.edu/rci/
Schipper, E. L. F. and Langston, L. (2015) A Comparative Overview of Resilience Measurement Frameworks: Analysing
Indicators and Approaches. Overseas Development Institute Working Paper, Issue 422. 15
Schipper, L. and Pelling, M. (2006) ‘Disaster risk, climate change and international development: scope for, and challenges
to, integration’, Disasters 30(1): 19-38.
Tol, R. and Yohe, G. (2007) ‘Infinite Uncertainty, Forgotten Feedbacks, and Cost-Benefit Analysis of Climate Change’, 20
Climate Change 83: 429-442.
Twigg, J. (2009) Characteristics of a Disaster Resilient Community,
http://community.eldis.org/.59e907ee/Characteristics2EDITION.pdf
25
UNISDR (2009) Terminology http://www.unisdr.org/we/inform/terminology
UNISDR (2013) From Shared Risk to Shared Value –The Business Case for Disaster Risk Reduction, United Nations Office
for Disaster Risk Reduction, Geneva.
30
UNISDR (2015) Global Assessment Report on Disaster Risk Reduction - Making Development Sustainable: The Future of
Disaster Risk Management, United Nations Office for Disaster Risk Reduction, Geneva,
http://www.preventionweb.net/english/hyogo/gar/2015/en/gar-pdf/GAR2015_EN.pdf
Nat. Hazards Earth Syst. Sci. Discuss., doi:10.5194/nhess-2016-188, 2016Manuscript under review for journal Nat. Hazards Earth Syst. Sci.Published: 31 May 2016c© Author(s) 2016. CC-BY 3.0 License.

38
USAID (2013) The Resilience Agenda: Measuring Resilience in USAID.
http://www.usaid.gov/sites/default/files/documents/1866/Technical%20Note_Measuring%20Resilience%20in%20USAID_J
une%202013.pdf
Vincent, K. (2007) ‘Uncertainty in adaptive capacity and the importance of scale’, Global Environmental Change 17(1): 12– 5
24.
Winderl, T. (2014) Disaster Resilience Measurements: Stocktaking of ongoing efforts in developing systems for measuring
resilience. United Nations Development Programme (UNDP).
10
Figures
Figure 1: Conceptual framework of community resilience. Source: IFRC, 2012
Nat. Hazards Earth Syst. Sci. Discuss., doi:10.5194/nhess-2016-188, 2016Manuscript under review for journal Nat. Hazards Earth Syst. Sci.Published: 31 May 2016c© Author(s) 2016. CC-BY 3.0 License.

39
Figure 2: Vulnerability to Resilience Framework. Source: Pasteur, 2011
Nat. Hazards Earth Syst. Sci. Discuss., doi:10.5194/nhess-2016-188, 2016Manuscript under review for journal Nat. Hazards Earth Syst. Sci.Published: 31 May 2016c© Author(s) 2016. CC-BY 3.0 License.