Development and Evaluation of the 1997 ASVAB Score...
255
Development and Evaluation of the 1997 ASVAB Score Scale Daniel O. Segall Defense Manpower Data Center July 2004
Transcript of Development and Evaluation of the 1997 ASVAB Score...

Development and Evaluation of the1997 ASVAB Score Scale
Daniel O. SegallDefense Manpower Data Center
July 2004


Contents
E xecutive Summar y xi
1 Introduction 11.1 1997 American Youth Population . . . . . . . . . . . . 31.2 The Armed Services Vocational Aptitude Battery . . . 31.3 Related Work . . . . . . . . . . . . . . . . . . . . . . . 41.4 Report Outline . . . . . . . . . . . . . . . . . . . . . . 4
2 ‘97 Score Scale Development 72.1 Relative Performance of ‘80 and ‘97 Youth Populations 72.2 Subtest Standard Score Conversions . . . . . . . . . . 102.3 Verbal and Auto-Shop Composites . . . . . . . . . . . 122.4 Armed Forces Qualification Test . . . . . . . . . . . . 132.5 Service Classification Composites . . . . . . . . . . . . 16
2.5.1 Air Force . . . . . . . . . . . . . . . . . . . . . 162.5.2 Marine Corps . . . . . . . . . . . . . . . . . . . 172.5.3 Army . . . . . . . . . . . . . . . . . . . . . . . 182.5.4 Navy . . . . . . . . . . . . . . . . . . . . . . . . 21
3 Test Form Equating 233.1 Background . . . . . . . . . . . . . . . . . . . . . . . . 23

ii Contents
3.2 Data . . . . . . . . . . . . . . . . . . . . . . . . . . . . 253.3 Equating and Standard-Score Transformations . . . . 26
3.3.1 Form 03D . . . . . . . . . . . . . . . . . . . . . 263.3.2 Form 01D . . . . . . . . . . . . . . . . . . . . . 283.3.3 Form 02D . . . . . . . . . . . . . . . . . . . . . 303.3.4 Form 25B . . . . . . . . . . . . . . . . . . . . . 32
3.4 Form Equivalence Analyses . . . . . . . . . . . . . . . 34
4 Enlistment Impact 394.1 Samples . . . . . . . . . . . . . . . . . . . . . . . . . . 39
4.1.1 CY2002 Cohort . . . . . . . . . . . . . . . . . . 404.1.2 Reserve and Guard Samples . . . . . . . . . . . 41
4.2 Qualification Impact . . . . . . . . . . . . . . . . . . . 414.3 Equating Enlistment Standards . . . . . . . . . . . . . 444.4 High-Quality Applicants and Educational Attainment 484.5 Subgroup Effects . . . . . . . . . . . . . . . . . . . . . 53
4.5.1 Groups Defined by Race . . . . . . . . . . . . . 534.5.2 Groups Defined by Gender . . . . . . . . . . . 56
4.6 Maintaining Expected Performance . . . . . . . . . . . 56
5 Occupational Qualification Impact 635.1 Background . . . . . . . . . . . . . . . . . . . . . . . . 635.2 Classification Composite Distribution Analysis . . . . 65
5.2.1 ‘80 Standard Impact . . . . . . . . . . . . . . . 675.2.2 ‘97 Standard Determination . . . . . . . . . . . 67
6 Implementation Options 696.1 Implementation Option Overview . . . . . . . . . . . . 696.2 Effects on Nominal and Predictive Standards . . . . . 706.3 Option Examples and Outcomes . . . . . . . . . . . . 71
6.3.1 Option A . . . . . . . . . . . . . . . . . . . . . 716.3.2 Option B . . . . . . . . . . . . . . . . . . . . . 726.3.3 Option C . . . . . . . . . . . . . . . . . . . . . 736.3.4 Option D . . . . . . . . . . . . . . . . . . . . . 73
6.4 Discussion . . . . . . . . . . . . . . . . . . . . . . . . . 74
References 77
A Army Supplement A-1

Contents iii
B Navy Supplement B-1
C Air Force Supplement C-1
D Marine Corps Supplement D-1
E AFQT ‘97 to ‘80 Transformation E-1
F Composite Transformation Tables F-1

iv Contents

List of Tables
1.1 CAT-ASVAB Composition . . . . . . . . . . . . . . . . 5
2.1 Subtest Statistics for PAY80 and PAY97 Samples . . . 82.2 AFQT Distributions for PAY80 and PAY97 Samples . 92.3 PAY97 Sample Moments (Form 04D) . . . . . . . . . . 102.4 Form 04D Standard Score Transformation Parameters 112.5 ‘97 AFQT Percentile Conversion . . . . . . . . . . . . 142.5 ‘97 AFQT Percentile Conversion (continued) . . . . . 152.6 Moments of Unstandardized Marine Corps Composite
Distributions . . . . . . . . . . . . . . . . . . . . . . . 182.7 Army Composite Weights (‘97 Metric) . . . . . . . . . 20
3.1 Data Sources and Sample Sizes for Form Equating . . 263.2 IOT&E Sample Subtest Moments . . . . . . . . . . . . 273.3 Form 03D Standard Score Transformation Parameters 283.4 CY2001 Sample Subtest Moments (Forms 01D and 03D) 293.5 Form 01D Standard Score Transformation Parameters 293.6 CY2001 Sample Subtest Moments (Forms 02D and 03D) 313.7 Form 02D Standard Score Transformation Parameters 313.8 Anchoring Study Sample Subtest Moments . . . . . . 333.9 Form 25B Standard Score Transformation Parameters 33

vi LIST OF TABLES
3.10 RMSD Indices Between Form Composite Distributions. 37
4.1 Sample Sizes of Regular CY2002 Cohort . . . . . . . . 404.2 Reserve and Guard CY2002 Sample Sizes . . . . . . . 414.3 Regular CY2002 AFQTQualification Percentages (Un-
adjusted Cut Scores) . . . . . . . . . . . . . . . . . . . 424.4 Reserve CY2002 AFQTQualification Percentages (Un-
adjusted Cut Scores) . . . . . . . . . . . . . . . . . . . 434.5 Guard CY2002 AFQT Qualification Percentages (Un-
adjusted Cut Scores) . . . . . . . . . . . . . . . . . . . 434.6 AFQT Distributions for 1980 and 1997 Scales . . . . . 454.6 AFQT Distributions for 1980 and 1997 Scales (con-
tinued) . . . . . . . . . . . . . . . . . . . . . . . . . . . 464.6 AFQT Distributions for 1980 and 1997 Scales (con-
tinued) . . . . . . . . . . . . . . . . . . . . . . . . . . . 474.7 Regular CY2002 AFQTQualification Percentages (Ad-
justed Cut Scores) . . . . . . . . . . . . . . . . . . . . 484.8 Reserve CY2002 AFQTQualification Percentages (Ad-
justed Cut Scores) . . . . . . . . . . . . . . . . . . . . 484.9 Guard CY2002 AFQT Qualification Percentages (Ad-
justed Cut Scores) . . . . . . . . . . . . . . . . . . . . 494.10 Distribution of High-Quality Regular Applicants Across
Alternative Score Scales . . . . . . . . . . . . . . . . . 504.11 Distribution of High-Quality Reserve Applicants Across
Alternative Score Scales . . . . . . . . . . . . . . . . . 514.12 Distribution of High-Quality Guard Applicants Across
Alternative Score Scales . . . . . . . . . . . . . . . . . 524.13 Subgroup Qualification Rates (All Services) . . . . . . 544.14 Subgroup Qualification Distributions (All Services) . . 574.15 Gender Qualification Rates (All Services) . . . . . . . 584.16 Gender Qualification Distributions (All Services) . . . 594.17 Equated AFQT Category Boundaries . . . . . . . . . . 61
5.1 Integer-Weighted Service Classification Composite De-finitions . . . . . . . . . . . . . . . . . . . . . . . . . . 64
5.2 Composite Moments (‘80 and ‘97 Scales) . . . . . . . . 66
6.1 AFQT Reporting, Standards, and Quality-Goal Options 696.2 Implementation Option Impact . . . . . . . . . . . . . 71

LIST OF TABLES vii
A.1 Army Composite Weights (‘80 Metric) . . . . . . . . . A-2A.2 Army Regular AFQT Distributions for 1980 and 1997
Scales . . . . . . . . . . . . . . . . . . . . . . . . . . . A-3A.2 Regular Army AFQT Distributions for 1980 and 1997
Scales (continued) . . . . . . . . . . . . . . . . . . . . A-5A.2 Regular Army AFQT Distributions for 1980 and 1997
Scales (continued) . . . . . . . . . . . . . . . . . . . . A-7A.3 Army Reserve AFQT Distributions for 1980 and 1997
Scales . . . . . . . . . . . . . . . . . . . . . . . . . . . A-9A.3 Army Reserve AFQT Distributions for 1980 and 1997
Scales (continued) . . . . . . . . . . . . . . . . . . . . A-11A.3 Army Reserve AFQT Distributions for 1980 and 1997
Scales (continued) . . . . . . . . . . . . . . . . . . . . A-13A.4 Army Guard AFQT Distributions for 1980 and 1997
Scales . . . . . . . . . . . . . . . . . . . . . . . . . . . A-15A.4 Army Guard AFQT Distributions for 1980 and 1997
Scales (continued) . . . . . . . . . . . . . . . . . . . . A-17A.4 Army Guard AFQT Distributions for 1980 and 1997
Scales (continued) . . . . . . . . . . . . . . . . . . . . A-19A.5 Subgroup Qualification Rates (Army Regular) . . . . . A-21A.6 Subgroup Qualification Rates (Army Reserve) . . . . . A-23A.7 Subgroup Qualification Rates (Army Guard) . . . . . A-25A.8 Gender Qualification Rates (Army Regular) . . . . . . A-26A.9 Gender Qualification Rates (Army Reserve) . . . . . . A-27A.10 Gender Qualification Rates (Army Guard) . . . . . . . A-28A.11 Subgroup Qualification Distributions (Army Regular) A-29A.12 Subgroup Qualification Distributions (Army Reserve) A-30A.13 Subgroup Qualification Distributions (Army Guard) . A-31A.14 Gender Qualification Distributions (Army Regular) . . A-32A.15 Gender Qualification Distributions (Army Reserve) . . A-33A.16 Gender Qualification Distributions (Army Guard) . . A-34
B.1 Navy Regular AFQT Distributions for 1980 and 1997Scales . . . . . . . . . . . . . . . . . . . . . . . . . . . B-3
B.1 Navy Regular AFQT Distributions for 1980 and 1997Scales (continued) . . . . . . . . . . . . . . . . . . . . B-5
B.1 Navy Regular AFQT Distributions for 1980 and 1997Scales (continued) . . . . . . . . . . . . . . . . . . . . B-7
B.2 Navy Reserve AFQT Distributions for 1980 and 1997Scales . . . . . . . . . . . . . . . . . . . . . . . . . . . B-9

viii LIST OF TABLES
B.2 Navy Reserve AFQT Distributions for 1980 and 1997Scales (continued) . . . . . . . . . . . . . . . . . . . . B-11
B.2 Navy Reserve AFQT Distributions for 1980 and 1997Scales (continued) . . . . . . . . . . . . . . . . . . . . B-13
B.3 Subgroup Qualification Rates (Navy Regular) . . . . . B-14B.4 Subgroup Qualification Rates (Navy Reserve) . . . . . B-15B.5 Gender Qualification Rates (Navy Regular) . . . . . . B-16B.6 Gender Qualification Rates (Navy Reserve) . . . . . . B-17B.7 Subgroup Qualification Distributions (Navy Regular) . B-18B.8 Subgroup Qualification Distributions (Navy Reserve) . B-19B.9 Gender Qualification Distributions (Navy Regular) . . B-20B.10 Gender Qualification Distributions (Navy Reserve) . . B-21
C.1 ‘97 Air Force Mechanical (M) Percentile Conversion . C-2C.1 ‘97 Air Force Mechanical (M) Percentile Conversion
(continued) . . . . . . . . . . . . . . . . . . . . . . . . C-3C.1 ‘97 Air Force Mechanical (M) Percentile Conversion
(continued) . . . . . . . . . . . . . . . . . . . . . . . . C-4C.2 ‘97 Air Force Administrative (A) Percentile Conver-
sion . . . . . . . . . . . . . . . . . . . . . . . . . . . . C-5C.3 ‘97 Air Force General (G) Percentile Conversion . . . C-6C.4 ‘97 Air Force Electrical (E) Percentile Conversion . . . C-7C.4 ‘97 Air Force Electrical (E) Percentile Conversion (con-
tinued) . . . . . . . . . . . . . . . . . . . . . . . . . . . C-8C.5 Air Force Regular AFQT Distributions for 1980 and
1997 Scales . . . . . . . . . . . . . . . . . . . . . . . . C-9C.5 Air Force Regular AFQT Distributions for 1980 and
1997 Scales (continued) . . . . . . . . . . . . . . . . . C-11C.5 Air Force Regular AFQT Distributions for 1980 and
1997 Scales (continued) . . . . . . . . . . . . . . . . . C-13C.6 Air Force Reserve AFQT Distributions for 1980 and
1997 Scales . . . . . . . . . . . . . . . . . . . . . . . . C-15C.6 Air Force Reserve AFQT Distributions for 1980 and
1997 Scales (continued) . . . . . . . . . . . . . . . . . C-17C.6 Air Force Reserve AFQT Distributions for 1980 and
1997 Scales (continued) . . . . . . . . . . . . . . . . . C-19C.7 Air Force Guard AFQT Distributions for 1980 and
1997 Scales . . . . . . . . . . . . . . . . . . . . . . . . C-21C.7 Air Force Guard AFQT Distributions for 1980 and
1997 Scales (continued) . . . . . . . . . . . . . . . . . C-23

LIST OF TABLES ix
C.7 Air Force Guard AFQT Distributions for 1980 and1997 Scales (continued) . . . . . . . . . . . . . . . . . C-25
C.8 Subgroup Qualification Rates (Air Force Regular) . . . C-26C.9 Subgroup Qualification Rates (Air Force Reserve) . . . C-27C.10 Subgroup Qualification Rates (Air Force Guard) . . . C-28C.11 Gender Qualification Rates (Air Force Regular) . . . . C-29C.12 Gender Qualification Rates (Air Force Reserve) . . . . C-30C.13 Gender Qualification Rates (Air Force Guard) . . . . . C-31C.14 Subgroup Qualification Distributions (Air Force Reg-
ular) . . . . . . . . . . . . . . . . . . . . . . . . . . . . C-32C.15 Subgroup Qualification Distributions (Air Force Re-
serve) . . . . . . . . . . . . . . . . . . . . . . . . . . . C-33C.16 Subgroup Qualification Distributions (Air Force Guard)C-34C.17 Gender Qualification Distributions (Air Force Regular)C-35C.18 Gender Qualification Distributions (Air Force Reserve)C-36C.19 Gender Qualification Distributions (Air Force Guard) C-37
D.1 Marine Corps Regular AFQT Distributions for 1980and 1997 Scales . . . . . . . . . . . . . . . . . . . . . . D-3
D.1 Marine Corps Regular AFQT Distributions for 1980and 1997 Scales (continued) . . . . . . . . . . . . . . . D-5
D.1 Marine Corps Regular AFQT Distributions for 1980and 1997 Scales (continued) . . . . . . . . . . . . . . . D-7
D.2 Marine Corps Reserve AFQT Distributions for 1980and 1997 Scales . . . . . . . . . . . . . . . . . . . . . . D-9
D.2 Marine Corps Reserve AFQT Distributions for 1980and 1997 Scales (continued) . . . . . . . . . . . . . . . D-11
D.2 Marine Corps Reserve AFQT Distributions for 1980and 1997 Scales (continued) . . . . . . . . . . . . . . . D-13
D.3 Subgroup Qualification Rates (Marine Corps Regular) D-14D.4 Subgroup Qualification Rates (Marine Corps Reserve) D-15D.5 Gender Qualification Rates (Marine Corps Regular) . D-16D.6 Gender Qualification Rates (Marine Corps Reserve) . D-17D.7 Subgroup Qualification Distributions (Marine Corps
Regular) . . . . . . . . . . . . . . . . . . . . . . . . . . D-18D.8 Subgroup Qualification Distributions (Marine Corps
Reserve) . . . . . . . . . . . . . . . . . . . . . . . . . . D-19D.9 Gender Qualification Distributions (Marine Corps Reg-
ular) . . . . . . . . . . . . . . . . . . . . . . . . . . . . D-20

x LIST OF TABLES
D.10 Gender Qualification Distributions (Marine Corps Re-serve) . . . . . . . . . . . . . . . . . . . . . . . . . . . D-21
E.1 Transformation of AFQT 1997 to 1980 Scale . . . . . . E-2E.1 Transformation of AFQT 1997 to 1980 Scale (continued)E-3E.1 Transformation of AFQT 1997 to 1980 Scale (continued)E-4
Executive Summary
The Armed Services Vocational Aptitude Battery (ASVAB) is a vitalcomponent of the United States Military selection and classificationsystem. It allows the Services to select and maintain a highly able andtrained fighting force. The ASVAB allows Military policy plannersto compare the cognitive level of today’s force with forces of yearspast, to set target qualification levels, and to anticipate future trendsin military needs and civilian supply (Maier, 1993).Over the past two decades the meaning and interpretation at-
tached to scores on the existing ASVAB scale (developed from datacollected in 1980) have become dated and potentially misleading. Asillustrated in the body of this report, a score of 50 on the ArmedForces Qualification Test (AFQT) no longer represents the medianscore of the current youth population. The aptitude levels of Ameri-can youth have changed in important ways over the last two decades,ways which should be reflected in a revised score scale if Militaryplanners are to accurately interpret the cognitive level of applicantsand accessions relative to the current American youth population.This has prompted the development of a new ASVAB score scale(termed the 1997 Score Scale) based on a recent national Profile ofAmerican Youth (PAY97).The PAY97 consists of a nationally representative sample of about
6,000 American youths aged 18—23, with oversamples of Hispanic and

xii 1. Executive Summary
Black youths. These youths were identified from a screening of over90,000 housing units. In the summer and fall of 1997, the comput-erized adaptive testing version of the ASVAB was administered tostudy participants under standardized conditions.This report provides details of the score-scale development based
on the PAY97 data collection study. It also provides an evaluationof the potential effects of the new scale on qualification rates of Mili-tary applicants (and particular subgroups of applicants). The closingsection provides a discussion of several implementation options af-fecting the numbers of qualified applicants and the quality of Militaryaccessions.

1Introduction
The Armed Services Vocational Aptitude Battery (ASVAB) is a vitalcomponent of the United States Military selection and classificationsystem. It allows the Services to select and maintain a highly able andtrained fighting force. The ASVAB allows Military policy plannersto compare the cognitive level of today’s force with forces of yearspast, to set target qualification levels, and to anticipate future trendsin military needs and civilian supply (Maier, 1993).Since its introduction in the 1970s, the ASVAB has undergone
substantial changes to further enhance its usefulness as a cognitivemeasurement tool. These include changes in usage, mode of deliv-ery ( Sands, Waters, & McBride, 1997; Segall & Moreno, 1999), andin the psychometric theory behind its construction and scoring. Al-though revolutionary in nature, these changes have been introducedin a deliberate, carefully planned sequence so as to ensure constancyand interpretability of ASVAB scores. This evolutionary approach tothe ASVAB program has helped ensure that alterations affecting theintricate selection and classification system are appropriately imple-mented and have the intended beneficial effect for all stake holders.Over the past two decades the meaning and interpretation at-
tached to scores on the existing ASVAB scale (developed from datacollected in 1980) have become dated and potentially misleading. Asillustrated in the body of this report, a score of 50 on the Armed

2 1. Introduction
Forces Qualification Test (AFQT) no longer represents the medianscore of the current youth population. The aptitude levels of Ameri-can youth have changed in important ways over the last two decades,ways which should be reflected in a revised score scale if Militaryplanners are to accurately interpret the cognitive level of applicantsand accessions relative to the current American youth population.This has prompted the development of a new ASVAB score scale(termed the 1997 Score Scale) based on a recent national Profile ofAmerican Youth (PAY97).Although the motivation behind the score-scale revision is straight-
forward, the technical details are complex, partly because of the waydata for the study were collected, and partly because of the way theASVAB has evolved over the last quarter-century. Data for the 1980norming study (Frankel & McWilliams, 1981; Maier & Sims, 1986)were collected on a paper-and-pencil (P&P) version of the ASVAB,where scores were based on the number of correct answers. Datafor the 1997 norming study (Moore, Pedlow, & Wolter, 1999) werecollected on a computerized adaptive testing (CAT) version of theASVAB, where scores are based on item response theory (Lord, 1980;van der Linden & Glas, 2000; Wainer, 2000). These changes in modeof delivery (from P&P to CAT) and psychometric theory (from clas-sical test theory to item response theory) add a layer of complexityto the development and evaluation of a new score scale.Another layer of complexity is added by the mixed mode of ASVAB
administration: The ASVAB is currently administered in two dif-ferent modes (CAT and P&P), and there exist multiple operationalforms of each. All scores from all forms of both modes must be placedon the new scale [even though only one form (Form 04D) of one mode(CAT) was administered in the norming data collection study]. Onceplaced on the new score scale, the consequences of doing so must alsobe evaluated for all operational ASVAB forms, including CAT andP&P versions.This report provides details of the score-scale development based
on the PAY97 data collection study. It also provides an evaluationof the potential effects of the new scale on qualification rates of Mili-tary applicants (and particular subgroups of applicants). The closingsection provides a discussion of several implementation options af-fecting the numbers of qualified applicants and the quality of Militaryaccessions.

1.1 1997 American Youth Population 3
1.1 1997 American Youth Population
The data used for the construction of the ‘97 score scale was collectedas part of the Profile of American Youth 1997 (PAY97) study. Tech-nical details of this study are provided by Moore et al. (1999). Thenationally representative sample consisted of about 6,000 Americanyouths aged 18—23, with oversamples of Hispanic and Black youths.These youths were identified from a screening of over 90,000 hous-ing units. In the summer and fall of 1997, the CAT version of theASVAB (CAT-ASVAB, Form 04D) was administered to study par-ticipants under standardized conditions at Sylvan Learning Centers.(Sylvan Learning Centers during this period also administered otherhigh-stakes computerized tests, such as the CAT-GRE.)Since the probability of sample inclusion differed among partici-
pants (i.e., was based on geographic and racial characteristics), caseweights were required for use in the analysis of the PAY97 data(Moore et al., 1999). These weights, in principle, enable the unbi-ased estimation of test-score statistics. The development of the finalset of weights for the PAY97 sample is described by MaCurdy andVytlacil (2003). In addition to providing adjustments for sample in-clusion probability, these weights also provide adjustments for short-falls or under representation in the numbers of respondents fallinginto key groups defined by age, race, gender, and education.
1.2 The Armed Services Vocational AptitudeBattery
The computerized adaptive testing (CAT) version (Form 04D) of theASVAB was administered to PAY97 study participants. This ver-sion uses adaptive Bayesian item selection and scoring rules basedon item response theory (Segall, Moreno, Bloxom, & Hetter, 1997).Similar to its P&P counterpart administered in the PAY80 study,the CAT-ASVAB includes subtests designed to measure aptitudesspanning math, verbal, technical, and spatial dimensions. These sub-tests (listed in order of administration) are provided in Table 1.1,along with their abbreviations. Psychometric properties of the CAT-ASVAB are detailed by Segall, Moreno, and Hetter (1997). Exten-sive empirical work detailing comparisons between the CAT-ASVABand P&P-ASVAB is reported by Hetter, Segall, and Bloxom (1997);

4 1. Introduction
Moreno and Segall (1997); Segall (1997); and Wolfe, Moreno, andSegall (1997).
1.3 Related Work
This report is just one of several planned works describing the out-come of the PAY97 research effort. Bock and Zimowski (in prepa-ration) will provide a detailed account of demographic influences onASVAB test performance and analyze score trends based on earlierwork conducted with the PAY80 sample (Bock & Moore, 1984). Inaddition, ASVAB norms for the Student Testing Program (STP) arealso under development (Sims, in preparation). These STP analy-ses will rely on ASVAB data collected from a substantially differentgroup of respondents whose test data were collected concurrentlywith PAY97 study participants. These data will be used to developASVAB norms for 10th, 11th, and 12th grade high school studentsfor use in the ASVAB Career Exploration Program.
1.4 Report Outline
Details of the development and evaluation of the 1997 score scaleare provided in the remaining sections of this document. The reportdescribes five principle steps in the construction and evaluation ofthe 1997 Score Scale:
2. ‘97 Score Scale Development
This section describes the development of the ‘97 score scale.The degree of shift between ‘80 and ‘97 score scales is ex-amined, and subtest standard score conversions are presentedalong with the percentile calculations for the AFQT. In ad-dition, development outcomes are provided for those Services(Air Force, Marine Corps, and Army) that attach a referencepopulation interpretation to their composite score scales.
3. Test Form Equating
This section provides transformations that enable the compu-tation of standard scores and composites derived from thesestandard scores for all currently operational ASVAB forms.

1.4 Report Outline 5
TABLE 1.1. CAT-ASVAB CompositionSubtest Abbrev. Construct
General Science GS Knowledge of physical and biologicalsciences
Arithmetic Reasoning AR Ability to solve arithmeticword problems
Word Knowledge WK Ability to select the correct meaningof words presented in context and toidentify best synonym for a given word
Paragraph Comprehension PC Ability to obtain information fromwritten passages
Mathematics Knowledge MK Knowledge of high school mathemat-ics principles
Electronics Information EI Knowledge of electricity andelectronics
Auto Information AI Knowledge of automobile terminologyand technologies
Shop Information SI Knowledge of tools and shop terminol-ogy and practices
Mechanical Comprehension MC Knowledge of mechanical and physicalprinciples
Assembling Objects AO Ability to figure out how an object willlook when its parts are put together

6 1. Introduction
Details of the equating process of existing operational forms tothe CAT-ASVAB reference form are provided.
4. Enlistment Impact
This section describes the impact of the ‘97 score scale onAFQT qualification rates. It also describes the process usedto equate the two scales and the consequences of adjustingthe ‘97 cut scores downward to maintain qualification-rate andclassification agreement across the ‘80 and ‘97 scales. The ef-fects of the new score scale on subgroup qualification rates ispresented, along with the possibility and consequence of usingalternate definitions of AFQT Category boundary levels.
5. Qualification Impact
This section describes the impact of the ‘97 score scale onService classification composite qualification rates. The con-sequences of applying cut scores developed on the ‘80 scaleto composite scores reported on the ‘97 scale are evaluated.In addition, an equating (allowing equal percentages of appli-cants to qualify across ‘80 and ‘97 scales) for each compositeis developed and presented.
6. Implementation Options
This section describes four implementation options. These op-tions differ along three dimensions: (a) AFQT score scale (i.e.,‘80 or ‘97), (b) cut or qualification score specification (basedon nominal or predictive standards), and (c) quality-goal spec-ification. Quality goals can be defined in different ways, someraising predicted performance levels and others keeping pre-dicted performance at their current levels. The effects of im-plementation options on the quality of Service accessions, andon the expected numbers of qualified applicants, are discussed.

2‘97 Score Scale Development
This chapter describes the development of the ‘97 score scale usingcase weights (developed by MaCurdy & Vytlacil, 2003) applied to thePAY97 sample. The degree of shift between ‘80 and ‘97 score scalesis examined in Section 2.1. Subtest standard score conversions arepresented in Sections 2.2 and 2.3. The percentile calculations for theArmed Forces Qualification Test (AFQT) are presented in Section2.4, while the composite scale development outcomes (for the threeServices that report composite scores on a transformed scale) aredescribed in the final section.
2.1 Relative Performance of ‘80 and ‘97 YouthPopulations
Differences between the ‘80 and ‘97 score scales will depend directlyon the degree of shift in test performance between the ‘80 and ‘97youth populations. Examining score distributions for the ‘80 and ‘97samples calculated relative to a common scale provides one approachfor assessing the shift in performance. Table 2.1 provides means (m)and standard deviations (s) for standardized subtest scores calcu-lated on the ‘80 metric for samples from both populations. Notethat different ASVAB forms were administered in each study: The

8 2. ‘97 Score Scale Development
TABLE 2.1. Subtest Statistics for PAY80 and PAY97 SamplesPAY80a PAY97b
Subtest m s m s
GS 50 10 49.784877 9.985895AR 50 10 49.912878 9.780678WK 50 10 51.023350 8.663426PC 50 10 49.779560 10.393450AS 50 10 47.420660 8.825132MK 50 10 51.623450 9.962462MC 50 10 48.357198 10.160671EI 50 10 47.245008 9.145122VE 50 10 50.655507 9.022130
Note. All statistics based on scores computedon the ‘80 scale.aForm 8A. bEquated Form 04D.
P&P-ASVAB Form 8A was administered in the ‘80 study, while theCAT-ASVAB Form 04D was administered in the ‘97 study. In or-der to place scores from the CAT-ASVAB form on the ‘80 scale, anequipercentile equating to the P&P-ASVAB Form 8A was conductedusing large samples of Military applicants.1 This equating providesa transformation of the 04D ability estimates which place them onthe ‘80 scale.Table 2.1 indicates generally equal or higher performance levels
for PAY97 youth on math and verbal tests (AR, WK, PC, MK,and VE) and lower performance levels for most technical tests (AS,MC, and EI). The new ‘97 score scale will be constructed by linearlytransforming PAY97 sample scores in a way that results in means andstandard deviations of 50 and 10, respectively. Consequently, for thePAY97 sample, average scores on the ‘97 scale would be expected toincrease (relative to the ‘80 scale) for those subtests having meansbelow 50 (GS, AR, PC, AS, MC, and EI) and decrease for those
1The equating between ASVAB forms 04D and 8A (Segall, 1999) was based on asample of 15,506 military applicants. Test forms were randomly assigned to applicants,and 04D subtest distributions were equated to the 8A reference form distributions us-ing an equipercentile approach described by Segall (1997). This equating provided atransformation that placed 04D scores on the ‘80 score scale.

2.1 Relative Performance of ‘80 and ‘97 Youth Populations 9
TABLE 2.2. AFQT Distributions for PAY80 and PAY97 SamplesAFQT Categories Percentagea
Label Range Nominal % PAY80 PAY97
I 93—99 7.5 7.9 7.6II 65—92 28 28.2 29.1
IIIA 50—64 15 15.3 16.9IIIB 31—49 19 18.3 21.1IVA 21—30 10 10.3 10.6IVB 16—20 5 4.9 4.8IVC 10—15 6 5.8 4.2V 1—9 9.5 9.3 5.8
aAFQT scores reported on the ‘80 scale.
subtests having means above 50 (WK, MK, and VE). Note thatthese same trends in average scores across scales are likely to holdfor other groups scored according to both scales.Table 2.2 displays AFQT distributions calculated from scores on
the ‘80 metric for both the PAY80 and PAY97 samples. These distri-butions are expressed in terms of AFQT categories which divide therange of scores based on percentile boundaries. The third column ofTable 2.2 lists the nominal (i.e., definitional) percentage in each cat-egory. For example, Category II is defined to include AFQT scoresin the range 65—92, which is defined to include 28% of the popula-tion (since the AFQT is defined as percentile scores relative to thepopulation). The fourth column provides the actual percentage ofthe PAY80 distribution falling in each category. In principle, theseshould equal the nominal values, but in practice they differ slightlybecause of the coarseness of the score scale. The last column liststhe percentage of the PAY97 sample that falls within each category,using AFQT scores defined on the ‘80 scale.As indicated in Table 2.2, the largest difference between distri-
butions occurs over the lower AFQT ranges (Categories IVC andV). In the PAY97 population, there are five percent fewer youthfalling in these lower ranges and more youth falling in higher-levelcategories (II, IIIA, and IIIB). The AFQT performance level is, ingeneral, higher for the PAY97 sample (m = 52.3, s = 27.3) than forthe PAY80 sample (m = 50.4, s = 28.9). This difference has impli-

10 2. ‘97 Score Scale Development
TABLE 2.3. PAY97 Sample Moments(Form 04D)Subtest µ̂ σ̂
GS 0.087593 0.866291AR 0.141784 0.867399WK 0.198510 0.906387PC 0.333026 0.809597AI −0.393601 0.705060SI −0.459142 0.771343MK 0.373530 0.997426MC −0.096266 0.771736EI −0.105092 0.906286AO −0.026450 0.967038
cations for (a) the construction of the new score scale, and (b) howscores on the ‘80 and ‘97 scales will compare for a given group. Thenew AFQT ‘97 score scale will be constructed by assigning percentilescores in a way that results in a mean percentile score of about 50.Consequently, for the PAY97 sample, average AFQT scores on the‘97 scale would be expected to decrease (relative to the ‘80 scale)from about 52.3 to about 50.0. The impact of this decrease on en-listment qualification rates is examined in Section 4.
2.2 Subtest Standard Score Conversions
Subtest standard scores are defined as linearly transformed subtestscores θ̂. Unrounded standard scores are defined to have a mean of50 and a standard deviation of 10 in the PAY97 sample and can becomputed by
Sk = 10
"θ̂(k) − µ̂(k)
σ̂(k)
#+ 50 , (2.1)
where the super/subscript k refers to the kth subtest, k ∈ (GS,AR, WK, PC, AI, SI, MK, MC, EI, AO), and µ̂(k) and σ̂(k) are themean and standard deviation of the subtest scores θ̂ calculated inthe PAY97 sample. These sample moments are listed in Table 2.3.

2.2 Subtest Standard Score Conversions 11
TABLE 2.4. Form 04D Standard ScoreTransformation ParametersSubtest A-Slope B-Intercept
GS 11.543462 48.988873AR 11.528721 48.365417WK 11.032817 47.809880PC 12.351821 45.886521AI 14.183186 55.582509SI 12.964407 55.952500MK 10.025804 46.255061MC 12.957792 51.247394EI 11.034039 51.159592AO 10.340850 50.273512
Given numerical values for the sample subtest moments, (2.1) sim-plifies to
Sk = A(k)4 θ̂
(k)+B
(k)4 , (2.2)
where A(k)4 and B(k)4 denote the slope and intercept values respec-
tively. Note the subscript “4” denotes values specific to the referenceform 04D. (Transformation parameters for other forms are consid-ered in Section 3.3.) Slope and intercept values are provided in Table2.4.In practice, standard scores are rounded to the nearest integer,
S̆k = Rnd (Sk) ,
where the function Rnd () denotes the rounding (up or down) to thenearest integer value. Unlike the ‘80 standard score computationalformulas, the range of standard scores is not truncated at 20 or 80(three standard deviations from the mean).2
2Truncation was performed for the ‘80 score scale primarily to regress highly unre-liable number-correct scores occurring over the lower range (where guessing is likely tooccur) up towards the mean. On the ‘97 scale, this truncation is unnecessary because anallowance for guessing is incorporated into the three parameter logistic scoring model,and because in instances of low precision, scores are appropriately regressed towards themean by the use of a Bayesian prior.

12 2. ‘97 Score Scale Development
2.3 Verbal and Auto-Shop Composites
For the ‘80 scale, the Verbal (VE) composite was formed from thestandardized unit weighted sum XWK+XPC of number-right scores,where XWK denotes the number-correct score on the 35-item WKtest, and XPC denotes the number-correct score on the 15-item PCtest. Although the number-right scores were equally weighted, theirrelative contribution to the sum (in terms of percent of varianceaccounted for) is not equal. This is due primarily to the fact thatthe test length for PC is shorter than the WK test length. The PCvariance is restricted by its shorter test length. Consequently, on the‘80 scale, PC accounts for less of the variance in the VE compositethan does WK, and in effect receives a smaller weight. Note thatthis smaller weight for PC is desirable because of PC’s relatively lowreliability.To maximize the agreement in relative PC/WK weighting across
‘80 and ‘97 scales, the VE composite on the ‘97 scale was formedfrom an optimally weighted composite of unrounded WK and PCstandard scores. The optimal weights were specified from the leastsquares regression of the VE standard score (computed relative tothe ‘80 metric) on SWK and SPC (unrounded standard scores onthe ‘97 metric). The ratio of the least-squares regression weightsbPC/bWK = 0.61934 indicates that SPC received about two-thirds theweight of SWK in the optimal prediction. Using this relative weight,the weighted composite SWK + 0.61934 × SPC was standardized tomean 50 and standard deviation 10. The resulting score can be ex-pressed as the weighted composite of WK and PC ability estimatesgiven by
SVE = (7.225587) θ̂(WK)4 + (5.010103) θ̂
(PC)4 + 46.897156 . (2.3)
The transformation parameters for the Auto Shop (AS) compositewere formed by standardizing the equal weighted3 sum of unroundedAI and SI standard scores SAI + SSI. The weighted composite of AIand SI ability estimates is given by
SAS = (7.648241) θ̂(AI)4 + (6.991018) θ̂
(SI)4 + 56.220220 , (2.4)
3The rationale for equal weighting is based on the P&P-ASVAB reference Form 8Atest specifications. These test specifications for the Auto-Shop subtest call for roughlyequal numbers of auto and shop items, with the two content areas having similar IRTinformation profiles.

2.4 Armed Forces Qualification Test 13
where SAS has mean 50 and standard deviation 10 in the PAY97sample, and where SAI and SSI are equally weighted components ofthe composite.Note that integer-valued counterparts of (2.3) and (2.4), S̆VE and
S̆AS, will be used operationally. These are obtained by rounding SVEand SAS to the nearest integer.
2.4 Armed Forces Qualification Test
The Armed Forces Qualification Test (AFQT) scores are calculatedfrom a linear combination of math and verbal standardized subtestscores:4
AFQTS = S̆AR + S̆MK + 2S̆VE .
The AFQT scores are reported on a percentile metric, where AFQT%represents the percentage of applicants scoring at or below the givenscore AFQTS :
AFQT% (AFQTS) = Rnd
100 AFQTSXx=1
f(x)
, (2.5)
where f(x) is the discrete probability density function for the com-posite distribution AFQTS in the ‘97 sample.Table 2.5 displays the conversion between the sum of subtest stan-
dard scores AFQTS (columns 1 and 5) and the percentile scoreAFQT% (columns 4 and 8). The percent scoring at each level [i.e.,f(AFQTS)] is displayed in columns 2 and 6, and the percent scor-ing at or below [i.e., the quantity in the right-hand side brackets of(2.5)] is displayed in columns 3 and 7. The integer-valued percentilescores AFQT% (columns 4 and 8) were calculated by rounding thecumulative percentile values (columns 3 and 7) up or down to thenearest integer. Rounded percentile scores of zero were set equal to1; rounded percentile scores of 100 were set equal to 99. (This sameconvention was used in AFQT percentile calculations for the ‘80 scorescale.)
4This same formula was used to calculate AFQT scores on the ‘80 metric.

14 2. ‘97 Score Scale Development
TABLE 2.5. ‘97 AFQT Percentile ConversionCum. Cum.
AFQTS % % AFQT% AFQTS % % AFQT%≤109 0.02 1.39 1 150 0.31 9.21 9110 0.15 1.54 2 151 0.19 9.41 9111 0.12 1.66 2 152 0.51 9.91 10112 0.10 1.76 2 153 0.42 10.33 10113 0.05 1.81 2 154 0.42 10.75 11114 0.05 1.85 2 155 0.37 11.12 11115 0.15 2.00 2 156 0.37 11.49 11116 0.03 2.04 2 157 0.67 12.16 12117 0.10 2.14 2 158 0.49 12.65 13118 0.20 2.34 2 159 0.65 13.30 13119 0.38 2.72 3 160 0.67 13.97 14120 0.19 2.92 3 161 0.64 14.61 15121 0.13 3.05 3 162 0.50 15.11 15122 0.10 3.15 3 163 0.63 15.74 16123 0.07 3.22 3 164 0.50 16.24 16124 0.15 3.36 3 165 0.36 16.60 17125 0.18 3.54 4 166 0.61 17.20 17126 0.15 3.69 4 167 0.74 17.94 18127 0.04 3.73 4 168 0.63 18.57 19128 0.10 3.83 4 169 0.79 19.37 19129 0.12 3.95 4 170 0.81 20.17 20130 0.12 4.07 4 171 0.49 20.66 21131 0.15 4.23 4 172 0.90 21.56 22132 0.05 4.27 4 173 0.42 21.98 22133 0.20 4.47 4 174 0.84 22.82 23134 0.12 4.59 5 175 0.89 23.71 24135 0.33 4.93 5 176 1.00 24.71 25136 0.19 5.12 5 177 0.66 25.37 25137 0.21 5.33 5 178 0.85 26.22 26138 0.37 5.70 6 179 0.85 27.07 27139 0.20 5.90 6 180 1.11 28.18 28140 0.24 6.14 6 181 1.13 29.31 29141 0.18 6.32 6 182 0.85 30.15 30142 0.38 6.70 7 183 0.80 30.95 31143 0.25 6.95 7 184 0.81 31.76 32144 0.28 7.22 7 185 0.93 32.69 33145 0.20 7.43 7 186 0.98 33.67 34146 0.30 7.72 8 187 0.90 34.58 35147 0.41 8.13 8 188 0.85 35.42 35148 0.44 8.57 9 189 1.05 36.47 36149 0.33 8.90 9 190 1.17 37.64 38

2.4 Armed Forces Qualification Test 15
TABLE 2.5. ‘97 AFQT Percentile Conversion (continued)Cum. Cum.
AFQTS % % AFQT% AFQTS % % AFQT%191 1.36 39.00 39 231 0.93 79.81 80192 1.12 40.12 40 232 0.94 80.75 81193 1.04 41.15 41 233 0.77 81.52 82194 0.95 42.10 42 234 0.81 82.34 82195 1.19 43.29 43 235 0.74 83.07 83196 1.05 44.33 44 236 0.76 83.83 84197 0.79 45.13 45 237 0.75 84.57 85198 1.07 46.19 46 238 0.54 85.12 85199 0.95 47.14 47 239 0.93 86.04 86200 0.65 47.80 48 240 0.71 86.76 87201 1.14 48.93 49 241 0.92 87.67 88202 0.84 49.77 50 242 0.55 88.23 88203 1.32 51.09 51 243 0.74 88.97 89204 0.84 51.93 52 244 0.82 89.79 90205 0.96 52.89 53 245 0.59 90.38 90206 1.14 54.04 54 246 0.59 90.97 91207 1.18 55.22 55 247 0.58 91.55 92208 1.07 56.29 56 248 0.59 92.14 92209 1.15 57.44 57 249 0.52 92.66 93210 1.10 58.54 59 250 0.37 93.04 93211 0.96 59.50 60 251 0.32 93.35 93212 1.44 60.94 61 252 0.46 93.82 94213 1.28 62.22 62 253 0.50 94.32 94214 1.14 63.36 63 254 0.39 94.70 95215 1.12 64.48 64 255 0.19 94.90 95216 1.02 65.50 66 256 0.32 95.21 95217 1.23 66.73 67 257 0.37 95.58 96218 0.80 67.53 68 258 0.37 95.95 96219 1.04 68.57 69 259 0.45 96.39 96220 1.01 69.58 70 260 0.34 96.73 97221 0.79 70.37 70 261 0.16 96.89 97222 1.03 71.40 71 262 0.34 97.24 97223 0.95 72.35 72 263 0.23 97.47 97224 0.97 73.32 73 264 0.20 97.67 98225 1.16 74.49 74 265 0.29 97.96 98226 0.77 75.26 75 266 0.11 98.06 98227 1.13 76.39 76 267 0.25 98.31 98228 0.89 77.28 77 268 0.14 98.45 98229 0.91 78.19 78 ≥269 0.07 98.52 99230 0.69 78.88 79

16 2. ‘97 Score Scale Development
2.5 Service Classification Composites
Service classification composites are used to aid in the assignment ofapplicants to jobs within the Military. These composites are formedfrom sums of weighted subtest standard scores. In contrast to theNavy, the Air Force, Marine Corps, and Army each report compositescores on standardized or percentile scales that have interpretationsattached to the youth population.5 For each of the three Services,the development of composite scales for the ‘97 youth population isdescribed below.
2.5.1 Air Force
The Air Force computes four classification composites: Mechanical(M), Administrative (A), General (G), and Electrical (E). Thesecomposites are formed from unit-weighted sums of standardized sub-test scores:
MS = S̆AR + S̆MC + S̆AS + 2S̆VEAS = S̆MK + S̆VEGS = S̆AR + S̆VEES = S̆GS + S̆AR + S̆MK + S̆EI
As with the AFQT score, these composites are reported on a per-centile metric, where M%, A%, G%, E% represent the percentageof applicants scoring at or below the weighted sum of standardizedsubtest scores represented by MS , AS , GS, ES , respectively. The con-version to percentile scores was conducted using the same approachdescribed for the AFQT composite. (See Section 2.4 for additionaldetails.)Tables C.1 through C.4 display the conversion between the sum of
subtest standard scores (columns 1 and 5) and the percentile scores(columns 4 and 8). The percent scoring at each level is displayed incolumns 2 and 6, and the percent scoring at or below is displayedin columns 3 and 7. For each composite (M%, A%, G%, E%), theinteger-valued percentile scores (columns 4 and 8) were calculatedby rounding the cumulative percentile values (columns 3 and 7) upor down to the nearest integer.
5The Navy reports their composite scores on a raw unaltered scale (as simply theunit-weighted sum of subtest standard scores).

2.5 Service Classification Composites 17
2.5.2 Marine Corps
The Marine Corps reports composite scores on a scale with mean100 and standard deviation 20. Transformations for four classifica-tion composites were estimated, including Mechanical (MM), Gen-eral Technical (GT), Electrical (EL), and Clerical (CL).6 The un-standardized composite scores (denoted by MMS , GTS, ELS, CLS)are computed from a unit weighted linear combination of select sub-test scores:
MMS = S̆AR + S̆MC + S̆EI + S̆ASGTS = S̆AR + S̆MC + S̆VEELS = S̆GS + S̆AR + S̆MK + S̆EICLS = S̆MK + S̆VE
The first two moments of the unstandardized composite distribu-tions are provided in Table 2.6. These moments (mean µ and stan-dard deviation σ) define the standardized composite score
C = Rnd·20
µCS − µCS
σCS
¶+ 100
¸, (2.6)
where C ∈ (MM, GT, EL, CL), Rnd() denotes rounding to the near-est integer, and µCS and σCS denote the mean and standard devia-tion of the unstandardized score for composite C provided in Table2.6. Given numerical values of µCS and σCS , (2.6) simplifies to alinear transformation of unstandardized composite scores:
MM = Rnd(0.588215 × MMS − 17.645724)GT = Rnd(0.755294 × GTS − 13.289535)EL = Rnd(0.577992 × ELS − 15.599795)CL = Rnd(1.092264 × CLS − 9.232992)
These transformations can be used to place the unstandardized com-posite scores on a scale with mean 100 and standard deviation 20 inthe ‘97 reference population.
6Although the CL composite was not used operationally by the Marine Corps at thetime of writing, it was included in the analysis in anticipation of its eventual use.

18 2. ‘97 Score Scale Development
TABLE 2.6. Moments of UnstandardizedMarine Corps Composite DistributionsUnstandardized MomentsComposite µ̂ σ̂
MMS 200.0046 34.0012GTS 149.9939 26.4797ELS 200.0024 34.6026CLS 100.0060 18.3106
2.5.3 Army
The Army calculates a total of ten classification composites. Onecomposite is calculated from integer-weighted subtest scores, whilethe other nine are calculated from non-integer weights. The approachfor deriving new ‘97 scale weights is described separately for integer-and non-integer weighted composites.
Integer-Weighted Composite
The Army reports its General Technical (GT) composite scores ona scale with mean 100 and standard-deviation 20. The process ofstandardization for this composite is the same as the process usedfor the Marine Corps composites (Section 2.5.2). The unstandardizedcomposite score (denoted by GTS) is computed from a unit-weightedlinear combination of AR and VE subtest scores:
GTS = S̆AR + S̆VE .
The first two moments of the distribution of unstandardized com-posite scores are µ̂ (GTS) = 100.0135 and σ̂ (GTS) = 18.6169. Thesemoments can be used to define the standardized composite scoregiven in Equation 2.6. Given these moments, the linear transforma-tion of unstandardized composite scores simplifies to
GT = Rnd (1.074292×GTS − 7.443781) .This transformation places the unstandardized composite score on ascale with mean 100 and standard deviation 20 in the ‘97 referencepopulation.
Non-integer Weighted Composites
The Army calculates nine classification composites from non-integerweighted linear combinations of eight ASVAB standard scores. These

2.5 Service Classification Composites 19
composites, calculated from subtest scores on the ‘80 scale, are in-tended to provide optimal prediction of success in training. (See Ta-ble A.1.)The composite calculations on the ‘80 scale can be represented in
matrix notation by
c(80) = B(80)s(80) + u(80) , (2.7)
where c(80) is a 9 × 1 vector of composite scores, B(80) is a 9 × 8matrix of weights, s(80) is the 8 × 1 vector of standardized subtestscores s(80)GS , ..., s
(80)VE , and u
(80) is a 9 × 1 vector of intercept terms.Note that B(80), s(80), and u(80) were all derived previously for usewith standard scores s(80) on the ‘80 metric, and that the resultingcomposite scores c(80) have mean 100 and standard deviation 20 inthe ‘80 youth population.Given that standard scores on the ‘80 scale can be expressed as
linear transformations of scores on the ‘97 scale (denoted by s(97)),we have the relation:
s(80) = As(97) + d , (2.8)
where A is an 8× 8 diagonal matrix of slope parameters, and d is a8×1 vector of intercept parameters. Then, by substituting (2.8) into(2.7), a new set of transformations (that can be applied directly tos(97)) can be derived to produce values identical to c(80) (previouslycalculated from standard scores s(80) on the ‘80 scale):
c(80) = B(80)³As(97) + d
´+ u(80)
= B(80)As(97) +B(80)d+ u(80) . (2.9)
A final set of composite weights can be derived in such a way as toproduce composite scores c(97) with mean 100 and standard devia-tion 20 in the ‘97 youth population, and to retain the same optimal-prediction qualities shared by those composite scores reported on the‘80 scale (i.e., c(80)). This can be accomplished from the transforma-tion
c(97) = 20×V−1/2³c(80) −µc(80)
´+ 100× 19 , (2.10)
where µc(80) is a 9 × 1 vector of means of composite scores c(80)in the ‘97 youth population, V is a 9 × 9 diagonal matrix of c(80)

20 2. ‘97 Score Scale Development
TABLE 2.7. Army Composite Weights (‘97 Metric)GS AR MK MC EI AS VE Constant
CL .00000 .75179 .58715 .11541 .07756 .07489 .67976 −14.32772CO .19868 .33090 .63397 .38486 .19979 .41161 .30347 −23.17105EL .08324 .44254 .49064 .26341 .30258 .36786 .49906 −22.46667FA .15031 .42263 .60172 .42966 .16389 .35866 .31958 −22.32119GM .23521 .46357 .45285 .29280 .30216 .50542 .21527 −23.36174MM .05942 .32829 .28517 .39607 .30796 .87309 .21150 −23.08481OF .14306 .53676 .34092 .36843 .19683 .50334 .36757 −22.84882SC .01235 .42812 .63650 .25070 .32194 .24636 .52770 −21.18951ST .12865 .49010 .47825 .31207 .14493 .21736 .62177 −19.65219
variances in the ‘97 youth population, and 19 is a 9× 1 vector of 1s.Substituting (2.9) into the right-hand side of (2.10) and simplifying,we have
c(97) = 20×V−1/2³B(80)As(97) +B(80)d+ u(80) − µc(80)
´+(100× 19)
= 20×V−1/2B(80)As(97)+20×V−1/2
³B(80)d+ u(80) − µc(80)
´+ (100× 19)
= B(97)s(97) + u(97) (2.11)
whereB(97) = 20×V−1/2B(80)A (2.12)
and
u(97) = 20×V−1/2³B(80)d+ u(80) − µc(80)
´+ (100× 19) . (2.13)
That is, the transformation with slope and intercept parametersB(97) and u(97) can be applied directly to standard scores on the‘97 scale s(97) to maintain the optimality of the non-integer weights(originally calculated from standard scores reported on the ‘80 scale).These updated transformations (2.12) and (2.13) provide compositescores c(97) that have mean 100 and standard deviation 20 in the ‘97youth population. These values are provided in Table 2.7.Note that the slope A and intercept d parameters were estimated
by linearly equating ‘97 subtest standard scores to the ‘80 scale us-ing subtest moments estimated from the PAY97 sample. Because therelation between scores on the two scales is slightly non-linear (near

2.5 Service Classification Composites 21
the extremes of the scale for CAT-ASVAB), composite scores c(80)
and c(97) calculated by (2.7) and (2.11) will not be exact linear trans-formations of one another. The level of agreement between optimallyweighted scores calculated on the ‘80 and ‘97 metrics is assessed inSection 5.
2.5.4 Navy
Unlike the other Services, the Navy does not report their compos-ite scores on a transformed scale that attaches a special meaning toreported scores (a meaning based on performance levels of the norm-ing population). Rather, the Navy reports their scores directly as the“sum of standardized subtest scores.” Consequently, it is unnecessaryto calculate 1997 transformations for Navy composites.

22 2. ‘97 Score Scale Development

3Test Form Equating
3.1 Background
Section 2 provides transformations that enable the computation of(a) standard scores, and (b) composites derived from these standardscores. However, these transformations are only appropriate for theCAT-ASVAB reference Form 04D. Before the new score scale canbe applied to other operational test forms, these forms had to beequated to the CAT-ASVAB reference form (04D) which was ad-ministered in the PAY97 Norming Study.Historically, ASVAB forms have been equated to the existing ref-
erence form (P&P-8A) using an equipercentile approach (Kolen &Brennan, 1995) applied separately to each subtest. These subtestequatings have proven sufficient to provide nearly equivalent Serviceclassification composite distributions across alternate forms.Beginning in January 2002, however, a new scoring method, based
on item response theory (IRT),1 was implemented for P&P-ASVABforms 25A, 25B, 26A, and 26B. With this approach, ability esti-mates are based on item response functions that have been placedon a common metric and have been estimated from large opera-
1This IRT-based method assigns scores based on the mode of the posterior densityfunction.

24 3. Test Form Equating
tional samples. This allows IRT scores produced from alternate P&Pforms to be treated as interchangeable without the need for a specialequating. In a sense, the form-specific equatings associated with theprevious number-right-based forms became unnecessary, since in thecontext of IRT, the ability estimates are interchangeable across dif-ferent sets of items.2 The equivalence of the IRT-based subtest andcomposite distributions across P&P forms was verified using datacollected from operational administrations of these forms (Segall &Thomasson, 2001).Although CAT-ASVAB forms also provide IRT-based ability es-
timates (which should in principle be interchangeable), historicallythese forms have been separately equated. Several factors contributedto the decision to use form-specific equating functions, including:
• CAT-ASVAB parameters were estimated from data collectedin paper-based, rather than computer-based, presentations.
• Calibration data were collected in non-operational administra-tions.
• Parameters of different forms were estimated from differentpopulations and under different levels of motivation.
• CAT-ASVAB has shorter test lengths than P&P-ASVAB, soa handful of poorly specified item response functions (IRFs)might have a large effect on score distributions.
• Some parameter estimates may have drifted over time; someestimates were obtained from data collected in the early 1980s.
The equating approach taken here attempts to rely more heav-ily on the invariance property of IRT ability estimates, and at thesame time address concerns about the potential difference amongforms in the distributions of IRT-based test scores. For this study,CAT-ASVAB forms were equated to the reference form using a linearmethod which matches the first two moments of the distribution ofthe estimated ability parameters θ̂. Provided the θ̂ distributions of
2 In fact, this is the fundamental feature of IRT that makes computerized adaptivetesting possible.

3.2 Data 25
the two forms have the same shapes, the linear equating should pro-vide a more accurate equating than the more complex and demand-ing equipercentile approach. (In addition, the linear equating methodis, of course, a more parsimonious approach than the equipercentileapproach.) To the extent that the distributions do not have similarshapes, the linear equating method can result in forms which exhibitdifferent qualification rates. The adequacy of the linear approach inthis regard is evaluated in Section 3.4.For the P&P-ASVAB forms, a single linear equating was esti-
mated between the set of four forms (25A, 25B, 26A, 26B) andthe CAT-ASVAB reference form 04D. (Ability estimates among theP&P forms are treated as interchangeable, as is currently done onthe ‘80 scale.) This linear equating addresses two issues. First, theP&P-ASVAB and CAT-ASVAB IRFs are not currently on a com-mon metric. In a sense, the linear equating helps ensure that theP&P ability estimates are placed on a metric comparable to theCAT reference form 04D. Second, the linear equating between test-score distributions helps match the CAT and P&P distributions ina way that strict IRT linking does not. That is, the linear equatingbetween test-score distributions is appropriately influenced by pos-sible IRF and ability-parameter mis-specification in either the CATor P&P versions.
3.2 Data
The Enlistment Testing Program currently consists of three CAT-ASVAB forms (01D, 02D, and 03D) and four P&P forms (25A, 25B,26A, 26B). Data used for the equating of these forms were takenfrom three sources listed in Table 3.1. Applicants in the Initial Op-erational Test and Evaluation (IOT&E) Study (Segall, 1999) wererandomly assigned to Forms 03D or 04D. These data were used toderive the equating between forms 03D and 04D. The CY2001 sam-ple consisted of applicants taking operational CAT-ASVAB duringthe calendar year 2001. The groups taking each form are randomlyequivalent (due to the random assignment of applicant to form en-sured by the test administration software). These data were used toderive equatings of forms 01D and 02D to the scale of 03D. (Usinga chaining process described below, these transformations were thencombined with those estimated from the IOT&E Study to provide

26 3. Test Form Equating
TABLE 3.1. Data Sources and Sample Sizes for Form EquatingForm
Source 01D 02D 03D 04D 25B TotalIOT&E Study 7,496 7,752 15,248CY2001 Sample 92,206 97,139 97,304 286,649Anchoring Study 6,232 5,955 12,187
direct transformations of 01D and 02D to the 04D scale. Finally,applicants in the Anchoring Study (Segall, 2000) were randomly as-signed to CAT-ASVAB Form 04D or P&P-ASVAB Form 25B. Thesedata formed the basis of the P&P-ASVAB (25A, 25B, 26A, 26B) to04D equating transformations.
3.3 Equating and Standard-Score Transformations
Subtest and composite (i.e., VE and AS) standard-score transforma-tions can be derived separately for each ASVAB form. These trans-formations take the form of those presented in Table 2.4
S(k) = A(k)4 θ̂
(k)4 +B
(k)4 , (3.1)
where S(k) denotes the unrounded standard score, θ̂(k)4 denotes the
subtest ability estimate, and A(k)4 and B
(k)4 denote the slope and in-
tercept values, respectively. Note the subscript “4” denotes valuesspecific to Form 04D, and the super-subscript k refers to subtest,where k ∈ (GS, AR, WK, PC, AI, SI, MK, MC, EI, AO). Note inaddition, there are two standardized scores (VE and AS) that area linear combination of more than one ability estimate (see equa-tions 2.4 and 2.3). By accounting for differences in the first twomoments of the subtest score distributions across test forms, form-specific standard-score transformations can be developed for all op-erational ASVAB forms. These are presented below.
3.3.1 Form 03D
Form 03D subtest standard-score transformations were developedusing data from the IOT&E Study (see Table 3.1). For subtest k,
the form 03D ability estimate θ̂(k)3 can be transformed to the 04D

3.3 Equating and Standard-Score Transformations 27
TABLE 3.2. IOT&E Sample Subtest Momentsµ σ
Subtest 04D 03D 04D 03DGS 0.139031 0.178258 0.748675 0.742858AR 0.221570 0.229621 0.699826 0.729938WK 0.173454 0.166271 0.761518 0.751634PC 0.429614 0.444126 0.615121 0.647018AI −0.302564 −0.384413 0.719048 0.719639SI −0.334146 −0.253040 0.730913 0.686308
MK 0.477187 0.360997 0.802852 0.852715MC 0.087070 0.113232 0.676303 0.647970EI 0.086836 0.113929 0.856383 0.788251AO 0.157043 0.055295 0.855839 0.861201
scale by the linear equating transformation:
θ̇(k)4 =
"θ̂(k)3 − µ
(k)3
σ(k)3
#σ(k)4 + µ
(k)4 , (3.2)
where µ(k)3 , µ(k)4 , σ
(k)3 , and σ
(k)4 denote the means and standard de-
viations of forms 03D and 04D in the IOT&E sample (see Table3.2). This transformation ensures that the transformed 03D values
θ̇(k)4 will have the same mean and variance as the Form 04D abil-ity estimates in the IOT&E sample. To obtain the standard-scoretransformation
S = A(k)3 θ̂
(k)3 +B
(k)3 , (3.3)
θ̇(k)4 [the right-hand side of (3.2)] can be substituted for θ̂
(k)4 in
(3.1). Given numerical values for all the µ’s, σ’s (Table 3.2), and forA(k)4 and B(k)4 (Table 2.4), the equation simplifies to a linear transfor-
mation with slope and intercept parameters denoted by (A(k)3 , B(k)3 ).
These transformation values are provided in Table 3.3.A slightly modified approach was used to calculate the transfor-
mation parameters for the AS and VE composites. The first twomoments of the distribution of a provisional 03D VE score were cal-culated (where the standard scores for 03D were calculated accordingto the parameters provided in Table 3.3). In addition, the momentsof the 04D VE standard score distribution were calculated accordingto (2.3). Then the linear transformation that placed the provisional

28 3. Test Form Equating
TABLE 3.3. Form 03D Standard ScoreTransformation ParametersSubtest A-Slope B-InterceptGS 11.633849 48.519947AR 11.053129 48.381800WK 11.177901 47.865008PC 11.742904 45.977707AI 14.171541 56.738913SI 13.807007 55.114211MK 9.439542 47.631594MC 13.524388 50.844242EI 11.987751 50.751994AO 10.276460 51.329230
03D VE on the 04D scale was calculated and combined with the WKand PC subtest standard score transformations to provide
SAS = (7.638941) θ̂(AI)3 + (7.442444) θ̂
(SI)3 + 56.389857 (3.4)
SVE = (7.330453) θ̂(WK)3 + (4.658058) θ̂
(PC)3 + 47.015269(3.5)
The AS transformation was calculated using the same approach.
3.3.2 Form 01D
Form 01D subtest standard-score transformations were developedusing data from the CY2001 Sample (see Table 3.1). For subtest k,
the form 01D ability estimate θ̂(k)1 can be transformed to the 03D
scale by the linear equating transformation:
θ̇(k)3 =
"θ̂(k)1 − µ
(k)1
σ(k)1
#σ(k)3 + µ
(k)3 , (3.6)
where µ(k)1 , µ(k)3 , σ
(k)1 , and σ
(k)3 denote the means and standard de-
viations of forms 01D and 03D in the CY2001 sample (provided inTable 3.4). This transformation ensures that the transformed 01D
values θ̇(k)3 will have the same mean and variance as the Form 03D
ability estimates in the CY2001 sample. To obtain the standard-scoretransformation
S = A(k)1 θ̂
(k)1 +B
(k)1 ,

3.3 Equating and Standard-Score Transformations 29
TABLE 3.4. CY2001 Sample Subtest Moments (Forms 01D and 03D)µ σ
Subtest 03D 01D 03D 01DGS 0.276280 0.337502 0.743059 0.814240AR 0.331573 0.337261 0.735248 0.838488WK 0.295040 0.277547 0.756783 0.803816PC 0.541195 0.348370 0.640326 0.767887AI −0.328393 −0.270693 0.734060 0.814678SI −0.191311 −0.263687 0.698151 0.878812
MK 0.417688 0.425812 0.863611 0.826382MC 0.200854 −0.069134 0.649176 0.866200EI 0.203479 0.012895 0.798097 0.784303AO 0.181096 0.191032 0.842499 0.834607
TABLE 3.5. Form 01D Standard ScoreTransformation ParametersSubtest A-Slope B-InterceptGS 10.616822 48.150942AR 9.692200 48.777920WK 10.523853 48.242075PC 9.792186 48.921604AI 12.769181 55.541600SI 10.968650 55.365076MK 9.864793 47.373829MC 10.135894 54.261398EI 12.198591 53.033941AO 10.373640 51.208559
θ̇(k)3 [the right-hand side of (3.6)] can be substituted for θ̂
(k)3 in
(3.3). Given numerical values for all the µ’s, σ’s (Table 3.4), and forA(k)3 and B(k)3 (Table 3.3), the equation simplifies to a linear transfor-
mation with slope and intercept parameters denoted by (A(k)1 , B(k)1 ).
These transformation values are provided in Table 3.5.The approach used to calculate the transformation parameters for
the VE composite required the calculation of the first two moments ofthe distribution of VE scores for 01D and 03D, where 03D VE scoreswere computed from (3.5) (which placed them on the 04D scale) anda provisional 01D VE composite was formed from standard scorescalculated from WK and PC transformation parameters (provided

30 3. Test Form Equating
in Table 3.5). Then the linear equating transformation that placedthe provisional 01D VE on the 04D scale was calculated and com-bined with the WK and PC subtest standard score transformationsto provide
SAS = (6.912023) θ̂(AI)1 + (5.937386) θ̂
(SI)1 + 55.894109
SVE = (6.880065) θ̂(WK)1 + (3.872187) θ̂
(PC)1 + 48.440471
The AS transformation was calculated using the same approach.
3.3.3 Form 02D
Form 02D subtest standard-score transformations were also devel-oped using data from the CY2001 Sample (Table 3.1). For subtest
k, the form 02D ability estimate θ̂(k)2 can be transformed to the 03D
scale by the linear equating transformation:
θ̇(k)3 =
"θ̂(k)2 − µ
(k)2
σ(k)2
#σ(k)3 + µ
(k)3 , (3.7)
where µ(k)2 , µ(k)3 , σ
(k)2 , and σ
(k)3 denote the means and standard de-
viations of forms 02D and 03D in the CY2001 sample (provided inTable 3.6). This transformation ensures that the transformed 02D
values θ̇(k)3 will have the same mean and variance as the Form 03D
ability estimates in the CY2001 sample. To obtain the standard-scoretransformation
S = A(k)2 θ̂
(k)2 +B
(k)2 ,
θ̇(k)3 [the right-hand side of (3.7)] can be substituted for θ̂
(k)3 in
(3.3). Given numerical values for all the µ’s, σ’s (Table 3.6), and forA(k)3 and B(k)3 (Table 3.3), the equation simplifies to a linear transfor-
mation with slope and intercept parameters denoted by (A(k)2 , B(k)2 ).
These transformation values are provided in Table 3.7.The approach used to calculate the transformation parameters for
the VE composite required the calculation of the first two moments ofthe distribution of VE scores for 02D and 03D, where 03D VE scoreswere computed from (3.5) (which placed them on the 04D scale), anda provisional 02D VE composite was formed from standard scores

3.3 Equating and Standard-Score Transformations 31
TABLE 3.6. CY2001 Sample Subtest Moments (Forms 02D and 03D)µ σ
Subtest 03D 02D 03D 02DGS 0.276280 0.440274 0.743059 0.823780AR 0.331573 0.309831 0.735248 0.873406WK 0.295040 0.259518 0.756783 0.850094PC 0.541195 0.322324 0.640326 0.818622AI −0.328393 −0.367549 0.734060 0.861382SI −0.191311 −0.246393 0.698151 0.847495
MK 0.417688 0.392266 0.863611 0.835913MC 0.200854 −0.079385 0.649176 0.850118EI 0.203479 −0.066214 0.798097 0.891771AO 0.181096 0.198515 0.842499 0.837635
TABLE 3.7. Form 02D StandardScore Transformation ParametersSubtest A-Slope B-InterceptGS 10.493866 47.113967AR 9.304716 49.163834WK 9.950953 48.580487PC 9.185298 49.372262AI 12.076841 56.523911SI 11.373969 55.275250MK 9.752319 47.748879MC 10.327647 54.380522EI 10.728527 53.901626AO 10.336139 51.138382

32 3. Test Form Equating
calculated from WK and PC transformation values (provided in Ta-ble 3.7). Then the linear equating transformation that placed theprovisional 02D VE on the 04D scale was calculated and combinedwith the WK and PC subtest standard score transformations to pro-vide
SAS = (6.521594) θ̂(AI)2 + (6.142037) θ̂
(SI)2 + 56.367825
SVE = (6.519033) θ̂(WK)2 + (3.639742) θ̂
(PC)2 + 48.833981
The AS transformation was calculated using the same approach.
3.3.4 Form 25B
Form 25B subtest standard-score transformations were developedusing data from the Anchoring Study (see Table 3.1). For subtest k,
the form 25B ability estimate θ̂(k)25B can be transformed to the 04D
scale by the linear equating transformation:
θ̇(k)4 =
θ̂(k)25B − µ(k)25B
σ(k)25B
σ(k)4 + µ(k)4 , (3.8)
where µ(k)25B, µ
(k)4 , σ
(k)25B, and σ
(k)4 denote the means and standard
deviations for forms 25B and 04D in the Anchoring Study sample(provided in Table 3.8). This transformation ensures that the trans-
formed 25B values θ̇(k)4 will have the same mean and variance as
the Form 04D ability estimates in the Anchoring Study sample. Toobtain the standard-score transformation
S = A(k)25B θ̂
(k)25B +B
(k)25B ,
θ̇(k)4 [the right-hand side of (3.8)] can be substituted for θ̂
(k)4 in
(3.1). Given numerical values for all the µ’s, σ’s (Table 3.8), and forA(k)4 and B(k)4 (Table 2.4), the equation simplifies to a linear transfor-
mation with slope and intercept parameters denoted by (A(k)25B, B(k)25B).
These transformation values are provided in Table 3.9.To calculate the transformation for the VE composite, the first
two moments of the distribution of VE scores were calculated for 25Band 04D standard scores, where 04D VE scores were computed from(2.3) and where 25B standard scores were calculated from weighted

3.3 Equating and Standard-Score Transformations 33
TABLE 3.8. Anchoring Study Sample Subtest Momentsµ σ
Subtest 04D 25B 04D 25BGS 0.110343 0.295551 0.758176 0.831350AR 0.202541 0.321543 0.709745 0.867403WK 0.167009 0.293603 0.791270 0.852233PC 0.433710 0.190763 0.618219 0.756241AI −0.366129 – 0.731588 –SI −0.404922 – 0.743423 –AS – 0.215995 – 0.808653MK 0.451699 0.305715 0.803390 0.864733MC 0.061627 0.290567 0.681431 0.826979EI 0.019043 0.295974 0.874071 0.814665AO 0.159984 0.122991 0.851460 0.847170
TABLE 3.9. Form 25B StandardScore Transformation ParametersSubtest A-Slope B-InterceptGS 10.527430 47.151224AR 9.433283 47.667251WK 10.243609 46.644903PC 10.097481 49.317406AS 12.381293 47.914860MK 9.314591 47.936105MC 10.677225 48.943491EI 11.838647 47.865784AO 10.393213 50.649606AS 12.381293 47.914860

34 3. Test Form Equating
WK and PC transformation values (provided in Table 3.9). Thenthe linear transformation that placed 25B VE on the 04D scale wascalculated and combined with the WK and PC subtest standardscore transformations to provide
SVE = (6.861654) θ̂(WK)25B + (4.091172) θ̂
(PC)25B + 47.481779
The AS transformation was calculated using a different approach,since for form 25B (which is a paper-based version), the Auto-Shop(AS) subtest produces a single IRT score θ̂AS.3 The linear trans-formation for 25B AS was calculated by first finding the momentsof the 04D AS standard-score composite (Equation 2.4) and thenfinding the moments of the θ̂AS modal estimate in the AnchoringStudy sample. Then a direct linear equating of the 25B AS scoreθ̂AS to the 04D AS composite SAS was conducted to find the lineartransformation parameters. These are listed in the 5th row of Table3.9.
3.4 Form Equivalence Analyses
To maintain a fair and equitable selection system, it is desirable fordistributions of test scores to be the same across alternate forms.This helps ensure that the same numbers of applicants qualify atselect cut points regardless of form, and that applicants can be in-different with regard to form (and also to mode: CAT or P&P). Ingeneral, equating performed at the subtest level does not guaranteethat distributions of composite scores derived from these subtestsare equated. However, when subtest scores were equated on the ‘80scale, these composite distributions were found to provide similarqualification rates not only across forms within a given medium, butalso across mediums (CAT and P&P).One issue that arises in the context of the new ‘97 score scale is
whether equated forms provide the same level of composite-distributionequivalence as displayed by those same forms equated on the ‘80scale. Note that for CAT-ASVAB forms, the method of equating dif-fers across score scales. For the ‘80 scale, test forms were routinely
3Due to dimensionality and content balancing concerns, the CAT-ASVAB forms pro-duce two separate unidimensional ability estimates: one for Auto Information (AI), andanother for Shop Information (SI).

3.4 Form Equivalence Analyses 35
equated using an equipercentile method. For the ‘97 scale, abilityestimates (θ̂) were equated using a linear equating method whichmatches the first two moments of the distributions of estimated θs.One issue that should be addressed is whether this linear methodapplied to scores at the subtest level on the ‘97 metric provides thesame level of composite-distribution equivalence obtained from anequipercentile approach applied to subtest scores on the ‘80 metric.This issue was addressed by computing root-mean-squared-difference(RMSD) indices of agreement between composite distributions de-rived from different forms on the two different scales.For a given score scale S ∈ (‘80, ‘97), the differences in qualification
rates between test forms k and j can be measured using the index
RMSD(k, j|S) = 100sX
x
1
2
£Qk|S (x)−Qj|S (x)
¤2 £dk|S (x) + dj|S (x)
¤,
where Qk|S (x) is the proportion of scores at or above x calculatedfrom the score distribution of form k on scale S, Qj|S (x) is theanalogous proportion for form j, and dk|S (x) and dj|S (x) are thecorresponding scale-specific densities of forms k and j. This statisticcan be interpreted as the average (or typical) difference in qualifi-cation rates between test forms k and j when the forms are scoredrelative to scale S.Table 3.10 displays the RMSD statistics between select pairs of
ASVAB forms. For each pair, the statistic is calculated for com-posite distributions calculated from scores on both the ‘80 and ‘97metrics. The selection of form pairs mirrors the pairs used in thechained equating analyses described in Section 3.2. RMSD valueswere calculated from one of three datasets, depending on the givencomparison (see notes attached to Table 3.10), and composites wereformed from a weighted linear combination of standardized subtestscores. Composite definitions are provided in Table 5.1.Results indicate close agreement between composite distributions
calculated from alternate test forms. On average, the difference be-tween qualification rates of select pairs of CAT-ASVAB forms (01D,02D, 03D, and 04D) is less than 1 percent (see bottom row of Table3.10), and the degree of agreement tends to be independent of scale.The RMSD statistic for cross-medium comparisons (CAT-ASVAB04D versus P&P-ASVAB 25B) tends to indicate a slightly higher dis-

36 3. Test Form Equating
crepancy between composite distributions, and differences betweenthese forms on the ‘97 metric appear to be slightly larger than thoseobserved on the ‘80 metric. However, all these differences are wellwithin the tolerable range of 2 to 3 percent observed in past CAT-P&P equatings.Note that the equivalence of composite distributions arising from
alternate P&P-ASVAB forms (25A, 25B, 26A, and 26B) were notexamined in this study, but were previously examined by Segall andThomasson (2001). For both the ‘80 and ‘97 metrics, all P&P sub-tests are (or will be) scored by item response theory using the Bayesmodal estimator θ̂, and composites will be formed from weightedlinear combinations of subtest θ̂s. The ability estimates arising fromalternate P&P forms can be treated as interchangeable, in part be-cause the item response functions were precisely estimated from largesamples of randomly equivalent applicant groups taking intact testforms,4 and in part because all forms were constructed from thesame stringent content specifications. This was verified by Segalland Thomasson (2001), who examined the equivalence of θ̂ distrib-utions. Given equivalent θ̂ distributions across forms, it follows thatlinear combinations of θ̂s used to form composites will also haveequivalent distributions across forms, regardless of the scale-specificweights (i.e., ‘80 weights or ‘97 weights) used to form the composite.
4Note that this is in contrast to IRFs used in CAT-ASVAB, which were originallyestimated from multiple non-operational administrations of P&P booklets assigned tonon-equivalent groups.

3.4 Form Equivalence Analyses 37
TABLE 3.10. RMSD Indices Between Form Composite Distributions.03Da — 04Da 01Db — 03Db 02Db — 03Db 04Dc — 25Bc
Composite ‘80 ‘97 ‘80 ‘97 ‘80 ‘97 ‘80 ‘97
AFQT 0.7 0.6 0.8 0.4 0.8 0.2 1.0 1.8Army-GT 0.6 0.6 0.5 0.6 0.7 0.4 0.9 1.7Army-CL 0.8 1.0 0.8 0.4 0.8 0.3 0.7 2.2Army-CO 0.4 0.4 0.9 0.4 1.2 0.8 0.4 1.9Army-EL 0.5 0.4 0.8 0.5 1.2 0.6 0.9 1.8Army-FA 0.5 0.4 0.9 0.4 1.2 0.7 0.4 2.0Army-GM 0.4 0.3 0.9 0.7 1.2 1.0 0.7 1.6Army-MM 0.3 0.4 0.8 0.8 1.2 0.6 1.1 1.3Army-OF 0.3 0.3 0.7 0.6 1.1 0.6 0.5 1.6Army-SC 0.6 0.6 0.9 0.5 1.2 0.6 1.1 2.1Army-ST 0.6 0.5 0.7 0.4 1.0 0.4 0.7 1.9Navy-GT 0.6 0.6 0.5 0.6 0.7 0.4 0.9 1.7Navy-EL 0.8 0.9 1.1 0.8 1.2 1.7 2.0 2.1Navy-BEE 0.8 1.4 1.2 0.8 0.6 0.7 0.6 1.9Navy-ENG 0.4 0.3 1.2 1.1 1.5 1.1 0.4 1.4Navy-MEC 0.3 0.4 0.5 0.7 0.7 0.6 1.7 1.5Navy-MEC2 0.3 0.4 0.3 1.0 0.2 0.7 1.6 1.5Navy-NUC 0.8 0.8 0.7 0.4 0.8 0.2 1.3 2.3Navy-OPS 0.7 0.9 0.7 0.3 0.4 0.2 0.6 1.7Navy-HM 0.6 0.5 1.1 0.4 0.6 1.2 0.7 1.3Navy-ADM 0.7 0.8 0.8 0.7 0.8 0.5 1.1 1.7MC-MM 0.4 0.5 0.8 1.2 1.1 0.8 1.6 1.5MC-GT 0.4 0.4 0.3 0.9 0.6 0.6 1.5 1.9MC-EL 0.8 0.9 1.1 0.8 1.2 1.7 2.0 2.1MC-CL 0.7 0.8 0.8 0.7 0.8 0.5 1.1 1.7AF-M 0.3 0.3 0.6 0.4 0.8 0.3 1.1 1.3AF-A 0.7 0.8 0.8 0.7 0.8 0.5 1.1 1.7AF-G 0.6 0.6 0.5 0.6 0.7 0.4 0.9 1.7AF-E 0.8 0.9 1.1 0.8 1.2 1.7 2.0 2.1
Average 0.5 0.6 0.8 0.6 0.9 0.7 1.1 1.8aData obtained from IOT&E Study.bData obtained from CY2001 Sample.cData obtained from Anchoring Study.

38 3. Test Form Equating
4Enlistment Impact
This chapter describes the impact of the ‘97 score scale on AFQTqualification rates. Section 4.1.1 describes the composition of theapplicant sample used to estimate the impact. The overall impactof using cut scores associated with the ‘80 scale on scores producedby the ‘97 metric is described in Section 4.2. Section 4.3 providesa description of the process used to equate the two scales and theconsequences of adjusting the ‘97 cut scores downward to maintainqualification rate and classification agreement across the ‘80 and ‘97scales. The effects of the new score scale on the numbers of high-quality applicants (defined by a combination of AFQT score andeducation credential) is discussed in Section 4.4. Section 4.5 describesthe effect of scale on subgroup qualification rates. The possibility andconsequence (on expected Military performance) of using alternatedefinitions of AFQT Category boundary levels is discussed in thefinal Section 4.6.
4.1 Samples
Separate impact analyses were conducted for Regular, Reserve, andGuard applicants. The composition of these samples are detailedbelow.
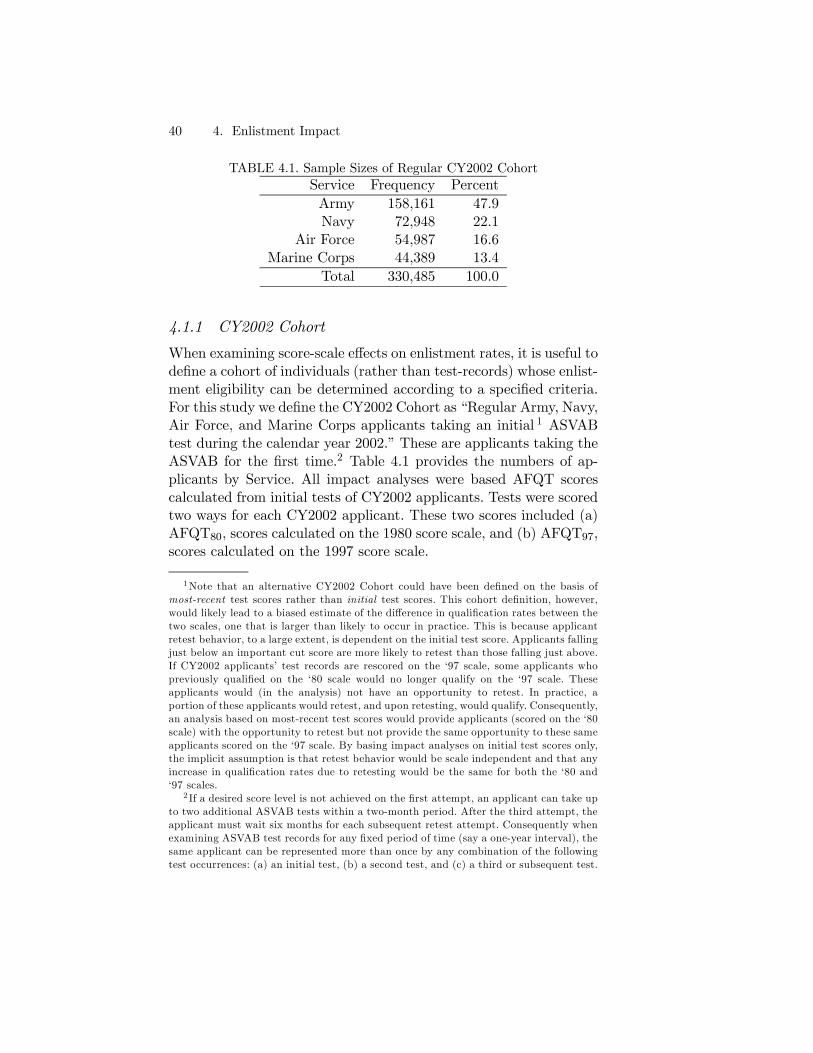
40 4. Enlistment Impact
TABLE 4.1. Sample Sizes of Regular CY2002 CohortService Frequency PercentArmy 158,161 47.9Navy 72,948 22.1
Air Force 54,987 16.6Marine Corps 44,389 13.4
Total 330,485 100.0
4.1.1 CY2002 Cohort
When examining score-scale effects on enlistment rates, it is useful todefine a cohort of individuals (rather than test-records) whose enlist-ment eligibility can be determined according to a specified criteria.For this study we define the CY2002 Cohort as “Regular Army, Navy,Air Force, and Marine Corps applicants taking an initial 1 ASVABtest during the calendar year 2002.” These are applicants taking theASVAB for the first time.2 Table 4.1 provides the numbers of ap-plicants by Service. All impact analyses were based AFQT scorescalculated from initial tests of CY2002 applicants. Tests were scoredtwo ways for each CY2002 applicant. These two scores included (a)AFQT80, scores calculated on the 1980 score scale, and (b) AFQT97,scores calculated on the 1997 score scale.
1Note that an alternative CY2002 Cohort could have been defined on the basis ofmost-recent test scores rather than initial test scores. This cohort definition, however,would likely lead to a biased estimate of the difference in qualification rates between thetwo scales, one that is larger than likely to occur in practice. This is because applicantretest behavior, to a large extent, is dependent on the initial test score. Applicants fallingjust below an important cut score are more likely to retest than those falling just above.If CY2002 applicants’ test records are rescored on the ‘97 scale, some applicants whopreviously qualified on the ‘80 scale would no longer qualify on the ‘97 scale. Theseapplicants would (in the analysis) not have an opportunity to retest. In practice, aportion of these applicants would retest, and upon retesting, would qualify. Consequently,an analysis based on most-recent test scores would provide applicants (scored on the ‘80scale) with the opportunity to retest but not provide the same opportunity to these sameapplicants scored on the ‘97 scale. By basing impact analyses on initial test scores only,the implicit assumption is that retest behavior would be scale independent and that anyincrease in qualification rates due to retesting would be the same for both the ‘80 and‘97 scales.
2 If a desired score level is not achieved on the first attempt, an applicant can take upto two additional ASVAB tests within a two-month period. After the third attempt, theapplicant must wait six months for each subsequent retest attempt. Consequently whenexamining ASVAB test records for any fixed period of time (say a one-year interval), thesame applicant can be represented more than once by any combination of the followingtest occurrences: (a) an initial test, (b) a second test, and (c) a third or subsequent test.

4.2 Qualification Impact 41
TABLE 4.2. Reserve and Guard CY2002 Sample SizesReserve Guard
Service Frequency Percent Frequency PercentArmy 35,262 62.0 51,929 85.2Navy 9,649 17.0 – –
Air Force 6,097 10.7 9,035 14.8Marine Corps 5,822 10.2 – –
Total 56,830 100.0 60,964 100.0
4.1.2 Reserve and Guard Samples
For this study we define the Reserve and Guard Samples as “Reserveand Guard Army, Navy, Air Force, and Marine Corps applicants tak-ing an initial ASVAB test during the calendar year 2002.” These areapplicants taking the ASVAB for the first time. Table 4.2 providesthe numbers of Reserve and Guard applicants by Service. As withRegular applicants, tests were scored two ways for each CY2002 ap-plicant: (a) AFQT80, scores calculated on the 1980 score scale, and(b) AFQT97, scores calculated on the 1997 score scale.
4.2 Qualification Impact
Tables 4.3, 4.4, and 4.5 display the AFQT qualification percentagesfor the CY2002 Regular, Reserve, and Guard samples broken out byService and score scale (1980 versus 1997). Qualification rates aredisplayed for select cut scores. For example in Table 4.3, 82.7% ofthe Regular Army applicants scored 31 or above on the 1980 scorescale compared to 77.2% scoring 31 or above on the 1997 score scale.Thus, the Army could expect to qualify about 5.5% fewer Regularapplicants using the ‘97 score scale (assuming a cut score of 31).On average, qualification rates differ by about 5 percentage pointsamong the lower cut scores (e.g., AFQT ≥ 31) and somewhat lesstowards the middle and upper ranges of the distribution. The lasttwo columns of Table 4.3 display the qualification rates for the com-bined samples of Army, Navy, Air Force, and Marine Corps Regularapplicants. The last two columns of Tables 4.4 and 4.5 display thequalification rates for the combined samples (across service) of Re-serve and Guard applicants.

42 4. Enlistment Impact
TABLE 4.3. Regular CY2002 AFQT Qualification Percentages (Unadjusted Cut Scores)Cut Army Navy Air Force Marines All
‘80 ‘97 ‘80 ‘97 ‘80 ‘97 ‘80 ‘97 ‘80 ‘97 ‘80 ‘9793 93 5.6 5.6 4.9 5.0 5.6 5.4 4.2 4.1 5.2 5.265 65 35.1 33.9 34.1 32.4 43.4 41.2 37.2 34.7 36.5 34.950 50 56.7 53.4 55.4 51.5 67.4 63.4 60.9 56.6 58.7 55.145 45 63.6 60.3 62.3 58.6 74.1 70.6 68.0 64.2 65.6 62.140 40 71.3 66.8 70.0 65.4 81.2 76.9 75.6 71.0 73.2 68.835 35 77.9 72.8 77.0 71.8 86.7 82.4 82.2 77.3 79.7 74.831 31 82.7 77.2 81.9 76.3 90.3 86.0 86.6 81.7 84.3 79.121 21 92.7 87.2 92.7 87.1 96.9 93.5 95.3 91.1 93.8 88.810 10 98.3 95.5 98.3 95.9 99.4 98.4 99.2 97.7 98.6 96.4
Appendices A, B, C, and D display the full range of cut scores forAFQT qualification percentages. For each Service, these are calcu-lated for the CY2002 Regular, Reserve, and Guard samples brokenout by score scale (1980 versus 1997). Army Regular, Reserve, andGuard results are provided in Tables A.2, A.3, and A.4; Navy Regularand Reserve are provided in Tables B.1 and B.2; Air Force Regular,Reserve, and Guard results are provided in Tables C.5, C.6, and C.7;and Marine Corps Regular and Reserve results are provided in Ta-bles D.1 and D.2. Each table displays distribution statistics for thespecified CY2002 sample based on the 1980 and 1997 score scales,including (a) AFQT score (column 1), (b) the percentage at eachscore level according to the 1980 scale (column 2), (c) the percent-age scoring at or above the given score (column 3) on the 1980 scale,(d) the percentage at each score level according to the 1997 scale(column 4), and (e) the percentage scoring at or above the givenscore on the 1997 scale (column 5).Note that one option is to equalize qualification rates across score
scales. This would require assigning new cut scores to the ‘97 scalethat qualified the same percentage as the corresponding (current)cut scores on the ‘80 scale. These cut scores would be lower than the‘80 cut scores; however, they would qualify applicants with the sameexpected performance in training as those qualified on the ‘80 scale.This option is discussed more fully in Section 4.3.

4.2 Qualification Impact 43
TABLE 4.4. Reserve CY2002 AFQT Qualification Percentages (Unadjusted Cut Scores)Cut Army Navy Air Force Marines All
‘80 ‘97 ‘80 ‘97 ‘80 ‘97 ‘80 ‘97 ‘80 ‘97 ‘80 ‘9793 93 7.1 7.4 7.7 8.3 7.6 8.3 10.4 10.3 7.6 7.965 65 40.2 39.2 37.2 37.9 46.9 46.3 54.1 50.8 41.8 40.950 50 61.2 58.1 56.9 54.9 69.8 67.2 75.6 71.6 62.9 59.945 45 67.8 64.6 63.3 61.0 75.8 72.9 81.7 78.5 69.3 66.340 40 74.7 70.7 70.3 66.9 81.6 78.3 86.8 83.9 75.9 72.235 35 80.8 76.1 76.8 72.1 86.9 82.8 90.9 88.1 81.8 77.431 31 85.1 80.2 81.2 76.3 90.6 86.6 93.4 90.7 85.9 81.321 21 93.8 89.2 91.2 85.9 96.5 93.7 97.9 95.9 94.0 89.810 10 98.5 96.2 97.4 94.5 99.3 98.1 99.5 99.0 98.5 96.4
TABLE 4.5. Guard CY2002 AFQT Qualification Percent-ages (Unadjusted Cut Scores)Cut Army Air Force All
‘80 ‘97 ‘80 ‘97 ‘80 ‘97 ‘80 ‘9793 93 5.6 5.5 9.5 9.5 6.2 6.165 65 32.6 31.7 50.4 49.3 35.2 34.350 50 50.8 47.8 70.4 67.8 53.7 50.745 45 56.8 53.9 75.7 73.3 59.6 56.840 40 63.9 59.7 81.7 78.4 66.6 62.535 35 70.7 65.5 86.0 82.9 73.0 68.031 31 75.6 69.9 89.1 85.6 77.6 72.221 21 87.4 80.4 95.6 92.2 88.6 82.210 10 95.9 91.0 98.9 97.2 96.3 91.9

44 4. Enlistment Impact
4.3 Equating Enlistment Standards
As mentioned in Section 4.2, the same expected performance in train-ing can be maintained across score scales by assigning new cut scoresto the ‘97 scale. These new cut scores are designed to qualify aboutthe same percentages of applicants as the corresponding cut scoresbased on the ‘80 scale.Table 4.6 displays distribution statistics for the Regular CY2002
sample based on the 1980 and 1997 score scales, including (a) AFQTscore (column 1), (b) the percentage at each score level according tothe 1980 scale (column 2), (c) the percentage scoring at or above thegiven score (column 3) on the 1980 scale, (d) the percentage at eachscore level according to the 1997 scale (column 4), (e) the percentagescoring at or above the given score on the 1997 scale (column 5), and(f) the equating transformation providing the cut score on the 1997scale that results in nearly the same qualification rate as the nominalscore on the 1980 scale (column 6).The rationale for the algorithm used in determining the equating
transformation (Table 4.6, column 6) can be illustrated using thefollowing example. From Table 4.6, column 3, we observe that 84.27percent of the Regular CY2002 sample obtained an AFQT80 ≥ 31.We also see, by scanning down column 5, that the most similar qual-ification rate on the 1997 scale is 83.66, which occurs for an AFQT97≥ 26. Thus, a score of “31” on the ‘80 scale and a score of “26” on the‘97 scale qualify nearly the same numbers of applicants (about 84%).This correspondence is noted in the last column of row 31. Trans-formation values for other score levels were determined according tothe same approach.Tables 4.7, 4.8, and 4.9 provide the qualification rates in the Reg-
ular, Reserve, and Guard CY2002 samples when different cut scoresare applied across the ‘80 and ‘97 score scales. The cut scores ap-plied to the ‘97 scale were specified by the equating transformation(described above, Table 4.6) to qualify about the same percentagesas the corresponding cuts on the ‘80 scale. These cut-score pairs arelisted in columns 1 and 2 of Tables 4.7, 4.8, and 4.9. For example,referring to Table 4.7, 86.6% of Regular Marine Corps applicantsobtained an AFQT80 ≥ 31 on the ‘80 scale, and 86.2% obtained anAFQT97 ≥ 26 on the ‘97 scale. Thus by lowering the cut score onthe ‘97 scale to 26, nearly the same numbers of applicants qualify.

4.3 Equating Enlistment Standards 45
TABLE 4.6. AFQT Distributions for 1980 and 1997 ScalesAFQT 1980 1997 Trans.Score % Qual. % Qual. ‘80 =⇒ ‘97
1 0.15 100.00 0.11 100.00 12 0.06 99.85 0.17 99.89 23 0.08 99.78 0.22 99.72 34 0.15 99.70 0.57 99.50 3
5 0.15 99.55 0.36 98.93 46 0.19 99.40 0.44 98.57 47 0.15 99.22 0.57 98.13 48 0.26 99.07 0.33 97.56 59 0.20 98.81 0.85 97.22 5
10 0.24 98.61 0.50 96.37 611 0.26 98.36 0.82 95.87 612 0.32 98.10 0.31 95.04 713 0.55 97.78 0.67 94.73 814 0.21 97.23 0.37 94.06 9
15 0.46 97.02 0.80 93.69 916 0.49 96.56 0.90 92.89 1017 0.58 96.07 0.99 91.99 1118 0.66 95.50 0.52 91.00 1119 0.70 94.84 1.12 90.48 13
20 0.38 94.14 0.60 89.36 1421 0.83 93.76 0.65 88.76 1522 0.92 92.93 1.35 88.11 1623 1.04 92.01 0.70 86.76 1724 0.55 90.97 0.76 86.05 18
25 1.20 90.42 1.63 85.30 1926 0.62 89.22 0.85 83.66 2027 1.34 88.61 0.91 82.82 2128 0.72 87.27 0.92 81.90 2329 1.48 86.55 0.92 80.98 23
30 0.80 85.07 0.99 80.06 2531 0.85 84.27 1.02 79.08 2632 1.77 83.42 1.05 78.05 2633 0.94 81.64 1.09 77.00 2834 0.97 80.70 1.12 75.92 29

46 4. Enlistment Impact
TABLE 4.6. AFQT Distributions for 1980 and 1997 Scales (continued)AFQT 1980 1997 Trans.Score % Qual. % Qual. ‘80 =⇒ ‘97
35 2.07 79.73 2.32 74.80 3036 1.08 77.66 1.19 72.48 3237 1.10 76.58 0.00 71.29 3338 1.12 75.49 1.26 71.29 3439 1.14 74.37 1.27 70.03 35
40 1.22 73.23 1.32 68.75 3641 1.24 72.01 1.32 67.43 3642 2.56 70.77 1.28 66.11 3743 1.32 68.22 1.33 64.83 4044 1.27 66.90 1.37 63.50 41
45 1.35 65.63 1.39 62.13 4246 1.35 64.28 1.42 60.75 4347 1.42 62.93 1.41 59.32 4448 1.37 61.52 1.41 57.91 4549 1.41 60.14 1.44 56.50 46
50 1.41 58.73 1.44 55.06 4751 1.48 57.32 1.43 53.62 4852 1.47 55.84 1.47 52.19 4953 2.94 54.37 1.48 50.73 5054 1.55 51.44 1.46 49.25 53
55 1.45 49.89 1.48 47.79 5456 1.55 48.44 1.46 46.31 5557 1.43 46.89 1.47 44.85 5658 1.56 45.46 0.00 43.39 5759 1.45 43.90 1.46 43.39 58
60 0.00 42.45 1.44 41.93 6061 1.53 42.45 1.42 40.49 6062 1.47 40.92 1.40 39.07 6163 1.52 39.45 1.38 37.66 6264 1.41 37.93 1.38 36.28 63
65 1.49 36.53 0.00 34.91 6466 1.45 35.03 1.34 34.91 6567 1.45 33.58 1.33 33.56 6768 1.33 32.14 1.30 32.23 6869 1.43 30.80 1.26 30.93 69

4.3 Equating Enlistment Standards 47
TABLE 4.6. AFQT Distributions for 1980 and 1997 Scales (continued)AFQT 1980 1997 Trans.Score % Qual. % Qual. ‘80 =⇒ ‘97
70 1.35 29.37 2.47 29.67 7071 1.33 28.02 1.21 27.20 7172 1.25 26.69 1.17 25.99 7173 1.29 25.43 1.13 24.82 7274 1.21 24.15 1.12 23.69 74
75 1.24 22.93 1.10 22.57 7576 1.14 21.70 1.06 21.47 7677 1.16 20.55 1.00 20.41 7778 1.15 19.40 1.01 19.41 7879 1.05 18.25 0.95 18.40 79
80 2.11 17.19 0.93 17.45 8081 1.01 15.08 0.90 16.52 8282 0.98 14.07 1.73 15.62 8383 0.00 13.09 0.81 13.89 8484 1.86 13.09 0.80 13.08 84
85 0.89 11.24 1.48 12.28 8686 0.81 10.35 0.69 10.81 8787 0.83 9.54 0.67 10.11 8888 0.76 8.71 1.20 9.45 8989 0.77 7.95 0.57 8.25 90
90 0.66 7.18 1.08 7.68 9091 0.67 6.52 0.49 6.60 9192 0.60 5.84 0.88 6.11 9293 0.62 5.24 1.20 5.23 9394 0.55 4.62 0.67 4.03 94
95 0.58 4.07 0.84 3.36 9496 0.48 3.49 0.67 2.52 9597 0.53 3.02 0.69 1.85 9598 0.37 2.48 0.55 1.16 9699 2.11 2.11 0.61 0.61 97

48 4. Enlistment Impact
TABLE 4.7. Regular CY2002 AFQT Qualification Percentages (Adjusted Cut Scores)Cut Army Navy Air Force Marines All
‘80 ‘97 ‘80 ‘97 ‘80 ‘97 ‘80 ‘97 ‘80 ‘97 ‘80 ‘9793 93 5.6 5.6 4.9 5.0 5.6 5.4 4.2 4.1 5.2 5.265 64 35.1 35.3 34.1 33.6 43.4 42.7 37.2 36.1 36.5 36.350 47 56.7 57.4 55.4 55.8 67.4 67.9 60.9 61.2 58.7 59.345 42 63.6 64.2 62.3 62.7 74.1 74.5 68.0 68.3 65.6 66.140 36 71.3 70.5 70.0 69.3 81.2 80.4 75.6 75.0 73.2 72.535 30 77.9 78.2 77.0 77.5 86.7 86.9 82.2 82.7 79.7 80.131 26 82.7 81.9 81.9 81.4 90.3 89.7 86.6 86.2 84.3 83.721 15 92.7 92.5 92.7 92.8 96.9 96.8 95.3 95.5 93.8 93.710 6 98.3 98.2 98.3 98.4 99.4 99.5 99.2 99.2 98.6 98.6
TABLE 4.8. Reserve CY2002 AFQT Qualification Percentages (Adjusted Cut Scores)Cut Army Navy Air Force Marines All
‘80 ‘97 ‘80 ‘97 ‘80 ‘97 ‘80 ‘97 ‘80 ‘97 ‘80 ‘9793 93 7.1 7.4 7.7 8.3 7.6 8.3 10.4 10.3 7.6 7.965 64 40.2 40.4 37.2 39.0 46.9 47.7 54.1 52.1 41.8 42.250 47 61.2 61.8 56.9 58.6 69.8 70.9 75.6 75.7 62.9 63.745 42 67.8 68.3 63.3 64.4 75.8 76.2 81.7 81.9 69.3 69.940 36 74.7 74.1 70.3 70.1 81.6 81.1 86.8 86.3 75.9 75.435 30 80.8 81.1 76.8 77.2 86.9 87.3 90.9 91.2 81.8 82.231 26 85.1 84.5 81.2 80.6 90.6 90.2 93.4 93.0 85.9 85.321 15 93.8 93.6 91.2 91.1 96.5 96.6 97.9 98.1 94.0 94.010 6 98.5 98.4 97.4 97.3 99.3 99.3 99.5 99.6 98.5 98.5
As indicated, the qualification rates for other Services (Regular, Re-serve, and Guard) are very similar across score scales–in most casesthe difference in qualification rates across scales is about one-half ofone-percent (0.5%) or less.
4.4 High-Quality Applicants and EducationalAttainment
Military applicants are classified into one of three Tiers according totheir education credentials. (See USMEPCOM Reg 680-1.) Gener-ally, applicants are classified as Tier 1 if they are high school gradu-ates, as Tier 2 if they hold an alternate high school credential, andas Tier 3 if they are not currently attending high school and are nei-ther a high school graduate nor an alternate high school credentialholder. The Department of Defense further classifies applicants as

4.4 High-Quality Applicants and Educational Attainment 49
TABLE 4.9. Guard CY2002 AFQT Qualification Percentages(Adjusted Cut Scores)Cut Army Air Force All
‘80 ‘97 ‘80 ‘97 ‘80 ‘97 ‘80 ‘9793 93 5.6 5.5 9.5 9.5 6.2 6.165 64 32.6 32.7 50.4 50.8 35.2 35.450 47 50.8 51.4 70.4 71.2 53.7 54.445 42 56.8 57.4 75.7 76.4 59.6 60.240 36 63.9 63.3 81.7 81.2 66.6 65.935 30 70.7 70.9 86.0 86.3 73.0 73.231 26 75.6 74.8 89.1 88.7 77.6 76.921 15 87.4 86.9 95.6 95.6 88.6 88.210 6 95.9 95.5 98.9 98.9 96.3 96.0
high-quality if they score 50 or above on the AFQT and have a Tier1 educational credential. These high-quality applicants are amongthe easiest to train and are most likely to complete a full term ofservice.Tables 4.10, 4.11, and 4.12 display the percentages of Regular,
Reserve, and Guard CY2002 applicants classified as high-quality.These percentages are displayed separately for each Service and foreach score-scale alternative. As indicated in Table 4.10, the numbersof high-quality Regular Army applicants would be reduced by about2.7% (= 48.1%−45.4%) when high-quality on the ‘97 scale is definedby aptitude levels of AFQT97 ≥ 50. Similar reductions were observedfor the other Services, with reductions in the numbers of high-qualityapplicants ranging between 3 and 4 percent.Tables 4.10, 4.11, and 4.12 also provide an impact assessment us-
ing a revised definition of high-quality applicants. This definition forthe 1997 score scale classifies applicants as high-quality if AFQT97≥ 47 and Educational Credential = Tier 1. As indicated, the reviseddefinition provides percentages (using AFQT97 ≥ 47) which are sim-ilar to those observed for the 1980 scale (with AFQT80 ≥ 50). Acrossall Services (Table 4.10, bottom), 52.7% of Regular applicants wereclassified as high-quality when scored on the ‘80 scale (with AFQT80≥ 50), and 53.1% were classified as high-quality when scored accord-ing to the ‘97 scale using a slightly modified definition of high-qualityaptitude (AFQT97 ≥ 47). Similar results were observed for Reserveand Guard classification rates (Tables 4.11 and 4.12). Consequently,

50 4. Enlistment Impact
TABLE 4.10. Distribution of High-Quality Regular ApplicantsAcross Alternative Score Scales
Score AFQT PercentService Scale Cut High-Qualitya
Army 1980 50 48.11997 50 45.41997 47 48.5
Navy 1980 50 49.51997 50 46.11997 47 49.8
Air Force 1980 50 65.31997 50 61.51997 47 65.8
Marine Corps 1980 50 58.61997 50 54.41997 47 58.9
All Services 1980 50 52.71997 50 49.51997 47 53.1
aHigh-quality applicants are defined as those applicantspossessing a Tier 1 educational credential and havingAFQT ≥ Cut.

4.4 High-Quality Applicants and Educational Attainment 51
TABLE 4.11. Distribution of High-Quality Reserve ApplicantsAcross Alternative Score Scales
Score AFQT PercentService Scale Cut High-Qualitya
Army 1980 50 57.01997 50 54.21997 47 57.5
Navy 1980 50 51.81997 50 50.01997 47 53.1
Air Force 1980 50 67.41997 50 64.91997 47 68.5
Marine Corps 1980 50 74.01997 50 70.21997 47 74.1
All Services 1980 50 59.01997 50 56.31997 47 59.6
aHigh-quality applicants are defined as those applicantspossessing a Tier 1 educational credential and havingAFQT ≥ Cut.

52 4. Enlistment Impact
TABLE 4.12. Distribution of High-Quality Guard ApplicantsAcross Alternative Score Scales
Score AFQT PercentService Scale Cut High-Qualitya
Army 1980 50 44.41997 50 41.91997 47 44.8
Air Force 1980 50 67.71997 50 65.11997 47 68.4
All Services 1980 50 47.91997 50 45.31997 47 48.3
aHigh-quality applicants are defined as those applicantspossessing a Tier 1 educational credential and havingAFQT ≥ Cut.

4.5 Subgroup Effects 53
consistency of qualification rates can be maintained across score-scales by altering the definition of high-quality applicants (i.e., byusing an AFQT cut of 47 rather than 50). In addition, this changein definition will also help maintain the consistency of performanceacross those selected by the new and old scales: Applicants clas-sified as high-quality using a criterion AFQT 97 ≥ 47 on the 1997scale will have the same expected performance in training, and thesame expected attrition rate, as those classified as high-quality usingAFQT 80 ≥ 50 on the 1980 scale.
4.5 Subgroup Effects
4.5.1 Groups Defined by Race
Score-scale effects are likely to be more severe among subgroupswhose scores cluster tightly around key cut points. The degree ofseverity is displayed in Table 4.13 which provides AFQT qualifica-tion rates broken out by race (White, Black, Hispanic, and Other),and by score scale for select AFQT cut scores. These results werebased on the initial test records of CY2002 Regular Army, Navy,Air Force, and Marine Corps applicants. For each cut score, threescales were evaluated: (a) the 1980 scale using the nominal 1980 cutscore, (b) the 1997 scale using nominal 1980 cut-scores, and (c) the1997 scale using adjusted (or equated) cut scores [designed to pro-vide equivalent qualification rates in the entire sample of CY2002Regular applicants (Table 4.6)].The results in Table 4.13 indicate that the score scale impact tends
to be more severe for Blacks and Hispanics than for Whites, espe-cially over the middle and lower score ranges. For example, using anAFQT cut = 31, the difference in qualification rates between scalesfor Whites is about 4 percent: (90.9− 87.0) /90.9 = 4.3%. However,the comparable decrements in qualification rates for Blacks and His-panics are more than double those for Whites: (71.0− 62.7) /71.0 =11.7% for Blacks, and (72.9− 65.7) /72.9 = 9.9% for Hispanics. Thatis, the qualification rate would be expected to drop by 4.3 percentfor Whites, but about 10 to 12 percent for Hispanics and Blacks.Table 4.13 also displays the impact of the ‘97 scale when the cut
scores are adjusted downward. These adjusted cut scores are de-signed to provide equivalent qualification rates in the entire sample

54 4. Enlistment Impact
TABLE 4.13. Subgroup Qualification Rates (All Services)
Scale Qualification Ratesa
White ( N = 208,308)1980 7.2 (93) 45.4 (65) 68.9 (50) 75.5 (45)1997 7.2 (93) 43.9 (65) 65.5 (50) 72.3 (45)1997 7.2 (93) 45.4 (64) 69.7 (47) 76.0 (42)
1980 82.2 (40) 87.5 (35) 90.9 (31) 97.0 (21)1997 78.4 (40) 83.6 (35) 87.0 (31) 93.9 (21)1997 81.7 (36) 87.8 (30) 90.4 (26) 96.9 (15)
Black ( N = 61,282)1980 1.2 (93) 17.3 (65) 37.0 (50) 44.5 (45)1997 1.1 (93) 15.9 (65) 33.0 (50) 40.5 (45)1997 1.1 (93) 16.9 (64) 37.4 (47) 45.1 (42)
1980 54.3 (40) 63.7 (35) 71.0 (31) 88.2 (21)1997 48.3 (40) 56.3 (35) 62.7 (31) 78.7 (21)1997 53.1 (36) 64.2 (30) 69.9 (26) 88.1 (15)
Hispanic ( N = 36,899)1980 1.5 (93) 21.0 (65) 41.7 (50) 49.4 (45)1997 1.4 (93) 18.8 (65) 37.0 (50) 44.9 (45)1997 1.4 (93) 19.9 (64) 41.6 (47) 49.4 (42)
1980 58.2 (40) 66.5 (35) 72.9 (31) 87.3 (21)1997 52.5 (40) 60.1 (35) 65.7 (31) 79.7 (21)1997 57.2 (36) 67.1 (30) 72.3 (26) 87.4 (15)
Other ( N = 23,996)1980 4.7 (93) 32.5 (65) 52.6 (50) 59.0 (45)1997 4.7 (93) 30.4 (65) 48.8 (50) 55.4 (45)1997 4.7 (93) 31.7 (64) 52.8 (47) 59.2 (42)
1980 66.6 (40) 73.5 (35) 78.3 (31) 89.9 (21)1997 61.8 (40) 68.3 (35) 72.6 (31) 83.4 (21)1997 65.7 (36) 73.7 (30) 77.6 (26) 89.8 (15)aAFQT cut scores are provided in parentheses.

4.5 Subgroup Effects 55
of CY2002 applicants (Section 4.3). Using the adjusted cut scores,the impact of the ‘97 score scale is in general much smaller than theimpact observed using nominal cuts based on the ‘80 scale. For ex-ample, using an AFQT cut = 31 on the ‘80 scale, and an AFQT cut= 26 on the ‘97 scale, the difference in qualification rates betweenscales for Whites is less than 1 percent: (90.9− 90.4) /90.9 = 0.6%.The comparable decrements in qualification rates for Blacks and His-panics are similar to those for Whites: (71.0− 69.9) /71.0 = 1.6% forBlacks, and (72.9− 72.3) /72.9 = 0.8% for Hispanics. That is, usingthe adjusted (rather than nominal AFQT cut score) the qualifica-tion rate would be expected to drop by about 2 percent or less forall groups: Whites, Blacks, and Hispanics. In general, small changesin qualification rates occur when the adjusted cut scores are appliedto the ‘97 scale. Tables A.5, A.6, A.7, B.3, B.4, C.8, C.9, C.10, D.3,and D.4 provide the same qualification-rate subgroup analysis foreach of the four Services. Results based on Regular, Reserve, andGuard applicants are reported separately.Although the choice of score scale appears to impact the qual-
ification rates of Blacks and Hispanics to a significant degree (ascompared to Whites), this differential impact results in only a minorshift in the racial composition of qualified applicants. Table 4.14 dis-plays the racial composition of Regular applicants qualifying at selectAFQT cut scores for each of the three candidate scale options. Forexample, among those applicants with AFQT80 ≥ 31 (where AFQTis scored on the ‘80 scale), 68% are White, 15.6% are Black, 9.7% areHispanic, and 6.8% fall into the “Other” racial category. Note thatamong those with AFQT97 ≥ 31 (where AFQT is scored on the ‘97scale), the size of the White group is increased by about 1 percent(69.3 − 68.0 = 1.3%), and the percentages of Blacks and Hispanicsare each reduced by less than 1 percent (Blacks: 15.6− 14.7 = 0.9%;Hispanics: 9.7 − 9.3 = 0.4%). In general, only small shifts in theracial composition of the qualified applicant group appear acrosskey AFQT cut scores.Note that by lowering the cut score on the ‘97 scale (see the third
line of each cut-score grouping in Table 4.14), the effects of the ‘97scale on racial composition can be virtually eliminated. For example,among those with AFQT97 ≥ 26, the percentages of Whites, Blacks,and Hispanics (68.1, 15.5, and 9.6, respectively) provide nearly iden-tical matches to those observed among applicants with AFQT80 ≥ 31

56 4. Enlistment Impact
(68.0, 15.6, and 9.7). Results broken out by Service for Regular, Re-serve, and Guard applicants are provided in Tables A.11, A.12, A.13,B.7, B.8, C.14, C.15, C.16, D.7, and D.8.
4.5.2 Groups Defined by Gender
The results in Table 4.15 (based on Regular applicants) indicatethat the score-scale impact tends to be about the same for Malesand Females, with qualification rates impacted slightly more forFemales over the middle and lower score ranges. For example, us-ing an AFQT cut = 31, the difference in qualification rates be-tween scales for males is about 6 percent: (84.9− 79.9) /84.9 = 5.9%.The comparable decrements in qualification rates for Females are(82.0− 75.9) /82.0 = 7.4%. That is, the qualification rate would beexpected to drop by 6 percent for Males and a little over 7 percentfor Females.Table 4.15 also displays the impact of the ‘97 scale when the cut
scores are adjusted downward. Using the adjusted cut scores, the im-pact of the ‘97 score scale is in general much smaller than the impactobserved using cuts based on the nominal ‘80 values. In general, smallqualification-rate changes (of about 1 percent or less) occur when theadjusted cut scores are applied to the ‘97 scale. Similar results areobtained when gender analyses are performed individually for eachof the four services, for Regular, Reserve, and Guard applicants. (SeeTables A.8, A.9, A.10, B.5, B.6, C.11, C.12, C.13, D.5, and D.6.)Table 4.16 displays the gender composition of Regular applicants
qualifying at select AFQT cut scores for each of the three candidatescale options. In general, only small shifts in gender compositionappear across key AFQT cut scores when the same nominal AFQTcut is applied to the ‘97 and ‘80 scales. When the ‘97 cut score isadjusted downward, the gender composition of qualified applicantsis virtually identical across ‘80 and ‘97 scales. Results broken out byService for Regular, Reserve, and Guard applicants are provided inTables A.14, A.15, A.16, B.9, B.10, C.17, C.18, C.19, D.9, and D.10.
4.6 Maintaining Expected Performance
One implication of the equating between the ‘80 and ‘97 scales isthat the impact of the new score scale can be eliminated by using

4.6 Maintaining Expected Performance 57
TABLE 4.14. Subgroup Qualification Distributions (All Services)Score AFQTScale Cut White Black Hispanic Other
1980 93 86.3 4.1 3.2 6.41997 93 86.5 4.0 3.1 6.51997 93 86.5 4.0 3.1 6.5
1980 65 78.3 8.8 6.4 6.51997 65 79.2 8.5 6.0 6.31997 64 78.9 8.6 6.1 6.3
1980 50 73.9 11.7 7.9 6.51997 50 75.0 11.1 7.5 6.41997 47 74.0 11.7 7.8 6.5
1980 45 72.5 12.6 8.4 6.51997 45 73.4 12.1 8.1 6.51997 42 72.5 12.6 8.4 6.5
1980 40 70.8 13.8 8.9 6.61997 40 71.9 13.0 8.5 6.51997 36 71.0 13.6 8.8 6.6
1980 35 69.2 14.8 9.3 6.71997 35 70.4 14.0 9.0 6.61997 30 69.1 14.9 9.4 6.7
1980 31 68.0 15.6 9.7 6.81997 31 69.3 14.7 9.3 6.71997 26 68.1 15.5 9.6 6.7
1980 21 65.2 17.4 10.4 7.01997 21 66.7 16.5 10.0 6.81997 15 65.2 17.4 10.4 7.0

58 4. Enlistment Impact
TABLE 4.15. Gender Qualification Rates (All Services)
Scale Qualification Ratesa
Males ( N = 260,600)1980 5.7 (93) 38.2 (65) 60.2 (50) 66.9 (45)1997 5.7 (93) 36.6 (65) 56.6 (50) 63.5 (45)1997 5.7 (93) 38.0 (64) 60.8 (47) 67.4 (42)
1980 74.2 (40) 80.5 (35) 84.9 (31) 93.9 (21)1997 70.0 (40) 75.8 (35) 79.9 (31) 89.2 (21)1997 73.6 (36) 80.9 (30) 84.3 (26) 93.9 (15)
Females ( N = 69,876)1980 3.3 (93) 30.2 (65) 53.4 (50) 60.9 (45)1997 3.3 (93) 28.7 (65) 49.4 (50) 57.0 (45)1997 3.3 (93) 30.0 (64) 53.9 (47) 61.3 (42)
1980 69.5 (40) 76.8 (35) 82.0 (31) 93.2 (21)1997 64.3 (40) 71.1 (35) 75.9 (31) 87.2 (21)1997 68.5 (36) 77.1 (30) 81.2 (26) 93.1 (15)aAFQT cut scores are provided in parentheses.

4.6 Maintaining Expected Performance 59
TABLE 4.16. Gender Qualification Distributions (All Services)Score AFQTScale Cut Males Females
1980 93 86.5 13.51997 93 86.5 13.51997 93 86.5 13.5
1980 65 82.5 17.51997 65 82.6 17.41997 64 82.5 17.5
1980 50 80.8 19.21997 50 81.0 19.01997 47 80.8 19.2
1980 45 80.4 19.61997 45 80.6 19.41997 42 80.4 19.6
1980 40 79.9 20.11997 40 80.2 19.81997 36 80.0 20.0
1980 35 79.6 20.41997 35 79.9 20.11997 30 79.6 20.4
1980 31 79.4 20.61997 31 79.7 20.31997 26 79.5 20.5
1980 21 79.0 21.01997 21 79.2 20.81997 15 79.0 21.0

60 4. Enlistment Impact
the adjusted cut scores (the ‘80 cut scores transformed to the ‘97scale) in place of the nominal ‘80 cut scores. (See Table 4.6.) Thisapproach could lead to two potentially desirable outcomes. First,the numbers of qualifying applicants remain constant across scorescales. Second, individual applicant qualification decisions are virtu-ally identical across the two scales. This latter assertion is supportedby the nearly identical rank ordering of applicant scores on the ‘80and ‘97 scales. The Spearman rank-order correlation coefficient3 be-tween AFQT80 and AFQT97 (AFQT scores computed on the 1980and 1997 scales, respectively) is 0.998. This suggests that those quali-fying on the basis of the adjusted ‘97 cut scores will be essentially thesame individuals qualifying on the ‘80 scale (using the unadjustedcut scores).Table 4.17 displays the AFQT Category boundaries defined ac-
cording to the ‘80 score scale (column 2). These categories are oftenused to define applicant/recruit aptitude quality. Also displayed arethe equated boundaries for the ‘97 scale obtained by taking the ‘80cut scores and transforming them to the ‘97 metric using Table 4.6(column 3). By using the adjusted boundaries in conjunction withAFQT97 (scores on the ‘97 scale), nearly all applicants should be in-different with regard to score scale, since each applicant would (withhigh probability) have the same Category classification, regardless ofwhether their Category calculations were performed on the ‘80 or ‘97scales. As a consequence, the adjusted ‘97 boundaries would ensurethat the same performance levels would be expected for applicantsin a given Category, regardless of which score scale was used in theirselection.
3The Spearman ρ was based on a random sample of about 26,000 cases drawn fromthe CY2002 applicant group.

4.6 Maintaining Expected Performance 61
TABLE 4.17. Equated AFQT Category Boundaries
Percentile BoundaryCategory 1980 1997
I 93—99 93—99
II 65—92 64—92
III 31—64 26—63
IIIA 50—64 47—63IIIB 31—49 26—46
IV 10—30 6—25
IVA 21—30 15—25IVB 16—20 10—14IVC 10—15 6—9
V 1—9 1—5

62 4. Enlistment Impact

5Occupational Qualification Impact
5.1 Background
This section describes the impact of the ‘97 score scale on Serviceclassification composite qualification rates. The Service classificationcomposites, formed from weighted linear combinations of subteststandard scores, are used by the Services primarily to classify ap-plicants into occupational specialties. (See Tables 5.1 and A.1.) Likethe AFQT composite (Section 2.4), these composites display sys-tematic differences in their score distributions across the ‘80 and ‘97scales.Each Service has at least two courses of action available regard-
ing classification composite qualification standards. One course usesthose standards based on the ‘80 scale and applies them to compos-ite scores reported on the ‘97 scale. This approach could lead to anincrease, a decrease, or no change in qualification rates. This courseof action could also lead to higher, lower, or about the same expectedperformance in training and on-the-job performance. Note that (un-like AFQT scores which are generally lower on the ‘97 score scale)the sign of the difference between ‘80 and ‘97 composite scores iscomposite-dependent, and in some instances dependent on the scorerange (low, medium, or high) of the given composite.

64 5. Occupational Qualification Impact
TABLE 5.1. Integer-Weighted Service Classification Composite DefinitionsService Composite Standard Score Formula
Army GT = AR + VE
Navy GT = AR + VEEL = GS + AR + MK + EIBEE = GS + AR + 2 MKENG = MK + ASMEC = AR + MC + ASMEC2 = AR + MC + AONUC = AR + MK + MC + VEOPS = AR + MK + AO + VEHM = GS + MK + VEADM = MK + VE
Marine Corps MM = AR + MC + EI + ASGT = AR + MC + VEEL = GS + AR + MK + EICL = MK + VE
Air Force M = AR + MC + AS + 2 VEA = MK + VEG = AR + VEE = GS + AR + MK + EI

5.2 Classification Composite Distribution Analysis 65
The second course of action identifies cut scores on the ‘97 scalethat qualify the same number of applicants as the existing cut scoreson the ‘80 scale. This approach not only ensures that qualificationrates remain constant across the ‘80 and ‘97 scales, but also helpsensure that those selected on the basis of their ‘97 composite scoreswould have about the same expected performance as those selectedon the basis of their ‘80 scores (using the existing ‘80 cut scores).This approach was used by the Services when transitioning from theWWII scale to the current ‘80 scale (Maier & Sims, 1986).
5.2 Classification Composite Distribution Analysis
Table 5.2 provides means (m) and standard deviations (s) of eachService composite on each scale. Sample moments for each compositewere estimated from the CY2002 cohort (see Section 4.1.1), wheremoments for Army composites were calculated from Regular Armyapplicants, moments for Navy composites were calculated from Reg-ular Navy applicants, and so forth. The numbers of applicants byService are provided in Table 4.1. From an examination of Table 5.2,a trend for integer-weighted (i.e., non-Army) composites emerges:Those composites consisting of one or more technical subtests tendto have higher ‘97 means (relative to ‘80 means) than those com-posites consisting of mainly math and verbal subtests. This findingis consistent with expectations based on the shift in performanceamong subtests between the PAY80 and PAY97 populations (Ta-ble 2.1). Note that non-integer weighted Army composites (all Armycomposites except GT) have about the same moments across the ‘80and ‘97 scales. This is a result of the linear rescaling applied to thenon-integer subtest weights–this rescaling was designed to main-tain the composites’ optimal prediction qualities on the ‘97 scorescale (Section 2.5.3).Appendix F provides tables displaying the qualification rates of
each Service classification composite on each of the two score scales.These qualification rates were also based on the CY2002 cohort (Sec-tion 4.1.1), where rates for each Service composite were based onscores from the respective (Army, Navy, Air Force, or Marine Corps)applicant group.

66 5. Occupational Qualification Impact
TABLE 5.2. Composite Moments (‘80 and ‘97 Scales)1980 1997
Composite m s m s
ArmyGT 102.8 15.4 101.8 16.4CL 103.0 15.2 102.2 16.1CO 101.8 15.5 103.0 16.9EL 101.8 15.3 102.9 17.0FA 101.9 15.6 103.0 16.8GM 101.2 15.6 103.0 17.3MM 100.1 16.0 103.4 18.1OF 101.3 15.7 103.1 17.3SC 102.3 15.2 102.8 16.7ST 102.4 15.3 102.7 16.6
NavyGT 101.7 14.2 100.7 15.1EL 203.0 28.0 203.8 29.0BEE 207.1 29.3 204.0 28.9ENG 100.7 12.7 101.7 13.7MEC 148.2 22.4 152.9 22.9MEC2 151.7 23.4 155.3 22.5NUC 204.9 27.7 204.2 28.0OPS 205.8 27.2 204.9 27.5HM 154.5 20.5 151.6 21.6ADM 104.3 13.3 101.5 14.1
Marine CorpsMM 101.9 14.9 106.2 16.1GT 104.4 14.8 104.8 14.9EL 104.1 14.3 104.7 15.0CL 106.1 13.3 103.0 14.0
Air ForceM 53.4 23.2 56.6 25.5A 62.7 20.4 58.8 21.9G 57.4 22.4 57.1 24.0E 58.5 21.5 59.4 24.4

5.2 Classification Composite Distribution Analysis 67
5.2.1 ‘80 Standard Impact
The tables in Appendix F can be used to determine the consequenceson qualification rates of applying existing ‘80 cut scores to compositescores reported on the ‘97 scale. Each table displays the compositescore C (column 1), the percentage P scoring at the given score onthe ‘80 scale (column 2), the percentage Q scoring at or above thegiven score on the ‘80 scale (column 3), the percentage P scoring atthe given score on the ‘97 scale (column 4), and the percentage Qscoring at or above the given score on the ‘97 scale (column 5).Suppose for example that the Army uses a cut score on the ‘80
scale for its GT composite of “104”. (See Table F.1.) As indicated,this cut score qualifies about 49.8 percent of Regular Army applicantson the ‘80 scale, but only qualifies about 46.6% of applicants on the‘97 scale. Consequently, if the Army chose to apply the same cut of104 across two groups scored on two different scales, it could expectto qualify about 3.2% fewer applicants on the ‘97 scale (46.6−49.8 =−3.2%) than on the ‘80 scale. This same approach can be used toassess the impact of other ‘80 cut scores applied to the same or othercomposites.
5.2.2 ‘97 Standard Determination
The tables in Appendix F can also be used to determine the ‘97 cutscores that provide target qualification rates based on existing ‘80cut scores. Continuing with the example of Section 5.2.1, suppose,as before, that the Army applies a cut score on the ‘80 scale for itsGT composite of “104”, qualifying about 49.8% of Army applicants(Table F.1). By examining the qualification rates associated with the‘97 score scale (column 5), we see that a score of 103 on the ‘97 scaleprovides nearly the same qualification rate (49.3%) as a score of 104on the ‘80 scale. This qualification-rate equivalence relation is indi-cated in the last column of row 104. Thus, the last column displaysthe ‘97 cut score that will provide nearly the same qualification rate(when applied to scores reported on the ‘97 scale) as the existing‘80 cut score (column 1) applied to scores reported on the ‘80 scale.The remaining tables of Appendix F provide the same informationfor other Service classification composites.

68 5. Occupational Qualification Impact

6Implementation Options
6.1 Implementation Option Overview
At least four options exist with regard to AFQT score reportingand standard (or cut score) specification (Table 6.1). These optionsdiffer along three dimensions. First, AFQT scores can be reportedon either the ‘80 or ‘97 scales (denoted by AFQT‘80 and AFQT‘97,respectively). Second, cut or qualification scores can be either speci-fied according to the ‘80 scale (C‘80) or translated from the ‘80 scaleto the ‘97 scale (C‘80=⇒‘97). Third, quality goals can be defined infour ways, some ways raising predicted performance levels, and otherways keeping predicted performance at their current levels.With regard to quality goals (Table 6.1, last column), the four
options are summarized with probability notation, where:
TABLE 6.1. AFQT Reporting, Standards, and Quality-Goal OptionsReported Cut Score
Option Scores Standards Quality GoalA AFQT‘80 C‘80 P (AFQT‘80 ≥ 50) ≥ 0.60B AFQT‘97 C‘80=⇒‘97 P (AFQT‘97 ≥ 47) ≥ 0.60C AFQT‘97 C‘80 P (AFQT‘97 ≥ 50) ≥ 0.60D AFQT‘97 C‘80 P (AFQT‘97 ≥ 50) ≥ 0.60−X

70 6. Implementation Options
• P (AFQT‘80 ≥ 50) ≥ 0.60
indicates that the proportion of accessions scoring at orabove 50 is greater than or equal to 0.60 (or 60%), withAFQT scores reported on the ‘80 scale;
• P (AFQT‘97 ≥ 47) ≥ 0.60
indicates that the proportion of accessions scoring at orabove 47 is greater than or equal to 0.60 (or 60%), withAFQT scores reported on the ‘97 scale;
• P (AFQT‘97 ≥ 50) ≥ 0.60
indicates that the proportion of accessions scoring at orabove 50 is greater than or equal to 0.60 (or 60%), withAFQT scores reported on the ‘97 scale; and
• P (AFQT‘97 ≥ 50) ≥ 0.60−X
indicates that the proportion of accessions scoring at orabove 50 is greater than or equal to 0.60−X (where X issome non-zero proportion), with AFQT scores reportedon the ‘97 scale.
6.2 Effects on Nominal and Predictive Standards
It is useful to make a distinction between two types of standardswhen characterizing the different implementation options.
• Nominal StandardsThese standards refer to the numerical values assigned to en-trance cut scores and to upper mental group goals. For exam-ple, a score of “31” (used to qualify applicants for military Ser-vice) is a nominal entrance standard. The percentage “60%”is also a nominal standard, denoting the quality goal of thepercentage scoring in the upper mental AFQT Categories I—IIIA (i.e., 50 and above). These values (31 and 60%) are nom-inal in the sense that they do not have any inherent meaning.

6.3 Option Examples and Outcomes 71
TABLE 6.2. Implementation Option ImpactNominal Standards Predictive Standards
Entrance Upper Entrance UpperOption Standards Mental Group Standards Mental GroupA No Change No Change No Change No ChangeB Lowered Lowered No Change No ChangeC No Change No Change Higher Perf. Higher Perf.D No Change Lowered Higher Perf. No Change
Rather, their meaning must be interpreted relative to a spe-cific score scale (in this instance relative to either the ‘80 or‘97 scales). That is, by lowering the nominal cut score from 31to 26 and applying each to scores reported on different scales,it is not possible to determine how future performance of qual-ifying applicants might change without first knowing how thecorresponding score scales relate to one another.
• Predictive StandardsThese standards refer to the expected future performance ofapplicants or accessions. Typically, this expectation is made inregard to training performance, job performance, or attrition.Changing cut scores, quality goals, or score scales can havedifferent effects on the expected performance of the qualifyingor upper mental groups.
The impact of each implementation option on both nominal andpredictive standards is summarized in Table 6.2 and is discussed inmore detail below.
6.3 Option Examples and Outcomes
Options A through D differ in their impact on the quality of Serviceaccessions and on the expected numbers of qualified applicants. Eachoption is further detailed below.
6.3.1 Option A
Option A (with reported AFQT‘80 and cut scores C‘80 both on the‘80 scale) provides a useful baseline for assessing the consequences of

72 6. Implementation Options
alternate scales and standards. This represents the current standardsand reporting used by the Services. For example, this option wouldbe represented by a Service with the following policy regarding scoresreported on the ‘80 score scale:
• Entrance Standard: No applicants admitted withAFQT‘80 < 31.
• Quality Goal: At least 60% of accessions with AFQT‘80 ≥ 50.
6.3.2 Option B
This option qualifies applicants with the same expected (or pre-dicted) performance as those selected in Option A (Table 6.2). Italso maintains the same expected performance levels of those classi-fied in the upper mental groups. In order to qualify applicants withthe same expected performance levels across the ‘80 and ‘97 scales,cuts applied to scores reported on the ‘97 scale must be adjusteddownward (in most cases) from those applied to scores reported onthe ‘80 scale. These adjustments are illustrated in Tables 4.6 and 4.7.Continuing with the example from Section 6.3.1, the new cut scoresbecome
C‘80=⇒‘97(31) = 26
C‘80=⇒‘97(50) = 47 ,
and the new entrance standard and quality goal are adjusted accord-ingly:
• Entrance Standard: No applicants admitted withAFQT‘97 < 26.
• Quality Goal: At least 60% of accessions with AFQT‘97 ≥ 47.
In addition to maintaining equivalent (expected) performance levelsacross scales, this option has the added benefit of maintaining thesame approximate numbers of qualified and high-mental group ap-plicants as provided by Option A. Although the lower nominal stan-dards associated with the ‘97 scale (26 versus 31; 47 versus 50) mightappear at face value to represent a lowering of standards (Table 6.2),these cut scores in reality maintain the same predicted performance

6.3 Option Examples and Outcomes 73
levels of Option A. The ‘97 qualification scores must be lowered tocompensate for the lower scores reported on the ‘97 scale.1 (See Sec-tions 4.3 and 4.6.)
6.3.3 Option C
This option applies the nominal qualification standards based on the‘80 scale to scores reported on the ‘97 scale (Table 6.2). This optionqualifies applicants with higher expected (or predicted) performancecompared to those qualified in Options A and B (Table 6.2). It alsoincreases the expected performance levels of those in the upper men-tal groups (i.e., I—IIIA). Continuing with the example from Section6.3.1, the new entrance standard and quality-goal are as follows:
• Entrance Standard: No applicants admitted withAFQT97 < 31.
• Quality Goal: At least 60% of accessions with AFQT97 ≥ 50.
Although this option provides increased (expected) performance lev-els (relative to the ‘80 scale), this comes at a cost: Fewer applicantswill be expected to qualify, and fewer applicants would be expectedto fall in the upper mental groups I—IIIA, as compared to either Op-tion A or B. Although the equivalent nominal qualification scoresassociated with the ‘80 and ‘97 scales might appear at face value torepresent equivalent standards across score scales (Table 6.2), thesecut scores in reality increase predicted performance levels over thoseof Options A and B. Since applicant scores on the ‘97 scale have beenlowered but the cut scores have not, those qualifying on the basis oftheir ‘97 scale-scores would have higher expected performance thanthose qualifying under Options A or B.
6.3.4 Option D
For entrance standards, this option applies the nominal qualifica-tion standards based on the ‘80 scale to scores reported on the ‘97scale. Consequently, those qualifying for Service would have higher
1This score decrement is a result of the increased performance levels of the PAY97sample relative to the PAY80 sample. (See Section 2.1.)

74 6. Implementation Options
expected (or predicted) performance compared to those qualified un-der either Option A or B (Table 6.2). However, this option maintainsthe existing (Option A) expected performance levels among those inthe upper mental groups (i.e., I—IIIA). Continuing with the examplefrom Section 6.3.1, the revised entrance standard and quality-goalare as follows:
• Entrance Standard: No applicants admitted withAFQT97 < 31.
• Quality Goal: At least 60−X percent of accessions withAFQT97 ≥ 50,
whereX is some positive integer value. Although this option providesincreased (expected) performance levels (relative to the ‘80 scale),this comes at a cost: Fewer applicants would be expected to qualifyfor entrance. However, the likelihood of satisfying the quality goal(based on the number of accessions in Categories I—IIIA) for anygiven applicant group would remain constant across this and theexisting Option A. In addition, the expected performance levels ofthose in the upper mental groups (i.e., I—IIIA) would also remainconstant across this and Option A. This would happen even thoughthe nominal quality goal has been lowered by X percentage points.Note that in order to maintain existing expected performance levelsamong upper mental group applicants, this percentage goal must belowered to compensate for the lower AFQT scores associated withthe ‘97 score-scale.
6.4 Discussion
The choice between Options B, C, and D requires a considerationof cost-benefit trade offs between increased performance on the onehand, and a potentially smaller pool of qualified applicants on theother. Arguments in favor of higher expected performance gainedunder Options C and D can be made on the basis of two trends: onebased on anticipated shifts in job-complexity levels, and the otherbased on past changes in youth aptitude levels. First, over the pasttwo decades, the aptitude levels of American youth have increased,as evidenced by the shift in AFQT performance between 1980 and

6.4 Discussion 75
1997 (Table 2.2). Second, in the near and mid terms, the complexitylevels of military jobs are also likely to increase. In order to maintaina sufficient number of able personnel in increasingly complex mili-tary occupations, a larger number of high-quality youth should berecruited. With the finding that more high-aptitude youth exist inthe youth population than was previously believed (based on a com-parison between PAY80 and PAY97 performance levels), this courseof action may be more feasible than previously believed.As mentioned, Options C and D raise standards at the possible
expense of reducing the size of the pool of qualified applicants, orat the expense of making the quality goal (based on the numbers ofaccessions in the categories I—IIIA) more difficult to meet. In additionto the analysis based on CY2002 applicants (Chapter 4), the degreeof reduction can also be estimated from historical data using anapproach described below.If enlistment aptitude standards are effectively raised (Options C
and D), then it is useful to assess the impact of these raised stan-dards on the expected numbers of qualified applicants. One approachfor conducting such an assessment takes proposed cut scores (to beapplied to scores reported on the ‘97 scale) and translates them backto the ‘80 scale where they can be applied to a recent sample of ap-plicants whose scores were reported on the ‘80 scale. This approachprovides an estimate of the numbers of applicants who would havequalified had their scores been reported on the ‘97 scale and judgedrelative to the proposed cut scores.Table E.1 (Appendix E) provides a conversion of AFQT scores
from the ‘97 metric to the ‘80 metric. For example, the percentageof applicants with AFQT‘97 ≥ 31 is about 79.1% (column 5). Byfinding the closest percent value on the ‘80 scale (column 3), we seethat about 79.7% of the applicants have AFQT‘80 ≥ 35. Thus, a cutscore of 31 on the ‘97 scale would be expected to qualify about thesame percentage of applicants as a cut score of 35 on the ‘80 scale.This is noted in the last column of row 31. Continuing with theexample presented earlier, the impact of higher standards of OptionC on qualification rates and quality goals can be assessed by applyingthe following cut scores to historical data reported on the ‘80 scale
C‘97=⇒‘80(31) = 35
C‘97=⇒‘80(50) = 53

76 6. Implementation Options
as indicated below:
• Entrance Standard: No applicants admitted withAFQT‘80 < 35.
• Quality Goal: At least 60% of accessions with AFQT‘80 > 52.
An analysis of this type allows comparisons between Option B(which maintains qualification rates across ‘80 and ‘97 scales) andOption C (which raises expected performance but lowers qualifica-tion rates). By an examination of recent historical data, the Servicescan assess their ability to meet recruiting targets in the near andmid terms with the higher aptitude standards set by Option C. TheServices may want to use this approach to examine the likelihood ofmeeting future recruiting goals by analyzing several years of histor-ical data that span a range of economic and other trends affectingenlistment propensity. Note that this analysis would need to be tai-lored by each Service to include the full range of aptitude and otherenlistment factors that uniquely define the respective Service’s qual-ification standards. A similar approach using historical data can beused for assessing the impact of Option D.

References
Bock, R. D., & Moore, E. G. J. (1984). 1980 profile of Americanyouth: Demographic influences on ASVAB test performance(Tech. Rep.). Office of Assistant Secretary of Defense (Man-power, Installations, and Logistics).
Bock, R. D., & Zimowski, M. (in preparation). 1997 profile ofAmerican youth: Demographic influences on ASVAB test per-formance (Tech. Rep.). Chicago, IL: National Opinion Re-search Center.
Frankel, M. R., & McWilliams, H. A. (1981). The profile of Americanyouth: Technical sampling report (Tech. Rep.). Chicago, IL:National Opinion Research Center.
Hetter, R. D., Segall, D. O., & Bloxom, B. M. (1997). Evaluatingitem calibration medium in computerized adaptive testing. InW. A. Sands, B. K. Waters, & J. R. McBride (Eds.), Computer-ized adaptive testing: From inquiry to operation (pp. 161—167).Washington, DC: American Psychological Association.
Kolen, M. J., & Brennan, R. L. (1995). Test equating: Methods andpractices. New York: Springer-Verlag.

78 REFERENCES
Lord, F. M. (1980). Applications of item response theory to practicaltesting problems. Hillsdale, NJ: Lawrence Erlbaum Associates.
MaCurdy, T., & Vytlacil, E. (2003). Establishing new norms for theAFQT using data from PAY97 (Tech. Rep.). Stanford, CA:Stanford University, Department of Economics.
Maier, M. H. (1993). Military aptitude testing: The past fifty years(Tech. Rep. No. 93-007). Seaside, CA: Defense Manpower DataCenter.
Maier, M. H., & Sims, W. H. (1986). The ASVAB score scales: 1980and World War II (Tech. Rep. No. CNR 116). Alexandria,VA: Center for Naval Analyses.
Moore, W., Pedlow, S., & Wolter, K. (1999). Profile of Americanyouth 1997 (PAY97): Technical sampling report (Tech. Rep.).Chicago, IL: National Opinion Research Center.
Moreno, K. E., & Segall, D. O. (1997). Reliability and constructvalidity of CAT-ASVAB. In W. A. Sands, B. K. Waters, &J. R. McBride (Eds.), Computerized adaptive testing: From in-quiry to operation (pp. 169—174). Washington, DC: AmericanPsychological Association.
Sands, W. A., Waters, B. K., & McBride, J. R. (Eds.). (1997). Com-puterized adaptive testing: From inquiry to operation. Wash-ington, DC: American Psychological Association.
Segall, D. O. (1997). Equating the CAT-ASVAB. In W. A. Sands,B. K. Waters, & J. R. McBride (Eds.), Computerized adaptivetesting: From inquiry to operation (pp. 181—198). Washington,DC: American Psychological Association.
Segall, D. O. (1999, September). IOT&E results: CAT-ASVAB forms03d & 04d. Briefing presented at the meeting of the DefenseAdvisory Committee on Military Personnel Testing, Washing-ton, D.C.
Segall, D. O. (2000, September). Anchoring study status. Briefingpresented at the meeting of the Defense Advisory Committeeon Military Personnel Testing, Newport, RI.

REFERENCES 79
Segall, D. O., & Moreno, K. E. (1999). Development of the computer-ized adaptive testing version of the Armed Services VocationalAptitude Battery. In F. Drasgow & J. B. Olson-Buchanan(Eds.), Innovations in computerized assessment. Hillsdale, NJ:Lawrence Erlbaum Associates.
Segall, D. O., Moreno, K. E., Bloxom, B. M., & Hetter, R. D. (1997).Psychometric procedures for administering CAT-ASVAB. InW. A. Sands, B. K. Waters, & J. R. McBride (Eds.), Computer-ized adaptive testing: From inquiry to operation (pp. 131—140).Washington, DC: American Psychological Association.
Segall, D. O., Moreno, K. E., & Hetter, R. D. (1997). Item pooldevelopment and evaluation. In W. A. Sands, B. K. Waters,& J. R. McBride (Eds.), Computerized adaptive testing: Frominquiry to operation (pp. 117—130). Washington, DC: AmericanPsychological Association.
Segall, D. O., & Thomasson, G. L. (2001, October). Scoring, equat-ing, and scaling analyses: P&P-ASVAB forms 23-27. Briefingpresented at the meeting of the Defense Advisory Committeeon Military Personnel Testing, San Diego, CA.
Sims, W. H. (in preparation). Development of the 1997 student test-ing program norms (Tech. Rep.). Seaside, CA: Defense Man-power Data Center.
van der Linden, W. J., & Glas, C. A. W. (Eds.). (2000). Computer-ized adaptive testing: Theory and practice. Boston: Kluwer.
Wainer, H. (Ed.). (2000). Computerized adaptive testing: A primer(2nd ed.). Mahwah, NJ: Lawrence Erlbaum Associates.
Wolfe, J. H., Moreno, K. E., & Segall, D. O. (1997). Evaluating thepredictive validity of CAT-ASVAB. In W. A. Sands, B. K. Wa-ters, & J. R. McBride (Eds.), Computerized adaptive testing:From inquiry to operation (pp. 175—179). Washington, DC:American Psychological Association.

80 REFERENCES

Appendix AArmy Supplement

A-2 Appendix A. Army Supplement
TABLE A.1. Army Composite Weights (‘80 Metric)GS AR AS MK MC EI VE Constant
CL .00000 .72448 .07998 .55550 .10706 .07994 .71014 −12.85471CO .18428 .31335 .43199 .58940 .35082 .20235 .31154 −19.18658EL .07647 .41509 .38240 .45180 .23783 .30353 .50746 −18.72901FA .14019 .40246 .37852 .56254 .39385 .16691 .32991 −18.71933GM .21608 .43480 .52538 .41700 .26436 .30311 .21889 −18.98138MM .05343 .30138 .88831 .25702 .35001 .30237 .21049 −18.15045OF .13160 .50414 .52394 .31436 .33310 .19771 .37426 −18.95577SC .01142 .40419 .25777 .58996 .22784 .32507 .54009 −17.81739ST .12016 .46735 .22971 .44773 .28646 .14781 .64276 −17.09884

Appendix A. Army Supplement A-3
TABLE A.2. Army Regular AFQT Distributions for 1980 and 1997 ScalesAFQT 1980 1997Score % Qual. % Qual.
1 0.17 100.00 0.13 100.002 0.08 99.83 0.22 99.873 0.09 99.75 0.28 99.654 0.20 99.65 0.75 99.37
5 0.18 99.45 0.43 98.626 0.23 99.27 0.54 98.197 0.19 99.04 0.71 97.658 0.33 98.85 0.41 96.949 0.25 98.52 1.02 96.53
10 0.28 98.27 0.57 95.5111 0.32 97.99 0.94 94.9412 0.37 97.67 0.34 94.0013 0.67 97.30 0.75 93.6614 0.24 96.63 0.41 92.91
15 0.54 96.39 0.87 92.5016 0.57 95.85 0.96 91.6317 0.65 95.28 1.10 90.6618 0.72 94.63 0.54 89.5719 0.80 93.91 1.19 89.03
20 0.41 93.12 0.63 87.8421 0.89 92.70 0.68 87.2122 0.99 91.81 1.40 86.5223 1.11 90.82 0.72 85.1324 0.58 89.71 0.80 84.40
25 1.30 89.13 1.69 83.6026 0.63 87.83 0.89 81.9127 1.41 87.20 0.95 81.0228 0.77 85.79 0.96 80.0729 1.55 85.02 0.94 79.11
30 0.83 83.48 0.96 78.1731 0.89 82.65 1.04 77.2032 1.88 81.76 1.07 76.1733 0.99 79.88 1.12 75.0934 0.99 78.89 1.13 73.98
Note. See Section 4.2 for explaination ofcontents.

A-4 Appendix A. Army Supplement
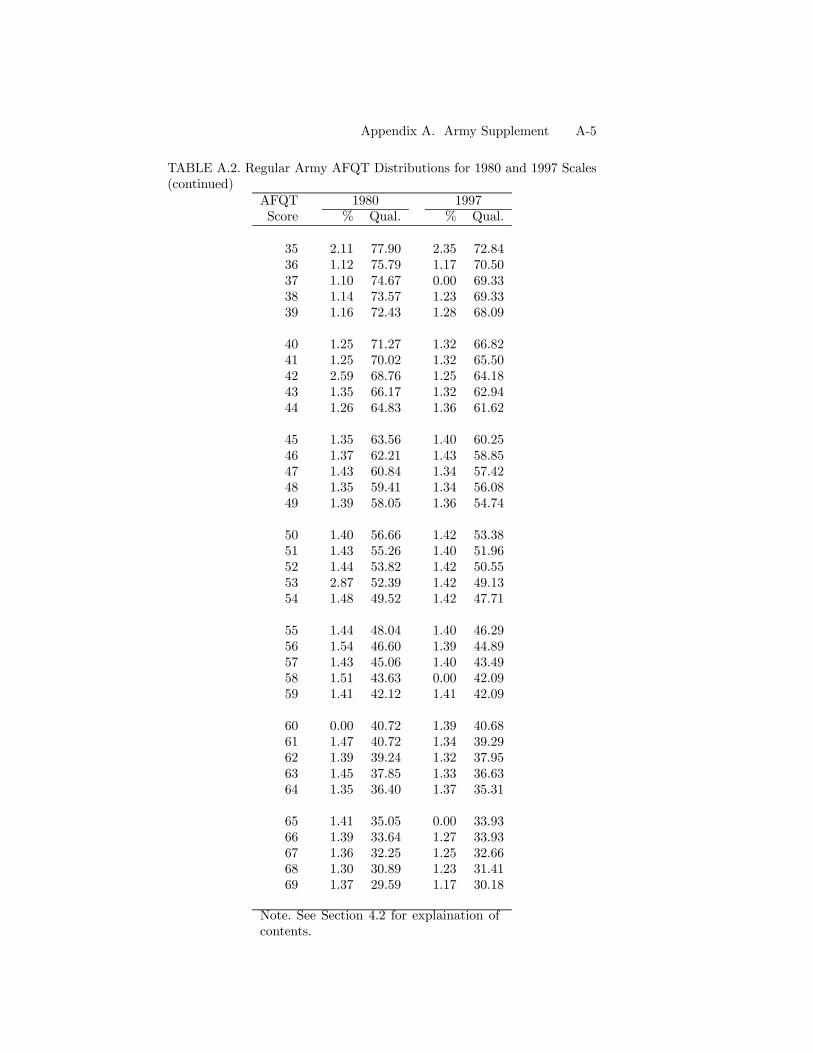
Appendix A. Army Supplement A-5
TABLE A.2. Regular Army AFQT Distributions for 1980 and 1997 Scales(continued)
AFQT 1980 1997Score % Qual. % Qual.
35 2.11 77.90 2.35 72.8436 1.12 75.79 1.17 70.5037 1.10 74.67 0.00 69.3338 1.14 73.57 1.23 69.3339 1.16 72.43 1.28 68.09
40 1.25 71.27 1.32 66.8241 1.25 70.02 1.32 65.5042 2.59 68.76 1.25 64.1843 1.35 66.17 1.32 62.9444 1.26 64.83 1.36 61.62
45 1.35 63.56 1.40 60.2546 1.37 62.21 1.43 58.8547 1.43 60.84 1.34 57.4248 1.35 59.41 1.34 56.0849 1.39 58.05 1.36 54.74
50 1.40 56.66 1.42 53.3851 1.43 55.26 1.40 51.9652 1.44 53.82 1.42 50.5553 2.87 52.39 1.42 49.1354 1.48 49.52 1.42 47.71
55 1.44 48.04 1.40 46.2956 1.54 46.60 1.39 44.8957 1.43 45.06 1.40 43.4958 1.51 43.63 0.00 42.0959 1.41 42.12 1.41 42.09
60 0.00 40.72 1.39 40.6861 1.47 40.72 1.34 39.2962 1.39 39.24 1.32 37.9563 1.45 37.85 1.33 36.6364 1.35 36.40 1.37 35.31
65 1.41 35.05 0.00 33.9366 1.39 33.64 1.27 33.9367 1.36 32.25 1.25 32.6668 1.30 30.89 1.23 31.4169 1.37 29.59 1.17 30.18
Note. See Section 4.2 for explaination ofcontents.

A-6 Appendix A. Army Supplement

Appendix A. Army Supplement A-7
TABLE A.2. Regular Army AFQT Distributions for 1980 and 1997 Scales(continued)
AFQT 1980 1997Score % Qual. % Qual.
70 1.27 28.22 2.38 29.0171 1.27 26.94 1.19 26.6472 1.20 25.67 1.12 25.4473 1.21 24.47 1.08 24.3274 1.16 23.26 1.07 23.24
75 1.16 22.10 1.04 22.1776 1.08 20.94 1.00 21.1377 1.12 19.86 0.95 20.1378 1.06 18.74 0.97 19.1879 0.99 17.67 0.89 18.21
80 1.97 16.69 0.89 17.3281 0.91 14.71 0.84 16.4482 0.90 13.80 1.66 15.5983 0.00 12.90 0.75 13.9384 1.74 12.90 0.74 13.18
85 0.83 11.16 1.42 12.4486 0.77 10.34 0.67 11.0287 0.71 9.57 0.61 10.3588 0.71 8.85 1.17 9.7489 0.73 8.15 0.55 8.57
90 0.64 7.41 1.06 8.0291 0.63 6.78 0.49 6.9692 0.58 6.14 0.87 6.4793 0.60 5.56 1.20 5.6094 0.57 4.96 0.71 4.40
95 0.58 4.39 0.87 3.6996 0.50 3.80 0.75 2.8297 0.55 3.30 0.76 2.0798 0.41 2.76 0.60 1.3199 2.35 2.35 0.71 0.71
Note. See Section 4.2 for explaination ofcontents.

A-8 Appendix A. Army Supplement

Appendix A. Army Supplement A-9
TABLE A.3. Army Reserve AFQT Distributions for 1980 and 1997 ScalesAFQT 1980 1997Score % Qual. % Qual.
1 0.14 100.00 0.11 100.002 0.10 99.86 0.19 99.893 0.09 99.76 0.23 99.704 0.15 99.67 0.65 99.47
5 0.18 99.52 0.38 98.826 0.20 99.34 0.46 98.447 0.12 99.15 0.54 97.988 0.30 99.03 0.34 97.449 0.22 98.73 0.87 97.10
10 0.28 98.51 0.48 96.2311 0.24 98.24 0.81 95.7512 0.34 98.00 0.33 94.9413 0.55 97.66 0.63 94.6114 0.26 97.11 0.35 93.99
15 0.47 96.85 0.70 93.6316 0.48 96.38 0.77 92.9417 0.50 95.90 0.87 92.1718 0.58 95.39 0.51 91.3019 0.71 94.81 1.08 90.79
20 0.33 94.10 0.50 89.7121 0.78 93.77 0.60 89.2122 0.88 92.99 1.20 88.6123 0.92 92.10 0.64 87.4024 0.49 91.18 0.75 86.76
25 1.08 90.69 1.56 86.0126 0.53 89.61 0.74 84.4627 1.20 89.07 0.82 83.7128 0.67 87.87 0.84 82.8929 1.34 87.20 0.92 82.05
30 0.77 85.85 0.97 81.1431 0.84 85.08 0.95 80.1632 1.68 84.24 0.97 79.2133 0.94 82.56 1.03 78.2434 0.86 81.62 1.07 77.22
Note. See Section 4.2 for explaination ofcontents.

A-10 Appendix A. Army Supplement

Appendix A. Army Supplement A-11
TABLE A.3. Army Reserve AFQT Distributions for 1980 and 1997 Scales(continued)
AFQT 1980 1997Score % Qual. % Qual.
35 1.91 80.76 2.08 76.1536 1.04 78.86 1.12 74.0737 1.00 77.82 0.00 72.9538 1.11 76.82 1.10 72.9539 1.02 75.71 1.12 71.85
40 1.11 74.69 1.23 70.7341 1.15 73.58 1.16 69.5142 2.29 72.43 1.17 68.3443 1.12 70.14 1.29 67.1744 1.22 69.02 1.27 65.88
45 1.32 67.80 1.39 64.6146 1.22 66.49 1.42 63.2247 1.48 65.27 1.18 61.8048 1.31 63.78 1.24 60.6249 1.30 62.48 1.31 59.38
50 1.24 61.18 1.24 58.0851 1.31 59.93 1.43 56.8352 1.34 58.62 1.30 55.4153 2.75 57.29 1.37 54.1054 1.42 54.54 1.43 52.73
55 1.41 53.11 1.42 51.3056 1.54 51.70 1.40 49.8857 1.35 50.16 1.37 48.4858 1.46 48.81 0.00 47.1159 1.26 47.35 1.29 47.11
60 0.00 46.09 1.39 45.8261 1.46 46.09 1.31 44.4462 1.40 44.62 1.33 43.1363 1.51 43.22 1.40 41.8064 1.52 41.70 1.24 40.41
65 1.40 40.19 0.00 39.1766 1.20 38.78 1.28 39.1767 1.48 37.58 1.29 37.8868 1.32 36.10 1.39 36.5969 1.40 34.79 1.28 35.21
Note. See Section 4.2 for explaination ofcontents.

A-12 Appendix A. Army Supplement

Appendix A. Army Supplement A-13
TABLE A.3. Army Reserve AFQT Distributions for 1980 and 1997 Scales(continued)
AFQT 1980 1997Score % Qual. % Qual.
70 1.39 33.39 2.41 33.9271 1.30 32.00 1.21 31.5172 1.30 30.70 1.14 30.3173 1.32 29.40 1.11 29.1674 1.21 28.08 1.17 28.05
75 1.26 26.87 1.11 26.8976 1.25 25.61 1.23 25.7877 1.23 24.35 1.06 24.5678 1.04 23.13 1.04 23.5079 1.19 22.08 1.07 22.46
80 2.25 20.89 1.02 21.3981 1.09 18.63 0.95 20.3782 1.17 17.54 1.79 19.4283 0.00 16.37 0.94 17.6384 2.02 16.37 0.92 16.69
85 1.04 14.35 1.60 15.7786 0.96 13.31 0.88 14.1787 0.93 12.35 0.77 13.2988 0.91 11.42 1.42 12.5389 0.84 10.51 0.70 11.11
90 0.85 9.67 1.36 10.4191 0.95 8.82 0.66 9.0592 0.77 7.88 1.02 8.3993 0.76 7.11 1.47 7.3794 0.68 6.35 0.84 5.90
95 0.64 5.67 1.23 5.0696 0.67 5.03 0.94 3.8397 0.76 4.35 0.97 2.9098 0.49 3.59 0.87 1.9299 3.10 3.10 1.05 1.05
Note. See Section 4.2 for explaination ofcontents.

A-14 Appendix A. Army Supplement

Appendix A. Army Supplement A-15
TABLE A.4. Army Guard AFQT Distributions for 1980 and 1997 ScalesAFQT 1980 1997Score % Qual. % Qual.
1 0.31 100.00 0.25 100.002 0.19 99.69 0.52 99.753 0.21 99.50 0.76 99.234 0.43 99.29 1.88 98.47
5 0.44 98.85 1.07 96.606 0.61 98.42 1.15 95.527 0.48 97.80 1.28 94.378 0.84 97.32 0.69 93.099 0.58 96.49 1.37 92.40
10 0.59 95.91 0.80 91.0311 0.63 95.31 1.32 90.2312 0.77 94.69 0.47 88.9113 1.19 93.92 1.01 88.4414 0.39 92.73 0.53 87.43
15 0.79 92.34 1.08 86.9016 0.79 91.55 1.16 85.8117 0.86 90.76 1.33 84.6518 0.96 89.90 0.66 83.3319 1.06 88.95 1.48 82.67
20 0.53 87.88 0.78 81.1921 1.23 87.36 0.76 80.4122 1.25 86.12 1.51 79.6523 1.32 84.87 0.80 78.1324 0.72 83.56 0.85 77.33
25 1.54 82.84 1.69 76.4826 0.73 81.30 0.84 74.7927 1.58 80.57 1.02 73.9528 0.75 78.99 1.00 72.9329 1.81 78.24 0.98 71.93
30 0.87 76.43 1.05 70.9531 0.86 75.56 1.02 69.9032 1.91 74.70 1.06 68.8833 1.05 72.80 1.19 67.8234 1.04 71.75 1.17 66.63
Note. See Section 4.2 for explaination ofcontents.

A-16 Appendix A. Army Supplement

Appendix A. Army Supplement A-17
TABLE A.4. Army Guard AFQT Distributions for 1980 and 1997 Scales(continued)
AFQT 1980 1997Score % Qual. % Qual.
35 2.06 70.71 2.20 65.4636 1.17 68.65 1.15 63.2537 1.14 67.47 0.00 62.1138 1.21 66.34 1.21 62.1139 1.22 65.13 1.17 60.89
40 1.17 63.92 1.13 59.7241 1.19 62.74 1.18 58.5942 2.30 61.56 1.19 57.4043 1.28 59.26 1.15 56.2244 1.17 57.97 1.20 55.07
45 1.20 56.80 1.23 53.8746 1.15 55.61 1.20 52.6447 1.22 54.46 1.20 51.4448 1.28 53.24 1.18 50.2449 1.17 51.96 1.28 49.06
50 1.23 50.79 1.19 47.7851 1.25 49.56 1.16 46.5952 1.23 48.31 1.13 45.4453 2.35 47.07 1.17 44.3154 1.20 44.72 1.11 43.14
55 1.20 43.52 1.23 42.0356 1.30 42.33 1.15 40.8057 1.21 41.02 1.14 39.6558 1.24 39.81 0.00 38.5159 1.15 38.57 1.16 38.51
60 0.00 37.42 1.24 37.3561 1.27 37.42 1.09 36.1162 1.13 36.15 1.17 35.0263 1.20 35.02 1.12 33.8564 1.21 33.83 1.05 32.73
65 1.19 32.61 0.00 31.6866 1.11 31.42 1.10 31.6867 1.25 30.31 1.10 30.5868 1.11 29.06 1.13 29.4869 1.16 27.95 1.11 28.36
Note. See Section 4.2 for explaination ofcontents.

A-18 Appendix A. Army Supplement

Appendix A. Army Supplement A-19
TABLE A.4. Army Guard AFQT Distributions for 1980 and 1997 Scales(continued)
AFQT 1980 1997Score % Qual. % Qual.
70 1.07 26.79 2.02 27.2571 1.17 25.72 0.97 25.2372 1.04 24.55 1.00 24.2673 1.08 23.51 1.02 23.2674 0.97 22.43 0.92 22.24
75 1.06 21.47 0.86 21.3276 0.97 20.41 0.91 20.4677 1.03 19.43 0.83 19.5578 0.96 18.40 0.87 18.7279 0.95 17.44 0.78 17.85
80 1.79 16.48 0.80 17.0781 0.90 14.69 0.84 16.2782 0.87 13.79 1.63 15.4383 0.00 12.92 0.73 13.8084 1.68 12.92 0.73 13.07
85 0.83 11.23 1.28 12.3486 0.74 10.40 0.65 11.0687 0.72 9.66 0.66 10.4088 0.78 8.94 1.25 9.7489 0.70 8.16 0.58 8.49
90 0.62 7.46 0.96 7.9191 0.65 6.84 0.47 6.9592 0.54 6.19 0.94 6.4893 0.69 5.64 1.19 5.5494 0.54 4.95 0.68 4.35
95 0.55 4.42 0.88 3.6796 0.45 3.87 0.75 2.7997 0.56 3.42 0.70 2.0498 0.39 2.86 0.65 1.3399 2.47 2.47 0.68 0.68
Note. See Section 4.2 for explaination ofcontents.

A-20 Appendix A. Army Supplement

Appendix A. Army Supplement A-21
TABLE A.5. Subgroup Qualification Rates (Army Regular)
Scale Qualification Ratesa
White ( N = 99,355)1980 7.7 (93) 44.3 (65) 67.4 (50) 74.1 (45)1997 7.8 (93) 43.3 (65) 64.3 (50) 71.1 (45)1997 7.8 (93) 44.9 (64) 68.4 (47) 74.9 (42)
1980 81.0 (40) 86.4 (35) 90.0 (31) 96.4 (21)1997 77.3 (40) 82.4 (35) 85.9 (31) 93.1 (21)1997 80.5 (36) 86.6 (30) 89.4 (26) 96.3 (15)
Black ( N = 31,034)1980 1.2 (93) 17.1 (65) 36.4 (50) 43.9 (45)1997 1.2 (93) 15.9 (65) 32.7 (50) 40.1 (45)1997 1.2 (93) 16.9 (64) 37.0 (47) 44.5 (42)
1980 53.5 (40) 62.9 (35) 70.3 (31) 87.8 (21)1997 47.5 (40) 55.6 (35) 61.9 (31) 78.0 (21)1997 52.3 (36) 63.3 (30) 69.1 (26) 87.5 (15)
Hispanic ( N = 18,892)1980 1.4 (93) 18.8 (65) 38.0 (50) 45.3 (45)1997 1.3 (93) 17.0 (65) 34.0 (50) 41.2 (45)1997 1.3 (93) 18.0 (64) 38.1 (47) 45.5 (42)
1980 54.0 (40) 62.4 (35) 69.0 (31) 84.1 (21)1997 48.5 (40) 56.0 (35) 61.7 (31) 75.7 (21)1997 53.0 (36) 63.0 (30) 68.2 (26) 83.9 (15)
Other ( N = 8,880)1980 5.2 (93) 29.4 (65) 47.1 (50) 52.9 (45)1997 5.2 (93) 28.0 (65) 44.0 (50) 49.7 (45)1997 5.2 (93) 29.0 (64) 47.3 (47) 53.4 (42)
1980 60.6 (40) 67.8 (35) 72.9 (31) 86.4 (21)1997 55.8 (40) 62.0 (35) 66.8 (31) 78.3 (21)1997 59.7 (36) 67.7 (30) 71.8 (26) 86.1 (15)Note. See Section 4.5 for explaination of contents.aAFQT cut-scores are provided in parentheses.

A-22 Appendix A. Army Supplement

Appendix A. Army Supplement A-23
TABLE A.6. Subgroup Qualification Rates (Army Reserve)
Scale Qualification Ratesa
White ( N = 20,864)1980 10.1 (93) 50.7 (65) 72.2 (50) 78.0 (45)1997 10.6 (93) 50.0 (65) 69.5 (50) 75.5 (45)1997 10.6 (93) 51.4 (64) 73.0 (47) 78.6 (42)
1980 83.8 (40) 88.4 (35) 91.5 (31) 97.0 (21)1997 80.6 (40) 85.0 (35) 88.0 (31) 94.2 (21)1997 83.3 (36) 88.8 (30) 91.1 (26) 96.9 (15)
Black ( N = 8,022)1980 1.4 (93) 22.5 (65) 44.2 (50) 52.6 (45)1997 1.4 (93) 21.3 (65) 40.6 (50) 48.6 (45)1997 1.4 (93) 22.3 (64) 44.8 (47) 53.2 (42)
1980 61.8 (40) 71.0 (35) 77.6 (31) 91.6 (21)1997 56.5 (40) 63.8 (35) 69.9 (31) 84.1 (21)1997 61.0 (36) 71.3 (30) 76.4 (26) 91.3 (15)
Hispanic ( N = 4,251)1980 2.2 (93) 22.4 (65) 41.8 (50) 49.3 (45)1997 2.2 (93) 20.8 (65) 37.8 (50) 44.6 (45)1997 2.2 (93) 21.7 (64) 41.9 (47) 49.6 (42)
1980 57.4 (40) 64.5 (35) 70.9 (31) 84.5 (21)1997 52.3 (40) 59.1 (35) 64.1 (31) 77.4 (21)1997 56.4 (36) 65.3 (30) 70.2 (26) 84.5 (15)
Other ( N = 2,125)1980 8.7 (93) 39.5 (65) 55.8 (50) 61.7 (45)1997 8.5 (93) 37.3 (65) 52.8 (50) 58.6 (45)1997 8.5 (93) 38.4 (64) 56.0 (47) 62.4 (42)
1980 68.7 (40) 75.3 (35) 78.9 (31) 88.6 (21)1997 64.4 (40) 70.1 (35) 74.4 (31) 82.5 (21)1997 68.3 (36) 75.1 (30) 78.4 (26) 88.3 (15)Note. See Section 4.5 for explaination of contents.aAFQT cut-scores are provided in parentheses.

A-24 Appendix A. Army Supplement

Appendix A. Army Supplement A-25
TABLE A.7. Subgroup Qualification Rates (Army Guard)
Scale Qualification Ratesa
White ( N = 33,979)1980 7.8 (93) 42.0 (65) 62.4 (50) 68.6 (45)1997 7.6 (93) 40.9 (65) 59.3 (50) 65.8 (45)1997 7.6 (93) 42.2 (64) 63.3 (47) 69.4 (42)
1980 75.6 (40) 81.7 (35) 85.9 (31) 94.3 (21)1997 71.7 (40) 77.2 (35) 81.2 (31) 89.7 (21)1997 75.0 (36) 82.1 (30) 85.4 (26) 94.1 (15)
Black ( N = 9,195)1980 1.1 (93) 13.8 (65) 28.9 (50) 35.4 (45)1997 1.1 (93) 13.1 (65) 25.8 (50) 31.9 (45)1997 1.1 (93) 13.9 (64) 29.1 (47) 35.7 (42)
1980 43.3 (40) 52.4 (35) 59.7 (31) 80.4 (21)1997 38.3 (40) 45.1 (35) 51.1 (31) 67.9 (21)1997 42.4 (36) 52.6 (30) 58.3 (26) 79.7 (15)
Hispanic ( N = 6,174)1980 0.8 (93) 10.9 (65) 22.8 (50) 27.2 (45)1997 0.8 (93) 10.3 (65) 20.1 (50) 24.8 (45)1997 0.8 (93) 10.7 (64) 22.8 (47) 27.5 (42)
1980 33.9 (40) 41.0 (35) 46.0 (31) 61.9 (21)1997 29.5 (40) 34.9 (35) 39.4 (31) 51.1 (21)1997 33.0 (36) 40.6 (30) 44.9 (26) 60.3 (15)
Other ( N = 2,581)1980 5.4 (93) 28.4 (65) 43.5 (50) 48.5 (45)1997 5.3 (93) 27.3 (65) 41.2 (50) 45.3 (45)1997 5.3 (93) 28.1 (64) 43.6 (47) 49.0 (42)
1980 55.9 (40) 61.7 (35) 66.8 (31) 81.9 (21)1997 51.1 (40) 56.6 (35) 60.8 (31) 72.7 (21)1997 54.7 (36) 62.0 (30) 65.7 (26) 81.2 (15)Note. See Section 4.5 for explaination of contents.aAFQT cut-scores are provided in parentheses.

A-26 Appendix A. Army Supplement
TABLE A.8. Gender Qualification Rates (Army Regular)
Scale Qualification Ratesa
Males ( N = 122,451)1980 6.2 (93) 37.1 (65) 58.6 (50) 65.4 (45)1997 6.2 (93) 35.9 (65) 55.4 (50) 62.2 (45)1997 6.2 (93) 37.3 (64) 59.5 (47) 66.0 (42)
1980 72.8 (40) 79.2 (35) 83.7 (31) 93.0 (21)1997 68.6 (40) 74.4 (35) 78.5 (31) 87.9 (21)1997 72.1 (36) 79.4 (30) 83.0 (26) 92.8 (15)
Females ( N = 35,707)1980 3.4 (93) 28.2 (65) 49.9 (50) 57.4 (45)1997 3.4 (93) 27.2 (65) 46.3 (50) 53.6 (45)1997 3.4 (93) 28.4 (64) 50.4 (47) 57.8 (42)
1980 66.0 (40) 73.6 (35) 79.2 (31) 91.6 (21)1997 60.8 (40) 67.6 (35) 72.7 (31) 84.7 (21)1997 65.0 (36) 73.9 (30) 78.2 (26) 91.4 (15)Note. See Section 4.5 for explaination of contents.aAFQT cut-scores are provided in parentheses.

Appendix A. Army Supplement A-27
TABLE A.9. Gender Qualification Rates (Army Reserve)
Scale Qualification Ratesa
Males ( N = 24,599)1980 8.3 (93) 43.3 (65) 63.8 (50) 70.0 (45)1997 8.7 (93) 42.4 (65) 61.0 (50) 67.1 (45)1997 8.7 (93) 43.7 (64) 64.5 (47) 70.5 (42)
1980 76.5 (40) 82.1 (35) 86.2 (31) 94.0 (21)1997 72.7 (40) 77.9 (35) 81.6 (31) 89.9 (21)1997 76.0 (36) 82.5 (30) 85.6 (26) 93.9 (15)
Females ( N = 10,663)1980 4.2 (93) 33.0 (65) 55.1 (50) 62.8 (45)1997 4.3 (93) 31.7 (65) 51.4 (50) 58.8 (45)1997 4.3 (93) 32.9 (64) 55.5 (47) 63.3 (42)
1980 70.5 (40) 77.6 (35) 82.4 (31) 93.1 (21)1997 66.2 (40) 72.1 (35) 76.8 (31) 87.6 (21)1997 69.7 (36) 78.0 (30) 81.8 (26) 93.1 (15)Note. See Section 4.5 for explaination of contents.aAFQT cut-scores are provided in parentheses.

A-28 Appendix A. Army Supplement
TABLE A.10. Gender Qualification Rates (Army Guard)
Scale Qualification Ratesa
Males ( N = 39,018)1980 6.4 (93) 35.2 (65) 53.1 (50) 59.0 (45)1997 6.3 (93) 34.2 (65) 50.2 (50) 56.2 (45)1997 6.3 (93) 35.2 (64) 53.8 (47) 59.6 (42)
1980 65.9 (40) 72.3 (35) 76.8 (31) 87.6 (21)1997 61.8 (40) 67.4 (35) 71.5 (31) 81.2 (21)1997 65.3 (36) 72.5 (30) 76.1 (26) 87.1 (15)
Females ( N = 12,911)1980 3.3 (93) 24.9 (65) 43.9 (50) 50.2 (45)1997 3.2 (93) 24.1 (65) 40.5 (50) 46.9 (45)1997 3.2 (93) 25.2 (64) 44.4 (47) 50.7 (42)
1980 58.1 (40) 65.9 (35) 71.9 (31) 86.7 (21)1997 53.5 (40) 59.6 (35) 65.2 (31) 78.0 (21)1997 57.2 (36) 66.3 (30) 70.9 (26) 86.3 (15)Note. See Section 4.5 for explaination of contents.aAFQT cut-scores are provided in parentheses.

Appendix A. Army Supplement A-29
TABLE A.11. Subgroup Qualification Distributions (Army Regular)Score- AFQTScale Cut White Black Hispanic Other
1980 93 87.4 4.3 2.9 5.31997 93 87.7 4.3 2.8 5.21997 93 87.7 4.3 2.8 5.2
1980 65 79.3 9.6 6.4 4.71997 65 80.2 9.2 6.0 4.61997 64 79.9 9.4 6.1 4.6
1980 50 74.7 12.6 8.0 4.71997 50 75.7 12.0 7.6 4.61997 47 74.8 12.6 7.9 4.6
1980 45 73.3 13.5 8.5 4.71997 45 74.2 13.0 8.2 4.61997 42 73.3 13.6 8.5 4.7
1980 40 71.4 14.7 9.1 4.81997 40 72.7 14.0 8.7 4.71997 36 71.7 14.6 9.0 4.8
1980 35 69.7 15.8 9.6 4.91997 35 71.1 15.0 9.2 4.81997 30 69.6 15.9 9.6 4.9
1980 31 68.4 16.7 10.0 5.01997 31 69.9 15.7 9.5 4.91997 26 68.6 16.6 9.9 4.9
1980 21 65.3 18.6 10.8 5.21997 21 67.0 17.6 10.4 5.01997 15 65.4 18.6 10.8 5.2

A-30 Appendix A. Army Supplement
TABLE A.12. Subgroup Qualification Distributions (Army Reserve)Score- AFQTScale Cut White Black Hispanic Other
1980 93 84.4 4.5 3.7 7.41997 93 85.1 4.3 3.6 7.01997 93 85.1 4.3 3.6 7.0
1980 65 74.6 12.8 6.7 5.91997 65 75.5 12.4 6.4 5.71997 64 75.2 12.6 6.5 5.7
1980 50 69.8 16.4 8.2 5.51997 50 70.8 15.9 7.8 5.51997 47 69.9 16.5 8.2 5.5
1980 45 68.1 17.7 8.8 5.51997 45 69.1 17.1 8.3 5.51997 42 68.0 17.7 8.7 5.5
1980 40 66.4 18.8 9.3 5.51997 40 67.4 18.2 8.9 5.51997 36 66.5 18.7 9.2 5.6
1980 35 64.8 20.0 9.6 5.61997 35 66.1 19.0 9.4 5.51997 30 64.7 20.0 9.7 5.6
1980 31 63.6 20.8 10.0 5.61997 31 65.0 19.8 9.6 5.61997 26 63.8 20.6 10.0 5.6
1980 21 61.2 22.2 10.9 5.71997 21 62.5 21.5 10.5 5.61997 15 61.3 22.2 10.9 5.7

Appendix A. Army Supplement A-31
TABLE A.13. Subgroup Qualification Distributions (Army Guard)Score- AFQTScale Cut White Black Hispanic Other
1980 93 90.1 3.4 1.7 4.71997 93 89.9 3.6 1.7 4.81997 93 89.9 3.6 1.7 4.8
1980 65 84.2 7.5 4.0 4.31997 65 84.5 7.3 3.8 4.31997 64 84.3 7.5 3.9 4.3
1980 50 80.3 10.1 5.3 4.31997 50 81.1 9.6 5.0 4.31997 47 80.5 10.0 5.3 4.2
1980 45 79.0 11.0 5.7 4.21997 45 79.9 10.5 5.5 4.21997 42 79.1 11.0 5.7 4.2
1980 40 77.4 12.0 6.3 4.31997 40 78.5 11.3 5.9 4.31997 36 77.6 11.9 6.2 4.3
1980 35 75.6 13.1 6.9 4.31997 35 77.2 12.2 6.3 4.31997 30 75.7 13.1 6.8 4.3
1980 31 74.4 14.0 7.2 4.41997 31 76.0 13.0 6.7 4.31997 26 74.7 13.8 7.1 4.4
1980 21 70.6 16.3 8.4 4.71997 21 73.0 15.0 7.6 4.51997 15 70.9 16.2 8.3 4.6
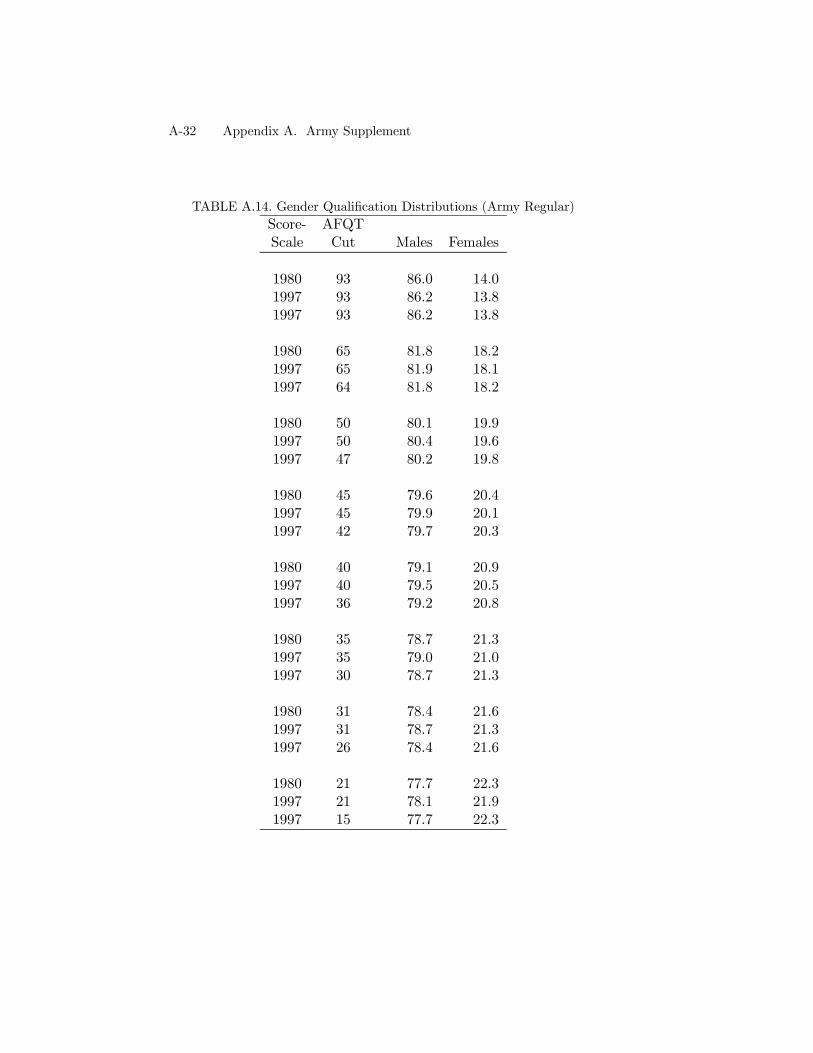
A-32 Appendix A. Army Supplement
TABLE A.14. Gender Qualification Distributions (Army Regular)Score- AFQTScale Cut Males Females
1980 93 86.0 14.01997 93 86.2 13.81997 93 86.2 13.8
1980 65 81.8 18.21997 65 81.9 18.11997 64 81.8 18.2
1980 50 80.1 19.91997 50 80.4 19.61997 47 80.2 19.8
1980 45 79.6 20.41997 45 79.9 20.11997 42 79.7 20.3
1980 40 79.1 20.91997 40 79.5 20.51997 36 79.2 20.8
1980 35 78.7 21.31997 35 79.0 21.01997 30 78.7 21.3
1980 31 78.4 21.61997 31 78.7 21.31997 26 78.4 21.6
1980 21 77.7 22.31997 21 78.1 21.91997 15 77.7 22.3

Appendix A. Army Supplement A-33
TABLE A.15. Gender Qualification Distributions (Army Reserve)Score- AFQTScale Cut Males Females
1980 93 81.9 18.11997 93 82.3 17.71997 93 82.3 17.7
1980 65 75.2 24.81997 65 75.5 24.51997 64 75.4 24.6
1980 50 72.8 27.21997 50 73.2 26.81997 47 72.8 27.2
1980 45 72.0 28.01997 45 72.5 27.51997 42 72.0 28.0
1980 40 71.5 28.51997 40 71.7 28.31997 36 71.5 28.5
1980 35 70.9 29.11997 35 71.4 28.61997 30 70.9 29.1
1980 31 70.7 29.31997 31 71.0 29.01997 26 70.7 29.3
1980 21 70.0 30.01997 21 70.3 29.71997 15 69.9 30.1

A-34 Appendix A. Army Supplement
TABLE A.16. Gender Qualification Distributions (Army Guard)Score- AFQTScale Cut Males Females
1980 93 85.4 14.61997 93 85.8 14.21997 93 85.8 14.2
1980 65 81.0 19.01997 65 81.1 18.91997 64 80.9 19.1
1980 50 78.5 21.51997 50 78.9 21.11997 47 78.5 21.5
1980 45 78.0 22.01997 45 78.3 21.71997 42 78.0 22.0
1980 40 77.4 22.61997 40 77.7 22.31997 36 77.5 22.5
1980 35 76.8 23.21997 35 77.4 22.61997 30 76.8 23.2
1980 31 76.3 23.71997 31 76.8 23.21997 26 76.4 23.6
1980 21 75.3 24.71997 21 75.9 24.11997 15 75.3 24.7

Appendix BNavy Supplement

B-2 Appendix B. Navy Supplement

Appendix B. Navy Supplement B-3
TABLE B.1. Navy Regular AFQT Distributions for 1980 and 1997 ScalesAFQT 1980 1997Score % Qual. % Qual.
1 0.22 100.00 0.17 100.002 0.09 99.78 0.20 99.833 0.10 99.69 0.25 99.644 0.17 99.58 0.61 99.38
5 0.19 99.42 0.42 98.786 0.23 99.23 0.52 98.357 0.16 99.00 0.63 97.838 0.29 98.84 0.37 97.209 0.23 98.55 0.96 96.83
10 0.30 98.32 0.56 95.8811 0.31 98.03 0.93 95.3212 0.36 97.72 0.37 94.3913 0.66 97.35 0.77 94.0214 0.26 96.70 0.43 93.26
15 0.49 96.44 0.94 92.8316 0.52 95.95 1.07 91.8817 0.66 95.42 1.11 90.8118 0.80 94.76 0.61 89.6919 0.83 93.96 1.29 89.09
20 0.45 93.13 0.71 87.7921 0.98 92.68 0.77 87.0822 1.07 91.70 1.55 86.3123 1.27 90.62 0.79 84.7624 0.60 89.36 0.78 83.97
25 1.35 88.75 1.76 83.1826 0.72 87.40 0.93 81.4327 1.54 86.68 1.03 80.4928 0.80 85.14 1.00 79.4629 1.59 84.34 1.00 78.46
30 0.89 82.75 1.13 77.4631 0.91 81.85 1.08 76.3232 1.92 80.94 1.09 75.2433 0.98 79.02 1.14 74.1534 1.08 78.04 1.22 73.01
Note. See Section 4.2 for explaination ofcontents.

B-4 Appendix B. Navy Supplement

Appendix B. Navy Supplement B-5
TABLE B.1. Navy Regular AFQT Distributions for 1980 and 1997 Scales(continued)
AFQT 1980 1997Score % Qual. % Qual.
35 2.18 76.96 2.45 71.8036 1.19 74.77 1.30 69.3437 1.19 73.58 0.00 68.0538 1.14 72.39 1.31 68.0539 1.20 71.24 1.30 66.74
40 1.22 70.04 1.38 65.4441 1.32 68.82 1.39 64.0642 2.54 67.50 1.32 62.6743 1.37 64.97 1.33 61.3444 1.32 63.59 1.41 60.01
45 1.38 62.27 1.39 58.6046 1.33 60.89 1.37 57.2047 1.42 59.56 1.50 55.8448 1.39 58.14 1.42 54.3449 1.39 56.75 1.44 52.91
50 1.45 55.36 1.38 51.4851 1.47 53.91 1.37 50.1052 1.42 52.44 1.43 48.7353 2.83 51.01 1.41 47.3054 1.55 48.19 1.39 45.89
55 1.29 46.63 1.44 44.5056 1.49 45.34 1.36 43.0657 1.36 43.85 1.40 41.7058 1.48 42.49 0.00 40.3059 1.38 41.01 1.41 40.30
60 0.00 39.63 1.32 38.8961 1.34 39.63 1.32 37.5762 1.35 38.28 1.30 36.2463 1.44 36.93 1.32 34.9464 1.35 35.49 1.20 33.62
65 1.37 34.14 0.00 32.4266 1.36 32.77 1.26 32.4267 1.33 31.41 1.22 31.1668 1.19 30.08 1.14 29.9369 1.28 28.89 1.19 28.79
Note. See Section 4.2 for explaination ofcontents.

B-6 Appendix B. Navy Supplement
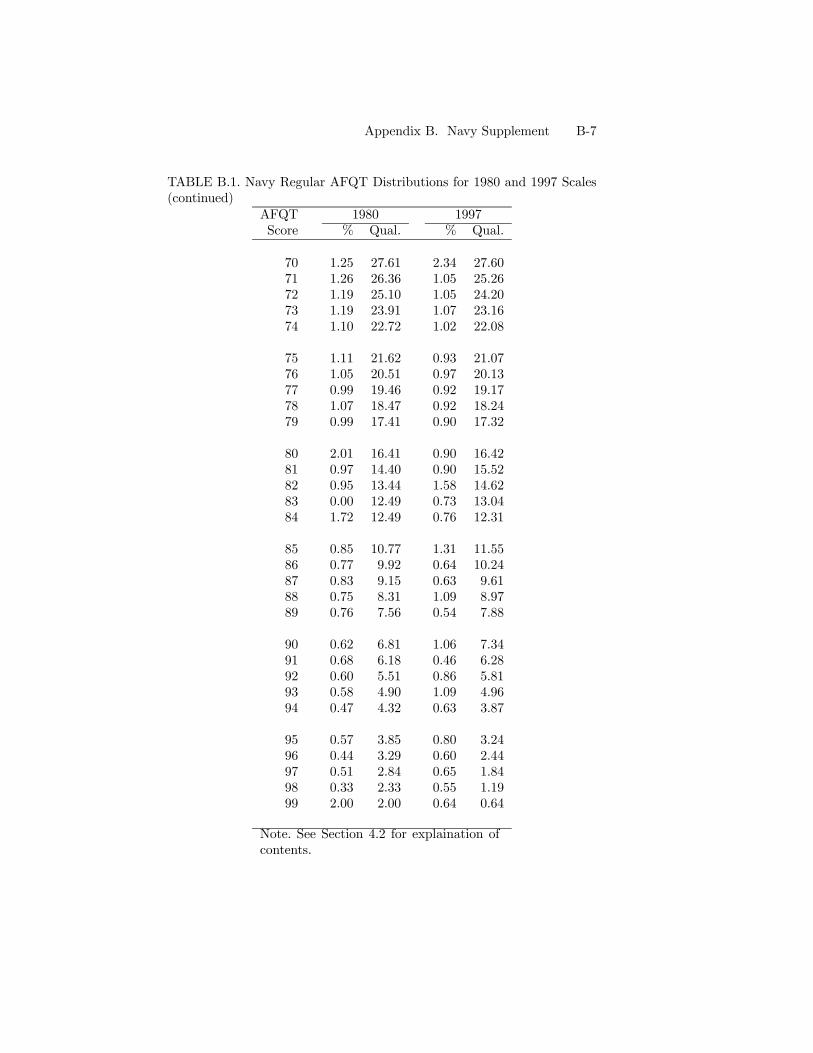
Appendix B. Navy Supplement B-7
TABLE B.1. Navy Regular AFQT Distributions for 1980 and 1997 Scales(continued)
AFQT 1980 1997Score % Qual. % Qual.
70 1.25 27.61 2.34 27.6071 1.26 26.36 1.05 25.2672 1.19 25.10 1.05 24.2073 1.19 23.91 1.07 23.1674 1.10 22.72 1.02 22.08
75 1.11 21.62 0.93 21.0776 1.05 20.51 0.97 20.1377 0.99 19.46 0.92 19.1778 1.07 18.47 0.92 18.2479 0.99 17.41 0.90 17.32
80 2.01 16.41 0.90 16.4281 0.97 14.40 0.90 15.5282 0.95 13.44 1.58 14.6283 0.00 12.49 0.73 13.0484 1.72 12.49 0.76 12.31
85 0.85 10.77 1.31 11.5586 0.77 9.92 0.64 10.2487 0.83 9.15 0.63 9.6188 0.75 8.31 1.09 8.9789 0.76 7.56 0.54 7.88
90 0.62 6.81 1.06 7.3491 0.68 6.18 0.46 6.2892 0.60 5.51 0.86 5.8193 0.58 4.90 1.09 4.9694 0.47 4.32 0.63 3.87
95 0.57 3.85 0.80 3.2496 0.44 3.29 0.60 2.4497 0.51 2.84 0.65 1.8498 0.33 2.33 0.55 1.1999 2.00 2.00 0.64 0.64
Note. See Section 4.2 for explaination ofcontents.

B-8 Appendix B. Navy Supplement

Appendix B. Navy Supplement B-9
TABLE B.2. Navy Reserve AFQT Distributions for 1980 and 1997 ScalesAFQT 1980 1997Score % Qual. % Qual.
1 0.32 100.00 0.26 100.002 0.17 99.68 0.38 99.743 0.23 99.51 0.37 99.364 0.32 99.28 1.10 98.98
5 0.41 98.96 0.54 97.896 0.34 98.55 0.53 97.357 0.20 98.21 0.97 96.828 0.36 98.01 0.34 95.849 0.28 97.65 0.99 95.50
10 0.34 97.37 0.58 94.5111 0.42 97.03 1.13 93.9312 0.50 96.60 0.45 92.8013 0.74 96.10 0.84 92.3514 0.28 95.37 0.37 91.51
15 0.47 95.09 0.99 91.1416 0.60 94.62 0.82 90.1417 0.78 94.02 1.11 89.3318 0.74 93.24 0.60 88.2219 0.85 92.51 1.12 87.62
20 0.47 91.66 0.58 86.5021 0.84 91.19 0.80 85.9222 1.07 90.35 1.42 85.1223 0.91 89.28 0.83 83.7024 0.44 88.37 0.70 82.87
25 1.30 87.94 1.61 82.1626 0.80 86.64 0.77 80.5627 1.59 85.84 0.84 79.7928 0.81 84.26 0.70 78.9529 1.49 83.45 1.03 78.25
30 0.75 81.96 0.95 77.2231 0.68 81.21 0.94 76.2732 1.72 80.53 1.08 75.3233 0.97 78.81 1.09 74.2534 0.98 77.83 1.09 73.16
Note. See Section 4.2 for explaination ofcontents.

B-10 Appendix B. Navy Supplement

Appendix B. Navy Supplement B-11
TABLE B.2. Navy Reserve AFQT Distributions for 1980 and 1997 Scales(continued)
AFQT 1980 1997Score % Qual. % Qual.
35 2.07 76.85 2.01 72.0736 0.98 74.77 1.01 70.0637 1.14 73.79 0.00 69.0538 1.11 72.65 1.14 69.0539 1.24 71.54 1.01 67.91
40 1.30 70.30 1.16 66.9141 1.08 69.00 1.34 65.7542 2.39 67.92 1.06 64.4143 1.07 65.53 1.21 63.3544 1.14 64.46 1.13 62.14
45 1.19 63.32 1.25 61.0146 1.35 62.13 1.20 59.7647 1.31 60.78 1.15 58.5648 1.27 59.48 1.33 57.4049 1.25 58.20 1.16 56.08
50 1.44 56.95 1.24 54.9251 1.36 55.51 1.32 53.6752 1.33 54.15 1.20 52.3653 2.70 52.82 1.17 51.1654 1.23 50.12 1.20 49.98
55 1.26 48.89 1.23 48.7856 1.41 47.62 1.21 47.5557 1.31 46.21 1.09 46.3458 1.44 44.91 0.00 45.2559 1.35 43.47 1.37 45.25
60 0.00 42.12 1.29 43.8861 1.11 42.12 1.24 42.6062 1.18 41.01 1.13 41.3563 1.34 39.83 1.22 40.2264 1.34 38.49 1.09 39.00
65 1.27 37.15 0.00 37.9166 1.33 35.88 1.07 37.9167 1.34 34.55 1.23 36.8468 1.41 33.22 1.06 35.6169 1.37 31.81 1.30 34.55
Note. See Section 4.2 for explaination ofcontents.

B-12 Appendix B. Navy Supplement

Appendix B. Navy Supplement B-13
TABLE B.2. Navy Reserve AFQT Distributions for 1980 and 1997 Scales(continued)
AFQT 1980 1997Score % Qual. % Qual.
70 1.24 30.44 2.38 33.2671 1.14 29.19 1.16 30.8772 1.16 28.05 1.12 29.7173 1.01 26.89 0.99 28.5974 0.82 25.89 0.84 27.60
75 1.16 25.07 1.06 26.7676 1.08 23.91 1.07 25.7077 1.12 22.83 0.80 24.6378 0.96 21.71 0.84 23.8479 1.09 20.75 0.93 23.00
80 2.01 19.66 0.98 22.0681 0.78 17.65 1.01 21.0882 0.90 16.87 1.92 20.0783 0.00 15.97 0.82 18.1684 1.99 15.97 0.85 17.34
85 1.02 13.98 1.50 16.4986 0.87 12.97 0.74 14.9987 0.76 12.09 0.56 14.2588 0.77 11.34 1.46 13.6989 0.66 10.57 0.83 12.23
90 0.91 9.91 1.46 11.4091 0.73 9.00 0.60 9.9492 0.59 8.27 0.99 9.3493 0.80 7.68 1.51 8.3494 0.57 6.88 0.94 6.83
95 0.55 6.31 1.21 5.8996 0.57 5.76 1.08 4.6797 0.62 5.19 1.25 3.6098 0.53 4.57 1.02 2.3499 4.04 4.04 1.33 1.33
Note. See Section 4.2 for explaination ofcontents.

B-14 Appendix B. Navy Supplement
TABLE B.3. Subgroup Qualification Rates (Navy Regular)
Scale Qualification Ratesa
White ( N = 40,200)1980 7.2 (93) 44.8 (65) 67.7 (50) 74.3 (45)1997 7.3 (93) 43.0 (65) 64.1 (50) 71.0 (45)1997 7.3 (93) 44.4 (64) 68.4 (47) 74.8 (42)
1980 81.1 (40) 86.7 (35) 90.3 (31) 96.9 (21)1997 77.3 (40) 82.6 (35) 86.3 (31) 93.7 (21)1997 80.6 (36) 87.2 (30) 90.0 (26) 96.9 (15)
Black ( N = 15,966)1980 1.0 (93) 14.7 (65) 32.5 (50) 39.8 (45)1997 0.9 (93) 13.4 (65) 28.5 (50) 35.7 (45)1997 0.9 (93) 14.2 (64) 32.8 (47) 40.2 (42)
1980 49.5 (40) 59.2 (35) 66.7 (31) 85.6 (21)1997 43.6 (40) 51.6 (35) 58.2 (31) 75.5 (21)1997 48.3 (36) 59.7 (30) 65.9 (26) 86.0 (15)
Hispanic ( N = 8,543)1980 1.9 (93) 21.8 (65) 41.9 (50) 49.8 (45)1997 1.8 (93) 19.7 (65) 37.2 (50) 45.0 (45)1997 1.8 (93) 20.7 (64) 42.1 (47) 49.9 (42)
1980 59.1 (40) 67.0 (35) 73.2 (31) 88.3 (21)1997 53.0 (40) 61.0 (35) 66.3 (31) 80.5 (21)1997 58.1 (36) 67.9 (30) 73.0 (26) 88.8 (15)
Other ( N = 8,239)1980 4.2 (93) 32.7 (65) 53.4 (50) 60.2 (45)1997 4.5 (93) 30.9 (65) 49.5 (50) 56.5 (45)1997 4.5 (93) 32.1 (64) 53.6 (47) 60.2 (42)
1980 67.5 (40) 74.1 (35) 78.8 (31) 90.2 (21)1997 63.0 (40) 69.3 (35) 73.4 (31) 84.1 (21)1997 66.8 (36) 74.5 (30) 78.6 (26) 90.1 (15)Note. See Section 4.5 for explaination of contents.aAFQT cut-scores are provided in parentheses.

Appendix B. Navy Supplement B-15
TABLE B.4. Subgroup Qualification Rates (Navy Reserve)
Scale Qualification Ratesa
White ( N = 5,222)1980 12.0 (93) 50.8 (65) 71.2 (50) 76.8 (45)1997 13.1 (93) 52.1 (65) 69.8 (50) 75.2 (45)1997 13.1 (93) 53.4 (64) 73.1 (47) 78.3 (42)
1980 83.3 (40) 87.9 (35) 90.7 (31) 96.3 (21)1997 80.5 (40) 84.7 (35) 87.5 (31) 93.4 (21)1997 83.2 (36) 88.1 (30) 90.1 (26) 96.2 (15)
Black ( N = 2,249)1980 1.6 (93) 18.1 (65) 37.3 (50) 45.4 (45)1997 1.5 (93) 18.3 (65) 34.9 (50) 42.3 (45)1997 1.5 (93) 19.0 (64) 39.0 (47) 46.0 (42)
1980 54.1 (40) 63.6 (35) 70.0 (31) 86.4 (21)1997 49.4 (40) 56.6 (35) 62.5 (31) 77.4 (21)1997 53.6 (36) 64.1 (30) 69.2 (26) 86.1 (15)
Hispanic ( N = 1,290)1980 1.6 (93) 17.7 (65) 36.6 (50) 44.0 (45)1997 1.8 (93) 18.0 (65) 33.4 (50) 40.2 (45)1997 1.8 (93) 18.8 (64) 37.5 (47) 44.4 (42)
1980 50.8 (40) 60.2 (35) 66.9 (31) 81.8 (21)1997 46.7 (40) 53.3 (35) 59.8 (31) 73.8 (21)1997 50.5 (36) 60.9 (30) 66.0 (26) 82.3 (15)
Other ( N = 888)1980 6.3 (93) 33.7 (65) 52.8 (50) 57.7 (45)1997 7.1 (93) 33.1 (65) 49.2 (50) 55.4 (45)1997 7.1 (93) 34.2 (64) 53.2 (47) 58.6 (42)
1980 63.5 (40) 69.5 (35) 74.7 (31) 86.8 (21)1997 60.6 (40) 64.3 (35) 68.8 (31) 81.1 (21)1997 63.1 (36) 70.0 (30) 74.3 (26) 86.7 (15)Note. See Section 4.5 for explaination of contents.aAFQT cut-scores are provided in parentheses.

B-16 Appendix B. Navy Supplement
TABLE B.5. Gender Qualification Rates (Navy Regular)
Scale Qualification Ratesa
Males ( N = 57,831)1980 5.3 (93) 35.2 (65) 55.7 (50) 62.5 (45)1997 5.4 (93) 33.4 (65) 52.0 (50) 59.0 (45)1997 5.4 (93) 34.6 (64) 56.2 (47) 62.9 (42)
1980 70.1 (40) 76.9 (35) 81.7 (31) 92.4 (21)1997 65.6 (40) 71.8 (35) 76.2 (31) 86.9 (21)1997 69.4 (36) 77.4 (30) 81.3 (26) 92.6 (15)
Females ( N = 15,114)1980 3.3 (93) 30.3 (65) 53.9 (50) 61.6 (45)1997 3.4 (93) 28.6 (65) 49.5 (50) 57.2 (45)1997 3.4 (93) 29.9 (64) 54.3 (47) 61.9 (42)
1980 70.0 (40) 77.3 (35) 82.3 (31) 93.6 (21)1997 64.9 (40) 71.7 (35) 76.7 (31) 87.9 (21)1997 69.1 (36) 77.9 (30) 81.9 (26) 93.7 (15)Note. See Section 4.5 for explaination of contents.aAFQT cut-scores are provided in parentheses.

Appendix B. Navy Supplement B-17
TABLE B.6. Gender Qualification Rates (Navy Reserve)
Scale Qualification Ratesa
Males ( N = 6,373)1980 9.2 (93) 40.7 (65) 60.2 (50) 65.6 (45)1997 10.0 (93) 41.4 (65) 58.2 (50) 63.8 (45)1997 10.0 (93) 42.5 (64) 61.5 (47) 66.7 (42)
1980 72.0 (40) 78.0 (35) 82.2 (31) 91.4 (21)1997 69.0 (40) 73.7 (35) 77.5 (31) 86.5 (21)1997 71.8 (36) 78.4 (30) 81.5 (26) 91.2 (15)
Females ( N = 3,276)1980 4.8 (93) 30.3 (65) 50.6 (50) 58.8 (45)1997 5.2 (93) 31.1 (65) 48.6 (50) 55.6 (45)1997 5.2 (93) 32.2 (64) 52.8 (47) 59.9 (42)
1980 66.9 (40) 74.7 (35) 79.3 (31) 90.8 (21)1997 62.9 (40) 69.0 (35) 74.0 (31) 84.9 (21)1997 66.7 (36) 74.9 (30) 78.8 (26) 91.0 (15)Note. See Section 4.5 for explaination of contents.aAFQT cut-scores are provided in parentheses.

B-18 Appendix B. Navy Supplement
TABLE B.7. Subgroup Qualification Distributions (Navy Regular)Score- AFQTScale Cut White Black Hispanic Other
1980 93 81.4 4.4 4.5 9.71997 93 81.3 4.2 4.3 10.31997 93 81.3 4.2 4.3 10.3
1980 65 72.3 9.4 7.5 10.81997 65 73.1 9.0 7.1 10.71997 64 72.8 9.2 7.2 10.8
1980 50 67.4 12.8 8.9 10.91997 50 68.6 12.1 8.5 10.91997 47 67.5 12.9 8.8 10.8
1980 45 65.7 14.0 9.4 10.91997 45 66.8 13.3 9.0 10.91997 42 65.8 14.0 9.3 10.9
1980 40 63.8 15.5 9.9 10.91997 40 65.1 14.6 9.5 10.91997 36 64.1 15.3 9.8 10.9
1980 35 62.1 16.8 10.2 10.91997 35 63.4 15.7 9.9 10.91997 30 62.0 16.9 10.3 10.9
1980 31 60.8 17.8 10.5 10.91997 31 62.3 16.7 10.2 10.91997 26 60.9 17.7 10.5 10.9
1980 21 57.6 20.2 11.2 11.01997 21 59.3 19.0 10.8 10.91997 15 57.5 20.3 11.2 11.0

Appendix B. Navy Supplement B-19
TABLE B.8. Subgroup Qualification Distributions (Navy Reserve)Score- AFQTScale Cut White Black Hispanic Other
1980 93 84.8 4.9 2.8 7.61997 93 85.1 4.2 2.9 7.81997 93 85.1 4.2 2.9 7.8
1980 65 74.0 11.3 6.4 8.31997 65 74.4 11.2 6.3 8.01997 64 74.1 11.4 6.5 8.1
1980 50 67.6 15.3 8.6 8.51997 50 68.8 14.8 8.1 8.21997 47 67.6 15.5 8.6 8.4
1980 45 65.6 16.7 9.3 8.41997 45 66.7 16.2 8.8 8.41997 42 65.8 16.7 9.2 8.4
1980 40 64.1 17.9 9.7 8.31997 40 65.1 17.2 9.3 8.31997 36 64.2 17.8 9.6 8.3
1980 35 61.9 19.3 10.5 8.31997 35 63.6 18.3 9.9 8.21997 30 61.8 19.3 10.5 8.3
1980 31 60.4 20.1 11.0 8.51997 31 62.1 19.1 10.5 8.31997 26 60.5 20.0 10.9 8.5
1980 21 57.2 22.1 12.0 8.81997 21 58.8 21.0 11.5 8.71997 15 57.2 22.0 12.1 8.8

B-20 Appendix B. Navy Supplement
TABLE B.9. Gender Qualification Distributions (Navy Regular)Score- AFQTScale Cut Males Females
1980 93 86.0 14.01997 93 85.7 14.31997 93 85.7 14.3
1980 65 81.6 18.41997 65 81.7 18.31997 64 81.6 18.4
1980 50 79.8 20.21997 50 80.1 19.91997 47 79.9 20.1
1980 45 79.5 20.51997 45 79.8 20.21997 42 79.5 20.5
1980 40 79.3 20.71997 40 79.4 20.61997 36 79.4 20.6
1980 35 79.2 20.81997 35 79.3 20.71997 30 79.2 20.8
1980 31 79.2 20.81997 31 79.2 20.81997 26 79.2 20.8
1980 21 79.1 20.91997 21 79.1 20.91997 15 79.1 20.9

Appendix B. Navy Supplement B-21
TABLE B.10. Gender Qualification Distributions (Navy Reserve)Score- AFQTScale Cut Males Females
1980 93 78.8 21.21997 93 78.9 21.11997 93 78.9 21.1
1980 65 72.3 27.71997 65 72.2 27.81997 64 71.9 28.1
1980 50 69.8 30.21997 50 69.9 30.11997 47 69.4 30.6
1980 45 68.5 31.51997 45 69.1 30.91997 42 68.4 31.6
1980 40 67.7 32.31997 40 68.1 31.91997 36 67.7 32.3
1980 35 67.0 33.01997 35 67.5 32.51997 30 67.1 32.9
1980 31 66.8 33.21997 31 67.1 32.91997 26 66.8 33.2
1980 21 66.2 33.81997 21 66.5 33.51997 15 66.1 33.9

B-22 Appendix B. Navy Supplement

Appendix CAir Force Supplement

C-2 Appendix C. Air Force Supplement
TABLE C.1. ‘97 Air Force Mechanical (M) Percentile ConversionCum. Cum.
MS % % M% MS % % M%
≤144 0.06 1.50 1 184 0.22 7.42 7145 0.01 1.51 2 185 0.31 7.74 8146 0.12 1.63 2 186 0.21 7.95 8147 0.10 1.73 2 187 0.19 8.14 8148 0.07 1.80 2 188 0.39 8.53 9149 0.12 1.92 2 189 0.28 8.81 9150 0.08 1.99 2 190 0.22 9.03 9151 0.13 2.13 2 191 0.22 9.25 9152 0.19 2.32 2 192 0.37 9.62 10153 0.04 2.36 2 193 0.36 9.99 10154 0.07 2.43 2 194 0.33 10.31 10155 0.02 2.45 2 195 0.30 10.61 11156 0.12 2.57 3 196 0.33 10.94 11157 0.16 2.73 3 197 0.40 11.34 11158 0.05 2.78 3 198 0.37 11.71 12159 0.10 2.88 3 199 0.59 12.29 12160 0.05 2.93 3 200 0.50 12.79 13161 0.21 3.14 3 201 0.37 13.16 13162 0.20 3.34 3 202 0.45 13.61 14163 0.12 3.46 3 203 0.27 13.88 14164 0.21 3.67 4 204 0.47 14.35 14165 0.18 3.85 4 205 0.36 14.70 15166 0.11 3.96 4 206 0.45 15.15 15167 0.10 4.06 4 207 0.33 15.48 15168 0.15 4.21 4 208 0.53 16.00 16169 0.19 4.40 4 209 0.46 16.47 16170 0.27 4.68 5 210 0.49 16.96 17171 0.22 4.90 5 211 0.58 17.54 18172 0.16 5.06 5 212 0.63 18.17 18173 0.18 5.25 5 213 0.48 18.65 19174 0.16 5.40 5 214 0.75 19.40 19175 0.18 5.59 6 215 0.63 20.03 20176 0.18 5.77 6 216 0.64 20.67 21177 0.10 5.87 6 217 0.56 21.22 21178 0.19 6.06 6 218 0.44 21.66 22179 0.25 6.31 6 219 0.68 22.35 22180 0.25 6.56 7 220 0.56 22.90 23181 0.24 6.79 7 221 0.65 23.56 24182 0.20 6.99 7 222 0.80 24.36 24183 0.21 7.20 7 223 0.53 24.88 25
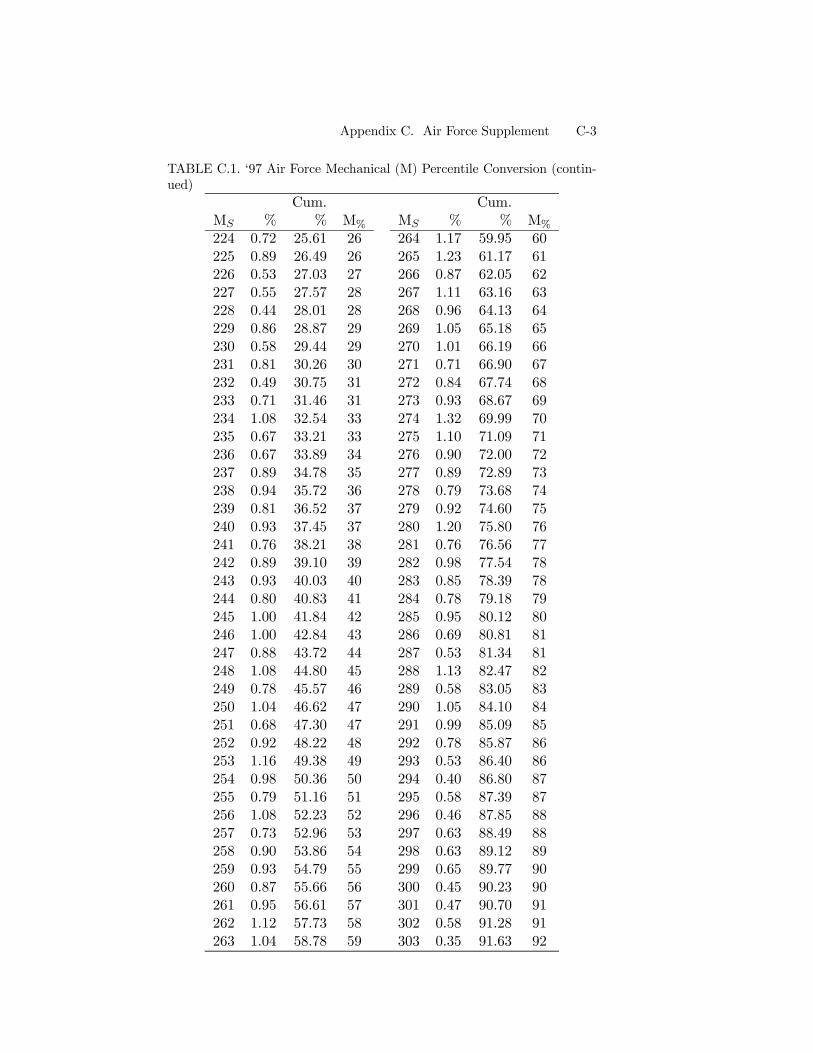
Appendix C. Air Force Supplement C-3
TABLE C.1. ‘97 Air Force Mechanical (M) Percentile Conversion (contin-ued)
Cum. Cum.MS % % M% MS % % M%
224 0.72 25.61 26 264 1.17 59.95 60225 0.89 26.49 26 265 1.23 61.17 61226 0.53 27.03 27 266 0.87 62.05 62227 0.55 27.57 28 267 1.11 63.16 63228 0.44 28.01 28 268 0.96 64.13 64229 0.86 28.87 29 269 1.05 65.18 65230 0.58 29.44 29 270 1.01 66.19 66231 0.81 30.26 30 271 0.71 66.90 67232 0.49 30.75 31 272 0.84 67.74 68233 0.71 31.46 31 273 0.93 68.67 69234 1.08 32.54 33 274 1.32 69.99 70235 0.67 33.21 33 275 1.10 71.09 71236 0.67 33.89 34 276 0.90 72.00 72237 0.89 34.78 35 277 0.89 72.89 73238 0.94 35.72 36 278 0.79 73.68 74239 0.81 36.52 37 279 0.92 74.60 75240 0.93 37.45 37 280 1.20 75.80 76241 0.76 38.21 38 281 0.76 76.56 77242 0.89 39.10 39 282 0.98 77.54 78243 0.93 40.03 40 283 0.85 78.39 78244 0.80 40.83 41 284 0.78 79.18 79245 1.00 41.84 42 285 0.95 80.12 80246 1.00 42.84 43 286 0.69 80.81 81247 0.88 43.72 44 287 0.53 81.34 81248 1.08 44.80 45 288 1.13 82.47 82249 0.78 45.57 46 289 0.58 83.05 83250 1.04 46.62 47 290 1.05 84.10 84251 0.68 47.30 47 291 0.99 85.09 85252 0.92 48.22 48 292 0.78 85.87 86253 1.16 49.38 49 293 0.53 86.40 86254 0.98 50.36 50 294 0.40 86.80 87255 0.79 51.16 51 295 0.58 87.39 87256 1.08 52.23 52 296 0.46 87.85 88257 0.73 52.96 53 297 0.63 88.49 88258 0.90 53.86 54 298 0.63 89.12 89259 0.93 54.79 55 299 0.65 89.77 90260 0.87 55.66 56 300 0.45 90.23 90261 0.95 56.61 57 301 0.47 90.70 91262 1.12 57.73 58 302 0.58 91.28 91263 1.04 58.78 59 303 0.35 91.63 92

C-4 Appendix C. Air Force Supplement
TABLE C.1. ‘97 Air Force Mechanical (M) Percentile Conversion (contin-ued)
Cum. Cum.MS % % M% MS % % M%
304 0.53 92.16 92 317 0.23 96.54 97305 0.46 92.61 93 318 0.21 96.75 97306 0.33 92.95 93 319 0.21 96.96 97307 0.42 93.36 93 320 0.17 97.13 97308 0.54 93.91 94 321 0.10 97.23 97309 0.29 94.20 94 322 0.31 97.53 98310 0.38 94.58 95 323 0.17 97.70 98311 0.18 94.77 95 324 0.13 97.83 98312 0.17 94.94 95 325 0.20 98.03 98313 0.19 95.13 95 326 0.22 98.25 98314 0.41 95.54 96 327 0.22 98.47 98315 0.23 95.78 96 328 0.02 98.49 98316 0.54 96.32 96 ≥329 0.20 98.69 99
.

Appendix C. Air Force Supplement C-5
TABLE C.2. ‘97 Air Force Administrative (A) Percentile ConversionCum. Cum.
AS % % A% AS % % A%≤55 0.14 1.50 1 95 1.62 38.97 3956 0.22 1.71 2 96 1.86 40.83 4157 0.23 1.94 2 97 1.99 42.82 4358 0.24 2.18 2 98 1.90 44.73 4559 0.28 2.47 2 99 1.95 46.67 4760 0.15 2.61 3 100 1.85 48.52 4961 0.22 2.83 3 101 1.72 50.25 5062 0.20 3.03 3 102 2.17 52.42 5263 0.22 3.25 3 103 2.12 54.54 5564 0.35 3.60 4 104 1.93 56.46 5665 0.28 3.88 4 105 2.23 58.69 5966 0.61 4.50 4 106 2.17 60.86 6167 0.22 4.72 5 107 2.13 62.99 6368 0.40 5.12 5 108 1.99 64.99 6569 0.52 5.64 6 109 1.92 66.90 6770 0.50 6.14 6 110 1.96 68.87 6971 0.61 6.75 7 111 1.82 70.68 7172 0.59 7.34 7 112 1.71 72.39 7273 0.72 8.06 8 113 1.92 74.31 7474 0.66 8.72 9 114 2.02 76.33 7675 0.86 9.58 10 115 1.63 77.96 7876 0.92 10.49 10 116 1.93 79.89 8077 0.98 11.48 11 117 1.98 81.86 8278 1.12 12.59 13 118 1.74 83.60 8479 1.09 13.68 14 119 1.72 85.32 8580 1.14 14.81 15 120 1.47 86.79 8781 1.48 16.29 16 121 1.59 88.39 8882 1.13 17.42 17 122 1.35 89.73 9083 1.10 18.52 19 123 1.20 90.94 9184 1.32 19.84 20 124 1.22 92.16 9285 1.30 21.14 21 125 0.93 93.09 9386 1.85 22.99 23 126 1.09 94.18 9487 1.77 24.76 25 127 0.80 94.98 9588 1.93 26.68 27 128 0.72 95.70 9689 1.69 28.38 28 129 0.59 96.29 9690 1.80 30.18 30 130 0.57 96.86 9791 1.76 31.94 32 131 0.57 97.43 9792 1.69 33.63 34 132 0.34 97.77 9893 1.59 35.23 35 133 0.40 98.17 9894 2.11 37.34 37 ≥134 0.43 98.60 99

C-6 Appendix C. Air Force Supplement
TABLE C.3. ‘97 Air Force General (G) Percentile ConversionCum. Cum.
GS % % G% GS % % G%≤51 0.12 1.42 1 94 2.23 35.64 3652 0.11 1.53 2 95 1.96 37.60 3853 0.19 1.72 2 96 2.22 39.82 4054 0.26 1.98 2 97 2.11 41.93 4255 0.11 2.09 2 98 2.48 44.42 4456 0.25 2.33 2 99 2.20 46.62 4757 0.15 2.48 2 100 2.08 48.70 4958 0.22 2.70 3 101 1.98 50.68 5159 0.28 2.98 3 102 2.18 52.86 5360 0.15 3.13 3 103 2.20 55.06 5561 0.30 3.43 3 104 2.05 57.12 5762 0.15 3.58 4 105 1.56 58.67 5963 0.25 3.83 4 106 2.83 61.50 6264 0.30 4.13 4 107 2.11 63.61 6465 0.36 4.49 4 108 2.43 66.03 6666 0.47 4.96 5 109 2.39 68.43 6867 0.45 5.41 5 110 1.93 70.35 7068 0.45 5.85 6 111 1.80 72.15 7269 0.52 6.38 6 112 2.30 74.45 7470 0.44 6.82 7 113 1.55 75.99 7671 0.46 7.28 7 114 2.17 78.16 7872 0.37 7.65 8 115 1.59 79.75 8073 0.52 8.17 8 116 1.66 81.41 8174 0.91 9.08 9 117 1.35 82.76 8375 0.51 9.59 10 118 1.42 84.18 8476 0.73 10.32 10 119 1.29 85.47 8577 0.82 11.14 11 120 1.25 86.72 8778 0.83 11.97 12 121 1.53 88.25 8879 0.79 12.76 13 122 1.20 89.45 8980 0.79 13.55 14 123 1.33 90.78 9181 1.37 14.92 15 124 1.01 91.79 9282 1.30 16.22 16 125 0.97 92.76 9383 1.14 17.36 17 126 0.84 93.60 9484 1.42 18.78 19 127 0.91 94.51 9585 1.06 19.85 20 128 0.63 95.13 9586 1.55 21.40 21 129 0.71 95.84 9687 1.43 22.83 23 130 0.40 96.25 9688 1.66 24.49 24 131 0.63 96.88 9789 1.45 25.93 26 132 0.45 97.33 9790 1.64 27.57 28 133 0.39 97.71 9891 1.96 29.53 30 134 0.47 98.18 9892 1.98 31.51 32 ≥ 135 0.37 98.56 9993 1.90 33.41 33

Appendix C. Air Force Supplement C-7
TABLE C.4. ‘97 Air Force Electrical (E) Percentile ConversionCum. Cum.
ES % % E% ES % % E%≤119 0.08 1.48 1 159 0.33 12.44 12120 0.14 1.62 2 160 0.53 12.97 13121 0.05 1.67 2 161 0.49 13.46 13122 0.20 1.87 2 162 0.38 13.84 14123 0.14 2.01 2 163 0.64 14.47 14124 0.12 2.14 2 164 0.65 15.13 15125 0.15 2.29 2 165 0.56 15.68 16126 0.10 2.39 2 166 0.49 16.17 16127 0.10 2.49 2 167 0.48 16.65 17128 0.15 2.64 3 168 0.63 17.28 17129 0.11 2.75 3 169 0.65 17.94 18130 0.19 2.94 3 170 0.89 18.82 19131 0.13 3.06 3 171 0.64 19.47 19132 0.13 3.20 3 172 0.90 20.37 20133 0.24 3.43 3 173 0.84 21.21 21134 0.26 3.69 4 174 0.77 21.98 22135 0.20 3.89 4 175 0.64 22.62 23136 0.26 4.14 4 176 0.82 23.44 23137 0.23 4.38 4 177 0.90 24.34 24138 0.21 4.58 5 178 1.09 25.44 25139 0.22 4.80 5 179 0.74 26.18 26140 0.16 4.96 5 180 1.32 27.50 27141 0.38 5.34 5 181 0.87 28.37 28142 0.26 5.60 6 182 1.20 29.56 30143 0.32 5.92 6 183 0.95 30.51 31144 0.25 6.17 6 184 0.97 31.48 31145 0.37 6.54 7 185 1.06 32.53 33146 0.15 6.69 7 186 1.05 33.58 34147 0.31 6.99 7 187 0.94 34.53 35148 0.35 7.35 7 188 1.24 35.77 36149 0.31 7.66 8 189 1.16 36.93 37150 0.44 8.09 8 190 1.14 38.08 38151 0.41 8.50 9 191 1.07 39.14 39152 0.37 8.87 9 192 1.03 40.17 40153 0.36 9.24 9 193 1.13 41.30 41154 0.52 9.76 10 194 1.28 42.58 43155 0.53 10.29 10 195 1.17 43.75 44156 0.51 10.80 11 196 1.12 44.87 45157 0.46 11.26 11 197 1.48 46.35 46158 0.85 12.12 12 198 1.10 47.45 47

C-8 Appendix C. Air Force Supplement
TABLE C.4. ‘97 Air Force Electrical (E) Percentile Conversion (continued)Cum. Cum.
ES % % E% ES % % E%199 1.07 48.53 49 236 0.76 86.04 86200 1.12 49.64 50 237 0.53 86.57 87201 1.38 51.02 51 238 0.69 87.26 87202 1.11 52.13 52 239 0.74 88.00 88203 1.15 53.28 53 240 0.47 88.47 88204 0.97 54.25 54 241 0.37 88.84 89205 1.11 55.36 55 242 0.60 89.44 89206 1.10 56.46 56 243 0.47 89.91 90207 1.19 57.65 58 244 0.69 90.61 91208 0.92 58.57 59 245 0.40 91.00 91209 1.17 59.74 60 246 0.19 91.19 91210 1.23 60.98 61 247 0.55 91.75 92211 1.26 62.24 62 248 0.42 92.17 92212 1.33 63.57 64 249 0.47 92.64 93213 1.23 64.80 65 250 0.47 93.11 93214 1.25 66.05 66 251 0.43 93.54 94215 1.22 67.27 67 252 0.52 94.06 94216 1.04 68.31 68 253 0.33 94.39 94217 0.86 69.17 69 254 0.32 94.71 95218 0.95 70.12 70 255 0.29 95.00 95219 0.88 70.99 71 256 0.25 95.26 95220 0.88 71.87 72 257 0.30 95.56 96221 1.19 73.06 73 258 0.36 95.92 96222 1.11 74.17 74 259 0.37 96.29 96223 0.87 75.04 75 260 0.20 96.49 96224 0.79 75.84 76 261 0.20 96.69 97225 0.54 76.38 76 262 0.20 96.89 97226 1.00 77.37 77 263 0.19 97.08 97227 1.19 78.56 79 264 0.20 97.28 97228 1.06 79.62 80 265 0.26 97.54 98229 1.04 80.66 81 266 0.22 97.76 98230 0.79 81.45 81 267 0.12 97.88 98231 0.79 82.24 82 268 0.11 97.99 98232 0.92 83.16 83 269 0.20 98.19 98233 0.65 83.81 84 270 0.12 98.31 98234 0.69 84.49 84 271 0.15 98.46 98235 0.79 85.28 85 ≥272 0.12 98.58 99

Appendix C. Air Force Supplement C-9
TABLE C.5. Air Force Regular AFQT Distributions for 1980 and 1997Scales
AFQT 1980 1997Score % Qual. % Qual.
1 0.05 100.00 0.04 100.002 0.01 99.95 0.05 99.963 0.03 99.94 0.06 99.914 0.07 99.91 0.24 99.85
5 0.06 99.85 0.15 99.616 0.07 99.79 0.20 99.467 0.06 99.71 0.27 99.268 0.11 99.65 0.17 98.999 0.09 99.54 0.42 98.83
10 0.11 99.45 0.28 98.4011 0.11 99.34 0.47 98.1212 0.16 99.24 0.19 97.6513 0.25 99.07 0.40 97.4614 0.10 98.83 0.23 97.07
15 0.27 98.73 0.49 96.8316 0.26 98.46 0.60 96.3417 0.29 98.20 0.66 95.7518 0.35 97.90 0.34 95.0919 0.40 97.55 0.78 94.75
20 0.21 97.16 0.44 93.9721 0.56 96.94 0.49 93.5322 0.57 96.38 0.96 93.0423 0.67 95.81 0.55 92.0824 0.37 95.13 0.61 91.54
25 0.82 94.76 1.26 90.9326 0.40 93.94 0.68 89.6627 0.98 93.54 0.69 88.9828 0.53 92.56 0.70 88.3029 1.15 92.03 0.73 87.60
30 0.61 90.89 0.85 86.8631 0.70 90.28 0.87 86.0132 1.33 89.58 0.86 85.1533 0.76 88.25 0.93 84.2934 0.79 87.48 0.98 83.35
Note. See Section 4.2 for explaination ofcontents.

C-10 Appendix C. Air Force Supplement

Appendix C. Air Force Supplement C-11
TABLE C.5. Air Force Regular AFQT Distributions for 1980 and 1997Scales (continued)
AFQT 1980 1997Score % Qual. % Qual.
35 1.70 86.70 2.02 82.3836 0.86 85.00 1.07 80.3537 0.98 84.14 0.00 79.2838 0.97 83.16 1.17 79.2839 1.01 82.20 1.18 78.10
40 1.13 81.19 1.24 76.9341 1.13 80.06 1.21 75.6842 2.38 78.94 1.25 74.4743 1.20 76.55 1.27 73.2244 1.21 75.35 1.35 71.95
45 1.27 74.14 1.30 70.6046 1.34 72.87 1.42 69.3047 1.37 71.54 1.43 67.8848 1.38 70.17 1.48 66.4549 1.40 68.79 1.54 64.97
50 1.43 67.38 1.49 63.4351 1.50 65.96 1.48 61.9452 1.51 64.46 1.58 60.4653 3.16 62.94 1.59 58.8854 1.61 59.78 1.55 57.28
55 1.55 58.17 1.61 55.7356 1.65 56.62 1.64 54.1357 1.52 54.98 1.62 52.4958 1.69 53.45 0.00 50.8759 1.58 51.76 1.61 50.87
60 0.00 50.18 1.67 49.2661 1.70 50.18 1.64 47.6062 1.74 48.48 1.67 45.9663 1.70 46.74 1.55 44.2964 1.65 45.04 1.53 42.74
65 1.73 43.39 0.00 41.2166 1.64 41.66 1.57 41.2167 1.71 40.02 1.55 39.6468 1.54 38.31 1.60 38.0969 1.73 36.77 1.49 36.49
Note. See Section 4.2 for explaination ofcontents.

C-12 Appendix C. Air Force Supplement

Appendix C. Air Force Supplement C-13
TABLE C.5. Air Force Regular AFQT Distributions for 1980 and 1997Scales (continued)
AFQT 1980 1997Score % Qual. % Qual.
70 1.61 35.04 2.84 35.0071 1.52 33.43 1.35 32.1672 1.47 31.91 1.47 30.8173 1.54 30.44 1.33 29.3474 1.49 28.90 1.30 28.00
75 1.55 27.41 1.40 26.7076 1.39 25.86 1.35 25.2977 1.39 24.48 1.22 23.9578 1.40 23.08 1.21 22.7279 1.29 21.68 1.17 21.51
80 2.62 20.39 1.13 20.3481 1.29 17.77 1.07 19.2182 1.22 16.48 2.13 18.1483 0.00 15.25 1.05 16.0184 2.37 15.25 1.00 14.96
85 1.11 12.89 1.84 13.9686 0.96 11.78 0.83 12.1187 1.07 10.83 0.84 11.2888 0.92 9.76 1.47 10.4589 0.88 8.84 0.71 8.98
90 0.83 7.95 1.26 8.2691 0.79 7.12 0.55 7.0092 0.70 6.33 1.03 6.4593 0.74 5.63 1.43 5.4294 0.63 4.89 0.76 4.00
95 0.63 4.26 0.94 3.2496 0.53 3.63 0.67 2.3097 0.58 3.09 0.67 1.6398 0.39 2.51 0.53 0.9699 2.12 2.12 0.43 0.43
Note. See Section 4.2 for explaination ofcontents.

C-14 Appendix C. Air Force Supplement

Appendix C. Air Force Supplement C-15
TABLE C.6. Air Force Reserve AFQT Distributions for 1980 and 1997Scales
AFQT 1980 1997Score % Qual. % Qual.
1 0.11 100.00 0.10 100.002 0.05 99.89 0.08 99.903 0.00 99.84 0.08 99.824 0.08 99.84 0.23 99.74
5 0.08 99.75 0.25 99.516 0.07 99.67 0.16 99.267 0.05 99.61 0.36 99.108 0.10 99.56 0.20 98.749 0.11 99.46 0.44 98.54
10 0.10 99.34 0.34 98.1011 0.16 99.25 0.34 97.7512 0.21 99.08 0.18 97.4113 0.33 98.87 0.36 97.2314 0.15 98.54 0.25 96.87
15 0.28 98.39 0.46 96.6216 0.31 98.11 0.56 96.1617 0.34 97.80 0.62 95.6018 0.39 97.46 0.26 94.9819 0.34 97.06 0.62 94.72
20 0.23 96.72 0.36 94.1021 0.38 96.49 0.46 93.7322 0.64 96.11 0.71 93.2823 0.56 95.47 0.41 92.5724 0.34 94.92 0.66 92.16
25 0.62 94.57 1.26 91.5026 0.28 93.95 0.62 90.2427 0.89 93.67 0.66 89.6228 0.51 92.78 0.82 88.9629 1.25 92.27 0.82 88.14
30 0.41 91.03 0.74 87.3231 0.75 90.62 0.85 86.5832 1.34 89.86 0.98 85.7333 0.75 88.52 1.02 84.7534 0.84 87.76 0.97 83.73
Note. See Section 4.2 for explaination ofcontents.

C-16 Appendix C. Air Force Supplement

Appendix C. Air Force Supplement C-17
TABLE C.6. Air Force Reserve AFQT Distributions for 1980 and 1997Scales (continued)
AFQT 1980 1997Score % Qual. % Qual.
35 1.67 86.93 1.67 82.7636 0.87 85.26 1.03 81.0937 0.97 84.39 0.00 80.0638 0.93 83.42 0.85 80.0639 0.89 82.48 0.92 79.20
40 1.02 81.60 1.00 78.2841 1.05 80.58 1.07 77.2842 1.74 79.53 1.03 76.2243 0.90 77.79 1.02 75.1844 1.12 76.89 1.25 74.17
45 1.23 75.77 1.02 72.9246 1.28 74.54 0.98 71.9047 1.25 73.27 1.28 70.9248 1.18 72.02 1.20 69.6449 1.03 70.84 1.28 68.44
50 1.25 69.80 1.26 67.1651 1.46 68.56 1.49 65.9052 1.25 67.10 1.18 64.4153 2.95 65.85 1.49 63.2354 1.36 62.90 1.36 61.74
55 1.61 61.54 1.30 60.3756 1.66 59.93 1.64 59.0857 1.54 58.27 1.33 57.4458 1.43 56.73 0.00 56.1159 1.62 55.31 1.82 56.11
60 0.00 53.68 1.79 54.2961 1.64 53.68 1.57 52.5062 1.75 52.04 1.62 50.9363 1.80 50.29 1.59 49.3064 1.56 48.48 1.41 47.71
65 1.56 46.92 0.00 46.3066 1.89 45.37 1.56 46.3067 1.66 43.48 1.57 44.7468 1.46 41.82 1.48 43.1769 1.75 40.36 1.57 41.69
Note. See Section 4.2 for explaination ofcontents.

C-18 Appendix C. Air Force Supplement

Appendix C. Air Force Supplement C-19
TABLE C.6. Air Force Reserve AFQT Distributions for 1980 and 1997Scales (continued)
AFQT 1980 1997Score % Qual. % Qual.
70 1.26 38.61 3.20 40.1271 1.66 37.35 1.39 36.9272 1.56 35.69 1.16 35.5373 1.48 34.13 1.66 34.3674 1.43 32.66 1.31 32.70
75 1.36 31.23 1.39 31.3976 1.54 29.87 1.12 30.0077 1.57 28.33 1.23 28.8878 1.18 26.75 1.13 27.6579 1.25 25.57 1.12 26.52
80 2.84 24.32 0.92 25.4181 1.34 21.49 1.26 24.4982 1.44 20.14 2.16 23.2283 0.00 18.70 1.02 21.0684 2.54 18.70 1.05 20.04
85 1.13 16.16 2.25 18.9986 1.34 15.02 1.28 16.7587 1.16 13.68 1.07 15.4788 0.85 12.51 1.79 14.4089 1.08 11.66 0.72 12.61
90 1.21 10.58 1.56 11.8991 0.97 9.37 0.66 10.3392 0.75 8.40 1.39 9.6893 0.95 7.64 2.00 8.2894 0.72 6.69 1.23 6.28
95 0.64 5.97 1.26 5.0596 0.71 5.33 1.00 3.7997 0.85 4.63 1.05 2.7998 0.62 3.77 0.80 1.7499 3.15 3.15 0.93 0.93
Note. See Section 4.2 for explaination ofcontents.

C-20 Appendix C. Air Force Supplement

Appendix C. Air Force Supplement C-21
TABLE C.7. Air Force Guard AFQT Distributions for 1980 and 1997 ScalesAFQT 1980 1997Score % Qual. % Qual.
1 0.06 100.00 0.06 100.002 0.13 99.94 0.19 99.943 0.07 99.81 0.11 99.764 0.11 99.75 0.44 99.65
5 0.13 99.63 0.32 99.206 0.10 99.50 0.35 98.887 0.15 99.40 0.51 98.538 0.21 99.25 0.28 98.029 0.15 99.04 0.53 97.74
10 0.18 98.88 0.27 97.2111 0.24 98.71 0.52 96.9512 0.18 98.46 0.17 96.4313 0.46 98.28 0.31 96.2614 0.19 97.82 0.32 95.95
15 0.30 97.63 0.52 95.6316 0.25 97.33 0.65 95.1117 0.29 97.08 0.75 94.4518 0.54 96.79 0.41 93.7019 0.38 96.25 0.74 93.29
20 0.31 95.87 0.39 92.5521 0.64 95.56 0.32 92.1622 0.64 94.92 0.90 91.8423 0.68 94.28 0.68 90.9524 0.30 93.60 0.54 90.27
25 0.85 93.30 1.01 89.7326 0.39 92.45 0.63 88.7227 0.95 92.06 0.52 88.0928 0.62 91.11 0.56 87.5729 0.93 90.49 0.69 87.01
30 0.44 89.56 0.68 86.3231 0.64 89.12 0.59 85.6432 1.26 88.48 0.55 85.0633 0.61 87.22 0.81 84.5034 0.59 86.61 0.80 83.70
Note. See Section 4.2 for explaination ofcontents.

C-22 Appendix C. Air Force Supplement

Appendix C. Air Force Supplement C-23
TABLE C.7. Air Force Guard AFQT Distributions for 1980 and 1997 Scales(continued)
AFQT 1980 1997Score % Qual. % Qual.
35 1.17 86.02 1.70 82.9036 0.79 84.85 1.00 81.2037 0.82 84.06 0.00 80.2038 0.80 83.24 0.82 80.2039 0.75 82.45 0.95 79.38
40 0.85 81.69 1.06 78.4341 0.89 80.84 0.95 77.3742 2.35 79.96 0.95 76.4143 0.85 77.61 1.10 75.4644 1.06 76.76 1.02 74.37
45 1.23 75.69 1.16 73.3546 1.00 74.47 1.03 72.1947 1.02 73.47 1.20 71.1648 0.92 72.45 1.21 69.9649 1.13 71.53 0.97 68.75
50 1.14 70.40 1.18 67.7851 1.10 69.26 1.24 66.6052 1.15 68.17 1.23 65.3653 2.47 67.02 1.11 64.1354 1.59 64.55 1.34 63.02
55 1.26 62.96 1.41 61.6856 1.26 61.69 1.34 60.2857 1.20 60.43 1.27 58.9458 1.53 59.24 0.00 57.6659 1.23 57.71 1.28 57.66
60 0.00 56.48 1.32 56.3861 1.54 56.48 1.22 55.0662 1.42 54.94 1.52 53.8563 1.47 53.53 1.49 52.3364 1.67 52.05 1.56 50.84
65 1.47 50.38 0.00 49.2866 1.44 48.91 1.48 49.2867 1.51 47.47 1.41 47.7968 1.58 45.97 1.27 46.3969 1.60 44.38 1.36 45.11
Note. See Section 4.2 for explaination ofcontents.

C-24 Appendix C. Air Force Supplement

Appendix C. Air Force Supplement C-25
TABLE C.7. Air Force Guard AFQT Distributions for 1980 and 1997 Scales(continued)
AFQT 1980 1997Score % Qual. % Qual.
70 1.36 42.78 2.94 43.7571 1.82 41.42 1.51 40.8172 1.55 39.60 1.29 39.3073 1.46 38.05 1.18 38.0174 1.15 36.59 1.37 36.82
75 1.43 35.44 1.41 35.4576 1.54 34.01 1.29 34.0577 1.35 32.47 1.33 32.7578 1.51 31.12 1.31 31.4279 1.54 29.62 1.31 30.12
80 3.21 28.08 1.32 28.8181 1.36 24.87 1.37 27.4982 1.53 23.51 2.62 26.1283 0.00 21.98 1.02 23.5084 2.77 21.98 1.34 22.48
85 1.25 19.21 2.25 21.1486 1.05 17.96 1.01 18.8987 1.44 16.91 0.90 17.8988 1.15 15.47 2.19 16.9989 1.28 14.32 1.06 14.80
90 1.23 13.04 1.64 13.7491 1.23 11.81 0.85 12.1092 1.12 10.58 1.73 11.2593 1.01 9.46 2.01 9.5294 0.87 8.46 1.26 7.50
95 1.01 7.58 1.74 6.2496 0.89 6.57 1.26 4.5097 1.02 5.69 1.22 3.2498 0.74 4.67 1.05 2.0399 3.93 3.93 0.97 0.97
Note. See Section 4.2 for explaination ofcontents.

C-26 Appendix C. Air Force Supplement
TABLE C.8. Subgroup Qualification Rates (Air Force Regular)
Scale Qualification Ratesa
White ( N = 38,692)1980 7.1 (93) 50.3 (65) 74.7 (50) 81.0 (45)1997 6.8 (93) 48.3 (65) 71.1 (50) 77.9 (45)1997 6.8 (93) 49.9 (64) 75.3 (47) 81.4 (42)
1980 87.1 (40) 91.4 (35) 94.1 (31) 98.4 (21)1997 83.5 (40) 88.1 (35) 90.9 (31) 96.3 (21)1997 86.5 (36) 91.6 (30) 93.7 (26) 98.4 (15)
Black ( N = 9,482)1980 1.3 (93) 21.7 (65) 45.4 (50) 53.8 (45)1997 1.2 (93) 20.0 (65) 40.6 (50) 49.1 (45)1997 1.2 (93) 21.1 (64) 45.8 (47) 54.1 (42)
1980 63.9 (40) 73.0 (35) 79.1 (31) 93.0 (21)1997 57.8 (40) 65.5 (35) 71.8 (31) 85.4 (21)1997 62.4 (36) 73.0 (30) 77.8 (26) 92.7 (15)
Hispanic ( N = 3,493)1980 1.8 (93) 29.1 (65) 51.7 (50) 59.7 (45)1997 1.7 (93) 25.9 (65) 46.8 (50) 54.7 (45)1997 1.7 (93) 27.4 (64) 51.4 (47) 59.8 (42)
1980 68.2 (40) 76.3 (35) 82.3 (31) 93.4 (21)1997 62.6 (40) 69.8 (35) 74.8 (31) 87.9 (21)1997 67.1 (36) 76.4 (30) 81.5 (26) 93.1 (15)
Other ( N = 3,320)1980 5.1 (93) 39.4 (65) 60.9 (50) 67.8 (45)1997 4.9 (93) 35.9 (65) 56.4 (50) 63.6 (45)1997 4.9 (93) 37.3 (64) 61.2 (47) 67.6 (42)
1980 75.6 (40) 82.0 (35) 86.4 (31) 94.8 (21)1997 70.2 (40) 76.9 (35) 81.1 (31) 90.2 (21)1997 74.4 (36) 82.1 (30) 85.0 (26) 94.8 (15)Note. See Section 4.5 for explaination of contents.aAFQT cut-scores are provided in parentheses.

Appendix C. Air Force Supplement C-27
TABLE C.9. Subgroup Qualification Rates (Air Force Reserve)
Scale Qualification Ratesa
White ( N = 3,789)1980 10.7 (93) 57.9 (65) 79.5 (50) 84.4 (45)1997 11.6 (93) 57.3 (65) 77.5 (50) 82.1 (45)1997 11.6 (93) 58.7 (64) 80.5 (47) 84.7 (42)
1980 88.8 (40) 92.6 (35) 94.9 (31) 98.2 (21)1997 86.6 (40) 89.7 (35) 92.4 (31) 96.9 (21)1997 88.4 (36) 92.9 (30) 94.6 (26) 98.3 (15)
Black ( N = 1,494)1980 1.2 (93) 23.6 (65) 48.7 (50) 57.0 (45)1997 1.7 (93) 22.6 (65) 44.9 (50) 53.0 (45)1997 1.7 (93) 24.4 (64) 49.9 (47) 58.0 (42)
1980 66.5 (40) 75.2 (35) 81.9 (31) 93.0 (21)1997 60.8 (40) 68.3 (35) 74.6 (31) 87.3 (21)1997 65.6 (36) 75.8 (30) 81.3 (26) 93.0 (15)
Hispanic ( N = 343)1980 3.5 (93) 32.4 (65) 61.2 (50) 67.1 (45)1997 4.1 (93) 31.8 (65) 58.6 (50) 65.0 (45)1997 4.1 (93) 32.4 (64) 63.6 (47) 67.3 (42)
1980 75.8 (40) 83.7 (35) 87.5 (31) 95.0 (21)1997 69.4 (40) 77.8 (35) 83.4 (31) 89.8 (21)1997 74.9 (36) 83.4 (30) 86.9 (26) 95.6 (15)
Other ( N = 471)1980 6.6 (93) 43.5 (65) 65.2 (50) 72.4 (45)1997 5.5 (93) 43.3 (65) 60.9 (50) 68.2 (45)1997 5.5 (93) 44.8 (64) 65.8 (47) 72.2 (42)
1980 76.0 (40) 80.9 (35) 85.8 (31) 94.7 (21)1997 73.7 (40) 76.6 (35) 79.8 (31) 91.5 (21)1997 75.6 (36) 81.7 (30) 85.8 (26) 95.1 (15)Note. See Section 4.5 for explaination of contents.aAFQT cut-scores are provided in parentheses.

C-28 Appendix C. Air Force Supplement
TABLE C.10. Subgroup Qualification Rates (Air Force Guard)
Scale Qualification Ratesa
White ( N = 6,548)1980 11.8 (93) 58.7 (65) 78.6 (50) 83.6 (45)1997 11.8 (93) 57.7 (65) 76.5 (50) 81.6 (45)1997 11.8 (93) 59.2 (64) 79.4 (47) 84.4 (42)
1980 88.7 (40) 92.1 (35) 94.3 (31) 98.5 (21)1997 86.1 (40) 89.6 (35) 91.7 (31) 96.5 (21)1997 88.3 (36) 92.3 (30) 94.1 (26) 98.5 (15)
Black ( N = 1,105)1980 2.2 (93) 24.7 (65) 46.4 (50) 54.0 (45)1997 2.3 (93) 23.2 (65) 43.1 (50) 50.0 (45)1997 2.3 (93) 24.9 (64) 48.1 (47) 54.8 (42)
1980 63.5 (40) 70.5 (35) 76.8 (31) 90.4 (21)1997 58.1 (40) 66.0 (35) 70.1 (31) 82.5 (21)1997 63.2 (36) 71.6 (30) 75.7 (26) 90.5 (15)
Hispanic ( N = 693)1980 2.0 (93) 22.9 (65) 41.1 (50) 46.5 (45)1997 1.9 (93) 21.5 (65) 36.2 (50) 43.4 (45)1997 1.9 (93) 23.2 (64) 40.5 (47) 46.6 (42)
1980 54.7 (40) 60.6 (35) 65.7 (31) 79.7 (21)1997 49.5 (40) 55.8 (35) 60.3 (31) 71.1 (21)1997 53.4 (36) 61.0 (30) 65.1 (26) 79.8 (15)
Other ( N = 689)1980 6.7 (93) 40.2 (65) 60.1 (50) 65.2 (45)1997 7.0 (93) 39.5 (65) 56.6 (50) 62.8 (45)1997 7.0 (93) 40.8 (64) 60.5 (47) 65.2 (42)
1980 71.7 (40) 78.7 (35) 82.9 (31) 92.3 (21)1997 67.5 (40) 73.3 (35) 78.1 (31) 87.5 (21)1997 70.4 (36) 78.8 (30) 82.4 (26) 92.6 (15)Note. See Section 4.5 for explaination of contents.aAFQT cut-scores are provided in parentheses.

Appendix C. Air Force Supplement C-29
TABLE C.11. Gender Qualification Rates (Air Force Regular)
Scale Qualification Ratesa
Males ( N = 39,542)1980 6.6 (93) 47.0 (65) 70.4 (50) 76.8 (45)1997 6.3 (93) 44.8 (65) 66.6 (50) 73.5 (45)1997 6.3 (93) 46.4 (64) 70.9 (47) 77.1 (42)
1980 83.3 (40) 88.3 (35) 91.5 (31) 97.3 (21)1997 79.3 (40) 84.4 (35) 87.7 (31) 94.4 (21)1997 82.5 (36) 88.5 (30) 91.0 (26) 97.2 (15)
Females ( N = 15,444)1980 3.2 (93) 34.0 (65) 59.7 (50) 67.4 (45)1997 3.1 (93) 31.9 (65) 55.2 (50) 63.3 (45)1997 3.1 (93) 33.4 (64) 60.2 (47) 67.7 (42)
1980 75.8 (40) 82.6 (35) 87.0 (31) 95.9 (21)1997 70.7 (40) 77.2 (35) 81.7 (31) 91.4 (21)1997 74.8 (36) 82.7 (30) 86.2 (26) 95.8 (15)Note. See Section 4.5 for explaination of contents.aAFQT cut-scores are provided in parentheses.

C-30 Appendix C. Air Force Supplement
TABLE C.12. Gender Qualification Rates (Air Force Reserve)
Scale Qualification Ratesa
Males ( N = 4,174)1980 9.5 (93) 52.2 (65) 74.8 (50) 80.1 (45)1997 10.2 (93) 51.5 (65) 72.7 (50) 77.4 (45)1997 10.2 (93) 53.1 (64) 75.8 (47) 80.5 (42)
1980 85.4 (40) 90.2 (35) 93.0 (31) 97.2 (21)1997 82.3 (40) 86.4 (35) 89.8 (31) 95.2 (21)1997 84.7 (36) 90.4 (30) 92.7 (26) 97.4 (15)
Females ( N = 1,923)1980 3.7 (93) 35.5 (65) 59.0 (50) 66.5 (45)1997 4.2 (93) 35.1 (65) 55.2 (50) 63.1 (45)1997 4.2 (93) 36.1 (64) 60.4 (47) 67.0 (42)
1980 73.4 (40) 79.9 (35) 85.5 (31) 95.0 (21)1997 69.5 (40) 74.9 (35) 79.6 (31) 90.5 (21)1997 73.2 (36) 80.6 (30) 84.9 (26) 95.0 (15)Note. See Section 4.5 for explaination of contents.aAFQT cut-scores are provided in parentheses.

Appendix C. Air Force Supplement C-31
TABLE C.13. Gender Qualification Rates (Air Force Guard)
Scale Qualification Ratesa
Males ( N = 6,757)1980 10.9 (93) 53.8 (65) 73.3 (50) 78.3 (45)1997 10.8 (93) 52.7 (65) 70.9 (50) 76.3 (45)1997 10.8 (93) 54.3 (64) 74.1 (47) 79.1 (42)
1980 83.5 (40) 87.6 (35) 90.2 (31) 95.8 (21)1997 80.7 (40) 84.7 (35) 87.2 (31) 92.8 (21)1997 83.1 (36) 87.7 (30) 89.9 (26) 95.9 (15)
Females ( N = 2,278)1980 5.2 (93) 40.2 (65) 61.7 (50) 68.0 (45)1997 5.6 (93) 39.1 (65) 58.5 (50) 64.6 (45)1997 5.6 (93) 40.6 (64) 62.4 (47) 68.5 (42)
1980 76.2 (40) 81.5 (35) 85.8 (31) 94.8 (21)1997 71.6 (40) 77.7 (35) 81.1 (31) 90.2 (21)1997 75.5 (36) 82.1 (30) 85.2 (26) 94.9 (15)Note. See Section 4.5 for explaination of contents.aAFQT cut-scores are provided in parentheses.

C-32 Appendix C. Air Force Supplement
TABLE C.14. Subgroup Qualification Distributions (Air Force Regular)Score- AFQTScale Cut White Black Hispanic Other
1980 93 88.6 4.0 2.0 5.41997 93 88.7 3.9 1.9 5.51997 93 88.7 3.9 1.9 5.5
1980 65 81.6 8.6 4.3 5.51997 65 82.4 8.4 4.0 5.31997 64 82.2 8.5 4.1 5.3
1980 50 78.0 11.6 4.9 5.51997 50 78.9 11.0 4.7 5.41997 47 78.1 11.6 4.8 5.4
1980 45 76.9 12.5 5.1 5.51997 45 77.7 12.0 4.9 5.41997 42 76.9 12.5 5.1 5.5
1980 40 75.5 13.6 5.3 5.61997 40 76.4 13.0 5.2 5.51997 36 75.7 13.4 5.3 5.6
1980 35 74.2 14.5 5.6 5.71997 35 75.3 13.7 5.4 5.61997 30 74.2 14.5 5.6 5.7
1980 31 73.3 15.1 5.8 5.81997 31 74.4 14.4 5.5 5.71997 26 73.5 15.0 5.8 5.7
1980 21 71.4 16.5 6.1 5.91997 21 72.5 15.7 6.0 5.81997 15 71.5 16.5 6.1 5.9

Appendix C. Air Force Supplement C-33
TABLE C.15. Subgroup Qualification Distributions (Air Force Reserve)Score- AFQTScale Cut White Black Hispanic Other
1980 93 86.9 3.9 2.6 6.71997 93 87.1 5.0 2.8 5.11997 93 87.1 5.0 2.8 5.1
1980 65 76.6 12.3 3.9 7.21997 65 76.9 12.0 3.9 7.21997 64 76.4 12.5 3.8 7.3
1980 50 70.8 17.1 4.9 7.21997 50 71.7 16.4 4.9 7.01997 47 70.6 17.2 5.0 7.2
1980 45 69.2 18.4 5.0 7.41997 45 70.0 17.8 5.0 7.21997 42 69.1 18.6 5.0 7.3
1980 40 67.6 20.0 5.2 7.21997 40 68.7 19.0 5.0 7.31997 36 67.8 19.8 5.2 7.2
1980 35 66.2 21.2 5.4 7.21997 35 67.3 20.2 5.3 7.21997 30 66.1 21.3 5.4 7.2
1980 31 65.1 22.2 5.4 7.31997 31 66.3 21.1 5.4 7.11997 26 65.2 22.1 5.4 7.3
1980 21 63.3 23.6 5.5 7.61997 21 64.2 22.8 5.4 7.51997 15 63.2 23.6 5.6 7.6

C-34 Appendix C. Air Force Supplement
TABLE C.16. Subgroup Qualification Distributions (Air Force Guard)Score- AFQTScale Cut White Black Hispanic Other
1980 93 90.2 2.8 1.6 5.41997 93 90.0 2.9 1.5 5.61997 93 90.0 2.9 1.5 5.6
1980 65 84.4 6.0 3.5 6.11997 65 84.8 5.8 3.3 6.11997 64 84.4 6.0 3.5 6.1
1980 50 80.9 8.1 4.5 6.51997 50 81.8 7.8 4.1 6.41997 47 80.9 8.3 4.4 6.5
1980 45 80.0 8.7 4.7 6.61997 45 80.6 8.3 4.5 6.51997 42 80.1 8.8 4.7 6.5
1980 40 78.7 9.5 5.1 6.71997 40 79.5 9.1 4.8 6.61997 36 78.8 9.5 5.0 6.6
1980 35 77.6 10.0 5.4 7.01997 35 78.4 9.7 5.2 6.71997 30 77.5 10.1 5.4 7.0
1980 31 76.7 10.5 5.7 7.11997 31 77.6 10.0 5.4 7.01997 26 76.8 10.4 5.6 7.1
1980 21 74.7 11.6 6.4 7.41997 21 75.9 11.0 5.9 7.21997 15 74.6 11.6 6.4 7.4

Appendix C. Air Force Supplement C-35
TABLE C.17. Gender Qualification Distributions (Air Force Regular)Score- AFQTScale Cut Males Females
1980 93 83.9 16.11997 93 83.7 16.31997 93 83.7 16.3
1980 65 78.0 22.01997 65 78.2 21.81997 64 78.1 21.9
1980 50 75.1 24.91997 50 75.5 24.51997 47 75.1 24.9
1980 45 74.5 25.51997 45 74.8 25.21997 42 74.5 25.5
1980 40 73.8 26.21997 40 74.2 25.81997 36 73.9 26.1
1980 35 73.2 26.81997 35 73.7 26.31997 30 73.3 26.7
1980 31 72.9 27.11997 31 73.3 26.71997 26 73.0 27.0
1980 21 72.2 27.81997 21 72.6 27.41997 15 72.2 27.8

C-36 Appendix C. Air Force Supplement
TABLE C.18. Gender Qualification Distributions (Air Force Reserve)Score- AFQTScale Cut Males Females
1980 93 84.8 15.21997 93 84.0 16.01997 93 84.0 16.0
1980 65 76.1 23.91997 65 76.1 23.91997 64 76.1 23.9
1980 50 73.3 26.71997 50 74.1 25.91997 47 73.1 26.9
1980 45 72.3 27.71997 45 72.7 27.31997 42 72.3 27.7
1980 40 71.6 28.41997 40 72.0 28.01997 36 71.5 28.5
1980 35 71.0 29.01997 35 71.4 28.61997 30 70.9 29.1
1980 31 70.2 29.81997 31 71.0 29.01997 26 70.3 29.7
1980 21 68.9 31.11997 21 69.5 30.51997 15 69.0 31.0

Appendix C. Air Force Supplement C-37
TABLE C.19. Gender Qualification Distributions (Air Force Guard)Score- AFQTScale Cut Males Females
1980 93 86.2 13.81997 93 85.2 14.81997 93 85.2 14.8
1980 65 79.9 20.11997 65 80.0 20.01997 64 79.8 20.2
1980 50 77.9 22.11997 50 78.2 21.81997 47 77.9 22.1
1980 45 77.4 22.61997 45 77.8 22.21997 42 77.4 22.6
1980 40 76.5 23.51997 40 77.0 23.01997 36 76.6 23.4
1980 35 76.1 23.91997 35 76.4 23.61997 30 76.0 24.0
1980 31 75.7 24.31997 31 76.1 23.91997 26 75.8 24.2
1980 21 75.0 25.01997 21 75.3 24.71997 15 75.0 25.0

C-38 Appendix C. Air Force Supplement

Appendix DMarine Corps Supplement

D-2 Appendix D. Marine Corps Supplement

Appendix D. Marine Corps Supplement D-3
TABLE D.1. Marine Corps Regular AFQT Distributions for 1980 and 1997Scales
AFQT 1980 1997Score % Qual. % Qual.
1 0.10 100.00 0.07 100.002 0.03 99.90 0.08 99.933 0.04 99.87 0.11 99.854 0.08 99.83 0.31 99.74
5 0.08 99.75 0.24 99.436 0.10 99.67 0.26 99.197 0.06 99.57 0.37 98.938 0.15 99.51 0.23 98.559 0.14 99.36 0.62 98.32
10 0.18 99.22 0.45 97.7011 0.18 99.04 0.66 97.2612 0.24 98.86 0.28 96.6013 0.35 98.62 0.56 96.3114 0.17 98.27 0.28 95.75
15 0.33 98.10 0.68 95.4716 0.44 97.77 0.76 94.7917 0.51 97.33 0.84 94.0318 0.59 96.81 0.52 93.1819 0.50 96.22 0.99 92.66
20 0.37 95.72 0.52 91.6721 0.68 95.35 0.53 91.1522 0.82 94.66 1.36 90.6123 0.91 93.84 0.67 89.2524 0.55 92.94 0.75 88.58
25 1.05 92.39 1.67 87.8426 0.66 91.33 0.76 86.1627 1.21 90.67 0.86 85.4028 0.63 89.46 0.93 84.5529 1.46 88.83 0.95 83.61
30 0.80 87.37 0.99 82.6631 0.81 86.56 1.09 81.6732 1.71 85.75 1.13 80.5933 0.95 84.04 1.08 79.4634 0.92 83.09 1.08 78.38
Note. See Section 4.2 for explaination ofcontents.

D-4 Appendix D. Marine Corps Supplement

Appendix D. Marine Corps Supplement D-5
TABLE D.1. Marine Corps Regular AFQT Distributions for 1980 and 1997Scales (continued)
AFQT 1980 1997Score % Qual. % Qual.
35 2.20 82.18 2.35 77.3036 0.99 79.97 1.26 74.9637 1.09 78.99 0.00 73.7038 1.16 77.90 1.39 73.7039 1.13 76.73 1.34 72.30
40 1.18 75.60 1.35 70.9641 1.22 74.41 1.36 69.6142 2.68 73.20 1.35 68.2543 1.30 70.52 1.42 66.9044 1.27 69.22 1.32 65.48
45 1.39 67.95 1.44 64.1646 1.30 66.56 1.50 62.7247 1.40 65.26 1.51 61.2348 1.41 63.85 1.53 59.7249 1.51 62.45 1.59 58.19
50 1.34 60.94 1.56 56.6051 1.63 59.60 1.55 55.0352 1.61 57.97 1.55 53.4953 3.09 56.35 1.65 51.9454 1.70 53.27 1.59 50.29
55 1.63 51.56 1.66 48.6956 1.57 49.93 1.61 47.0357 1.42 48.36 1.60 45.4258 1.71 46.94 0.00 43.8259 1.53 45.22 1.52 43.82
60 0.00 43.69 1.56 42.2961 1.79 43.69 1.58 40.7462 1.63 41.90 1.54 39.1663 1.66 40.26 1.48 37.6264 1.41 38.60 1.49 36.14
65 1.69 37.19 0.00 34.6566 1.58 35.50 1.47 34.6567 1.62 33.93 1.51 33.1868 1.42 32.30 1.43 31.6769 1.53 30.88 1.40 30.25
Note. See Section 4.2 for explaination ofcontents.

D-6 Appendix D. Marine Corps Supplement

Appendix D. Marine Corps Supplement D-7
TABLE D.1. Marine Corps Regular AFQT Distributions for 1980 and 1997Scales (continued)
AFQT 1980 1997Score % Qual. % Qual.
70 1.46 29.35 2.57 28.8571 1.44 27.89 1.34 26.2772 1.29 26.45 1.20 24.9373 1.41 25.16 1.17 23.7374 1.24 23.75 1.20 22.56
75 1.35 22.51 1.18 21.3676 1.21 21.17 1.10 20.1777 1.25 19.95 1.01 19.0778 1.29 18.70 1.08 18.0779 1.08 17.41 0.96 16.98
80 2.14 16.33 0.89 16.0281 1.09 14.18 0.88 15.1382 1.00 13.09 1.71 14.2583 0.00 12.09 0.86 12.5484 1.85 12.09 0.80 11.68
85 0.94 10.23 1.52 10.8886 0.84 9.30 0.71 9.3687 0.92 8.45 0.69 8.6588 0.76 7.53 1.15 7.9689 0.77 6.78 0.55 6.81
90 0.60 6.00 0.92 6.2691 0.66 5.40 0.50 5.3492 0.57 4.75 0.73 4.8593 0.57 4.17 1.07 4.1294 0.52 3.60 0.53 3.05
95 0.52 3.08 0.69 2.5296 0.39 2.57 0.51 1.8397 0.46 2.17 0.52 1.3298 0.30 1.71 0.37 0.8099 1.42 1.42 0.43 0.43
Note. See Section 4.2 for explaination ofcontents.

D-8 Appendix D. Marine Corps Supplement

Appendix D. Marine Corps Supplement D-9
TABLE D.2. Marine Corps Reserve AFQT Distributions for 1980 and 1997Scales
AFQT 1980 1997Score % Qual. % Qual.
1 0.10 100.00 0.07 100.002 0.02 99.90 0.14 99.933 0.02 99.88 0.03 99.794 0.07 99.86 0.14 99.76
5 0.07 99.79 0.03 99.626 0.05 99.73 0.14 99.597 0.02 99.67 0.15 99.458 0.05 99.66 0.03 99.309 0.07 99.60 0.24 99.26
10 0.03 99.54 0.22 99.0211 0.03 99.50 0.22 98.8012 0.19 99.47 0.15 98.5713 0.12 99.28 0.29 98.4214 0.07 99.16 0.07 98.13
15 0.12 99.09 0.36 98.0616 0.14 98.97 0.33 97.7017 0.22 98.83 0.31 97.3718 0.21 98.61 0.26 97.0619 0.33 98.40 0.57 96.81
20 0.15 98.08 0.29 96.2421 0.24 97.92 0.27 95.9522 0.40 97.68 0.52 95.6723 0.41 97.29 0.43 95.1624 0.27 96.87 0.70 94.73
25 0.52 96.60 1.00 94.0226 0.31 96.08 0.41 93.0327 0.67 95.77 0.31 92.6128 0.38 95.10 0.50 92.3129 0.93 94.73 0.64 91.81
30 0.43 93.80 0.52 91.1731 0.60 93.37 0.65 90.6632 1.01 92.77 0.72 90.0033 0.50 91.76 0.55 89.2834 0.36 91.26 0.65 88.73
Note. See Section 4.2 for explaination ofcontents.

D-10 Appendix D. Marine Corps Supplement

Appendix D. Marine Corps Supplement D-11
TABLE D.2. Marine Corps Reserve AFQT Distributions for 1980 and 1997Scales (continued)
AFQT 1980 1997Score % Qual. % Qual.
35 1.37 90.90 1.77 88.0836 0.60 89.52 0.79 86.3137 0.58 88.92 0.00 85.5238 0.77 88.34 0.70 85.5239 0.74 87.56 0.91 84.82
40 0.88 86.83 0.94 83.9141 0.89 85.95 1.08 82.9642 1.53 85.06 1.06 81.8843 0.88 83.53 1.05 80.8144 1.00 82.65 1.27 79.77
45 1.22 81.66 1.31 78.5046 1.22 80.44 1.44 77.1947 1.10 79.22 1.44 75.7548 1.15 78.12 1.51 74.3049 1.41 76.97 1.15 72.79
50 1.53 75.56 1.51 71.6451 1.36 74.03 1.48 70.1352 1.27 72.67 1.22 68.6553 2.59 71.40 1.31 67.4354 1.44 68.81 1.17 66.13
55 1.43 67.37 1.55 64.9656 1.43 65.94 1.49 63.4157 1.27 64.51 1.60 61.9258 1.58 63.24 0.00 60.3259 1.41 61.66 1.87 60.32
60 0.00 60.25 1.44 58.4561 1.63 60.25 1.58 57.0162 1.67 58.62 1.68 55.4363 1.31 56.96 1.61 53.7464 1.58 55.65 1.34 52.13
65 1.68 54.07 0.00 50.7966 1.61 52.39 1.44 50.7967 1.75 50.77 1.41 49.3568 1.44 49.02 1.61 47.9469 1.63 47.58 1.46 46.32
Note. See Section 4.2 for explaination ofcontents.

D-12 Appendix D. Marine Corps Supplement

Appendix D. Marine Corps Supplement D-13
TABLE D.2. Marine Corps Reserve AFQT Distributions for 1980 and 1997Scales (continued)
AFQT 1980 1997Score % Qual. % Qual.
70 1.44 45.95 2.94 44.8671 1.77 44.50 1.43 41.9372 1.67 42.73 1.17 40.5073 1.56 41.07 1.53 39.3374 1.37 39.51 1.51 37.80
75 1.91 38.13 1.72 36.2976 1.70 36.22 1.56 34.5877 1.48 34.52 1.39 33.0178 1.92 33.05 1.37 31.6279 1.55 31.12 1.25 30.25
80 3.06 29.58 1.44 28.9981 1.43 26.52 1.27 27.5582 1.51 25.09 2.28 26.2883 0.00 23.58 1.13 24.0084 2.80 23.58 1.19 22.86
85 1.44 20.78 2.16 21.6886 1.36 19.34 1.15 19.5187 1.48 17.98 0.81 18.3688 1.37 16.51 1.72 17.5589 0.98 15.13 1.15 15.84
90 1.19 14.15 1.89 14.6991 1.24 12.97 1.03 12.8092 1.32 11.73 1.44 11.7793 1.36 10.41 2.04 10.3294 1.01 9.05 1.25 8.28
95 1.12 8.04 1.80 7.0396 1.17 6.92 1.37 5.2297 1.03 5.75 1.37 3.8598 0.79 4.72 1.15 2.4799 3.93 3.93 1.32 1.32
Note. See Section 4.2 for explaination ofcontents.

D-14 Appendix D. Marine Corps Supplement
TABLE D.3. Subgroup Qualification Rates (Marine Corps Regular)
Scale Qualification Ratesa
White ( N = 30,061)1980 5.3 (93) 43.6 (65) 67.8 (50) 74.4 (45)1997 5.3 (93) 41.2 (65) 63.9 (50) 71.0 (45)1997 5.3 (93) 42.8 (64) 68.4 (47) 74.8 (42)
1980 81.3 (40) 87.0 (35) 90.5 (31) 97.1 (21)1997 77.3 (40) 83.0 (35) 86.6 (31) 94.0 (21)1997 80.9 (36) 87.5 (30) 90.2 (26) 97.2 (15)
Black ( N = 4,800)1980 0.9 (93) 18.3 (65) 38.5 (50) 46.2 (45)1997 0.8 (93) 16.5 (65) 34.3 (50) 41.9 (45)1997 0.8 (93) 17.5 (64) 38.6 (47) 46.9 (42)
1980 56.9 (40) 66.1 (35) 73.1 (31) 89.5 (21)1997 50.5 (40) 58.5 (35) 65.1 (31) 81.2 (21)1997 55.7 (36) 66.7 (30) 72.2 (26) 89.7 (15)
Hispanic ( N = 5,971)1980 1.2 (93) 22.1 (65) 46.8 (50) 55.4 (45)1997 1.1 (93) 18.9 (65) 40.4 (50) 50.5 (45)1997 1.1 (93) 20.2 (64) 46.1 (47) 55.2 (42)
1980 64.3 (40) 72.9 (35) 79.6 (31) 92.5 (21)1997 58.2 (40) 66.3 (35) 72.5 (31) 86.5 (21)1997 63.2 (36) 73.6 (30) 79.0 (26) 92.8 (15)
Other ( N = 3,557)1980 3.8 (93) 33.7 (65) 56.7 (50) 63.6 (45)1997 3.7 (93) 30.5 (65) 52.2 (50) 59.5 (45)1997 3.7 (93) 32.0 (64) 56.8 (47) 63.5 (42)
1980 71.2 (40) 78.8 (35) 83.3 (31) 93.4 (21)1997 66.4 (40) 73.4 (35) 77.7 (31) 88.2 (21)1997 70.5 (36) 78.9 (30) 82.8 (26) 93.4 (15)Note. See Section 4.5 for explaination of contents.aAFQT cut-scores are provided in parentheses.

Appendix D. Marine Corps Supplement D-15
TABLE D.4. Subgroup Qualification Rates (Marine Corps Reserve)
Scale Qualification Ratesa
White ( N = 3,999)1980 12.4 (93) 59.9 (65) 80.5 (50) 86.1 (45)1997 12.3 (93) 56.8 (65) 76.8 (50) 83.2 (45)1997 12.3 (93) 58.2 (64) 80.8 (47) 86.2 (42)
1980 90.4 (40) 93.3 (35) 95.2 (31) 98.7 (21)1997 88.1 (40) 91.4 (35) 93.3 (31) 97.2 (21)1997 90.1 (36) 93.6 (30) 95.0 (26) 98.7 (15)
Black ( N = 579)1980 2.4 (93) 35.8 (65) 58.5 (50) 64.9 (45)1997 2.4 (93) 32.6 (65) 54.1 (50) 62.2 (45)1997 2.4 (93) 34.5 (64) 58.4 (47) 66.0 (42)
1980 73.6 (40) 81.9 (35) 86.2 (31) 94.8 (21)1997 68.2 (40) 75.6 (35) 80.7 (31) 91.2 (21)1997 72.4 (36) 82.0 (30) 85.5 (26) 95.5 (15)
Hispanic ( N = 677)1980 3.5 (93) 34.7 (65) 61.2 (50) 69.3 (45)1997 3.2 (93) 30.6 (65) 55.4 (50) 64.7 (45)1997 3.2 (93) 31.5 (64) 60.6 (47) 69.6 (42)
1980 76.5 (40) 83.3 (35) 87.9 (31) 95.7 (21)1997 72.4 (40) 78.6 (35) 82.4 (31) 91.9 (21)1997 75.8 (36) 83.6 (30) 87.4 (26) 95.9 (15)
Other ( N = 567)1980 13.1 (93) 54.7 (65) 75.5 (50) 82.0 (45)1997 13.1 (93) 51.1 (65) 72.3 (50) 78.3 (45)1997 13.1 (93) 52.2 (64) 76.0 (47) 82.0 (42)
1980 87.5 (40) 92.2 (35) 94.2 (31) 98.4 (21)1997 84.0 (40) 88.7 (35) 91.9 (31) 96.5 (21)1997 86.6 (36) 92.4 (30) 93.7 (26) 98.6 (15)Note. See Section 4.5 for explaination of contents.aAFQT cut-scores are provided in parentheses.

D-16 Appendix D. Marine Corps Supplement
TABLE D.5. Gender Qualification Rates (Marine Corps Regular)
Scale Qualification Ratesa
Males ( N = 40,776)1980 4.3 (93) 37.5 (65) 61.1 (50) 68.1 (45)1997 4.2 (93) 35.0 (65) 56.8 (50) 64.3 (45)1997 4.2 (93) 36.5 (64) 61.4 (47) 68.5 (42)
1980 75.7 (40) 82.2 (35) 86.6 (31) 95.3 (21)1997 71.2 (40) 77.4 (35) 81.8 (31) 91.1 (21)1997 75.1 (36) 82.8 (30) 86.2 (26) 95.5 (15)
Females ( N = 3,611)1980 3.1 (93) 33.2 (65) 59.2 (50) 65.8 (45)1997 3.1 (93) 30.5 (65) 54.5 (50) 62.2 (45)1997 3.1 (93) 32.1 (64) 59.4 (47) 65.8 (42)
1980 74.0 (40) 81.4 (35) 86.2 (31) 95.4 (21)1997 68.7 (40) 75.9 (35) 80.4 (31) 91.4 (21)1997 73.2 (36) 81.4 (30) 85.5 (26) 95.5 (15)Note. See Section 4.5 for explaination of contents.aAFQT cut-scores are provided in parentheses.

Appendix D. Marine Corps Supplement D-17
TABLE D.6. Gender Qualification Rates (Marine Corps Reserve)
Scale Qualification Ratesa
Males ( N = 5,428)1980 10.7 (93) 54.7 (65) 75.7 (50) 81.9 (45)1997 10.6 (93) 51.4 (65) 71.9 (50) 78.7 (45)1997 10.6 (93) 52.7 (64) 75.9 (47) 82.0 (42)
1980 87.0 (40) 91.0 (35) 93.3 (31) 98.0 (21)1997 84.1 (40) 88.2 (35) 90.7 (31) 95.9 (21)1997 86.4 (36) 91.2 (30) 93.0 (26) 98.1 (15)
Females ( N = 394)1980 5.8 (93) 45.7 (65) 73.1 (50) 78.9 (45)1997 6.6 (93) 41.9 (65) 67.8 (50) 75.1 (45)1997 6.6 (93) 44.2 (64) 73.1 (47) 79.9 (42)
1980 84.8 (40) 89.6 (35) 94.2 (31) 97.5 (21)1997 81.5 (40) 86.8 (35) 89.8 (31) 96.4 (21)1997 84.8 (36) 90.6 (30) 93.1 (26) 97.2 (15)Note. See Section 4.5 for explaination of contents.aAFQT cut-scores are provided in parentheses.

D-18 Appendix D. Marine Corps Supplement
TABLE D.7. Subgroup Qualification Distributions (Marine Corps Regular)Score- AFQTScale Cut White Black Hispanic Other
1980 93 86.6 2.3 3.8 7.31997 93 87.1 2.0 3.7 7.21997 93 87.1 2.0 3.7 7.2
1980 65 79.4 5.3 8.0 7.31997 65 80.5 5.1 7.3 7.11997 64 80.2 5.2 7.5 7.1
1980 50 75.4 6.8 10.3 7.51997 50 76.4 6.6 9.6 7.41997 47 75.6 6.8 10.1 7.4
1980 45 74.2 7.4 11.0 7.51997 45 74.9 7.1 10.6 7.41997 42 74.2 7.4 10.9 7.5
1980 40 72.9 8.1 11.4 7.51997 40 73.8 7.7 11.0 7.51997 36 73.1 8.0 11.3 7.5
1980 35 71.7 8.7 11.9 7.71997 35 72.7 8.2 11.5 7.61997 30 71.7 8.7 12.0 7.6
1980 31 70.8 9.1 12.4 7.71997 31 71.8 8.6 11.9 7.61997 26 70.9 9.1 12.3 7.7
1980 21 68.9 10.1 13.1 7.91997 21 69.8 9.6 12.8 7.81997 15 68.9 10.2 13.1 7.8

Appendix D. Marine Corps Supplement D-19
TABLE D.8. Subgroup Qualification Distributions (Marine Corps Reserve)Score- AFQTScale Cut White Black Hispanic Other
1980 93 81.5 2.3 4.0 12.21997 93 81.7 2.3 3.7 12.31997 93 81.7 2.3 3.7 12.3
1980 65 76.1 6.6 7.5 9.81997 65 76.8 6.4 7.0 9.81997 64 76.6 6.6 7.0 9.8
1980 50 73.2 7.7 9.4 9.71997 50 73.7 7.5 9.0 9.81997 47 73.3 7.7 9.3 9.8
1980 45 72.4 7.9 9.9 9.81997 45 72.8 7.9 9.6 9.71997 42 72.4 8.0 9.9 9.8
1980 40 71.5 8.4 10.2 9.81997 40 72.1 8.1 10.0 9.71997 36 71.7 8.3 10.2 9.8
1980 35 70.5 9.0 10.7 9.91997 35 71.3 8.5 10.4 9.81997 30 70.5 8.9 10.7 9.9
1980 31 70.1 9.2 10.9 9.81997 31 70.7 8.8 10.6 9.91997 26 70.1 9.1 10.9 9.8
1980 21 69.2 9.6 11.4 9.81997 21 69.6 9.5 11.1 9.81997 15 69.2 9.7 11.4 9.8

D-20 Appendix D. Marine Corps Supplement
TABLE D.9. Gender Qualification Distributions (Marine Corps Regular)Score- AFQTScale Cut Males Females
1980 93 94.0 6.01997 93 93.9 6.11997 93 93.9 6.1
1980 65 92.7 7.31997 65 92.8 7.21997 64 92.8 7.2
1980 50 92.1 7.91997 50 92.2 7.81997 47 92.1 7.9
1980 45 92.1 7.91997 45 92.1 7.91997 42 92.2 7.8
1980 40 92.0 8.01997 40 92.1 7.91997 36 92.1 7.9
1980 35 91.9 8.11997 35 92.0 8.01997 30 92.0 8.0
1980 31 91.9 8.11997 31 92.0 8.01997 26 91.9 8.1
1980 21 91.9 8.11997 21 91.8 8.21997 15 91.9 8.1

Appendix D. Marine Corps Supplement D-21
TABLE D.10. Gender Qualification Distributions (Marine Corps Reserve)Score- AFQTScale Cut Males Females
1980 93 96.2 3.81997 93 95.7 4.31997 93 95.7 4.3
1980 65 94.3 5.71997 65 94.4 5.61997 64 94.3 5.7
1980 50 93.5 6.51997 50 93.6 6.41997 47 93.5 6.5
1980 45 93.5 6.51997 45 93.5 6.51997 42 93.4 6.6
1980 40 93.4 6.61997 40 93.4 6.61997 36 93.4 6.6
1980 35 93.3 6.71997 35 93.3 6.71997 30 93.3 6.7
1980 31 93.2 6.81997 31 93.3 6.71997 26 93.2 6.8
1980 21 93.3 6.71997 21 93.2 6.81997 15 93.3 6.7

D-22 Appendix D. Marine Corps Supplement

Appendix EAFQT ‘97 to ‘80 Transformation

E-2 Appendix E. AFQT ‘97 to ‘80 Transformation
TABLE E.1. Transformation of AFQT 1997 to 1980 ScaleAFQT 1980 1997 Trans.Score % Qual. % Qual. ‘97 =⇒ ‘80
1 0.15 100.00 0.11 100.00 12 0.06 99.85 0.17 99.89 23 0.08 99.78 0.22 99.72 44 0.15 99.70 0.57 99.50 5
5 0.15 99.55 0.36 98.93 96 0.19 99.40 0.44 98.57 107 0.15 99.22 0.57 98.13 128 0.26 99.07 0.33 97.56 139 0.20 98.81 0.85 97.22 14
10 0.24 98.61 0.50 96.37 1611 0.26 98.36 0.82 95.87 1712 0.32 98.10 0.31 95.04 1913 0.55 97.78 0.67 94.73 1914 0.21 97.23 0.37 94.06 20
15 0.46 97.02 0.80 93.69 2116 0.49 96.56 0.90 92.89 2217 0.58 96.07 0.99 91.99 2318 0.66 95.50 0.52 91.00 2419 0.70 94.84 1.12 90.48 25
20 0.38 94.14 0.60 89.36 2621 0.83 93.76 0.65 88.76 2722 0.92 92.93 1.35 88.11 2723 1.04 92.01 0.70 86.76 2924 0.55 90.97 0.76 86.05 29
25 1.20 90.42 1.63 85.30 3026 0.62 89.22 0.85 83.66 3227 1.34 88.61 0.91 82.82 3228 0.72 87.27 0.92 81.90 3329 1.48 86.55 0.92 80.98 34
30 0.80 85.07 0.99 80.06 3531 0.85 84.27 1.02 79.08 3532 1.77 83.42 1.05 78.05 3633 0.94 81.64 1.09 77.00 3734 0.97 80.70 1.12 75.92 38
Note. See Section 6.3.4 for explaination of contents.

Appendix E. AFQT ‘97 to ‘80 Transformation E-3
TABLE E.1. Transformation of AFQT 1997 to 1980 Scale (continued)AFQT 1980 1997 Trans.Score % Qual. % Qual. ‘97 =⇒ ‘80
35 2.07 79.73 2.32 74.80 3936 1.08 77.66 1.19 72.48 4137 1.10 76.58 0.00 71.29 4238 1.12 75.49 1.26 71.29 4239 1.14 74.37 1.27 70.03 42
40 1.22 73.23 1.32 68.75 4341 1.24 72.01 1.32 67.43 4442 2.56 70.77 1.28 66.11 4543 1.32 68.22 1.33 64.83 4644 1.27 66.90 1.37 63.50 47
45 1.35 65.63 1.39 62.13 4846 1.35 64.28 1.42 60.75 4947 1.42 62.93 1.41 59.32 5048 1.37 61.52 1.41 57.91 5149 1.41 60.14 1.44 56.50 52
50 1.41 58.73 1.44 55.06 5351 1.48 57.32 1.43 53.62 5352 1.47 55.84 1.47 52.19 5453 2.94 54.37 1.48 50.73 5454 1.55 51.44 1.46 49.25 55
55 1.45 49.89 1.48 47.79 5656 1.55 48.44 1.46 46.31 5757 1.43 46.89 1.47 44.85 5858 1.56 45.46 0.00 43.39 5959 1.45 43.90 1.46 43.39 59
60 0.00 42.45 1.44 41.93 6061 1.53 42.45 1.42 40.49 6262 1.47 40.92 1.40 39.07 6363 1.52 39.45 1.38 37.66 6464 1.41 37.93 1.38 36.28 65
65 1.49 36.53 0.00 34.91 6666 1.45 35.03 1.34 34.91 6667 1.45 33.58 1.33 33.56 6768 1.33 32.14 1.30 32.23 6869 1.43 30.80 1.26 30.93 69
Note. See Section 6.3.4 for explaination of contents.

E-4 Appendix E. AFQT ‘97 to ‘80 Transformation
TABLE E.1. Transformation of AFQT 1997 to 1980 Scale (continued)AFQT 1980 1997 Trans.Score % Qual. % Qual. ‘97 =⇒ ‘80
70 1.35 29.37 2.47 29.67 7071 1.33 28.02 1.21 27.20 7272 1.25 26.69 1.17 25.99 7373 1.29 25.43 1.13 24.82 7374 1.21 24.15 1.12 23.69 74
75 1.24 22.93 1.10 22.57 7576 1.14 21.70 1.06 21.47 7677 1.16 20.55 1.00 20.41 7778 1.15 19.40 1.01 19.41 7879 1.05 18.25 0.95 18.40 79
80 2.11 17.19 0.93 17.45 8081 1.01 15.08 0.90 16.52 8082 0.98 14.07 1.73 15.62 8183 0.00 13.09 0.81 13.89 8284 1.86 13.09 0.80 13.08 83
85 0.89 11.24 1.48 12.28 8386 0.81 10.35 0.69 10.81 8587 0.83 9.54 0.67 10.11 8688 0.76 8.71 1.20 9.45 8789 0.77 7.95 0.57 8.25 89
90 0.66 7.18 1.08 7.68 8991 0.67 6.52 0.49 6.60 9192 0.60 5.84 0.88 6.11 9293 0.62 5.24 1.20 5.23 9394 0.55 4.62 0.67 4.03 95
95 0.58 4.07 0.84 3.36 9696 0.48 3.49 0.67 2.52 9897 0.53 3.02 0.69 1.85 9998 0.37 2.48 0.55 1.16 9999 2.11 2.11 0.61 0.61 99
Note. See Section 6.3.4 for explaination of contents.

Appendix FComposite Transformation Tables


Appendix F. Composite Transformation Tables F-1
TABLE F.1. Composite ‘97 Conversion: GT-Army1980 1997 1980 1997
C P Q P Q ’97 C P Q P Q ‘9761 0.1 99.4 0.2 98.9 58 99 2.6 63.0 2.5 59.7 9862 0.1 99.3 0.2 98.8 59 100 2.7 60.4 2.7 57.2 9963 0.2 99.2 0.2 98.6 60 101 2.6 57.8 2.6 54.5 10064 0.2 99.0 0.0 98.4 61 102 2.6 55.1 2.7 51.9 10165 0.0 98.8 0.2 98.4 62 103 2.7 52.6 2.6 49.3 10266 0.2 98.8 0.3 98.1 62 104 2.8 49.8 2.7 46.6 10367 0.3 98.6 0.3 97.9 63 105 2.8 47.1 2.6 43.9 10468 0.2 98.3 0.4 97.6 65 106 0.0 44.2 2.6 41.3 10569 0.3 98.1 0.4 97.2 66 107 2.4 44.2 0.0 38.6 10570 0.3 97.8 0.4 96.8 67 108 2.8 41.8 2.6 38.6 10671 0.4 97.4 0.4 96.4 68 109 2.8 39.0 2.5 36.0 10872 0.4 97.0 0.5 96.0 70 110 2.6 36.2 2.4 33.5 10973 0.5 96.6 0.6 95.5 71 111 2.5 33.5 2.4 31.1 11074 0.6 96.0 0.6 94.9 72 112 2.5 31.1 2.2 28.8 11175 0.6 95.5 0.7 94.2 73 113 2.4 28.5 2.2 26.5 11276 0.7 94.9 0.8 93.6 74 114 2.4 26.1 2.1 24.3 11377 0.7 94.2 0.8 92.8 75 115 2.1 23.8 2.0 22.2 11478 0.8 93.5 0.9 92.0 76 116 2.2 21.7 1.9 20.3 11579 0.0 92.6 0.0 91.2 77 117 2.0 19.5 1.8 18.4 11680 0.8 92.6 1.0 91.2 77 118 1.8 17.5 1.7 16.6 11881 1.0 91.8 1.0 90.2 78 119 0.0 15.7 1.6 15.0 11982 1.0 90.8 1.1 89.2 80 120 1.9 15.7 1.4 13.4 11983 1.1 89.8 1.2 88.1 81 121 1.8 13.8 1.3 12.0 12084 1.2 88.7 1.3 86.9 82 122 1.6 12.0 0.0 10.6 12185 1.3 87.6 1.4 85.6 83 123 1.5 10.4 1.2 10.6 12386 1.4 86.3 1.5 84.2 84 124 1.4 8.9 1.2 9.4 12487 1.5 84.9 1.6 82.7 86 125 1.4 7.5 1.1 8.3 12688 1.6 83.3 1.7 81.1 87 126 1.3 6.1 1.0 7.2 12789 1.7 81.8 1.8 79.4 88 127 1.2 4.8 0.8 6.2 12990 1.8 80.1 1.9 77.6 89 128 1.2 3.7 0.8 5.4 13091 1.9 78.3 2.0 75.7 90 129 1.1 2.5 0.7 4.6 13292 0.0 76.4 2.2 73.7 91 130 0.9 1.4 0.6 3.9 13593 2.0 76.4 0.0 71.6 91 131 0.1 0.6 0.6 3.3 14094 2.1 74.4 2.2 71.6 92 132 0.1 0.4 0.5 2.7 14195 2.1 72.3 2.3 69.3 94 133 0.0 0.3 0.4 2.2 14296 2.4 70.1 2.3 67.0 95 134 0.1 0.3 0.4 1.8 14297 2.4 67.8 2.5 64.7 96 135 0.1 0.2 0.3 1.4 14398 2.3 65.3 2.5 62.2 97 136 0.0 0.2 0.0 1.2 144Notes. C: composite score, P : percentage with score C, Q: percentage scoringat or above C. See Section 5 for an explanation of table contents.

F-2 Appendix F. Composite Transformation Tables
TABLE F.2. Composite ‘97 Conversion: CL-Army1980 1997 1980 1997
C P Q P Q ’97 C P Q P Q ‘9764 0.1 99.4 0.2 98.9 60 101 2.5 57.5 2.5 55.2 10065 0.1 99.3 0.2 98.7 61 102 2.5 55.1 2.5 52.7 10166 0.2 99.2 0.2 98.5 62 103 2.5 52.6 2.5 50.2 10267 0.2 99.0 0.3 98.2 63 104 2.5 50.1 2.6 47.7 10368 0.3 98.8 0.3 98.0 65 105 2.6 47.6 2.5 45.1 10469 0.2 98.5 0.3 97.7 66 106 2.5 45.0 2.5 42.6 10570 0.3 98.3 0.3 97.3 67 107 2.5 42.5 2.4 40.1 10671 0.4 98.0 0.4 97.0 68 108 2.4 40.0 2.4 37.7 10772 0.4 97.6 0.4 96.6 69 109 2.4 37.6 2.3 35.3 10873 0.4 97.3 0.5 96.2 70 110 2.4 35.1 2.3 32.9 10974 0.5 96.8 0.6 95.6 71 111 2.3 32.8 2.2 30.7 11075 0.5 96.4 0.6 95.1 73 112 2.2 30.5 2.1 28.5 11176 0.6 95.8 0.6 94.5 74 113 2.1 28.3 2.0 26.4 11277 0.6 95.2 0.7 93.9 75 114 2.1 26.1 1.9 24.4 11378 0.7 94.6 0.8 93.2 76 115 2.0 24.1 1.9 22.5 11479 0.7 93.9 0.8 92.4 77 116 1.9 22.1 1.8 20.7 11580 0.8 93.1 0.9 91.6 78 117 1.9 20.2 1.8 18.9 11681 0.9 92.3 1.0 90.7 79 118 1.7 18.3 1.5 17.1 11782 1.0 91.4 1.0 89.7 80 119 1.7 16.6 1.4 15.6 11883 1.1 90.4 1.2 88.7 81 120 1.5 14.9 1.4 14.2 11984 1.2 89.3 1.2 87.5 82 121 1.5 13.4 1.2 12.8 12185 1.2 88.1 1.3 86.3 83 122 1.4 11.9 1.2 11.6 12286 1.3 86.9 1.4 85.0 85 123 1.3 10.5 1.1 10.3 12387 1.4 85.6 1.5 83.6 86 124 1.2 9.2 1.0 9.3 12488 1.5 84.2 1.5 82.1 87 125 1.1 8.0 1.0 8.3 12589 1.7 82.6 1.7 80.6 88 126 1.1 6.9 0.8 7.3 12790 1.7 80.9 1.8 78.9 89 127 1.0 5.8 0.8 6.5 12891 1.8 79.3 1.9 77.1 90 128 0.9 4.7 0.7 5.6 12992 2.0 77.5 2.0 75.2 91 129 0.9 3.8 0.7 4.9 13193 2.0 75.5 2.1 73.2 92 130 0.8 3.0 0.6 4.2 13294 2.1 73.5 2.1 71.2 93 131 0.7 2.2 0.5 3.6 13495 2.2 71.4 2.2 69.0 94 132 0.6 1.5 0.5 3.1 13696 2.2 69.2 2.3 66.9 95 133 0.4 1.0 0.4 2.6 13897 2.3 67.0 2.3 64.6 96 134 0.3 0.5 0.3 2.2 14098 2.3 64.6 2.3 62.3 97 135 0.1 0.3 0.3 1.8 14399 2.3 62.3 2.3 59.9 98 136 0.1 0.2 0.3 1.5 144100 2.5 60.0 2.4 57.6 99 137 0.0 0.1 0.2 1.2 146Notes. C: composite score, P : percentage with score C,Q: percentage scoringat or above C. See Section 5 for an explanation of table contents.

Appendix F. Composite Transformation Tables F-3
TABLE F.3. Composite ‘97 Conversion: CO-Army1980 1997 1980 1997
C P Q P Q ’97 C P Q P Q ‘9765 0.2 99.3 0.2 98.8 62 103 2.4 49.2 2.4 51.7 10466 0.2 99.1 0.3 98.6 63 104 2.4 46.7 2.3 49.3 10567 0.3 98.9 0.3 98.4 64 105 2.4 44.3 2.3 47.0 10668 0.3 98.7 0.3 98.1 66 106 2.4 41.9 2.3 44.7 10769 0.3 98.4 0.4 97.8 67 107 2.4 39.6 2.2 42.4 10870 0.4 98.1 0.4 97.4 68 108 2.3 37.1 2.3 40.2 10971 0.4 97.7 0.4 97.1 69 109 2.3 34.9 2.3 37.9 11072 0.5 97.3 0.5 96.6 70 110 2.2 32.6 2.1 35.6 11173 0.5 96.8 0.5 96.2 72 111 2.2 30.4 2.1 33.5 11274 0.6 96.3 0.6 95.7 73 112 2.1 28.3 2.1 31.3 11375 0.7 95.8 0.6 95.1 74 113 2.0 26.2 2.0 29.2 11576 0.7 95.1 0.7 94.5 75 114 2.0 24.1 1.9 27.2 11677 0.8 94.4 0.7 93.8 76 115 1.9 22.2 1.9 25.3 11778 0.9 93.6 0.8 93.1 77 116 1.8 20.3 1.8 23.5 11879 0.9 92.8 0.9 92.3 78 117 1.7 18.5 1.7 21.7 11980 1.0 91.8 1.0 91.4 80 118 1.6 16.7 1.6 19.9 12081 1.1 90.8 1.0 90.4 81 119 1.5 15.2 1.6 18.3 12182 1.2 89.7 1.1 89.4 82 120 1.4 13.6 1.4 16.8 12283 1.3 88.5 1.2 88.3 83 121 1.4 12.2 1.4 15.3 12384 1.4 87.2 1.2 87.1 84 122 1.3 10.8 1.3 13.9 12485 1.5 85.9 1.3 85.9 85 123 1.1 9.5 1.2 12.6 12686 1.5 84.4 1.4 84.6 86 124 1.1 8.4 1.1 11.3 12787 1.6 82.9 1.4 83.2 87 125 1.0 7.2 1.0 10.2 12888 1.7 81.3 1.6 81.8 88 126 1.0 6.2 1.0 9.2 12989 1.8 79.6 1.6 80.2 89 127 0.8 5.3 0.9 8.2 13190 1.8 77.8 1.7 78.6 90 128 0.7 4.4 0.9 7.3 13291 1.9 76.0 1.7 76.9 92 129 0.7 3.7 0.7 6.4 13392 2.1 74.1 1.8 75.2 93 130 0.6 3.1 0.7 5.7 13593 2.1 72.1 1.9 73.4 94 131 0.5 2.4 0.6 5.0 13694 2.1 70.0 2.0 71.4 95 132 0.4 1.9 0.6 4.4 13795 2.2 67.8 2.0 69.4 96 133 0.4 1.5 0.5 3.8 13996 2.2 65.7 2.1 67.4 97 134 0.3 1.1 0.5 3.3 14097 2.2 63.4 2.1 65.3 98 135 0.2 0.8 0.4 2.8 14298 2.4 61.2 2.2 63.1 99 136 0.2 0.6 0.3 2.4 14499 2.4 58.8 2.2 60.9 100 137 0.1 0.4 0.3 2.1 145100 2.5 56.4 2.3 58.7 101 138 0.1 0.3 0.3 1.7 147101 2.4 54.0 2.3 56.4 102 139 0.1 0.2 0.2 1.5 149102 2.4 51.6 2.3 54.1 103 140 0.0 0.1 0.2 1.2 151Notes. C: composite score, P : percentage with score C, Q: percentage scoringat or above C. See Section 5 for an explanation of table contents.

F-4 Appendix F. Composite Transformation Tables
TABLE F.4. Composite ‘97 Conversion: EL-Army1980 1997 1980 1997
C P Q P Q ’97 C P Q P Q ‘9764 0.1 99.4 0.2 98.9 61 102 2.5 52.1 2.4 54.1 10365 0.2 99.2 0.2 98.6 62 103 2.5 49.7 2.3 51.8 10466 0.2 99.0 0.3 98.4 63 104 2.5 47.2 2.4 49.5 10567 0.2 98.8 0.3 98.2 64 105 2.5 44.7 2.4 47.1 10668 0.3 98.6 0.3 97.9 65 106 2.4 42.2 2.3 44.7 10769 0.3 98.3 0.4 97.6 66 107 2.4 39.7 2.3 42.4 10870 0.4 98.0 0.4 97.2 68 108 2.4 37.3 2.2 40.1 10971 0.4 97.7 0.4 96.8 69 109 2.3 35.0 2.2 37.9 11072 0.4 97.3 0.5 96.4 70 110 2.3 32.6 2.2 35.7 11173 0.5 96.8 0.5 95.9 71 111 2.2 30.3 2.2 33.4 11274 0.5 96.3 0.6 95.4 72 112 2.2 28.1 2.0 31.3 11475 0.6 95.8 0.6 94.8 73 113 2.0 25.9 2.0 29.2 11576 0.7 95.1 0.7 94.2 74 114 2.0 23.9 1.9 27.2 11677 0.8 94.4 0.7 93.5 76 115 2.0 21.9 1.9 25.3 11778 0.8 93.7 0.8 92.8 77 116 1.9 19.9 1.8 23.5 11879 0.9 92.8 0.9 92.0 78 117 1.8 18.1 1.7 21.6 11980 1.0 92.0 1.0 91.2 79 118 1.7 16.3 1.7 19.9 12081 1.1 91.0 1.0 90.2 80 119 1.6 14.6 1.5 18.3 12182 1.2 89.9 1.0 89.2 81 120 1.5 13.1 1.5 16.7 12383 1.2 88.8 1.2 88.2 82 121 1.4 11.6 1.4 15.2 12484 1.3 87.6 1.2 87.0 84 122 1.3 10.2 1.3 13.9 12585 1.4 86.3 1.3 85.8 85 123 1.2 8.9 1.2 12.5 12686 1.5 84.8 1.4 84.4 86 124 1.1 7.7 1.2 11.3 12787 1.6 83.4 1.5 83.0 87 125 1.0 6.6 1.1 10.1 12988 1.7 81.8 1.5 81.6 88 126 0.9 5.6 1.0 9.1 13089 1.7 80.1 1.6 80.1 89 127 0.8 4.7 0.9 8.1 13190 1.8 78.4 1.6 78.5 90 128 0.7 3.9 0.8 7.2 13391 1.8 76.6 1.7 76.8 91 129 0.6 3.2 0.7 6.4 13492 2.0 74.8 1.8 75.1 92 130 0.6 2.5 0.7 5.6 13693 2.0 72.8 1.9 73.3 93 131 0.5 2.0 0.6 4.9 13794 2.2 70.7 2.0 71.4 94 132 0.4 1.5 0.6 4.3 13995 2.2 68.6 2.0 69.4 95 133 0.3 1.1 0.5 3.7 14096 2.2 66.4 2.1 67.4 96 134 0.2 0.8 0.5 3.2 14297 2.3 64.2 2.2 65.3 98 135 0.2 0.6 0.4 2.7 14398 2.4 61.8 2.3 63.1 99 136 0.1 0.4 0.3 2.3 14599 2.4 59.5 2.2 60.9 100 137 0.1 0.2 0.3 2.0 147100 2.5 57.1 2.3 58.7 101 138 0.1 0.1 0.3 1.7 149101 2.5 54.6 2.3 56.4 102 139 0.0 0.1 0.3 1.4 151Notes. C: composite score, P : percentage with score C,Q: percentage scoringat or above C. See Section 5 for an explanation of table contents.

Appendix F. Composite Transformation Tables F-5
TABLE F.5. Composite ‘97 Conversion: FA-Army1980 1997 1980 1997
C P Q P Q ’97 C P Q P Q ‘9765 0.2 99.3 0.2 98.9 62 103 2.4 49.4 2.3 51.7 10466 0.2 99.1 0.2 98.7 63 104 2.4 47.0 2.4 49.4 10567 0.3 98.9 0.3 98.4 65 105 2.4 44.6 2.3 47.1 10668 0.3 98.7 0.3 98.1 66 106 2.4 42.2 2.3 44.7 10769 0.3 98.4 0.4 97.9 67 107 2.4 39.8 2.2 42.4 10870 0.4 98.1 0.4 97.5 68 108 2.3 37.5 2.4 40.2 10971 0.4 97.7 0.4 97.1 69 109 2.2 35.2 2.3 37.8 11072 0.5 97.3 0.5 96.7 71 110 2.2 33.0 2.1 35.5 11173 0.5 96.8 0.5 96.2 72 111 2.2 30.8 2.1 33.4 11274 0.6 96.3 0.5 95.7 73 112 2.1 28.6 2.1 31.3 11375 0.6 95.7 0.6 95.2 74 113 2.0 26.5 2.0 29.2 11476 0.7 95.1 0.6 94.5 75 114 2.0 24.5 1.9 27.2 11577 0.8 94.4 0.7 93.9 76 115 1.9 22.5 1.8 25.2 11678 0.9 93.6 0.8 93.2 77 116 1.7 20.6 1.8 23.4 11879 0.9 92.7 0.9 92.4 79 117 1.7 18.9 1.7 21.6 11980 1.0 91.8 0.9 91.5 80 118 1.7 17.2 1.6 19.8 12081 1.1 90.8 1.0 90.6 81 119 1.5 15.5 1.6 18.3 12182 1.2 89.7 1.1 89.6 82 120 1.5 14.0 1.5 16.7 12283 1.3 88.5 1.2 88.5 83 121 1.4 12.5 1.4 15.2 12384 1.3 87.2 1.2 87.3 84 122 1.3 11.1 1.3 13.8 12485 1.5 85.9 1.3 86.1 85 123 1.2 9.8 1.3 12.5 12586 1.5 84.4 1.4 84.8 86 124 1.1 8.6 1.1 11.2 12687 1.7 82.9 1.5 83.4 87 125 1.0 7.5 1.0 10.1 12888 1.7 81.3 1.5 81.9 88 126 1.0 6.5 0.9 9.1 12989 1.8 79.6 1.6 80.4 89 127 0.8 5.5 0.9 8.1 13090 1.8 77.9 1.7 78.8 91 128 0.8 4.7 0.8 7.2 13191 1.9 76.1 1.7 77.1 92 129 0.7 3.9 0.7 6.4 13392 2.0 74.2 1.9 75.4 93 130 0.6 3.2 0.7 5.6 13493 2.1 72.1 2.0 73.5 94 131 0.5 2.6 0.6 4.9 13594 2.2 70.1 2.0 71.6 95 132 0.5 2.0 0.6 4.3 13795 2.2 67.9 2.1 69.6 96 133 0.4 1.6 0.5 3.8 13896 2.2 65.7 2.1 67.5 97 134 0.3 1.2 0.4 3.2 14097 2.3 63.6 2.1 65.4 98 135 0.3 0.9 0.4 2.8 14298 2.3 61.3 2.2 63.2 99 136 0.2 0.6 0.4 2.4 14399 2.4 59.0 2.3 61.0 100 137 0.2 0.4 0.3 2.0 145100 2.4 56.6 2.3 58.7 101 138 0.1 0.3 0.3 1.7 147101 2.4 54.2 2.4 56.5 102 139 0.1 0.2 0.2 1.4 149102 2.4 51.8 2.4 54.1 103 140 0.0 0.1 0.2 1.2 151Notes. C: composite score, P : percentage with score C, Q: percentage scoringat or above C. See Section 5 for an explanation of table contents.

F-6 App endix F. Comp osi te Transformation Tables
TABLE F.6. Comp osite ‘97 Conve rsion: GM-Army1980 1997 1980 1997
C P Q P Q ’97 C P Q P Q ‘9765 0.2 99.3 0.2 98.8 62 103 2.4 47.7 2.3 51.8 10566 0.2 99.1 0.3 98.6 64 104 2.3 45.3 2.3 49.6 10667 0.3 98.8 0.3 98.3 65 105 2.4 42.9 2.2 47.3 10768 0.3 98.6 0.3 98.0 66 106 2.3 40.6 2.2 45.0 10869 0.3 98.3 0.4 97.7 67 107 2.3 38.2 2.2 42.8 10970 0.4 97.9 0.4 97.3 68 108 2.3 36.0 2.2 40.7 11071 0.5 97.5 0.4 96.9 70 109 2.2 33.7 2.2 38.4 11172 0.5 97.0 0.5 96.4 71 110 2.2 31.5 2.1 36.3 11273 0.6 96.5 0.6 96.0 72 111 2.2 29.3 2.1 34.1 11374 0.7 95.9 0.6 95.4 73 112 2.1 27.2 2.0 32.0 11475 0.8 95.3 0.7 94.8 74 113 2.0 25.1 2.1 30.0 11576 0.8 94.5 0.7 94.1 75 114 1.9 23.1 1.9 28.0 11777 0.9 93.7 0.8 93.4 76 115 1.9 21.3 1.9 26.0 11878 1.0 92.9 0.9 92.6 78 116 1.7 19.4 1.8 24.2 11979 1.0 91.9 0.9 91.7 79 117 1.6 17.7 1.7 22.4 12080 1.1 90.9 1.0 90.8 80 118 1.6 16.0 1.6 20.7 12181 1.2 89.8 1.1 89.8 81 119 1.5 14.4 1.6 19.1 12282 1.2 88.6 1.1 88.8 82 120 1.4 12.9 1.5 17.5 12383 1.4 87.4 1.2 87.7 83 121 1.3 11.5 1.4 16.0 12484 1.4 86.0 1.3 86.5 84 122 1.2 10.2 1.3 14.6 12685 1.5 84.6 1.4 85.2 86 123 1.2 9.0 1.3 13.3 12786 1.6 83.0 1.4 83.9 87 124 1.1 7.8 1.2 12.0 12887 1.6 81.4 1.5 82.5 88 125 1.0 6.7 1.1 10.8 12988 1.7 79.8 1.5 81.1 89 126 0.9 5.8 1.0 9.7 13089 1.8 78.1 1.6 79.5 90 127 0.8 4.9 0.9 8.7 13290 1.9 76.3 1.6 77.9 91 128 0.7 4.1 0.9 7.8 13391 2.0 74.4 1.7 76.3 92 129 0.6 3.4 0.8 6.9 13592 2.1 72.4 1.9 74.6 93 130 0.5 2.8 0.7 6.1 13693 2.1 70.3 1.9 72.8 94 131 0.5 2.2 0.7 5.4 13794 2.1 68.3 2.0 70.9 95 132 0.4 1.8 0.5 4.7 13995 2.1 66.2 2.0 68.9 96 133 0.3 1.4 0.5 4.2 14096 2.2 64.0 2.0 67.0 97 134 0.3 1.0 0.5 3.6 14297 2.3 61.8 2.1 65.0 99 135 0.2 0.8 0.4 3.1 14398 2.3 59.5 2.1 62.9 100 136 0.2 0.6 0.4 2.7 14599 2.4 57.2 2.2 60.8 101 137 0.1 0.4 0.3 2.3 146100 2.4 54.8 2.2 58.6 102 138 0.1 0.2 0.3 2.0 148101 2.4 52.4 2.2 56.4 103 139 0.1 0.2 0.3 1.6 150102 2.4 50.0 2.3 54.1 104 140 0.0 0.1 0.2 1.4 152Notes. C: composite score, P : percentage with score C,Q: percentage scoringat or above C. See Section 5 for an explanation of table contents.

App e ndi x F. Comp osite Transformati on Tables F-7
TABLE F. 7. Comp osite ‘97 Conve rsion: MM-Army1980 1997 1980 1997
C P Q P Q ’97 C P Q P Q ‘9764 0.2 99.3 0.2 99.0 62 104 2.2 42.9 2.1 50.1 10765 0.2 99.1 0.2 98.8 63 105 2.2 40.7 2.2 48.0 10966 0.3 98.9 0.3 98.5 64 106 2.2 38.5 2.1 45.8 11067 0.3 98.7 0.3 98.2 65 107 2.2 36.2 2.0 43.7 11168 0.3 98.3 0.4 97.9 67 108 2.2 34.0 2.1 41.7 11269 0.4 98.0 0.4 97.6 68 109 2.1 31.8 2.0 39.6 11370 0.5 97.5 0.5 97.1 69 110 2.0 29.7 2.0 37.6 11471 0.6 97.0 0.5 96.7 70 111 2.0 27.6 2.0 35.6 11572 0.7 96.4 0.6 96.2 71 112 1.9 25.6 2.0 33.6 11673 0.7 95.8 0.6 95.6 73 113 1.9 23.7 1.9 31.6 11774 0.8 95.0 0.7 94.9 74 114 1.8 21.8 1.8 29.7 11875 0.9 94.3 0.7 94.3 75 115 1.7 20.0 1.8 27.8 12076 1.0 93.4 0.8 93.6 76 116 1.7 18.3 1.8 26.0 12177 1.0 92.4 0.8 92.7 77 117 1.6 16.6 1.7 24.3 12278 1.1 91.4 0.9 91.9 79 118 1.5 15.0 1.6 22.6 12379 1.2 90.3 1.0 91.0 80 119 1.4 13.5 1.6 21.0 12480 1.3 89.1 1.0 90.0 81 120 1.3 12.1 1.5 19.4 12581 1.3 87.9 1.1 89.0 82 121 1.2 10.8 1.4 17.9 12782 1.4 86.5 1.1 87.9 83 122 1.1 9.5 1.3 16.5 12883 1.5 85.1 1.2 86.7 84 123 1.1 8.4 1.3 15.2 12984 1.5 83.6 1.3 85.6 86 124 0.9 7.3 1.2 13.9 13085 1.7 82.1 1.3 84.3 87 125 0.9 6.4 1.1 12.7 13286 1.7 80.4 1.4 83.0 88 126 0.8 5.5 1.1 11.5 13387 1.8 78.7 1.5 81.6 89 127 0.7 4.6 1.0 10.4 13488 1.8 76.9 1.5 80.0 90 128 0.6 3.9 0.9 9.4 13689 1.9 75.1 1.6 78.5 91 129 0.6 3.3 0.8 8.5 13790 1.9 73.2 1.6 77.0 92 130 0.5 2.7 0.8 7.6 13891 2.0 71.3 1.8 75.3 93 131 0.4 2.2 0.7 6.8 14092 2.1 69.3 1.7 73.6 94 132 0.4 1.8 0.7 6.1 14193 2.0 67.3 1.8 71.9 96 133 0.3 1.4 0.6 5.4 14394 2.1 65.2 1.8 70.1 97 134 0.3 1.1 0.6 4.8 14495 2.1 63.1 1.9 68.3 98 135 0.2 0.8 0.5 4.2 14696 2.2 61.0 1.9 66.4 99 136 0.2 0.6 0.5 3.7 14797 2.3 58.8 2.0 64.5 100 137 0.1 0.4 0.4 3.2 14998 2.2 56.5 2.0 62.5 101 138 0.1 0.3 0.4 2.8 15199 2.2 54.3 2.1 60.5 102 139 0.1 0.2 0.3 2.5 153100 2.3 52.1 2.1 58.5 103 140 0.1 0.1 0.3 2.1 155101 2.3 49.8 2.1 56.4 104 141 0.0 0.1 0.2 1.8 158102 2.3 47.5 2.0 54.3 105 142 0.0 0.0 0.3 1.6 161103 2.3 45.2 2.1 52.2 106 143 0.0 0.0 0.2 1.3 163Notes. C: composite score, P : percentage with score C, Q: percentage scoringat or above C. See Section 5 for an explanation of table contents.

App e ndi x F. Comp osite Transformati on Tables F-8
TA BLE F.8. Comp osite ‘97 Conve rsion: OF-Army1980 1997 1980 1997
C P Q P Q ’97 C P Q P Q ‘9764 0.2 99.3 0.2 98.9 61 103 2.3 48.1 2.3 52.0 10565 0.2 99.2 0.2 98.7 63 104 2.4 45.8 2.3 49.7 10666 0.2 98.9 0.3 98.5 64 105 2.3 43.4 2.3 47.4 10767 0.3 98.7 0.3 98.2 65 106 2.3 41.1 2.2 45.1 10868 0.3 98.4 0.3 97.9 66 107 2.3 38.7 2.2 42.9 10969 0.3 98.1 0.4 97.6 67 108 2.3 36.4 2.2 40.7 11070 0.4 97.8 0.4 97.3 69 109 2.2 34.2 2.2 38.5 11171 0.5 97.4 0.5 96.8 70 110 2.3 32.0 2.1 36.4 11272 0.5 96.9 0.5 96.4 71 111 2.2 29.8 2.1 34.3 11373 0.6 96.4 0.5 95.9 72 112 2.1 27.6 2.1 32.2 11474 0.7 95.8 0.7 95.3 73 113 2.0 25.5 2.0 30.0 11575 0.7 95.1 0.7 94.7 74 114 1.9 23.6 2.0 28.1 11676 0.8 94.4 0.7 94.0 75 115 1.9 21.6 1.9 26.1 11877 0.8 93.6 0.8 93.3 77 116 1.8 19.7 1.7 24.3 11978 1.0 92.8 0.9 92.6 78 117 1.7 17.9 1.7 22.5 12079 1.0 91.8 0.9 91.7 79 118 1.7 16.3 1.6 20.8 12180 1.1 90.8 1.0 90.8 80 119 1.5 14.6 1.6 19.2 12281 1.2 89.7 1.0 89.9 81 120 1.4 13.0 1.5 17.5 12382 1.2 88.6 1.1 88.8 82 121 1.3 11.6 1.4 16.0 12483 1.4 87.3 1.2 87.7 83 122 1.3 10.3 1.4 14.6 12584 1.4 86.0 1.3 86.5 84 123 1.2 9.0 1.2 13.2 12785 1.5 84.5 1.3 85.3 86 124 1.1 7.8 1.2 12.0 12886 1.6 83.1 1.4 84.0 87 125 1.0 6.7 1.1 10.8 12987 1.6 81.5 1.5 82.6 88 126 0.9 5.7 1.0 9.7 13088 1.7 79.9 1.5 81.1 89 127 0.8 4.8 1.0 8.7 13289 1.7 78.2 1.6 79.6 90 128 0.8 4.1 0.9 7.7 13390 1.9 76.4 1.6 78.0 91 129 0.6 3.3 0.8 6.8 13491 1.9 74.6 1.7 76.4 92 130 0.6 2.7 0.7 6.1 13692 2.0 72.6 1.9 74.7 93 131 0.5 2.1 0.6 5.3 13793 2.1 70.6 1.9 72.8 94 132 0.4 1.7 0.6 4.7 13994 2.1 68.5 1.9 71.0 95 133 0.3 1.3 0.6 4.1 14095 2.1 66.5 2.0 69.1 96 134 0.3 0.9 0.5 3.6 14296 2.2 64.4 2.0 67.1 97 135 0.2 0.7 0.4 3.1 14397 2.2 62.1 2.1 65.1 98 136 0.2 0.5 0.4 2.7 14598 2.3 59.9 2.1 63.0 99 137 0.1 0.3 0.3 2.2 14799 2.4 57.6 2.1 60.8 101 138 0.1 0.2 0.3 1.9 149100 2.4 55.2 2.2 58.7 102 139 0.1 0.1 0.3 1.6 151101 2.4 52.8 2.3 56.5 103 140 0.0 0.1 0.2 1.3 153102 2.4 50.5 2.3 54.2 104 141 0.0 0.0 0.2 1.1 155Notes. C: composite score, P : percentage with score C, Q: percentage scoringat or above C. See Section 5 for an explanation of table contents.

F-9 App endix F. Comp osi te Transformation Tables
TABLE F.9. Comp osite ‘97 Conve rsion: SC-Army1980 1997 1980 1997
C P Q P Q ’97 C P Q P Q ‘9764 0.1 99.4 0.2 98.9 60 102 2.5 53.3 2.5 54.0 10265 0.2 99.3 0.2 98.7 61 103 2.6 50.8 2.4 51.5 10366 0.2 99.1 0.3 98.5 62 104 2.5 48.2 2.5 49.1 10467 0.2 98.9 0.3 98.2 64 105 2.5 45.7 2.4 46.7 10568 0.2 98.7 0.3 97.9 65 106 2.4 43.1 2.4 44.3 10669 0.3 98.5 0.3 97.6 66 107 2.4 40.7 2.3 41.9 10870 0.3 98.2 0.4 97.3 67 108 2.5 38.2 2.3 39.6 10971 0.3 97.8 0.4 97.0 68 109 2.4 35.8 2.3 37.2 11072 0.4 97.5 0.4 96.5 69 110 2.3 33.4 2.2 34.9 11173 0.5 97.1 0.5 96.1 71 111 2.3 31.1 2.1 32.7 11274 0.5 96.6 0.5 95.6 72 112 2.2 28.8 2.1 30.6 11375 0.5 96.1 0.6 95.1 73 113 2.1 26.6 2.0 28.5 11476 0.6 95.5 0.6 94.5 74 114 2.0 24.5 1.9 26.5 11577 0.7 94.9 0.7 93.8 75 115 1.9 22.5 1.9 24.6 11678 0.8 94.2 0.8 93.1 76 116 1.9 20.6 1.8 22.7 11779 0.8 93.4 0.8 92.4 78 117 1.8 18.7 1.7 20.9 11880 0.9 92.6 0.9 91.5 79 118 1.7 16.9 1.6 19.2 11981 1.0 91.7 1.0 90.6 80 119 1.6 15.2 1.6 17.6 12182 1.1 90.7 1.0 89.6 81 120 1.5 13.6 1.5 16.0 12283 1.1 89.7 1.2 88.6 82 121 1.4 12.1 1.3 14.6 12384 1.3 88.5 1.2 87.4 83 122 1.3 10.7 1.3 13.2 12485 1.4 87.3 1.3 86.2 84 123 1.2 9.4 1.2 11.9 12586 1.4 85.9 1.4 84.9 85 124 1.1 8.2 1.1 10.7 12687 1.6 84.5 1.5 83.6 86 125 1.0 7.0 1.0 9.6 12888 1.6 82.9 1.5 82.1 87 126 0.9 6.0 0.9 8.6 12989 1.7 81.3 1.6 80.6 88 127 0.9 5.1 0.8 7.6 13090 1.7 79.6 1.7 78.9 90 128 0.8 4.2 0.8 6.8 13291 1.9 77.9 1.8 77.3 91 129 0.7 3.4 0.8 6.0 13392 2.0 76.0 1.9 75.5 92 130 0.6 2.7 0.7 5.3 13593 2.0 74.0 1.9 73.6 93 131 0.5 2.2 0.6 4.6 13694 2.2 72.0 2.0 71.7 94 132 0.5 1.7 0.6 4.0 13795 2.2 69.8 2.1 69.7 95 133 0.3 1.2 0.5 3.4 13996 2.3 67.6 2.1 67.5 96 134 0.3 0.8 0.4 3.0 14197 2.3 65.3 2.2 65.4 97 135 0.2 0.6 0.4 2.5 14398 2.4 63.0 2.2 63.2 98 136 0.1 0.4 0.3 2.1 14499 2.4 60.7 2.3 61.0 99 137 0.1 0.2 0.3 1.8 146100 2.5 58.3 2.3 58.6 100 138 0.1 0.1 0.3 1.5 148101 2.5 55.8 2.3 56.3 101 139 0.0 0.1 0.2 1.2 150Notes. C: composite score, P : percentage with score C,Q: percentage scoringat or above C. See Section 5 for an explanation of table contents.

App e ndi x F. Comp osite Transformati on Tables F-10
TA BLE F .10. Comp osite ‘ 97 Conve rsion: ST-Army1980 1997 1980 1997
C P Q P Q ’97 C P Q P Q ‘9764 0.1 99.3 0.2 98.9 61 102 2.5 53.8 2.3 53.7 10265 0.2 99.2 0.2 98.7 62 103 2.5 51.3 2.4 51.4 10366 0.2 99.0 0.2 98.4 63 104 2.6 48.8 2.5 49.0 10467 0.2 98.8 0.3 98.2 64 105 2.5 46.2 2.5 46.5 10568 0.3 98.6 0.3 97.9 65 106 2.5 43.7 2.4 44.0 10669 0.3 98.3 0.3 97.6 66 107 2.4 41.2 2.3 41.6 10770 0.3 98.0 0.4 97.3 68 108 2.4 38.8 2.3 39.3 10871 0.4 97.7 0.4 96.9 69 109 2.4 36.4 2.3 37.0 10972 0.4 97.3 0.5 96.5 70 110 2.4 34.0 2.2 34.8 11073 0.5 96.9 0.5 96.0 71 111 2.3 31.7 2.2 32.5 11174 0.5 96.4 0.6 95.5 72 112 2.2 29.4 2.1 30.3 11275 0.6 95.9 0.6 95.0 73 113 2.2 27.2 2.0 28.3 11476 0.6 95.3 0.6 94.4 74 114 2.0 25.1 1.9 26.3 11577 0.7 94.7 0.7 93.8 75 115 1.9 23.0 1.9 24.3 11678 0.8 94.0 0.8 93.1 77 116 1.9 21.1 1.8 22.5 11779 0.8 93.2 0.8 92.3 78 117 1.8 19.2 1.7 20.6 11880 0.9 92.4 0.9 91.5 79 118 1.7 17.3 1.6 18.9 11981 1.0 91.6 1.0 90.6 80 119 1.6 15.6 1.5 17.3 12082 1.1 90.6 1.1 89.6 81 120 1.6 14.0 1.5 15.8 12183 1.2 89.5 1.1 88.5 82 121 1.5 12.4 1.4 14.3 12284 1.3 88.3 1.2 87.3 83 122 1.3 10.9 1.3 12.9 12485 1.3 87.1 1.3 86.1 84 123 1.3 9.6 1.2 11.7 12586 1.4 85.7 1.4 84.8 85 124 1.2 8.4 1.1 10.5 12687 1.5 84.3 1.4 83.5 86 125 1.1 7.2 1.0 9.4 12788 1.6 82.9 1.5 82.0 87 126 1.0 6.1 1.0 8.4 12989 1.7 81.3 1.7 80.5 88 127 0.9 5.1 0.9 7.4 13090 1.8 79.6 1.7 78.8 90 128 0.8 4.3 0.8 6.6 13191 1.8 77.8 1.8 77.1 91 129 0.7 3.4 0.7 5.8 13392 1.9 76.1 1.9 75.4 92 130 0.6 2.7 0.7 5.1 13493 2.0 74.1 2.0 73.5 93 131 0.6 2.1 0.6 4.4 13694 2.1 72.2 2.0 71.5 94 132 0.4 1.6 0.5 3.8 13795 2.2 70.0 2.1 69.5 95 133 0.4 1.1 0.5 3.2 13996 2.2 67.8 2.2 67.4 96 134 0.3 0.7 0.4 2.8 14197 2.3 65.6 2.2 65.2 97 135 0.2 0.5 0.4 2.3 14398 2.3 63.3 2.3 63.0 98 136 0.1 0.3 0.3 1.9 14599 2.3 61.0 2.3 60.7 99 137 0.1 0.2 0.3 1.6 147100 2.4 58.7 2.3 58.4 100 138 0.0 0.1 0.3 1.4 149101 2.4 56.2 2.4 56.1 101 139 0.0 0.1 0.2 1.1 150Notes. C: composite score, P : percentage with score C, Q: percentage scoringat or above C. See Section 5 for an explanation of table contents.

Appendix F. Composite Transformation Tables F-11
TABLE F.11. Composite ‘97 Conversion: GT-Navy1980 1997 1980 1997
C P Q P Q ’97 C P Q P Q ‘9765 0.1 99.3 0.2 98.9 62 99 2.5 60.1 2.6 56.7 9866 0.2 99.1 0.2 98.7 63 100 2.6 57.6 2.7 54.1 9967 0.2 99.0 0.3 98.5 64 101 2.7 55.0 2.5 51.4 10068 0.2 98.8 0.3 98.2 66 102 2.5 52.3 2.7 48.8 10169 0.2 98.6 0.3 98.0 67 103 2.7 49.8 2.7 46.2 10270 0.3 98.3 0.4 97.6 68 104 2.7 47.1 2.6 43.5 10371 0.3 98.1 0.4 97.3 69 105 2.8 44.3 2.6 40.9 10472 0.4 97.7 0.4 96.9 70 106 2.4 41.5 2.6 38.2 10573 0.5 97.3 0.5 96.5 71 107 2.5 39.1 2.3 35.7 10674 0.4 96.9 0.6 96.0 72 108 2.6 36.6 2.3 33.3 10775 0.5 96.4 0.6 95.5 73 109 2.6 34.0 2.4 31.0 10876 0.6 95.9 0.6 94.9 74 110 2.2 31.4 2.2 28.7 10977 0.7 95.3 0.7 94.3 75 111 2.4 29.2 2.1 26.4 11078 0.7 94.6 0.8 93.6 76 112 2.1 26.8 2.0 24.3 11179 0.8 93.9 0.9 92.8 78 113 2.2 24.7 1.9 22.3 11280 0.9 93.1 1.0 91.9 79 114 2.0 22.5 1.9 20.4 11381 0.9 92.2 1.1 90.9 80 115 2.1 20.5 1.8 18.5 11482 1.1 91.3 1.2 89.8 81 116 2.0 18.4 1.7 16.7 11583 1.2 90.2 1.2 88.7 82 117 1.7 16.4 1.6 15.0 11684 1.3 89.0 1.3 87.5 83 118 1.9 14.7 1.4 13.4 11785 1.3 87.7 1.4 86.1 84 119 1.7 12.8 1.3 12.0 11886 1.5 86.5 1.7 84.7 85 120 1.6 11.0 1.3 10.6 12087 1.6 85.0 1.6 83.0 86 121 1.5 9.4 1.1 9.4 12188 1.6 83.4 1.8 81.4 87 122 1.3 8.0 1.0 8.2 12289 1.8 81.8 1.8 79.6 88 123 1.3 6.7 1.0 7.2 12490 1.9 80.0 2.0 77.7 89 124 1.2 5.4 0.8 6.3 12591 1.9 78.2 2.1 75.7 90 125 1.1 4.1 0.8 5.5 12792 2.0 76.3 2.2 73.6 91 126 1.1 3.0 0.7 4.6 12993 2.2 74.3 2.4 71.4 92 127 1.0 1.9 0.6 3.9 13194 2.4 72.1 2.4 69.1 93 128 0.7 1.0 0.5 3.3 13495 2.3 69.7 2.4 66.6 94 129 0.1 0.3 0.5 2.8 13996 2.5 67.4 2.6 64.3 95 130 0.1 0.2 0.4 2.3 14097 2.4 64.9 2.5 61.7 96 131 0.0 0.2 0.4 1.9 14198 2.4 62.5 2.5 59.2 97 132 0.0 0.1 0.3 1.5 142Notes. C: composite score, P : percentage with score C, Q: percentage scoringat or above C. See Section 5 for an explanation of table contents.

F-12 Appendix F. Composite Transformation Tables
TABLE F.12. Composite ‘97 Conversion: EL-Navy1980 1997 1980 1997
C P Q P Q ’97 C P Q P Q ‘97138 0.1 99.3 0.1 98.9 134 178 1.0 80.8 0.9 81.6 179139 0.1 99.2 0.1 98.8 135 179 1.0 79.9 0.9 80.7 180140 0.1 99.1 0.1 98.7 136 180 1.0 78.9 1.0 79.8 181141 0.1 99.0 0.1 98.6 138 181 1.1 77.9 1.0 78.7 182142 0.1 98.9 0.1 98.5 139 182 1.1 76.8 1.0 77.7 183143 0.1 98.7 0.2 98.3 140 183 1.2 75.7 1.1 76.7 184144 0.2 98.6 0.2 98.2 141 184 1.1 74.5 1.1 75.6 185145 0.2 98.4 0.2 98.0 142 185 1.2 73.4 1.1 74.5 186146 0.2 98.2 0.2 97.8 144 186 1.2 72.2 1.2 73.4 187147 0.2 98.0 0.2 97.6 145 187 1.2 71.0 1.2 72.2 188148 0.2 97.8 0.2 97.4 146 188 1.2 69.8 1.1 71.1 189149 0.2 97.6 0.2 97.2 147 189 1.2 68.6 1.2 69.9 190150 0.3 97.4 0.2 96.9 148 190 1.3 67.4 1.2 68.7 191151 0.3 97.1 0.3 96.7 149 191 1.3 66.1 1.2 67.5 192152 0.3 96.8 0.3 96.4 151 192 1.3 64.9 1.2 66.2 193153 0.3 96.5 0.3 96.2 152 193 1.3 63.6 1.2 65.0 194154 0.3 96.2 0.3 95.9 153 194 1.3 62.3 1.3 63.8 195155 0.3 95.9 0.3 95.5 154 195 1.2 61.0 1.3 62.5 196156 0.4 95.6 0.3 95.2 155 196 1.3 59.8 1.2 61.2 197157 0.4 95.2 0.4 94.9 156 197 1.4 58.5 1.4 60.0 198158 0.5 94.8 0.4 94.5 157 198 1.3 57.1 1.3 58.6 199159 0.4 94.3 0.4 94.1 158 199 1.3 55.8 1.4 57.4 200160 0.5 93.9 0.5 93.7 160 200 1.4 54.5 1.4 55.9 201161 0.5 93.4 0.5 93.2 161 201 1.4 53.1 1.3 54.6 202162 0.5 92.9 0.5 92.8 162 202 1.3 51.7 1.4 53.2 203163 0.6 92.4 0.5 92.3 163 203 1.3 50.4 1.4 51.8 204164 0.6 91.8 0.5 91.8 164 204 1.4 49.1 1.3 50.4 205165 0.6 91.3 0.6 91.3 165 205 1.3 47.7 1.3 49.1 206166 0.6 90.6 0.6 90.7 166 206 1.3 46.4 1.4 47.8 207167 0.7 90.0 0.6 90.1 167 207 1.3 45.2 1.3 46.4 208168 0.7 89.3 0.7 89.5 168 208 1.3 43.9 1.4 45.1 209169 0.8 88.6 0.7 88.8 169 209 1.3 42.6 1.4 43.7 210170 0.8 87.8 0.7 88.1 170 210 1.2 41.2 1.3 42.3 211171 0.8 87.1 0.7 87.4 171 211 1.2 40.0 1.3 41.1 212172 0.8 86.3 0.8 86.7 173 212 1.3 38.8 1.3 39.7 213173 0.8 85.4 0.8 86.0 174 213 1.2 37.5 1.3 38.5 214174 0.9 84.6 0.9 85.1 175 214 1.2 36.2 1.3 37.2 215175 0.9 83.7 0.8 84.3 176 215 1.2 35.0 1.2 35.9 216176 0.9 82.8 1.0 83.4 177 216 1.3 33.8 1.3 34.7 217177 1.1 81.9 0.9 82.5 178 217 1.2 32.5 1.2 33.4 218Notes. C: composite score, P : percentage with score C,Q: percentage scoringat or above C. See Section 5 for an explanation of table contents.

Appendix F. Composite Transformation Tables F-13
TABLE F.12. Composite ‘97 Conversion: EL-Navy (continued)1980 1997 1980 1997
C P Q P Q ’97 C P Q P Q ‘97218 1.1 31.4 1.3 32.2 219 244 0.6 8.0 0.6 8.7 245219 1.2 30.2 1.1 30.9 220 245 0.6 7.5 0.5 8.1 246220 1.2 29.1 1.2 29.8 221 246 0.5 6.9 0.5 7.6 248221 1.1 27.9 1.2 28.6 222 247 0.6 6.4 0.5 7.1 249222 1.1 26.8 1.1 27.4 223 248 0.4 5.8 0.4 6.6 250223 1.0 25.7 1.1 26.3 224 249 0.5 5.4 0.4 6.2 251224 1.0 24.7 1.1 25.2 224 250 0.4 4.9 0.4 5.8 252225 1.0 23.7 1.0 24.1 225 251 0.4 4.4 0.4 5.4 254226 1.0 22.7 1.0 23.1 226 252 0.4 4.0 0.3 5.0 255227 1.0 21.7 1.0 22.0 227 253 0.4 3.6 0.3 4.7 256228 0.9 20.7 0.9 21.0 228 254 0.4 3.2 0.3 4.3 258229 1.0 19.8 1.0 20.1 229 255 0.3 2.8 0.3 4.0 259230 0.9 18.9 0.9 19.1 230 256 0.4 2.5 0.3 3.7 260231 0.9 18.0 0.9 18.2 231 257 0.3 2.2 0.3 3.4 262232 0.9 17.0 0.9 17.3 232 258 0.3 1.9 0.3 3.1 263233 0.9 16.1 0.8 16.4 233 259 0.2 1.6 0.2 2.8 265234 0.8 15.2 0.8 15.6 234 260 0.2 1.3 0.2 2.6 267235 0.8 14.4 0.8 14.7 235 261 0.2 1.1 0.2 2.4 268236 0.7 13.6 0.7 14.0 237 262 0.1 0.9 0.2 2.2 270237 0.8 12.8 0.7 13.2 238 263 0.2 0.8 0.2 2.0 272238 0.7 12.1 0.7 12.5 239 264 0.1 0.6 0.2 1.8 274239 0.7 11.4 0.7 11.8 240 265 0.2 0.5 0.2 1.6 276240 0.7 10.7 0.6 11.1 241 266 0.1 0.3 0.1 1.5 279241 0.7 10.0 0.6 10.5 242 267 0.1 0.3 0.1 1.3 280242 0.7 9.3 0.6 9.9 243 268 0.1 0.2 0.1 1.2 283243 0.6 8.6 0.6 9.2 244 269 0.0 0.1 0.1 1.1 285Notes. C: composite score, P : percentage with score C, Q: percentage scoringat or above C. See Section 5 for an explanation of table contents.
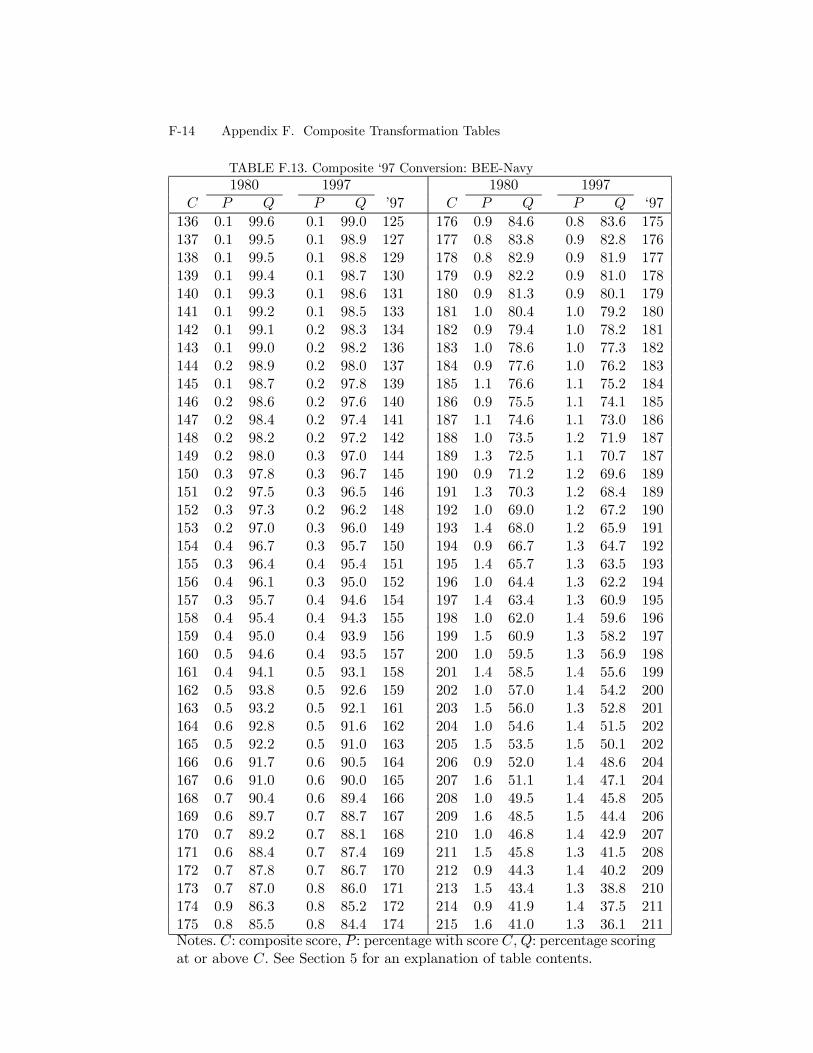
F-14 Appendix F. Composite Transformation Tables
TABLE F.13. Composite ‘97 Conversion: BEE-Navy1980 1997 1980 1997
C P Q P Q ’97 C P Q P Q ‘97136 0.1 99.6 0.1 99.0 125 176 0.9 84.6 0.8 83.6 175137 0.1 99.5 0.1 98.9 127 177 0.8 83.8 0.9 82.8 176138 0.1 99.5 0.1 98.8 129 178 0.8 82.9 0.9 81.9 177139 0.1 99.4 0.1 98.7 130 179 0.9 82.2 0.9 81.0 178140 0.1 99.3 0.1 98.6 131 180 0.9 81.3 0.9 80.1 179141 0.1 99.2 0.1 98.5 133 181 1.0 80.4 1.0 79.2 180142 0.1 99.1 0.2 98.3 134 182 0.9 79.4 1.0 78.2 181143 0.1 99.0 0.2 98.2 136 183 1.0 78.6 1.0 77.3 182144 0.2 98.9 0.2 98.0 137 184 0.9 77.6 1.0 76.2 183145 0.1 98.7 0.2 97.8 139 185 1.1 76.6 1.1 75.2 184146 0.2 98.6 0.2 97.6 140 186 0.9 75.5 1.1 74.1 185147 0.2 98.4 0.2 97.4 141 187 1.1 74.6 1.1 73.0 186148 0.2 98.2 0.2 97.2 142 188 1.0 73.5 1.2 71.9 187149 0.2 98.0 0.3 97.0 144 189 1.3 72.5 1.1 70.7 187150 0.3 97.8 0.3 96.7 145 190 0.9 71.2 1.2 69.6 189151 0.2 97.5 0.3 96.5 146 191 1.3 70.3 1.2 68.4 189152 0.3 97.3 0.2 96.2 148 192 1.0 69.0 1.2 67.2 190153 0.2 97.0 0.3 96.0 149 193 1.4 68.0 1.2 65.9 191154 0.4 96.7 0.3 95.7 150 194 0.9 66.7 1.3 64.7 192155 0.3 96.4 0.4 95.4 151 195 1.4 65.7 1.3 63.5 193156 0.4 96.1 0.3 95.0 152 196 1.0 64.4 1.3 62.2 194157 0.3 95.7 0.4 94.6 154 197 1.4 63.4 1.3 60.9 195158 0.4 95.4 0.4 94.3 155 198 1.0 62.0 1.4 59.6 196159 0.4 95.0 0.4 93.9 156 199 1.5 60.9 1.3 58.2 197160 0.5 94.6 0.4 93.5 157 200 1.0 59.5 1.3 56.9 198161 0.4 94.1 0.5 93.1 158 201 1.4 58.5 1.4 55.6 199162 0.5 93.8 0.5 92.6 159 202 1.0 57.0 1.4 54.2 200163 0.5 93.2 0.5 92.1 161 203 1.5 56.0 1.3 52.8 201164 0.6 92.8 0.5 91.6 162 204 1.0 54.6 1.4 51.5 202165 0.5 92.2 0.5 91.0 163 205 1.5 53.5 1.5 50.1 202166 0.6 91.7 0.6 90.5 164 206 0.9 52.0 1.4 48.6 204167 0.6 91.0 0.6 90.0 165 207 1.6 51.1 1.4 47.1 204168 0.7 90.4 0.6 89.4 166 208 1.0 49.5 1.4 45.8 205169 0.6 89.7 0.7 88.7 167 209 1.6 48.5 1.5 44.4 206170 0.7 89.2 0.7 88.1 168 210 1.0 46.8 1.4 42.9 207171 0.6 88.4 0.7 87.4 169 211 1.5 45.8 1.3 41.5 208172 0.7 87.8 0.7 86.7 170 212 0.9 44.3 1.4 40.2 209173 0.7 87.0 0.8 86.0 171 213 1.5 43.4 1.3 38.8 210174 0.9 86.3 0.8 85.2 172 214 0.9 41.9 1.4 37.5 211175 0.8 85.5 0.8 84.4 174 215 1.6 41.0 1.3 36.1 211Notes. C: composite score, P : percentage with score C,Q: percentage scoringat or above C. See Section 5 for an explanation of table contents.

Appendix F. Composite Transformation Tables F-15
TABLE F.13. Composite ‘97 Conversion: BEE-Navy (continued)1980 1997 1980 1997
C P Q P Q ’97 C P Q P Q ‘97216 0.9 39.4 1.2 34.8 213 242 0.6 13.7 0.6 9.7 236217 1.5 38.5 1.3 33.6 213 243 0.8 13.1 0.6 9.1 237218 0.9 37.0 1.3 32.3 214 244 0.7 12.4 0.5 8.5 238219 1.4 36.2 1.2 31.0 215 245 0.8 11.7 0.5 8.0 239220 0.9 34.7 1.2 29.8 216 246 0.6 10.9 0.5 7.6 240221 1.3 33.8 1.2 28.6 217 247 0.7 10.3 0.5 7.1 241222 0.8 32.5 1.2 27.5 218 248 0.6 9.6 0.5 6.6 242223 1.4 31.7 1.1 26.3 219 249 0.7 9.0 0.4 6.2 243224 0.8 30.3 1.1 25.2 220 250 0.6 8.4 0.4 5.8 244225 1.3 29.5 1.1 24.0 220 251 0.5 7.7 0.4 5.3 246226 0.9 28.2 1.1 23.0 221 252 0.6 7.2 0.4 5.0 247227 1.3 27.3 1.1 21.9 222 253 0.5 6.7 0.3 4.6 248228 0.8 26.0 1.0 20.9 223 254 0.6 6.2 0.3 4.2 249229 1.2 25.3 1.0 19.9 224 255 0.5 5.6 0.3 3.9 250230 0.8 24.0 1.0 18.9 225 256 0.5 5.1 0.3 3.6 252231 1.2 23.2 0.9 18.0 226 257 0.4 4.6 0.3 3.3 253232 0.8 22.0 0.9 17.1 227 258 0.5 4.2 0.3 3.1 254233 1.1 21.2 0.8 16.2 228 259 0.3 3.7 0.2 2.8 256234 0.7 20.2 0.8 15.4 229 260 0.5 3.3 0.3 2.6 257235 1.0 19.5 0.8 14.6 229 261 0.3 2.8 0.2 2.3 259236 0.7 18.4 0.8 13.8 231 262 0.5 2.5 0.2 2.1 260237 1.0 17.8 0.7 13.1 231 263 0.2 2.0 0.2 1.9 262238 0.6 16.8 0.7 12.3 232 264 0.5 1.8 0.2 1.8 264239 0.9 16.1 0.7 11.7 233 265 0.2 1.4 0.1 1.6 267240 0.6 15.2 0.6 11.0 234 266 0.4 1.2 0.2 1.4 268241 0.8 14.6 0.6 10.3 235 267 0.1 0.8 0.2 1.3 270Notes. C: composite score, P : percentage with score C, Q: percentage scoringat or above C. See Section 5 for an explanation of table contents.

F-16 Appendix F. Composite Transformation Tables
TABLE F.14. Composite ‘97 Conversion: ENG-Navy1980 1997 1980 1997
C P Q P Q ’97 C P Q P Q ‘9771 0.2 99.5 0.3 98.9 68 102 3.1 48.2 2.9 50.7 10372 0.3 99.2 0.3 98.7 70 103 3.0 45.1 3.0 47.8 10473 0.3 99.0 0.3 98.4 71 104 3.0 42.1 2.9 44.8 10574 0.4 98.6 0.4 98.0 72 105 2.5 39.1 2.8 41.8 10675 0.5 98.2 0.4 97.6 73 106 3.4 36.5 2.7 39.0 10776 0.5 97.7 0.5 97.2 75 107 2.3 33.2 2.6 36.3 10877 0.7 97.3 0.6 96.7 76 108 2.6 30.9 2.6 33.7 10978 0.6 96.6 0.6 96.1 77 109 2.6 28.2 2.6 31.1 11079 0.8 95.9 0.7 95.5 78 110 2.2 25.6 2.5 28.5 11180 0.9 95.1 0.9 94.8 80 111 2.6 23.4 2.3 26.0 11281 1.1 94.2 0.9 93.9 81 112 2.1 20.8 2.2 23.7 11382 1.1 93.1 1.1 92.9 82 113 2.0 18.7 2.1 21.6 11483 1.6 92.0 1.2 91.9 83 114 2.0 16.7 2.0 19.5 11584 1.2 90.4 1.3 90.7 84 115 1.9 14.7 1.8 17.5 11785 1.5 89.2 1.5 89.4 85 116 1.6 12.8 1.7 15.7 11886 1.8 87.6 1.5 87.9 86 117 1.6 11.2 1.6 14.0 11987 1.6 85.8 1.7 86.4 87 118 1.3 9.6 1.4 12.4 12088 2.3 84.3 1.7 84.8 88 119 1.2 8.3 1.3 10.9 12189 1.8 82.0 1.9 83.0 90 120 1.1 7.1 1.2 9.6 12290 2.2 80.1 1.9 81.1 90 121 1.1 6.0 1.1 8.4 12391 2.3 77.9 2.2 79.2 92 122 0.7 4.9 1.0 7.3 12592 2.5 75.6 2.2 77.0 93 123 0.8 4.2 0.9 6.3 12693 2.4 73.1 2.4 74.8 94 124 0.6 3.3 0.8 5.5 12794 2.7 70.7 2.5 72.4 95 125 0.5 2.7 0.7 4.7 12895 2.7 68.0 2.5 69.9 96 126 0.5 2.2 0.7 4.0 12996 2.5 65.2 2.7 67.4 97 127 0.3 1.7 0.5 3.3 13197 3.3 62.8 2.8 64.8 98 128 0.3 1.4 0.5 2.8 13298 2.6 59.5 2.7 62.0 99 129 0.2 1.1 0.4 2.3 13399 2.8 56.9 2.9 59.3 100 130 0.3 0.8 0.3 2.0 134100 3.1 54.1 2.8 56.4 101 131 0.1 0.6 0.3 1.6 136101 2.9 51.0 2.9 53.7 102 132 0.2 0.5 0.2 1.3 137Notes. C: composite score, P : percentage with score C,Q: percentage scoringat or above C. See Section 5 for an explanation of table contents.

Appendix F. Composite Transformation Tables F-17
TABLE F.15. Composite ‘97 Conversion: MEC-Navy1980 1997 1980 1997
C P Q P Q ’97 C P Q P Q ‘97103 0.2 98.9 0.1 99.0 104 143 1.6 58.5 1.6 66.1 148104 0.3 98.7 0.1 98.9 106 144 1.6 56.9 1.5 64.6 149105 0.3 98.4 0.2 98.8 107 145 1.6 55.3 1.6 63.0 150106 0.4 98.1 0.2 98.6 108 146 1.5 53.7 1.7 61.5 151107 0.4 97.8 0.2 98.4 110 147 1.5 52.2 1.6 59.8 152108 0.4 97.4 0.2 98.2 111 148 1.6 50.7 1.7 58.2 153109 0.4 97.0 0.3 98.0 112 149 1.5 49.1 1.7 56.5 153110 0.5 96.5 0.3 97.6 113 150 1.6 47.5 1.6 54.8 154111 0.5 96.0 0.3 97.3 114 151 1.5 45.9 1.7 53.2 155112 0.6 95.5 0.3 97.0 116 152 1.5 44.4 1.7 51.5 156113 0.7 94.9 0.4 96.6 117 153 1.5 42.8 1.6 49.9 157114 0.6 94.2 0.4 96.2 118 154 1.6 41.4 1.7 48.2 158115 0.8 93.6 0.5 95.8 119 155 1.4 39.8 1.6 46.6 159116 0.7 92.8 0.5 95.3 120 156 1.5 38.4 1.7 45.0 160117 1.0 92.1 0.6 94.8 121 157 1.4 36.9 1.6 43.3 161118 0.9 91.1 0.6 94.3 123 158 1.5 35.4 1.6 41.7 162119 1.0 90.3 0.6 93.6 124 159 1.4 33.9 1.6 40.2 163120 1.0 89.3 0.7 93.0 125 160 1.5 32.5 1.5 38.6 164121 1.0 88.3 0.7 92.3 126 161 1.4 31.0 1.6 37.1 165122 1.2 87.3 0.7 91.6 127 162 1.3 29.6 1.5 35.5 166123 1.1 86.2 0.8 90.9 128 163 1.4 28.3 1.4 34.0 167124 1.2 85.1 0.9 90.1 129 164 1.2 26.8 1.5 32.5 168125 1.2 83.9 0.9 89.2 130 165 1.5 25.6 1.4 31.1 169126 1.3 82.7 1.0 88.2 131 166 1.1 24.1 1.5 29.7 170127 1.2 81.4 1.0 87.2 132 167 1.4 23.0 1.3 28.2 171128 1.3 80.2 1.1 86.2 133 168 1.1 21.6 1.3 26.9 172129 1.2 78.8 1.1 85.2 134 169 1.3 20.5 1.4 25.5 173130 1.5 77.6 1.1 84.0 135 170 1.1 19.2 1.3 24.1 174131 1.3 76.1 1.2 82.9 136 171 1.2 18.1 1.2 22.8 175132 1.3 74.8 1.2 81.7 137 172 1.1 16.9 1.2 21.6 176133 1.5 73.4 1.3 80.5 138 173 1.0 15.8 1.2 20.4 177134 1.4 72.0 1.2 79.2 139 174 1.1 14.8 1.1 19.2 178135 1.6 70.5 1.4 78.0 140 175 1.0 13.7 1.2 18.1 179136 1.5 68.9 1.4 76.6 141 176 1.0 12.8 1.1 17.0 180137 1.6 67.5 1.4 75.2 142 177 0.8 11.8 1.0 15.9 181138 1.4 65.9 1.4 73.8 143 178 1.0 11.0 0.9 14.8 182139 1.6 64.5 1.4 72.3 144 179 0.7 10.0 1.0 14.0 183140 1.3 62.9 1.6 70.9 145 180 0.9 9.3 0.9 12.9 184141 1.7 61.5 1.6 69.2 146 181 0.7 8.3 0.8 12.0 186142 1.4 59.9 1.5 67.7 147 182 0.8 7.7 0.8 11.2 187Notes. C: composite score, P : percentage with score C, Q: percentage scoringat or above C. See Section 5 for an explanation of table contents.

F-18 Appendix F. Composite Transformation Tables
TABLE F.15. Composite ‘97 Conversion: MEC-Navy (continued)1980 1997 1980 1997
C P Q P Q ’97 C P Q P Q ‘97183 0.6 6.9 0.8 10.3 188 194 0.3 1.5 0.4 3.9 202184 0.7 6.3 0.7 9.5 189 195 0.2 1.3 0.4 3.5 204185 0.6 5.5 0.8 8.8 190 196 0.2 1.1 0.3 3.1 205186 0.6 5.0 0.6 8.0 191 197 0.2 0.8 0.3 2.8 207187 0.6 4.4 0.6 7.4 193 198 0.2 0.7 0.3 2.5 208188 0.4 3.8 0.6 6.9 194 199 0.1 0.5 0.2 2.3 210189 0.5 3.4 0.6 6.3 195 200 0.1 0.4 0.2 2.0 212190 0.4 2.9 0.6 5.7 197 201 0.1 0.3 0.2 1.8 215191 0.4 2.6 0.5 5.2 198 202 0.1 0.2 0.2 1.6 217192 0.3 2.1 0.5 4.7 200 203 0.1 0.1 0.2 1.4 220193 0.3 1.9 0.4 4.2 201 204 0.0 0.1 0.2 1.3 222Notes. C: composite score, P : percentage with score C,Q: percentage scoringat or above C. See Section 5 for an explanation of table contents.

Appendix F. Composite Transformation Tables F-19
TABLE F.16. Composite ‘97 Conversion: MEC2-Navy1980 1997 1980 1997
C P Q P Q ’97 C P Q P Q ‘97100 0.2 98.9 0.1 99.3 103 140 1.4 69.3 1.3 75.9 145101 0.2 98.8 0.1 99.2 105 141 1.3 67.9 1.4 74.7 146102 0.2 98.6 0.1 99.1 106 142 1.5 66.6 1.3 73.3 147103 0.3 98.3 0.1 99.0 107 143 1.4 65.1 1.3 72.0 148104 0.3 98.0 0.1 98.9 108 144 1.5 63.7 1.5 70.7 149105 0.3 97.8 0.2 98.7 109 145 1.5 62.3 1.5 69.2 149106 0.3 97.5 0.2 98.6 111 146 1.5 60.8 1.6 67.7 150107 0.4 97.1 0.2 98.4 112 147 1.5 59.2 1.5 66.1 151108 0.4 96.7 0.3 98.1 113 148 1.5 57.7 1.6 64.6 152109 0.4 96.3 0.3 97.9 114 149 1.5 56.2 1.6 63.0 153110 0.4 95.9 0.3 97.6 115 150 1.6 54.7 1.6 61.4 154111 0.5 95.5 0.3 97.3 116 151 1.5 53.1 1.7 59.8 155112 0.5 95.0 0.4 97.0 117 152 1.6 51.6 1.7 58.1 156113 0.5 94.5 0.3 96.7 118 153 1.6 50.0 1.7 56.4 157114 0.6 94.0 0.4 96.3 119 154 1.6 48.4 1.7 54.7 158115 0.6 93.4 0.4 95.9 120 155 1.5 46.9 1.7 53.0 159116 0.6 92.9 0.5 95.5 121 156 1.6 45.3 1.7 51.3 159117 0.7 92.2 0.4 95.1 122 157 1.6 43.7 1.8 49.6 160118 0.7 91.6 0.5 94.6 123 158 1.6 42.2 1.8 47.8 161119 0.7 90.8 0.5 94.1 125 159 1.6 40.5 1.7 46.0 162120 0.7 90.2 0.6 93.6 125 160 1.4 39.0 1.8 44.3 163121 0.8 89.4 0.6 93.0 127 161 1.5 37.5 1.7 42.5 164122 0.9 88.6 0.6 92.5 128 162 1.5 36.0 1.7 40.8 165123 0.8 87.7 0.7 91.8 129 163 1.6 34.5 1.7 39.1 166124 0.9 86.9 0.7 91.2 130 164 1.4 32.9 1.6 37.3 167125 0.9 86.1 0.7 90.5 131 165 1.4 31.5 1.6 35.7 168126 1.0 85.2 0.8 89.8 131 166 1.5 30.1 1.6 34.1 168127 1.0 84.2 0.8 89.1 132 167 1.4 28.6 1.6 32.4 169128 1.0 83.3 0.9 88.3 133 168 1.5 27.2 1.6 30.8 170129 1.0 82.3 0.9 87.4 134 169 1.3 25.8 1.5 29.2 171130 1.0 81.2 0.9 86.5 135 170 1.3 24.4 1.5 27.7 172131 1.1 80.2 1.0 85.6 136 171 1.3 23.1 1.4 26.2 173132 1.1 79.1 0.9 84.7 137 172 1.2 21.8 1.5 24.7 174133 1.1 78.0 1.0 83.8 138 173 1.2 20.6 1.4 23.3 175134 1.2 76.9 1.0 82.7 139 174 1.2 19.4 1.3 21.8 176135 1.3 75.7 1.2 81.7 140 175 1.2 18.2 1.3 20.5 177136 1.2 74.4 1.0 80.6 141 176 1.1 17.0 1.3 19.2 178137 1.2 73.2 1.2 79.5 142 177 1.2 15.8 1.3 18.0 179138 1.3 72.0 1.2 78.4 143 178 1.0 14.7 1.2 16.7 180139 1.4 70.7 1.2 77.2 144 179 1.0 13.7 1.1 15.5 181Notes. C: composite score, P : percentage with score C, Q: percentage scoringat or above C. See Section 5 for an explanation of table contents.
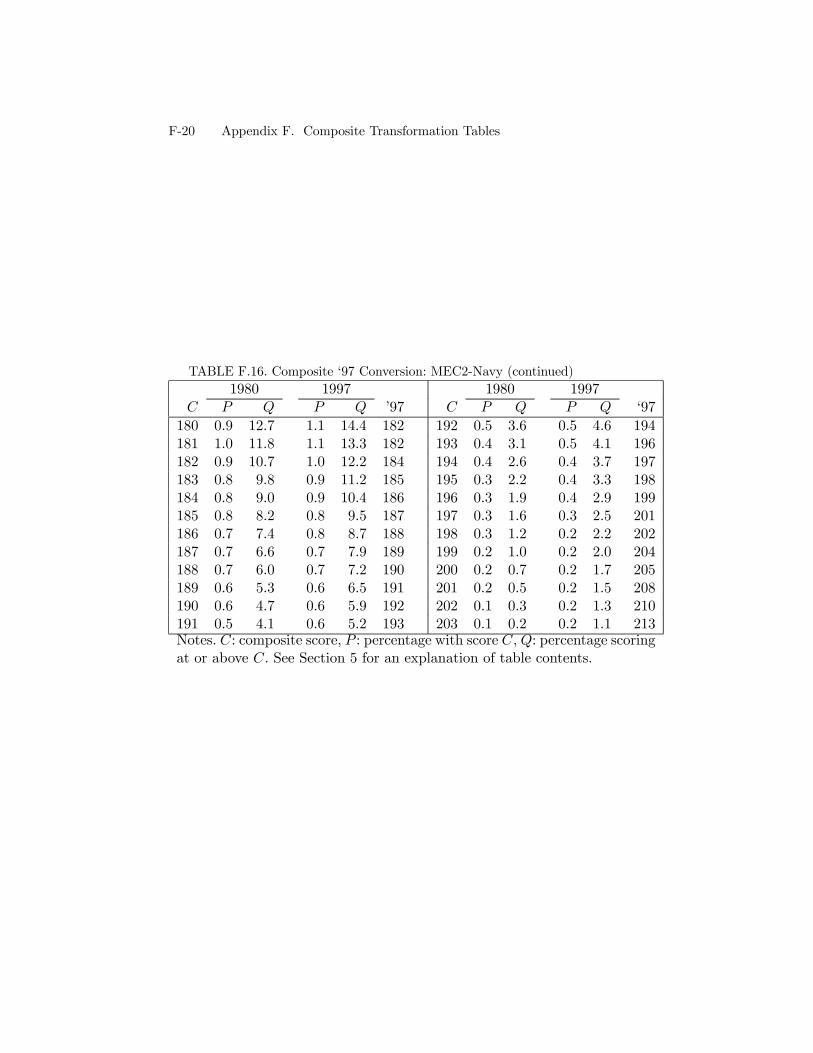
F-20 Appendix F. Composite Transformation Tables
TABLE F.16. Composite ‘97 Conversion: MEC2-Navy (continued)1980 1997 1980 1997
C P Q P Q ’97 C P Q P Q ‘97180 0.9 12.7 1.1 14.4 182 192 0.5 3.6 0.5 4.6 194181 1.0 11.8 1.1 13.3 182 193 0.4 3.1 0.5 4.1 196182 0.9 10.7 1.0 12.2 184 194 0.4 2.6 0.4 3.7 197183 0.8 9.8 0.9 11.2 185 195 0.3 2.2 0.4 3.3 198184 0.8 9.0 0.9 10.4 186 196 0.3 1.9 0.4 2.9 199185 0.8 8.2 0.8 9.5 187 197 0.3 1.6 0.3 2.5 201186 0.7 7.4 0.8 8.7 188 198 0.3 1.2 0.2 2.2 202187 0.7 6.6 0.7 7.9 189 199 0.2 1.0 0.2 2.0 204188 0.7 6.0 0.7 7.2 190 200 0.2 0.7 0.2 1.7 205189 0.6 5.3 0.6 6.5 191 201 0.2 0.5 0.2 1.5 208190 0.6 4.7 0.6 5.9 192 202 0.1 0.3 0.2 1.3 210191 0.5 4.1 0.6 5.2 193 203 0.1 0.2 0.2 1.1 213Notes. C: composite score, P : percentage with score C,Q: percentage scoringat or above C. See Section 5 for an explanation of table contents.

Appendix F. Composite Transformation Tables F-21
TABLE F.17. Composite ‘97 Conversion: NUC-Navy1980 1997 1980 1997
C P Q P Q ’97 C P Q P Q ‘97138 0.1 99.3 0.1 98.9 134 178 0.9 83.0 0.9 83.3 178139 0.1 99.2 0.1 98.9 135 179 0.9 82.1 0.9 82.4 179140 0.1 99.1 0.1 98.7 136 180 1.0 81.2 1.0 81.5 180141 0.1 99.0 0.1 98.6 137 181 1.0 80.2 1.0 80.5 181142 0.1 98.9 0.1 98.5 139 182 1.0 79.1 1.1 79.5 182143 0.1 98.8 0.1 98.4 140 183 1.1 78.2 1.1 78.4 183144 0.1 98.6 0.1 98.3 141 184 1.1 77.1 1.1 77.3 184145 0.1 98.5 0.2 98.1 142 185 1.0 76.0 1.0 76.2 185146 0.2 98.3 0.2 98.0 143 186 1.1 75.0 1.1 75.2 186147 0.2 98.2 0.2 97.8 145 187 1.1 73.9 1.2 74.1 187148 0.2 97.9 0.2 97.6 146 188 1.2 72.8 1.2 72.9 188149 0.2 97.8 0.2 97.4 147 189 1.2 71.6 1.2 71.7 189150 0.2 97.6 0.2 97.2 148 190 1.2 70.4 1.2 70.4 190151 0.2 97.3 0.2 97.0 149 191 1.2 69.2 1.2 69.2 191152 0.2 97.1 0.2 96.8 150 192 1.2 68.0 1.4 68.0 192153 0.2 96.9 0.2 96.6 152 193 1.3 66.8 1.4 66.6 193154 0.3 96.6 0.3 96.3 153 194 1.3 65.5 1.3 65.2 194155 0.3 96.3 0.3 96.0 154 195 1.3 64.2 1.3 63.9 195156 0.4 96.0 0.3 95.7 155 196 1.3 63.0 1.3 62.6 196157 0.4 95.7 0.3 95.4 156 197 1.3 61.7 1.4 61.3 197158 0.3 95.3 0.4 95.1 157 198 1.3 60.4 1.4 59.8 198159 0.5 95.0 0.4 94.7 158 199 1.3 59.1 1.4 58.4 199160 0.4 94.5 0.4 94.3 159 200 1.3 57.7 1.4 57.0 199161 0.4 94.1 0.4 94.0 161 201 1.4 56.5 1.4 55.6 200162 0.5 93.7 0.5 93.6 162 202 1.3 55.1 1.4 54.1 201163 0.5 93.2 0.5 93.1 163 203 1.3 53.8 1.4 52.7 202164 0.5 92.7 0.4 92.6 164 204 1.3 52.4 1.5 51.3 203165 0.6 92.2 0.5 92.2 165 205 1.3 51.1 1.4 49.9 204166 0.6 91.7 0.5 91.7 166 206 1.4 49.8 1.4 48.5 205167 0.6 91.1 0.6 91.2 167 207 1.3 48.4 1.4 47.0 206168 0.6 90.5 0.6 90.5 168 208 1.4 47.2 1.4 45.6 207169 0.7 89.9 0.6 89.9 169 209 1.3 45.8 1.5 44.2 208170 0.7 89.2 0.6 89.4 170 210 1.4 44.5 1.4 42.7 209171 0.7 88.5 0.7 88.7 171 211 1.3 43.1 1.4 41.3 210172 0.7 87.8 0.7 88.1 172 212 1.3 41.8 1.3 39.9 211173 0.8 87.1 0.8 87.4 173 213 1.3 40.5 1.3 38.5 212174 0.8 86.4 0.8 86.6 174 214 1.3 39.2 1.3 37.3 212175 0.9 85.6 0.8 85.9 175 215 1.2 37.9 1.3 36.0 214176 0.9 84.7 0.9 85.1 176 216 1.2 36.7 1.3 34.7 214177 0.9 83.8 0.9 84.2 177 217 1.3 35.5 1.3 33.3 215Notes. C: composite score, P : percentage with score C, Q: percentage scoringat or above C. See Section 5 for an explanation of table contents.

F-22 Appendix F. Composite Transformation Tables
TABLE F.17. Composite ‘97 Conversion: NUC-Navy (continued)1980 1997 1980 1997
C P Q P Q ’97 C P Q P Q ‘97218 1.2 34.2 1.3 32.1 216 243 0.7 9.5 0.5 8.7 242219 1.2 33.0 1.3 30.8 217 244 0.6 8.8 0.5 8.1 243220 1.2 31.7 1.2 29.5 218 245 0.6 8.1 0.5 7.6 244221 1.2 30.5 1.2 28.3 219 246 0.6 7.5 0.4 7.1 245222 1.2 29.4 1.2 27.1 220 247 0.6 6.9 0.5 6.6 246223 1.2 28.2 1.2 26.0 221 248 0.6 6.3 0.5 6.2 248224 1.1 27.0 1.2 24.8 222 249 0.5 5.7 0.4 5.7 249225 1.1 25.9 1.1 23.7 223 250 0.5 5.2 0.4 5.2 250226 1.0 24.7 1.1 22.6 224 251 0.5 4.7 0.4 4.9 251227 1.1 23.7 1.0 21.5 225 252 0.5 4.2 0.4 4.5 253228 1.1 22.6 1.0 20.4 226 253 0.5 3.8 0.3 4.1 254229 1.0 21.6 1.0 19.5 227 254 0.4 3.3 0.3 3.8 256230 1.0 20.5 0.9 18.5 228 255 0.4 2.9 0.3 3.5 257231 1.0 19.5 0.9 17.6 229 256 0.4 2.5 0.3 3.2 259232 1.0 18.5 0.8 16.7 230 257 0.3 2.1 0.2 2.9 260233 0.9 17.5 0.9 15.8 231 258 0.3 1.8 0.2 2.7 262234 0.9 16.6 0.8 14.9 232 259 0.3 1.5 0.3 2.4 264235 0.8 15.7 0.7 14.1 233 260 0.2 1.2 0.2 2.2 266236 0.9 14.9 0.8 13.4 234 261 0.2 1.0 0.2 2.0 268237 0.8 14.1 0.7 12.6 235 262 0.2 0.7 0.2 1.8 270238 0.8 13.2 0.7 11.9 236 263 0.2 0.6 0.2 1.6 272239 0.8 12.4 0.7 11.2 237 264 0.1 0.4 0.2 1.5 275240 0.7 11.7 0.6 10.4 238 265 0.1 0.2 0.1 1.3 278241 0.8 10.9 0.6 9.8 239 266 0.1 0.2 0.1 1.2 281242 0.7 10.1 0.6 9.2 241 267 0.0 0.1 0.1 1.1 287Notes. C: composite score, P : percentage with score C,Q: percentage scoringat or above C. See Section 5 for an explanation of table contents.

Appendix F. Composite Transformation Tables F-23
TABLE F.18. Composite ‘97 Conversion: OPS-Navy1980 1997 1980 1997
C P Q P Q ’97 C P Q P Q ‘97139 0.1 99.2 0.1 99.0 136 179 0.8 83.3 0.9 83.0 179140 0.1 99.1 0.1 98.8 137 180 0.9 82.5 0.9 82.1 180141 0.1 99.0 0.1 98.7 138 181 0.9 81.6 0.9 81.2 181142 0.1 98.9 0.1 98.6 139 182 0.9 80.7 0.9 80.4 182143 0.1 98.8 0.1 98.5 140 183 0.9 79.8 1.0 79.4 183144 0.1 98.7 0.1 98.3 141 184 0.9 78.8 1.0 78.4 184145 0.1 98.5 0.2 98.2 142 185 1.1 77.9 1.0 77.4 184146 0.2 98.4 0.2 98.0 144 186 1.0 76.8 1.1 76.4 186147 0.2 98.2 0.2 97.9 145 187 1.1 75.9 1.1 75.3 186148 0.2 98.0 0.2 97.7 146 188 1.1 74.8 1.1 74.2 187149 0.2 97.9 0.2 97.5 147 189 1.1 73.7 1.1 73.1 188150 0.2 97.6 0.2 97.3 148 190 1.1 72.6 1.2 71.9 189151 0.2 97.4 0.2 97.1 149 191 1.2 71.5 1.3 70.8 190152 0.3 97.2 0.3 96.8 150 192 1.2 70.3 1.2 69.5 191153 0.2 96.9 0.3 96.6 152 193 1.3 69.1 1.2 68.3 192154 0.3 96.7 0.3 96.3 153 194 1.2 67.8 1.3 67.1 193155 0.3 96.4 0.3 96.0 154 195 1.3 66.6 1.4 65.8 194156 0.3 96.1 0.4 95.8 155 196 1.3 65.3 1.4 64.4 195157 0.3 95.8 0.3 95.4 156 197 1.3 64.0 1.4 63.0 196158 0.3 95.5 0.4 95.1 157 198 1.3 62.7 1.3 61.7 197159 0.4 95.1 0.3 94.7 158 199 1.3 61.4 1.3 60.4 198160 0.4 94.8 0.4 94.4 159 200 1.3 60.1 1.4 59.1 199161 0.4 94.3 0.4 94.0 160 201 1.3 58.8 1.4 57.7 200162 0.5 93.9 0.4 93.6 161 202 1.3 57.5 1.4 56.3 201163 0.4 93.5 0.5 93.2 162 203 1.4 56.2 1.4 54.9 202164 0.5 93.0 0.5 92.7 163 204 1.3 54.8 1.4 53.4 203165 0.5 92.6 0.5 92.2 164 205 1.4 53.5 1.5 52.0 204166 0.5 92.0 0.5 91.7 165 206 1.3 52.1 1.4 50.6 205167 0.6 91.6 0.5 91.2 166 207 1.4 50.8 1.4 49.2 206168 0.6 91.0 0.6 90.7 167 208 1.4 49.4 1.4 47.8 207169 0.6 90.4 0.6 90.1 168 209 1.3 48.0 1.5 46.4 208170 0.6 89.8 0.7 89.5 169 210 1.5 46.7 1.5 44.9 209171 0.6 89.2 0.6 88.8 170 211 1.3 45.2 1.5 43.4 210172 0.7 88.6 0.6 88.2 171 212 1.4 43.8 1.4 41.9 211173 0.7 87.9 0.7 87.6 172 213 1.4 42.4 1.4 40.5 212174 0.7 87.2 0.7 86.9 173 214 1.4 41.1 1.4 39.0 213175 0.8 86.5 0.8 86.2 174 215 1.3 39.6 1.4 37.7 214176 0.8 85.8 0.7 85.4 176 216 1.4 38.3 1.4 36.3 215177 0.8 85.0 0.8 84.7 177 217 1.3 36.9 1.4 35.0 216178 0.8 84.2 0.9 83.9 178 218 1.3 35.6 1.4 33.5 217Notes. C: composite score, P : percentage with score C, Q: percentage scoringat or above C. See Section 5 for an explanation of table contents.

F-24 Appendix F. Composite Transformation Tables
TABLE F.18. Composite ‘97 Conversion: OPS-Navy (continued)1980 1997 1980 1997
C P Q P Q ’97 C P Q P Q ‘97219 1.3 34.3 1.4 32.2 217 241 0.8 10.5 0.7 9.6 240220 1.3 33.0 1.4 30.8 218 242 0.8 9.7 0.7 8.9 241221 1.3 31.7 1.3 29.4 219 243 0.7 8.9 0.6 8.2 242222 1.3 30.4 1.2 28.1 220 244 0.7 8.2 0.6 7.6 243223 1.2 29.1 1.3 26.9 221 245 0.7 7.5 0.5 7.0 244224 1.2 27.8 1.2 25.7 222 246 0.6 6.8 0.5 6.5 245225 1.2 26.6 1.2 24.5 223 247 0.6 6.2 0.5 6.0 247226 1.2 25.5 1.1 23.3 224 248 0.6 5.5 0.4 5.5 248227 1.2 24.3 1.1 22.2 225 249 0.5 5.0 0.4 5.1 249228 1.2 23.2 1.0 21.1 226 250 0.6 4.5 0.4 4.7 251229 1.1 22.0 1.0 20.0 227 251 0.5 3.9 0.4 4.3 252230 1.1 20.9 1.0 19.0 228 252 0.4 3.4 0.4 3.9 253231 1.0 19.8 1.1 18.0 229 253 0.4 3.0 0.4 3.5 254232 1.0 18.8 0.9 17.0 230 254 0.4 2.5 0.3 3.1 256233 1.0 17.8 0.9 16.0 231 255 0.4 2.2 0.3 2.8 257234 1.0 16.8 0.9 15.1 232 256 0.3 1.8 0.3 2.5 259235 1.0 15.8 0.8 14.2 233 257 0.3 1.5 0.3 2.2 261236 0.9 14.8 0.8 13.4 234 258 0.2 1.2 0.2 2.0 262237 0.9 13.9 0.8 12.6 235 259 0.2 1.0 0.2 1.8 264238 0.9 13.1 0.8 11.7 236 260 0.2 0.7 0.2 1.6 266239 0.9 12.2 0.7 11.0 237 261 0.2 0.5 0.1 1.4 268240 0.8 11.3 0.7 10.3 239 262 0.2 0.4 0.2 1.3 270Notes. C: composite score, P : percentage with score C,Q: percentage scoringat or above C. See Section 5 for an explanation of table contents.

Appendix F. Composite Transformation Tables F-25
TABLE F.19. Composite ‘97 Conversion: HM-Navy1980 1997 1980 1997
C P Q P Q ’97 C P Q P Q ‘97100 0.1 99.4 0.1 98.9 94 140 1.5 76.7 1.5 71.5 137101 0.1 99.3 0.1 98.8 96 141 1.5 75.3 1.6 70.0 138102 0.1 99.2 0.1 98.6 97 142 1.5 73.7 1.6 68.4 139103 0.1 99.1 0.1 98.5 98 143 1.5 72.2 1.6 66.8 140104 0.1 99.0 0.2 98.3 99 144 1.6 70.6 1.7 65.1 141105 0.1 98.9 0.2 98.2 100 145 1.7 69.0 1.8 63.4 142106 0.1 98.8 0.2 98.0 101 146 1.7 67.4 1.7 61.7 143107 0.2 98.6 0.2 97.8 102 147 1.7 65.7 1.7 60.0 144108 0.2 98.5 0.2 97.6 103 148 1.7 64.0 1.7 58.3 145109 0.2 98.3 0.3 97.4 104 149 1.7 62.3 1.8 56.6 146110 0.2 98.1 0.3 97.1 105 150 1.7 60.6 1.8 54.7 147111 0.2 97.9 0.3 96.8 106 151 1.8 58.9 1.9 52.9 148112 0.2 97.7 0.3 96.5 108 152 1.7 57.1 1.8 51.1 149113 0.3 97.5 0.4 96.2 109 153 1.8 55.3 1.8 49.3 150114 0.3 97.2 0.4 95.8 110 154 1.9 53.5 1.8 47.4 151115 0.4 96.9 0.5 95.5 111 155 1.8 51.7 1.8 45.6 152116 0.3 96.5 0.4 95.0 112 156 1.8 49.8 1.8 43.8 153117 0.4 96.2 0.5 94.6 113 157 1.8 48.0 1.8 42.0 154118 0.4 95.8 0.5 94.0 114 158 1.8 46.2 1.9 40.1 155119 0.4 95.4 0.5 93.5 115 159 1.9 44.4 1.7 38.3 156120 0.5 95.0 0.6 93.0 116 160 1.8 42.5 1.8 36.5 157121 0.5 94.5 0.7 92.4 117 161 1.8 40.7 1.7 34.7 158122 0.6 94.0 0.7 91.7 118 162 1.9 38.9 1.6 33.0 159123 0.6 93.4 0.8 91.0 119 163 1.8 37.0 1.6 31.4 160124 0.6 92.8 0.8 90.3 120 164 1.8 35.2 1.6 29.8 161125 0.7 92.2 0.8 89.5 121 165 1.7 33.4 1.5 28.2 162126 0.7 91.5 0.9 88.7 122 166 1.7 31.7 1.6 26.7 163127 0.9 90.7 1.0 87.8 123 167 1.6 30.0 1.5 25.1 164128 0.8 89.9 1.1 86.8 124 168 1.7 28.4 1.4 23.6 165129 0.9 89.0 1.0 85.8 126 169 1.5 26.7 1.3 22.2 166130 0.9 88.2 1.0 84.7 127 170 1.6 25.2 1.3 20.9 167131 1.0 87.3 1.1 83.7 128 171 1.4 23.6 1.3 19.6 168132 1.1 86.2 1.2 82.6 129 172 1.5 22.1 1.2 18.3 169133 1.1 85.2 1.2 81.4 130 173 1.4 20.6 1.3 17.1 170134 1.1 84.1 1.3 80.2 131 174 1.4 19.3 1.1 15.8 171135 1.1 83.0 1.3 78.9 132 175 1.3 17.8 1.1 14.8 172136 1.3 81.9 1.4 77.5 133 176 1.3 16.5 1.0 13.7 173137 1.2 80.6 1.5 76.1 134 177 1.2 15.2 1.0 12.7 175138 1.3 79.4 1.5 74.6 135 178 1.2 14.0 0.9 11.7 176139 1.4 78.1 1.6 73.1 136 179 1.2 12.8 0.9 10.8 177Notes. C: composite score, P : percentage with score C, Q: percentage scoringat or above C. See Section 5 for an explanation of table contents.

F-26 Appendix F. Composite Transformation Tables
TABLE F.19. Composite ‘97 Conversion: HM-Navy (continued)1980 1997 1980 1997
C P Q P Q ’97 C P Q P Q ‘97180 1.1 11.7 0.8 9.9 178 190 0.6 3.3 0.4 3.6 191181 1.0 10.6 0.7 9.1 179 191 0.5 2.7 0.3 3.2 193182 1.0 9.5 0.8 8.3 180 192 0.4 2.1 0.3 2.9 194183 0.9 8.5 0.7 7.5 182 193 0.4 1.7 0.3 2.5 196184 0.9 7.6 0.7 6.8 183 194 0.4 1.3 0.3 2.2 198185 0.8 6.8 0.6 6.2 184 195 0.2 0.9 0.2 1.9 200186 0.8 6.0 0.5 5.6 185 196 0.3 0.7 0.2 1.7 202187 0.7 5.2 0.6 5.1 187 197 0.1 0.4 0.2 1.5 205188 0.6 4.5 0.4 4.5 188 198 0.2 0.3 0.2 1.3 206189 0.6 3.9 0.4 4.1 189 199 0.0 0.1 0.2 1.1 211Notes. C: composite score, P : percentage with score C,Q: percentage scoringat or above C. See Section 5 for an explanation of table contents.

Appendix F. Composite Transformation Tables F-27
TABLE F.20. Composite ‘97 Conversion: ADM-Navy1980 1997 1980 1997
C P Q P Q ’97 C P Q P Q ‘9767 0.1 99.5 0.2 98.9 62 100 2.8 65.2 2.9 56.6 9768 0.1 99.4 0.2 98.7 63 101 2.6 62.4 2.8 53.7 9869 0.1 99.3 0.2 98.5 64 102 2.8 59.8 2.9 50.9 9970 0.2 99.1 0.3 98.3 65 103 3.0 57.0 2.9 48.0 10071 0.2 99.0 0.3 98.0 66 104 2.6 54.0 2.9 45.0 10172 0.2 98.8 0.3 97.7 68 105 3.0 51.4 2.8 42.1 10273 0.2 98.6 0.3 97.4 69 106 3.0 48.4 2.7 39.3 10374 0.3 98.4 0.4 97.1 69 107 2.7 45.5 2.7 36.6 10475 0.4 98.1 0.4 96.7 71 108 3.0 42.7 2.6 33.9 10576 0.3 97.7 0.5 96.2 72 109 2.9 39.7 2.5 31.3 10677 0.4 97.4 0.6 95.7 73 110 2.5 36.8 2.4 28.8 10778 0.5 97.0 0.6 95.2 74 111 2.8 34.3 2.2 26.3 10879 0.5 96.6 0.6 94.5 75 112 2.7 31.5 2.3 24.2 10980 0.5 96.1 0.8 93.9 76 113 2.3 28.7 2.0 21.9 11081 0.7 95.5 0.9 93.0 77 114 2.6 26.4 1.9 19.9 11182 0.7 94.8 1.0 92.1 79 115 2.2 23.9 1.9 17.9 11283 0.7 94.1 1.1 91.2 80 116 2.4 21.7 1.6 16.0 11384 0.9 93.4 1.2 90.1 81 117 2.2 19.3 1.6 14.4 11485 1.0 92.5 1.3 88.9 82 118 1.9 17.1 1.5 12.8 11586 1.2 91.4 1.5 87.6 83 119 2.0 15.2 1.3 11.3 11787 1.2 90.3 1.6 86.2 84 120 1.9 13.2 1.3 10.0 11888 1.3 89.1 1.7 84.6 85 121 1.6 11.3 1.1 8.8 11989 1.4 87.8 1.8 82.8 86 122 1.6 9.7 1.1 7.6 12090 1.6 86.3 1.9 81.1 87 123 1.5 8.1 0.9 6.5 12291 1.7 84.7 2.0 79.1 88 124 1.4 6.6 0.9 5.7 12392 1.9 83.0 2.2 77.1 89 125 1.2 5.2 0.7 4.8 12593 1.9 81.0 2.3 74.9 90 126 1.0 4.0 0.7 4.1 12694 2.1 79.2 2.4 72.6 91 127 1.0 3.1 0.6 3.4 12895 2.4 77.1 2.5 70.1 92 128 0.8 2.1 0.5 2.8 13096 2.2 74.8 2.6 67.6 93 129 0.5 1.3 0.4 2.3 13297 2.3 72.5 2.7 64.9 94 130 0.6 0.8 0.3 1.9 13498 2.6 70.2 2.8 62.3 95 131 0.1 0.2 0.3 1.6 13899 2.4 67.6 2.9 59.4 96 132 0.0 0.1 0.2 1.3 140Notes. C: composite score, P : percentage with score C, Q: percentage scoringat or above C. See Section 5 for an explanation of table contents.

F-28 Appendix F. Composite Transformation Tables
TABLE F.21. Composite ‘97 Conversion: MM-Marine Corps1980 1997 1980 1997
C P Q P Q ’97 C P Q P Q ‘9769 0.3 99.0 0.2 99.1 70 106 2.8 41.9 3.0 51.6 11070 0.4 98.7 0.1 98.9 71 107 2.7 39.1 1.4 48.6 11171 0.4 98.3 0.3 98.8 73 108 1.3 36.5 2.8 47.2 11272 0.2 97.9 0.3 98.5 74 109 2.9 35.2 2.7 44.4 11373 0.5 97.7 0.2 98.2 75 110 2.5 32.3 1.4 41.7 11474 0.6 97.2 0.4 98.0 76 111 2.5 29.8 2.7 40.3 11575 0.7 96.6 0.4 97.6 77 112 1.3 27.3 2.7 37.6 11676 0.4 95.9 0.5 97.2 79 113 2.4 26.0 1.3 34.9 11777 0.8 95.5 0.3 96.7 79 114 2.4 23.6 2.7 33.5 11978 0.9 94.7 0.6 96.4 81 115 2.1 21.2 2.4 30.8 12079 1.1 93.8 0.7 95.8 82 116 1.0 19.0 2.4 28.4 12180 0.6 92.7 0.5 95.1 83 117 2.0 18.0 1.3 26.0 12281 1.2 92.0 0.8 94.6 84 118 1.9 16.0 2.3 24.7 12382 1.4 90.8 0.9 93.8 85 119 1.8 14.1 2.1 22.5 12483 1.5 89.4 0.5 92.9 86 120 0.8 12.3 1.1 20.4 12584 0.8 87.9 1.1 92.3 88 121 1.5 11.5 1.9 19.3 12685 1.7 87.1 1.4 91.2 88 122 1.5 10.0 1.8 17.4 12786 1.8 85.5 1.4 89.8 89 123 1.3 8.6 0.9 15.6 12987 1.9 83.7 0.7 88.5 91 124 0.7 7.2 1.7 14.7 13088 1.0 81.9 1.5 87.7 92 125 1.1 6.6 1.5 13.0 13189 2.1 80.8 1.7 86.3 92 126 0.9 5.4 1.4 11.5 13290 2.1 78.7 0.9 84.6 94 127 0.8 4.5 0.6 10.1 13491 2.3 76.6 1.9 83.7 95 128 0.4 3.6 1.2 9.5 13592 1.2 74.3 2.0 81.7 96 129 0.6 3.3 1.1 8.3 13693 2.4 73.1 1.1 79.7 96 130 0.7 2.6 0.5 7.2 13894 2.5 70.7 2.1 78.7 98 131 0.5 1.9 0.9 6.7 13995 2.5 68.2 2.3 76.5 99 132 0.2 1.5 0.8 5.7 14196 1.3 65.7 2.4 74.2 100 133 0.4 1.3 0.4 5.0 14297 2.7 64.4 1.2 71.8 101 134 0.3 0.9 0.7 4.6 14498 2.7 61.7 2.5 70.6 102 135 0.2 0.6 0.6 3.9 14699 2.7 59.0 2.6 68.1 103 136 0.1 0.4 0.5 3.3 148100 1.4 56.2 1.4 65.5 104 137 0.1 0.3 0.3 2.7 149101 2.9 54.9 2.6 64.1 105 138 0.1 0.2 0.4 2.5 151102 2.9 52.0 2.8 61.5 106 139 0.1 0.2 0.4 2.1 153103 2.9 49.1 1.4 58.7 107 140 0.0 0.1 0.1 1.7 156104 1.5 46.2 2.8 57.3 108 141 0.0 0.1 0.3 1.6 158105 2.7 44.6 2.9 54.5 109 142 0.0 0.0 0.3 1.3 161Notes. C: composite score, P : percentage with score C,Q: percentage scoringat or above C. See Section 5 for an explanation of table contents.

Appendix F. Composite Transformation Tables F-29
TABLE F.22. Composite ‘97 Conversion: GT-Marine Corps1980 1997 1980 1997
C P Q P Q ’97 C P Q P Q ‘9769 0.2 99.0 0.1 98.9 69 104 1.9 54.2 1.9 54.0 10470 0.2 98.8 0.1 98.8 70 105 3.9 52.2 4.0 52.2 10571 0.3 98.6 0.3 98.7 71 106 1.9 48.3 2.0 48.2 10672 0.2 98.3 0.2 98.4 73 107 2.0 46.4 2.1 46.1 10773 0.3 98.1 0.2 98.2 74 108 3.8 44.4 3.8 44.1 10874 0.6 97.8 0.5 98.0 74 109 1.8 40.6 1.9 40.2 10975 0.3 97.2 0.3 97.5 76 110 1.9 38.8 1.9 38.3 11076 0.4 96.9 0.3 97.2 77 111 3.6 36.9 3.7 36.4 11177 0.9 96.5 0.7 96.9 78 112 1.7 33.3 1.9 32.8 11278 0.5 95.7 0.4 96.3 79 113 1.7 31.6 1.8 30.9 11379 0.5 95.2 0.4 95.9 80 114 3.5 29.9 3.5 29.1 11480 1.1 94.8 1.0 95.5 81 115 1.8 26.3 1.6 25.6 11581 0.6 93.6 0.5 94.5 83 116 1.6 24.5 1.6 24.0 11682 0.7 93.0 0.6 94.0 83 117 3.2 22.9 2.9 22.3 11783 1.5 92.3 1.3 93.4 84 118 1.6 19.7 1.5 19.4 11884 0.8 90.8 0.7 92.0 86 119 1.4 18.1 1.3 17.9 11985 0.8 90.0 0.8 91.3 86 120 2.8 16.7 2.6 16.6 12086 2.0 89.1 1.8 90.5 87 121 1.2 13.9 1.1 14.0 12187 1.0 87.1 0.9 88.6 89 122 1.1 12.7 1.0 12.9 12288 1.1 86.1 1.1 87.7 89 123 2.1 11.6 2.0 11.8 12389 2.3 85.0 2.4 86.6 90 124 1.0 9.5 0.9 9.9 12490 1.2 82.7 1.3 84.3 91 125 1.0 8.4 0.8 9.0 12691 1.3 81.5 1.2 83.0 92 126 0.9 7.4 1.5 8.2 12792 2.6 80.2 2.6 81.8 93 127 1.6 6.5 0.6 6.7 12793 1.4 77.5 1.4 79.2 94 128 0.7 4.9 0.6 6.1 12994 1.4 76.1 1.6 77.8 95 129 0.8 4.2 1.2 5.5 13095 1.4 74.7 3.3 76.2 95 130 1.1 3.4 0.5 4.3 13296 3.2 73.3 1.7 72.9 96 131 0.5 2.3 0.4 3.8 13497 1.6 70.1 1.7 71.2 98 132 0.4 1.8 0.8 3.4 13598 1.8 68.5 3.5 69.5 98 133 0.7 1.4 0.3 2.6 13799 3.4 66.7 1.9 66.0 99 134 0.3 0.7 0.3 2.3 140100 1.7 63.3 1.8 64.1 100 135 0.2 0.5 0.3 2.0 142101 1.9 61.7 2.0 62.3 101 136 0.2 0.3 0.4 1.7 145102 3.8 59.7 4.1 60.3 102 137 0.0 0.1 0.2 1.3 151103 1.8 56.0 2.2 56.2 103 138 0.0 0.0 0.2 1.1 152Notes. C: composite score, P : percentage with score C, Q: percentage scoringat or above C. See Section 5 for an explanation of table contents.

F-30 Appendix F. Composite Transformation Tables
TABLE F.23. Composite ‘97 Conversion: EL-Marine Corps1980 1997 1980 1997
C P Q P Q ’97 C P Q P Q ‘9770 0.2 99.2 0.1 98.8 67 105 2.9 50.0 3.0 51.7 10671 0.2 99.0 0.3 98.7 69 106 3.0 47.2 3.1 48.7 10672 0.3 98.8 0.3 98.4 70 107 3.0 44.1 1.6 45.5 10873 0.2 98.5 0.3 98.1 72 108 1.4 41.2 3.0 43.9 10974 0.3 98.3 0.2 97.8 72 109 2.8 39.8 3.0 40.9 10975 0.4 98.0 0.4 97.6 73 110 2.7 37.0 2.9 37.9 11076 0.5 97.6 0.5 97.2 75 111 2.9 34.3 1.5 35.1 11277 0.6 97.1 0.5 96.6 76 112 1.2 31.4 2.8 33.6 11378 0.3 96.5 0.3 96.1 77 113 2.7 30.2 2.8 30.8 11379 0.7 96.2 0.7 95.8 78 114 2.4 27.4 2.7 28.0 11480 0.9 95.5 0.8 95.0 79 115 2.5 25.0 1.2 25.3 11581 0.9 94.6 0.5 94.3 81 116 2.4 22.5 2.5 24.1 11782 0.5 93.7 1.0 93.8 82 117 1.1 20.1 2.3 21.7 11883 1.1 93.2 1.1 92.8 83 118 2.0 19.0 2.1 19.4 11884 1.3 92.1 1.1 91.8 84 119 2.1 17.0 0.9 17.3 11985 1.3 90.8 0.5 90.6 85 120 1.7 14.9 1.9 16.4 12186 0.7 89.5 1.4 90.1 86 121 0.9 13.2 1.7 14.4 12287 1.6 88.8 1.5 88.7 87 122 1.7 12.3 0.8 12.7 12288 1.8 87.3 1.7 87.2 88 123 1.5 10.6 1.6 11.9 12489 1.8 85.5 0.9 85.5 89 124 1.4 9.1 1.4 10.3 12590 2.0 83.7 1.9 84.6 91 125 0.6 7.7 1.1 8.9 12691 0.9 81.7 1.9 82.8 92 126 1.2 7.1 0.6 7.7 12792 2.1 80.7 2.0 80.9 92 127 1.1 5.9 1.0 7.2 12893 2.2 78.6 1.0 78.9 93 128 0.9 4.8 0.9 6.1 12994 2.2 76.5 2.1 77.8 95 129 0.4 3.9 0.8 5.2 13195 1.2 74.2 2.4 75.7 96 130 0.7 3.5 0.3 4.4 13296 2.6 73.0 1.3 73.3 96 131 0.7 2.8 0.6 4.1 13397 2.6 70.3 2.5 72.0 98 132 0.6 2.1 0.6 3.5 13598 2.9 67.7 2.8 69.5 99 133 0.5 1.5 0.2 2.9 13799 1.3 64.8 2.8 66.7 100 134 0.2 1.1 0.5 2.6 139100 3.0 63.5 1.5 63.8 100 135 0.3 0.9 0.4 2.2 140101 3.0 60.5 3.0 62.3 102 136 0.2 0.6 0.3 1.7 142102 3.1 57.5 3.0 59.3 103 137 0.2 0.4 0.1 1.5 144103 2.9 54.4 3.0 56.3 104 138 0.1 0.2 0.3 1.3 146104 1.5 51.5 1.5 53.3 105 139 0.1 0.1 0.2 1.0 148Notes. C: composite score, P : percentage with score C,Q: percentage scoringat or above C. See Section 5 for an explanation of table contents.

Appendix F. Composite Transformation Tables F-31
TABLE F.24. Composite ‘97 Conversion: CL-Marine Corps1980 1997 1980 1997
C P Q P Q ’97 C P Q P Q ‘9768 0.1 99.5 0.1 99.0 63 101 2.6 67.7 2.9 58.2 9869 0.1 99.4 0.2 98.8 64 102 3.1 65.1 3.3 55.3 9970 0.0 99.3 0.0 98.6 65 103 3.0 62.0 3.3 52.0 10071 0.1 99.3 0.2 98.6 65 104 2.9 59.0 3.2 48.7 10172 0.2 99.2 0.3 98.4 66 105 3.2 56.1 3.2 45.5 10273 0.2 99.0 0.4 98.1 68 106 0.0 52.9 0.0 42.4 10374 0.2 98.8 0.4 97.7 69 107 3.4 52.9 3.2 42.4 10375 0.3 98.6 0.4 97.3 71 108 3.1 49.5 3.1 39.2 10476 0.3 98.4 0.5 96.9 72 109 3.3 46.5 3.1 36.1 10577 0.4 98.0 0.5 96.4 73 110 3.3 43.2 2.8 33.0 10778 0.4 97.6 0.6 95.9 74 111 2.9 39.8 2.8 30.2 10879 0.5 97.2 0.7 95.4 75 112 3.2 36.9 2.6 27.4 10980 0.5 96.7 0.8 94.6 76 113 3.3 33.6 2.5 24.8 11081 0.6 96.2 0.9 93.9 77 114 2.7 30.4 2.5 22.2 11182 0.0 95.6 0.0 93.0 79 115 2.9 27.7 2.1 19.8 11283 0.7 95.6 1.0 93.0 79 116 2.4 24.8 2.0 17.6 11384 0.8 94.9 1.1 92.0 80 117 0.0 22.3 1.8 15.6 11485 0.9 94.0 1.2 90.9 81 118 2.8 22.3 0.0 13.8 11486 1.0 93.1 1.4 89.7 83 119 2.5 19.6 1.8 13.8 11587 1.1 92.1 1.5 88.4 84 120 2.1 17.1 1.6 12.0 11688 1.3 91.0 1.6 86.9 85 121 2.3 15.0 1.4 10.4 11789 1.3 89.7 1.8 85.4 86 122 2.0 12.7 1.2 9.0 12090 1.5 88.5 1.9 83.6 87 123 1.7 10.7 1.1 7.8 12191 1.6 86.9 2.0 81.7 88 124 1.8 9.0 1.0 6.7 12292 1.7 85.3 2.2 79.7 89 125 1.4 7.2 0.9 5.7 12493 2.0 83.6 2.3 77.5 90 126 1.3 5.8 0.7 4.8 12594 0.0 81.6 0.0 75.2 91 127 1.1 4.4 0.7 4.0 12695 2.1 81.6 2.4 75.2 91 128 1.0 3.3 0.6 3.3 12896 2.1 79.5 2.7 72.8 92 129 0.0 2.3 0.5 2.7 13197 2.3 77.5 2.6 70.1 93 130 0.8 2.3 0.0 2.2 13198 2.4 75.2 2.9 67.4 95 131 0.6 1.6 0.4 2.2 13399 2.4 72.8 3.0 64.5 96 132 0.4 0.9 0.3 1.7 135100 2.7 70.3 3.2 61.5 97 133 0.4 0.5 0.3 1.5 137Notes. C: composite score, P : percentage with score C, Q: percentage scoringat or above C. See Section 5 for an explanation of table contents.

F-32 Appendix F. Composite Transformation Tables
TABLE F.25. Composite ‘97 Conversion: M-Air Force1980 1997 1980 1997
C P Q P Q ’97 C P Q P Q ‘978 0.2 99.2 0.3 98.8 7 48 0.0 55.7 1.1 60.8 529 0.3 99.0 0.5 98.5 7 49 2.4 55.7 1.1 59.7 5210 0.3 98.7 0.5 98.0 8 50 1.2 53.2 1.1 58.5 5511 0.3 98.4 0.6 97.5 9 51 1.1 52.0 1.2 57.4 5612 0.3 98.1 0.4 96.9 10 52 1.2 50.9 1.2 56.3 5713 0.6 97.8 0.5 96.5 10 53 1.3 49.6 1.1 55.1 5814 0.7 97.3 0.7 96.0 11 54 1.3 48.4 1.2 53.9 5915 0.2 96.6 0.9 95.3 13 55 1.3 47.0 1.2 52.8 6016 0.9 96.4 0.7 94.3 13 56 1.3 45.8 1.3 51.6 6117 0.6 95.5 0.4 93.6 15 57 1.3 44.5 1.2 50.3 6218 0.6 95.0 0.8 93.2 15 58 1.3 43.2 1.1 49.1 6319 0.7 94.3 0.9 92.4 16 59 1.2 41.9 1.2 48.0 6420 0.8 93.6 0.4 91.6 17 60 1.2 40.7 1.2 46.8 6521 0.9 92.8 1.0 91.1 19 61 1.3 39.6 1.2 45.6 6622 1.5 91.9 1.0 90.1 20 62 1.2 38.3 1.2 44.5 6723 1.1 90.4 0.6 89.0 22 63 1.2 37.1 1.2 43.3 6824 1.2 89.3 1.2 88.4 23 64 1.2 35.9 1.1 42.1 6925 0.6 88.2 0.6 87.2 24 65 1.2 34.7 1.1 40.9 7126 1.3 87.5 1.4 86.6 25 66 1.2 33.5 1.2 39.8 7227 1.6 86.3 0.7 85.2 26 67 2.3 32.3 1.1 38.7 7328 1.4 84.7 1.4 84.5 28 68 1.1 30.0 1.1 37.5 7529 0.8 83.3 1.6 83.1 29 69 1.2 28.9 1.1 36.4 7630 1.6 82.4 0.8 81.5 29 70 1.1 27.7 1.1 35.3 7731 0.8 80.8 1.6 80.8 31 71 1.1 26.6 1.1 34.2 7832 1.7 80.0 0.0 79.1 31 72 1.1 25.5 1.1 33.1 7933 1.9 78.3 1.7 79.1 33 73 2.0 24.4 1.0 32.0 7934 1.0 76.4 0.9 77.4 35 74 1.1 22.4 1.1 31.0 8135 1.9 75.5 0.9 76.5 36 75 0.0 21.3 1.0 29.8 8236 2.1 73.5 1.0 75.6 38 76 2.0 21.3 1.1 28.9 8237 1.0 71.4 2.0 74.6 39 77 0.9 19.3 1.0 27.8 8438 1.1 70.4 1.0 72.6 40 78 1.0 18.4 1.9 26.7 8539 1.1 69.4 1.0 71.6 41 79 1.0 17.4 0.9 24.8 8640 1.0 68.3 1.0 70.6 42 80 0.9 16.4 1.0 23.9 8741 2.3 67.3 1.1 69.6 43 81 0.8 15.5 1.8 22.9 8742 1.2 65.0 1.0 68.5 45 82 0.9 14.6 0.9 21.1 8843 1.0 63.8 1.1 67.5 46 83 0.8 13.8 0.9 20.2 8844 2.4 62.8 1.1 66.4 47 84 0.9 12.9 0.9 19.4 8945 1.2 60.4 1.1 65.3 48 85 1.6 12.1 0.8 18.4 9046 1.1 59.2 1.1 64.2 49 86 0.7 10.5 1.6 17.6 9147 2.4 58.1 2.3 63.1 50 87 0.7 9.8 1.5 16.0 92Notes. C: composite score, P : percentage with score C,Q: percentage scoringat or above C. See Section 5 for an explanation of table contents.

Appendix F. Composite Transformation Tables F-33
TABLE F.25. Composite ‘97 Conversion: M-Air Force (continued)1980 1997 1980 1997
C P Q P Q ’97 C P Q P Q ‘9788 1.2 9.1 1.4 14.5 93 94 0.4 3.7 0.9 7.3 9789 0.6 7.9 0.7 13.0 94 95 0.7 3.3 1.5 6.4 9790 1.1 7.3 1.3 12.4 94 96 0.9 2.6 1.0 4.9 9891 0.5 6.1 1.2 11.1 95 97 0.7 1.7 1.3 3.9 9992 0.9 5.6 1.1 9.9 96 98 0.4 1.0 1.3 2.6 9993 0.9 4.7 1.5 8.8 96 99 0.6 0.6 1.3 1.3 99Notes. C: composite score, P : percentage with score C, Q: percentage scoringat or above C. See Section 5 for an explanation of table contents.

F-34 Appendix F. Composite Transformation Tables
TABLE F.26. Composite ‘97 Conversion: A-Air Force1980 1997 1980 1997
C P Q P Q ’97 C P Q P Q ‘979 0.1 99.6 0.2 99.0 5 49 0.0 74.8 2.9 68.9 4510 0.1 99.6 0.4 98.8 6 50 2.5 74.8 2.8 66.0 4511 0.1 99.5 0.3 98.4 6 51 2.9 72.3 0.0 63.2 4712 0.1 99.4 0.0 98.1 7 52 0.0 69.4 3.1 63.2 4913 0.1 99.2 0.3 98.1 8 53 0.0 69.4 0.0 60.1 4914 0.2 99.1 0.4 97.8 8 54 2.9 69.4 0.0 60.1 4915 0.2 99.0 0.4 97.4 9 55 2.7 66.5 3.3 60.1 5016 0.2 98.8 0.5 96.9 10 56 0.0 63.8 3.2 56.8 5217 0.3 98.5 0.5 96.5 11 57 3.1 63.8 0.0 53.6 5218 0.0 98.3 0.0 95.9 11 58 0.0 60.7 0.0 53.6 5519 0.3 98.3 0.6 95.9 11 59 3.3 60.7 3.4 53.6 5520 0.3 98.0 0.7 95.3 13 60 0.0 57.4 0.0 50.2 5621 0.4 97.7 0.8 94.6 14 61 3.1 57.4 3.2 50.2 5622 0.5 97.3 0.0 93.8 15 62 0.0 54.3 0.0 47.0 5923 0.6 96.8 0.9 93.8 16 63 3.3 54.3 3.3 47.0 5924 0.0 96.2 0.0 92.9 17 64 0.0 51.0 0.0 43.7 6125 0.6 96.2 1.0 92.9 17 65 3.5 51.0 3.3 43.7 6126 0.7 95.6 0.0 92.0 20 66 0.0 47.5 0.0 40.4 6327 0.8 94.9 1.1 92.0 21 67 3.1 47.5 3.2 40.4 6328 0.0 94.1 1.1 90.9 23 68 0.0 44.4 0.0 37.2 6529 0.9 94.1 0.0 89.7 23 69 3.7 44.4 3.2 37.2 6530 0.9 93.2 1.4 89.7 25 70 0.0 40.7 0.0 34.0 6731 1.1 92.3 0.0 88.3 27 71 3.5 40.7 3.0 34.0 6732 0.0 91.2 1.4 88.3 28 72 3.1 37.2 2.9 31.0 6933 1.3 91.2 0.0 86.9 28 73 0.0 34.0 0.0 28.1 7134 0.0 89.9 1.7 86.9 30 74 3.3 34.0 2.8 28.1 7135 1.3 89.9 1.9 85.2 30 75 0.0 30.8 0.0 25.3 7236 0.0 88.7 0.0 83.3 32 76 3.0 30.8 2.6 25.3 7237 1.5 88.7 2.0 83.3 32 77 3.1 27.8 0.0 22.7 7438 0.0 87.1 0.0 81.4 34 78 0.0 24.7 2.5 22.7 7639 1.7 87.1 2.1 81.4 34 79 3.1 24.7 0.0 20.2 7640 1.8 85.5 0.0 79.2 35 80 0.0 21.6 2.3 20.2 7841 0.0 83.7 2.3 79.2 37 81 2.5 21.6 0.0 17.9 7842 2.1 83.7 0.0 76.9 37 82 0.0 19.1 2.3 17.9 8043 0.0 81.6 2.6 76.9 39 83 2.7 19.1 0.0 15.6 8044 2.2 81.6 0.0 74.4 39 84 2.5 16.4 2.0 15.6 8445 0.0 79.4 2.6 74.4 41 85 0.0 13.8 1.8 13.6 8546 2.2 79.4 0.0 71.8 41 86 2.2 13.8 0.0 11.8 8547 0.0 77.2 2.9 71.8 43 87 0.0 11.6 1.6 11.8 8748 2.4 77.2 0.0 68.9 43 88 0.0 11.6 1.5 10.2 87Notes. C: composite score, P : percentage with score C,Q: percentage scoringat or above C. See Section 5 for an explanation of table contents.

Appendix F. Composite Transformation Tables F-35
TABLE F.26. Composite ‘97 Conversion: A-Air Force (continued)1980 1997 1980 1997
C P Q P Q ’97 C P Q P Q ‘9789 2.1 11.6 0.0 8.7 87 94 1.4 6.1 0.7 4.3 9290 1.9 9.6 1.3 8.7 88 95 0.0 4.7 0.7 3.6 9491 0.0 7.7 1.2 7.4 91 96 1.2 4.7 1.1 2.8 9492 1.6 7.7 1.0 6.2 91 97 1.2 3.5 0.7 1.8 9593 0.0 6.1 0.9 5.2 92 98 0.0 2.3 0.5 1.1 96Notes. C: composite score, P : percentage with score C, Q: percentage scoringat or above C. See Section 5 for an explanation of table contents.

F-36 Appendix F. Composite Transformation Tables
TABLE F.27. Composite ‘97 Conversion: G-Air Force1980 1997 1980 1997
C P Q P Q ’97 C P Q P Q ‘978 0.1 99.5 0.4 98.8 5 48 2.9 65.5 0.0 64.9 499 0.2 99.5 0.3 98.4 6 49 0.0 62.6 2.8 64.9 5110 0.2 99.2 0.7 98.2 7 50 2.6 62.6 0.0 62.1 5111 0.2 99.1 0.4 97.5 7 51 0.0 60.0 2.8 62.1 5312 0.2 98.9 0.3 97.1 8 52 2.9 60.0 0.0 59.2 5313 0.2 98.6 0.5 96.7 8 53 3.0 57.1 3.0 59.2 5514 0.2 98.4 0.6 96.2 9 54 0.0 54.1 0.0 56.3 5715 0.3 98.2 0.6 95.6 10 55 3.2 54.1 2.9 56.3 5716 0.4 97.8 0.7 95.0 10 56 0.0 50.9 0.0 53.4 5917 0.5 97.5 0.8 94.3 11 57 2.7 50.9 2.9 53.4 5918 0.5 97.0 0.0 93.4 12 58 0.0 48.2 0.0 50.5 6219 0.5 96.5 1.0 93.4 13 59 3.0 48.2 3.0 50.5 6220 0.6 96.1 1.0 92.4 14 60 0.0 45.1 0.0 47.4 6421 0.7 95.4 1.1 91.5 15 61 0.0 45.1 0.0 47.4 6422 0.8 94.7 0.0 90.4 16 62 3.2 45.1 3.2 47.4 6423 0.9 93.9 1.3 90.4 17 63 0.0 42.0 0.0 44.3 6624 0.0 93.0 1.3 89.1 19 64 3.2 42.0 3.0 44.3 6625 1.0 93.0 0.0 87.8 19 65 0.0 38.8 0.0 41.3 6826 1.0 92.0 1.5 87.8 21 66 2.8 38.8 2.9 41.3 6827 1.2 90.9 0.0 86.3 23 67 0.0 36.0 0.0 38.4 7028 0.0 89.8 1.6 86.3 24 68 3.0 36.0 2.9 38.4 7029 1.3 89.8 0.0 84.7 24 69 0.0 33.0 0.0 35.5 7230 1.5 88.5 1.8 84.7 24 70 2.8 33.0 2.7 35.5 7231 0.0 87.0 0.0 83.0 28 71 0.0 30.2 0.0 32.8 7432 1.6 87.0 1.8 83.0 28 72 2.8 30.2 2.7 32.8 7433 1.7 85.4 1.9 81.2 30 73 0.0 27.4 0.0 30.1 7634 1.7 83.7 0.0 79.3 32 74 2.4 27.4 2.6 30.1 7635 0.0 81.9 0.0 79.3 33 75 0.0 25.0 0.0 27.5 7836 2.0 81.9 2.1 79.3 33 76 2.5 25.0 2.3 27.5 7837 2.0 80.0 0.0 77.2 36 77 0.0 22.4 0.0 25.1 8038 0.0 78.0 2.2 77.2 38 78 2.6 22.4 2.4 25.1 8039 2.3 78.0 0.0 75.0 38 79 0.0 19.8 0.0 22.8 8140 0.0 75.7 2.3 75.0 40 80 2.3 19.8 2.2 22.8 8141 2.4 75.7 0.0 72.7 40 81 0.0 17.6 2.2 20.5 8342 2.4 73.4 2.6 72.7 42 82 2.3 17.6 0.0 18.3 8343 0.0 70.9 0.0 70.1 44 83 0.0 15.3 2.0 18.3 8544 2.6 70.9 2.6 70.1 44 84 2.2 15.3 2.0 16.3 8545 0.0 68.3 0.0 67.5 47 85 0.0 13.1 1.7 14.3 8746 2.8 68.3 0.0 67.5 47 86 2.0 13.1 0.0 12.7 8747 0.0 65.5 2.6 67.5 49 87 0.0 11.1 1.6 12.7 88Notes. C: composite score, P : percentage with score C,Q: percentage scoringat or above C. See Section 5 for an explanation of table contents.

Appendix F. Composite Transformation Tables F-37
TABLE F.27. Composite ‘97 Conversion: G-Air Force (continued)1980 1997 1980 1997
C P Q P Q ’97 C P Q P Q ‘9788 1.7 11.1 1.5 11.1 88 94 1.4 6.0 0.9 4.9 9389 0.0 9.3 1.4 9.6 89 95 0.0 4.6 1.4 4.1 9490 1.8 9.3 0.0 8.2 89 96 1.3 4.6 0.9 2.7 9491 0.0 7.5 1.3 8.2 92 97 0.0 3.3 0.6 1.7 9692 1.5 7.5 1.1 6.9 92 98 1.2 3.3 0.5 1.1 9693 0.0 6.0 0.9 5.9 93 99 2.1 2.1 0.6 0.6 97Notes. C: composite score, P : percentage with score C, Q: percentage scoringat or above C. See Section 5 for an explanation of table contents.

F-38 Appendix F. Composite Transformation Tables
TABLE F.28. Composite ‘97 Conversion: E-Air Force1980 1997 1980 1997
C P Q P Q ’97 C P Q P Q ‘978 0.2 99.3 0.2 99.0 7 48 1.3 69.3 0.0 67.3 479 0.2 99.1 0.5 98.7 8 49 1.4 67.9 1.3 67.3 4910 0.1 98.9 0.3 98.2 8 50 2.6 66.6 1.4 66.1 5011 0.3 98.8 0.4 97.9 9 51 1.4 64.0 1.3 64.7 5212 0.2 98.5 0.5 97.5 9 52 1.5 62.6 1.4 63.4 5313 0.4 98.3 0.5 97.0 10 53 1.4 61.1 1.4 62.0 5414 0.4 97.9 0.6 96.5 11 54 1.5 59.7 1.5 60.5 5515 0.3 97.5 0.3 95.9 12 55 1.4 58.2 1.5 59.0 5616 0.2 97.2 0.7 95.6 13 56 1.5 56.8 1.4 57.5 5617 0.6 97.0 0.8 94.8 13 57 1.5 55.3 0.0 56.1 5918 0.4 96.4 0.4 94.0 14 58 1.5 53.8 1.5 56.1 6019 0.7 96.1 1.0 93.6 15 59 1.4 52.3 1.5 54.6 6120 0.4 95.4 0.5 92.6 16 60 1.5 50.9 1.6 53.2 6121 0.4 95.0 0.5 92.1 17 61 1.4 49.4 1.5 51.6 6222 0.9 94.6 0.6 91.6 17 62 2.9 47.9 1.5 50.1 6423 0.5 93.7 1.2 91.0 19 63 1.5 45.0 0.0 48.6 6624 0.5 93.2 0.7 89.7 19 64 1.4 43.5 1.5 48.6 6725 0.6 92.7 0.7 89.1 20 65 1.4 42.1 1.5 47.1 6826 0.6 92.1 0.7 88.4 21 66 1.4 40.7 1.4 45.6 6927 0.6 91.6 0.8 87.7 22 67 3.0 39.3 1.5 44.1 7028 0.6 90.9 0.9 86.9 23 68 1.4 36.3 1.4 42.6 7229 0.6 90.3 0.0 86.1 24 69 1.4 34.9 1.5 41.3 7330 0.7 89.7 0.9 86.1 24 70 1.4 33.5 1.4 39.8 7431 0.8 89.0 1.8 85.2 25 71 1.2 32.2 1.4 38.3 7532 1.6 88.3 0.0 83.4 26 72 2.5 30.9 1.6 36.9 7633 0.8 86.7 0.9 83.4 28 73 1.3 28.4 1.4 35.3 7734 0.9 85.8 0.9 82.5 30 74 1.3 27.1 1.3 34.0 7935 0.9 85.0 1.0 81.5 31 75 1.2 25.8 1.3 32.6 8036 0.9 84.1 1.0 80.5 33 76 1.2 24.6 2.6 31.4 8137 1.0 83.2 1.1 79.5 33 77 2.4 23.4 1.3 28.8 8238 1.0 82.2 1.1 78.4 34 78 1.1 21.0 0.0 27.5 8339 1.1 81.2 1.2 77.3 35 79 1.2 19.9 1.3 27.5 8440 1.2 80.1 1.1 76.1 36 80 1.1 18.7 1.2 26.2 8541 1.1 78.9 1.2 75.0 38 81 2.1 17.6 2.4 25.0 8542 1.1 77.8 0.0 73.8 39 82 1.0 15.5 1.2 22.6 8743 2.3 76.7 1.3 73.8 40 83 1.0 14.5 1.1 21.4 8844 1.3 74.4 1.3 72.5 43 84 0.9 13.5 2.2 20.3 8845 1.3 73.1 1.3 71.3 44 85 0.8 12.6 1.0 18.1 8946 1.3 71.9 1.3 70.0 45 86 1.6 11.8 1.0 17.0 8947 1.3 70.6 1.4 68.7 46 87 0.8 10.2 1.9 16.0 91Notes. C: composite score, P : percentage with score C,Q: percentage scoringat or above C. See Section 5 for an explanation of table contents.
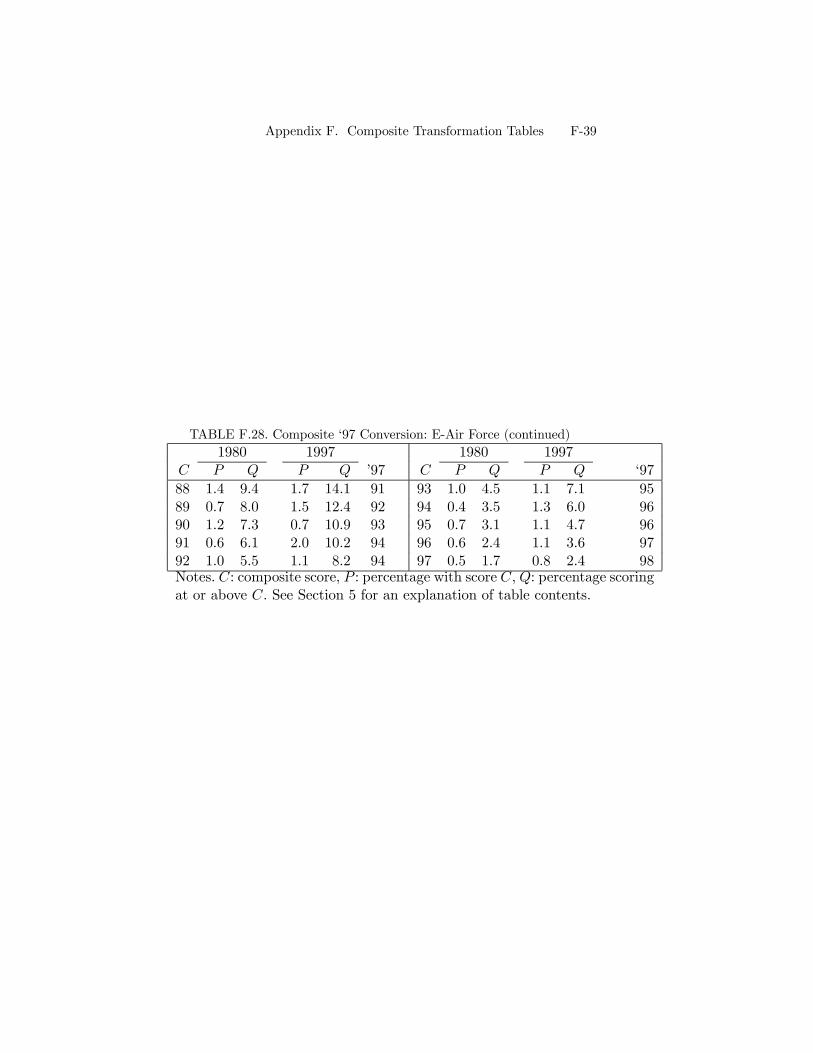
Appendix F. Composite Transformation Tables F-39
TABLE F.28. Composite ‘97 Conversion: E-Air Force (continued)1980 1997 1980 1997
C P Q P Q ’97 C P Q P Q ‘9788 1.4 9.4 1.7 14.1 91 93 1.0 4.5 1.1 7.1 9589 0.7 8.0 1.5 12.4 92 94 0.4 3.5 1.3 6.0 9690 1.2 7.3 0.7 10.9 93 95 0.7 3.1 1.1 4.7 9691 0.6 6.1 2.0 10.2 94 96 0.6 2.4 1.1 3.6 9792 1.0 5.5 1.1 8.2 94 97 0.5 1.7 0.8 2.4 98Notes. C: composite score, P : percentage with score C, Q: percentage scoringat or above C. See Section 5 for an explanation of table contents.