Development and Evaluation of Polymeric Nanoparticle ...
123
School of Pharmacy Development and Evaluation of Polymeric Nanoparticle Formulations for Triamcinolone Acetonide Delivery Christofori Maria Ratna Rini Nastiti This thesis is presented for the Degree of Master of Pharmacy of Curtin University of Technology March 2007
Transcript of Development and Evaluation of Polymeric Nanoparticle ...

School of Pharmacy
Development and Evaluation of
Polymeric Nanoparticle Formulations
for Triamcinolone Acetonide Delivery
Christofori Maria Ratna Rini Nastiti
This thesis is presented for the Degree of
Master of Pharmacy
of
Curtin University of Technology
March 2007

I
ABSTRACT
The aims of this study were to develop polymeric NP formulations for triamcinolone
acetonide (TA) delivery, from biodegradable and biocompatible hydrophobic
polymers, which provide sustained release, prolonged stability and low toxicity, and
to assess the toxicity of TA NPs (TA-NPs) compared to TA alone upon BALB/c 3T3
and ARPE 19 cell culture models.
The study involved investigation of three different types of polymers:
poly(D,L,lactide) (PDLLA), poly(D,L,lactide-co-glycolide)(PLGA) and methoxy-
polyethyleneglycol poly(D,L,lactide-co-glycolide)(mPEG PLGA). Two different
methods were studied in the TA-NPs preparation: spontaneous emulsification solvent
diffusion and emulsification solvent evaporation methods.
The results show that emulsification-solvent evaporation method was superior to
spontaneous emulsification solvent diffusion in terms of yield, loading and
entrapment efficiency. TA-NPs synthesised of mPEG PLGA exhibited the smallest
particle size, highest efficiency and fastest release of TA, whereas PDLLA produced
large TA-NPs with the slowest TA release. The toxicity study revealed that BALB/c
3T3 was more sensitive than ARPE 19 and was concentration dependent in response
to 24 hour exposure of either TA or TA-NPs, while ARPE 19 appeared to be less
sensitive to the exposure. All NPs were less toxic than TA in all concentrations, in
both cell models.
II
ACKNOWLEDGMENT
First of all, I would like to praise the Lord, God the Almighty, for all of blessings and
miracles throughout my life.
I would also like to acknowledge the Australian Development Scholarship for
sponsoring me in pursuing my Master degree.
I also wish to express my sincere gratitude to my supervisor Dr. Yan Chen for her
excellent guidance, continual technical support and encouragement during my study
time. I would also like to give my wholehearted appreciation to Associate Professor
Heather Benson, my co-supervisor, for providing invaluable support and guidance
during the course of my study. I am very thankful to Dr. Simon Fox, my associate
supervisor, for his expert guidance, encouragement and continual support.
I wish to thank Mr. Mike Boddy and Ms. Erin Bolitho for their invaluable technical
assistance in the laboratory.
I would also like to thank Adjunct. Associate Professor Chooi-May Lai (Lions Eye
Institute) for kindly donating an ARPE 19 cell line for my toxicity study and Gautam
Dalwadi for providing in house synthesis of mPEG PLGA.
My deep appreciation also goes to Mr. Mike Stack, Mr. John Hess, Dr. John Fielder,
Ms. Jennifer Ramsay, Ms. Daphne D’Souza, Mr. Jorge Martinez, Ms. Irine Ferraz,
Ms. Angela Samec, and Mr. Paul Ellery, for invaluable assistance during my
research.
I thank Arie Sulistyarini, Desak Ketut Ernawati, Sarika Madan Namjoshi, Gayathri
Khrisnan, Danushka Hettiararchi, and Chirag Desai for being best friends and for
their assistance, support and motivation in many ways.

III
Last but not least, I gratefully thank my husband and my family for their invaluable
moral support, understanding, and encouragement throughout my life, especially at
this study moment.
IV
TABLE OF CONTENTS
ABSTRACT .............................................................................................. I
ACKNOWLEDGMENTS ..................................................................... II
TABLE OF CONTENTS ...................................................................... IV
LIST OF TABLES .............................................................................. VII
LIST OF FIGURES .......................................................................... VIII
ABBREVIATIONS ................................................................................ X
INTRODUCTION ................................................................................... 1
1.1 Sustained/controlled release systems .............................................. 1
1.2 Nanoparticles (NPs) ......................................................................... 2
1.2.1 Criteria of ideal NPs .................................................................................... 3
1.2.2 Limitation of NPs ........................................................................................ 4
1.2.3 Potential pharmaceutical applications of NPs ............................................. 4
1.2.4 Polymers used for NPs manufacturing ........................................................ 6
1.2.5 Synthesis of NPs ....................................................................................... 10
1.2.6 Surface modification of NPs ..................................................................... 12
1.2.7 Physical characterisation of NPs ............................................................... 14
1.2.8 Purification of NPs .................................................................................... 16
1.3 In vitro cell culture toxicity study ................................................. 16
1.3.1 Significance of cell culture for in vitro study ............................................ 17
1.3.2 Assay used for in vitro toxicity studies ..................................................... 17
1.3.3 MTT assay ................................................................................................. 17
1.3.4 Cell lines as the objects for the current study ........................................... 18
1.4 Triamcinolone acetonide (TA) ...................................................... 18
1.4.1 Physicochemical properties ....................................................................... 19
1.4.2 Clinical applications .................................................................................. 20
1.4.3 Side effects ................................................................................................ 20
1.5 Objectives of the study .................................................................. 21

V
MATERIALS AND METHODS ......................................................... 23
2.1 Experimental materials .................................................................. 23
2.1.1 Experimental materials for TA-NPs formulation ...................................... 23
2.1.2 Experimental materials for in vitro toxicity study .................................... 24
2.2 Instrumentation .............................................................................. 24
2.2.1 Instrumentation for TA-NPs formulation ................................................. 24
2.2.2 Instrumentation for in vitro toxicity study ................................................ 25
2.3 Methods ......................................................................................... 26
2.3.1 High Performance Liquid Chromatography (HPLC) assay validation for
TA ...................................................................................................................... 26
2.3.2 Preparation of TA-NPs ............................................................................. 28
2.3.3 NPs purification ........................................................................................ 29
2.3.4 NP characterization ................................................................................... 30
2.3.5 Turbidity assay .......................................................................................... 32
2.3.6 In vitro release assay of TA-NPs .............................................................. 32
2.3.7 Stability assay of TA ................................................................................. 33
2.3.8 In vitro toxicity assay ................................................................................ 34
2.3.9 Statistical analysis ..................................................................................... 37
RESULTS AND DISCUSSION ........................................................... 38
3.1 HPLC assay validation .................................................................. 38
3.2 Formulations of TA loaded NPs (TA-NPs) ................................... 48
3.2.1 NP purification by high speed centrifugation ........................................... 60
3.2.2 Release characteristics of TA-NPs ............................................................ 62
3.2.3 TA stability study ...................................................................................... 68
3.3 In vitro toxicity study of TA-loaded NPs ..................................... 71
3.3.1 Assay optimisation .................................................................................... 71
3.3.2 BALB/c 3T3 cell viability assessment ...................................................... 74
3.3.3 ARPE 19 cell viability assessment ............................................................ 79
GENERAL DISCUSSION ................................................................... 86
4.1 Polymeric NP formulations for TA delivery ................................. 86
4.2. In vitro toxicity study of TA-loaded NPs ..................................... 90

VI
CONCLUSION AND SCOPE FOR FUTURE WORK .................... 92
5.1 Conclusion ..................................................................................... 92
5.2 Scope for future work .................................................................... 93
REFERENCES ...................................................................................... 94
APPENDIX .......................................................................................... 105
VII
LIST OF TABLES
Table 3.1: System precision of the HPLC method for TA determination ................. 40
Table 3.2: Recovery of TA in the presence of empty NPs in mobile phase .............. 42
Table 3.3: LOD/LOQ of the HPLC assay for TA determination ............................... 45
Table 3.4: Physical characteristics of empty NPs made by solvent diffusion method
.................................................................................................................................... 49
Table 3.5: Results of initial study of TA incorporation into PDLLA NPs by solvent
diffusion ..................................................................................................................... 50
Table 3.6: Properties of TA-loaded- NPs made by the optimised solvent diffusion
method ........................................................................................................................ 52
Table 3.7: Physical characteristics of empty NPs made by emulsification-solvent
evaporation method .................................................................................................... 53
Table 3.8: Properties of TA-loaded- NPs made by emulsification-solvent evaporation
method ........................................................................................................................ 54
Table 3.9: Distribution of TA inside NPs, in supernatant and precipitate in
emulsification-solvent evaporation method ............................................................... 60
Table 3.10 : PVA removal on purification of NPs by high speed centrifugation ...... 62
Table 3.11: Particle size of the NPs before and after purification ............................. 62
Table 3.12: Distribution of TA after release process over 96 hours .......................... 67
Table 3.13: Absorbance of samples with and without cells at 585 nm ...................... 73

VIII
LIST OF FIGURES Figure 1.1: Nanospheres and nanocapsules 14. ............................................................. 3
Figure 1.2: Structure of poly (lactic acid)43 ................................................................. 9
Figure 1.3: Structure of poly (D,L, lactide-co-glycolide)43. ........................................ 9
Figure 1.4: Solvent diffusion process illustrated by Murakami48 .............................. 11
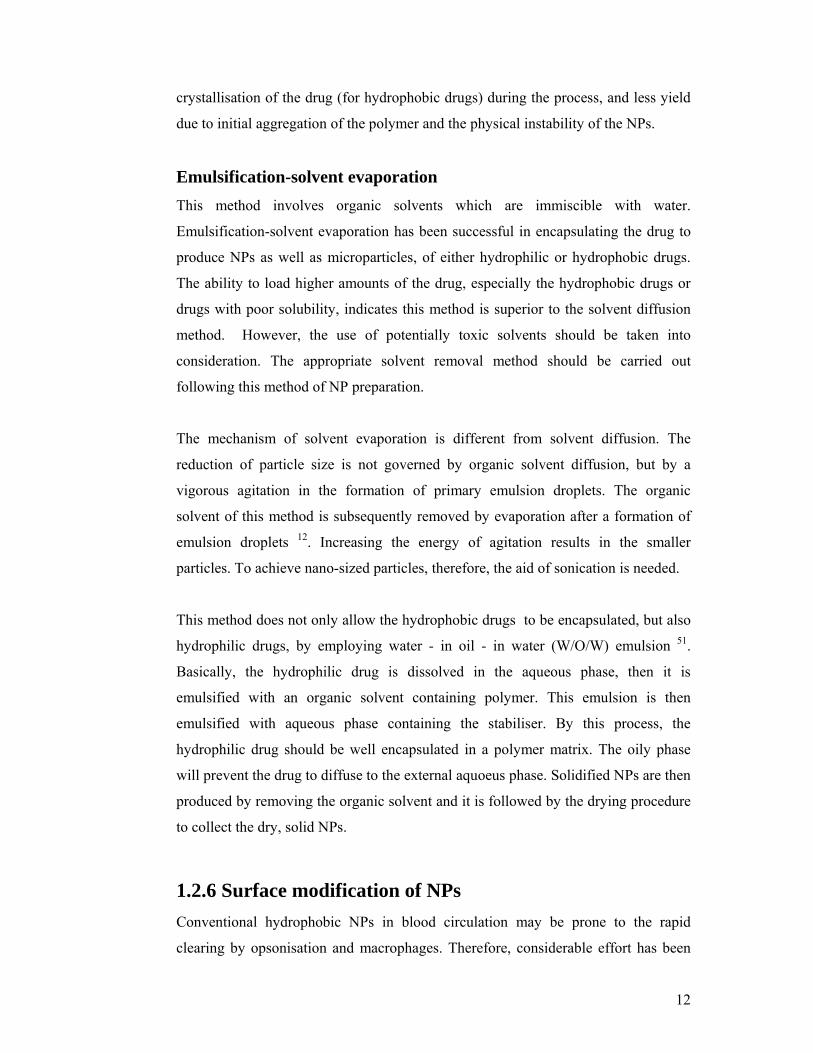
Figure 1.5: Structur of (methoxypolyethyleneglycol)poly-(D,L,lactide-co-gycolide)13
.................................................................................................................................... 13
Figure 1.6: Structure of triamcinolone acetonide 71 ................................................... 19
Figure 2.1: The dialysis bag diffusion equipment ...................................................... 33
Figure 3.1: Standard curve for TA in ACN:mobile phase 1:1. .................................. 39
Figure 3.2: Standard curve for TA in PBS-NaN3 ....................................................... 40
Figure 3.3: (a) Typical HPLC chromatogram of TA standard in ACN:mobile phase
1:1 ............................................................................................................................... 45
Figure 3.3: (b) Typical HPLC chromatogram of extraction of empty NPs in ACN:
mobile phase 1:1 as blank .......................................................................................... 46
Figure 3.3: (c) Typical HPLC chromatogram of TA extraction from loaded NPs in
ACN: mobile phase 1:1 .............................................................................................. 46
Figure 3.3: (d) Typical HPLC chromatogram of TA standard in PBS-NaN3 ............ 47
Figure 3.3: (e) Typical HPLC chromatogram of TA (peak 1) and degradation
product (peak 2) in PBS-NaN3 at 37°C over 24 hours ............................................... 47
Figure 3.3: (f) Typical HPLC chromatogram of PBS-NaN3 (release medium) ......... 48
Figure 3.4: SEM of TA crystal in TA-PDLLA NPs. ................................................. 50
Figure 3.5: Turbidity profile of TA and polymers ..................................................... 51
Figure 3.6: Comparison of yield, loading and entrapment efficiency values of three
types of NPs. .............................................................................................................. 55
Figure 3.7: FESEM image of TA-NPs ....................................................................... 57
Figure 3.8: TA-NPs characterisation.......................................................................... 59
Figure 3.9: A representative of calibration curve of PVA determination .................. 61
Figure 3.10: Release profile of TA control groups over 96 hours. ............................ 64
Figure 3.11: Release profile of TA-NPs over 96 hours. ............................................ 65
Figure 3.12: Overall release profiles of TA from TA-NPs over 96 hours ................. 66
Figure 3.13: Release profiles of TA from TA-NPs over 8 hours. .............................. 67
Figure 3.14: Potency of TA over 72 hours ................................................................. 69
IX
Figure 3.15: Potency of TA at 72 hours .................................................................... 70
Figure 3.16: A reprentative of HPLC chromatogram of TA extraction from NPs .... 71
Figure 3.17: Seeding density optimisation of BALB/c 3T3. ..................................... 72
Figure 3.18: Seeding density optimisation of ARPE 19 (1) ...................................... 72
Figure 3.19: Seeding density optimisation of ARPE 19 (2) ...................................... 73
Figure 3.20: Image of BALB/c 3T3 cells................................................................... 74
Figure 3.21: Image of BALB/c 3T3 cells after being exposed to TA and TA-NPs. .. 75
Figure 3.22: Effect of TA and TA-NPs on BALB/c 3T3 cell viability..................... 76
Figure 3.23: Effect of TA (1 mg/mL) and TA-NPs on BALB/c 3T3 cell viability .. 77
Figure 3.24: Effect of TA (0.1 mg/mL) and TA-NPs on BALB/c 3T3 cell viability 78
Figure 3.25: Effect of empty NPs and TA-NPs on BALB/c 3T3 cell viability ........ 79
Figure 3.26: Image of ARPE 19 cells. ....................................................................... 79
Figure 3.27: Morphology of ARPE 19 cells after being exposed to TA and TA-NPs
.................................................................................................................................... 80
Figure 3.28: Effect of TA and TA-NPs on ARPE 19 cell viability ........................... 81
Figure 3.29: Effect of TA (1 mg/mL) and TA-NPs on ARPE 19 cell viability ......... 82
Figure 3.30: Effect of TA (0.1 mg/mL) and TA-Nps on ARPE 19 cell viability ...... 83
Figure 3.31: Effect of empty NPs and TA-NPs on ARPE 19 cell viability ............... 84

X
ABBREVIATIONS
ACN Acetonitrile
AMD Age-related macular degeneration
CpG ODN CpG oligodeoxynucleotide
CTFR Cystic fibrosis transmembrane regulator
D10 DMEM plus 10% fetal calf serum
DCD Dialysis centrifugal devices
DCM Dichloromethane
DF12 DMEM:Ham F12 1:1 plus 10% fetal calf serum
DMEM Dulbecco’s modified Eagle’s media
DMSO Dimethyl sulfoxide
DT Diphteria toxoid
FESEM Field emission scanning electron microscope
HPLC High performance liquid chromatography
LOD Limit of detection
LOQ Limit of quantification
mPEG PLGA methoxy polyethylene glycol poly(D,L,lactide)
MTC Minimal toxic concentration
MTT 3-(4,5-dimethylthiazol-2-yl)-2,5-diphenyltetrazolium bromide
MWCO molecular weight cut-off
NP Nanoparticle
NPs Nanoparticles
O/W Oil-in-water
PBS Phosphate buffer saline
PCL Poly-(ε-caprolactone)
PDLLA Poly(D,L,lactide)
PEG Polyethylene glycol
PG Poly glycolic acid
PLA Poly lactic acid
PLGA Poly(D,L,lactide-co-glycolide)
PLLA Poly(L lactide)

XI
PVA Poly(vinyl alcohol)
RPE Retinal pigment epithelial
rpm revolution per minute
RSD relative standard deviation
TA Triamcinolone acetonide
TA-mPEG PLGA NPs TA-NPs using mPEG PLGA
TA-NPs Triamcinolone acetonide-loaded nanoparticles
TA-PDLLA NPs TA-NPs using PDLLA
TA-PLGA NPs TA-NPs using PLGA
Tg glass transition temperature
UV Ultraviolet
UV/Vis Ultraviolet-visible
VEGF Vascular endothelial grow factor
W/O/W Water-in-oil-in-water

1
INTRODUCTION
1.1 Sustained/controlled release systems
The main challenge of developing a successful drug delivery system is to deliver the
drug promptly to the target site at a rate and a concentration which can maximise the
efficacy and minimise the side effects, in a appropriate period of time 1. Several
parameters, such as bioavailability, biocompatibility, site targeting and drug release
profile, play a dominant role in administering the drug 2. Although conventional
formulations have been effective for most of the drugs, there have been obstacles for
some drugs to achieve the target site, due to poor physicochemical properties and an
incapability to pass through the barriers of the body. Such drugs, especially those
which have a narrow therapeutic range and exhibit poor solubility but require long
term and localised therapy, would need a continuous administration to maintain the
plasma level in the therapeutic range over a period of time 3. In addition, patient non-
compliance with the required administration of the drugs appears to be a significant
problem 1. Therefore, several modifications to drug delivery, such as designing
sustained or controlled release products, were made, in order to control frequency of
dosing and specificity of the drug. This can lead to improved patient compliance 1,
4, 5.
Sustained release (a term that can be interchangeably used with prolonged release 1)
products have been developed commercially since the late 1940s 6 with the aims of
minimising the frequency of administration as well as side effects, locally or
systematically. Although sustained release products can enhance patient compliance,
these products were only set up with the goal of prolonging the therapeutic duration
without any consideration of consistency in terms of drug release. In the late 1960s,
the term “controlled release” was used to describe a system which could release the
drug in a reliable and constant release fashion 6. By establishing such strategies as
controlling the drug released, modifying the methods to reach the target, and
maximising the extent of drug concentration on the target site, the drug efficacy
could be improved in a controlled release system.

2
1.2 Nanoparticles (NPs)
Over the past two decades there has been a variety of controlled drug delivery
strategies used to enhance the efficacy of the drug, such as developing soluble
macromolecular carriers, micellar carriers, and colloidal micro- and nanoparticulate
carriers. Those approaches, especially micro- and nanoparticulate carriers, have
become extremely valuable in altering the pharmacokinetic and pharmacodynamic
properties of the drug.
Among the various colloidal particulate systems, NPs have attracted much interest in
the development of controlled delivery systems. Kreuter 7 defined NPs as “solid
colloidal particles ranging in size from 10 nm to 1000 nm (1µm)”. The drug can be
entrapped in, encapsulated in, dissolved in, adsorbed or chemically attached to, the
matrix of the NPs, which can be polymers or lipids.
Since this study will mainly focus on polymeric NPs, only the criteria, characteristic
and therapeutic application of polymeric NPs (thereafter referred to as ‘NPs’ ) will be
reviewed in the following sections.
By incorporating the drug into the polymer matrix and reducing the particle size
down to nano-scale, the nature of the drug and its interaction with biological
membrane can be modified, leading to the improved delivery of the drug to the target
site, which is facilitated by a controlled release. NPs can protect the drug from the
unfriendly environment thereby avoiding premature degradation of the drug 8. NPs
are reported to be more stable than liposomes 9. This delivery system was also
reported to be able to minimise the local side effects as well as systemic ones 10.
Moreover, NPs can be an exclusive controlled delivery since it can be bound with the
specific ligand for targeting drug actions 11-13.
NPs can be further distinguished as nanospheres and nanocapsules. The illustration
can be seen in Figure 1.1. In nanospheres, drugs are dispersed in the matrix structure
as a uniform dispersion, whereas nanocapsules are vesicular systems in which the
drug can be dissolved or entrapped in the inner core or adsorbed onto the surface of
inner vesicles 9.

3
Figure 1.1: Nanospheres and nanocapsules 14.
Compared to microparticles, NPs show significant advantages in site-specific drug
delivery. It has been suggested that, for intravenous administration, the particle
should be smaller than 8 µm to avoid capillary clogging 3. In addition, since the
diameter of the capillaries is about 5-6 µm, the carriers should be a much smaller
size, so they can be delivered without showing any harmful effects for the blood
circulation system, such as embolism in the capillaries 12. NPs also show higher
intracellular uptake 9. NPs synthesised from surface modified polymer, are reported
to be able to enhance prolonged blood circulation and pass through the blood-brain
barrier 12, 13, therefore, they are potentially useful as an optimised delivery system to
intravascular administration.
1.2.1 Criteria of ideal NPs
As a drug carrier system, a nanoparticle (NP) formulation should meet the main
criterion, in which the matrix should be biocompatible and biodegradable 3, 15. The
matrix must be non-toxic and must not exhibit any antigenic behaviour to the body 3,
16. Oppenheim 17 and Domb 18 emphasised that for an ideal drug carrier system, the
matrix of the product should be stable during the sterilisation and manufacturing, to
enzyme activity, the pH of the environment and must not be degraded in a short
period of time and it should provide sustained release. Moreover, the NPs should be
able to load the drug, which is either hydrophilic or hydrophobic in nature, in a
sufficient amount and maintain the integrity of the drug-matrix before release of the
drug at the target site. The matrix, should therefore, protect the drug until it reaches
the target site. Finally, the system should provide a reliable and reproducible release
kinetics for the drug in a controlled fashion 17. In terms of drug-carrier production,
the cost-effective and reproducibility of the manufacturing of the drug-carrier
complex should also be taken into consideration 18.

4
1.2.2 Limitation of NPs
Much research has been conducted on nanoparticulate system, however it is still in
an ongoing process to establish the formulation which is pharmaceutically and
clinically accepted. Controlling the particle size has always been a challenge in
developing NP formulations. Although nano-sized particles can be easily made by
various methods of NP preparation, the physical stability of NPs, mainly the particle
size, sometimes cannot be maintained due to the potential risk of particle
aggregation. NPs can load either hydrophilic or hydrophobic drugs, however, the
level of loading appears to be low, compared to microparticles. In terms of release
characteristic, NPs have potential to undergo an initial burst release due to drug
adsorption on the particle surface during manufacture. This initial burst release may
lead to toxicity if the concentration of drug released is over the minimum level of
toxic concentration (MTC) in the blood. In terms of toxicity issue, the various
interactions of NPs with biological tissues have to be taken into consideration. NPs
may trigger mediator to activate inflammatory or immunological responses. If it is
administered intravenously, they may have potential to affect the cardial and cerebral
function 19. Despite those limitations, modification and innovation have been
extensively developed in order to optimise the NPs formulations.
1.2.3 Potential pharmaceutical applications of NPs
NPs can be used to deliver various drugs, such as hydrophilic drugs 20, hydrophobic
drugs, peptides, and vaccines 21 in prolonged period time of circulation. They can
also be targeted carriers in the lymphatic system, brain, arterial walls, lungs, liver,
and spleen 12.
Gene therapy
NPs have been investigated in clinical phase I of cysctic fibrosis therapy 22. This
investigation aimed to provide a single molecule gene of the cystic fibrosis
transmembrane regulator (CTFR) in ultra small NPs (less than 25 nm) to slip
through the nuclear membrane. The use of poly-L-lysine was reported to be in
5
association with reduced size, enabling internalisation of the gene to eventually reach
the nucleus.
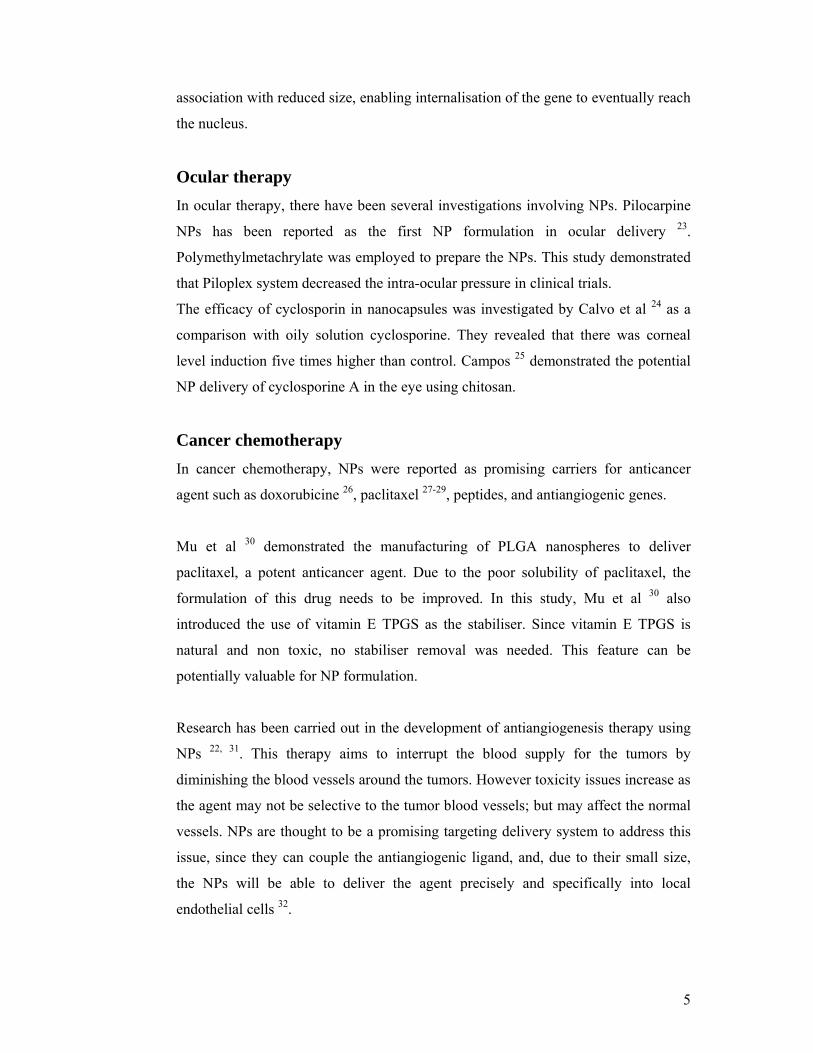
Ocular therapy
In ocular therapy, there have been several investigations involving NPs. Pilocarpine
NPs has been reported as the first NP formulation in ocular delivery 23.
Polymethylmetachrylate was employed to prepare the NPs. This study demonstrated
that Piloplex system decreased the intra-ocular pressure in clinical trials.
The efficacy of cyclosporin in nanocapsules was investigated by Calvo et al 24 as a
comparison with oily solution cyclosporine. They revealed that there was corneal
level induction five times higher than control. Campos 25 demonstrated the potential
NP delivery of cyclosporine A in the eye using chitosan.
Cancer chemotherapy
In cancer chemotherapy, NPs were reported as promising carriers for anticancer
agent such as doxorubicine 26, paclitaxel 27-29, peptides, and antiangiogenic genes.
Mu et al 30 demonstrated the manufacturing of PLGA nanospheres to deliver
paclitaxel, a potent anticancer agent. Due to the poor solubility of paclitaxel, the
formulation of this drug needs to be improved. In this study, Mu et al 30 also
introduced the use of vitamin E TPGS as the stabiliser. Since vitamin E TPGS is
natural and non toxic, no stabiliser removal was needed. This feature can be
potentially valuable for NP formulation.
Research has been carried out in the development of antiangiogenesis therapy using
NPs 22, 31. This therapy aims to interrupt the blood supply for the tumors by
diminishing the blood vessels around the tumors. However toxicity issues increase as
the agent may not be selective to the tumor blood vessels; but may affect the normal
vessels. NPs are thought to be a promising targeting delivery system to address this
issue, since they can couple the antiangiogenic ligand, and, due to their small size,
the NPs will be able to deliver the agent precisely and specifically into local
endothelial cells 32.

6
Vaccine delivery
Singh et al. 33 demonstrated the manufacture of poly-(ε-caprolactone) (PCL), a
poly(lactide-co-glycolide) (PLGA)-PCL blend and co-polymer NPs encapsulating
diphtheria toxoid (DT) for a mucosal vaccine delivery system. Significantly higher
uptake of PCL NPs was observed in an in vitro experiment using Caco-2 cells in
comparison to polymeric PLGA, the PLGA-PCL blend and co-polymer NPs.
Positive correlation between hydrophobicity of the NPs and the immune response
was also observed following intramuscular administration and after intranasal
administration of the NPs.
Immunopotentiation effect at modest doses of a few micro- or nanograms of CpG
oligodeoxynucleotide (CpG ODN) and the influence on T cell responses at such low
doses has also been investigated to establish NP delivery of vaccine adjuvant of
tetanus toxoid. This study emphasises that antigen delivery in biodegradable NPs can
facilitate the induction of strong T cell responses, particularly of the Th1 type, at
extremely low doses of CpG ODN since NPs have an immunopotentiation effect on
T cell response. This dose modification would be beneficial for minimising the
potential side effects of these novel adjuvants 34.
1.2.4 Polymers used for NPs manufacturing
A large variety of polymers can be employed as matrix materials of the NPs to
provide a controlled release effect. They are categorised as biodegradable and non-
biodegradable polymers. Since the current study involves biodegradable polymers,
which have potential value in a controlled drug delivery, this review will mainly
focus on those polymers.
Biodegradable polymer is a polymer which can be metabolised either enzymatically
or non enzymatically in vivo, to produce biocompatible by-products, which then can
be eliminated by normal physiological pathways 35. Biodegradable polymers have
shown several advantages over non-biodegradable polymers. Once they were
implanted, the biodegradable polymers do not need surgical removal from the body.
They are degraded over time in a controlled decay, in which the side effects on the
tissues can also be decreased 36. However, biodegradable polymers also have a
7
limitation as they are difficult to remove in the case of therapy rearrangement. In
terms of safety, monitoring of the reaction affected by the degradation products must
also be carried out 3, 37.
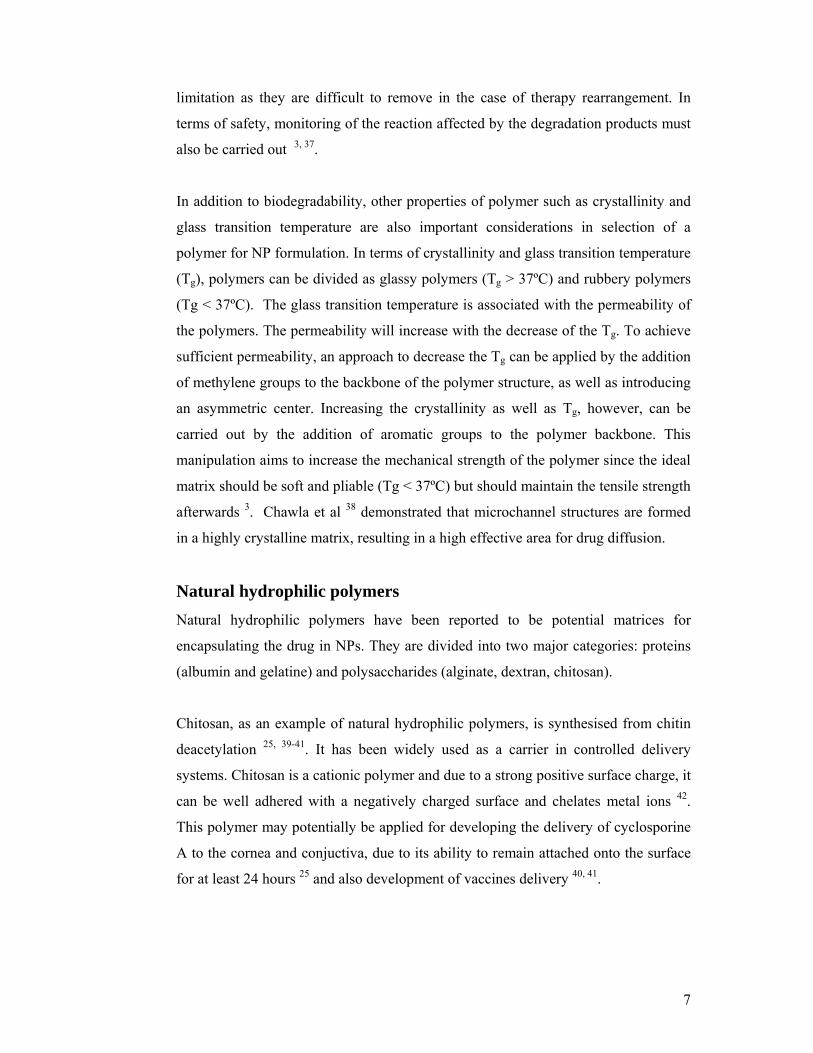
In addition to biodegradability, other properties of polymer such as crystallinity and
glass transition temperature are also important considerations in selection of a
polymer for NP formulation. In terms of crystallinity and glass transition temperature
(Tg), polymers can be divided as glassy polymers (Tg > 37ºC) and rubbery polymers
(Tg < 37ºC). The glass transition temperature is associated with the permeability of
the polymers. The permeability will increase with the decrease of the Tg. To achieve
sufficient permeability, an approach to decrease the Tg can be applied by the addition
of methylene groups to the backbone of the polymer structure, as well as introducing
an asymmetric center. Increasing the crystallinity as well as Tg, however, can be
carried out by the addition of aromatic groups to the polymer backbone. This
manipulation aims to increase the mechanical strength of the polymer since the ideal
matrix should be soft and pliable (Tg < 37ºC) but should maintain the tensile strength
afterwards 3. Chawla et al 38 demonstrated that microchannel structures are formed
in a highly crystalline matrix, resulting in a high effective area for drug diffusion.
Natural hydrophilic polymers
Natural hydrophilic polymers have been reported to be potential matrices for
encapsulating the drug in NPs. They are divided into two major categories: proteins
(albumin and gelatine) and polysaccharides (alginate, dextran, chitosan).
Chitosan, as an example of natural hydrophilic polymers, is synthesised from chitin
deacetylation 25, 39-41. It has been widely used as a carrier in controlled delivery
systems. Chitosan is a cationic polymer and due to a strong positive surface charge, it
can be well adhered with a negatively charged surface and chelates metal ions 42.
This polymer may potentially be applied for developing the delivery of cyclosporine
A to the cornea and conjuctiva, due to its ability to remain attached onto the surface
for at least 24 hours 25 and also development of vaccines delivery 40, 41.

8
However, natural polymers have been reported to have less capability to provide the
range of ideal characteristics to be such carriers in a controlled release study, since
they may degrade the drug embedded because of required cross-linking, they are
sensitive to microbial growth and enzymatic degradation 12 and they may induce
immune response 43. Therefore, synthetic hydrophobic polymers have been
extensively investigated as alternative drug carriers in the manufacturing of NPs.
Synthetic hydrophobic polymers
Synthetic hydrophobic polymers have attracted much attention in developing the
nanoparticle (NP) formulation. They offer advantages in that they are biocompatible
and can be relatively good carriers without showing undesirable interaction with the
drug. Although they degrade over time, there is no report of microbial or enzymatic
activities involved in the process of degradation. Of those polymers, only poly (D,L,-
lactide) and poly (D,L,-lactide-co-glycolide) (PLGA) will be reviewed, since those
polymers were used in the current study. Those polymers have been widely
investigated as drug carriers since they are biodegradable and biocompatible
therefore they have regulatory approval in most countries. Toxicological and clinical
data of those polymers is readily obtainable. Moreover, those polymers are
commercially available 43, 44.
Poly (D,L,-lactide) (PDLLA)
PDLLA is completely amorphous with a glass transition temperature of around 57ºC.
Since it is more amorphous than the other isomer, poly (L-lactide) (PLLA), the
tensile strength as well as the modulus of elasticity of this polymer are lower, ~5000
psi and ~250,000 psi respectively. The consequence of this characteristic is that this
polymer will be degraded faster than PLLA 45. The group of lactic acid indicates that
the poly lactic acid is hydrophobic (Figure 1.2) with a level of hydrophobicity
greater than Poly(D,L,lactide-co-glycolide) but less than poly(L, lactide).

9
Figure 1.2: Structure of poly (lactic acid)43. The letter n represents the number of lactic acid monomers
Poly (D,L,-lactide-co-glycolide) (PLGA)
PLGA has been clinically approved by the FDA as a biodegradable and non-toxic
polymer46. This polymer was initially applied as a suture, which did not require
surgical removal on its application. Its advantages, such as excellent
biodegradability, biocompatibility, mechanical strength, hydrophobicity and
flexibility, make this the most commonly used polymer in a controlled delivery
system.
PLGA is synthesised by polymerisation lactide/glycolide in various ratios. PLGA is
copolymer of poly(lactide) (PLA) and poly(glycolide) (PGA), which can be well-
absorbed into the body when it is degraded. The chemical structure of PLGA can be
seen in Figure 1.3. Gurny15 suggested that the rate of PLGA biodegradation
increased with increasing the glycolic unit proportion in this polymer.
Figure 1.3: Structure of poly (D,L, lactide-co-glycolide) 43. The letter p represents the number of glycolic acid monomer, q represents the number of lactic acid monomer

10
1.2.5 Synthesis of NPs
A variety of methods have been developed to synthesise NPs. Those methods can be
classified based on the performed matrix polymers, whether they are from the
monomer which undergoes polymerisation or directly from the macromolecules. In
this review, the most important methods of NPs preparation are described.
Coacervation/phase separation
Coacervation/phase separation techniques can be separated into two categories:
aqueous phase separation and organic phase separation. The basic principle of this
method is the addition of desolvating agent which can decrease the solubility of the
matrix, leading to phase separation. In this separation, polymer and coacervates exist
in one phase, and free-polymer-supernatant is in the other phase.
Solvent diffusion (nanoprecipitation or solvent displacement)
method
The solvent diffusion method has been very popular in the preparation of NPs in
recent years. Chorny 47 reported that this method can produce NPs sized less than
100 nm with a narrow distribution using several modifications. This is suitable to the
preparation of highly-intracellular uptake-NPs. Another advantage of this method is
that the method requires relatively non-toxic organic solvents, such as acetone, or a
mixture of acetone and ethanol; therefore the risks of potentially toxic solvents can
be avoided 47-49. High energy output equipment can also be avoided using this
method, leading to the possibility for this method to be scaled up 50.
The principle of this method is a precipitation of polymer or drug with polymer in the
form of NPs as a result of rapid diffusion of one or two miscible organic solvents, in
which polymer or a combination of polymer and drug, were dissolved into water.
The basic procedure was a dropwise addition of the polymeric organic solution into
an aqueous solution containing a stabiliser and followed by continuous stirring at
room temperature to reach equilibrium.
Murakami et al.48 established a modified spontaneous emulsification solvent
diffusion method. In this development, they suggested that a proper composition of

11
binary organic solvents (ethanol and acetone) and the polymer concentration can
present NPs with better characteristics, such as submicron particle size and higher
yield efficiency (Figure 1.4). In their experiment, ethanol added to a PLGA acetonic
solution, was also shown to inhibit the aggregation.
Figure 1.4: Solvent diffusion process illustrated by Murakami 48
The mechanism involved in the solvent diffusion method can be explained by a study
reported by Murakami et al 48, 49. In their study of developing a modified spontaneous
emulsion solvent diffusion, they introduced a mixture of two organic solvents, which
were ethanol and acetone. They demonstrated that there was a perturbation of the
interface during the dispersion of PLGA solution into the aqueous PVA solution,
leading to the spontaneous formation of a large interfacial area. This phenomenon
was governed by the so called Marangoni effect, resulting in nano-sized quasi
emulsion droplets of PLGA solution. The ethanol initially diffuses out from the
droplet due to the lower affinity of ethanol to PLGA, followed by acetone. Acetone
subsequently diffused, resulting in PVA coacervation in the aqueous phase. This
diffusion allowed an increased concentration of PLGA, leading to the solidification
or precipitation of PLGA and PVA adsorption simultaneously. This spontaneous and
instantaneous process allowed the formation of uniform NP dispersion under mild
agitation.
Regardless of the advantages described above, several disadvantages have also been
uncovered, such as less drug load due to leakage (especially for hydrophilic drugs) or
12
crystallisation of the drug (for hydrophobic drugs) during the process, and less yield
due to initial aggregation of the polymer and the physical instability of the NPs.
Emulsification-solvent evaporation
This method involves organic solvents which are immiscible with water.
Emulsification-solvent evaporation has been successful in encapsulating the drug to
produce NPs as well as microparticles, of either hydrophilic or hydrophobic drugs.
The ability to load higher amounts of the drug, especially the hydrophobic drugs or
drugs with poor solubility, indicates this method is superior to the solvent diffusion
method. However, the use of potentially toxic solvents should be taken into
consideration. The appropriate solvent removal method should be carried out
following this method of NP preparation.
The mechanism of solvent evaporation is different from solvent diffusion. The
reduction of particle size is not governed by organic solvent diffusion, but by a
vigorous agitation in the formation of primary emulsion droplets. The organic
solvent of this method is subsequently removed by evaporation after a formation of
emulsion droplets 12. Increasing the energy of agitation results in the smaller
particles. To achieve nano-sized particles, therefore, the aid of sonication is needed.
This method does not only allow the hydrophobic drugs to be encapsulated, but also
hydrophilic drugs, by employing water - in oil - in water (W/O/W) emulsion 51.
Basically, the hydrophilic drug is dissolved in the aqueous phase, then it is
emulsified with an organic solvent containing polymer. This emulsion is then
emulsified with aqueous phase containing the stabiliser. By this process, the
hydrophilic drug should be well encapsulated in a polymer matrix. The oily phase
will prevent the drug to diffuse to the external aquoeus phase. Solidified NPs are then
produced by removing the organic solvent and it is followed by the drying procedure
to collect the dry, solid NPs.
1.2.6 Surface modification of NPs
Conventional hydrophobic NPs in blood circulation may be prone to the rapid
clearing by opsonisation and macrophages. Therefore, considerable effort has been
13
made in order to prevent the NPs from early clearing and to prolong the circulation in
the blood. It is suggested that to prevent phagocytosis, particles should be larger than
3 µm 3. However, this suggestion apparently does not work in NP development.
Surface modification has been developed to tailor the problem 9. Coating the surface
with hydrophilic polymers allows the hydrophobic NPs to be retained longer in the
circulation due to steric stability offered by hydrophobic polymer. This approach
may also control the opsonisation and improve the surface properties of the NPs.
Among those surface coated polymers, PEGylated-poly lactide (methoxy poly lactide
mPEG PLA) and PEGylated PLGA(methoxy-poly lactide-co-glyclide, mPEG
PLGA) have gained much interest in the NP investigation. Their basic colloidal
properties and degradation depend on copolymer composition. The mPEG PLA and
mPEG PLGA NPs exhibit prolonged blood circulation following intravenous
administration to animals. The composition of NPs determines their biodistribution
properties, probably through its influence on the effectiveness of the PEG steric
barrier and the size of the NPs. The ability of the mPEG PLA and mPEG PLGA NPs
to avoid rapid phagocytosis has extended the range of sites within the body that the
NPs can reach, which has significant implications with regard to their application in
controlled drug delivery and targeting. The mPEG PLA and mPEG PLGA NPs can
be loaded with a variety of bioactive agents achieving satisfactory loading, especially
in the case of hydrophobic drugs. The NPs have been investigated for the treatment
of infectious diseases and cancer, the intravenous and mucosal delivery of proteins,
and oligonucleotide and gene delivery 52-54. This current study is investigating mPEG
PLGA as one of the polymers used in nanoparticle formulations. The chemical
structure of mPEG PLGA is shown in Figure 1.5.
Figure 1.5: Structure of (methoxypolyethyleneglycol)poly-(D,L,lactide-co-gycolide)13

14
1.2.7 Physical characterisations of NPs
To characterise the NPs, there are mainly five parameters to be taken into
consideration: particle size and morphology of particles, surface charge, drug loading
and release study.
One of the most important features of NPs is particle size. It has been a challenge in
NP formulation to measure the particle size accurately in the presence of dust,
microbial contamination and crystallisation or aggregation of the ingredients that
occur during the synthesis. However, photon correlation spectroscopy or dynamic
light scattering is the currently applicable method to measure the size of sub-micron
particles. It measures the hydrodynamic diameter which is a combination of the
particle diameter and the double layer thickness. This method offers several
advantages: it enables small and non-invasive sampling, automatic measurement, and
is less time-consuming with high accuracy results. The basic instrumentation of this
method is a coupling between low-angle laser light scattering and a detector in which
the scattered waves travel to the detector. It is suitable to measure the size of
particles which undergo a diffusive Brownian motion. Nevertheless, there are several
drawbacks to be taken into consideration. This method has a limitation of
measurement up to 3µm. Larger particles are subject to laser diffraction 55. The
measurement of particle size is normally verified by the examination of the surface
morphology of NPs. Scanning electron microscopy enables the researcher to
investigate the surface morphology of the NPs.
Various parameters were reported to highly affect the particle size in NPs
preparation. Polymer concentration, internal/external ratio, exchange ratio and
solvent-polymer interaction, as well as stabiliser type and concentration are several
important parameters in optimising the NPs size. Increasing polymer concentration
of organic phase added into a stabiliser solution results in poor dispersability of the
organic phase due to higher viscous resistance against shear forces during
emulsification. This will produce larger and heterogeneous droplets, which
eventually result in larger particles 56, 57. The increased internal/external (organic
phase/ aqueous phase) ratio may prevent coalescence of droplet due to the larger
amount of solvent in the organic phase, resulting in reduced size of particles 56.

15
Choi et al 58 demonstrated that if the exchange ratio, the ratio of diffusion from
solvent to water over diffusion from water to solvent, is increased and the solvent-
polymer interaction parameter is decreased, a small supersaturating region will be
created, resulting in small NPs. Stabiliser type and concentration also affect the size
of particles in terms of the ability to stabilise the emulsion during preparation.
Generally, higher stabiliser concentration is more likely to produce smaller particles.
However, Sahoo et al 59 suggested that for PVA, the concentration of stabiliser used
in the NPs preparation should not be higher than 2.5% since PVA is aggregated at
that concentration and tends to show surfactant activity, leading to the formation of
larger particles after solvent evaporation. Since those parameters were fixed in this
study, the difference properties of TA-NPs were mainly because of the nature of the
polymers.
Surface charge, which can be determined by measuring the zeta potential, is an
indicator for stability of the NPs in the suspension. As the charge increases, the
repulsive interactions will be greater to maintain physical stability of a suspension.
The zeta potential can be measured by laser Doppler anemometry. In addition to
determining the physical stability of NPs in the suspension, surface charge
determines the acceptability of the NPs when they are administered in the body,
regarding the phagocytic uptake of NPs by cells of a reticuloendothelial system 8. A
value of ± 30 mV is considered as the minimum value of zeta potential to provide a
physically stable nanosuspension 12. In terms of cellular uptake, negatively charged
NPs show poor endocytosis while positively charged NPs exhibit rapid
internalisation and accumulate at high extent 60
Determination of the loading of NPs can be carried out in a direct or an indirect way.
Direct determination, on the one hand, is carried out especially for hydrophobic
drugs, which can be extracted from NPs. On the other hand, indirect determination is
commonly used to determine the hydrophilic drug. In this technique, free drug in the
supernatant is determined and is used to subtract the initial drug added to achieve the
drug loading in the NPs.
The release characteristics of a drug is one of the major features in NPs due to their
characteristics as a controlled delivery system. The profile of drug release is

16
markedly affected by several factors, such as physicochemical properties of the drug
and the polymer, size of the particles, distribution of the drug incorporated into NPs,
stability and the degradation rate of the polymer, the diffusion coefficient and affinity
of the drug-polymer matrix8, 61. The drug can be released from the matrix by
desorption of surface bound drug, diffusion through the matrix or polymer walls,
erosion of the NPs or a combination of erosion of the matrix and diffusion of drug 8.
1.2.8 Purification of NPs
NPs produced by the available methods may contain contaminants and not be of
acceptable purity. Poly(vinyl alcohol) (PVA) solution, which acts as a stabiliser
solution when is used in high concentration, is potentially toxic and unacceptable for
vascular administration. Excessive amounts of remaining organic solvent are likely
to be harmful and potentially carcinogenic. Therefore, removal of those elements is
important in the manufacture of NP system.
A variety of methods have been investigated for NP purification, including dialysis
centrifugal device (DCD), tangential flow filtration (TFF) and high-speed
centrifugation 62. Among those methods, high-speed centrifugation is probably the
most effective and simple way to collect the NPs and remove the impurities. This
method is reported to able to remove approximately 90% of PVA from the system 62.
Although the high centrifugal forces may cause a compaction of NPs, especially for
the hydrophobic matrix, the compaction still can be redispersed in a reasonable
manner.
1.3 In vitro cell culture toxicity study
Cell culture has been widely applied to facilitate in vitro toxicity studies. According
to Freshney 63, cell culture refers to “cultures derived from dispersed cells taken from
the original tissue, from a primary culture, or from a cell line or cell strain, by
enzymatic, mechanical, or chemical disaggregation.” Cell culture is also commonly
employed for investigating various aspect of cell biology and physiology 64.

17
1.3.1 Significance of cell culture for in vitro study
Cell culture offers an advantage of precise control of physicochemical environment
and physiological conditions, which is always kept constant. It is also virtually
identical and the results are more reproducible compared to in vitro study with
excised animal tissue, therefore it minimises the use of statistical analysis of
variance. In terms of economical reasons, cell culture requires less reagent and
reduce the use of animals than in vivo study, therefore the study can be more cost
effective. In addition, since cell culture only involve either animal or human cells,
the ethical issue can be avoided 63, 64.
1.3.2 Assay used for in vitro toxicity studies
A variety of assays have been extensively applied for in vitro toxicity study using
cell cultures. Those are categorised into two major classes: (1) a short-term response
using a measure of viability such as membrane integrity or loss of metabolic
function, during exposure to potentially toxic materials, (2) a long-term response of
survival, such as expressing metabolic capacity after exposure.
The cell viability can be referred to membrane integrity of cells after being exposed
to potentially toxic substances, which is determined by either dye exclusion or dye
uptake. Dye exclusion refers to the concept in which viable cells are impermeable to
several types of dyes, while dye uptake refers to the ability of viable cells to take up
certain chemicals.
1.3.3 MTT assay
The MTT ((3-(4,5-dimethylthiazol-2-yl)-2,5-diphenyl tetrazolium bromide) assay
was initially developed by Mosmann in 1983 65. It involves a reduction of yellow
tetrazolium salt (MTT), to form insoluble purple formazan crystals. The cleavage of
tetrazolium salt to yield insoluble formazan product, which then are accumulated
within cells, can only be carried out by the mitochondrial dehydrogenase enzyme,
produced by the active mitochondria of living cells. The purple formazan product can
be solubilised by detergent, dimethyl sulfoxide (DMSO) or isopropanol and
quantified colorimetrically.

18
MTT assay is proven as a rapid and convenient assay to determine the cellular
growth and cell survival. It requires a short period of time of analysis and a simple
spectrophotometry. Moreover, this method offers high sensitivity and accuracy, since
it can detect slight changes in cell metabolism. The linearity between cell number
and absorbance, which can be well established, shows the accurate and direct
quantification of viable cells and proliferation. This assay is also considered to be
safer than the other methods, since it does not require radioactive substances 65.
Moreover, this assay is widely acceptable in toxicity studies, especially for NP
formulations, with good correlation with in vivo toxicity.
1.3.4 Cell lines as the objects for the current study
The BALB/c 3T3 cell lines are continuous, immortalised but not transformed cell
lines which are not tumorigenic in mice 66. They are reported as the cell model used
in the in vitro toxicity evaluation of genistein glycosides using neutral red uptake
(NRU) assay 67.
The ARPE 19 cell lines are continuous immortalised cell lines established from
human retinal epithelial cells. It is derived in 1986 by Amy Aotaki Keen 68 from the
normal eyes of a 19-year old male who died in a motor vehicle accident.
Dunn et al 68 demonstrated that ARPE 19 cells showed a rapid growth by passage 5,
forming cobblestone monolayers, which pigmented after several months. They
demonstrated that ARPE 19 has structural and functional properties characterisation
of RPE cells in vivo, therefore this cell line is invaluable for in vitro studies of retinal
pigment epithelia.
1.4 Triamcinolone acetonide (TA)
Triamcinolone was first introduced in 1958 as a potent anti-inflammatory agent. Its
antirheumatic activity was reported as similar to methylprednisolone, but greater than
prednisolone 69. TA (9α-Fluoro-11ß, 16α,17,21-tetrahydroxypregna-1,4-diene-3,20-
dione cyclic 16,17-acetal with acetone) was developed as a derivative of
triamcinolone. It has a molecular weight of 434.5 70.
19
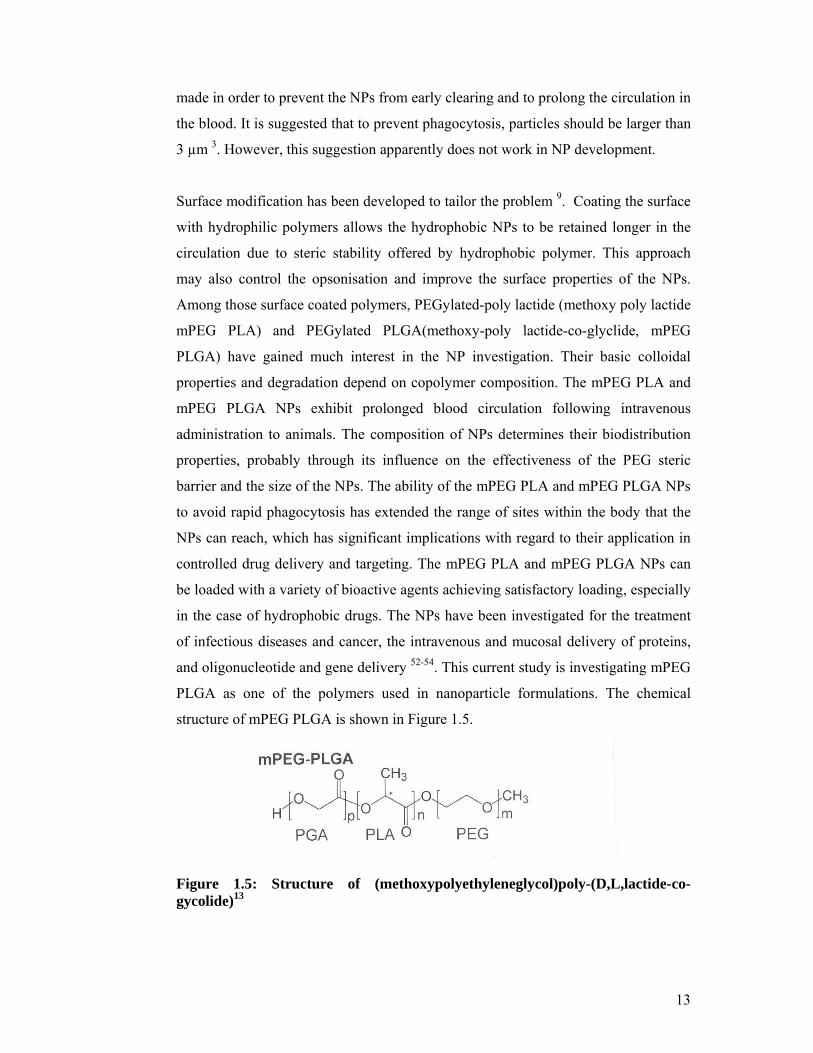
Figure 1.6: Structure of triamcinolone acetonide 71
The 9α-Fluoro group attaches to the steroid ring (Figure 1.6) and governs the
increase of the anti- inflammatory activity while the insertion of a 16α-hydroxy
analogue is reported to minimise the mineralocorticoid activity 69.
1.4.1 Physicochemical properties
TA is chemically prepared crystalline powder with white, or almost white, colour in
a solid state, with no distinct melting points. Several reports state different melting
points of TA: 277 ºC, 292 ºC, and 294 ºC 72. The difference is likely due to the
different polymorph existing for the compound. TA is very slightly soluble in water,
but soluble in ethanol (1:150), acetone (1:11) and chloroform (1:40). It is very
soluble in dehydrated alcohol and methanol but sparingly soluble in ethyl acetate73 .
TA is reported to be stable in its solid state. However, Gupta 74 demonstrated that
aqueous-alkaline and ethanolic solutions of TA are unstable. The degradation of TA
alkaline and ethanolic solution, which follows pseudo-first order kinetics, is
governed by oxidative rearrangement of the α-ketol side chain. He also showed that
TA solution is more stable at pH values less than 5.5 and minimal degradation
occurred at pH 3.4. However, it was demonstrated that, above pH 7, the
decomposition decreased with an increase of the ionic strength. In addition, the
solution stored at 25ºC was nine times more stable that of at 50ºC. Another study,
which was conducted by Timmins and Gray 75, also demonstrated that TA follows
specific acid catalysis at pH 1 to 3, and specific base catalysis at pH 4 to 7 an pH 9 to
12, with the pH independent region at pH 7-9. The pKa of this drug is only stated in

20
terms of TA phosphate (1.70) 70. As TA does not ionise, no information on the pKa
of TA is available.
1.4.2 Clinical applications
As a corticosteroid, TA is known to treat various diseases related to autoimmune and
allergic conditions. It was first introduced in topical administration, which showed
better efficacy than other corticosteroids. The effect of TA is mainly related to its
glucocorticoid action and suppression of inflammatory responses. TA is a drug of
choice to treat diseases associated with inflammation such as arthritis, given by intra
articular injection to relieve pain. TA has also been reported to reduce lower back
and radicular pain. In this treatment TA is administered via epidural injections of a
microcrystalline TA suspension 69, 71, 76, 77 78.
Recently, TA has been extensively investigated in the treatment of a variety of ocular
diseases associated with inflammation and neovascularisation 82, 84-90. In its
application for ophthalmic disease management, TA is a proven anti inflammatory
agent and an inhibitor of neovascularisation 79. TA is a drug of choice for treatment
of symphatetic ophtalmia and post cataract surgery inflammation77. TA has also been
indicated for other ophthalmic diseases such as age-related macular degeneration
(AMD), diabetic macular edema and foveal telangiectasia82, 83. Its antiangiogenic
effect is mediated through the mechanism of either alteration of extracellular matrix
degradation or inhibition of angiogenic growth factors 79-81.
The angiostatic effect of TA in treating neovascularisation 90, 91, therefore provides
potential for this agent to be developed as an antiangiogenesis agent, which could be
useful in the treatment of a range of cancers.
1.4.3 Side effects
TA may suppress the normal inflammatory responses which may activate the latent
infection caused by tubercular or fungal. The use of large amount of TA can lead to
the failure of producing adrenal suppression, diabetes, hypertension and Cushing’s
syndrome. Prolonged used of TA may develop Chusingoid body changes and
osteoporosis which is irreversible71. Those side effects are related to high dose
chronic systemic administration.

21
In ocular therapy, TA in suspension is commonly administered to patients with AMD
or other retinal diseases via intra vitreal and sub-tenon’s injection 87, 88, 92. However,
there are several side effects associated with those treatments, such as increasing the
intraocular pressure (IOP) and the risk of post injection infectious endophthalmitis.
TA is commercially available as a cream or gel for topical administration and a
microsuspension for parenteral administration. In ocular therapy, a suspension of TA
is commonly administered to a patient with retinal diseases via intra vitreal and sub
tenon’s injection 82, 88, 93, 94. However, there are several side effects associated with
those treatments, such as: increasing the intraocular pressure (IOP) and the risk of
post injection infectious endophtalmitis 92, 95. TA itself is reported as a steroid-
induced risk of ocular hypertension and cataract development regardless of the
dosage or particle size 77, 92. Other side effects reported are immune system depletion,
moon face, and osteoporosis 77, associated with high chronic oral doses of
corticosteroid. Having those potential side effects, the administration of TA should
be improved to minimize the side effects.
1.5 Objectives of the study
Over the years, the research focused in our laboratory has been to develop NP
formulation for delivery of various drugs and peptides.
TA is known as potential anti inflammatory agent and has been extensively
investigated in the treatment of retinal diseases, such as age related degeneration,
diabetic macular oedema and neovascularisation 79-83. The ability of TA to inhibit
neovascularisation can be proposed as a potential indication for TA to be an
antiangiogenic agent in the cancer chemotherapy.
TA is commercially manufactured as a microsuspension for parenteral
administration. Evidence suggests that TA can potentially induce toxicity in that
form at typical dosages 92. Despite this, there has only been very limited effort
directed towards to TA formulation to achieve a safer and more acceptable means of
delivery. Although the delivery of TA by NPs has been investigated by Krause 96,

22
there is a need for further research of TA loaded NPs, using other biodegradable
polymers and potentially superior methods, to improve the quality of NPs.
The overall aims of this study were to develop TA loaded-NP formulations from
biodegradable and biocompatible polymers, which provide: sustained release,
prolonged stability and low toxicity.
In order to achieve the overall aims, the following studies were set up to
accomplished:
Formulation of TA loaded NPs (TA-NPs) using poly(D,L,lactide) (PDLLA),
poly(D,L, lactide-co-glycolide) (PLGA) and methoxy-poly-ethylene glycol-
poly(D,L, lactide-co-glycolide) (mPEG-PLGA),
Determination of the physical properties of empty NPs and TA-NPs,
Investigation of the effect of NP incorporation on the stability of TA,
Investigation of the effect of polymer on the in vitro release characteristics of
three different types of TA-NPs,
Assessment of the toxicity profiles of both empty NPs and TA-NPs in two in
vitro cell culture models: BALB/c 3T3 and ARPE 19.
23
MATERIALS AND METHODS
2.1 Experimental materials
2.1.1 Experimental materials for TA-NPs formulation
Acetonitrile; HPLC grade (LabScan, Thailand);
Acetone; HPLC grade (LabScan, Thailand);
Boric acid; analytical grade (Ajax Chemical Ltd, Australia)
Dichloromethane; HPLC grade (LabScan, Thailand)
Di-sodium hydrogen orthophosphate anhydrous (Na2HPO4) ‘AnalaR’;
analytical grade (Merck Pty.Ltd., Victoria)
D,L-Lactide/Glycolide copolymer (PLGA), ratio 85:15, batch number:
82/136, (Purac Biochem bv, Netherlands)
Orthophosphoric acid, Mw 98.00, BDH ‘AnalaR’; analytical grade, Min
85% (BDH, Germany)
Poly (D,L,-lactic acid) (PDLLA), lot number: DG 676 GA, (Purac Biochem
bv, Netherlands)
Poly(lactic-co-glycolic)-methoxypoly(ethyleneglycol) (mPEG-PLGA)
synthesized in house, containing 4.8% mPEG,
Poly(vinyl alcohol) (PVA), 87-90% hydrolysed, Mw 30,000-70,000, batch
number 094K0104, chemical grade (Sigma Aldrich Inc., USA)
Sodium azide, (NaN3) batch number: 1001010, analytical grade (BDH
Chemicals Pty Ltd., Kilsyth, Victoria)
Sodium chloride (NaCl), batch number: 55914, analytical grade (Scharlau
Chemie, Spain)
Sodium dihydrogen orthophosphate (NaH2PO4.H2O) ‘AnalaR’, analytical
grade (Merck Pty.Ltd, Victoria)
Triamcinolone acetonide (TA) micronised, batch number:
2196NMO0100421, chemical grade (Farmabios, Italy)
Water (deionised) - passed through a milli ‘Q’ apparatus with an initial
specifc conductivity of 18 MΩ cm at 25˚C ( Millipore Corporation , Bedford,
MASS, USA)
24
All other chemicals were of analytical reagent grade.
2.1.2 Experimental materials for in vitro toxicity study
ARPE 19 cell line, kindly donated by Adj. Assoc. Prof. Chooi-May Lai
(Lions Eye Institute, Western Australia)
BALB/c 3T3 cell line (ATCC, USA)
Dimethyl sulfoxide (DMSO), analytical grade (Sigma-Aldrich Chemie,
Germany)
Media for culturing ARPE 19:
Dulbecco’s Modified Eagle’s Media (DMEM) : Ham’s F12 1:1 media
(GIBCO, Invitrogen Co., USA) containing 10% fetal calf serum (JRH,
Germany), 100 IU Penicillin-100 µg/ml Streptomycin (GIBCO, Invitrogen
Co., USA),
Media for culturing BALB/c 3T3 cells:
DMEM containing sodium pyruvate (GIBCO), 10% fetal calf serum (JRH,
Germany), 100 IU Penicillin-100 µg/ml Streptomycin ( GIBCO, Invitrogen
Co., USA ) and 2 mM Glutamax (GIBCO, Invitrogen Co., USA)
Methylene blue, analytical grade (Sigma-Aldrich Chemie, Germany)
0.9% NaCl / saline solution for irrigation ( Baxter, Australia)
Trypsin-EDTA (GIBCO, Invitrogen Co., USA)
Triamcinolone acetonide (TA), micronised, (batch number:
2196NMO0100421 (Farmabios, Italy)
2.2 Instrumentation
2.2.1 Instrumentation for TA-NPs formulation
Sonicator; Biosonik II (Bronwill Scientific, New York, USA),
Bath sonicator; Bransonic Ultrasonic cleaner 2510E-DTH (Branson
Ultrasonic Corporation, USA);
Centrifuge; Allegra™ 64R centrifuge (Beckman Coulter, Inc., USA);
Eppendorf minispin AG 22331 (Eppendorf, Germany),
Field Emission Scanning Electrone Microscope (FESEM); Jeol JSM 6700F
Japan, with a sputter coater (JFC-1300, Auto Fine coater, Jeol, Tokyo, Japan)

25
High Performance Liquid Chromatograph (HPLC) apparatus, consists of:
An Agilent 1100™ HPLC; an installation of a degasser (G1322A, serial #
JP73022182), a quaternary pump (G1311A, serial # DE91610024), an
automatic sampler (G1313A, serial # DE91612069), a diode array detector
(G1315B, serial # DE01609022) and a ChemStation working station
An Econosil™ column, C18 10 µm, 250 x 4.6 mm (Alltech Associates Inc,
PA, USA), as the column for a reverse-phase HPLC analysis;
NP sizer; Zetasizer 3000HS, Malvern Instrument, UK,
Magnetic stirrer; Variomag telemodul 20P (Dr Hoss + Partner GmBH,
Germany),
Oven (Memmert, Germany);
pH meter; Microprocessor pH/mV/ºC Meter, Model: 8417N, (Hanna
Instruments, Singapore),
UV-Vis spectrophotometer; diode array spectrophotometer 8452 A (Hewlett
Packard, USA) and UV-Visible spectrophotometer 1201 (Shimadzu, Japan),
Vacuum rotary evaporator; Buchi Rotavapor R-200 (Buchi Labortechnik AG,
Switzerland).
2.2.2 Instrumentation for in vitro toxicity study
Aseptic hood; Email™ Air Handling Hood, Biological Safety Cabinet, Type:
Class II 1800 RH, conforming to 2252 part2 1994, Model No. 1687,
(WestingHouse, Australia),
CO2 incubator; Sanyo CO2 incubator, MCO-17AIC, (Sanyo Electric Co, Ltd,
Japan),
Centrifuge; Eppendorf™ centrifuge 5417C (Hamburg, Germany), Beckman
GS-6 centrifuge, Germany
Phase contrast microscope; Nikon phase contrast microscope, model TMS,
Japan
Microplate reader; Microplate reader model 3550 (BioRad, USA)
Water bath, Thermoline™ water bath, Australia

26
2.3 Methods
2.3.1 High Performance Liquid Chromatography (HPLC)
assay validation for TA
The TA HPLC method was adopted from a reported method 74 with some
modification. An Econosil column, C18 10 µm, 250 x 4.6 mm (Alltech Associates
Inc, PA, USA) was used as the stationary phase. The mobile phase consisted of a
composition of acetonitrile (ACN) and 20mM phosphate buffer solution (pH 4.2) in
the proportion of 50:50 v/v, filtered through a 0.45 µm membrane filter prior to use.
The flow rate of 1.5 mL/min and the injection volume of 20µl were used. The assay
validation was conducted with TA standards dissolved in two media: the
ACN:mobile phase 1:1 v/v and phosphate buffer saline pH 7.4 containing 0.05% w/v
sodium azide (PBS-NaN3). To obtain a maximum sensitivity, TA was measured at its
wavelength of maximum absorption: 242 nm. The temperature of the system was
maintained at 25ºC. The HPLC assay of TA was validated for linearity, precision,
recovery (accuracy), sensitivity and selectivity.
Linearity
Linearity of the assay was determined in two types of media for TA loading and
release study i.e. ACN:mobile phase 1:1 v/v and PBS-NaN3, respectively. The
standard solutions were injected directly into the HPLC column under the conditions
described in Section 2.3.1. The calibration curve was constructed for each type of
medium by plotting peak areas against the concentration of TA standard solutions.
TA in ACN:mobile phase 1:1
Six standard solutions at concentrations of 1, 2, 5, 10, 30, and 40 µg/mL were
prepared by diluting a 50 µg/mL of TA stock solution in ACN:mobile phase 1:1 v/v.
TA in PBS-NaN3 pH 7.4
A 50 µg/mL of TA stock solution in PBS-NaN3 was diluted to obtain standard
solutions ranging between 0.5 µg/mL and 25 µg/mL. Due to the TA solubility
problem, the stock solution was prepared by dissolving 12.5 mg TA in 100 mL of
ACN and making up to 500 mL with PBS-Na N3.

27
Preparation of PBS-NaN3 solution
The method of preparation for Sorensen buffer was adapted from the Pharmaceutical
Codex (ref) to prepare 40 mM phosphate buffer saline solution (PBS) pH 7.4, with a
replacement of the di-sodium hydrogen orthophosphate dihydrate (Na2HPO4.2H2O)
with anhydrous di-sodium hydrogen orthophosphate (Na2HPO4) containing an
equivalent amount of salt. The solution was prepared by dissolving 7.6 g of
Na2HPO4, 2.1 g of sodium dihydrogen orthophosphate (NaH2PO4.2H2O), and 4.4 g
of sodium chloride (NaCl) in 1000 mL of Milli ‘Q’water. Sodium azide, NaN3
(0.05% w/v) was included as a preservative in the PBS solution.
System precision
Six replicate injections of two different concentrations of TA (low and high
concentrations) were assessed for the precision of the assay. The study was
conducted in two media: loading medium and release medium. The means and
relative standard deviations (RSD) were calculated for each TA concentration.
Recovery (accuracy)
Six concentrations ranging between 2.5 µg/mL and 40 µg/mL were analysed in the
presence of a known volume of 20 µg/mL of empty PLGA, mPEG-PLGA (4.8%)
and PDLLA NPs by the same method used for TA loading determination. The final
solutions were filtered with a 0.2 µm syringe filter (GHP Acrodisc® 13, Pall
Corporation, USA) prior to injection into the HPLC column. The recovery was
calculated by comparing the actual TA concentration detected with the initial
concentration.
Sensitivity
Blank solvents were injected six times consecutively into the HPLC column and the
standard deviation of average noise levels in the expected retention time were
determined. For the TA loading determination assay, blank solvent was defined as
the loading media after being filtered from blank NPs, while in the release study,
blank solvent was the PBS-NaN3. The theoretical LOD and LOQ were then
calculated by the following formulae:

28
3curvencalibratioofionconcentratversusheightofslope
levelsnoiseofdeviationndardtasLOD (Eq.1)
10curvencalibratioofionconcentratversusheightofslope
levelsnoiseofdeviationndardtasLOQ (Eq.2)
Selectivity
The peak purity of TA in two different media (ACN:mobile phase 1:1 and PBS-
NaN3) containing TA and degradation products were analysed to determine the
selectivity of the assay. The interference of the media was also investigated. The
purity factor should be within the calculated threshold limit.
2.3.2 Preparation of TA-NPs
Solvent diffusion method
The solvent diffusion method in this study was developed based on the method
reported by Murakami48.
Polymeric organic phase preparation
To prepare the polymeric organic phase, 0.4 g of polymer was dissolved in 20 mL
acetone. The solution was then mixed well and served as the organic phase.
Aqueous phase preparation
Polyvinyl alcohol (PVA) with concentration of 0.6% (w/v) was used as the aqueous
phase as well as the stabilizer solution. To prepare the PVA solution, 0.6 g of PVA
was sprinkled onto 100 mL water and stirred overnight. The PVA solution was
further filtered by a 0.2 µm syringe filter (GHP Acrodisc® 13, Pall Corporation,
USA) to obtain a particle-free-solution.
Preparation of TA-NPs by solvent diffusion
Polymeric organic phase (20 ml) containing 80 mg of TA was added drop-by-drop
into 60 mL of 0.6% PVA solution and constantly stirred at a speed of 300 rpm, at
room temperature, for 4 hours to evaporate the acetone. The NP suspension was left
on the bench for 30 minutes prior to purification. These procedures were repeated for

29
each type of polymer. The empty NPs were prepared with the same method without
the drug.
Emulsification solvent evaporation method
In this method, 0.4 g of polymer was dissolved in dichloromethane (DCM). The
solution was mixed well and prepared as the organic phase. The same stabilizer
solution as per section 2.3.2 was also used in the emulsification-solvent evaporation.
Preparation of TA-NPs by solvent evaporation
Polymeric organic phase (20 mL) containing 80 mg of TA, and 40 mL of 0.6% PVA
solution were sonicated using the Biosonic® (Bronwill Scientific, USA) for 2
minutes. The emulsion was then mixed with 20 mL of 0.6% PVA and continuously
stirred for 10 minutes. The remaining DCM was removed by a rotary evaporator. The
NP suspension was left on the bench for 30 minutes prior to purification. This
procedures were repeated for each type of polymer. The empty NPs were prepared
with the same method without the drug.
2.3.3 NPs purification
After evaporating the organic solvents, the NP suspension was centrifuged at 12,000
rpm for 20 minutes using an Allegra 64R centrifuge (Beckman Coulter, Inc., CA,
USA). The supernatant was collected and used to analyse the amount of PVA
removed from the NP suspension. The determination of PVA content was described
below. The settled NPs were then dispersed in 10 mL of deionised water.
Determination of PVA content
A colorimetric method, reported by Dalwadi et al. 62, was adopted to determine the
PVA content in the supernatant obtained during the purification of NPs.
To quantify the PVA in the nanoparticulate system, a calibration curve of absorbance
versus PVA concentration was established. Standard solutions of PVA ranging
from 18.9 µg/mL to 66.15 µg/mL were prepared from 2 mg/mL of the PVA stock
solution. A volume of 5 mL of water was added into a known volume of standard
solution, followed by the additions of 3 mL of 4% w/v boric acid and 0.6 mL of

30
0.1M iodine solution. The mixture was then made up to 10 mL with water accurately
and kept in the dark for 5 minutes to optimize the formation of the complex. The
PVA-iodine absorbance was measured using a UV-visible spectrophotometer 1201
(Shimadzu, Japan) at 690 nm.
Prior to PVA determinination, both supernatant obtained after NP centrifugation and
PVA solution used to prepare NPs were diluted five times. To prepare the sample, 5
mL of water was added to 0.1 mL of diluted supernatant (and PVA solution),
followed by the additions of 3 mL of 4% boric acid and 0.1M of iodine solution.
After it was made up to 10 mL with water, the mixture was kept in the dark for 5
minutes. The absorbance was measured at 690 nm and the PVA concentration was
quantified using a calibration curve prepared above. The PVA concentration was
used to determine the PVA amount in the total volume of supernatant, which was
equivalent to the amount of PVA removed from the nanoparticulate system. The
percentage of PVA removal was calculated based on this equation:
100(%) phaseaquoeusinPVAofamount
tnernataupstheinPVAofamountremovedPVA (Eq.3)
2.3.4 NP characterization
Empty NPs and TA-NPs of each polymer were characterized in terms of morphology
and size of NPs, zeta potential, yield, loading value, and entrapment efficiency.
Morphology and size of NPs
Morphology of the NPs was investigated using field emission scanning electron
microscopy (FESEM). Briefly, the dried NPs were attached to the metallic studs with
double sided carbon tapes and coated with gold by a sputter coater (JFC-1300, Auto
Fine coater, Jeol, Tokyo, Japan) for 40 seconds with a 40 mA current intensity, prior
to observation using FESEM (Jeol JSM 6700F, Japan).
The size of the NPs in diluted samples were measured using a Zetasizer 3000HS
(Malvern Instrument Pty. Ltd., Worcestershire, UK) based on a dynamic light
scattering (DLS) principle,. The hydrodynamic diameter, which is represented as Z

31
average mean size, was determined at 25º C with a detection angle of 90º. The
triplicate measurements were performed at 25ºC.
Zeta potential
The surface charge of the NPs, expressed as zeta potential, was also determined by
the Zetasizer™, with a zeta mode based on the laser droppler anemometry principle.
The measurements were also performed three times with diluted samples at 25ºC.
Yield determination
A known volume of NP suspension was added to a pre-weighed glass container and
placed into an oven at 70ºC until the dried NPs reached constant weight (evaporation
of solvent complete). As a control, the same volume of water was also treated under
the same condition. The yield of NPs was then determined by the following
formulae:
Yield of blank NPs (YNPs):
100(%) polymerofweight
lesnanoparticdriedofweightYNPs (Eq.4)
Yield of TA-NPs (YTA-NPs):
100)(
(%)
drugpolymerofweight
lesnanoparticdriedofweightY NPsTA (Eq.5)
Determination of drug loading and entrapment efficiency
A known volume of NP suspension was dissolved in 100 mL ACN to extract the
drug from the NPs. The solution was then diluted 1:2 with the mobile phase, to
precipitate the polymer. The precipitated polymer was removed by filtration with a
0.2 µm syringe filter (GHP Acrodisc® 13, Pall Corporation, USA) prior to injection
onto the HPLC column. For analysis of TA concentration, drug loading was
calculated based on the following formula:
100(%) obtainedlesnanoparticdriedofweight
loadeddrugofamountloadingDrug (Eq.6)
Whereas the entrapment efficiency was determined by this formula:

32
100(%) addeddruginitialofamount
loadeddrugofamountefficiencyEntrapment (Eq.7)
2.3.5 Turbidity assay
Ten mL of 4 mg/mL TA in acetone was added into 30 mL of 0.6 % PVA and stirred.
The samples were taken at time zero (t=0 min), t=2 minutes and at every 5 minutes
thereafter and the mixture was continuously stirred. The absorbances of the samples
were then determined using a diode array spectrophotometer 8452 A (Hewlett
Packard, USA) at 400 nm. The sampling was carried out until the mixture reached
equilibrium (the absorbance was relatively stable). The same method was used to
study the precipitation of polymeric organic phase (20 mg/mL of PDLLA and mPEG
PLGA) in acetone. The results compared the precipitation rate between the TA and
polymers in the aqueous environment (0.6 % PVA solution).
2.3.6 In vitro release assay of TA-NPs
TA solubility study
TA was added into release media until over saturated. The suspension were stirred at
room temperature under controlled agitation. The samples were taken over 8 hours
and 24 hours and filtered by a 0.2 µm syringe filter (GHP Acrodisc® 13, Pall
Corporation, USA) prior to injection onto the HPLC column.
Treatment of dialysis bag
The dialysis bags were washed with running water for 3-4 hours to remove the
glycerine. Those bags were then immersed in 0.3% w/v of sodium sulphide at 80º C
for 1 minute to remove the sulphur. The sodium sulphide was removed by washing
the bags with water at 60ºC for 2 minutes and acidifying it with 0.2 % v/v sulfuric
acid. The bags were finally rinsed with hot water to remove the acid and stored in
Milli ‘Q’ water at 4º C. The water was replaced daily to minimize the risk of
microbial contamination.

33
In vitro release method
The release study of TA-NPs was conducted using a dialysis bag diffusion technique.
The experiment was performed in PBS-NaN3 at 37º C. The equipment was set up as
shown in Figure 2.1.
Figure 2.1: The dialysis bag diffusion equipment
In brief, 10mL of TA-NPs of each polymer (containing 2.5mg of TA) was added to a
4 cm of dialysis bag, which was then sealed. The sealed dialysis bag was then
soaked in 50mL of PBS-NaN3 and incubated at 37º C with constant shaking. Forty
mL of samples were taken at 1, 2, 3, 4, 5, 6, 7, 8, 24, 72, and 96 hours, and replaced
with an equal volume of fresh PBS-NaN3 to maintain the sink condition. The TA
concentration in the samples was then analysed using the HPLC assay under the
same conditions as in section 2.3.1. The release study was conducted in triplicates for
each type of TA-NPs.
Following controls were included in for the release study,
Control 1: TA suspension (containing 2.5mg TA in 10mL water) prepared by a
similar technique of solvent evaporation for TA-NPs excluding the polymer
Control 2: TA suspension (containing 2.5mg TA in 10mL water) prepared by
sonicating TA in water for about 5 min
2.3.7 Stability assay of TA
The stability study of TA in the release medium (PBS-NaN3) was conducted under
conditions with and without being loaded in the NPs.
a glass container with lid
PBS-NaN3 as the release media
a sealed dialysis bag containing TA or NPs suspension
an orbital shaker
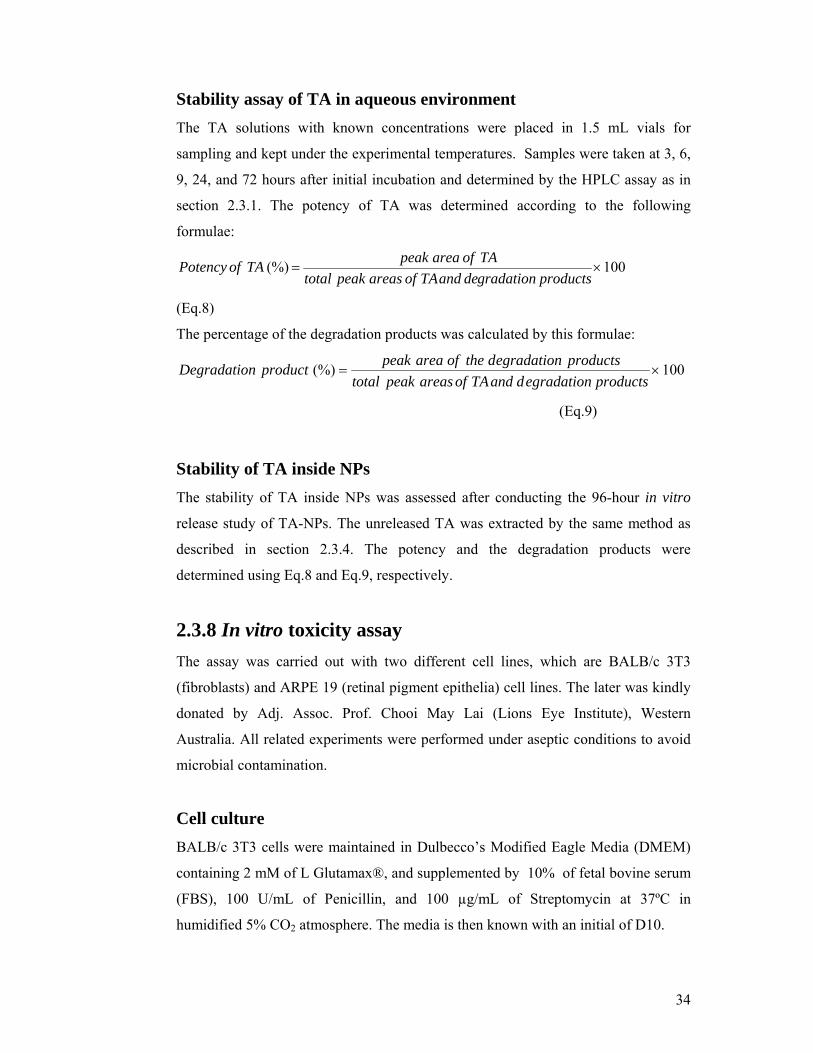
34
Stability assay of TA in aqueous environment
The TA solutions with known concentrations were placed in 1.5 mL vials for
sampling and kept under the experimental temperatures. Samples were taken at 3, 6,
9, 24, and 72 hours after initial incubation and determined by the HPLC assay as in
section 2.3.1. The potency of TA was determined according to the following
formulae:
100(%) productsradationgdeandTAofareaspeaktotal
TAofareapeakTAofPotency
(Eq.8)
The percentage of the degradation products was calculated by this formulae:
100(%) productsradationegdandTAofareaspeaktotal
productsegradationdtheofareapeakproductnDegradatio
(Eq.9)
Stability of TA inside NPs
The stability of TA inside NPs was assessed after conducting the 96-hour in vitro
release study of TA-NPs. The unreleased TA was extracted by the same method as
described in section 2.3.4. The potency and the degradation products were
determined using Eq.8 and Eq.9, respectively.
2.3.8 In vitro toxicity assay
The assay was carried out with two different cell lines, which are BALB/c 3T3
(fibroblasts) and ARPE 19 (retinal pigment epithelia) cell lines. The later was kindly
donated by Adj. Assoc. Prof. Chooi May Lai (Lions Eye Institute), Western
Australia. All related experiments were performed under aseptic conditions to avoid
microbial contamination.
Cell culture
BALB/c 3T3 cells were maintained in Dulbecco’s Modified Eagle Media (DMEM)
containing 2 mM of L Glutamax®, and supplemented by 10% of fetal bovine serum
(FBS), 100 U/mL of Penicillin, and 100 µg/mL of Streptomycin at 37ºC in
humidified 5% CO2 atmosphere. The media is then known with an initial of D10.

35
The ARPE 19 cells were maintained in 1:1 mixture of DMEM and Ham’s F12
containing 3 mM of glutamine 97, 98 with the same supplementation and under the
same conditions as of BALB/c 3T3, the media then is known as DF12.
Cell storage
For long term storage, cells were stored in cryovials in liquid nitrogen (N2) storage.
Prior to storage, 300 µl of FCS containing DMSO 9:1 (a freeze brew solution) was
added into 300 µl the cell suspension in the cryovials as a cryoprotectant.
Thawing the cells
To bring up the cells from liquid nitrogen (N2) storage, the cells were first thawed
rapidly at 37ºC and then 5 ml of the appropriate media was added. The cell
suspension was then centrifuged at 1000 rpm for 5 minutes, the supernatant was
removed and the cells were resuspended in 8 mL of fresh media. The cells were then
placed into 80 cm3 flasks and incubated at 37º C.
Subculturing (passaging) the cells
Cell cultures were maintained until they reached approximately 80% confluence. The
media was removed by aspiration, the cell monolayer was washed once with
approximately 5 ml of saline and the cell harvested by addition of 1 ml of 0.2% of
Trypsin-EDTA (Invitrogen, USA). Detachment of the cells was monitored by a
phase contrast microscope. When the cells were detached, they were seeded into
different flasks at an appropriate split ratio (1:3).
Cell counts
In order to standardize cell seeding into 96 well plates, cell counts were performed
prior to seeding. Cells were harvested by Trypsin-EDTA as described above (in the
section of subculturing the cells). Following detachment the cell suspension was
centrifuged at 1000 rpm for 5 minutes. The supernatant was discarded and cells were
resuspended in 2 ml of fresh media. To count cells, 20 µL of 0.4% Trypan blue was
mixed with an equal volume of the cell suspension. The mixture was then added to
the counting chamber and placed under the microscope. The cells were then counted
on 25 squares with the following standard formula :
36
4102)25(/ squaresoncellstheofamountmLcellstheofAmount (Eq.10)
Cell optimization
Cell optimization was conducted in order to determine the appropriate seeding
density, which would provide an adequate response for the assay. The cell
suspension (100 µL) was added in a 96-well plate in 3-4 different seeding densities
(cells/well) and in three different plates, for three different examination times: 0, 24,
and 48 hours. After 24 hour seeding at 37oC, the procedure of the MTT assay, as
described in section of toxicity assay below, was performed for the 0 hour-plate. The
same procedure was then repeated with the 24 and 48 hour- plates after 48 hours and
72 hours seeding, respectively. The optimization graph of absorbance versus time for
four seeding densities of the cells was constructed.
Toxicity assay
The MTT assay was performed on cells cultured in 96-well plates to determine the
cell viability following 24 hour exposure to experimental samples. Cells were
inoculated into 96 well plates in 100 µL of appropriate media at seeding densities of
15,000 cells/well for BALB/c 3T3 and 20,000 cells/well for ARPE 19. After cell
inoculation, the cells were incubated for 24 hours prior to addition of experimental
samples. After 24 hours, one plate was assayed to determine starting cell densities,
this represent a measure of the cell population for each cell line at the time of
samples addition (T0). The cells were treated by addition of freshly prepared
samples:
TA in the media, in ten-fold concentrations ranging from 0.1 µg/mL to 1
mg/mL(four wells per concentration),
TA-NP suspensions in media, of each polymer (PDLLA, PLGA, and 4.8%
mPEG PLGA), containing various amount of TA as above, with various
concentrations of NPs based on the loading value (four wells per certain
amount of TA),
empty NP suspension in media, of each polymer, containing an equivalent
amount of NPs as used in the TA-NP suspesions above (four wells per certain
amount of NPs).

37
Cells without any treatment other than an addition of 100 µL of media were used as
controls. Following samples addition, the cells were incubated for an additional 24
hours and the assay is terminated by adding 100 µL of MTT solution (1 mg/mL in
appropriate media). The cells combined with an MTT solution were then incubated
for 1 hour at 37ºC. After the precipitation of purple fomazan, the MTT supernatant
was removed and 100 µL of DMSO added to dissolve the purple formazan product.
The absorbance of dissolved product was determined using a multiwell microplate
reader 3550 (BioRad, USA) at a wavelength of 595 nm. The absorbance was
corrected by reagents in the absence of cells and experimental samples. The toxicity
assay was replicated three times. The toxicity of the samples is expressed as the
percentage of cell viability in comparison to control cells. The control cells were
assumed to be 100% viable.
2.3.9 Statistical analysis
All results of triplicate samples in each study are presented as mean ± SD,
representing descriptive statistics. The statistical analysis for in vitro toxicity study
was carried out using InStat® computer software. Unpaired t test was used to analyse
the significance of the differences between TA and NPs. A significant difference was
considered if the p value was less than 0.05 (p<0.05).

38
RESULTS AND DISCUSSION
This study was conducted with two main objectives. The first was to develop
polymeric NP formulations for delivery of TA, which would provide: low toxicity,
sustained release properties and prolonged stability of TA. The second objective was
to assess the toxicity of TA loaded NPs (TA NPs) compared with TA alone upon
exposure to BALB/c 3T3 (fibroblasts) and ARPE 19 (human retinal pigment
epithelial) cell lines. Since conventional TA administration is known causing
potential side effects, it is expected that the NPs developed for TA administration can
minimize potential side effects of TA by providing a controlled drug delivery to a
target site. There have been concerns on the toxicity of NPs themselves, therefore, it
is essential to study the toxicity of NP formulations with and without incorporation
of TA. The ultimate aim of this study was to develop a safe and acceptable polymeric
NP formulation for TA delivery that could have potential in ocular delivery.
3.1 HPLC assay validation
To determine the TA concentration, a HPLC assay developed by Gupta 74 was
adopted with some modification. It was found that the original mobile phase
containing ACN:20 mM phosphate buffer pH 4.2 in the proportion of 32:68 with a
flow rate of 3 mL/min could not produce a distinct peak of TA. In order to achieve
an optimum HPLC assay, a modification was made to reduce the wavelength to 242
nm, change the proportion of mobile phase to ACN: 20 mM phosphate buffer pH 4.2
50:50 and alter the flow rate to 1.5 mL/min. The internal standard was excluded
since the assay recovery was satisfactory with external standards.
The linearity of UV detector response was assessed for calibration curves in two
different media: ACN:mobile phase 1:1 and PBS-NaN3. The former was the medium
for the analysis of TA loading within NPs, and the latter was the release medium in
the in vitro-TA-release study. Sodium azide (NaN3) was added as a preservative in
the release media with the concentration of 0.05% to prevent microbial growth.

39
The range of TA concentration in the media of ACN:mobile phase 1:1 was from 1.03
µg/mL to 41.20 µg/mL, while in the release media, the concentration ranged from
0.264 µg/mL to 26.4 µg/mL. Correlation coefficient r2, an indication of the fitness of
linear regression, was calculated for the calibration curve of area under the curve
(AUC) against the TA concentration in both media. The detector’s response was
found to be linear with r2 of 0.9999 and 1 for ACN:mobile phase 1:1 media and PBS-
NaN3, respectively. This suggests that the concentration of TA in the samples can be
determined against the standard in the concentration range of calibration curve.
Representative calibration curves are presented in Figure 3.1 and 3.2.
y = 23.675x - 1.8577
R2 = 0.9999
0
200
400
600
800
1000
1200
0 10 20 30 40
Concentration (g/mL)
AU
C (
mA
u*s
ec)
Figure 3.1: Standard curve for TA in ACN:mobile phase 1:1. TA was injected into HPLC in the range concentration of 1.03 µg/mL to 41.20 µg/mL, in 20µL injection volumes. Data is a representative of three independent calibration curves. r2 was calculated by Microsoft Excel™ software.

40
y = 24.922x - 0.06
R2 = 1
0
100
200
300
400
500
600
700
0 5 10 15 20 25 30
Concentration (mg/ml)
AU
C (
mA
u*s
ec)
Figure 3.2: Standard curve for TA in PBS-NaN3. TA was injected into HPLC in the range concentration of 0.264 µg/mL to 26.4 µg/mL, in 20µL injection volumes. Data is a representative of three independent calibration curves. r2 was calculated by Microsoft Excel™ software.
System precision for the HPLC assay is shown in Table 3.1. Six injections (20 µL
volumes) were carried out at the concentration of 1.03 µg/mL and 30.90 µg/mL with
ACN:mobile phase 1:1 as the medium. The relative standard deviation (RSD) of the
injections was obtained below the nominal acceptable level of 2%. In the release
medium, six injections of the concentration of 0.53 µg/mL and 5.27 µg/mL produced
RSD of 0.53% and 0.08%, respectively, indicating that the injection of assay was
precise for TA analysis.
Table 3.1: System precision of the HPLC method for TA determination
(a) 1.03 µg/mL of TA solution in ACN: mobile phase 1:1
Injection numbers AUC (mAu*sec)
1 26.78
2 27.23
3 27.78
4 26.95
5 27.15
6 27.14
Average 27.17
RSD (%) 1.25

41
(b) 30.90 µg/mL of TA solution in ACN:mobile phase 1:1
Injection numbers AUC (mAu*sec)
1 788.93
2 759.54
3 759.19
4 757.91
5 764.13
6 756.31
Average 764.33
RSD (%) 1.61
(c) 0.53 µg/mL of TA in PBS-NaN3
Injection numbers AUC (mAu*sec)
1 13.08
2 13.21
3 13.11
4 13.03
5 13.20
6 13.11
Average 13.12
RSD (%) 0.53
(d) 5.27 µg/mL of TA in PBS-NaN3
Injection numbers AUC (mAu*sec)
1 129.85
2 129.94
3 130.09
4 130.04
5 130.13
6 129.98
Average 130.00
RSD (%) 0.08

42
The accuracy of the HPLC assay was studied by examining the levels of recovery of
TA in the presence of empty NPs made of three different polymers. The recovery of
TA was investigated for determination of TA loading to assess the interference of the
NP matrix in the assay. The results are presented in table 3.2.
Table 3.2: Recovery of TA in the presence of empty NPs in mobile phase
(a) PDLLA NPs as the empty NPs
Initial concentration
(µg/mL)
Measured
concentration (µg/mL)
Recovery (%)
2.56 2.70 105.20
5.13 4.99 97.22
10.26 9.93 96.81
20.52 20.27 98.79
30.78 30.25 98.28
41.04 40.47 98.62
Mean ± SD 99.15 ± 2.79
Regression analysis
Test Results
Slope 0.9849
Intercept -0.0069
Correlation coefficient 0.9999
95% CI slope 0.9738-0.9960
95% CI Y-intercept -0.5187 to 0.5050

43
(b) PLGA NPs as the empty NPs
Initial concentration
(µg/mL)
Measured
concentration (µg/mL)
Recovery (%)
2.56 2.67 103.97
5.13 5.07 98.85
10.26 10.09 98.38
20.52 20.15 98.20
30.78 30.49 99.06
41.04 40.91 99.68
Mean ± SD 99.69 ± 1.97
Regression analysis
Test Results
Slope 0.9941
Intercept -0.00885
Correlation coefficient 0.9999
95% CI slope 0.9813-1.0070
95% CI Y-intercept -0.6809 to 0.5036
(c) mPEG PLGA as the empty NPs
Initial concentration
(µg/mL)
Measured
concentration (µg/mL)
Recovery (%)
2.56 2.69 104.89
5.13 5.14 100.23
10.26 9.97 97.20
20.52 20.21 98.49
30.78 30.55 99.24
41.04 40.78 99.38
Mean ± SD 99.91 ± 2.41

44
Regression analysis
Test Results
Slope 0.9921
Intercept -0.0267
Correlation coefficient 0.9999
95% CI slope 0.9798 – 1.0045
95% CI Y-intercept -0.5961 to 0.5427
In the presence of empty PDLLA NPs, the 95% confident interval (CI) of the slope
was 0.9738-0.9960, not including 1 (Table 3.2.a). It indicates that the TA was not
totally recovered by the assay method in the presence of the PDLLA matrix.
However, the average of recovery was in the value of 99.69 ± 1.97%, with a slope
and the correlation coefficient of 0.9849 and 0.9999, respectively. The 95% CI of Y-
intercept goes through zero, therefore, this level of recovery was considered
acceptable. Other tables, which show the recovery levels in the presence of empty
PLGA NPs (Table 3.2 (b)) and empty 4.8% mPEG-PLGA NPs (Table 3.2 (c)),
revealed 95% CI of slope including 1 and 95% CI of Y-intercepts going through
zero. These data indicate that the assay is unbiased and produces a satisfactory
recovery.
The recovery of TA in the release media was not carried out since there was no
extraction method prior to TA determination by HPLC in the release study.
Moreover, the release study was conducted using the dialysis bags and the samples
were taken from the media outside the dialysis bag. The molecular weight cut-off
(MWCO) of the dialysis bag was about 12,400 Da, therefore it would allow TA to
freely pass through, while the NPs, whose size is much larger than MWCO, would be
likely to be retained inside the bag.
In order to assess the sensitivity of the assay, the theoretical minimum LOD and
minimum LOQ were determined both in the loading determination and in the release
study. The theoretical LOD and LOQ for loading determination, which includes the
extraction process of three different types of NPs, were approximately 0.107 µg/mL
and 0.336 µg/mL, respectively (Table 3.3). In the release study, the HPLC assay for

45
TA determination was theoretically able to detect TA at levels above 0.053 µg/mL,
and to provide accurate quantification of TA above 0.180 µg/mL. A sample of LOD
and LOQ calculation is shown in appendix 1.
Table 3.3: LOD/LOQ of the HPLC assay for TA determination
LOD (µg/mL) LOQ (µg/mL)
Loading determination:
- PDLLA NPs
- PLGA NPs
- mPEG PLGA NPs
0.090
0.094
0.118
0.299
0.315
0.394
Release study: 0.053 0.180
Selectivity in the HPLC assay development was assessed to determine that the peaks
can be well-separated and the purity factor of the drug analysed is within the
calculated threshold. The typical HPLC chromatograms of TA and degradation
products are illustrated in Figure 3.3 from (a) to (f).
Figure 3.3: (a) Typical HPLC chromatogram of TA standard in ACN:mobile phase 1:1

46
Figure 3.3: (b) Typical HPLC chromatogram of extraction of empty NPs in ACN: mobile phase 1:1 as blank
Figure 3.3: (c) Typical HPLC chromatogram of TA extraction from loaded NPs in ACN: mobile phase 1:1

47
Figure 3.3: (d) Typical HPLC chromatogram of TA standard in PBS-NaN3
Figure 3.3: (e) Typical HPLC chromatogram of TA (peak 1) and degradation product (peak 2) in PBS-NaN3 at 37°C over 24 hours
2
1

48
Figure 3.3: (f) Typical HPLC chromatogram of PBS-NaN3 (release medium)
The retention time of TA and its degradation product (which is speculated to be 6β-
hydroxyltriamcinolone72) were approximately 3.7 and 2.9 minutes respectively,
showing that they were completely separated (Figure 33.(e)) In the release medium,
the buffer substances and the sodium azide (NaN3, a preservative) eluted faster than
TA (at 1.6 minutes), suggesting that those compounds did not interfere with the TA
analysis. Traces of PVA, in the loading determination were not detectable at a UV
wavelength of 242 nm. In addition, the purity factor of the TA peak calculated by the
Chemstation software package was within the calculated thresholds, indicating that
the peak of TA was free from interference (see appendix 2).
3.2 Formulations of TA loaded NPs (TA-NPs)
The main objective of the current study was to develop NP formulations for TA
which provide low toxicity, sustained release properties and prolonged stability. This
study involved investigation of three different types of polymer, i.e poly- (D.L.
lactide) (PDLLA), poly-(D,L,lactide-co-glycolide) (PLGA) and methoxy-poly
ethylene-glycol-poly(D,L,lactide-co-glycolide) (mPEG PLGA) containing 4.8%
polyethyleneglycol (PEG), for preparation of NPs. The solvent diffusion method was
initially chosen to produce NPs, considering that it can produce particles sized
around 200 nm using non toxic solvents and the production can be conducted in mild
conditions 47-50, 57.

49
In the solvent diffusion method, acetonic solution containing polymer (for empty
NPs) and polymer plus TA (for TA loaded NPs) was added dropwise into the PVA
solution under mild agitation. The mixture of those solutions appeared to be opaque,
since the NPs rapidly precipitated.
Table 3.4: Physical characteristics of empty NPs made by solvent diffusion method
Properties PDLLA NPs PLGA NPs mPEG PLGA NPs
Particle size (nm) 284.93 ± 25.46 274.57 ± 5.09 212.77 ± 3.67
Polydispersity index 0.09 ± 0.02 0.07 ± 0.01 0.04 ± 0.01
Zeta Potential (mV) -28.20 ± 3.24 -33.70 ± 0.90 -35.17 ± 3.47
Yield (%) 72.98 ± 8.71 84.38 ± 1.09 90.21 ± 1.91
All particles produced by the solvent diffusion exhibited small size, around 250 nm,
with negatively charged surfaces (Table 3.4). About 80% yield was achieved by the
solvent diffusion technique for empty NPs. The properties varied with nature of the
polymers. Since the solvent diffusion technique involves a rapid diffusion of acetone
into water, this rate of diffusion would affect the rate of formation and precipitation
of NPs. From the results, it can be seen that the increased hydrophobicity of the
polymer correlated with increased size.
Based on the properties obtained from empty NPs, incorporation of TA into NPs was
carried out. Initially, it was found that the level of TA incorporated into PDLLA NPs
appeared to be good (Table 3.5).

50
Table 3.5: Results of initial study of TA incorporation into PDLLA NPs by solvent diffusion
Batch No. Particle
size (nm)
Polydispersity
index
Yield (%) Loading
(%)
Entrapment
efficiency
(%)
6 240.8 0.01 72.03 31.41 67.90
9 242.9 0.10 69.89 31.87 66.69
17 219.9 0.06 75.28 14.5 65.80
However, further investigation, conducted on the morphological characteristics of
TA-PDLLA NPs, revealed that the NP suspension contained a mixture of TA-
PDLLA NPs and TA crystals. Figure 3.4 shows a scanning electrone microscopy
(SEM) image of TA crystals found in the initial TA-PDLLA NPs sample. We
hypothesised that, although the polymer was able to form NPs immediately after
being introduced to the PVA solution, TA was less entrapped in NPs during diffusion
process, instead, most of TA precipitated in the PVA solution. This led to artificially
high entrapment efficiency. To test this hypothesis, the next study was carried out.
Figure 3.4: SEM of TA crystal in TA-PDLLA NPs.

51
Turbidity study
To assess the order of precipitation between polymer and TA during formation of
NPs in the solvent diffusion method, the turbidity study was conducted on two types
of polymer: PDLLA and mPEG-PLGA. The former has the most hydrophobic
characteristics whereas the later is the most hydrophilic polymer used in this study.
In this turbidity study, the experiment was designed similarly as for preparing the
NPs, except that the polymer-acetonic solution and TA-acetonic solution were
poured individually into PVA solution. The precipitation (turbidity of solution) was
determined at a UV wavelength of 400 nm. A mixture of acetone and PVA solution
was used as blank. Figure 3.5 shows that the polymers precipitated immediately after
being introduced to the PVA solution, while TA took about five minutes to be
precipitated. This suggests that only a small amount of TA might be incorporated
into NPs due to the rapid precipitation of the polymers.
0
1
2
3
4
5
0 5 10 15 20 25 30
Time (min)
Abs
orb
ance
(at
400
nm
)
TA PDLLA mPEG PLGA
Figure 3.5: Turbidity profile of TA and polymers. The absorbance was evaluated at wavelength of 400 nm in certain time points during solvent diffusion process. The mixture of 0.6% PVA solution and acetone was used to correct the background
Modification of solvent diffusion method
The solvent diffusion method was modified to separate the TA crystals from TA-NPs
produced by solvent diffusion process. In order to separate NPs from TA crystals, the
NP suspension containing TA crystals was left on the bench for about 30 minutes.
The settled TA crystals were then separated from NP suspension prior to
centrifugation of NP suspension at 12,000 rpm for 20 minutes. The physical
characteristics of the NPs prepared by this optimised method are shown in Table 3.6.

52
Table 3.6: Properties of TA-loaded- NPs made by the optimised solvent diffusion method
Properties TA-PDLLA NPs TA-PLGA NPs TA-mPEG
PLGA NPs
Particle size (nm) 256.7 ± 2.54 279.0 ± 19 233.63 ± 4.29
Polydispersity index 0.057 ± 0.005 0.040 ± 0.020 0.090 ± 0.001
Zeta Potential (mV) -30.53 ± 0.95 -33.06 ± 2.31 -30.05 ± 1.20
Yield (%) 50.08 ± 4.27 60.04 ± 5.89 82.73 ± 1.90
Loading (%) 1.57 ± 0.73 2.47 ± 0.34 2.94 ± 0.25
Entrapment efficiency (%) 4.23 ± 1.79 7.91 ± 1.07 12.3 ± 0.87
In terms of the characterisation of NPs, the smallest particles were obtained in TA-
mPEG PLGA NPs (around 230 nm), followed by TA-PLGA NPs and TA-PDLLA
NPs (around 260 nm). The small size of TA-mPEG PLGA was due to the PEG
content on mPEG PLGA. Beletsi et al 99 and Avgoustakis et al 54 suggest that PEG
has the ability to mediate the association of polymer molecules during the formation
of NPs. In terms of entrapment efficiency and loading value, we revealed that the
entrapment efficiency and the load value of TA-NPs, especially TA-PDLLA NPs,
were extremely low, around 1% and 5% respectively. However, the result of TA-
PDLLA NPs particle size is in agreement with other study conducted by Liu et al 50.
They demonstrated that the particle size of PLA NPs of 231.5 ± 32.1 nm was
obtained with the same polymer concentration (2%). Berton et al 100, in their study of
incorporating oligonucleotide complex (a hydrophobic drug model) into PDLLA,
revealed that the actual loading of only 2.91% w/w could be obtained for a
theoretical loading of 10%. The failure to entrap the drug was possibly due to the
rapid diffusion of the acetone to outer phase. As the mechanism of this method
involves diffusion of solvent, 48, 58, 101, a rapid diffusion may cause the polymer to
solidify rapidly. Due to the poor solubility of the hydrophobic polymers in aqueous
stabiliser solution, polymer aggregation may occur at the same time with NP
formation, resulting in a low level of yield of NPs. Leo et al 102 also suggested that a
substantial decrease of yield with the increased of drug loading may be due to the
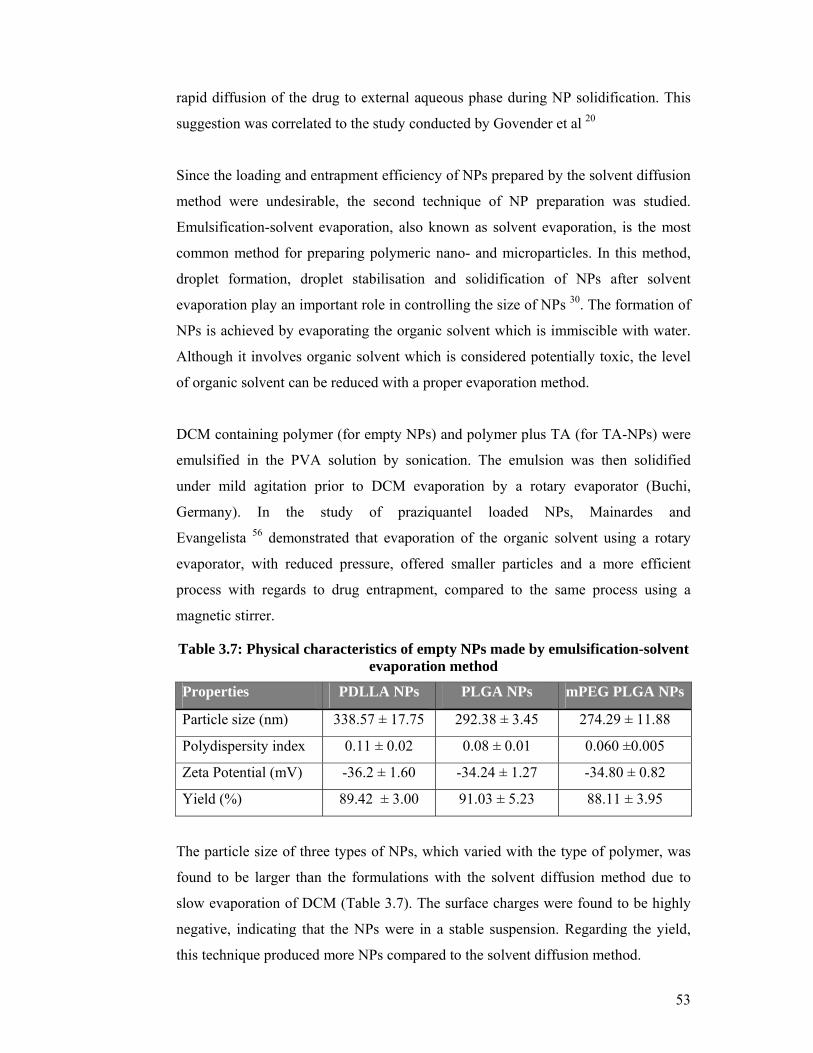
53
rapid diffusion of the drug to external aqueous phase during NP solidification. This
suggestion was correlated to the study conducted by Govender et al 20
Since the loading and entrapment efficiency of NPs prepared by the solvent diffusion
method were undesirable, the second technique of NP preparation was studied.
Emulsification-solvent evaporation, also known as solvent evaporation, is the most
common method for preparing polymeric nano- and microparticles. In this method,
droplet formation, droplet stabilisation and solidification of NPs after solvent
evaporation play an important role in controlling the size of NPs 30. The formation of
NPs is achieved by evaporating the organic solvent which is immiscible with water.
Although it involves organic solvent which is considered potentially toxic, the level
of organic solvent can be reduced with a proper evaporation method.
DCM containing polymer (for empty NPs) and polymer plus TA (for TA-NPs) were
emulsified in the PVA solution by sonication. The emulsion was then solidified
under mild agitation prior to DCM evaporation by a rotary evaporator (Buchi,
Germany). In the study of praziquantel loaded NPs, Mainardes and
Evangelista 56 demonstrated that evaporation of the organic solvent using a rotary
evaporator, with reduced pressure, offered smaller particles and a more efficient
process with regards to drug entrapment, compared to the same process using a
magnetic stirrer.
Table 3.7: Physical characteristics of empty NPs made by emulsification-solvent evaporation method
Properties PDLLA NPs PLGA NPs mPEG PLGA NPs
Particle size (nm) 338.57 ± 17.75 292.38 ± 3.45 274.29 ± 11.88
Polydispersity index 0.11 ± 0.02 0.08 ± 0.01 0.060 ±0.005
Zeta Potential (mV) -36.2 ± 1.60 -34.24 ± 1.27 -34.80 ± 0.82
Yield (%) 89.42 ± 3.00 91.03 ± 5.23 88.11 ± 3.95
The particle size of three types of NPs, which varied with the type of polymer, was
found to be larger than the formulations with the solvent diffusion method due to
slow evaporation of DCM (Table 3.7). The surface charges were found to be highly
negative, indicating that the NPs were in a stable suspension. Regarding the yield,
this technique produced more NPs compared to the solvent diffusion method.

54
Incorporating of TA into NPs was also carried out by solvent evaporation method.
As expected, the particle size of TA-NPs was larger than that of empty NPs.
Table 3.8: Properties of TA-loaded- NPs made by emulsification-solvent evaporation method
Properties TA-PDLLA
NPs
TA-PLGA
NPs
TA-mPEG PLGA
NPs
Particle size (nm) 360.35 ± 1.91 326.85 ± 0.35 291.35 ± 4.03
Polydispersity index 0.03 ± 0.02 0.030 ± 0.005 0.06 ± 0.03
Zeta Potential (mV) -33.25 ± 8.56 -32.85 ± 6.43 -32.15 ± 2.76
Yield (%) 79.39 ± 1.86 92.30 ± 2.06 87.61 ± 4.05
Loading (%) 6.09 ± 0.85 12.00 ± 0.43 12.69 ± 0.85
Entrapment efficiency (%) 29.57 ± 4.55 67.26 ± 4.11 63.06 ± 1.69

55
(a)
0
20
40
60
80
100
Yield Loading Entrapment Efficiency
Val
ue
(%)
TA-PDLLA NPs TA-PLGA NPs TA-mPEG PLGA NPs
(b)
0
20
40
60
80
100
Yield Loading Entrapmentefficiency
Val
ue
(%)
TA-PDLLA NPs TA-PLGA NPs TA-mPEG PLGA NPs
Figure 3.6: Comparison of yield, loading and entrapment efficiency values of three types of NPs. The NPs were made by the optimised solvent diffusion method (a) and solvent evaporation (b). The data is presented as mean ± SD (n=3). The error bars represent standard deviation of triplicate samples.
Although the particle size and zeta potential showed expected values, loading and
entrapment efficiency of TA-NPs made by solvent diffusion method were out of
expectation (Figure 3.6 (a)). The low drug entrapment efficiency and loading could
be due to the rapid diffusion of acetone into water, which led to the rapid
precipitation of polymers. Based on the obtained data, we can conclude that, when
NPs are prepared by solvent diffusion method, a small quantity of the drug could be
encapsulated leading to low entrapment efficiency. In other words, the solvent

56
diffusion method is only capable for producing NPs with a low entrapment
efficiency.
In solvent evaporation method, TA-NPs with substantial higher loading values could
be achieved (Figure 3.6 (b)). The high drug loading and entrapment efficiency were
achieved in both TA-mPEG PLGA NPs and TA-PLGA NPs. The yield of NPs was
greatest with TA-PLGA NPs and TA-mPEG PLGA, but less with TA-PDLLA NPs.
The incomplete recovery for TA-mPEG PLGA was due to the limitation of
purification, in which the speed of centrifugation was not high enough to settle the
mPEG PLGA NPs, resulting in loss of NPs during supernatant (PVA) removal. The
purification of NPs will be further discussed as per section 3.5. Low levels of
loading, entrapment efficiency as well as the yield of TA-PDLLA NPs were due to
the formation of TA crystals, microparticles and polymer aggregation, which were
separated from NPs prior to centrifugation.
The morphological characteristics of TA-NPs prepared by solvent evaporation were
examined. Field emission scanning electron microscopy (FESEM) was used to
capture images of TA-NPs.
(a)

57
(b)
(c)
Figure 3.7: FESEM image of TA-NPs. TA-NPs were prepared by solvent evaporation method. (a) TA-PDLLA NPs, (b) TA-PLGA NPs, (c) TA-mPEG PLGA NPs. Images were taken at 15,000 magnification.
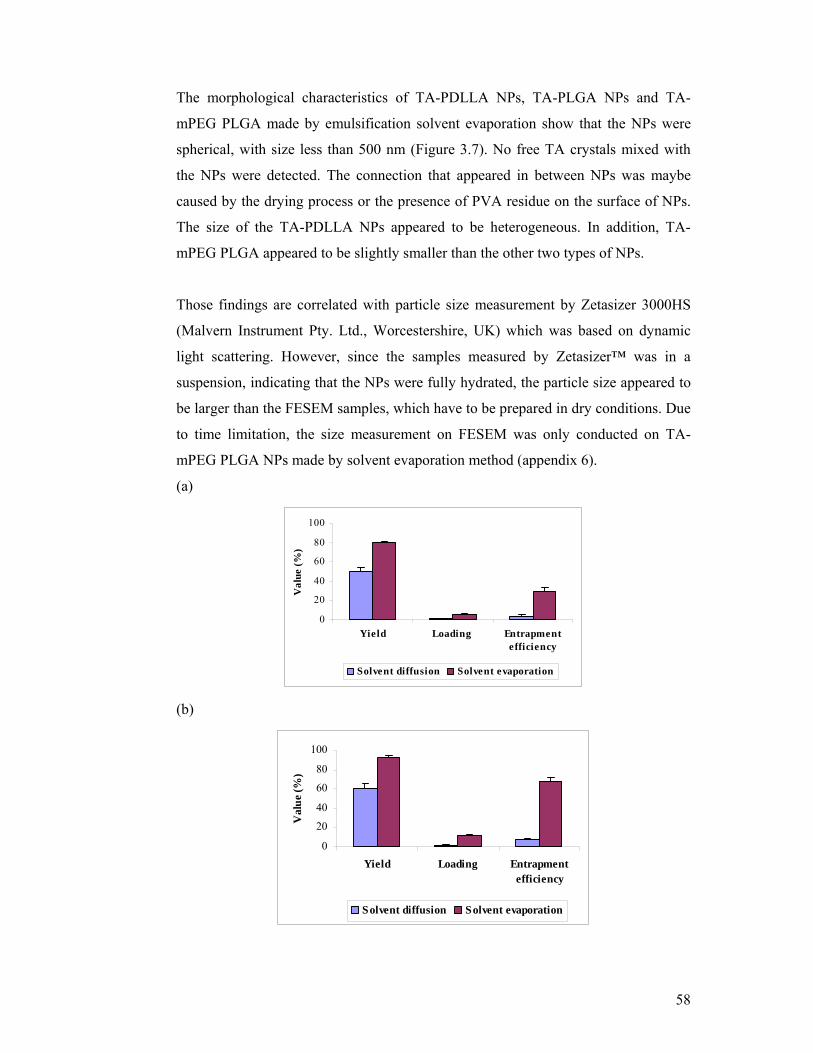
58
The morphological characteristics of TA-PDLLA NPs, TA-PLGA NPs and TA-
mPEG PLGA made by emulsification solvent evaporation show that the NPs were
spherical, with size less than 500 nm (Figure 3.7). No free TA crystals mixed with
the NPs were detected. The connection that appeared in between NPs was maybe
caused by the drying process or the presence of PVA residue on the surface of NPs.
The size of the TA-PDLLA NPs appeared to be heterogeneous. In addition, TA-
mPEG PLGA appeared to be slightly smaller than the other two types of NPs.
Those findings are correlated with particle size measurement by Zetasizer 3000HS
(Malvern Instrument Pty. Ltd., Worcestershire, UK) which was based on dynamic
light scattering. However, since the samples measured by Zetasizer™ was in a
suspension, indicating that the NPs were fully hydrated, the particle size appeared to
be larger than the FESEM samples, which have to be prepared in dry conditions. Due
to time limitation, the size measurement on FESEM was only conducted on TA-
mPEG PLGA NPs made by solvent evaporation method (appendix 6).
(a)
0
20
40
60
80
100
Yield Loading Entrapmentefficiency
Val
ue (
%)
Solvent diffusion Solvent evaporation
(b)
0
20
40
60
80
100
Yield Loading Entrapmentefficiency
Val
ue
(%)
Solvent diffusion Solvent evaporation

59
(c)
0
20
40
60
80
100
Yield Loading Entrapmentefficiency
Val
ue (
%)
Solvent diffusion Solvent evaporation
Figure 3.8: TA-NPs characterisation. The column chart illustrates the comparison of yield, loading and entrapment efficiency obtained in TA-NPs made by solvent diffusion and solvent evaporation methods (a) TA-PDLLA NPs, (b) TA-PLGA NPs, (c) TA-mPEG PLGA NPs. Data is presented as mean ± SD (n=3).
It is evident that in general, the solvent diffusion method can reduce the size to
approximately 200 nm even less 47, 49, 50, 103. In the solvent diffusion method, the
particle size of TA-PDLLA NPs was 256.7 ± 2.5 nm, whereas in the solvent
evaporation the TA-PDLLA NPs sized around 360.4 ± 1.9 nm. The large particles
(>200 nm) formed was possibly due to the combination of hydrophobicity of
polymer and a relatively high polymer concentration. Zeta potentials of
approximately -30 mV were found in both method, indicating that the NPs were
well-dispersed and the suspension was stable. Solvent diffusion method produced a
low yield value with TA-PDLLA NPs (Figure 3.8). This was due to the formation of
aggregates and microparticles during the preparation process, which were settled and
removed prior to purification. The entrapment efficiency was found to be very low
with the NP preparation by the solvent diffusion method. This may be due to the
rapid diffusion of organic solvent resulting in very rapid solidification of the polymer
(PDLLA). However, solvent evaporation can produce TA-PDLLA NPs with
relatively higher entrapment efficiency.
The similar patterns, which show that solvent evaporation was superior than solvent
diffusion, were also shown in TA-PLGA NPs and TA-mPEG PLGA NPs.
To determine the distribution of TA on the preparation of NPs, a mass balance study
was conducted for all types of NPs (Table 3.9). The proportion of TA in the

60
supernatant was similar in all types of NPs, indicating that the quantity of TA in
supernatant was controlled by the solubility of TA. Correlating with the result on
entrapment efficiency, it was found that the greatest amount of TA precipitated was
in TA-PDLLA NPs due to the poor entrapment of NPs.
Table 3.9: Distribution of TA inside NPs, in supernatant and precipitate in emulsification-solvent evaporation method
Type of NPs Distribution of TA (%)
Inside NPs In supernatant Precipitate
TA-PDLLA NPs 37.01 ± 0.59 4.30 ± 0.45 54.62 ± 0.20
TA-PLGA NPs 78.52 ± 0.44 4.31 ± 0.21 12.91 ± 0.43
TA- mPEG-PLGA NPs 80.85 ± 0.28 4.09 ± 0.40 14.26 ± 0.61
3.2.1 NP purification by high speed centrifugation
Purification of the NPs was analysed to remove potentially toxic impurities, such as
traces of organic solvents, aggregates, surfactants or stabilisers. Polyvinyl alcohol
(PVA) should be removed from the system in the preparation of NPs, since it is
considered to be undesirable. Although PVA is reported as an effective stabiliser,
which can assist to produce NPs with reduced size and high entrapment
efficiency 36, 104, it is also reported by other investigator that PVA is a suspected
potential carcinogen 105 .
Various methods can be conducted to purify the NPs such as tangential flow
filtration, diafiltration centrifugal devices (DCD) and high speed
centrifugation 62. High speed centrifugation was selected as the method of
purification for this study since it offered a simple and effective way to remove PVA.
This method was carried out by centrifuging the NP suspensions at 12,000 rpm for
20 minutes at room temperature followed by decanting the PVA-containing-
supernatant.
We adopted the method reported by Dalwadi et al 62 to determine the level of PVA in
the system before and after purification, in order to analyse the efficiency of removal.

61
The method is based on the complexation of two adjacent hydroxyl groups of PVA
and an iodine molecule, in the presence of boric acid. The green coloured complex
produces an intense absorbance band in the visible spectrum region at a wavelength
of 690 nm. Figure 3.9 shows a representative of a calibration curve which was used
to detect and quantify the amount of PVA remaining in the supernatant. A regression
coefficient (r2) of 0.9964 was obtained, indicating that the absorbance was found to
be linear with the concentrations of PVA, ranging from 19 to 67 µg/mL. A blank of
the reagents excluding the PVA was used as zero concentration of PVA.
y = 0.0264x - 0.0016
R2 = 0.9964
0
0.5
1
1.5
2
0 10 20 30 40 50 60 70
Concentration (g/mL)
Abs
orb
ance
Figure 3.9: A representative of calibration curve of PVA determination. The curve was plotted on absorbance at 690 nm against PVA concentration in the range concentration of 19 to 67 µg/mL.
Although high speed centrifugation offers satisfactory results in removing the PVA
(Table 3.10), PVA still could not be 100% removed from the system. This finding is
corresponding with the study reported by Murakami et al 48, 106 which revealed that
small amount of PVA appeared to be attached on the surface of NPs as a result of
hydrophobic bonding.

62
Table 3.10 : PVA removal on purification of NPs by high speed centrifugation
Type of NPs PVA removed (%)
Solvent diffusion method Solvent evaporation method
TA-PDLLA NPs 94.28 ± 0.97 95.63 ± 0.37
TA-PLGA NPs 96.62 ± 0.20 96.61 ± 1.83
TA-mPEG PLGA NPs 96.66 ± 0.62 95.51 ± 2.03
Effect of purification on particle size
It is imperative to ensure that the method of purification does not affect the physical
characteristics of NPs. To investigate the effect of purification on particle size, the
particle size of the NPs before and after purification was analysed (Table 3.11).
Table 3.11: Particle size of the NPs before and after purification
Type of NPs Before purification After purification
Particle size
(nm)
Polydispersity
index
Particle size
(nm)
Polydispersity
index
PDLLA NPs 307.87 ± 4.28 0.10 ± 0.02 324.77 ± 1.44 0.12 ± 0.02
PLGA NPs 333.63 ± 1.33 0.07 ± 0.03 355.97 ± 2.12 0.06 ± 0.03
mPEG-PLGA
NPs
230.80 ± 7.92 0.09 ± 0.02 233.63 ± 4.29 0.03 ± 0.02
A slight increase in particle size was found after purification, to the extent that there
was no difference on particle size observed on mPEG-PLGA NPs. Polydispersity
index of three different types of NPs appeared to be similar before and after
purification. Therefore, the effect of high speed centrifugation is negligible,
suggesting that high speed centrifugation is an effective purification methods for
NPs.
3.2.2 Release characteristics of TA-NPs
To investigate the characteristics of TA-NPs in providing sustained release, an in
vitro release study of the NPs was conducted by dialysis bag diffusion method
designed as per section 2.3.6. Sodium azide (NaN3, 0.05%) was added as a
preservative in the release medium.

63
TA solubility in the release media was investigated prior to the release study, to
determine the maximum concentration for maintenance sink conditions in the
system. The design of solubility study can be seen on section 2.3.6. In this solubility
study it was found that the solubility of TA was 6.58 ± 1.20 µg/mL over 8 hours, and
27.40 ± 0.40 µg/mL over 24 hours (appendix 7). In the release study, since the
medium (PBS-NaN3) was replaced with the fresh one every hour over 8 hours and
every 24 hours over 96 hours (in sampling time), it can be sure that the sink
condition was achieved and TA solubility issues did not contribute to the release of
TA from NPs .
To develop a control, two TA suspensions in water containing a known amount of
TA in different particle size, were used to examine the release profiles of free TA.
Due to the limitations of instrumentation, the controls were only designed in micro-
size. The first control was made by a similar solvent evaporation procedure so as to
make the NPs, excluding the polymer and PVA. As can be predicted, this method
produced a TA suspension with the microparticles sized around 5.34 ± 0.25 μm. In
an attempt to reduce the size, the second control was established by sonicating the
TA suspension for 5 minutes at room temperature. The size was found to be smaller
than the first control, i.e. 2.86 ± 0.62 μm.
Although it was not possible to design a control group which has the same particle
size as the NP samples without an excipient or a stabiliser, it can be seen that the
release of TA was more rapid with the reduction of size (Figure 3.10). It was
speculated that if we can design the control group with nano-sized particles, the
release of TA would be much faster.

64
0
20
40
60
80
100
0 24 48 72 96
Time (h)
Cum
ulat
ive
perc
enta
ge
of T
A r
elea
sed
(%)
TA control 2 TA control 1
Figure 3.10: Release profile of TA control groups over 96 hours. Release study was conducted at 37°C using a dialysis-diffusion bag method in the PBS-NaN3 as the release media. TA control 1 was prepared by the same method of solvent evaporation for NPs (5.34 ± 0.25 μm). TA control 2 was prepared by sonicating TA in water for 5 minutes in the absence of stabiliser (2.86 ± 0.62 μm). Both control groups containing the same concentration of TA as in the NPs. Data is presented as mean ± SD (n=3).
Nevertheless, because the system was not supported by any surfactants and, the
particles of TA in the control groups aggregated over time, resulting in the smaller
surface area, and hence the rate of release was reduced.
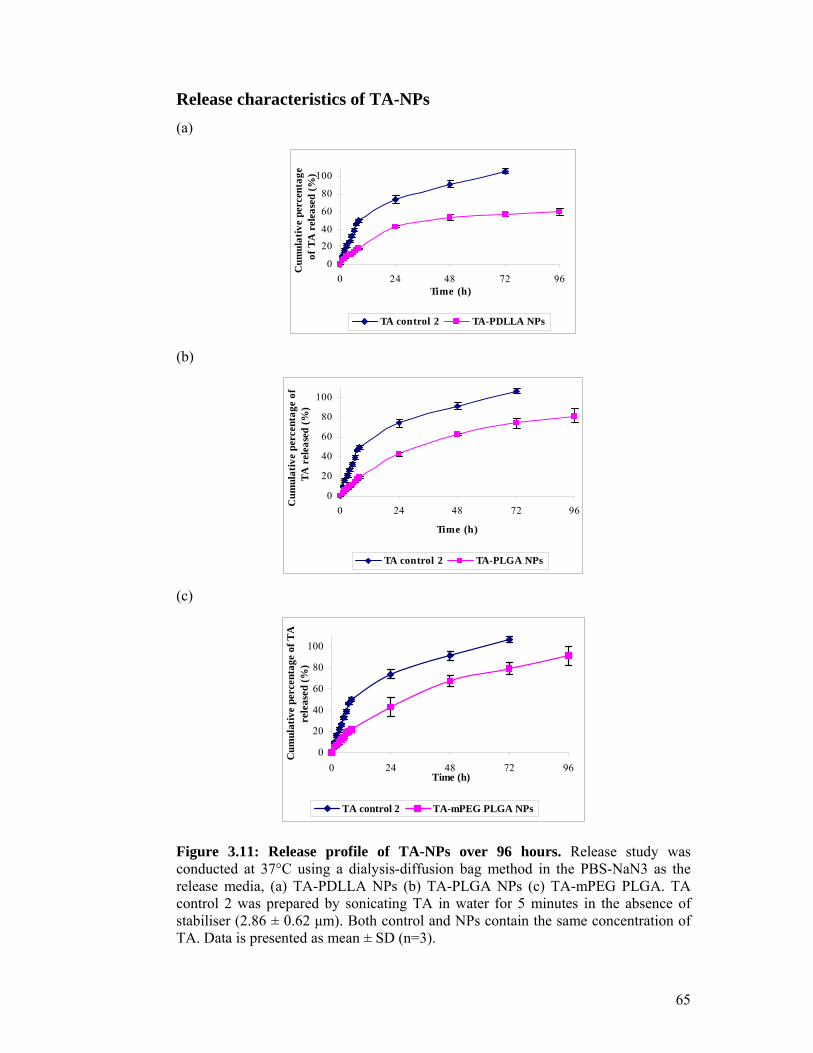
65
Release characteristics of TA-NPs
(a)
0
20
40
60
80
100
0 24 48 72 96Time (h)
Cum
ulat
ive
perc
enta
ge
of T
A r
elea
sed
(%)
TA control 2 TA-PDLLA NPs
(b)
0
20
40
60
80
100
0 24 48 72 96
Time (h)
Cum
ulat
ive
perc
enta
ge o
f T
A r
elea
sed
(%)
TA control 2 TA-PLGA NPs
(c)
0
20
40
60
80
100
0 24 48 72 96Time (h)
Cum
ulat
ive
perc
enta
ge o
f T
Are
leas
ed (
%)
TA control 2 TA-mPEG PLGA NPs
Figure 3.11: Release profile of TA-NPs over 96 hours. Release study was conducted at 37°C using a dialysis-diffusion bag method in the PBS-NaN3 as the release media, (a) TA-PDLLA NPs (b) TA-PLGA NPs (c) TA-mPEG PLGA. TA control 2 was prepared by sonicating TA in water for 5 minutes in the absence of stabiliser (2.86 ± 0.62 μm). Both control and NPs contain the same concentration of TA. Data is presented as mean ± SD (n=3).
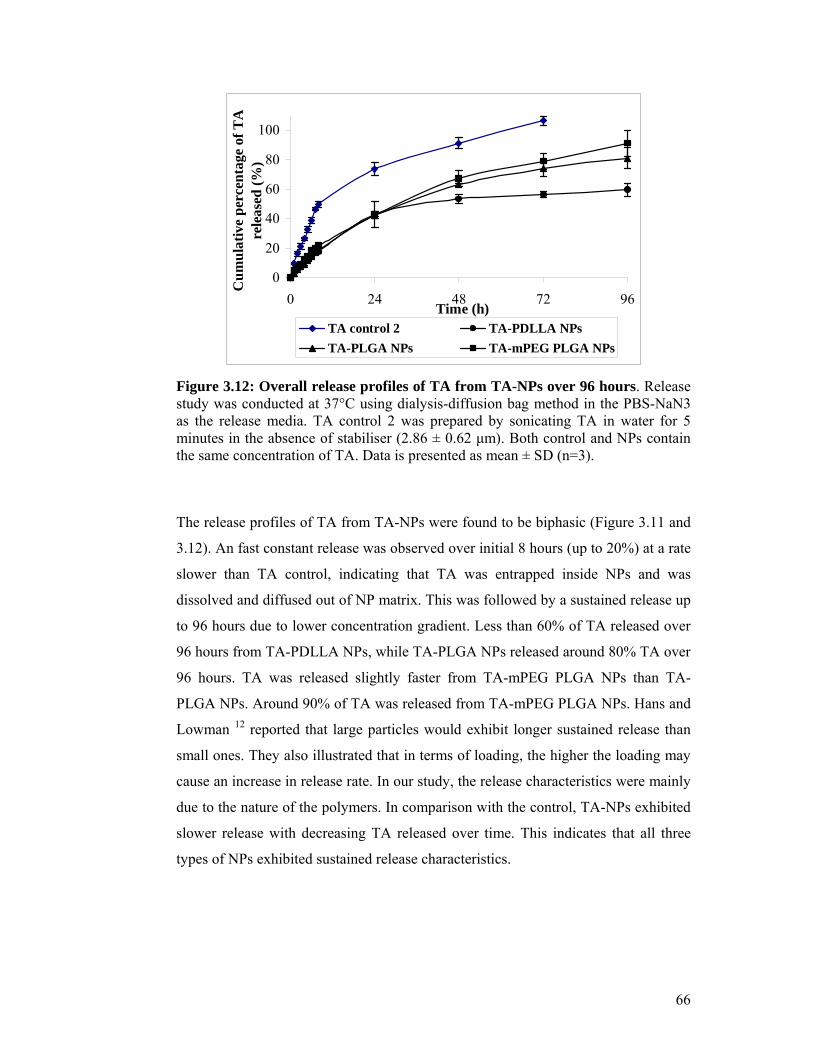
66
0
20
40
60
80
100
0 24 48 72 96Time (h)
Cu
mu
lati
ve p
erce
nta
ge o
f T
A
rele
ased
(%
)
TA control 2 TA-PDLLA NPs
TA-PLGA NPs TA-mPEG PLGA NPs
Figure 3.12: Overall release profiles of TA from TA-NPs over 96 hours. Release study was conducted at 37°C using dialysis-diffusion bag method in the PBS-NaN3 as the release media. TA control 2 was prepared by sonicating TA in water for 5 minutes in the absence of stabiliser (2.86 ± 0.62 μm). Both control and NPs contain the same concentration of TA. Data is presented as mean ± SD (n=3).
The release profiles of TA from TA-NPs were found to be biphasic (Figure 3.11 and
3.12). An fast constant release was observed over initial 8 hours (up to 20%) at a rate
slower than TA control, indicating that TA was entrapped inside NPs and was
dissolved and diffused out of NP matrix. This was followed by a sustained release up
to 96 hours due to lower concentration gradient. Less than 60% of TA released over
96 hours from TA-PDLLA NPs, while TA-PLGA NPs released around 80% TA over
96 hours. TA was released slightly faster from TA-mPEG PLGA NPs than TA-
PLGA NPs. Around 90% of TA was released from TA-mPEG PLGA NPs. Hans and
Lowman 12 reported that large particles would exhibit longer sustained release than
small ones. They also illustrated that in terms of loading, the higher the loading may
cause an increase in release rate. In our study, the release characteristics were mainly
due to the nature of the polymers. In comparison with the control, TA-NPs exhibited
slower release with decreasing TA released over time. This indicates that all three
types of NPs exhibited sustained release characteristics.

67
0
10
20
30
40
50
60
0 2 4 6 8Time (h)
Cu
mu
lati
ve a
mou
nt
of T
A
rele
ased
(%
)
TA control 2 TA-PDLLA NPs
TA-PLGA NPs TA-mPEG PLGA NPs
Figure 3.13: Release profiles of TA from TA-NPs over 8 hours. Release study was conducted at 37°C using dialysis-diffusion bag method in the PBS-NaN3 as the release media. TA control 2 was prepared by sonicating TA in water for 5 minutes in the absence of stabiliser (2.86 ± 0.62 μm). Both control groups containing the same concentration of TA as in the NPs. Data is presented as mean ± SD (n=3).
Release profiles of TA from TA NPs at initial 8 hours are presented in Figure 3.13.
All three types of polymer show fast release at a constant rate up to 20% due to the
dissolution and diffusion of TA which was entrapped inside NPs, to the media.
Although all types of NPs show an initial fast release, the cumulative TA released
was about half that of the control.
Table 3.12: Distribution of TA after release process over 96 hours
Distribution TA proportion (%)
TA-PDLLA
NPs
TA-PLGA
NPs
TA-mPEG
PLGA NPs
TA
(control)
TA released over 96 h (in the release medium)
59.74 80.93 91.13 100*
Unreleased TA (in the NPs)
37.85 17.46 9.17 -
Total 97.59 98.39 100.3
*released in 72 hours
Table 3.12 shows the distribution of TA after release over 96 hours. The unreleased
TA was determined by the same method used for drug loading determination (section
2.3.4.4) which was extracting the TA by dissolving the NPs into ACN. From that

68
distribution, it can be concluded that only TA-PDLLA NPs exhibited true sustained
release, probably due to the more rigid of NPs.
In summary, the difference of physical characteristics between TA-NPs in both
methods was due to the nature of polymer and the solvent system used in the
methods. The solubility of the drug and polymer in organic phase plays an important
role especially in determining the entrapment efficiency. In the solvent diffusion, TA
appeared to be very soluble in acetone. This led most of TA to diffuse out together
with the organic phase to the aqueous phase. Although both TA and polymer are
hydrophobic, it appeared that the interaction between TA and polymers was
overweighed by the TA solubility in acetone. In the preparation of TA-NPs using the
solvent evaporation the DCM was used as the organic solvent. In general we
revealed that the particle size of TA-NPs was larger than those prepared by the
solvent diffusion method. This was due to the slow evaporation of DCM. We also
revealed that TA-PDLLA NPs were the largest particle with the lowest entrapment
efficiency, while TA-mPEG PLGA NPs were the smallest particle with the highest
entrapment efficiency. The release characteristics show that TA-mPEG PLGA NPs
exhibited the fastest release of TA while the slowest release was shown in TA-
PDLLA NPs. These results led to the speculation that although the amount of TA
associated with PDLLA was low, association of TA with PDLLA appeared to be the
strongest. PDLLA was likely to entrap TA thoroughly rather than other NPs. In the
TA-mPEG PLGA NPs, the PEG presence on mPEG-PLGA enhanced the
hydrophilicity of polymer, resulting in the relatively higher water uptake into NPs.
This was probably the cause of the fastest release of TA.
3.2.3 TA stability study
One of the NP advantageous features is that they can protect the drug from
hazardous environment and from potentially premature degradation 18. To determine
whether the NP formulations could enhance the stability of TA in the aqueous
environment, an investigation of the stability of TA in the aqueous medium was
carried out. In this study, the potency of TA in aqueous solutions was determined
over 72 hours after storage at three different experimental temperatures: 4°C, 25°C,
and 37°C. The potency of TA was calculated as a percentage of the TA peak area
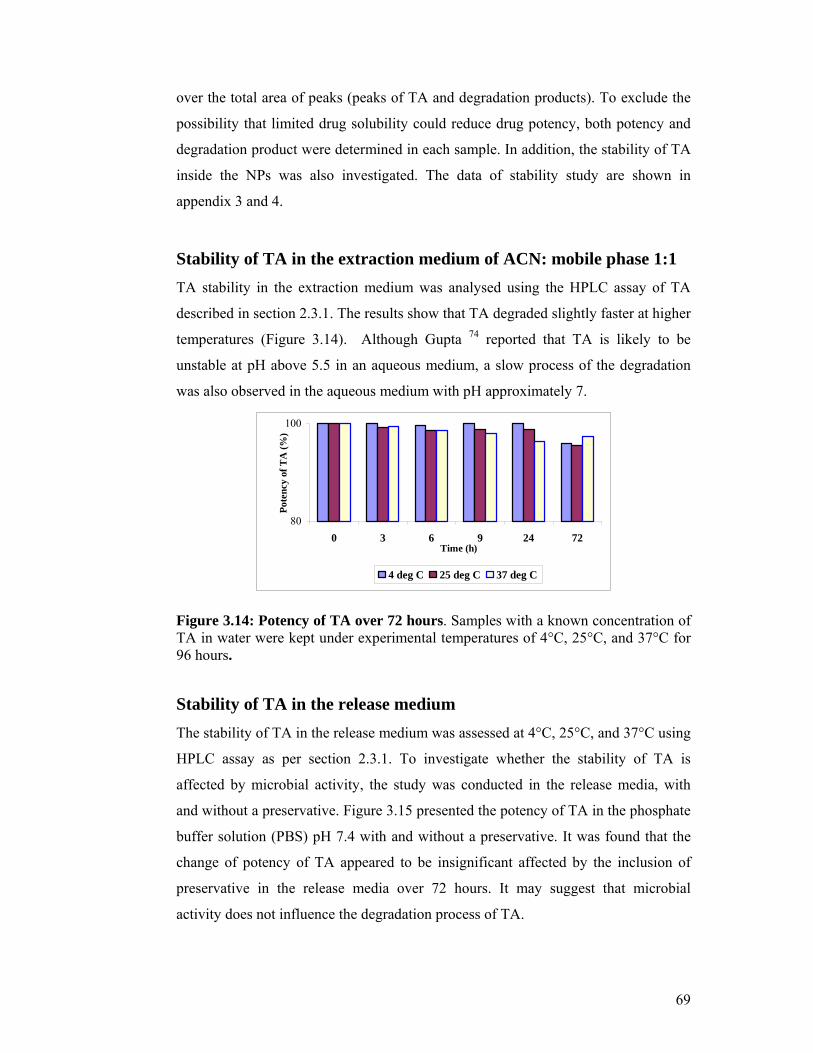
69
over the total area of peaks (peaks of TA and degradation products). To exclude the
possibility that limited drug solubility could reduce drug potency, both potency and
degradation product were determined in each sample. In addition, the stability of TA
inside the NPs was also investigated. The data of stability study are shown in
appendix 3 and 4.
Stability of TA in the extraction medium of ACN: mobile phase 1:1
TA stability in the extraction medium was analysed using the HPLC assay of TA
described in section 2.3.1. The results show that TA degraded slightly faster at higher
temperatures (Figure 3.14). Although Gupta 74 reported that TA is likely to be
unstable at pH above 5.5 in an aqueous medium, a slow process of the degradation
was also observed in the aqueous medium with pH approximately 7.
80
100
0 3 6 9 24 72Time (h)
Pot
ency
of
TA
(%
)
4 deg C 25 deg C 37 deg C
Figure 3.14: Potency of TA over 72 hours. Samples with a known concentration of TA in water were kept under experimental temperatures of 4°C, 25°C, and 37°C for 96 hours.
Stability of TA in the release medium
The stability of TA in the release medium was assessed at 4°C, 25°C, and 37°C using
HPLC assay as per section 2.3.1. To investigate whether the stability of TA is
affected by microbial activity, the study was conducted in the release media, with
and without a preservative. Figure 3.15 presented the potency of TA in the phosphate
buffer solution (PBS) pH 7.4 with and without a preservative. It was found that the
change of potency of TA appeared to be insignificant affected by the inclusion of
preservative in the release media over 72 hours. It may suggest that microbial
activity does not influence the degradation process of TA.

70
In the release medium, TA was degraded the fastest at 37°C, as predicted. After 72
hours storage at 37°C, the degradation was increased dramatically up to 43%. A
substantial decomposition of TA was found at room temperature, with TA potency
reduced to 85% over 72 hours, while at 4°C the TA showed less than 10%
degradation (6.4%).
0
20
40
60
80
100
4°C 25°C 37°C
Experimental temperatures
Pot
ency
of
TA
(%
)
PBS-Na azide PBS
Figure 3.15: Potency of TA at 72 hours. Samples with a known concentration of TA in PBS and PBS–Na azide (PBS-NaN3) were kept under experimental temperatures of 4°C, 25°C, and 37°C for 96 hours.
TA stability inside NPs
To determine whether the NP formulations are able to maintain the stability of TA,
the TA stability inside NPs was investigated. The study was conducted after
completing a 96 hour in vitro release study. The TA was extracted from the NPs and
analysed for its concentration as per section 2.3.4.4. Since TA in the control groups
was 100% released in 72 hours, the potency of TA in the control groups was
calculated with regards to 72 hours release. It was shown by the chromatogram
(Figure 3.16) that after 96 hour release study at 37°C, TA remained in nature form
inside NPs and no degradation product was detected. However, the free TA in the
control groups was degraded up to approximately 12% over 72 hours. The data
obtained suggests that the stability of TA was maintained satisfactorily by the
polymer matrix of the NPs.

71
Figure 3.16: A representative of HPLC chromatogram of TA extraction from NPs. The extraction was carried out after 96 hour release study in PBS-NaN3 at 37°C.
3.3 In vitro toxicity study of TA-loaded NPs
The issues of toxicity of NPs have been raised up recently, in accordance with the
potential clinical application of NPs. To investigate the effect of either TA or TA-
NPs, an in vitro toxicity study was carried out upon two different cell culture models:
BALB/c 3T3 (fibroblasts) and ARPE 19 cells (human retinal pigment epithelial). The
MTT assay was selected to determine the cell viability since it is a simple yet
accurate assay 65, and is widely used in studies investigating polymers 44 and NP
toxicity107-109. The MTT assay was well-established in this laboratory. Previous
research in this laboratory has found that the MTT assay is the most efficient at
demonstrating toxic effects on cell viability if the final absorbance of the untreated
cultures is in the range of 0.7-1.2.
3.3.1 Assay optimisation
In order to effectively show adequate responses to toxic compounds, it was necessary
at the first stage, to optimise the seeding density (number of cells per well) in the 96
well plates assay. The process to optimise the cell number per well is described as
per section 2.3.8 using the MTT assay. BALB/c 3T3 cells were seeding with seeding
density in the range of 5,000 – 20,000 cells/well at three different plates reflecting
three different time points: 0, 24 and 48 hours (Figure 3.17). The optimum seeding
density for BALB/c 3T3 was determined at 15,000 cells/well based on the linearity

72
of the response (absorbance) against time and final absorbance was in the range 0.7-
1.2.
00.20.40.60.8
11.21.41.6
T 0 T 24 T 48Time (h)
Abs
orba
nce
20,000 cells/well
15,000 cells/well
10,000 cells/well
7,500 cells/well
5,000 cells/well
Figure 3.17: Seeding density optimisation of BALB/c 3T3. The cells were inoculated in D10 media in a range of seeding density and incubated at 37°C. The cell viability was assayed by MTT assay at each time point. Data shown is a representative of three independent studies.
Seeding density optimisation for ARPE 19 was also conducted as per section 2.3.8,
with the same aim as that of BALB/c 3T3 (Figure 3.18). A range of seeding density
was initially designed from 5,000 to 20,000 cells/well. In contrast to BALB/c 3T3
expression, ARPE 19 demonstrated low intensity of absorbance at the same
incubation time. This may indicate that mitochondrial activity of ARPE 19 cells was
not as active as BALB/c 3T3
.
00.10.20.30.40.50.60.70.8
T 0 T 24 T 48
Time (h)
Ab
sorb
ance
20,000 cells/well
15,000 cells/well
10,000 cells/well
7,500 cells/well
5,000 cells/well
Figure 3.18: Seeding density optimisation of ARPE 19 (1). The cells were inoculated in DF12 media in seeding densities ranging from 5,000 to 20,000 cells/well and incubated at 37°C. The cell viability was assayed by MTT assay at each time point. Data shown is a representative of three independent studies.
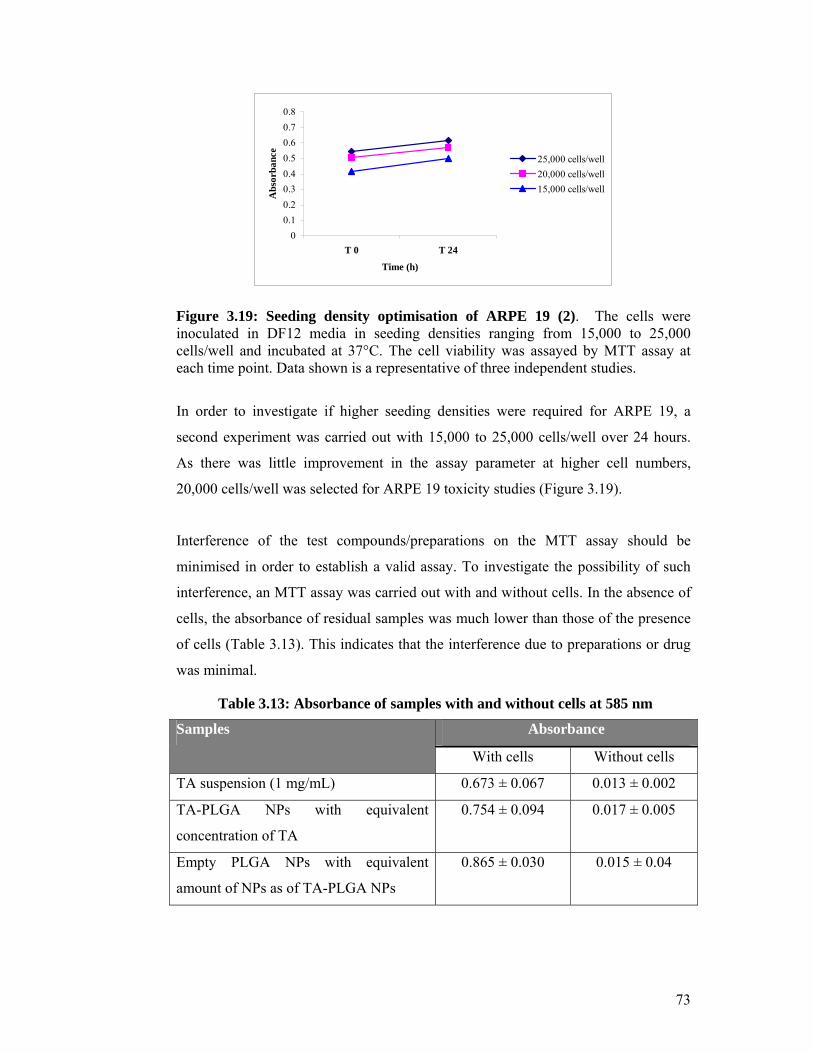
73
0
0.1
0.2
0.3
0.4
0.5
0.6
0.7
0.8
T 0 T 24
Time (h)A
bsor
banc
e
25,000 cells/well
20,000 cells/well
15,000 cells/well
Figure 3.19: Seeding density optimisation of ARPE 19 (2). The cells were inoculated in DF12 media in seeding densities ranging from 15,000 to 25,000 cells/well and incubated at 37°C. The cell viability was assayed by MTT assay at each time point. Data shown is a representative of three independent studies.
In order to investigate if higher seeding densities were required for ARPE 19, a
second experiment was carried out with 15,000 to 25,000 cells/well over 24 hours.
As there was little improvement in the assay parameter at higher cell numbers,
20,000 cells/well was selected for ARPE 19 toxicity studies (Figure 3.19).
Interference of the test compounds/preparations on the MTT assay should be
minimised in order to establish a valid assay. To investigate the possibility of such
interference, an MTT assay was carried out with and without cells. In the absence of
cells, the absorbance of residual samples was much lower than those of the presence
of cells (Table 3.13). This indicates that the interference due to preparations or drug
was minimal.
Table 3.13: Absorbance of samples with and without cells at 585 nm
Samples Absorbance
With cells Without cells
TA suspension (1 mg/mL) 0.673 ± 0.067 0.013 ± 0.002
TA-PLGA NPs with equivalent
concentration of TA
0.754 ± 0.094 0.017 ± 0.005
Empty PLGA NPs with equivalent
amount of NPs as of TA-PLGA NPs
0.865 ± 0.030 0.015 ± 0.04

74
3.3.2 BALB/c 3T3 cell viability assessment
Figure 3.20: Image of BALB/c 3T3 cells. Image was taken with an aid of a phase contrast microscope at 33x magnification. The cells were inoculated in D10 media (80% confluence). BALB/c 3T3 is the most common cell culture models used in toxicity study. Its
feature of non tumorigenicity makes this cell model appropriate to study the toxicity
of drugs which are not intended as anticancer agents. In order to assess the toxicity of
TA and TA-NPs upon BALB/c 3T3, the study was carried out by exposing the cells
to either TA or TA NPs over 24 hours at 37°C. The assessment was designed as per
section 2.3.8.7. The range of TA concentration was designed from 0.1 µg/mL to 1
mg/mL based upon previous TA toxicity study conducted on ARPE 19 cells 98. The
TA-NPs were prepared to give an equivalent concentration of TA. Empty NPs were
prepared to give an equal amount of NPs to TA-NPs. In addition to MTT assay,
treated and untreated cell cultures were also observed by phase contrast microscopy.
To investigate the condition of the cells after exposure, phase contrast microscopy
was used. An image of cells exposed to TA revealed that an aggregation of TA
crystals was occurred, which appeared to induced cell death or inhibition around the
location, resulting in a clear space between the cells (Figure 3.21.(a)). Contrary to
that, TA-NPs were not visually detected by microscopy (Figure 3.21 (b)). The clear
spaces were also observed in the cells exposed to TA-NPs but not as much as in the
cells exposed to TA.

75
(a)
(b)
Figure 3.21: Image of BALB/c 3T3 cells after being exposed to TA and TA-NPs. Phase contrast microscopy 33x. Cells were exposed to samples for 24 hours at 37°C. (a) Cells were exposed to TA at a concentration of 1 mg/mL (b) Cells were exposed to TA-NPs containing the same concentration of TA.
TA crystals

76
(a)
0
20
40
60
80
100
TA TA-PDLLA
NPs
TA-PLGANPs
TA-mPEGPLGA NPs
Cel
l via
bili
ty (
%)
0.0001 mg/mL TA
0.001 mg/mL TA
0.01 mg/mL TA
0.1 mg/mL TA
1 mg/mL TA
(b)
0
20
40
60
80
100
0.0001 0.001 0.01 0.1 1
TA concentration (mg/mL)
Cel
l vi
abil
ity
(%)
TA TA-PDLLA NPs TA-PLGA NPs TA-mPEG PLGA NPs
Figure 3.22: Effect of TA and TA-NPs on BALB/c 3T3 cell viability. Cells were seeded at 15,000 cells/well in D10 media and exposed to TA (0.1 µg/mL to 1 mg/mL) and TA-NPs with drug concentration equivalent to TA, for 24 hours. The different chart designs are used to assist in understanding the effects of samples on the BALB/c 3T3 cell viability. (a) Cell viability against type of samples (b) Cell viability against TA concentration (mg/mL). Data presented as mean ± SD (n=3).
The toxicity studies on BALB/c 3T3 cell model demonstrated a dose dependent
decrease in cell viability with the increasing sample concentration (Figure 3.22).
Although at the TA concentration of 0.1mg/mL and 1 mg/mL the cell viability was
dramatically decreased, there was little effect on concentrations from 0.1 µg/mL to
0.01 mg/mL. This indicates that the cells were not susceptible to TA at the

77
concentration at and below 0.01 mg/mL. Similar results were observed after
exposure to all types of NPs at the same concentration of TA (0.1 µg/mL to 0.01
mg/mL).
20
40
60
80
100
TA TA-PDLLA NPs TA-PLGA NPs TA-mPEGPLGA NPs
Cel
l via
bil
ity
(%) p = 0.009
p = 0.017
p = 0.021
Figure 3.23: Effect of TA (1 mg/mL) and TA-NPs on BALB/c 3T3 cell viability. Cells were seeded at 15,000 cells/well in D10 media and were exposed to 1 mg/mL of either TA or TA-NPs with drug concentration equivalent to TA for 24 hours. Cell viability was determined using MTT assay. Data represent mean ± SD (n=3). The significant difference was considered if p < 0.05.
At TA concentration of 1 mg/mL, the differences on the cell viability after being
exposed to TA NPs compared to TA control were statistically significant (Figure
3.33) with a reduction of cell viability down to around 50%. Among three types of
NPs, TA PLGA NPs appeared to be the most effective in protecting the cells from
TA toxicity. Although only around 70% of cells were viable after being exposed to
TA-NPs, it demonstrates that the TA NPs show significantly less cell toxicity than
TA in this cell model.

78
20
40
60
80
100
TA TA-PDLLA NPs TA-PLGA NPs TA-mPEGPLGA NPs
Cel
l via
bil
lity
(%
)
Figure 3.24: Effect of TA (0.1 mg/mL) and TA-NPs on BALB/c 3T3 cell viability. Cells were seeded at 15,000 cells/well in D10 media and exposed to 0.1 mg/mL of either TA or TA-NPs with drug concentration equivalent to TA for 24 hours. Cell viability was determined using MTT assay. Data represent mean ± SD (n=3). The significant difference was considered if p < 0.05.
At TA concentration of 0.1 mg/mL, the difference is not statistically significant due
to the high levels of standard deviation, resulting from the biological variability
between triplicate experiments (Figure 3.34).
The relative contribution of the NPs themselves to toxicity was also investigated
(Figure 3.35). The cell viabilities under exposure to TA loaded NPs containing the
highest concentration of TA (1 mg/mL) and empty NPs containing an equal amount
of NPs as the TA loaded NPs were assessed. The result demonstrates that the
difference was not statistically significant, indicating that NPs did not contribute to
the TA toxicity on BALB/c 3T3 cell model .

79
0
20
40
60
80
100
PDLLA NPs PLGA NPs mPEG PLGA NPs
Cel
l vi
abil
ity
(%)
Loaded NPs Blank NPs
Figure 3.25: Effect of empty NPs and TA-NPs on BALB/c 3T3 cell viability. Cells were seeded at 15,000 cells/well in D10 media and exposed to either TA-NPs with TA concentration of 1 mg/mL or empty NPs with an equivalent amount of NPs to TA-NPs, for 24 hours. Cell viability was determined using MTT assay. Data represent mean ± SD (n=3).
3.3.3 ARPE 19 cell viability assessment
Figure 3.26: Image of ARPE 19 cells. A phase contrast microscopy at 33x magnification. The cells were inoculated in DF12 media (80% confluence).
Recently, TA has been extensively investigated in the treatment of retinal diseases 84-
86, 91. Since TA-NPs are potential carriers to treat retinal diseases, it was imperative to
test TA-NPs toxicity against a more specific and relevant cell model. TA has been

80
investigated for toxicity using ARPE 19 cells 97, 98, 110, therefore the non malignant
retinal epithelial cell-line, ARPE 19, was used for this purpose.
To assess the toxicity of TA and TA-NPs, in vitro toxicity studies were also
conducted by exposing ARPE 19 cell culture to TA and TA-NPs over 24 hours at
37°C. The range of TA concentration was similar to those applied on BALB/c 3T3
cell viability assessment based on the previous toxicity study of TA conducted by
Yeung 98.
(a)
(b)
Figure 3.27: Morphology of ARPE 19 cells after being exposed to TA and TA-NPs. Phase contrast microscopy at 33x magnification. Cells were exposed to samples for 24 hours at 37°C. (a) Cells were exposed to TA at a concentration of 1 mg/mL (b) Cells were exposed to TA-NPs containing the same concentration of TA.
TA crystals

81
Phase contrast microscopy was also used to observe the cells exposed to TA and TA-
NPs. An aggregation of TA crystal was observed on the cells exposed to TA,
however, the cell morphology appeared to be the same after exposure (Figure 3.37
(a)). The TA NPs were not detected by phase contrast microscopy due to sub-micron
size of the NPs (Figure 3.37 (b)). Due to time limitation, investigation on
morphological alteration after exposure on the cells was not conducted.
(a)
0
20
40
60
80
100
TA TA-PDLLANPs
TA-PLGANPs
TA-mPEGPLGA NPs
Cel
l via
bili
ty (
%)
0.0001 mg/mL TA
0.001 mg/mL TA
0.01 mg/mL TA
0.1 mg/mL TA
1 mg/mL TA
(b)
0
20
40
60
80
100
0.0001 0.001 0.01 0.1 1
TA concentration (mg/mL)
Cel
l via
bili
ty (
%)
TA TA-PDLLA NPs TA-PLGA NPs TA-mPEG PLGA NPs
Figure 3.28: Effect of TA and TA-NPs on ARPE 19 cell viability. Cells were seeded at 20,000 cells/well in DF12 media and exposed to TA (0.1 µg/mL to 1 mg/mL) and TA-NPs with drug concentration equivalent to TA, for 24 hours. The different chart designs are used to assist in understanding the effects of samples on the BALB/c 3T3 cell viability. (a) Cell viability against type of samples (b) Cell viability against TA concentration (mg/mL). Data presented as mean (n=3) ± SD.

82
High toxicity of TA after 24 hour exposure to ARPE 19 was observed at the highest
concentration (1 mg/mL) (Figure 3.38 (a)). It reduced the cell viability down to 60%.
The differences in cell viability after 24 hour exposure to TA and TA-NPs, at the TA
concentration of 1 mg/mL, were statistically significant (Figure 3.39). At
concentration of 0.1 mg/mL or less, the TA was still found to be relatively toxic
compared to TA-NPs. However, regarding TA-NPs, around 80-100% viable cells
were observed on TA NPs with TA concentration at 0.1 mg/mL or less, suggesting
that the TA NPs did not induce toxicity on those concentration.
20
40
60
80
100
TA TA-PDLLA NPs TA-PLGA NPs TA-mPEGPLGA NPs
Cel
l via
bili
ty (
%) p = 0.039
p = 0.005
p = 0.010
Figure 3.29: Effect of TA (1 mg/mL) and TA-NPs on ARPE 19 cell viability. Cells were seeded at 20,000 cells/well in DF12 media and exposed to 1 mg/mL of either TA or TA-NPs with drug concentration equivalent to TA for 24 hours. Cell viability was determined using MTT assay. Data represent mean ± SD (n=3).
The toxicity of all TA NPs were significantly less than TA alone in ARPE 19 cells.
Although only around 80% cells were viable after 24 hours exposure, NPs did not
appear to induce toxicity.

83
20
40
60
80
100
TA TA-PDLLA NPs TA-PLGA NPs TA-mPEGPLGA NPs
Cel
l via
bil
ity
(%)
Figure 3.30: Effect of TA (0.1 mg/mL) and TA-Nps on ARPE 19 cell viability. Cells were seeded at 20,000 cells/well in DF12 media and exposed to 0.1 mg/mL of either TA or TA-NPs with drug concentration equivalent to TA for 24 hours. Cell viability was determined using MTT assay. Data represent mean ± SD (n=3).
Among three type of TA-NPs, TA-mPEG PLGA NPs was apparently the least toxic.
The similar trend is also observed at the TA concentration of 0.1 mg/mL (Figure
3.40), in which TA-mPEG PLGA NPs appeared to be the safest NPs. From the same
figure, we revealed that the differences of cell viability after exposure to TA-PDLLA
NPs and TA-PLGA NPs were statistically insignificant compared to cell viability
after TA exposure.
p= 0.017

84
0
20
40
60
80
100
PDLLA NPs PLGA NPs mPEG PLGA NPs
Cel
l via
bil
ity
(%)
Loaded NPs Blank NPs
Figure 3.31: Effect of empty NPs and TA-NPs on ARPE 19 cell viability. Cells were seeded at 20,000 cells/well in DF12 media and exposed to either TA-NPs with TA concentration of 1 mg/mL or empty NPs, for 24 hours. Cell viability was determined using MTT assay. Data represent mean ± SD (n=3).
The toxicity of NP themselves were also assessed using ARPE 19. In comparison of
the cell viability exposed to TA-NPs (which contain TA at 1 mg/mL) and empty
NPs, it was revealed that there were no statistically significant differences between
empty and TA-NPs (Figure 3.41).
To summarise, TA was found to be toxic at the highest concentration (1 mg/mL) on
both cell models. Significant reduction of cell viability of cells was obtained in
BALB/c 3T3 (down to 50%) and ARPE 19 (down to 60%). This finding is in
agreement with other TA toxicity studies on ARPE 19 cell model 98, 110. The high
toxicity level of TA on the highest concentration (1 mg/mL) was speculated to be
due to substantially large particle size compared to the NPs. Szurman et al 111
demonstrated that the cytotoxic effect of TA was governed by sedimented TA
crystals or aggregates in direct contact with the cell surface. In addition to the results,
BALB/c 3T3 cell viability reduction was found to be dose-dependent. They are also
more sensitive to TA and TA NPs than ARPE 19.
All types of TA-NPs were significantly less toxic than TA at the TA concentration of
1 mg/mL on both cell models. The levels of cell viability after exposure to TA-NPs

85
were higher than those after exposure of TA. The differences of cell viability
exposed to TA and TA-NPs were statistically significant (p<0.05). In addition, empty
NPs and TA-NPs show the similar toxicity level, indicating that the cell viability of
both cell culture models was less affected by NPs themselves. These findings suggest
that the delivery of TA by NPs may potentially reduce the potential side effect of
TA. Bejjani et al 112 demonstrated that PLGA NPs was considered to be non toxic
upon RPE and its rapid internalization enables gene transfer and expression in RPE
cells.

86
GENERAL DISCUSSION
NP delivery was investigated for TA since it has potential advantages of providing
controlled release and prolonging stability of TA. Moreover, due to their sub-micron
size, NPs are more acceptable than larger particles for intra vascular administration
as they are small enough for cellular internalization.
TA was selected as a model for hydrophobic drugs for studying polymeric NP
formulations. The control of particle size of hydrophobic drugs appears to be
problematic in parenteral administration, since the hydrophobic particles tend to be
physically unstable and aggregate. Polymeric NP formulations may provide
alternatives to overcome these problems as surface of polymeric NPs can be readily
modified.
This study involves investigation of three types of polymers for incorporation of TA
into NPs: poly (D,L, lactide) (PDLLA), poly (D,L, lactide-co-glycolide) (PLGA) and
methoxy polyethyleneglycol-poly (D,L, lactide-co-glycolide) (mPEG-PLGA). PLGA
is more hydrophilic than PDLLA due to the presence of glycolic acid on the
copolymerisation of lactic acid with glycolic acid. The hydrophilicity in mPEG
PLGA is further enhanced by an addition of polyethyleneglycol group. The
hydrophobicity level of those polymers follows this order: PDLLA > PLGA >
mPEG-PLGA.
4.1 Polymeric NP formulations for TA delivery
Preparation of polymeric NPs was carried out by either the solvent diffusion or
solvent evaporation method. The former method has an advantage of producing sub-
micron particles, using non toxic organic solvents, in an effective and reproducible
manner 12, 47-49, 57, 58, 113. The latter method is commonly used to manufacture
microparticles 15, 114. However, by appropriate modification NPs can also be easily
made by this method. One of the advantages of applying this method is that it
provides high levels of yield, loading and entrapment efficiency, especially for
hydrophobic drugs due to the slower evaporation of the organic solvent, which

87
results in slower precipitation of NPs. The difference which can be distinguished for
both methods is the application of different solvent system. The solvent diffusion
method involved acetone as the organic solvent, whereas in the solvent evaporation
method, DCM which is immiscible with water, was employed instead of acetone.
The solvent system in this study played an important role in determining the
characteristics of NPs.
The NPs were characterized for their particle size, surface charge, yield and loading
value, and TA entrapment efficiency. An in vitro release study was conducted to
investigate the release characteristics of all types of TA-NPs compared to TA control
(free TA).
The empty NPs made by both methods show excellent characteristics. Both methods
can provide sub-micron particles with those made by the solvent diffusion method
being smaller than those made by solvent evaporation. In terms of surface charge, the
zeta potential of those particles was highly negative, indicating that NPs were well-
dispersed in the medium. In a comparison among polymers, PDLLA, which is the
most hydrophobic polymer, exhibited the largest particle size, and the lowest yield.
In the solvent diffusion method, this is due to a rapid diffusion of organic solvent
into the aqueous stabiliser phase, leaving the polymer with strong hydrophobic bonds
to associate, leading to aggregation and the formation of microparticles during NP
preparation, which were not expected. Low concentration of the stabiliser in the
solvent diffusion method (0.6% PVA) may have failed to effectively stabilise the
emulsion, resulting in aggregation of polymer.
Based on those characteristics, an attempt to incorporate 40 mg TA into 200 mg
polymer was made using either solvent diffusion or solvent evaporation. To
determine the concentration of TA, either for loading determination or release study,
an HPLC method reported by Gupta74 was adopted with some modification to
optimize the separation of the peaks. This method was selected since it provides a
stability indicating assay for TA. Validation of HPLC assay was conducted in order
to develop an accurate and reproducible assay to determine TA concentration. The
main parameters of validation such as: linearity of detector response, system
precision, recovery (accuracy), sensitivity and selectivity, were examined. The

88
investigation revealed that the validated modified HPLC method developed in this
study was suitable for the determination TA in the formulation and release
experiments.
Initially, solvent diffusion method was employed to prepare TA-loaded NPs with
theoretical loading of 16.7%. The preparation of TA-PDLLA NPs, the entrapment
efficiency initially appeared to be satisfactory (approximately 65%). However,
further investigation showed that the NPs obtained were in a mixture of TA-NPs and
TA crystals. An optimisation of the method therefore was conducted. By settling
down the TA crystals for 30 minutes prior to PVA purification, the crystals were
separated and removed from the NPs. It was found that by optimised solvent
diffusion method, the yield, loading and entrapment efficiency of TA-NPs were
extremely low. This was probably due to the high solubility of TA in acetone, as
when acetone diffused out rapidly to the aqueous phase, TA also diffused out from
the organic phase.
The solvent evaporation method was then employed to prepare TA-NPs. In using this
method, although the size was slightly increased, the yield, loading and entrapment
efficiency of NPs made from three different polymers were obtained in reasonably
high levels. The increased size was due to the primary droplet formed in the
emulsification, which was affected by the concentration of polymer in organic
solvent (the viscosity of organic phase). The more viscous the organic phase, the
larger the droplet. This is due to the less ability of the viscous organic phase to
disperse. Eventually, larger droplet will produce larger NPs 96, 115. Slow evaporation
of DCM also contributed to the formation of large particle size of NPs. However, the
use of a sonicator during emulsification effectively reduce the size of NPs116.
Görner et al115 demonstrated that an increase in size of the NPs would increase the
entrapment efficiency. However, the initial amount of drug added plays an important
role in determining the entrapment efficiency of NP preparation. In our study,
although the size of TA-mPEG PLGA NPs (around 295 nm) was smaller than that of
TA-PLGA NPs (around 325 nm), both TA-PLGA and TA-mPEG PLGA NPs
exhibited high entrapment efficiency of around 65%. However, TA PDLLA NPs
exhibited the largest size (around 360 nm) and the lowest entrapment efficiency

89
(30%). The low entrapment efficiency of TA-PDLLA NPs was probably due to the
partitioning of polymer and TA between the dispersed and the dispersing phase. The
partition is not only to the organic solvent as both polymer and drug molecule may
also diffuse across the interface from organic phase to the external phase during NP
formation 30.
The preparation of NPs in this study involves PVA as a stabiliser. Although PVA is
reported as an effective stabiliser, which can assist to produce NPs with reduced size
and high entrapment efficiency 36, 104, it is also reported by other investigator that
PVA is a suspected carcinogen 105. Therefore, purification of NPs was carried out to
remove the PVA. High speed centrifugation was selected as the purification
technique due to its efficiency to separate the NPs from the supernatant containing
PVA. Although high speed centrifugation offers satisfactory results in removing the
PVA (Table 3.10 and Figure 3.11), PVA still could not be 100% removed from the
system. This finding corresponds with the study reported by Murakami et al 48, 106
which revealed that small amount of PVA appeared to be attached on the surface of
NPs as a result of hydrophobic bonding.
Physical stability of TA in NPs was also examined. TA was extracted from TA-NPs
after 96 hour-in vitro release study, and the extraction samples were injected into the
HPLC. A typical chromatogram showed that no degradation product of TA was
detected in the extraction (Figure 3.16). This finding was the same for all types of
TA-NPs and suggests that TA was fully isolated by NPs from environmental hazards.
In vitro release study was carried out only for the TA-NPs made by solvent
evaporation, prone to small entrapment efficiency achieved by TA-NPs made by
solvent diffusion. The release characteristics of three types of NPs show biphasic
patterns. Initially, a fast constant release was observed over 8 hours (around 20% TA
was released), followed by a slow release over 96 hours. The fast release of TA over
8 hours was due to poor entrapment of TA resulting in reduced surface area. The
slow release of TA after 24 hours might be performed by TA entrapped in the NPs.
Of the three types of NPs, the greatest release was observed on TA-mPEG PLGA
NPs, which were the smallest among those NPs (around 295 nm).
Avgoustakis et al 53 demonstrated that the release of drug from mPEG PLGA NPs

90
was related to the mPEG content, it increases with an increase of mPEG content.
The release characteristics of the NPs were normally governed by drug diffusion and
polymer erosion, which is a result of polymer degradation. Porosity of the particles,
as a result of solvent evaporation during initial preparation may also affect the
release behaviour. The more porous the NPs, the higher the drug diffusion rate would
be . Hans and Lowman 12 reported that large particles would exhibit longer sustained
release than small ones. They also illustrated that in terms of loading, the higher the
loading may cause an increase in the release rate. From the investigation, it was
found that TA- mPEG-PLGA with the highest loading (67%) show the fastest release
( around 90% of TA released over 96 hours), while TA-PDLLA NPs with the particle
sized around 360 nm, showed the slowest release among three types of NPs.
Limitation of the formulation study
There are several limitations in this study. Both methods used in the TA-NPs
preparation could not produce NPs with size less than 200 nm. This is probably due
to the relatively high polymer concentration in the organic phase. In terms of loading,
the theoretical loading was too high (16.67%) to be loaded into the NPs resulting in
very low entrapment efficiency and yield.
4.2. In vitro toxicity study of TA-loaded NPs
To assure the safety of polymeric NP formulations for TA delivery, it is essential that
the toxicities of TA-NPs are assessed. Basic toxicity assessment of TA-NPs was
carried out in this study upon two different cell lines: BALB/c 3T3 (fibroblasts) cells
which are the immortalised and non malignant cells, and ARPE 19 (human retinal
pigment epithelia) cells, which represent retinal cells. The toxicity was represented
by percentage of cell viability of the samples over the control.
In our study, we revealed that TA at 1 mg/mL was toxic. It reduced the cell viability
of BALB/c 3T3 cell model down to 50% and ARPE 19 cell model down to 60%.
However the TA-NPs containing the same amount of TA were less toxic than TA. In
both cell models, it was found that BALB/c 3T3 cell model was more sensitive than
ARPE 19. It also showed dose-dependent reduction in exposure to TA.

91
Although the effect of particle size of either TA or TA-NPs on the cell viability did
not particularly investigated due to time limitation, the distinct difference of size
between TA (microsize) and TA-NPs (nanosize) can be one of the reasons to explain
the high toxicity of TA in this study. The possibility of TA crystals to be aggregated
also contributed to the high potential of being toxic.
Limitation of the in vitro toxicity study
The MTT assay is an easy and simple assay and it is the best to be used with cells
which show high mitochondrial activity. Cells with low mitochondrial activity may
show low intensity leading to potential assay error.
92
CONCLUSION AND SCOPE FOR
FUTURE WORK
5.1 Conclusion
The present study demonstrated that incorporation of TA into NPs with favourable
characteristics can be achieved by solvent diffusion and solvent evaporation method
using PDLLA, PLGA and mPEG PLGA. Although solvent diffusion produced NPs
sized around 200 nm, which was less than of those made by solvent evaporation,
solvent evaporation was superior to solvent diffusion method in terms of yield,
loading and entrapment efficiency. In terms of NP characterization, TA NPs
synthesized from mPEG PLGA exhibited the smallest particle size and the highest
entrapment efficiency whereas PDLLA was more likely to produce particles with
large size and low entrapment efficiency.
All types of NPs studied demonstrated sustained release ability to certain degrees.
This was particularly evident as the amount of the drug released reduced after 24
hours and remained constant subsequently. TA-mPEG NPs, which has the highest
drug loading exhibited the fastest release, while TA-PDLLA NPs appeared to release
TA in the slowest rate.
Stability of TA in NPs was found to be superior to that in drug suspension.
Undetected degradation products in TA-NPs over 96 hours, indicated that the
stability of TA has been enhanced by NP formulations.
An in vitro toxicity study revealed that in both BALB/c 3T3 and ARPE 19 cells, TA
was toxic on the highest concentration (1 mg/mL) while the TA-NPs containing TA
at the same concentration, were less likely to be toxic. The difference of cell viability
determined under exposure of either TA loaded- NPs or blank NPs was found to be
statistically insignificant (p>0.05), indicating that the components of NPs beside the
drug did not induce toxicity. BALB/c 3T3 cells were more sensitive than ARPE 19 to
TA and TA-NPs.

93
In summary, the TA NPs which were made from biodegradable and biocompatible
polymers, have shown a promising delivery for TA, in which NPs provide controlled
release properties, are potential to reduce the toxicity of TA, and are able to prolong
the stability of TA.
5.2 Scope for future work
Although TA loaded NPs were successfully made by a simple solvent evaporation
method, the ideal manufacture of NPs has not been achieved due to the use of a toxic
organic solvent and a potentially toxic stabiliser. The method conducted in this study,
failed to produce the NPs with size less than 200 nm. It will be worthwhile to
investigate the preparation parameters of NPs which can produce small NPs (< 200
nm) and can be potentially scaled up with high drug loading and yield. The polymer
which has a nature like mPEG-PLGA is considered to be a suitable polymer for NP
manufacture since it is biocompatible and able to prolong the circulation of NPs.
The mechanism of release study of TA-NPs needs to be investigated further. The
experimental conditions for the in vitro release study should be further optimised to
ensure sink conditions in the system. As for the formulation, an additional feature
which can minimize burst release should be taken into consideration in the design of
the formulations.
The properties to be available for cellular uptake have become focus to explore in the
preparation of NPs. Since TA-NPs considered to be less toxic than TA itself, it will
be worthwhile to study the mechanism of cellular traffic of TA-NPs to understand
the distribution and interaction of NPs with the biological system.

94
REFERENCES
1. Robinson J, editor. Sustained and controlled release drug delivery systems.
New York: Marcell Dekker; 1978.
2. Svenson S, editor. Polymeric drug delivery I: particulate drug carriers.
Washington DC: American Chemical Society; 2005.
3. Linhardt RJ. Biodegradable polymers for controlled release of drugs. In:
Rossof M, editor. Controlled Release of Drugs: Polymers and aggregate systems.
New York: VCH Publishers, Inc; 1989. p. 53-95.
4. Juliano RL, editor. Drug delivery systems, characteristics and biomedical
applications. New York: Oxford University Press, Inc.; 1980.
5. Schwenderman AP, Cardamone M, Klibanov A, Langer R. Stabillity of
protein and their delivery from biodegradable polymer microspheres. In: Cohen H,
Bernstein H, editors. Microparticulate systems for the delivery of proteins and
vaccines. New York: Marcell Dekker, Inc; 1996.
6. Park K, editor. Controlled drug delivery, challenges and strategies.
Washington, DC: American Chemical Society; 1997.
7. Kreuter J. Colloidal drug delivery. In. New York: Marcell Dekker; 1994.
8. Kreuter J. Nanoparticles. In: Kreuter J, editor. Colloidal drug delivery
systems. New York: Marcel Dekker; 1994.
9. Reis CP, Neufeld RJ, Ribeiro AJ, Veiga F. Nanoencapsulation I. Methods for
preparation of drug-loaded polymeric nanoparticles. Nanomedicine:
Nanotechnology, Biology, and Medicine 2006;2:8-21.
10. Pison U, Welte T, Giersig , Groneberg D.A. Nanomedicine for respiratory
diseases. Eur J Pharm Sci 2006;533:341-350.
11. Labhasetwar V, Song C, Levy RJ. Nanoparticle drug delivery system for
restenosis. Adv Drug Del Rev 1997;24(1):63-85.
12. Hans ML, Lowman AM. Biodegradable nanoparticles for drug delivery and
targeting. Current Opinion in Solid State and Materials Science 2002;6(4):319-327.
13. Olivier JC. Drug transport to brain with targeted nanoparticles. NeuroRx
2005;2(1):108-19.
95
14. Reis CP, Neufeld RJ, Ribeiro AJ, Veiga F. Nanoencapsulation II. Biomedical
applications and current status of peptide and protein nanoparticulate delivery
systems. Nanomedicine: Nanotechnology, Biology, and Medicine 2006;2:53-65.
15. Guiot P, Couvreur P, editors. Polymeric nanoparticles and microspheres.
Boca Raton: CRC Press; 1986.
16. Kataoka K. Targeted polymeric drugs. In: Park K, editor. Controlled drug
delivery, Challenges and Strategy. Washington DC: ACS Professional Reference
Book; 1997. p. 49-71.
17. Oppenheim R. Nanoparticles. In: Juliano RL, editor. Drug delivery systems,
characteristics and biomedical applications. New York: Oxford University Press;
1980. p. 177.
18. Domb A, editor. Polymeric site specific pharmacotherapy. New York: John
Wiley and Sons; 1994.
19. Donaldson K, Stone V, Tran CL, Kreyling W, Borm PJA. Nanotoxicology.
Occup Environ Med 2004;61:727-728.
20. Govender T, Stolnik S, Garnett MC, Illum L, Davis SS. PLGA nanoparticles
prepared by nanoprecipitation: drug loading and release studies of a water soluble
drug. J Control Release 1999;57(2):171-85.
21. des Rieux A, Fievez V, Garinot M, Schneider YJ, Preat V. Nanoparticles as
potential oral delivery systems of proteins and vaccines: A mechanistic approach. J
Control Release 2006;116(1):1-27.
22. Kirchweger G. Nanoparticles-the next big thing? [Commentary]. The
American Society of Gene Therapy; 2002 [cited 13 Agust 2005]. Available from:
www.idealibrary.com.
23. Ticho U, Blumenthal M, Zonis S, Gal A, Blank I, Mazor ZW. A clinical trial
with Piloplex- a new long acting pilocarpine compound: preliminary report. Ann.
Ophthalmol 1979;4:555-561.
24. Calvo P, Martinez J, Lopez MI, Calonge M, Pastor JC, Alonso MJ. Polyester
nanocapsules as new topical oclar delivery systems for cyclosporin. Pharm Res
1996;13:311-315.
25. Campos AM, Sanchez A, Alonso MJ. Chitosan nanoparticles: a new vehicle
for the improvement of the delivery of drugs to the ocular surface. Application to
cyclosporin A. Int J Pharm 2001;224:159-168.

96
26. Gelperina SE, Khalansky AS, Skidan IN, Smirnova ZS, Bobruskin AI,
Severin SE, et al. Toxicological studies of doxorubicin bound to polysorbate 80-
coated poly(butyl cyanoacrylate) nanoparticles in healthy rats and rats with
intracranial glioblastoma. Toxicol Lett 2002;126(2):131-141.
27. Mu L, Feng SS. A novel controlled release formulation for the anticancer
drug paclitaxel (Taxol®): PLGA nanoparticles containing vitamin E TPGS. J Control
Rel 2003;86(1):33-48.
28. Dong Y, Feng SS. Nanoparticles of poly(D,L-lactide)/methoxy poly(ethylene
glycol)-poly(D,L-lactide) blends for controlled release of paclitaxel. J Biomed Mater
Res A 2006;78(1):12-9.
29. Fonseca C, Simoes S, Gaspar R. Paclitaxel-loaded PLGA nanoparticles:
preparation, physicochemical characterization and in vitro anti-tumoral activity. J
Control Rel 2002;83(2):273-286.
30. Mu L, Feng SS. Vitamin E TPGS used as emulsifier in the solvent
evaporation/extraction technique for fabrication of polymeric nanospheres for
controlled release of paclitaxel (Taxol®). J Control Rel 2002;80(1-3):129-144.
31. Mukherjee P, Bhattacharya R, Wang P, Wang L, Basu S, Nagy JA, et al.
Antiangiogenic properties of gold nanoparticles. Clin Cancer Res 2005;11(9):3530-4.
32. Hood JD. Tumor regression by targeted gene delivery to the neovasculature.
Science 2002;296:2404-2407.
33. Singh J, Pandit S, Bramwell VW, Alpar HO. Diphtheria toxoid loaded poly-
(epsilon-caprolactone) nanoparticles as mucosal vaccine delivery systems. Methods
2006;38(2):96-105.
34. Diwan M, Elamanchili P, Cao M, Samuel J. Dose sparing of CpG
oligodeoxynucleotide vaccine adjuvants by nanoparticle delivery. Curr Drug Deliv
2004;1(4):405-12.
35. Ranade V, Hollinger M. Drug delivery systems. Second ed. New York: CRC
Press Inc.; 2004. p. 226-229.
36. Scholes PD, Coombes AGA, Illum L. The preparation of sub-200 nm poly
(lactide-co-glycolide) microspheres for site specific drug delivery. J Control Rel
1993;25:145-153.
37. Yolles S, Sartori MR. Degradable polymers for sustained release. In: Juliano
RL, editor. Drug Delivery Systems. New York: Oxford University Press; 1980.
97
38. Chawla JS, Amiji MM. Biodegradable poly (caprolactone) nanoparticles
for tumor-targeted delivery of tamoxifen. Int J Pharm 2002;249:127-138.
39. Chew JL, Wolfowicz CB, Mao HQ, Leong KW, Chua KY. Chitosan
nanoparticles containing plasmid DNA encoding house dust mite allergen, Der p 1
for oral vaccination in mice. Vaccine 2003;21(21-22):2720-9.
40. Illum L, Jabbal-Gill I, Hinchcliffe M, Fisher AN, Davis SS. Chitosan as a
novel nasal delivery system for vaccines. Adv Drug Del Rev 2001;51(1-3):81-96.
41. van der Lubben IM, Verhoef JC, Borchard G, Junginger HE. Chitosan for
mucosal vaccination. Adv Drug Del Rev 2001;52(2):139-44.
42. Thanou M, Verhoef J, Junginger H. Oral drug absorption enhancement by
chitosan and its derivatives. Adv Drug Del Rev 2001;52(2):117-126.
43. Scholes PD, Coombes AGA, Davies MC, Illum L, Davis SS. Particle
engineering of Biodegradable Colloids for site-specific drug delivery. In: Park K,
editor. Controlled drug delivery, Challenges and strategies. Washington DC:
American Chemical Society; 1997.
44. Ignatius AA, Claes LE. In vitro biocompatibility of bioresorbable polymers:
poly(L, DL-lactide) and poly(L-lactide-co-glycolide). Biomaterials 1996;17(8):831-
9.
45. Perrin DE, J.P E. Polyglycolide and polylactide. In: Domb A, Kost J,
Wiseman DM, editors. Handbook of biodegradable polymers. Amsterdam: Harwood
academic publishers; 1997. p. 3-26.
46. Lewis D. Controlled release of bioactive agents from lactide/glycolide
polymers. In: Chasin M, Langer R, editors. Biodegradable polymers as drug delivery
systems. New York: Marcell Dekker; 1990. p. 1-41.
47. Chorny M, Fishbein I, Danenberg HD, Golomb G. Lipophilic drug loaded
nanospheres prepared by nanoprecipitation: effect of formulation variables on size,
drug recovery and release kinetics. J Control Rel 2002;83(3):389-400.
48. Murakami H, Kobayashi M, Takeuchi H, Kawashima Y. Preparation of
poly(-lactide-co-glycolide) nanoparticles by modified spontaneous emulsification
solvent diffusion method. Int J Pharm 1999;187(2):143-152.
49. Murakami H, Kobayashi M, Takeuchi H, Kawashima Y. Further application
of a modified spontaneous emulsification solvent diffusion method to various types
of PLGA and PLA polymers for preparation of nanoparticles. Powder Technology
2000;107(1-2):137-143.
98
50. Liu M, Dong J, Yang Y, Yang X, Xu H. Characterization and release of
triptolide-loaded poly (D,L-lactic acid) nanoparticles. Euro Pol J 2005;41(2):375-
382.
51. Gaspar M, Blanco D, Cruz MEM, Alonso MJ. Formulation of L-
asparaginase-loaded poly(lactide-co-glycolide) nanoparticles: influence of polymer
properties on enzyme loading, activity and in vitro release. J Control Rel 1998;52:53-
62.
52. Avgoustakis K. Pegylated poly(lactide) and poly(lactide-co-glycolide)
nanoparticles: preparation, properties and possible applications in drug delivery. Curr
Drug Deliv 2004;1(4):321-33.
53. Avgoustakis K, Beletsi A, Panagi Z, Klepetsanis P, Karydas AG, Ithakissios
DS. PLGA-mPEG nanoparticles of cisplatin: in vitro nanoparticle degradation, in
vitro drug release and in vivo drug residence in blood properties. J Control Rel
2002;79(1-3):123-135.
54. Avgoustakis K, Beletsi A, Panagi Z, Klepetsanis P, Livaniou E, Evangelatos
G, et al. Effect of copolymer composition on the physicochemical characteristics, in
vitro stability, and biodistribution of PLGA-mPEG nanoparticles. Int J Pharm
2003;259(1-2):115-127.
55. Jiao J, Burgess DJ. Characterisation and analysis of dispersed systems. In:
Burgess DJ, editor. Injectable disperse systems; formulation, processing and
performance. Boca Raton: Taylor & Francis Group; 2005.
56. Mainardes RM, Evangelista RC. PLGA nanoparticles containing
praziquantel: effect of formulation variables on size distribution. Int J Pharm
2005;290(1-2):137-144.
57. Kwon H-Y, Lee J-Y, Choi S-W, Jang Y, Kim J-H. Preparation of PLGA
nanoparticles containing estrogen by emulsification-diffusion method. J Colloids and
Surfaces A: Physicochemical and Engineering Aspects 2001;182(1-3):123-130.
58. Choi S-W, Kwon H-Y, Kim W-S, Kim J-H. Thermodynamic parameters on
poly(D,L-lactide-co-glcolide) particle size in emulsification-diffusion process.
Journal of Colloid and Surfaces 2002;201:283-289.
59. Sahoo SK, Panyam J, Prabha S, Labhasetwar V. Residual polyvinyl alcohol
associated with poly (,-lactide-co-glycolide) nanoparticles affects their physical
properties and cellular uptake. J Control Rel 2002;82(1):105-114.

99
60. Frenkel OH, Debotton N, Benita S, Altschuler Y. Targeting of nanoparticles
to the clathrin-mediatic endocytic pathway. Biochem Biophysic Res Comm
2007;353:26-32.
61. Maulding H. Prolonged delivery of peptide by macrocapsules. In: Anderson
JM, Kim SW, editors. Advances in Drug Delivery Systems. Amsterdam: Elsevier;
1987. p. 170-171.
62. Dalwadi G, Benson HA, Chen Y. Comparison of diafiltration and tangential
flow filtration for purification of nanoparticle suspensions. Pharm Res
2005;22(12):2152-62.
63. Freshney R. Culture of animal cells, a manual of basic technique. second
edition ed. New York: Alan R. Liss,Inc.,; 1987. p. 1-4;127-129;245.
64. Hornof M, Toropainen E, Urtti A. Cell culture models of the ocular barriers.
Eur J Pharm Biopharm 2005;In Press, Corrected Proof.
65. Mosmann T. Rapid colorimetric assay for cellular growth and survival:
application to proliferation and cytotoxicity assays. J Immunol Methods 1983;65(1-
2):55-63.
66. Aaronson SA, Todaro GJ. Development of 3T3-like lines from Balb-c mouse
embryo cultures: transformation susceptibility to SV40. J Cell Physiol 1968;72:141-
148.
67. Popiolkiewicz J, Polkowski K, Skierski JS, Mazurek AP. In vitro toxicity
evaluation in the development of new anticancer drugs-genistein glycosides. Cancer
Lett 2005;229:67-75.
68. Dunn KC, Aotaki-Keen AE, Putkey FR, Hjelmeland LM. ARPE-19, A
Human Retinal Pigment Epithelial Cell Line with Differentiated Properties. Exp Eye
Res 1996;62(2):155-170.
69. Foye W, Lemke T, Williams D. Principles of medicinal chemistry. Fourth ed.
Baltimore: Williams & Wilkins; 1995.
70. Derendorf H, Rohdewald P, Hochhaus G, Mollmann H. HPLC determination
of glucocorticoid alcohols, their phosphates and hydrocortisone in aqueous solutions
and biological fluids. J Pharm Biomed Anal 1986;4(2):197-206.
71. Dollery C. Therapeutic drugs. Second ed. Edinburgh: Churchill Livingstone;
1999.
72. Sieh DH. Triamcinolone acetonide. In: Florey K, editor. Analytical profiles
of drug substances. New Jersey: Academic Press; 1982. p. 619-623.

100
73. Reynolds J, editor. Martindale, the extra pharmacopeia. 28th ed ed. London:
The Pharmaceutical Press; 1982.
74. Gupta V. Stability of triamcinolone acetonide solution as determined by high
performance liquid chromatography. J Pharm Sci 1982;72(12):1453-1456.
75. Timmins P, Gray EA. The degradation of triamcinolone acetonide in aqueous
solution: influence of the cyclic ketal function. J Pharm Pharmacol 1983;35:175-177.
76. Beers M, Berkow R. The Merck manual of diagnosis and therapy. New
Jersey: Merck Research Laboratories; 1999.
77. Lacy C, Armstrong L, Goldman M, Lance L. Drug information handbook.
Tenth ed. Hudson: Lexi-Comp, Inc.; 2002.
78. Stanczak J, Blankenbaker D, De Smet A, Fine J. Efficacy of epidural
injections of Kenalog and Celestone in the treatment of lower back pain. AJR Am J
Roentgenol 2003;181(5):1255-1258.
79. Ciulla TA, Chriswell MH, Danis RP, Fronheiser M, Yuan P, TA C, et al.
Choroidal neovascular membrane inhibition in a laser treated rat model with
intraocular sustained release triamcinolone acetonide microimplants. Br J
Ophthalmol 2003;87:1032-1037.
80. Spaide RF, Sorenson J, Maranan L. Photodynamic therapy with verteporfin
combined with intravitreal injection of triamcinolone acetonide for choroidal
neovascularization. Ophthalmology 2005;112(2):301-304.
81. Spaide RF, Sorenson J, Maranan L. Combined photodynamic therapy with
verteporfin and intravitreal triamcinolone acetonide for choroidal neovascularization.
Ophthalmology 2003;110(8):1517-1525.
82. Jonas JB, Kreissig I, Degenring R. Intravitreal triamcinolone acetonide for
treatment of intraocular proliferative, exudative, and neovascular diseases. Prog
Retin Eye Res 2005;In Press, Corrected Proof.
83. Larsson J, Zhu M, Sutter F, Gillies MC. Relation between reduction of foveal
thickness and visual acuity in diabetic macular edema treated with intravitreal
triamcinolone. Am J Ophthalmol 2005;In Press, Corrected Proof.
84. Al-Haddad CE, Jurdi FA, Bashshur ZF. Intravitreal triamcinolone acetonide
for the management of diabetic papillopathy. Am J Ophthalmol 2004;137(6):1151-
1153.
85. Bakri SJ, Kaiser PK. Posterior subtenon triamcinolone acetonide for
refractory diabetic macular edema. Am J Ophthalmol 2005;139(2):290-294.
101
86. Conway MD, Canakis C, Livir-Rallatos C, Peyman GA. Intravitreal
triamcinolone acetonide for refractory chronic pseudophakic cystoid macular edema.
J Cataract Refract Surg 2003;29(1):27-33.
87. Jonas JB. Intravitreal triamcinolone acetonide for treatment of sympathetic
ophthalmia. Am J Ophthalmol 2004;137(2):367-368.
88. Paganelli F, Cardillo J, Melo L, Oliveira A, Skaf M, Costa R. A single
intraoperative sub-tenon's capsule triamcinolone acetonide Injection for the treatment
of post cataract surgery inflammation. American Academy of Ophthalmology
2004;111(11).
89. Park CH, Jaffe GJ, Fekrat S. Intravitreal triamcinolone acetonide in eyes with
cystoid macular edema associated with central retinal vein occlusion. Am J
Ophthalmol 2003;136(3):419-425.
90. Rechtman E, Allen VD, Danis RP, Pratt LM, Harris A, Speicher MA.
Intravitreal triamcinolone for choroidal neovascularization in ocular histoplasmosis
syndrome. Am J Ophthalmol 2003;136(4):739-741.
91. Obata R, Iriyama A, Inoue Y, Takahashi H, Tamaki Y, Yanagi Y.
Triamcinolone acetonide suppresses early proangiogenic response in retinal pigment
epithelial cells after photodynamic therapy in vitro. Br J Ophthalmol 2007;91(1):100-
4.
92. Smithen LM, Ober MD, Maranan L, Spaide RF. Intravitreal triamcinolone
acetonide and intraocular pressure. Am J Ophthalmol 2004;138(5):740-743.
93. Scott IU, Flynn J, Harry W., Rosenfeld PJ. Intravitreal triamcinolone
acetonide for idiopathic cystoid macular edema. Am J Ophthalmol 2003;136(4):737-
739.
94. Kramer M, Ehrlich R, Snir M, Friling R, Mukamel M, Weinberger D, et al.
Intravitreal injections of triamcinolone acetonide for severe vitritis in patients with
incomplete Behcet's disease. Am J Ophthalmol 2004;138(4):666-667.
95. Jonas JB, Degenring RF, Kreissig I, Akkoyun I, Kamppeter BA. Intraocular
pressure elevation after intravitreal triamcinolone acetonide injection.
Ophthalmology 2005;112(4):593-598.
96. Krause H-J, Schwarz A, Rohdewald P. Polylactic acid nanoparticles, a
colloidal drug delivery system for lipophilic drugs. Int J Pharm 1985;27(2-3):145-
155.

102
97. Yeung C, Chan K, Chan C, Pang C, Lam D. Cytotoxicity of triamcinolone on
cultured human retinal pigment epithelial cells: comparison with dexamethasone and
hydrocortisone. Jpn J Ophthalmol. 2004;48:236-242.
98. Yeung C, Chan K, Chiang S, Pang C, Lam D. The toxic and stress responses
of cultured human retinal pigment epithelium (ARPE19) and human glial cells
(SVG) in the presence of triamcinolone. Invest Ophthal Vis Science
2003;44(12):5293-5300.
99. Beletsi A, Panagi Z, Avgoustakis K. Biodistribution properties of
nanoparticles based on mixtures of PLGA with PLGA-PEG diblock copolymers. Int
J Pharm 2005;298:233-241.
100. Berton M, Allemann E, Stein CA, Gurny R. Highly loaded nanoparticulate
carrier using an hydrophobic antisense oligonucleotide complex. Eur J Pharm Sci
1999;9(2):163-170.
101. Niwa T, Takeuchi H, Kunou N, Kawashima Y. Preparations of biodegradable
nanospheres of water soluble and insoluble drugs with D,L-lactide/glycolide
copolymer by a novel spontaneous emulsification solvent diffusion method and the
drug release behaviour. J Control Rel 1993;25:89-98.
102. Leo E, Brina B, Forni F, Vandelli MA. In vitro evaluation of PLA
nanoparticles containing a lipophilic drug in water-soluble or insoluble form. Int J
Pharm 2004;278(1):133-141.
103. Song CX, Labhasetwar V, Murphy H, Qu X, Humphrey WR, Shebuski RJ, et
al. Formulation and characterization of biodegradable nanoparticles for intravascular
local drug delivery. J Control Rel 1997;43(2-3):197-212.
104. Zambaux MF, Bonneaux F, Gref R. Influence of experimental parameters on
the characteristics of poly (lactic acid) nanoparticles prepared by a double emulsion
method. J Control Rel 1998;50(1-3):31-40.
105. Jeong Y, Shim Y, Choi C, Jang M, Shin G, Nah J. Surfactant-Free
Nanoparticles of Poly(DL-Lactide-co-Glycolide) Prepared with Poly(L-
Lactide)/Poly(Ethylene Glycol). Journal of Applied Polymer Science 2003;89:1116-
1123.
106. Murakami H, Kawashima Y, Niwa T, Hino T, Takeuchi H, Kobayashi M.
Influence of the degrees of hydrolyzation and polymerization of poly(vinylalcohol)
on the preparation and properties of poly(-lactide-co-glycolide) nanoparticle. Int J
Pharm 1997;149(1):43-49.

103
107. Borges O, Corderio-da-Silva A, Romeijn SG, Amidi M, de Sousa A,
Borchard G, et al. Uptake studies in rat Peyer's patches, cytotoxicity and release
studies of alginate coated chitosan nanoparticles for mucosal vaccination. J Control
Rel 2006;114:348-358.
108. Zhang Z, Feng SS. The drug encapsulation efficiency, in vitro drug release,
cellular uptake and cytotoxicity of paclitaxel-loaded poly(lactide)-tocopheryl
polyethylene glycol succinate nanoparticles. Biomaterials 2006;27(21):4025-33.
109. Miglietta A, Cavalli R, Bocca C, Gabriel L, Gasco MR. Cellular uptake and
cytotoxicity of solid lipid nanospheres (SLN) incorporating doxorubicin or
paclitaxel. Int J Pharm 2000;210:61-67.
110. Shaikh S, Ho S, Engelmann LA, Klemann SW. Cell viability effects of
triamcinolone acetonide and preservative vehicle formulations. Br J Ophthalmol
2006;90:233-236.
111. Szurman P, Kaczmarek R, Spitzer MS, Jaissle GB, Decker P, Grisanti S, et
al. Differential toxic effect of dissolved triamcinolone acetonide and its crystalline
deposits on cultured human retinal pigment epithelium (ARPE 19) cells. Exp Eye
Res 2006;83:584-592.
112. Bejjani RA, BenEzra D, Cohen H, Rieger J, Andrieu C, Jeanny JC, et al.
Nanoparticles for gene delivery to retinal pigment epithelial cells. Mol Vis
2005;11:124-32.
113. Kwon SS, Nam YS, Lee JS, Ku BS, Han SH, Lee JY, et al. Preparation and
characterization of coenzyme Q10-loaded PMMA nanoparticles by a new
emulsification process based on microfluidization. Colloids and Surfaces A:
Physicochemical and Engineering Aspects 2002;210(1):95-104.
114. Anderson JM, Shive MS. Biodegradation and biocompatibility of PLA and
PLGA microspheres. Adv Drug Del Rev 1997;28(1):5-24.
115. Gorner T, Gref R, Michenot D, Sommer F, Tran MN, Dellacherie E.
Lidocaine-loaded biodegradable nanospheres. I. Optimization of the drug
incorporation into the polymer matrix. J Control Rel 1999;57:259-268.
116. Bilati U, Alleman,E, Doelker,E. Development of a nanoprecipitation method
intended for the entrapment of hydrophilic drugs into nanoparticles. Eur J Pharm Sci
2005;24:67-75.

104
Every reasonable effort has been made to acknowledge the owners of copyright
material. I would be pleased to hear from any copyright owner who has been omitted
or incorrectly acknowledged.

105
APPENDIX
Appendix 1: A sample of LOD/LOQ calculation
Noise :Injection No. Noise (6SD)
1 0.044 LOD2 0.052 = (3 x Average of noise SD) : slope of std Conc vs height3 0.032 = 0.053 (μg/ml)4 0.0365 0.037 LOQ6 0.055 = (10 x Average of noise SD) : slope of std Conc vs height
Average 0.042 = 0.18 (μg/ml)SD 0.009
Linearity of detector response
y = 2.3913x + 0.1243
R2 = 10
50
100
150
0 10 20 30 40 50 60
Concentration (g/ml)
Hei
ghts
(m
Au)

106
Appendix 2: Purity factor of TA peak on HPLC assay

107
Appendix 3: Data of TA potency and degradation products
(a) TA stability in ACN: mobile phase 1:1 over 72 hours
at three different temperatures
Time (h) Potency (%)* Degradation product (%) 4ºC 25ºC 37ºC 4ºC 25ºC 37ºC
0 100.00 100.00 100.00 0.00 0.00 0.00 3 100.00 99.19 99.44 0.00 0.81 0.56 6 99.62 98.68 98.54 0.38 1.32 1.46 9 100.00 98.84 97.98 0.00 1.16 2.02 24 100.00 98.77 96.33 0.00 1.23 3.67 72 95.88 95.48 97.31 4.12 4.52 2.69
(b) TA stability in PBS pH 7.4 over 72 hours
at three different temperatures
Time (h)
Potency (%)* Degradation product (%) 4ºC 25ºC 37ºC 4ºC 25ºC 37ºC
0 100.00 100.00 100.00 0.00 0.00 0.00 3 97.90 97.37 95.68 2.10 2.63 4.32 6 97.33 96.46 94.53 2.67 3.54 5.47 9 99.00 98.00 94.29 1.00 2.00 5.71 24 97.21 92.80 84.49 2.79 7.20 15.51 72 95.73 88.44 60.23 4.27 11.56 39.77
(c) TA stability in PBS-NaN3 over 72 hours
at three different temperatures
Time (h)
Potency (%)* Degradation product (%) 4ºC 25ºC 37ºC 4ºC 25ºC 37ºC
0 100.00 100.00 100.00 0.00 0.00 0.00 3 96.56 97.84 95.67 3.44 2.16 4.33 6 95.57 94.81 93.40 4.43 5.19 6.60 9 99.24 97.71 92.88 0.76 2.29 7.12 24 96.82 93.95 82.03 3.18 6.05 17.97 72 93.60 85.63 57.05 6.40 14.37 42.95
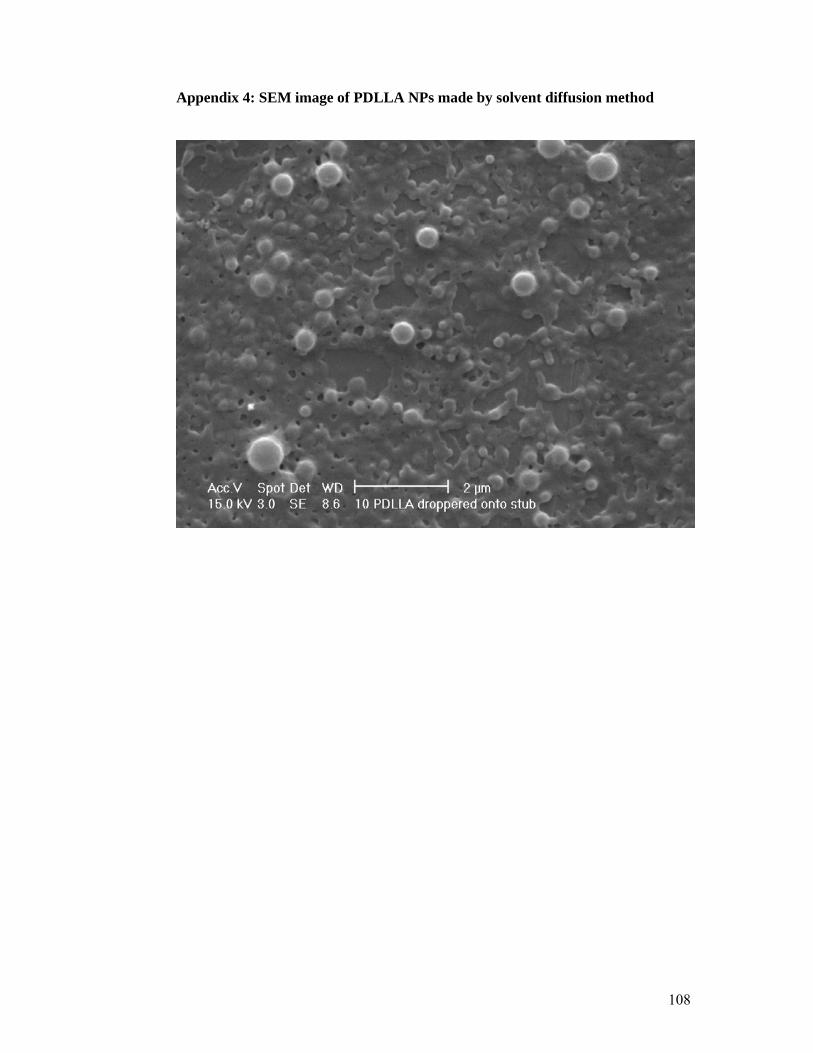
108
Appendix 4: SEM image of PDLLA NPs made by solvent diffusion method

109
Appendix 5: Turbidity data
Time (min)
Absorbance TA PDLLA mPEG PLGA
0 0.003 3.786 3.767
2 0.015 3.889 3.806
5 0.389 3.603 3.697
10 0.370 3.852 3.842
15 0.309 3.994 3.999
20 0.268 3.555 3.690
25 0.379 3.903 3.920
30 0.350 3.727 3.998

110
Appendix 6: Particle measurement by FESEM on TA-MPEG PLGA
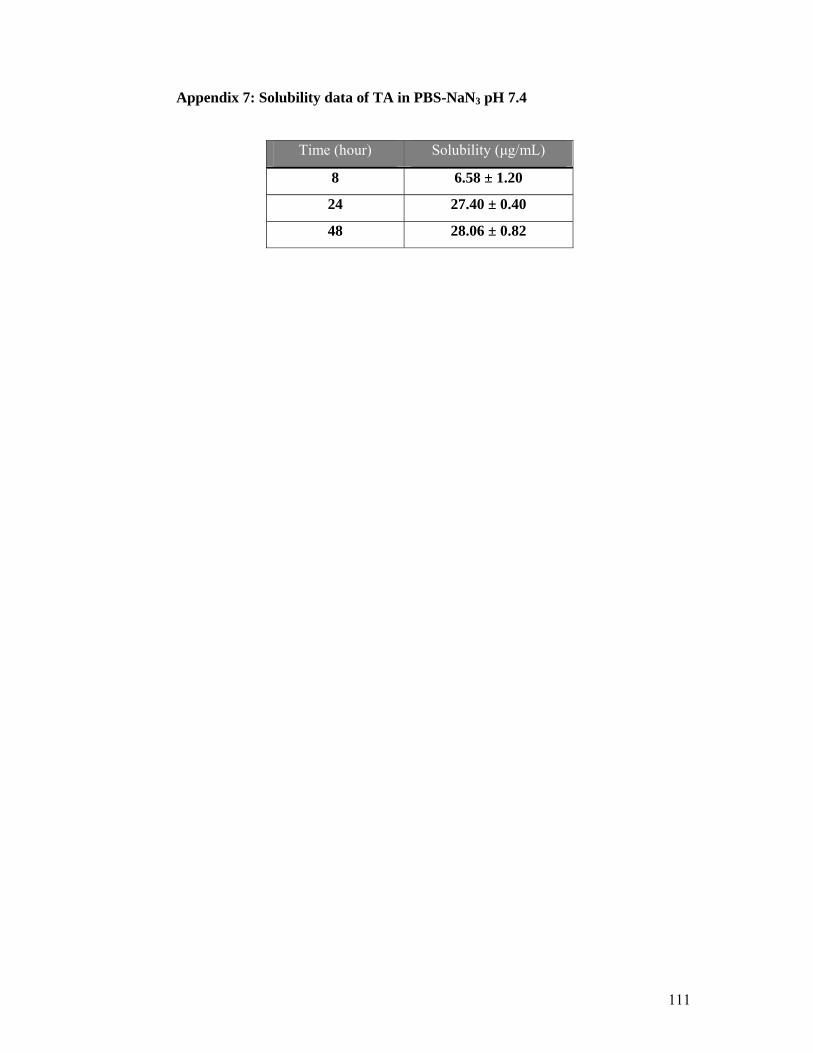
111
Appendix 7: Solubility data of TA in PBS-NaN3 pH 7.4
Time (hour) Solubility (μg/mL)
8 6.58 ± 1.20
24 27.40 ± 0.40
48 28.06 ± 0.82