Development and Evaluation of Performance Tests to ... and Evaluation of Performance Tests to...
22
Development and Evaluation of Performance Tests to Enhance Superpave Mix Design and Implementation in Idaho USDOT Assistance No. DTOS59-06-G-00029 (NIATT Project No. KLK479) ITD Project No. RP 181 (NIATT Project No. KLK483) Quarterly Progress Report – QR3 For the period Jan.1 st to Mar. 31 st , 2008 Submitted to U.S. Department of Transportation Ed Weiner, COTR And Idaho Transportation Department Ned Parrish, Research Manager Michael J. Santi, PE, Assistant Material Engineer UI Research Team Dr. Fouad Bayomy, PI Dr. S. J. Jung, Co-PI Dr. Thomas Weaver, Co-PI Dr. Richard Nielsen, Co-PI Mr. Ahmad Abu Abdo, Graduate Research Assistant Mr. Seung II Baek, Graduate Research Assistant University of Idaho (UI) National Institute for Advanced Transportation Technology (NIATT) Center for Transportation Infrastructure (CTI) March 31, 2008
Transcript of Development and Evaluation of Performance Tests to ... and Evaluation of Performance Tests to...

Development and Evaluation of Performance Tests to Enhance Superpave Mix Design and Implementation in Idaho
USDOT Assistance No. DTOS59-06-G-00029 (NIATT Project No. KLK479)
ITD Project No. RP 181 (NIATT Project No. KLK483)
Quarterly Progress Report – QR3 For the period
Jan.1st to Mar. 31st, 2008
Submitted to
U.S. Department of Transportation
Ed Weiner, COTR
And
Idaho Transportation Department Ned Parrish, Research Manager
Michael J. Santi, PE, Assistant Material Engineer
UI Research Team Dr. Fouad Bayomy, PI Dr. S. J. Jung, Co-PI Dr. Thomas Weaver, Co-PI Dr. Richard Nielsen, Co-PI Mr. Ahmad Abu Abdo, Graduate Research Assistant Mr. Seung II Baek, Graduate Research Assistant University of Idaho (UI) National Institute for Advanced Transportation Technology (NIATT) Center for Transportation Infrastructure (CTI)
March 31, 2008

1. Introduction
This project addresses the implementation of the Superpave mix design system in the state of Idaho. The project focuses on developing asphalt mix tests and tools to assess the mix quality and performance at the mix design stage. These tests and tools are intended to augment the current Superpave mix design procedures. The project focuses on two areas of mix evaluation, deformation and fatigue fracture. The project plan is divided into four phases, where most of the research work is done under phases A and B. Phase A focuses on the mix resistance to deformation, where phase B focuses on the fatigue fracture. Phase C of the project is devoted to developing and offering a training program to aid the ITD engineers to implement the products of the research. And, final Phase D is dedicated to the final report. Detailed plans for these phases have been presented in the project proposal. The progress so far has been presented in an initial progress report that was submitted to the USDOT (Mr. Kyle Gracey) in May 2007. It summarized the work progress since the inception of the USDOT assistance contract till May 2007. After the inception of the ITD contract in July 2007, two Quarter reports have been submitted; QR1 in September and QR2 in December, 2007. All these reports are posted on the project reports web page at: http://www.webs1.uidaho.edu/bayomy/KLK479-483/QReports.htm. This report is the third Quarterly Report, QR3 which covers the work progress during the period January to March 2008.
2. Progress by Task
The chart in Table 1 summarizes the progress as % work completed as of March 31, 2008. Table 1 Approximate Level of Work Completed by Task at the end of Quarter 3
Phase / TaskQuarter
Month 7 8 9 10 11 12 1 2 3 4 5 6 7 8 9 10 11 12 1 2 3 4 5 6 7 8 9 10 11
Task A1 – Review of previous studies and available data 10% 10% 2% 0% 2% 6% 0% 10% 40%
Task A2 – Analytical Analysis 12% 2% 4% 0% 7% 0% 5% 30%Task A3 – Experimental Design, Binder and Agg. Eval. 15% 15% 10% 5% 15% 0% 5% 10% 75%
Q2 Q3 Q4Calendar Yr 2007
Year 1 Year 2 Year 3
Phase A: Evaluation of Mix Resistance to Deformation
Tot
al %
T
ask
Com
plet
ed
Q1 Q2 Q3 Q4 Q1Calendar Yr 2008 Calendar Yr 2009
Task A4 – Prep and Evaluation of Asphalt Mixtures 5% 5% 10% 15% 20% 15% 15% 85%
Task A5 – Data Analysis 10% 0% 5% 15%
Task B1 – Literature Review 10% 15% 5% 5% 5% 5% 0% 5% 50%
Task B2 – Finite Element Analysis 5% 5% 5% 5% 15% 5% 40%Task B3 – Development of the Fracture Test Procedure
12% 2% 5% 16% 35%
Task B4 – Prep and Evaluation of Asphalt Mixtures 0% 15% 10% 25%
Task B5 – Data Analysis 0%
Task B6 – Reliability Analysis 0%
Task C1 – Development of Implementation Plan 0%
Task C2 – Training Program for ITD Personnel 0%
Tasks A6, B7 and C3 – Quarter Reports for USDOT R1 R2 R3 R4 R5 R6 R7 Final 0%
Task D1: External peer review of the final report 0%
Task D2: Final report review by ITD 0%
Task D3: Final Report Submittal 0%
Phase C: Implementation of Research Products and Training
Reporting
Phase D: Final Report Review and Submittal
Phase B: Evaluation of Mix Resistance to Fracture and Fatigue Cracking
1

Work performed during the report period in the various project tasks is described below: Phase A: Evaluation of Mix Resistance to Deformation Task A1 – Review of previous studies and available data During this quarter, work was limited to study the development of E* (Dynamic Modulus) master curve for asphalt mixtures. Literature survey that was done on the models of E*has been documented in the previous quarterly reports. The work completed in this task is estimated by about 40%. Task A2 – Analytical Analysis The focus of this task is on the development of constitutive models that relate the mix properties to the properties of its constituents. Research efforts during this quarter focused on reviewing work related to visco-elasto-plastic models. A summary of the literature review during this quarter is presented in Appendix A of this report. The work completed in this task is estimated by about 30% Task A3 – Experimental Design, Binder and Aggregate Evaluation Binder testing: All binder testing is now completed, and has been reported in QR2. Binder grade verification is being conducted by ITD, and it is still is in progress. Aggregate testing: Other than the aggregate gradations that have been identified in QR1 report, no further evaluation on aggregates have been made in this period. Aggregates Imaging System (AIMS) Testing is pending. The work completed in this task is estimated to be about 75%. Task A4 – Preparation and Evaluation of Asphalt Mixtures During this quarter, work in this task focused on the preparation of lab samples for E* testing. Simultaneously, samples for Jc and triaxial testing are also being prepared for the designated mixes. More than 85% of the samples required for lab and field mixes have been prepared. Sample preparation and testing in E* at various temperatures and under designated load frequency is in progress. For the prepared samples, Gyratory Stability Testing: 100% completed.
E-star and Flow number Testing: 100% completed. APA test: in progress at ITD. Image Analysis: pending.
A summary of total number of samples is presented in Table 2.
2

Table 2: Total Number of Prepared Test Samples
Mix PG AC% APA E* Image Jc/Jc* Notes
70‐28 4.90% 2 2 3 1570‐28 5.40% 2 2 3 670‐28 4.40% 2 2 3 664‐28 4.90% 2 2 3 658‐28 4.90% 2 2 3 670‐22 4.90% 2 2 3 1570‐34 4.90% 2 2 3 1564‐34 4.35% 2 2 3 1564‐34 4.85% 2 2 3 664‐34 3.85% 2 2 3 670‐34 4.35% 2 2 3 658‐34 4.35% 2 2 3 664‐22 4.35% 2 2 3 1564‐28 4.35% 2 2 3 1570‐28 4.90% 2 2 3 6
Coarse Mix 70‐28 4.90% 2 2 2 2Fine Mix 70‐28 4.90% 2 2 2 2
1 70‐28 4.90% 2 2 ‐ 32 60‐34 4.35% 2 2 ‐ 33 70‐28 5.40% 2 2 ‐ 34 58‐34 6.20% 2 2 ‐ 35 70‐28 5.12% 2 2 ‐ 36 70‐28 5.90% 2 2 ‐ 37 70‐28 5.10% 2 2 ‐ 3
Total 48 48 49 169 314
1
2
Lab Mixes
Field Mixes
Work completed in this task is estimated by about 85% Task A5 – Data Analysis Preliminary data analysis has been conducted on the Gyratory stability (GS) data to determine the relationship of GS and other mix properties including (aggregate structure, asphalt content, and mix density). The analysis is presented in Appendix B of this report. Work completed in this task is estimated by about 15% Phase B: Evaluation of Mix Resistance to Fracture and Fatigue Cracking Task B1 – Literature Review on Fracture Limited work on the literature was done during March 07 since the focus was on other tasks. Generally the literature review on fracture during this quarter was limited to numerical modeling. The reviewed literature was presented in QR2 and in Appendix C of this report. The work completed in this task is estimated to be about 45%.
3

Task B2 – Finite Element Analysis Since the departure of the graduate student (Mr. Gone) in December, we could not fill his position, and this affected the developments in this task a great deal. However, Dr. Weaver (PI in charge of this task) has spent considerable time to learn and test the Finite Element package ABAQUS. In addition, previous studies to model rutting in ABAQUS and verify it by APA results have been reviewed. A summary is also presented in Appendix A. The effort spent in this task, so far, is estimated by about 40% of the work level in this task. Task B3 – Development of the Fracture Test Procedure The focus of this task is on the development of a simple test to predict fatigue cracking from a simple fracture test under static loading condition. The goal is to link a simple static fracture test to a dynamic fracture test, and develop correlations from which the fatigue can be estimated from the simple fracture test. During this quarter, the work involved research into numerical modeling. A summary of the research activity under this task is presented in Appendix C. The work completed in this task so far is estimated by about 35%. Task B4 – Prep and Evaluation of Asphalt Mixtures During this quarter focus of this task was on developing trial samples to test the applicability of the models being investigated under Task B3. More the 30 cylindrical samples were prepared, sliced and notched from a trial field mix. Details of the activity in task are also summarized in Appendix C of the report. The work completed in this task so far is estimated by about 25%. Tasks B5, B6 and Phases C and D Work in these tasks and phases did not commence yet.
3. Equipment Development and Troubleshooting
During this quarter research team focused on the upgrade of the MTS machine. 1. A new controller has been acquired. Trial testing is underway. 2. An in-house system for sample coring, slicing and notching have been developed and
used for sample preparation for fracture tests. 3. Work is still in progress on developing a temperature control room for low temperature
fracture testing.
4. Summary
The main outcomes that have been achieved during this quarter can be summarized as follows: 1. MTS testing system controller is procured. The testing frame is being upgraded and
adapted to conduct fracture test. 2. Coring and notching jigs for preparation Jc samples are complete and operational. 3. Progress in building a cooling system for fracture testing at low temperature.
4

5
4. All filed mixes have been obtained. 5. Preparation of Samples for E* and Gyratory Stability are complete. Testing is still in
progress. 6. Preliminary analysis for GS data is conducted. 7. Continued literature review
Appendices Appendix A: Literature Review on Numerical Modeling of Asphalt Concrete Appendix B: Initial Analysis of Test Results - Gyratory Stability data Appendix C: Fracture Test – Development and Modeling

Appendix A Literature Review on Numerical Modeling of Asphalt Concrete (Prepared by: Thomas Weaver)
1 Introduction In previous reports, we have presented background information on constitutive models that can be used to predict the stress-strain response of asphalt pavements under physical and environmental loads. After reviewing the literature, we have identified two constitutive models which will be used for future numerical modeling of asphalt pavement response. These constitutive models are available for use in the finite element analysis software ABAQUS (2003). These models are reviewed below, and our plan for implementation of these models is presented.
2 Viscoelastic Model Viscoelastic models are appropriate for materials that are rate-dependent in response to applied loads and at strain levels where significant permanent deformations do not occur. The rate-dependency/viscous response of asphalt pavement material is illustrated in Figure 1, where the strain in the sample lags behind the applied cyclic stress. Since E* tests are performed at relatively low strain amplitudes, it may be feasible to model the E* test using a viscoelastic model. The rheologic model for the viscoelastic constitutive relation implemented in ABAQUS is shown in Figure 2, where a number of springs/dashpots act in parallel. The number of material constants is a function of the number of springs/dashpots. The material constants can be back-calculated using measured test results. Once material constants have been back-calculated using data from some E* tests, we plan to develop relationships between the material constants and asphalt pavement material properties. As a result, this may become a useful model for assessing changes in E* based on changes in the constituents of asphalt pavements.
Figure 1 Representation of E* test results.
QR3_Appendix A: Literature Review on Numerical Modeling - Page 1

F(t) – Force response
spring
dashpot
u(t) – input displacement
Figure 2: Rheologic model for viscoelastic material response as implemented in ABAQUS
3 Viscoplasticity Viscoplastic models allow for estimating permanent deformations of a material resulting from time dependent loading. A power law viscoplastic model available in the computer program ABAQUS has successfully been used to model permanent deformation of asphalt pavement associated with an Asphalt Pavement Analyzer (APA) test (Pirabarooban et al. 2003). Results published by Pirabarooban are shown in Figure 3 below. The constitutive equation requires only three material constants. Our efforts will be spent on back-calculating these three material constants using results from E* and/or APA tests. Then we will develop empirical relationships between the material constants and various properties of the asphalt pavement constituents (e.g. binder G*, aggregate gradation, etc.).
Figure 2 Measured and predicted APA rut depth vs number of load cycles (Pirabarooban et al. 2003).
4 Summary Two constitutive models available within the finite element analysis software ABAQUS will be used to model E* and APA test results. Our objective is to back‐calculate the material constants required for each constitutive model, and then correlate the material constants to asphalt pavement properties.
QR3_Appendix A: Literature Review on Numerical Modeling - Page 2

QR3_Appendix A: Literature Review on Numerical Modeling - Page 3
Thus, the material constants for these constitutive models can be determined for other pavement mixes. Simple finite element analyses can then be used to estimate E* for use in the mechanistic‐empirical design of highway pavement sections.
5 References
ABAQUS/Theory Manual (2003). Version 6.4, Hibbit, Karlson & Soren
Pirabarooban, S., Zaman, M., and Tarefder, R.A. (2003). “Evaluation of rutting potential in asphalt mixes using finite element modeling,” 2003 Annual Conference of the Transportation Association of Canada, 16p.

Appendix B Initial Analysis of Test Results ‐ Gyratory Stability data (Prepared by: A. AbuAbdo)
1. Introduction The analysis conducted under Task A5 was focused on the Gyratory Stability results. The purpose was to determine the interaction of the aggregate structure and mix volumetric properties on the GS value of the mix. No other mechanical testing was used in this analysis such as APA results or E* since they are still in progress.
2. Aggregates Structure To study the effect of changes in mix properties on the Gyratory Stability (GS), the experimental program was designed to test four different aggregate structures; Mix 1 (25mm mix), Mix 2 (19mm mix), very coarse mix (25mm mix) and fine mix (4.75mm mix) (Figure 1). To ensure that only the change in aggregate structure is evaluated, these mixes were designed using the same asphalt binder grade and content. GS Results presented in Figure 2, showed the finer the mix the lower GS would be, thus the lower the mix stability, until a point is reached where the lack of fine materials causes the mix to become less stable, due to the decrease of friction between aggregate particles that is necessary for aggregate interlocking. In addition, when comparing the two mixes’ GS values, Mix 1 yielded higher GS values, which led to the conclusion that Mix 1 shall perform better than Mix 2 under the same loading conditions.
0%
10%
20%
30%
40%
50%
60%
70%
80%
90%
100%
0.01 0.1 1
Passing, %
Sieve Size, mm (.45 power chart)
Coarse Mix (25mm)
Mix 1 (25mm)
Mix 2 (19mm)
Fine Mix (4.75mm)
Figure 1: Mixes Aggregates Gradation Chart
QR3_Appendix B: Preliminary Data Analysis - Page 1
8
9
10
11
12
13
14
15
16
Fine Mix Mix 2 Mix 1 Coarse Mix
GS, kN.m
Lab Mixes
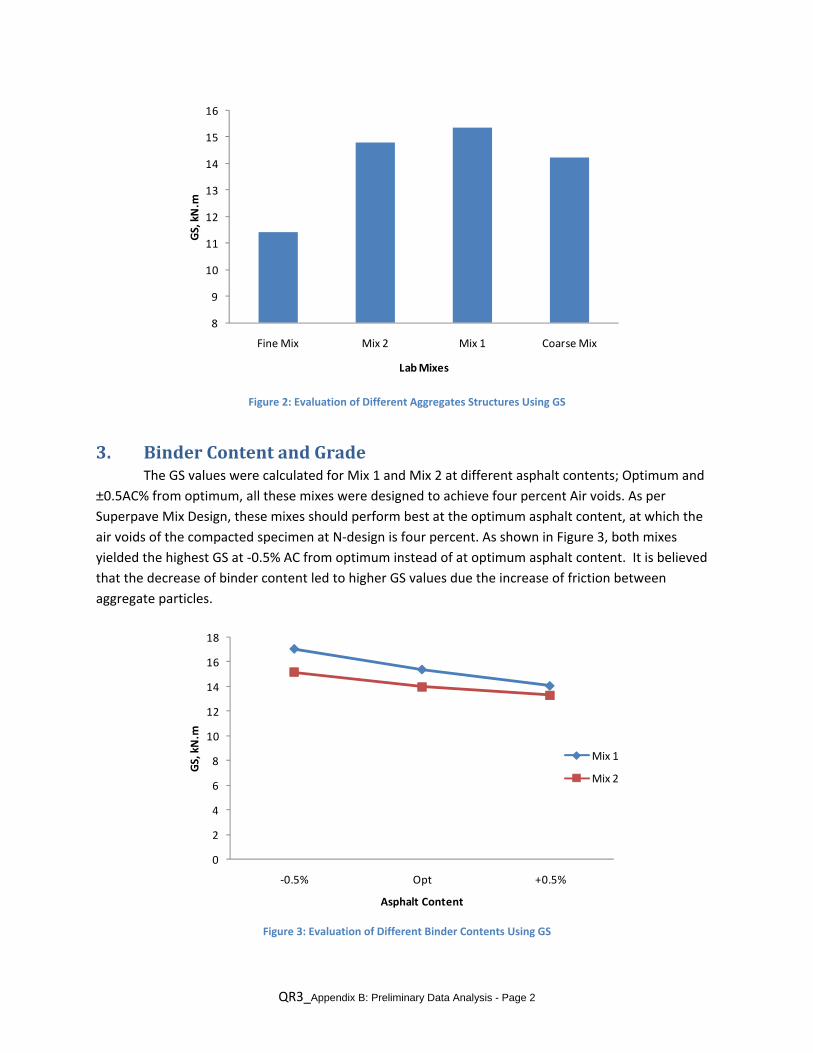
Figure 2: Evaluation of Different Aggregates Structures Using GS
3. Binder Content and Grade The GS values were calculated for Mix 1 and Mix 2 at different asphalt contents; Optimum and ±0.5AC% from optimum, all these mixes were designed to achieve four percent Air voids. As per Superpave Mix Design, these mixes should perform best at the optimum asphalt content, at which the air voids of the compacted specimen at N‐design is four percent. As shown in Figure 3, both mixes yielded the highest GS at ‐0.5% AC from optimum instead of at optimum asphalt content. It is believed that the decrease of binder content led to higher GS values due the increase of friction between aggregate particles.
0
2
4
6
8
10
12
14
16
18
‐0.5% Opt +0.5%
GS, kN.m
Asphalt Content
Mix 1
Mix 2
Figure 3: Evaluation of Different Binder Contents Using GS
QR3_Appendix B: Preliminary Data Analysis - Page 2

GS sensitivity to binder type (PG grade) was evaluated for these two mixes. It was speculated that GS would not capture the changes in binder grade, since GS is determined while compaction, when all binders are heated to achieve the same viscosity (0.28±0.30 Pa.s) and the difference in grade does not influence the performance of the mix at these temperatures. The results (FIGURE 3) showed as expected that overall GS is not very sensitive to the changes in binder grade.
0
2
4
6
8
10
12
14
16
18
70‐28 58‐28 64‐28 70‐22 70‐34
GS, kN.m
Binder Grade
Mix 1
GSaverage = 15.37 kN.m
0
2
4
6
8
10
12
14
16
18
64‐34 58‐34 70‐34 64‐22 64‐28
GS, kN.m
Binder Grade
Mix 2
GSaverage = 14.49 kN.m
Figure 4: Evaluation of Different Binder Grades Using GS
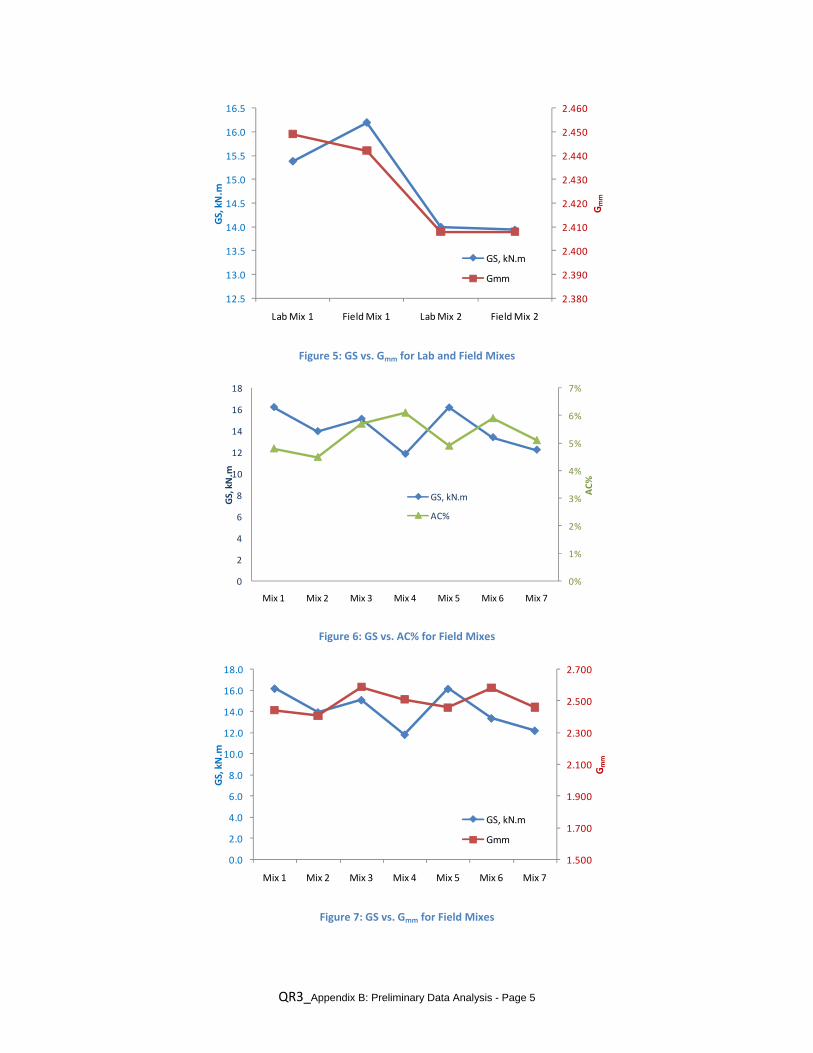
4. Quality Control Measurements To evaluate the possibility of utilizing GS as a quality control tool in the field, GS values for lab mixes were compared to field mixes. When tested, Field Mix 1 had different mix properties than the mix design (lab mix). Field Mix 2 exhibited the same mix properties as the mix design. When GS was compared for lab and field mixes, it was found that GS could capture the changes in mix properties as
QR3_Appendix B: Preliminary Data Analysis - Page 3

shown in Figure 5. Results showed that GS for Mix 1 changed with the change of mix properties (e.g. Gmm). Mix 2 GS values were the same for field and lab mix due to no change has occurred in mix properties. In addition, GS was evaluated for other five field mixes (Figure 6 and Figure 7). A trend has been observed, the lower the asphalt content the higher the GS values (Figure 6), due to the increase of friction and interlocking between aggregate particles. Field Mixes details are presented in Table 1.
Table 1: Field Mix Properties
Mix ID 1 2 3 4 5 6 7
ProjectJerome IC, Topaz to Lava Hot
Springs Lapwai to Spalding Washington State
Line to US 95/SH6US-20 MP 112.90 to MP 124.63
Pullman to Idaho State Line, WA-270 (1/2 inch Mix)
Pullman to Idaho State Line, WA-270 (1 inch Mix)
Project # IM-84-3 (074) 165 NH-A010 (455) NH-4110 (144) S07209A NH-3340 (109)
Key# 8896 10455 8353 8883 9106 7120 7120
Class SP4 SP3 SP3 SP2 SP3 SP3 SP3
ESALs > 30x106 3 - 30x106 3 - 30x106 0.3 - 3x10⁶ 3 - 30x106 3 - 30x106 3 - 30x106
N-design 125 100 100 75 100 100 100
Gmm 2.449 2.424 2.568 2.480 2.448 2.581 2.460
AV% 4% 4% 4% 4% 4% 3.5% 3.5%
Sample wt, gr 4700 4600 4800 4600 4750 - -
PG 70-28 64-34 70-28 58-34 70-28 70-28 70-28
Pb% 4.90% 4.35% 5.40% 6.20% 5.12% 5.90% 5.10%
Gb 1.021 1.025 1.034 1.009 1.021 1.036 1.036
Mix Temp., °F 330 335 323 323 330 328 328
Comp. Temp., °F 305 307 293 285 305 305 305
Gsb 2.586 2.558 2.771 2.731 2.589 2.822 2.822
Gse 2.639 2.568 2.808 2.744 2.648 - -
Absorption 1.3% 1.5% 1.9% 1.7% 1.9% - -
%Passing, Sieves
25mm (1") 98% 100% 100% 100% 100% 100% 98%
19 mm (3/4") 86% 100% 97% 100% 100% 100% 90%
12.5mm (1/2") 73% 83% 83% 95% 79% 96% 74%
9.5mm (3/8") 64% 65% 71% 78% 66% 87% 66%
4.75mm (#4) 41% 37% 51% 53% 45% 58% 40%
2.36mm (#8) 27% 25% 34% 35% 32% 36% 25%
1.18mm (#16) 18% 18% 23% 22% 23% 22% 16%
600um (#30) 13% 14% 16% 15% 16% 17% 12%
300um (#50) 10% 11% 11% 12% 9% 13% 10%
150um (#100) 5% 7% 8% 9% 5% 8% 7%
75um (#200) 4.0% 4.7% 5.9% 6.8% 4.0% 6.4% 5.7%
Mix Properties
Binder Properties
Aggregates Properties
QR3_Appendix B: Preliminary Data Analysis - Page 4
2.380
2.390
2.400
2.410
2.420
2.430
2.440
2.450
2.460
12.5
13.0
13.5
14.0
14.5
15.0
15.5
16.0
16.5
Lab Mix 1 Field Mix 1 Lab Mix 2 Field Mix 2
Gmm
GS, kN.m
GS, kN.m
Gmm
Figure 5: GS vs. Gmm for Lab and Field Mixes
0%
1%
2%
3%
4%
5%
6%
7%
0
2
4
6
8
10
12
14
16
18
Mix 1 Mix 2 Mix 3 Mix 4 Mix 5 Mix 6 Mix 7AC%
GS, kN.m
GS, kN.m
AC%
Figure 6: GS vs. AC% for Field Mixes
1.500
1.700
1.900
2.100
2.300
2.500
0.0
2.0
4.0
6.0
8.0
10.0
12.0
14.0
16.0
Mix 1 Mix 2 Mix 3 Mix 4 Mix 5 Mix 6 Mix 7
Gmm
GS, kN.m
2.70018.0
GS, kN.m
Gmm
Figure 7: GS vs. Gmm for Field Mixes
QR3_Appendix B: Preliminary Data Analysis - Page 5

QR3_Appendix B: Preliminary Data Analysis - Page 6
5. Conclusions Initial Analysis of GS showed that the Gyratory Stability (GS) could be used as a first screener to
distinguish among mixes for mix design acceptance, especially to decide on the acceptance of the mix aggregate structure and as a quality control tool in the field. The following conclusions and observations are also made:
1. GS was found to be sensitive to any changes of mix properties, especially aggregate structures. When different aggregate structures were evaluated, it was found that the coarser the aggregate structure the higher the stability would be to a point, where the lack of fine materials would lead to less stability due to lower friction between particles.
2. It was found that Mixes with lower asphalt content yielded higher GS values. 3. It is expected that Mix 1 shall have better performance than Mix 2 under the same loading
conditions due to higher GS values for Mix 1. 4. It was found that GS did not capture the changes in binder grades, which was expected. Since GS
is evaluated at compaction temperature where all binders have the same viscosity and has no effect.
5. GS was able to capture the changes of mix properties between Lab and Field mixes, which gives it high potential to be used a quality control tool on site.
6. For field mixes, it was found that mixes with lower the asphalt content yielded higher GS values.
Appendix C Fracture Test – Development and Modeling (Prepared by: S. Jung and Seung Baek)
Task B3 – Development of the Fracture Test Procedure
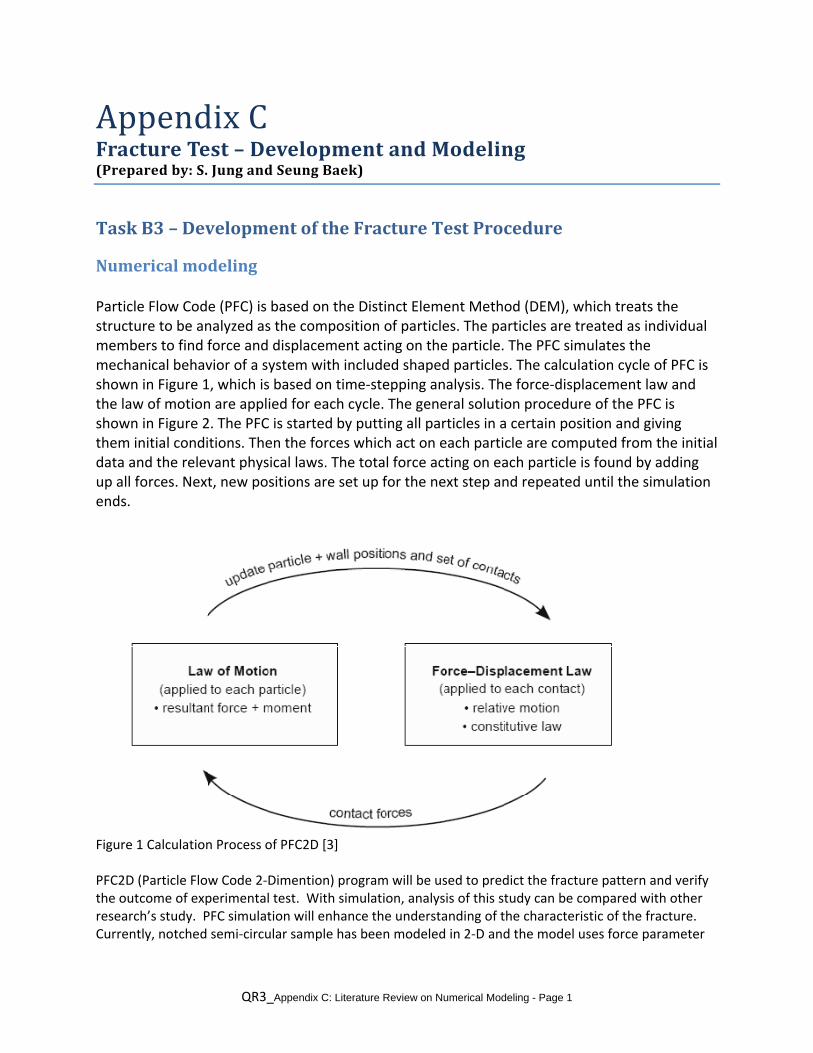
Numerical modeling Particle Flow Code (PFC) is based on the Distinct Element Method (DEM), which treats the structure to be analyzed as the composition of particles. The particles are treated as individual members to find force and displacement acting on the particle. The PFC simulates the mechanical behavior of a system with included shaped particles. The calculation cycle of PFC is shown in Figure 1, which is based on time‐stepping analysis. The force‐displacement law and the law of motion are applied for each cycle. The general solution procedure of the PFC is shown in Figure 2. The PFC is started by putting all particles in a certain position and giving them initial conditions. Then the forces which act on each particle are computed from the initial data and the relevant physical laws. The total force acting on each particle is found by adding up all forces. Next, new positions are set up for the next step and repeated until the simulation ends.
Figure 1 Calculation Process of PFC2D [3] PFC2D (Particle Flow Code 2‐Dimention) program will be used to predict the fracture pattern and verify the outcome of experimental test. With simulation, analysis of this study can be compared with other research’s study. PFC simulation will enhance the understanding of the characteristic of the fracture. Currently, notched semi‐circular sample has been modeled in 2‐D and the model uses force parameter
QR3_Appendix C: Literature Review on Numerical Modeling - Page 1

to test the particles movement for a numerical simulation. Distinct element program, PFC2D (Particle Flow Code), is used to generate a model to compare the test results (Figure 3).
Figure 2 Flow Chart of PFC Program [3]
QR3_Appendix C: Literature Review on Numerical Modeling - Page 2

Figure 3 Semi‐circular notched (0.5‐inch) model for PFC2D before test
PFC2D 3.10
Itasca Consulting Group, Inc.Minneapolis, MN USA
itle: 5-inch Notched half circle
Step 20432 13:14:53 Sat Mar 29 2008
View Size: X: -1.257e-001 <=> 1.257e-001 Y: -1.392e-001 <=> 1.392e-001
BallBall
Task B4 – Prep and Evaluation of Asphalt Mixtures
Simplified Fatigue Test The proposed experimental study is focused on the developing the procedure of simplification of Fatigue Test, especially, on the semi circular notched sample. Semi circular notched sample has been proven that it is easy to prepare and simple to test. Total 92 semi circular samples (Figure 4) of preliminary test specimens were prepared from 23 cylindrical samples from field mixes. Preliminary mix will be used to verify the study parameters including frequency, temperature, and strain rate. Table 1 illustrated the study parameters which were investigated by previous studies. Process of the sample preparation is that the cylindrical samples with dimensions of 6 inch diameter and about 4.7 inch height were cut, and then notched with 0.5 inch notch depth at the bottom center of the sample (Figure 4, 5, & 6) . The preliminary test specimens will be examined with existing model study and testing procedure and experimental set‐up for MTS system will be verified to improve consistency (Figure 7 & 8). MTS control system was upgraded for better control of experiment for static and dynamic test. MTS frame is able to handle up to 22 Kips, and upgraded control system and hydraulic pump are able to handle maximum frequency of 25 Hz with a limited stroke displacement for fatigue (Figure 7). The second group of test samples is being prepared with different combination of several PG grade and asphalt contents (Table 2). Currently, 30 cylindrical samples are prepared and will be notched for fatigue and static tests (Figure 4). Each cylindrical sample will be cut to 4 semi circular specimen. Pre‐determined parameters through literature review will be used to verify
QR3_Appendix C: Literature Review on Numerical Modeling - Page 3

existing method and to develop better correlation between fatigue and static test to accomplish the objective of the research goal. Studying experimental parameters will be followed; temperature at ‐30, 0, 10 and 20 °C, strain rate of 10, 100 and 1000 (10‐6 unit/s) and at 0.1, 1 and 10 Hz, with MTS system (Table 1). Table 1 Test conditions
Temperature (°C) Strain rate (10‐6 units/s)
Frequency (Hz) Monotonic Cyclic
Daniel [1] 5, 20 5, 12, 20 10, 30, 500, 1500 1, 10 Lundstrom [4] 0,10,20 100, 200, 400, 800 10 Medani [3] 5, 15, 20, 25, 30 for n 10‐50 H. J. Lee [2] 25 5
Figure 4 Semi circular notched specimens (0.5‐inch)
QR3_Appendix C: Literature Review on Numerical Modeling - Page 4

Figure 5 Cutting table saw for notching a sample
Figure 6 Semi circular notched specimens (0.5‐inch) for preliminary test
QR3_Appendix C: Literature Review on Numerical Modeling - Page 5

Figure 7 22 Kips testing frame
Figure 8 Three point load testing set‐up on the MTS machine
QR3_Appendix C: Literature Review on Numerical Modeling - Page 6

QR3_Appendix C: Literature Review on Numerical Modeling - Page 7
Table 2 PG Grade and Asphalt Content of samples
Mix PG AC%
1
70‐28 4.90
70‐28 5.40
70‐28 4.40
64‐28 4.90
58‐28 4.90
70‐22 4.90
70‐34 4.90
2
64‐34 4.35
64‐34 4.85
64‐34 3.85
70‐34 4.35
58‐34 4.35
64‐22 4.35
64‐28 4.35
70‐28 4.90
Coarse Mix 70‐28 4.90
Fine Mix 70‐28 4.90
Reference:
1. Daniel, J.S., and Y.R. Kim, Development of a Simplified Fatigue Test and Analysis Procedure using a Viscoelastic Continuum Damage Model. Journal of the Association of Asphalt Pavement Technologists, 2002. Vol. 71: p. pp. 619‐650.
2. Lee, H.J., Y.R.K., and S. W. Lee, Fatigue Life Prediction of Asphalt Mixes Using Viscoelastic Material Properties. J. of Transportation Research Board, 2002.
3. Itasca Consulting Group, I., PFC User's Manual, ver. 3.1. 2004.
4. Lundstrom, R., a.U.I., Characterization of Asphalt Concrete Deterioration Using Monotonic and Cyclic Tests. International Journal of Pavement Engineering, 2003. Volume 4(Issue 3): p. 143 ‐ 153
5. Medani, T.O., A.A.A.M., Estimation of fatigue characteristics of asphaltic mixes using simple tests. Heron, 2000. Vol. 45(No. 3): p. pp. 155‐166.