DEVELOPMENT AND EVALUATION OF A MULTIPLEX ASSAY TO MEASURE
67
DEVELOPMENT AND EVALUATION OF A MULTIPLEX ASSAY TO MEASURE BOVINE IgG1 AND IgG2 USING MICROSPHERES AND FLOW CYTOMETRY By REKHA THADAGAVADI KEMPEGOWDA B.D.S., Mysore University, India, 1999 ------------------------------------------------------------------------------------ A THESIS submitted in partial fulfillment of the requirements for the degree MASTER OF SCIENCE Department of Diagnostic Medicine and Pathobiology College of Veterinary Medicine KANSAS STATE UNIVERSITY Manhattan, Kansas 2005 Approved by: Major Professor Melinda J. Wilkerson
Transcript of DEVELOPMENT AND EVALUATION OF A MULTIPLEX ASSAY TO MEASURE
DEVELOPMENT AND EVALUATION OF A MULTIPLEX ASSAY TO
MEASURE BOVINE IgG1 AND IgG2 USING MICROSPHERES AND
FLOW CYTOMETRY
By
REKHA THADAGAVADI KEMPEGOWDA
B.D.S., Mysore University, India, 1999
------------------------------------------------------------------------------------
A THESIS
submitted in partial fulfillment of the requirements for the degree
MASTER OF SCIENCE
Department of Diagnostic Medicine and Pathobiology College of Veterinary Medicine
KANSAS STATE UNIVERSITY Manhattan, Kansas
2005 Approved by: Major Professor Melinda J. Wilkerson

ABSTRACT Failure of passive transfer (FPT) is one of the main reasons for increased mortality rate in
newborn calves and diagnosis is dependent on determination of serum IgG concentrations
(diagnosis is based on < 1 g/dL of total IgG). Several qualitative assays are available, but
the reference method, single radial immunodiffusion assay (SRID), albeit quantitative
measures only one subclass at a time. We set out to develop a competitive multiplex
microsphere flow cytometry assay to measure bovine IgG1 and IgG2 concentrations in 30
serum samples acquired from newborn Holstein calves prior to and 24 hours after
ingestion of colostrum and to compare the values with SRID. A triplex bead assay was
created by mixing three distinct sets of Quantum plex carboxylated fluorescent
microspheres that were coated with purified bovine IgG1, IgG2 or albumin using a two
step chemical reaction. The triplex protein coated beads were reacted with a cocktail of
sheep anti-bovine IgG1 and IgG2. Evaluation of analytical specificity demonstrated
cross reactivity between anti-bovine IgG2 and IgG1 coated beads that precluded
determination of IgG2 > 0.5 g/dL. Cross reactivity between anti-IgG1 and IgG2 coated
beads was minimal and did not affect IgG1 concentrations between 0.15 to 1.2 g/dL. A
competitive linear decrease in the fluorescence intensity was observed in the triplex assay
when 2-fold dilutions spanning a concentration range of 12 mg/dL – 100 mg/dL of either
purified bovine IgG1 or IgG2 were included as a competitive inhibitor of the reaction.
Precolostral serum samples from 29 calves were determined to be < 0.4 g/dL by SRID.
Standard calibrants for the flow assay were prepared from two fold serial dilutions of
purified bovine IgG (stock concentration 10 g/dL) using a precolostral calf serum pool as
the diluent. The standard calibrants (IgG1 was 1.0- 0.16 g/dL and IgG2 was 3.4 – 0.22

g/dL) were used as the inhibitors in a triplex assay to develop a standard curve for
unknown samples. Dilutions of bovine reference serum containing known amounts of
IgG1 (1.2 – 0.15 g/dL) and IgG2 (1.6 – 0.2 g/dL) was used as positive control. The intra
Intra-assay and inter-assay precision of the mutiplex assay was good (coefficient of
variation < 10%). Since the IgG2 concentrations of post colostral samples were below
detection limit, only IgG1 values were compared to the SRID. The agreement between
triplex microsphere assay and SRID for IgG1 was poor with a mean bias of 0.743 g/dL
towards triplex microsphere assay (95% confidence interval of 0.382 to 1.105 g/dL).
Method comparison studies between total IgG determined by SRID and the gamma-
globulin fraction determined by serum electrophoresis indicated that the SRID calculated
higher values than the protein method (mean bias of -1.4 g/dL, 95% confidence interval
was -1.8 to -1.05 g/dL). We hypothesized that the positive bias for the microsphere assay
was explained in part by the use of dilution factors, use of standards that had a low
analytical range, and erroneously high standards used in the SRID method.

TABLE OF CONTENTS
List of tables------------------------------------------------------------------------------- ii
List of figures------------------------------------------------------------------------------ iii
Acknowledgements----------------------------------------------------------------------- iv
Literature Review------------------------------------------------------------------------- 1
Introduction-------------------------------------------------------------------------------- 13
Materials and Methods------------------------------------------------------------------- 15
Results-------------------------------------------------------------------------------------- 23
Discussion---------------------------------------------------------------------------------- 29
References---------------------------------------------------------------------------------- 35
Tables--------------------------------------------------------------------------------------- 41
Figures-------------------------------------------------------------------------------------- 47
i

LIST OF TABLES
Table 1. Post colostral IgG concentrations (g/dL) measured by RID -------------- 41
Table 2. Concentrations of bovine IgG subclasses in serum calibrants and
reference sera ------------------------------------------------------------------- 42
Table 3. Intraassay reproducibility. ---------------------------------------------------- 43
Table 4. Interassay reproducibility.----------------------------------------------------- 44
Table 5. Analytical accuracy.-------------------------------------------------------------45
Table 6. Comparison of IgG concentrations of serum calibrants by protein
electrophoresis and SRID----------------------------------------------------- 46
ii

LIST OF FIGURES
Figure 1. Flow cytometry dot plot and histogram of Quantum Plex beads--------------- 47
Figure 2. Flow cytometry dot plot illustrating analytical specificity of bead assay------ 48
Figure 3. Triplex bead assay analyzing cross reactivity studies with purified bovine
IgG1 inhibitor.-------------------------------------------------------------------------49
Figure 4. Triplex bead assay analyzing cross reactivity studies with purified bovine
IgG2 inhibitor.----------------------------------------------------------------------- 50
Figure 5. Bar chart comparing monoplex IgG1 and biplex IgG1 microsphere assay.-- 51
Figure 6. Bar chart comparing monoplex IgG2 and biplex IgG2 microsphere assay.-- 52
Figure 7. Flow cytometry dot plots for standard serum calibrants and precolostral
serum.---------------------------------------------------------------------------------- 53
Figure 8. Standard curve and first order polynomial equation.---------------------------- 54
Figure 9. Standard curve and first order polynomial equation from intraassay and
Interassay reproducibility.---------------------------------------------------------- 55
Figure 10. Deming method comparison of IgG1 concentrations determined by flow
and SRID.---------------------------------------------------------------------------- 56
Figure 11. Deming method comparison of IgG1 concentrations determined by flow
and SRID methods after removing outlier.-------------------------------------- 57
Figure 12. NCCLS bias plot of microsphere assay compared to SRID.------------------ 58
Figure 13. Deming method comparison of total IgG concentrations determined by
cellulose acetate and SRID methods.-------------------------------------------- 59
Figure 14. NCCLS bias plot of cellulose acetate method compared to SRID.----------- 60
iii

ACKNOWLEDGEMENTS
First and foremost, I would like to thank my major professor, Dr Melinda J. Wilkerson
for the support and guidance throughout this project and for accepting me into her lab
during my difficult days of pregnancy. I can honestly say that without her confidence in
me, none of this would be possible. I wish to extend my appreciation to my graduate
committee members Dr Carol Wyatt and Dr Elizabeth Davis for their help and guidance
through this project. I would also like to extend my sincere gratitude to Tammy
Koopman and Dr Mehrdad Ameri for their support, guidance, technical knowledge and
assistance. Additional thanks go out to Dr Steve Stockham and Dr Roberta Di Terlizzi
for protein analysis and Michael Scheffel manager of KSU Diary Herd for taking care of
newborn calves. Special thanks to Dr T.G. Nagaraja and Dr M.M. Chengappa for the
moral support. I would also like to thank Nora Springer, Nora Zacharis and Jesse Dubin
for laboratory support. I wish to thank my family members, brothers, relatives, parents,
in-laws and friends who have directly and indirectly assisted me in my endeavors. To this
I must add my thanks to Prasanna Kankanala, Cheng Chuanmin, Sheila Prabhakar and
Parajuli Puspa for the wonderful support. Most important, I must express my ongoing
appreciation for the love, support and cooperation provided by my husband Dr Ashoka
Maddur and daughter Amritha Ashok.
iv

Review of Literature
Failure of passive transfer (FPT) and associated neonatal disease.
Calves are born with a naïve but competent fully developed peripheral immune
system. Newborn calves are susceptible to environmental pathogens because there is a
prolonged lag period and primary immune responses produce low amounts of antibody.
Protective memory immune responses may not be optimal until after one month of age
(Tizard & Schubot, 2005), therefore, immune protection from the dam is paramount at
the time of birth. Ruminants differ from humans in that intrauterine transfer of maternal
immunoglobulins does not occur. This phenomenon is due to the fact that maternal blood
does not bathe the trophoblast and the chorionic epithelium is in direct contact with the
uterine tissues, described as syndesymochorial placentation (Tizard, et al, 2005). As a
consequence, the transplacental transfer of immunoglobulin (Ig) molecules is completely
precluded, and newborn calves are dependent on receiving maternal antibodies by oral
consumption of colostrum (Quigley et al., 2001;Bush & Staley, 1980). Adequate levels of
gamma globulin (IgG) transfer are essential for health and survival of neonatal calves.
Passive immunity is achieved by ingestion of an adequate mass of IgG in colostrum
produced by the dam (Bush, et al, 1980;Quigley, et al, 2001;Besser & Gay, 1994). Failure
of passive transfer (FPT) occurs when the plasma IgG concentration is below 1g/dL
(Besser, et al, 1994;Quigley, et al, 2001) and predisposes the newborn calf to disease.
Calves with IgG concentrations greater than 1g/dL have lower mortality rates from
infectious enteritis and respiratory diseases (Besser, et al, 1994). The frequency of failure
1

of passive transfer in dairy calves is reported to be as high as 35% of the calves (Stott et
al., 1979;Brignole & Stott, 1980), whereas it is less frequent in beef calves (Wilson et al.,
1999).
Colostral immunoglobulin absorption.
The colostrums in cattle consist of the accumulated secretions of the mammary gland
during the last weeks of pregnancy. Estrogens and progesterone influence the transfer of
immunoglobulins and other proteins from the blood to the mammary gland. IgG is the
major Ig present in the blood and it accounts for 65 – 90% of the total antibody content in
the colostrum whereas IgA and IgM are 10 – 20% of the total (Tizard, et al, 2005). The
subclass of IgG that predominates in bovine colostrum is IgG1. In fact, colostral IgG1
concentrations are five to ten times higher than maternal serum IgG1 (Besser, et al,
1994;Tizard, et al, 2005;Sasaki et al., 1976). Transfer of IgG1 from the blood across the
mammary glad secretory epithelium is facilitated by receptors to IgG1 (Barrington et al.,
1997a) and peaks 1-3 days before partiturition (Brandon et al., 1971). As lactation of the
dam progress colostrum changes to milk and the glandular epithelial cells cease IgG1
receptors production under the influence of prolactin (Barrington et al., 1997b).
Thereafter, most of the IgG and IgA are derived not from the blood but produced locally
in the udder (Tizard, et al, 2005).
Selective transfer of maternal immunoglobulin occurs over the first few hours of
birth by an apical tubular system in the intestinal absorptive cells. After 12 hours the
absorptive capacity of the intestine decreases (Bush, et al, 1980;Stott, et al, 1979), and by
2

24 hours of birth passive transfer of maternal Ig stops. Maternal antibodies are detected
in the lymphatics at 1 to 2 hours after birth (Bush, et al, 1980). Absorption of IgM is
slower than IgG and IgA (Bush, et al, 1980) and gradual decreased absorption for each
class is independent and observed at 16 hours for IgM, 22 hours for IgA, and 24 hours
for IgG. Irrespective of when the calf is fed, absorption of proteins decreases
spontaneously at 12 hours of age. Cessation of the nonselective absorption of proteins
through intestinal epithelial cells is referred to as gut closure, and is thought to be a
function of exhaustion of the pinocytic capability of the apical enterocytes, and due to
enterocyte replacement by a more mature population of epithelial cells that may lack
specific Fc receptors (Mayer et al., 2002). The basal cell membrane fails to release the
pinocytosed products resulting in cessation of transport, hence closing the uptake by the
tubular system. The amount of IgG consumed has a positive linear relationship to the
concentration of the IgG in the serum within 24 hours (Bush, et al, 1980). Unlike other
piglets or lambs (Lecce & Morgan, 1962), in cattle feeding or dietary regimens do not
influence time to closure, however gut closure may be extended to 36 hours if feeding is
delayed (Stott & Fellah, 1983).
Factors affecting passive transfer in calves.
Attainment of passive immunity in newborn calves is influenced by IgG
concentration and the volume of the colostrum (Arthington et al., 2000;Besser, et al,
1994;Bush, et al, 1980;Quigley, et al, 2001;Stott, et al, 1979;Besser et al., 1991) , the age
of calves at first feeding (Arthington, et al, 2000;Bush, et al, 1980;Stott, et al, 1979), birth
3

weight, (Bush, et al, 1980;Stott, et al, 1979), and absorption of IgG from intestine to
blood (Besser, et al, 1994). In an early report, it was described that fermented colostrum
had a lower pH and lower absorption of gamma-globulins (Bush, et al, 1980), however,
lower pH did not affect the absorption of exogenous IgG spiked in colostrum
supplements (Quigley, III et al., 2000). Furthermore, high rates of FPT occur in dairy
calves that are allowed to suckle naturally. This observation was attributed to the fact
that the IgG concentration in holstein cow colostrum is more dilute than beef cows.
Dairy calves are unable to achieve adequate passive transfer unless they receive adequate
IgG mass when fed 4 liters of colostrum (Besser, et al, 1991).
Methods for determining failure of passive transfer.
There are several traditional methods to diagnose FPT such as salt turbidity assays
including zinc sulfate and sodium sulfite, total protein by refractometry, gluteraldehyde
turbidity assay and immunological methods including SRID and immunoturbidity assays
but none of them are entirely satisfactory.
Salt turbidity assays.
Salt turbidity assays that are commonly used to measure Ig in serum include the zinc
sulfate assay and sodium sulfite assay. Both are considered qualitative assays and their
principle is based on the fact that when a salt mixture is added to serum containing Igs,
the immunoglobulins precipitate or salt out resulting in a turbid solution. In both
4

methods, the turbidity is proportional to the amount in milligrams of immunoglobulin
using known standards to compare with the patient sample. Both the zinc sulfate and
sodium sulfite assay are easy, inexpensive and less time consuming when compared to
SRID. However, hemolysis caused a false increase in turbidity of the zinc sulfate test
(Weaver et al., 2000). In addition the zinc sulfate turbidity assay overestimated the
concentration of immunoglobulins compared to SRID (Pfeiffer et al., 1977). When a cut
off of < 1g/dL of IgG1 was used to define FPT, the zinc sulfate test had a diagnostic
sensitivity of 100% and specificity of 52% when compared with the SRID. The low
specificity of the zinc sulfate test indicates that false positive results for FPT were
frequent (48% of the time) and greater than when the sodium sulfite assay and serum
total protein by refractometer were used to predict FPT (Tyler et al., 1996b)
In the sodium sulfite turbidity assay 14%, 16% and 18% sodium sulfite solutions
are used to test serum samples for Ig. The highest salt concentrations (18%) induce
turbidity at low concentrations of high molecular weight proteins, whereas low salt
concentrations precipitate proteins of high concentrations. For example in a study of 242
calf serum samples, mean serum IgG1 concentration was found to be 2.9 g/dL (range 2.4
– 3.6 g/dL) by SRID when precipitation or turbidity was present in all three sodium
sulfite solutions. Precipitation in the 16% and 18% sodium sulfite solutions was equal to
a range of 1.0 – 4.3 g/dL for IgG1; whereas when precipitation occurred only in the 18%
sodium sulfite solution the IgG1 concentration was equal to a range of 0.6 – 2.5 g/dL.
Absence of turbidity in all three sodium sulfite solutions was considered a negative result
and reflected a mean serum IgG1concentration of 0.6 g/dL, (range was 0 – 2.4 g/dL)
(Tyler, et al, 1996b). When the performance of the sodium sulfite test was determined by
5
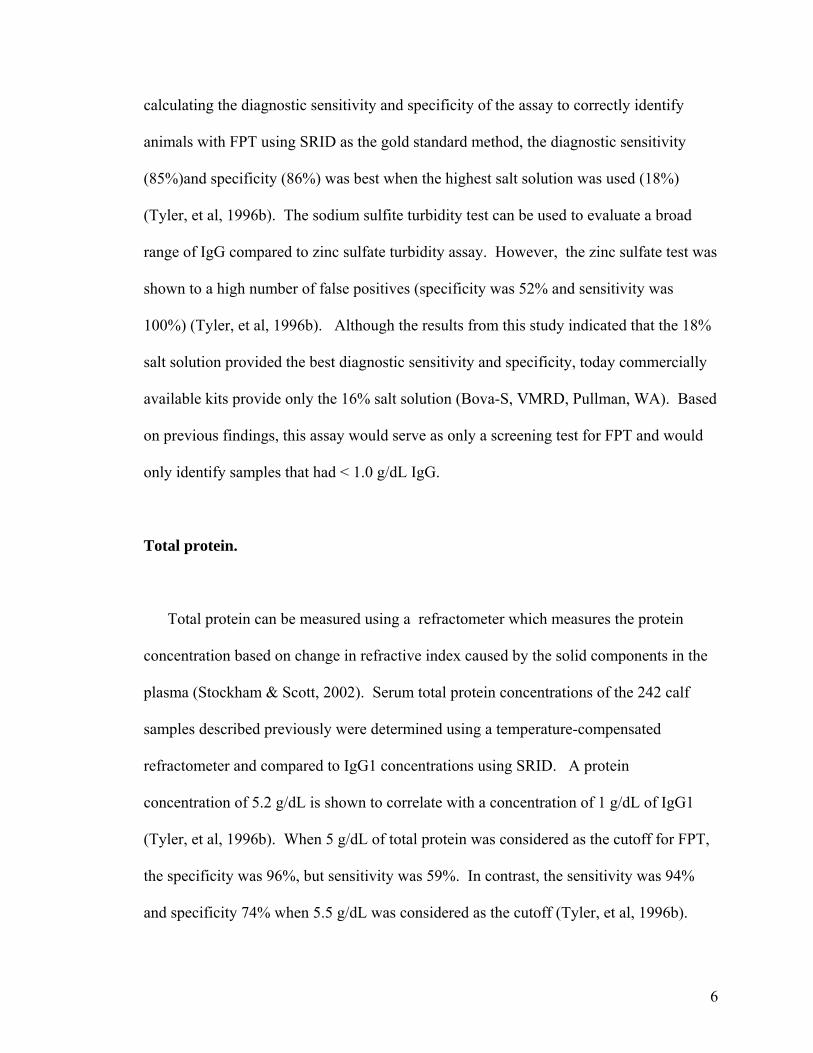
calculating the diagnostic sensitivity and specificity of the assay to correctly identify
animals with FPT using SRID as the gold standard method, the diagnostic sensitivity
(85%)and specificity (86%) was best when the highest salt solution was used (18%)
(Tyler, et al, 1996b). The sodium sulfite turbidity test can be used to evaluate a broad
range of IgG compared to zinc sulfate turbidity assay. However, the zinc sulfate test was
shown to a high number of false positives (specificity was 52% and sensitivity was
100%) (Tyler, et al, 1996b). Although the results from this study indicated that the 18%
salt solution provided the best diagnostic sensitivity and specificity, today commercially
available kits provide only the 16% salt solution (Bova-S, VMRD, Pullman, WA). Based
on previous findings, this assay would serve as only a screening test for FPT and would
only identify samples that had < 1.0 g/dL IgG.
Total protein.
Total protein can be measured using a refractometer which measures the protein
concentration based on change in refractive index caused by the solid components in the
plasma (Stockham & Scott, 2002). Serum total protein concentrations of the 242 calf
samples described previously were determined using a temperature-compensated
refractometer and compared to IgG1 concentrations using SRID. A protein
concentration of 5.2 g/dL is shown to correlate with a concentration of 1 g/dL of IgG1
(Tyler, et al, 1996b). When 5 g/dL of total protein was considered as the cutoff for FPT,
the specificity was 96%, but sensitivity was 59%. In contrast, the sensitivity was 94%
and specificity 74% when 5.5 g/dL was considered as the cutoff (Tyler, et al, 1996b).
6

The total protein by refractometer is considered excellent for herd monitoring, however,
there are concerns regarding the effects of age and hydration status (Weaver, et al, 2000).
Similarly, the biuret reaction using brom-cresol green dye is one of the most common
spectrophotometric methods used to measure total protein. Copper in the biuret reagent
binds to peptide bonds creating a blue-green colored complex. The color change is
proportional to the amount of protein in the solution, but not all the polypeptide chains
are available for the reaction (Stockham, et al, 2002)
Serum electrophoresis.
Serum electrophoresis is used to determine the concentration of immunoglobulin due
to different migration pattern of proteins in an electric field. The major disadvantage of
this method is that it requires expensive equipment and it cannot be used to determine the
concentrations of the subclasses of the gamma fraction (Pfeiffer, et al, 1977). The assay
also requires knowledge of the total protein concentration because the percentage of the
gamma fraction is then multiplied by the total protein to determine the concentration of
the gamma fraction.
Gluteraldehyde coagulation test.
The molecular cross linking caused by a 10% gluteradehyde solution coagulates
basic proteins such as immunoglobulins and fibrinogen. The amount of coagulation is
thought to be dependent on IgG as it is the predominant immunoglobulin in postcolostral
serum (Stockham, et al, 2002). The gluteraldehyde coagulation test is inexpensive and
7

easy to perform, but the sensitivity and specificity is inadequate for diagnostic use when
compared with SRID. Diagnostic sensitivity was reported to be < 41% and specificity
varied from 85% to 100% (Tyler et al., 1996a).
Single radial immunodiffusion assay (SRID).
Single radial immunodiffusion is a quantitative assay which can determine the
concentrations of total bovine IgG and the subclasses IgG1 and IgG2 (Pfeiffer, et al,
1977). The assay is based on a precipitation reaction that occurs in an agarose gel
between the immunoglobulin (Ig) in the bovine serum sample and specific antibody to
bovine Ig incorporated into the gel at the time of gel preparation. The standards consist of
bovine serum containing known concentrations of IgG and its subclasses or isotopes. In
the early assay development, standards were initially prepared by precipitating
immunoglobulin from adult bovine serum with ammonium sulfate (50 and 40%) then
dialyzed and lyophilized. The protein concentration of the IgG product was determined
by the Lowry method (Pfeiffer, et al, 1977).
Today commercially available standards to measure total bovine IgG by SRID are in
the range of 400mg/dL to 3200mg/ dL. For IgG1 and IgG2 standards are 125 mg/dL to
1000 mg/dL and 94 mg/dL to 750 mg/dL, respectively. The diameters of the precipitin
rings resulting from the antigen antibody reaction of the standards are used to create a
linear standard curve. The diameters of the precipitin rings of the bovine serum samples
are compared to the diameters produced by the standards. Concentrations of the
unknown samples are determined by a linear standard curve created by plotting diameters
8

in millimeters vs. concentration on semilog paper. The SRID is considered the gold
standard because of the specificity and quantitative properties of the method (Davis et al.,
2005). In addition, there are several advantages to the SRID method compared to other
methods. For example, SRID uses only 3 µL of serum and can be used to determine the
concentrations of the subclasses of IgG. However, the disadvantage is that the SRID
requires 18 to 20 hours of incubation. Since age of feeding is an important factor in
treating FPT, this long incubation period is a major disadvantage of this method. Finally,
SRID is very expensive compared to other methods.
SRID gave better results compared to other methods because it is more
quantitative than either sodium sufite assay or zinc sulfate assay. SRID showed fewer
false positive results when compared to zinc sulfate assay and correlated well with
refractometric determination of total protein (Tyler, et al, 1996b). Most of these methods
measure IgG based on the assumption that IgG is the most abundant protein in the serum
whereas, SRID directly measures IgG and its subclasses by antigen antibody reaction.
Automated and transportable turboimmunometric assay.
Automated assays have been designed to detect human IgG, equine IgG, and
bovine IgG. The are based on detection of agglutination reaction between IgG and
specific antibody that results in light scatter and is measured spectrophotometrically by
an automated instrument (Davis, et al, 2005;Etzel et al., 1997). This assay is not affected
by hemolysis in serum and can be used for serum or plasma samples. The major
advantage of this assay over SRID is the automation, shorter turnaround time (< 1 hour)
9

and elimination of human error in reading precipitation rings. Comparison studies
between the turboimmunometric assay and SRID for equine and bovine IgG showed
good correlation (Davis, et al, 2005;Etzel, et al, 1997).
A commercially available immunoassay using lateral-flow technology is now
marketed for field testing. This assay produced by Midland BioProducts was evaluated
for performance in predicting FTP by testing 204 male Holstein calves (ranging from 4 to
8 days old) and comparing the results to refractometry of total protein and zinc sulfate
turbidity methods. The lateral-flow immunoassay values correlated well with the
refractometry and zinc sulfate turbidity techniques, but the lateral flow immunoassay had
the best diagnostic accuracy (95%) compared to refractometry (80%), and zinc sulfate
(73%) methods (McVicker et al., 2002), but still cannot read IgG1 and IgG2 in the same
tube.
Multiplex microsphere technology using flow cytometry.
Multiplex fluorescent microsphere bead assays are extensively used in human
medicine. This is a novel technology that enables one to analyze multiple analytes in a
single tube using a flow cytometer. These microspheres are internally dyed with
fluorophores (combinations of red and orange dyes) of different intensities and act as
solid base to which the analyte or protein can be covalently linked using various chemical
or molecular techniques. The flow cytometer can differentiate amoung microspheres up
to 100 different bead sets based on size, fluorescence intensity, and fluorescent
wavelength. This technology can analyze numerous biomolecules such as nucleic acids,
10

viruses, ligand binding interactions, proteins such as cytokines and antibodies when
proteins, nucleic acids or capture molecules are covalently linked to the microspheres and
treated with specific reporter antibodies following incubation with the analyte of interest
(Camilla et al., 2001;Dasso et al., 2002;Lal et al., 2004;Paul et al., 2005).
There are hurdles to using this novel technology as the cytometer and the
associated software is very expensive. Microsphere bead technology is very sensitive,
thus standardization of the assay and the reagents for the multiple components is very
critical (Camilla, et al, 2001;Dasso, et al, 2002;Lal, et al, 2004). Minor variations in the
coupling protocols will significantly alter the fluorescence intensity of the capture
antibodies because of the variation in the density of the coupled capture antibodies
(Dasso, et al, 2002).
Many studies have reported good correlation between microsphere bead assay and
enzyme-linked immunosorbent assay (ELISA) (Camilla, et al, 2001;Dasso, et al,
2002;Lal, et al, 2004). However, studies that compare methods for agreement are
lacking. Correlation coefficients used to determine correlation between methods identify
associations, which are not unexpected if the methods measure the same analyte.
However, there are better statistical models to determine the degree of agreement or bias
between methods (Altman, 1991).
Using flow cytometry, the microsphere assay directly measures multiple Igs or their
isotypes by antigen-antibody reaction, if the beads are covalently linked with the proper
purified proteins and allowed to react with fluorochrome labeled specific reporter
antibodies. The main advantage of using a microsphere assay to determine IgG and its
subclass concentrations in the foreseeable future is the expected shorter turn around time
11

and multiplexing that would allow multiple Igs to be measured, thus facilitating the
ability to identify animals with FPT or other immune deficiencies.
12

Introduction
Newborn calves are immunologically naïve at birth and require the passive
transfer of maternal immunoglobulins (Ig) after birth to maintain health and immune
protection against environmental pathogens. Unlike humans, transfer of Ig to calves and
foals does not occur in utero due to the strict barriers of placentation in these species.
Instead, maternal immunoglobulins are absorbed from colostrum (first fraction of milk)
in a narrow window of time after birth (≤ 24 hours). Determination of adequate passive
transfer of these critical life saving antibodies in neonatal animals is a common procedure
requested by practitioners in the field. Several commercially available assays used to
measure serum Ig concentrations in neonatal calves include refractometer determination
of total serum protein concentration, sodium sulfite turbidity, zinc sulfate, and SRID.
Previous studies indicate there is marked variation in the results and poor accuracy or
lack of precision of the assays. Serum electrophoresis was found to be very accurate and
quantitative (Pfeiffer, et al, 1977). The RID was not linear at high concentrations of
serum immunoglobulin, whereas sodium sulfite turbidity assay is semi-quantitative and
zinc sulfate is qualtitative (Tyler, et al, 1996b). Variables that contribute to variability
from one study to another include the age of the calves that were sampled, the time of
sampling, and venipuncture site (Chorfi et al., 2004).
New technology using immunological reactions, microspheres, and flow cytometry
has become available that provides a multiplexing capability in which multiple analytes
can be measured in a sample at one time. This technology uses polystyrene carboxylated
microspheres that are internally dyed with fluorochromes of various intensities. The
beads serve as a solid matrix in which multiple different analytes can be covalently
13

attached. Fluorescently conjugated reporter antibodies specific to the protein are then
used to capture the analyte in the serum. Thereafter, the microspheres coupled with
analyte and antibodies can be analyzed by flow cytometry. The main advantages of using
the microsphere assay to determine IgG and its subclass concentrations in the foreseeable
future are the expected shorter turn around time and the ability to measure multiple Igs at
one time, thus facilitating the ability to identify animals with FPT or other immune
deficiencies.
Many studies have reported good correlation between microsphere assays and
enzyme-linked immunosorbent assays (ELISA) (Camilla, et al, 2001;Dasso, et al,
2002;Lal, et al, 2004). However, studies that compare methods for agreement are
lacking. Correlation coefficients used to determine correlation between methods identify
associations, which are not unexpected if the methods measure the same analyte (Bland
& Altman, 1986b). There are better statistical models to determine the degree of
agreement or bias between methods (Bland & Altman, 1986a;Altman, 1991).
The goals of this project were to develop a multiplex microsphere flow cytometry
assay to measure bovine IgG subclasses and to compare the IgG1 and IgG2 results to that
of the reference method (SRID) using serum samples obtained from calves prior to and
24 hours after ingestion of colostrum. Total IgG concentrations determined by SRID
were also compared with the gamma-globulin fraction by serum electrophoresis.
14

Materials and Methods
Calf samples.
Serum samples from 30 newborn Holstein calves were collected at birth and 24
hours later, at which time all calves had received one to two liters of banked colostra.
Venipuncture by jugular vein and animal handling protocols were followed using
approved guidelines established by the Kansas State University Institutional Animal
Care and Use Committee. A precolostral serum pool was prepared by pooling 1 mL
serum aliquots from each of 29 calf samples. All twenty-nine samples were determined
to be below the detection limit of the single radial immunodiffusion assay (SRID).
Quantitation of bovine IgG1 and IgG2 by single radial immunodiffusion.
Concentrations of total IgG in all calf samples (pre and postcolostral) were
determined by SRID in duplicate using a commercially available assay (Immunocheck,
SRID, VMRD, Pullman, WA) with an analytical range of 400 – 3200 mg/dL.
Quantitation of bovine IgG by combined biuret and serum protein electrophoresis.
The gamma fraction of calf samples was quantified independently by the clinical
pathology laboratory at the College of Veterinary Medicine, Kansas State University
using a combined cellulose acetate serum protein electrophoresis method and the biuret
method for total protein (Hitachi 911, Boehringer Mannheim, Indianapolis, IN).
15

Conjugation of analyte to carboxylated microspheres.
Three distinct sets of carboxylated fluorescent microspheres (5.5 µm, Quantum
Plex beads, Bangs Laboratories, Fishers, IN) were separately covalently linked with
either purified bovine IgG1, IgG2 (Bethyl laboratories, Montgomery, TX) or globulin
free bovine serum albumin (BSA) (Sigma-Aldrich, St. Louis, MO) using a modification
of a previously described method (Paul, et al, 2005). To prepare a stock of carboxylated
beads for protein conjugation, three separate 1 mL aliquots of bead suspensions were
washed twice with 2-[N-morpholino] ethane sulfonic acid buffer (Sigma, St. Louis,
MO). Two mL of 1-ethyl-3-3-(3-dimethyl aminopropyl) carbodimide hydrochloride
(stock was 10 mg/ml of EDC in deionized water, PIERCE, Rockford, IL) was brought
up to 10 mL by adding 2-(N-morpholino)ethane sulfonic acid (MES) buffer, pH 7.4,
then incubated with the stock beads for 15 minutes at room temperature. To open the
amine group on the proteins, each protein (bovine IgGs and serum albumin) were
treated with the EDC/MES mixture in a similar manner. The activated bovine proteins
(IgG1, IgG2, and albumin, 50 mg/L) were added to the carboxylated activated
microsphere sets for 3 hours and 30 minutes on a rocker platform at room temperature.
This carbodiimide coupling procedure results in a water soluble intermediate product
that creates a protein attachment to the beads by an amide linkage. After the incubation
period, the beads were washed twice with 0.05% Tween in PBS, pH 7.4 (PBST). The
conjugated microspheres were incubated with 30mM glycine at room temperature for
15 minutes to quench the charge and reduce nonspecific absorption. To block the
remaining nonspecific binding sites, beads were incubated with 3% BSA for 1 hour on a
16

rocker platform at 37 °C. The bead suspension was washed twice with 0.05% PBST.
Finally, an equivalent amount of conjugated beads were suspended in 0.05% PBST and
stored at 4°C. All washing steps were at high speed (2000 x g) for 5 minutes (Beckman
TJ6 centrifuge, Fullerton, CA).
Determination of optimal concentrations of fluorescin labeled secondary antibody.
Using a monoplex assay for each IgG subclass coated bead set, a cocktail of
secondary antibodies was serially diluted ten fold (final concentrations 0.1g/L to 0.01
mg/L) and incubated with IgG1 or IgG2 coated microspheres for 30 minutes on a rocker
at room temperature and assayed on flow cytometer.
Comparison of monoplex and biplex assays.
To determine whether or not there was interference in the antibody-antigen reaction
when multiple bead sets were introduced, the mean fluorescence intensity values for
each monoplex assay generated by reacting a single set of protein conjugated
microspheres with a single antibody was compared with values determined in a biplex
assay. For the biplex assay, a cocktail of beads coated with IgG1 and IgG2 were
incubated with a cocktail of anti-bovine IgG1 and IgG2. The antibodies were tested in
ten fold dilutions. A cocktail of conjugated beads were made by adding 50 µL of each
conjugated bead set to a tube (1.5mLEpendorf tube). The microsphere cocktail was
mixed with 10 µL of a bovine standard or serum sample diluted 1:4 in PBS.
17

Immediately, 100 µL of a cocktail of two FITC- labeled affinity purified sheep
antibodies to bovine IgG1 and IgG2 (4 µg/mL stock in 0.01M PBS, Bethyl
laboratories, Montgomery, TX) was added to the bead mixture and incubated for 30
minutes on a rocker platform at room temperature. The bead suspension was suspended
in 300 µL of PBS prior to acquisition by flow cytometry. Mean fluorescence intensities
(MF) generated from monoplex assay for both IgG1 and IgG2 were compared with the
biplex assay.
Development of triplex assay to measure bovine IgG1 and IgG2.
The characteristics of the Quantum plex microspheres used to covalently link
purified bovine IgG1, IgG2 and BSA are illustrated in Fig. 1A prior to reacting with
FITC-labeled anti-bovine antibodies. The different bead sets of 5.5µm diameter can be
detected by far red emission (690 nm) after excitation with the argon laser (Fig. 1.B).
Bovine serum albumin (BSA) was conjugated to the microsphere set (designated as
pink beads) with the lowest fluorescent intensity detected by the FL3 detector (10 to 20
mean fluorescent channels). Bovine IgG2 was conjugated to the microsphere set
(designated as blue beads) with fluorescent intensity between 100 and 200 mean
fluorescent channels of the FL3 detector. Bovine IgG1 was conjugated to the
microsphere set (designated as green beads) with fluorescent intensity between 700 and
800 mean fluorescent channels of the FL3 detector. To confirm specific protein coating
of the beads, beads were incubated with a cocktail of fluorescein isothiocynate (FITC)
sheep anti-bovine IgG1 and IgG2 (Bethyl Laboratories, Inc., Montgomery, TX). An
18

arbitrary cut-off for background fluorescence intensity was established based on the
shift in fluorescent intensity of the negative control bead set coated with BSA or
background fluorescence intensity established for IgG1 and IgG2 conjugated beads in
cross reactivity studies. Two fold dilutions of standard serum calibrants diluted in
precolostral serum were used as the inhibitor of the assay to generate a standard curve.
The decrease in mean fluorescence intensity that occurred with inclusion of inhibitor
was proportional to the concentration of the inhibitor protein.
Determination of analytical specificity of microsphere assay,
To determine the cross reactivity of the IgG1 or IgG2 bovine antibodies to the
bovine subclass immunoglobulin molecules coating the microspheres, beads conjugated
with IgG1 were reacted with sheep anti-bovine IgG2, and beads conjugated with IgG2
were reacted with sheep anti-bovine IgG1. The mean fluorescence intensities of these
reactions were compared to the mean fluorescence intensity values of the isotype
specific reactions (i.e. anti-bovine IgG1 with IgG1 and anti-bovine IgG2 with IgG2).
To determine if the cross reactivity of the sheep anti-bovine antibodies to the IgG
subclasses altered the decrease in mean fluorescence intensity obtained with specific
IgG subclass inhibitors, a triplex assay was performed using one inhibitor at a time. In
separate tubes either purified IgG1 or IgG2 (serial dilutions starting at 1 mg/mL) was
added to the mixture of beads coated with IgG1, IgG2 and BSA. Two fold serial
dilutions of purified protein were tested in separate tubes. Immediately, the cocktail of
19

antibodies (sheep anti-bovine IgG1+anti-bovine IgG2) was added and incubated for 30
minutes on rocker at room temperature and assayed on flow cytometer.
Stability of bead protein conjugates.
To determine the stability of the proteins covalently linked to the beads, the triplex
assay was performed weekly for four consecutive weeks using the same stock of beads
and cocktail of secondary antibodies.
Preparing the standards and creating a standard curve.
Standard serum calibrants were prepared by two fold serial dilutions of purified
bovine IgG (10 g/dL, Sigma Co, St. Louis, MO.) using precolostral calf serum pool as
the diluent. The total concentration of bovine IgG in the commercial product was
confirmed by serum protein electrophoresis using cellulose acetate and biuret reactions
(Hitachi 911, Boehringer, Mannheim). This assay was performed by the clinical
pathology laboratory at Kansas State University. Concentrations of IgG1 and IgG2 in
the standard calibrants were determined by the SRID (VMRD, Pullman, WA). Controls
consisted of bovine reference containing known amounts of IgG1 and IgG2 (Bethyl
laboratories, Montgomery, TX). The concentrations of the serum calibrants were
converted to natural log and plotted on the X-axis vs. mean fluorescence (Y-axis). A
first order polynomial equation [Y = slope(X) + intercept] was generated from the
standard curve. The equation was solved for the X value and the natural log value was
20

converted using the exponent. Serial dilutions of the bovine reference serum were run
as positive controls between ranges of 2.8 to 0.35 g/dL for total IgG (IgG1 was 1.2 -
0.15 g/dL and IgG2 was 1.6 – 0.2 g/dL). A set of beads conjugated with BSA was used
as a negative control.
Flow cytometry
A total of 1000 gated bead events for each bead set were collected by a flow
cytometer (FACSCalibur, Becton Dickinson, San Jose, CA) and the data were analyzed
using Cell Quest software (Becton Dickinson, San Jose, CA). Three gates were placed
on each microsphere set using two color dot plots. Distinction of Quantum plex bead
sets that reacted with FITC sheep anti-bovine IgG antibodies was visualized by
displaying the beads in on FL3 (y-axis) vs. FL1 (x-axis) (Fig. 1). The mean
fluorescence intensity of the binding of FITC conjugated antibody (peak emission 535
nm) to each bead set, (BSA, IgG1, and IgG2) was recorded by the FL1 detector.
Assay reproducibility and analytical accuracy.
Intra-assay and inter-assay precision or reproducibility was determined by assaying
standard serum calibrants and four fold dilutions of the bovine reference serum on the
same day (intra-assay) or over several days (inter-assay) using a stock of conjugated
beads. Results were obtained from each set and coefficient of variation was calculated
(standard deviation divided by the mean) and expressed as a percentage.
21

The analytical accuracy of the assay was determined by assaying the bovine
reference serum with known concentrations of 0.175 – 1.2 g/dL determined by SRID
and ELISA (communication with Bethyl labs, Montgomery, TX). Percentage of
recovery was calculated by dividing the observed values determined by the microsphere
assay by the expected values and multiplying the result by 100.
Method comparisons.
IgG1 concentrations of 30 postcolostral serum samples were determined in
duplicates by SRID (VMRD, Pullman, WA) and by the triplex micrsophere assay. The
average of each replicate sample was determined for each assay. To identify constant
and proportional bias the average concentrations of each assay were plotted by Deming
regression analysis (Analyse-it software for Microsoft excel, version 1.71). For NCCLS
(National Committee for Clinical Laboratories) bias plots, the differences between the
methods were plotted against the mean concentration determined for the reference
method (NCCLS, now Clinical Laboratory Standards Institute). The SRID method was
designated as the reference method, whereas the microsphere assay was designated as
the new or comparative method. Total IgG concentrations determined by SRID were
compared to the total serum gamma fraction by protein serum electrophoresis using
cellulose acetate combined with the biuret reaction for total protein. In each method
comparison, the average values for the reference method (SRID) were subtracted from
the average values of the comparison method to determine the differences.
22

Statistical analysis
Data was analyzed for normality using Kolmorgorov-Smirnov (K-S) and replicates
were tested for differences in the median by the Mann-Whitney Rank Sum test.
Association between the methods that determined IgG1 concentrations (microsphere
assay and SRID and protein serum electrophoresis and SRID) was determined using the
Spearman Correlation coefficient (RS).
Results
SRID assay results of pre and post colostral samples.
Concentrations of total IgG for 29 calves in precolostral sera were below detection
limits of the SRID assay (0.4 g/dL). One calf had 1.6 g/dL. Total IgG, IgG1 and IgG2
concentrations in post colostral sera determined by SRID were listed in Table 1. The
median concentrations for total IgG were 3.2 g/dL, whereas IgG1 and IgG2 were
between 2.0 - 2.05 and 0.11 – 0.115 g/dL, respectively. The proportion of IgG1 of the
total bovine IgG determined by SRID was 65%, whereas IgG2 was 3%. There was no
statistically significant difference between the replicates (Mann-Whitney Rank Sum
test, P =0.865).
23

Analytical specificity of the microsphere assay,
Specificity of the assay was evaluated to identify any cross reactivity of the FITC-
labeled sheep anti-bovine antibodies to the protein coated microspheres or to soluble
protein inhibitor. In the first experiment, secondary antibodies were tested for binding
to IgG1 or IgG2 coated beads without serum inhibitor (Fig. 2). Slight binding of IgG1
coated beads occurred with anti-bovine IgG2 (Fig. 2A, mean fluorescence intensity was
33), whereas anti-bovine IgG1 reacted with IgG2 coated beads resulting in a greater
shift in fluorescence intensity (up to 102) (Fig 2B.) indicating cross reactivity of anti-
bovine IgG2 with IgG1 and anti-bovine IgG1 with bovine IgG2. However, the shift in
fluorescence intensity that occurred with specific isotype reactions for IgG1 and IgG2
were substantially higher, 2-logs for IgG1 (Fig. 2C), and 1-log for IgG2 (Fig. 2D).
In the second experiment when purified IgG1 was added alone in increasing
concentrations to the FITC-labeled anti-bovine antibody cocktail, the mean fluorescence
intensity for the reaction between antibody and IgG1 coated beads decreased in a linear
manner, while the mean fluorescence intensity of IgG2 and BSA coated beads remained
essentially unaltered (Fig. 3). Similarly, when IgG2 was added without IgG1 inhibitor,
only the IgG2 coated beads showed a decrease in mean fluorescence intensity (Fig 4)
indicating specific competition with soluble IgG2. There was a slight drop in mean
fluorescence intensity for IgG1 and IgG2 when the opposite IgG class inhibitor was
added at the low inhibitor concentrations. These results indicated the cross reactivity of
the sheep antibodies did not affect the triplex assay when purified inhibitor was used.
24

Comparison studies between monoplex and biplex assay.
Interference between the bead sets was investigated by comparing mean
fluorescence intensities generated by the monoplex assay with those generated by the
biplex assays. In Figure 5, the mean fluorescence intensity of the monoplex and biplex
assay were similar and demonstrated linearity over the dilutional range for both IgG1
(Fig. 5) and IgG2 (Fig. 6). There was a slight decrease in the mean fluorescence
intensities for IgG2 when the biplex was compared to the monoplex assay. In
conclusion, the biplex assay having two sets of beads did not substantially alter the
fluorescence intensities detected by the binding of FITC cocktail antibodies to either
IgG1 or IgG2 coated beads.
Assay stability and optimization of report antibody concentrations.
Stability of the beads after protein coating was analyzed by comparing mean
fluorescence intensity values generated from the triplex assay over time. The mean
fluorescence intensity for each set of microspheres of the triplex assay did not change
up to four weeks, thereafter the protein coated beads deteriorated causing an increase in
scatter properties and a decrease in the mean fluorescence intensity. The optimal
concentration of FITC-labeled sheep anti-bovine IgG1 and IgG2 was determined to be
1:250 because this concentration did not cause BSA-coated beads to shift in fluorescent
intensity and gave the highest mean fluorescence intensities compared to further
dilutions of antibody.
25

IgG subclass concentrations of bovine IgG standards and reference sera.
The IgG concentrations of the Sigma serum standard and reference serum were
compared in Table 2. Protein electrophoresis and the biuret method confirmed the
concentrations of the Sigma serum product after dilution with the precolostral sera pool.
The total amount of IgG determined by serum protein electrophoresis approximated the
sum of the two subclasses of each product. Concentrations of the IgG subclasses of the
two products were comparable with IgG2 being consistently higher than IgG1 in both
serum products.
Development of a standard curve for the triplex assay.
Increasing concentrations of the standard bovine IgG (Sigma, CO, St. Louis, MO)
diluted with the precolostral sera pool was used as the inhibitor in a triplex assay to
develop a standard curve for unknown samples (illustrated in Fig. 7 dot plots). The
bead sets coated with IgG1 (green dots) and IgG2 (blue dots) shifted to the left or
decreased in fluorescence intensity as the inhibitor concentrations increased (Fig. 7B –
F) compared to precolostral serum without inhibitor (Fig. 7A). The highest
concentration of standard IgG1 (1.0 g/dL) did not shift into the fluorescence region in
which anti-IgG2 cross reacted with IgG1 coated beads (Fig. 7F compared to Fig. 2A).
Several concentrations of standard IgG2 (3.4 – 0.8 g/dL) overlapped with the
26

fluorescence shift that occur when anti-IgG1 cross reacted with IgG2 (Fig. 7D-F
compared to Fig. 2B).
Because the IgG2 concentration of the post colostral sera from all calves was < 0.2
g/dL by SRID, further quantification of IgG2 by the microsphere assay was not
performed. To create a standard curve and a first order polynomial equation to solve for
unknowns, the standard IgG1 concentrations were plotted against the mean fluorescence
intensity of the standards (Fig. 8A). However, this plot produced a nonlinear curve,
therefore, the x-axis data (standard concentrations) were converted to natural log (Fig.
8B) and the equation for the line was created.
Assay reproducibility and analytical accuracy for IgG1.
The imprecision data for the microsphere assay for IgG1 is presented in Tables 3
and 4. The within assay reproducibility (intra-assay precision) was good (CV < 10%)
for all concentrations of standards and reference serum (Table 3), however, reference
sera at 0.3 g/dL concentration had the highest CV (8%). The inter-assay precision was
also good (CV < 10%) for each concentration of standard or reference sera (Table 3).
The standard curves for the intra-assay and inter-assay reproducibility experiments were
linear with similar values for the slope and intercept (Fig 9A and B).
The accuracy of the microsphere assay was near 100% (± 8%) for all
concentrations of bovine reference sera (0.35 g/dl – 1.2 g/dL) except for the lowest
concentration (0.175 g/dL), in which the percent recovery was 183%.
27

Method comparison of SRID and microsphere assays.
The amount of agreement between the triplex microsphere assay and the reference
method SRID was determined by comparing the results of all the 30 pre and post
colostral serum values performed in duplicate. Since IgG2 concentrations were less than
0.3 g/dL in both assays, statistical comparisons were not performed. The mean IgG1
concentrations determined by the flow cytometry microsphere assay and SRID were
compared using a Deming regression plot. Figure 10 shows the presence of an extreme
outlier that caused the regression line to cross the line of identity. The outlier was due
to a post colostral sample that measured 7.5 g/dL (mean) by the RID and 2.3 g/dL by
the microsphere assay. This outlier was removed from the database because of the
extreme discrepancy between the two assays and the data from the methods were
reanalyzed for comparison (Fig. 11). In the new plot the data points were spread out
and based on the position of the new regression line, there was a notable constant and
proportion bias. The NCCLS bias plot (Fig. 12) showed a mean positive bias of 0.743
g/dL (95% confidence interval was 0.382 to 1.105 g/dL) over the analytical range. The
RS value was low (0.31) indicating a poor correlation between the two assays. Since
the microsphere assay for IgG1 had poor agreement with the SRID assay, total IgG
concentrations of the post colostral sera samples were compared with a protein
electrophoresis method using cellulose acetate to determine the gamma globulin
fraction and biuret method to determine the total protein of the samples. Although the
RS value was fairly high (0.78) indicating a good correlation between the gamma
globulin concentrations and the total IgG determined by SRID, the Deming regression
28
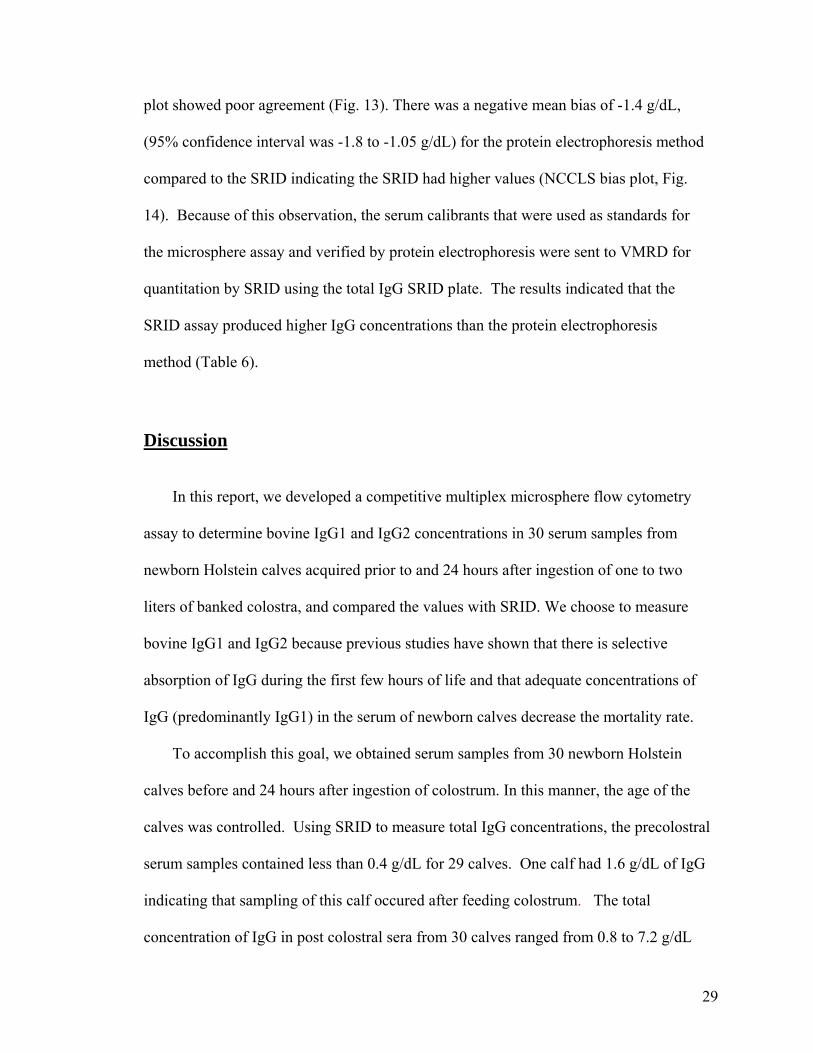
plot showed poor agreement (Fig. 13). There was a negative mean bias of -1.4 g/dL,
(95% confidence interval was -1.8 to -1.05 g/dL) for the protein electrophoresis method
compared to the SRID indicating the SRID had higher values (NCCLS bias plot, Fig.
14). Because of this observation, the serum calibrants that were used as standards for
the microsphere assay and verified by protein electrophoresis were sent to VMRD for
quantitation by SRID using the total IgG SRID plate. The results indicated that the
SRID assay produced higher IgG concentrations than the protein electrophoresis
method (Table 6).
Discussion
In this report, we developed a competitive multiplex microsphere flow cytometry
assay to determine bovine IgG1 and IgG2 concentrations in 30 serum samples from
newborn Holstein calves acquired prior to and 24 hours after ingestion of one to two
liters of banked colostra, and compared the values with SRID. We choose to measure
bovine IgG1 and IgG2 because previous studies have shown that there is selective
absorption of IgG during the first few hours of life and that adequate concentrations of
IgG (predominantly IgG1) in the serum of newborn calves decrease the mortality rate.
To accomplish this goal, we obtained serum samples from 30 newborn Holstein
calves before and 24 hours after ingestion of colostrum. In this manner, the age of the
calves was controlled. Using SRID to measure total IgG concentrations, the precolostral
serum samples contained less than 0.4 g/dL for 29 calves. One calf had 1.6 g/dL of IgG
indicating that sampling of this calf occured after feeding colostrum. The total
concentration of IgG in post colostral sera from 30 calves ranged from 0.8 to 7.2 g/dL
29

with a median value of 3.2 g/dL (interquartile range = 2.25 to 4 g/dL). According to the
SRID only two calves had IgG concentrations < 1.0 g/dL. The IgG1 concentrations had a
similar range as the total IgG, but the median concentration and interquartile range was
lower (2.0 g/dl; 1.4 – 2.5 g/dL) constituting about 60 – 65% of the total IgG. IgG2
determined by SRID using a specific IgG2 plate revealed very low concentrations of
IgG2 (interquartile range = 0.11 – 0.15 g/dL). Unexpectedly, the IgG1 and IgG2
subclasses contributed to approximately 65- 75% of the total IgG. Possible explanations
for this finding are that other IgG classes contribute to the total IgG in post colostral sera,
a suggestion that has not been reported before, or that the SRID assay that measures total
IgG is overestimating the total IgG. We support the latter hypothesis, for additional
studies by others demonstrate the SRID overestimates IgG compared to cellulose acetate
protein electrophoresis assays which measure the gamma globulin fraction (R.Di Terlizzi,
2005).
The multiplex microsphere bead assay developed in this study uses the flow
cytometry to differentiate microsphere beads based on size and fluorescence intensity.
The multiplexing property of this assay enables the quantitation of the IgG subclasses in a
single sample. This simultaneous analysis reduces sample volumes, time and labor. The
triplex bead assay was developed based on the covalent linking of proteins to
carboxylated microspheres by chemical reactions and the microsphere assay is
reproducible and has shown good correlation with ELISA (Camilla, et al, 2001;Lal, et al,
2004;Dasso, et al, 2002).
In contrast to many multiplexing formats that use a capture antibody and reporter
antibody conjugated to a fluorochrome, the principle of the assay that we developed was
30

based on competition for a reporter antibody between soluble Ig and Ig bound to
microspheres. Therefore, antigenic determinants on bovine IgGs present in the serum
competed with purified bovine IgG coating the microspheres for the FITC-labeled
antibodies. As a result, as serum IgG concentrations increase the fluorescence intensity
of the beads reacting with antibody decreases proportionally to the amount of soluble
serum Ig.
We found that one of the limitations of the microsphere assay was the
observation that the FITC-labeled sheep anti-bovine IgG1 and IgG2 antibodies cross
reacted with IgG2 and IgG1 coated microspheres in the absence of serum Ig inhibitors.
Although the isotype specific reaction was one to two log higher than the nonspecific
reaction, the cross reactivity between IgG1 antibodies and IgG2 coated beads impaired
the ability to determine accurate concentrations of IgG2 between 0.8 – 3.4 g/dL.
Although the sheep anti-bovine isotype specific antibodies used in this study were
affinity purified and preabsorbed with opposite IgG subclasses, some degree of cross
reactivity is expected (personal communication, Bob Wilds, Technical support,
VMRD). When purified bovine IgG1 or IgG2 at low concentrations (up to 0.1 g/dL)
was added as an inhibitor to the assay the decrease in fluorescence intensity was linear
indicating that the cross reactivity properties of the antibodies did not significantly alter
the change in fluorescence intensity determined for each IgG subclass in a low
analytical range. However, the assay would not be able to accurately determine IgG2 at
concentrations > 0.5 g/dL.
To test the interference for the microsphere assay, the biplex assay was
compared with monoplex assay. The biplex assay did not significantly alter the
31

fluorescence values detected by the binding of FITC cocktail antibodies to either IgG1
or IgG2 coated beads (monoplex). This can also be considered as a test for cross
reactivity because the fluorescence in the biplex assay was not different from the
monoplex assay. We predicted that the mean fluorescence intensity for detection of
IgG2 in the biplex assay would be greater than the monoplex assay because of the cross
reactivity of anti-IgG1 against IgG2 coated beads that we demonstrated previously.
However, the mean fluorescence intensity for IgG2 in the biplex assay was actually less
than the monoplex assay.
The optimization of the triplex assay required a two step carbodimide chemical
reaction and similar incubation techniques for all the three activated proteins and
microspheres. It was observed that variation in the conjugation steps affected the
reproducibility of the assay and the standard curve (data not shown); therefore large
stocks of protein coated beads were prepared to analyze the entire set of serum samples.
Previous studies to test the process of coupling antibodies to microsphere beads has
shown that slight variations in the coupling procedure affect the reproducibility of
microsphere assay when new stock beads are prepared each time, there was change in
CVs up to 25% (Dasso, et al, 2002).
The triplex microsphere assay demonstrated linearity over the two fold dilutions of
standard serum calibrants which included the cutoff range for FPT (< 1 g/dL), but the
triplex assay was designed to determine the concentrations of IgG1 and IgG2 not just
detect FPT. The mean fluorescence intensity generated by using a known amount of
bovine IgG1 and IgG2 as the inhibitors in a triplex assay was used to develop a standard
curve for unknown samples. Bovine reference serum containing known amounts of IgG1
32

(1.2 - 0.15 g/dL) and IgG2 (1.6 – 0.2 g/dL) was used to test the linearity of the curve and
as a control. The triplex microsphere bead assay for IgG1 was reproducible. The intra-
assay and inter-assay precision was good with CV less than 10% for all concentrations of
standards and reference serum with similar slope for the first order polynomial equation.
The analytical accuracy of the IgG1 assay approached 100% for bovine reference serum
concentrations between 0.35 to 1.2 g/dL, however was poor at the lowest concentration
(0.175 g/dL). Possibilities for this observation included nonlinearity of the standard
curve at the lowest concentration, lack of sensitivity of the assay, or errors in sample
preparation.
In our studies we measured the IgG1 and IgG2 concentrations of all the 30
precolostral and postcolostral serum samples from Holstein calves in duplicates. The
Deming method comparison of IgG1 from the flow assay was done using SRID as the
reference. The presence of an outlier caused the regression line to cross the identity line,
When this outlier was removed there was constant and proportion bias. The
concentration of IgG1 determined by the microsphere assay was higher than SRID and
method comparison studies showed poor agreement between the microsphere assay and
SRID assay. The positive bias for the flow cytometry assay can be explained in part by
the use of dilution factors and use of standards with a low analytical range. Moreover,
independent studies using protein electrophoresis to determine the gamma globulin
fraction demonstrated that the Ig standards used to test total IgG by SRID were
erroneously high (Table 6). Based on these findings we propose that the SRID has
several limitations and should not be considered the gold standard method. The
limitations include the variations that occur between individuals when measuring the
33

diameter of the precipitation ring, which is dependent on having a crisp diffusion ring and
the accuracy of using a millimeter ruler. Furthermore, samples may diffuse into
neighboring wells. The error rate is reported to be high in SRID if the serum
concentrations of immunoglobulins are higher than 3g/dL due to the lack of linearity of
the standard curve and the amplification of errors when concentrations are corrected for
the dilution factor (Pfeiffer, et al, 1977). In fact, this group reported a negative bias of
0.3 g/dL between the serum protein electrophoresis method and total IgG determination
by SRID. Similar problems occur with the microsphere assay because the postcolostral
serum samples that have IgG1 concentrations greater than 1g/dL must be diluted due to
low analytical range of the bovine IgG1 and IgG2 standards. Most of commercial
preparations of purified bovine IgG1 have higher IgG2 concentrations than those of
newborn calves.
Although the triplex assay is potentially more sensitive than SRID, because of the
sensitivity of fluorescence intensity measured by a flow cytometer, further studies must
be performed to optimize the multiplex assay to measure bovine IgG subclasses. Future
experiments that must be done include using a monoclonal anti-bovine reporter
antibodies to minimize the cross reactivity, preparing bovine standards that cover a wide
analytical range, independent quantitation of IgG1 and IgG2 standards other than by
SRID, and recovery studies that involve spiking bovine serum with known concentrations
of IgG1 and IgG2 to determine the analytical sensitivity of the assay.
34

Reference List
Altman, D. 1991. Practical statistics for medical research. Chapman and Hall, London.
Arthington, J. D., Cattell, M. B., Quigley, J. D., III, McCoy, G. C., and Hurley, W. L.
2000. Passive immunoglobin transfer in newborn calves fed colostrum or spray-
dried serum protein alone or as a supplement to colostrum of varying quality. J.
Dairy Sci. 83, 2834-2838.
Barrington, G. M., Besser, T. E., Davis, W. C., Gay, C. C., Reeves, J. J., and McFadden,
T. B. 1997a. Expression of immunoglobulin G1 receptors by bovine mammary
epithelial cells and mammary leukocytes. J Dairy Sci. 80, 86-93.
Barrington, G. M., Besser, T. E., Gay, C. C., Davis, W. C., Reeves, J. J., and McFadden,
T. B. 1997b. Effect of prolactin on in vitro expression of the bovine mammary
immunoglobulin G1 receptor. J Dairy Sci. 80, 94-100.
Besser, T. E. and Gay, C. C. 1994. The importance of colostrum to the health of the
neonatal calf. Vet. Clin. North Am. Food Anim Pract. 10, 107-117.
Besser, T. E., Gay, C. C., and Pritchett, L. 1991. Comparison of three methods of feeding
colostrum to dairy calves. J Am. Vet Med Assoc. 198, 419-422.
Bland, J. M. and Altman, D. G. 1986a. Statistical methods for assessing agreement
between two methods of clinical measurement. Lancet 1, 307-310.
Bland, J. M. and Altman, D. J. 1986b. Regression analysis. Lancet 1, 908-909.
35

Brandon, M. R., Watson, D. L., and Lascelles, A. K. 1971. The mechanism of transfer of
immunoglobulin into mammary secretion of cows. Aust. J Exp. Biol. Med Sci. 49,
613-623.
Brignole, T. J. and Stott, G. H. 1980. Effect of suckling followed by bottle feeding
colostrum on immunoglobulin absorption and calf survival. J Dairy Sci. 63, 451-
456.
Bush, L. J. and Staley, T. E. 1980. Absorption of colostral immunoglobulins in newborn
calves. J. Dairy Sci. 63, 672-680.
Camilla, C., Mely, L., Magnan, A., Casano, B., Prato, S., Debono, S., Montero, F.,
Defoort, J. P., Martin, M., and Fert, V. 2001. Flow cytometric microsphere-based
immunoassay: analysis of secreted cytokines in whole-blood samples from
asthmatics. Clin Diagn. Lab Immunol. 8, 776-784.
Chorfi, Y., Lanevschi-Pietersma, A., Girard, V., and Tremblay, A. 2004. Evaluation of
variation in serum globulin concentrations in dairy cattle. Vet. Clin. Pathol. 33,
122-127.
Dasso, J., Lee, J., Bach, H., and Mage, R. G. 2002. A comparison of ELISA and flow
microsphere-based assays for quantification of immunoglobulins. J. Immunol.
Methods 263, 23-33.
Davis, D. G., Schaefer, D. M., Hinchcliff, K. W., Wellman, M. L., Willet, V. E., and
Fletcher, J. M. 2005. Measurement of serum IgG in foals by radial
36

immunodiffusion and automated turbidimetric immunoassay. J. Vet. Intern. Med.
19, 93-96.
Etzel, L. R., Strohbehn, R. E., and McVicker, J. K. 1997. Development of an automated
turbidimetric immunoassay for quantification of bovine serum immunoglobulin G.
Am. J Vet Res. 58, 1201-1205.
Lal, G., Balmer, P., Joseph, H., Dawson, M., and Borrow, R. 2004. Development and
evaluation of a tetraplex flow cytometric assay for quantitation of serum antibodies
to Neisseria meningitidis serogroups A, C, Y, and W-135. Clin Diagn. Lab
Immunol. 11, 272-279.
Lecce, J. G. and Morgan, D. O. 1962. Effect of dietary regimen on cessation of intestinal
absorption of large molecules (closure) in the neonatal pig and lamb. J Nutr. 78,
263-268.
Mayer, B., Zolnai, A., Frenyo, L. V., Jancsik, V., Szentirmay, Z., Hammarstrom, L., and
Kacskovics, I. 2002. Redistribution of the sheep neonatal Fc receptor in the
mammary gland around the time of parturition in ewes and its localization in the
small intestine of neonatal lambs. Immunology 107, 288-296.
McVicker, J. K., Rouse, G. C., Fowler, M. A., Perry, B. H., Miller, B. L., and Johnson, T.
E. 2002. Evaluation of a lateral-flow immunoassay for use in monitoring passive
transfer of immunoglobulins in calves. Am. J Vet Res. 63, 247-250.
37

Paul, S., Wilkerson, M. J., Shuman, W., and Harkin, K. R. 2005. Development and
evaluation of a flow cytometry microsphere assay to detect anti-histone antibody in
dogs. Vet. Immunol. Immunopathol.
Pfeiffer, N. E., McGuire, T. C., Bendel, R. B., and Weikel, J. M. 1977. Quantitation of
bovine immunoglobulins: comparison of single radial immunodiffusion, zinc
sulfate turbidity, serum electrophoresis, and refractometer methods. Am. J. Vet.
Res. 38, 693-698.
Quigley, J. D., III, French, P., and James, R. E. 2000. Short communication: effect of pH
on absorption of immunoglobulin G in neonatal calves. J Dairy Sci. 83, 1853-1855.
Quigley, J. D., Strohbehn, R. E., Kost, C. J., and O'Brien, M. M. 2001. Formulation of
colostrum supplements, colostrum replacers and acquisition of passive immunity in
neonatal calves. J. Dairy Sci. 84, 2059-2065.
R.Di Terlizzi, S. L. Stockham R. Kempegowda and M. J. Wilkerson. Submitted to
American College of Veterinary Pathologist, 2005. Comparison of protein
concentraitons in precolostral and postcolostral bovine sera using
spectrophotometric,refractometetric,electrophoretic and radioimmunodiffusion
methods.
Sasaki, M., Davis, C. L., and Larson, B. L. 1976. Production and turnover of IgG1 and
IgG2 immunoglobulins in the bovine around parturition. J Dairy Sci. 59, 2046-
2055.
38

Stockham, S. L. and Scott, M. A. 2002. Proteins. In: S. L. Stockham and M. A. Scott,
(Eds.) , Fundamentals of Veterinary Clinical Pathology Vol. pp. 251-276.
Blacksburg Publishing, Ames, IA.
Stott, G. H. and Fellah, A. 1983. Colostral immunoglobulin absorption linearly related to
concentration for calves. J. Dairy Sci. 66, 1319-1328.
Stott, G. H., Marx, D. B., Menefee, B. E., and Nightengale, G. T. 1979. Colostral
immunoglobulin transfer in calves I. Period of absorption. J. Dairy Sci. 62, 1632-
1638.
Tizard, I. R. and Schubot, R. M. 2005. Immunity in the fetus and newborn. In:
Veterinary Immunology, an introduction Vol. pp. 221-233. Saunders,
Philadelphia.
Tyler, J. W., Besser, T. E., Wilson, L., Hancock, D. D., Sanders, S., and Rea, D. E.
1996a. Evaluation of a whole blood glutaraldehyde coagulation test for the
detection of failure of passive transfer in calves. J Vet Intern Med 10, 82-84.
Tyler, J. W., Hancock, D. D., Parish, S. M., Rea, D. E., Besser, T. E., Sanders, S. G., and
Wilson, L. K. 1996b. Evaluation of 3 assays for failure of passive transfer in calves.
J. Vet. Intern. Med. 10, 304-307.
Weaver, D. M., Tyler, J. W., VanMetre, D. C., Hostetler, D. E., and Barrington, G. M.
2000. Passive transfer of colostral immunoglobulins in calves. J Vet Intern Med 14,
569-577.
39

Wilson, L. K., Tyler, J. W., Besser, T. E., Parish, S. M., and Gant, R. 1999. Prediction of
serum IgG1 concentration in beef calves based on age and serum gamma-glutamyl-
transferase activity. J Vet Intern Med 13, 123-125.
40

Table 1. Post colostral IgG concentrations (g/dL) measured by RID
Calf no SRID (Total IgG)
Rep. 1. Rep. 2. SRID (IgG1)
Rep. 1. Rep. 2. SRID (IgG2) Rep. 1. Rep. 2
3421 3.2 3.2 2.1 2.1 0.04 0.04 3429 2.3 2.3 1.3 1.3 0.07 0.07 3430 1.6 1.6 1.4 1.3 0.07 0.07 3431 1.7 1.7 0.7 0.7 0.12 0.15 3432 2.9 2.9 1.5 1.3 0.19 0.19 3436 4.0 4.2 1.4 1.4 0.19 0.19 3437 4.0 4.0 1.3 1.3 0.12 0.12 3438 1.5 1.5 2.1 2.1 0.10 0.10 3439 3.2 3.2 2.0 2.0 0.09 0.09 3440 7.2 6.8 7.5 8.0 0.20 0.20 3441 4.8 4.8 2.1 2.1 0.09 0.09 3444 3.2 3.2 1.9 1.9 0.09 0.09 3446 5.0 5.0 2.7 2.7 0.09 0.09 3448 0.8 0.8 0.7 0.7 0.04 0.04 3451 1.2 1.2 1.5 1.5 0.12 0.12 3454 0.9 0.9 0.7 0.9 0.05 0.05
3418A 5.0 5.0 2.6 2.6 0.12 0.12 3419A 3.2 3.2 2.7 2.7 0.09 0.09 3420A 3.2 3.2 2.0 2.0 0.09 0.09 3421A 3.2 3.2 2.1 2.1 0.14 0.14 3422A 2.4 2.4 2.2 2.2 0.11 0.11 3423A 2.3 2.3 1.7 1.7 0.10 0.11 3426A 2.4 2.5 2.3 2.3 0.15 0.15 3427A 4.8 4.8 3.0 3.0 0.18 0.16 3431A 3.2 3.2 2.5 2.5 0.13 0.13 3433A 5.0 5.0 1.2 1.2 0.11 0.11 3435A 3.8 3.8 3.2 3.2 0.16 0.16 3437A 1.5 1.5 1.2 1.5 0.5 0.05 3438A 3.0 3.0 2.0 2.4 0.27 0.27 3440A 4.0 4.0 2.6 2.6 0.94 0.09
Median 3.2 3.2 2 2.1 0.12 0.11 25% 2.3 2.3 1.4 1.4 0.09 0.09 75% 4.0 4.0 2.5 2.5 0.16 0.15
41

Table 2. Concentrations of bovine IgG subclasses in serum calibrants and
reference sera
*PE – protein electrophoresis by cellulose acetate
Sigma bovine IgG (PE)*
Sigma bovine IgG1 by SRID
Sigma bovine IgG IgG2 by SRID
Bovine Ref. Sera IgG1
Bovine Ref. Sera IgG2
5.0 g/dL
1.0 g/dL
~3.4 g/dL
1.2 g/dL
1.6 g/dL
2.5 g/dL
0.5 g/dL
1.7 g/dL
0.6 g/dL
0.8 g/dL
1.3 g/dL
0.25 g/dL
0.85 g/dL
0.3 g/dL
0.4 g/dL
0.6 g/dL
0.16 g/dL
0.45 g/dL
0.15 g/dL
0.2 g/dL
0.3 g/dL
Too small
0.225 g/dL
-- --
42

Table 3. Intraassay reproducibility.
Sigma bovine IgG1 Concentration
g/dL SD MF CV
1 16.0 291.3 5%
0.5 26.8 427.5
6%
0.25 22.3 579.3
4%
0.16 20.5 824.8
2%
too small 28.7 1001.8
3%
A.
B.
Ref-serum
IgG1 Concentration
g/dL SD MF CV
1.2 17.0 286.3
6%
0.6 14.0 407.3
3%
0.3 42.0 530.5 8%
0.1 30.3 607.0 5%
-- --
--
43
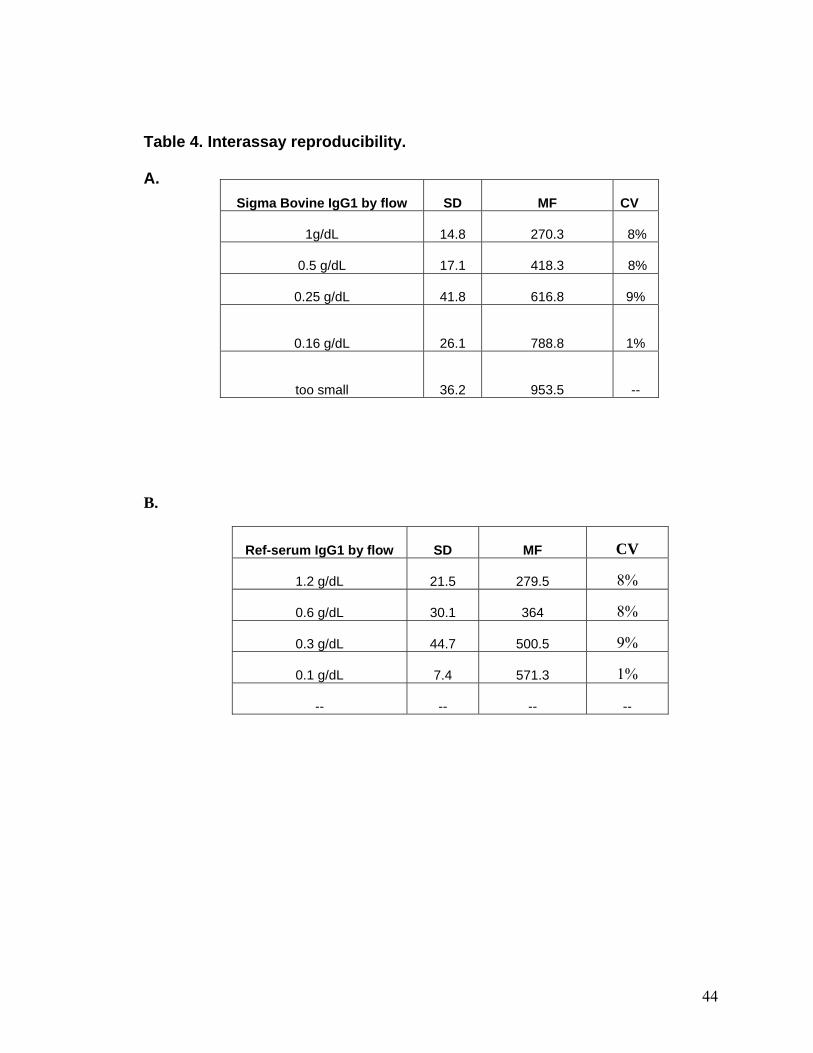
Table 4. Interassay reproducibility.
A. Sigma Bovine IgG1 by flow SD MF
CV
1g/dL 14.8 270.3 8%
0.5 g/dL 17.1 418.3
8%
0.25 g/dL 41.8 616.8
9%
0.16 g/dL 26.1 788.8
1%
too small 36.2 953.5
--
B.
Ref-serum IgG1 by flow SD MF CV
1.2 g/dL 21.5 279.5 8%
0.6 g/dL 30.1 364 8%
0.3 g/dL 44.7 500.5 9%
0.1 g/dL 7.4 571.3 1%
-- -- -- --
44

Table 5. Analytical accuracy of IgG1 in bovine reference serum
Expected concentration
of IgG1
Observed
concentration of IgG1
Percentage recovery
(observed/expected)
1.2 g/dL
1.3 g/dL
108%
0.7 g/dL
0.70 g/dL
100%
0.35 g/dL
0.37 g/dL
106%
0.175 g/dL
0.32 g/dL
183%
45

Table 6. Comparison of IgG concentrations of Serum calibrants by
Protein electrophoresis and SRID methods.
Protein electrophoresis SRID for total IgG
5.0 g/dL Too large
2.5 g/dL 3.4 g/dL
1.3 g/dL 1.7 g/dL
0.6 g/dL 0.9 g/dL
0.3 g/dL 0.4 g/dL
46

FL1-H
Figure 1. Flow cytometry dot plot (A) and histogram (B) of Quantum Plex beads
illustrates the different red fluorescent properties of the beads that were coated with
BSA (pink dots), IgG2 (blue dots), and IgG1 (green dots) as the microsphere sets are
distinguished from one another by a two color dot plot using the FL3 detector and FL1
detector (A) and plotted as a histogram on a log scale using the number of bead events
(counts) vs. the height of fluorescent channels.
47

Figure 2. Flow cytometry dot plots (FL3-H vs. FL1-H) illustrating the binding of
FITC sheep anti-bovine Igs to a combination of IgG1 and IgG2 coated beads. Cross
reactive binding of FITC-labeled sheep anti-bovine IgG2 occurred with IgG1 coated
microspheres, green dots (A) and FITC-labeled sheep anti-bovine IgG1 with IgG2
coated beads, blue dots (B). Isotypes specific reactions demonstrate a greater shift in
fluorescence intensity for bovine IgG1 coated beads treated with anti-bovine IgG1(C)
and bovine IgG2 coated beads treated with anti-bovine IgG2 (D). No changes were
observed in BSA, red dots.
48
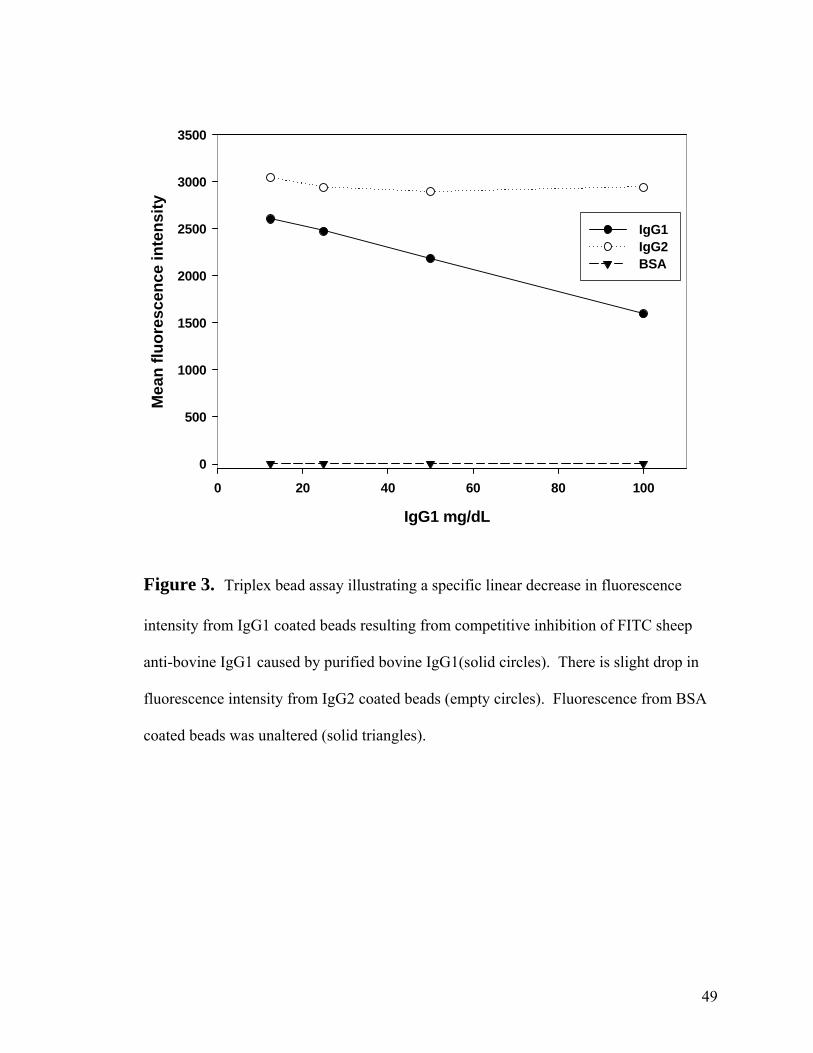
IgG1 mg/dL
0 20 40 60 80 100
Mea
n flu
ores
cenc
e in
tens
ity
0
500
1000
1500
2000
2500
3000
3500
IgG1 IgG2 BSA
Figure 3. Triplex bead assay illustrating a specific linear decrease in fluorescence
intensity from IgG1 coated beads resulting from competitive inhibition of FITC sheep
anti-bovine IgG1 caused by purified bovine IgG1(solid circles). There is slight drop in
fluorescence intensity from IgG2 coated beads (empty circles). Fluorescence from BSA
coated beads was unaltered (solid triangles).
49

IgG2 mg/dL
0 20 40 60 80 100
Mea
n flu
ores
cenc
e in
tens
ity
0
500
1000
1500
2000
2500
3000
3500
IgG2 IgG1 BSA
Figure 4. Triplex bead assay illustrating a specific linear decrease in fluorescence
intensity from IgG2 coated beads resulting from competitive inhibition of FITC sheep
anti-bovine IgG2 caused by purified bovine IgG2(solid circles) (except for highest
concentration of IgG2). There is slight drop in fluorescence intensity from IgG1 coated
beads (empty circles). Fluorescence intensity from BSA coated beads was unaltered
(solid triangles).
50

0
200
400
600
800
1000
1200
1400
1600
1800
100 500 1000 10000
Dilutions of secondary antibodies
Mea
n flu
ores
cenc
e in
tens
ity
Monoplex IgG1Biplex IgG1
Figure 5. Bar chart comparing monoplex IgG1(black bars) and biplex IgG1(white
bars) microsphere assay over the dilution range of sheep anti-bovine IgG1 and IgG2,
the mean fluorescence intensity of the monoplex IgG1 and biplex IgG1are similar as
there is no significant interference in biplex for IgG1.
51

0
500
1000
1500
2000
2500
3000
3500
4000
100 500 1000 10000
Dilutions of secondary antibodies
Mea
n flu
ores
cenc
e in
tens
ity
Monoplex IgG2Biplex IgG2
Figure 6. Bar chart comparing monoplex IgG2 (black bars) and biplex IgG2 (white
bars) microsphere assays over the dilution range of sheep antibovine IgG1 and IgG2
antibodies, there is slight decrease in fluorescence intensity for the biplex IgG2 on
comparision with the monoplex IgG2.
52

Figure 7. Flow cytometry dot plots (FL3-H vs. FL1-H) illustrating decrease in
fluorescence intensity for IgG1 (green dots) and IgG2 (blue dots) coated beads with
increasing concentration of inhibitor. No changes were observed in BSA (red dots).
(A) Precolostral serum-no inhibitor (B) IgG1 too small to detect by SRID, IgG2-0.22
g/dL, (C) IgG1-0.16 g/dL, IgG2-0.45 g/dL (D) IgG1-0.25 g/dL, IgG2-0.85g/dL, (E)
IgG1-0.5 g/dL,IgG2-1.4 g/dL, (F). IgG1-1g/dL, IgG2 ~3.4 g/dL.
53

A
0
200
400
600
800
1000
0 0.5 1
IgG1 (g/dL)
Mea
n flu
ores
cenc
e in
tens
ity
1.5
B
y = -275.45x + 235.86
0
200
400
600
800
1000
-2 -1.5 -1 -0.5 0
IgG1
Mea
n flu
ores
cenc
e in
tens
ity
Figure 8. The standard curve and first order polynomial equation created by plotting
IgG1 standard serum calibrants against mean fluorescence intensity of the IgG1
standards. (A) A nonlinear curve is observed when concentrations of IgG1 in g/dL
plotted against mean fluorescence intensity. (B) Linear curve resulted when
concentrations of IgG1 in x-axis were converted to natural log and the polynomial
equation for the curve was created
54

A
y = -276.19x + 260.13
0
200
400
600
800
1000
-2 -1.5 -1 -0.5 0IgG1
Mea
n flu
ores
cenc
e in
tens
ity
B
y = -276.91x + 254.18
0
200
400
600
800
1000
-2 -1.5 -1 -0.5 0
IgG1
Mea
n flu
ores
cenc
e in
tens
ity
Figure 9. The standard curve and first order polynomial equation created by plotting
concentrations of IgG1 standard serum calibrants in natural log in x-axis against mean
fluorescence intensity of the IgG1 standards. The standard curves for the intraassay (A)
and interassay (B) reproducibility experiments were linear with similar values for the
slope.
55

Identity line
Y = X
y = 0.1077x + 2.4021
0
1
2
3
4
5
6
7
8
0 2 4 6 8
Average IgG1 concentration by SRID
Ave
rage
IgG
1 co
ncen
trat
ion
by F
low
cy
tom
etry
Figure 10. The average concentrations of duplicate samples for IgG1 determined by
flow and SRID were plotted using Deming method comparison. The faint line represents
the line of identity if the samples had the same concentrations. The dark line represents
the best fit line, which is extremely altered because of the presence of an outlier.
56

Identity line
Y = X
y = 0.7125x + 1.2883
0.5
1
1.5
2
2.5
3
3.5
4
4.5
0.5 1.5 2.5 3.5 4.5
Average IgG1 concentration by SRID
Ave
rage
IgG
1 co
ncen
trat
ion
by F
low
cy
tom
etry
ass
ay
Figure 11. Average concentrations of duplicate samples for IgG1 determined by flow
and SRID were plotted using Deming method comparison without outlier. The faint line
represents the line of identity if the samples had the same concentrations. The dark line
represents the best fit line, which shows a positive bias, constant and proportional bias.
The mean fluorescence intensity of the duplicate measurements of SRID and flow is used
for Deming method. The concentration of IgG1 determined by flow is higher than SRID.
57

Zero bias
-1.5
-1-0.5
0
0.51
1.5
22.5
3
0.5 1.5 2.5 3.5 4.5
Average of SRID IgG1 concentration
Diff
eren
ce b
etw
een
met
hods
Flow
IgG
1 - S
RID
IgG
1
Figure 12. NCCLS Bias plot represents difference between methods compared to
SRID. Differences were determined by subtracting the average of duplicate samples of
the SRID from the average of duplicate samples from the flow cytometry assay. The
short dashes represent positive bias of 0.743 g/dL. The short and long dashes represent
95% confidence interval of the bias (0.382 to 1.105 g/dL). One outlier was observed.
58

Identity line
Y = X
y = 0.3657x + 0.6816
1
2
3
4
5
6
7
8
1 3 5 7
Average IgG concentration (SRID)
Ave
rage
IgG
con
cent
ratio
n (C
A)
Figure 13. Average concentrations of duplicate samples for total IgG determined by
cellulose acetate method and SRID were plotted using Deming method comparison. The
faint line represents the line of identity if the samples had the same concentrations. The
dark line represents the best fit line, which shows a negative bias, constant and
proportional bias. The concentration of total IgG determined by SRID is higher than
cellulose acetate method.
59

Zero bias
-3.5
-3
-2.5
-2
-1.5
-1
-0.5
0
0.5
1 3 5 7
Average of SRID ( IgG)
Ave
rage
of G
amm
a gl
obul
in (C
A) -
A
vera
ge o
f SR
ID (I
gG)
Figure 14. NCCLS bias plot represents the difference between methods compared to
SRID. Differences were determined by subtracting the average of duplicate samples of
the protein electrophoresis determined by cellulose acetate (CA) from the mean of
duplicate samples from the flow cytometry assay. The short dashes represent negative
bias of 1.4 g/dL. The short and long dashes represent 95% confidence interval of the bias
(-1.8 to -1.05 g/dL).
60