Development and evaluation of a computer adaptive test of personality: the basic traits inventory
242
COPYRIGHT AND CITATION CONSIDERATIONS FOR THIS THESIS/ DISSERTATION o Attribution — You must give appropriate credit, provide a link to the license, and indicate if changes were made. You may do so in any reasonable manner, but not in any way that suggests the licensor endorses you or your use. o NonCommercial — You may not use the material for commercial purposes. o ShareAlike — If you remix, transform, or build upon the material, you must distribute your contributions under the same license as the original. How to cite this thesis Surname, Initial(s). (2012) Title of the thesis or dissertation. PhD. (Chemistry)/ M.Sc. (Physics)/ M.A. (Philosophy)/M.Com. (Finance) etc. [Unpublished]: University of Johannesburg. Retrieved from: https://ujcontent.uj.ac.za/vital/access/manager/Index?site_name=Research%20Output (Accessed: Date).
Transcript of Development and evaluation of a computer adaptive test of personality: the basic traits inventory

COPYRIGHT AND CITATION CONSIDERATIONS FOR THIS THESIS/ DISSERTATION
o Attribution — You must give appropriate credit, provide a link to the license, and indicate ifchanges were made. You may do so in any reasonable manner, but not in any way thatsuggests the licensor endorses you or your use.
o NonCommercial — You may not use the material for commercial purposes.
o ShareAlike — If you remix, transform, or build upon the material, you must distribute yourcontributions under the same license as the original.
How to cite this thesis
Surname, Initial(s). (2012) Title of the thesis or dissertation. PhD. (Chemistry)/ M.Sc. (Physics)/ M.A. (Philosophy)/M.Com. (Finance) etc. [Unpublished]: University of Johannesburg. Retrieved from: https://ujcontent.uj.ac.za/vital/access/manager/Index?site_name=Research%20Output (Accessed: Date).

DEVELOPMENT AND EVALUATION OF A COMPUTER ADAPTIVE
TEST OF PERSONALITY: THE BASIC TRAITS INVENTORY
by
PAUL P. VORSTER
200603252
Thesis submitted in fulfilment
of the requirements for the degree
DOCTORATE IN PHILOSOPHY Industrial Psychology
in the
FACULTY OF MANAGEMENT
at the
Department of Industrial Psychology and People Management
Supervisor: Professor Gideon P. de Bruin

2
ABSTRACT
Background: Recent developments in technology have made the creation of computer adaptive
tests of personality a possibility. Despite the advances promised by computer adaptive testing,
personality testing has lagged behind the ability testing domain regarding computer adaptive
testing and adaptation. A principal reason why personality tests have not enjoyed computer
adaptive adaptation is because few working computer adaptive tests are available for study or
comparison to their original fixed form counterparts. In addition, personality tests tend to be
predominantly based on classical test theory, whereas item response theory is required for the
development of a computer adaptive test. Despite these impediments, numerous attitudinal
measures have been adapted to function as computer adaptive tests and have demonstrated good
psychometric properties and equivalence to their fixed form counterparts. As computer adaptive
testing holds numerous advantages both psychometrically and practically, the development of a
computer adaptive personality test may further advance psychometric testing of personality.
Research Purpose: This study aimed to address the lack of progress made in the field of computer
adaptive personality testing through the evaluation and simulated testing of a hierarchical
personality inventory, namely the Basic Traits Inventory (BTI), within a computer adaptive test
framework. The research aimed to demonstrate the process of computer adaptive test preparation
and evaluation (study 1 and study 2); as well as the simulation of the scales of the BTI as computer
adaptive tests (study 3). This was conducted to determine whether the BTI scales could be used as
computer adaptive tests, and to determine how the BTI computer adaptive scales compare to their
fixed form counterparts.
Research Design: A sample of 1962 South African adults completed the BTI for selection,
development and career counselling purposes. The instrument was investigated on a scale by scale
basis with specific emphasis placed on scale dimensionality (study 1) and scale fit to the one-
dimensional Rasch item response theory model (study 2). These factor analytic and item response

3
theory evaluations were necessary to determine the suitability of the BTI scales for computer
adaptive testing as well as prepare the BTI for computer adaptive test simulation. Poor performing
items were removed and a set of ‘core’ items selected for computer adaptive testing. Finally, the
efficiency, precision, and equivalence of the person parameters generated by the computer
adaptive core scales, as simulated in a computer adaptive framework, were compared to their non-
adaptive fixed form counterparts to determine their metric equivalence and functioning (study 3).
Main Findings:
Study 1: The initial evaluation of dimensionality of the BTI scales indicated that the orthogonal
bifactor model was the best fitting dimensional model for the BTI scales. The scales of the BTI
was therefore not strictly unidimensional, but rather was composed of a dominant general factor
with some group factors (the facets) accounting for unique variance beyond the general factor.
Except for Extraversion, all other scales of the BTI evidenced general factor dominance, which
indicated that a total score could be interpreted for at least four of the five BTI scales. This total
score interpretation at the scale level allows the BTI to be used computer adaptively on the scale
(general factor) level. Although Excitement Seeking accounted for unique variance beyond the
general factor, the facet was still included when the scale was fit to the Rasch model.
Study 2: A total of 59 items were flagged for removal following fit to the one-dimensional Rasch
model. These items were flagged for removal because they did not fit the Rasch rating scale model
effectively or because the items demonstrated either uniform or non-uniform DIF by ethnicity
and/or gender. Item parameters were also generated for the shortened and optimised BTI scales
(core scales) for computer adaptive adaptation. In general, all the scales of the BTI fit the Rasch
model well after flagged items were removed which justified the inclusion of the Excitement
Seeking facet in the Extraversion scale for computer adaptive testing.
Study 3: The optimised computer adaptive ‘core’ BTI scales used on average 50 – 67% fewer
items when compared to their fixed form non-computer adaptive counterparts during computer
4
adaptive test simulation. Person parameter estimates were estimated at or below the standard error
criterion of .33 which indicate rigorous measurement precision. The BTI scales also demonstrated
strong correlations to their non-adaptive full form counterparts with correlations ranging between
.89 (Extraversion) to .94 (Neuroticism).
Summary and Implications: It is possible for a standard non-computer adaptive test of
personality to be converted into a computer adaptive test without compromising the psychometric
properties of the instrument. Study 1 and 2 were evaluative and helped to prepare the BTI scales
for computer adaptive test application. The final study indicated that good scale preparation results
in better equivalence between the computer adaptive and fixed form non-computer adaptive tests.
Additionally, a lower standard error of person parameter estimation as well as greater item
administration efficiency was attained by the ‘prepared’ item banks. Although future research
should take into consideration test-mode differences and content balancing of subscales, the
research demonstrates that a computer adaptive test of personality can be as precise, reliable, and
accurate, while being more efficient, than their fixed form non-computer adaptive counterparts.

5
TABLE OF CONTENTS
ABSTRACT ............................................................................................................................... 2
ACKNOWLEDGEMENTS ....................................................................................................... 9
LIST OF TABLES ................................................................................................................... 10
LIST OF FIGURES ................................................................................................................. 12
CHAPTER 1: INTRODUCTION AND ORIENTATION TO THE STUDY ......................... 14
1.1. Introduction ....................................................................................................................14
1.2. The progress made in the computer adaptive testing of personality ..............................15
1.3. Overview of the present study ........................................................................................18
CHAPTER 2: BACKGROUND OF COMPUTER ADAPTIVE TESTING .......................... 20
2.1. Key terms in computer adaptive testing .........................................................................20
2.2. Equivalence of computer adaptive tests to non-computer adaptive tests .......................23
2.3. Classical test theory and item response theory ...............................................................27
2.3.1. The problem of mean error estimation in classical test theory .......................................30
2.3.2. The impact of the number of test items administered ....................................................32
2.3.3. Local independence, person-free items estimation, and item-free person estimation ....33
2.3.4. Measurement invariance .................................................................................................38
2.4. The advantages of computerized adaptive testing ..........................................................39
2.4.1. Increased relevance for test-takers .................................................................................40
2.4.2. Reduction of testing time................................................................................................41
2.4.3. Reducing the burden of testing .......................................................................................42
2.4.4. Immediate feedback after testing....................................................................................42
2.4.5. Testing is not limited to one setting ...............................................................................43
2.4.6. Greater test security ........................................................................................................43
2.4.7. Invariant measurement ...................................................................................................44
2.4.8. Error estimates for each item ..........................................................................................44
2.4.9. Advancement of psychometric testing in general ..........................................................44
2.5. The requirements for the development of computer adaptive tests ................................45
2.6. Preview of the contents of the following chapters .........................................................46
CHAPTER 3: THE DIMENSIONALITY OF THE BTI SCALES ......................................... 48
3.1. Introduction ....................................................................................................................48
6
3.1.1. Testing the dimensionality of hierarchical personality scales ........................................49
3.1.2. Evaluation of the dimensionality of hierarchical personality scales ..............................52
3.1.3. The Basic Traits Inventory (BTI) ...................................................................................54
3.2. Method ............................................................................................................................55
3.2.1. Participants…………………………………………………………………………….55
3.2.2. Instrument……………………………………………………………………………...56
3.2.3. Data Analysis..................................................................................................................56
3.2.4. Ethical Considerations ....................................................................................................58
3.3. Results ............................................................................................................................58
3.3.1. Fit indices for the bifactor model (Model3) ...................................................................60
3.3.2. Reliability of the BTI scales ...........................................................................................61
3.3.3. Reliability of the BTI subscales .....................................................................................62
3.3.4. The bifactor pattern matrix .............................................................................................64
3.4. Discussion.......................................................................................................................66
3.4.1. The fit of the bifactor model ...........................................................................................66
3.4.2. The dimensionality of the BTI scales .............................................................................67
3.4.3. Implications for fit to one-dimensional item response theory models ...........................68
3.5. Overview of Chapter 3 and a preview of Chapter 4 ..................................................69
CHAPTER 4: FITTING THE BTI SCALES TO THE RASCH MODEL ............................ 70
4.1. Introduction ....................................................................................................................70
4.1.1. The use of the Rasch model for computer adaptive test development ...........................71
4.1.2. The application of Rasch diagnostic criteria for psychometric evaluation ....................73
4.2. Method ............................................................................................................................75
4.2.1. Participants …………………………………………………………………………….75
4.2.2. Instrument……………………………………………………………………………...75
4.2.3. Data Analysis..................................................................................................................76
4.2.4. Ethical Considerations ....................................................................................................78
4.3. Results ............................................................................................................................82
4.3.1. BTI scale infit and outfit statistics ..................................................................................82
4.3.2. Person separation and reliability indices ........................................................................86
4.3.3. Rating scale performance ...............................................................................................87
4.3.4. Differential item functioning ..........................................................................................92
4.3.5. Criteria for item exclusion from the core item bank ......................................................98
7
4.3.6. Functioning of the ‘core’ BTI scales ..............................................................................99
4.3.7. Cross-plotting person parameters of the full-test and the reduced test scales ..............113
4.4. Discussion.....................................................................................................................118
4.4.1. Rasch rating scale model fit .........................................................................................119
4.4.2. Item spread and reliability ............................................................................................119
4.4.3. Rating scale performance .............................................................................................120
4.4.4. DIF by ethnicity and gender .........................................................................................121
4.4.5. Conclusion…………………………………………………………………………….121
4.5. Overview of the current chapter and preview of the forthcoming chapter ...................123
CHAPTER 5: AN EVALUATION OF THE COMPUTER ADAPTIVE BTI ..................... 125
5.1. Introduction ..................................................................................................................125
5.1.1. Computer adaptive test simulation ...............................................................................126
5.1.2. Item banks used in computer adaptive testing ..............................................................128
5.1.3. Computer adaptive testing ............................................................................................129
5.2. Method ..........................................................................................................................142
5.2.1. Participants……………………………………………………………………………142
5.2.2. Instrument…………………………………………………………………………….142
5.2.3. Data Analysis................................................................................................................143
5.2.4. Ethical Considerations ..................................................................................................150
5.3. Results ..........................................................................................................................150
5.3.1. Comparing person parameter estimates of the different BTI scales .............................151
5.3.2. Computer adaptive core test performance indices........................................................167
5.4. Discussion.....................................................................................................................179
5.4.1. Correlations between person parameter estimates of the various adaptive and non-adaptive
test forms……………………………………………………………………………...180
5.4.2. Adaptive core and adaptive full performance indices ..................................................183
5.4.3. Item usage statistics ......................................................................................................185
5.4.4. Implications for computer adaptive testing of personality ...........................................185
5.4.5. Recommendations for future research ..........................................................................186
5.4.6. Conclusion and final comments ...................................................................................189
CHAPTER 6: DISCUSSION AND CONCLUSION ............................................................ 191
6.1. Introduction ..................................................................................................................191
6.1.1. Aims and objectives of the three studies ......................................................................191

8
6.1.2. Study 1 objectives: The dimensionality of the BTI scales ...........................................192
6.1.3. Study 2 objectives: Fitting the BTI scales to the Rasch model: Evaluation and selection of a
core item bank for computer adaptive testing ..............................................................193
6.1.4. Study 3 objectives: An evaluation of the simulated Basic Traits Inventory computer adaptive
test…………………………………………………………………………………….193
6.2. Discussion of Results for the Three Studies .................................................................194
6.2.1. Study 1 results: The dimensionality of the BTI scales .................................................194
6.2.2. Study 2 results: Fitting the BTI scales to the Rasch model ..........................................197
6.2.3. Study 3 results: An evaluation of the computer adaptive BTI .....................................198
6.3. Limitations and suggestions for future research ...........................................................199
6.4. Implications for practice ...............................................................................................201
6.5. Conclusion ....................................................................................................................202
REFERENCES ...................................................................................................................... 203
APPENDIX A: ITEM USAGE STATISTICS FOR THE ADAPTIVE FULL AND
ADAPTIVE CORE TEST VERSIONS ................................................................................. 227
APPENDIX B: MAXIMUM ATTAINABLE INFORMATION WITH SUCCESSIVE ITEM
ADMINISTRATION ............................................................................................................. 232
APPENDIX C: NUMBER OF ITEMS ADMINISTERED ACROSS THE TRAIT
CONTINUUM ....................................................................................................................... 237

9
ACKNOWLEDGEMENTS
I am deeply indebted to the following people and institutions:
Professor G. P. de Bruin, thank you Professor for all the kind, and hard, words and for
all the support you have given me. I am greatly indebted to you for making this possible. I have
learned so much from you and I hope that I can add to our field and make you proud.
I dedicate this doctoral thesis to two people who have walked the hard miles with me. Firstly,
to my mother Maxine Vorster, without your help, guidance, support and love I would never
have found the courage to complete this endeavour. Thank you for standing by me through
this adventure called ‘life’.
Secondly, but by no means second, thank you Marié Minnaar for standing by me and
giving up our quality time so that I could complete this work. You are truly the love of my life
and without that love I would have been lost. Thank you from the deepest part of my heart.
You are my touchstone.
I would also like to specially thank Professor Freddie Crous. Thank you Professor for
the words of encouragement and the hope you have instilled in me to be the best I can be.
Thank you for always being interested and encouraging. It has meant more to me than you will
ever know.
Finally, I would like to thank Dr. Nicola Taylor and Dr. Brandon Morgan for their
constant assistance and support. Without the two of you I would not have had the motivation
to embark and complete this endeavour. Thank you both for being not only fantastic colleagues,
but good friends.
I would also like to give a final thanks to the Centre for Work Performance and the
Department of Industrial Psychology and People Management. Thank you for your support,
both academically and financially.

10
LIST OF TABLES
Table 3.1 Three confirmatory factor models of the structure of the BTI scales 59
Table 3.2 Chi-square difference test of the three factor models 60
Table 3.3 Proportion of specific and total variance explained by factors and facets of the
BTI
62
Table 3.4 Standardised factor loadings for Neuroticism (Model 3) 64
Table 4.1 Item and person mean summary infit and outfit statistics 82
Table 4.2 Item infit mean squares for the BTI scales 83
Table 4.3 Item outfit mean squares for the BTI scales 85
Table 4.4 Person separation and reliability indices 87
Table 4.5 Rating scale performance indices 88
Table 4.6 Practically significant DIF by ethnicity 93
Table 4.7 Practically significant DIF by gender 96
Table 4.8 Item and person mean summary infit and outfit statistics after item removal 100
Table 4.9 Item infit statistics for the scales of the BTI after flagged items were removed 101
Table 4.10 Item outfit statistics for the scales of the BTI after flagged items were removed 103
Table 4.11 Person separation and reliability indices after item removal 105
Table 4.12 Rating scale performance indices after item removal 106
Table 4.13 Practically significant DIF by ethnicity 110
Table 4.14 Practically significant DIF by gender 112
Table 5.1 Correlations between test-form person parameter estimates for the BTI
Extraversion scale
151
Table 5.2 Correlations between test-form person parameter estimates for the BTI
Neuroticism scale
155

11
Table 5.3 Correlations between test-form person parameter estimates for the BTI
Conscientiousness scale
158
Table 5.4 Correlations between test-form person parameter estimates for the BTI
Openness scale
161
Table 5.5 Correlations between test-form person parameter estimates for the BTI
Agreeableness scale
164
Table 5.6 Performance indices of the adaptive core and full item banks 168
Table 5.7 Percentage of items not administered by the adaptive test versions 178

12
LIST OF FIGURES
Figure 4.3.3a Person/item distribution for the Extraversion scale 90
Figure 4.3.3b Person/item distribution for the Neuroticism scale 90
Figure 4.3.3c Person/item distribution for the Conscientiousness scale 91
Figure 4.3.3d Person/item distribution for the Openness scale 91
Figure 4.3.3e Person/item distribution for the Agreeableness scale 92
Figure 4.3.5.3a Person/item distribution for the core Extraversion scale 107
Figure 4.3.5.3b Person/item distribution for the core Neuroticism scale 108
Figure 4.3.5.3c Person/item distribution for the core Conscientiousness scale 108
Figure 4.3.5.3d Person/item distribution for the core Openness scale 109
Figure 4.3.5.3e Person/item distribution for the core Agreeableness scale 109
Figure 4.3.6a Cross plot of person measures for the full and core Extraversion
scales
114
Figure 4.3.6b Cross plot of person measures for the full and core Neuroticism
scales
115
Figure 4.3.6c Cross plot of person measures for the full and core
Conscientiousness scales
115
Figure 4.3.6d Cross plot of person measures for the full and core Openness scales 116
Figure 4.3.6e Cross Plot of Person Measures for the Full and Core Agreeableness
Scales
116
Figure 5.3.1.1 Cross plot of person measures for the adaptive core and non-
adaptive full scales of Extraversion
153

13
Figure 5.3.1.2
Cross plot of person measures for the adaptive core and non-
adaptive full scales of Neuroticism
156
Figure 5.3.1.3 Cross plot of person measures for the adaptive core and non-
adaptive full scales of Conscientiousness
160
Figure 5.3.1.4 Cross plot of person measures for the adaptive core and non-
adaptive full scales of Openness
163
Figure 5.3.1.5 Cross plot of person measures for the adaptive core and non-
adaptive full scales of Agreeableness
165
Figure 5.6a Maximum attainable information contributed with each item
administered for the Extraversion full item bank
172
Figure 5.6b
Maximum attainable information contributed with each item
administered for the Extraversion core item bank.
173
Figure 5.11a Number of items administered across the trait continuum for the
Extraversion full item bank
175
Figure 5.11b Number of items administered across the trait continuum for the
Extraversion core item bank
176

14
CHAPTER 1: INTRODUCTION AND ORIENTATION TO THE STUDY
“Computer adaptive testing…a methodology whose time has come?” – Michael Linacre
(2000, p.1)
1.1. Introduction
Personality measurement has to move forward. Psychologists and psychometricians
have for too long relied on non-adaptive non-computerised tests based on classical test
theory to measure personality (Crocker & Algina, 1986; McDonald, 1999; Weiss, 2004;
Zickar & Broadfoot, 2009). Paraphrasing Linacre (2000), computer adaptive testing is a
methodology that is ready to be applied to attitudinal inventories (such as personality
inventories). Although computerised adaptive testing has enjoyed widespread attention
in some psychometric testing domains, such as ability testing; personality testing has not
shared the same progress (Forbey & Ben-Porath, 2007; Forbey, Ben-Porath, & Arbisi,
2012; Hol, Vorst, & Mellengergh, 2008; Hsu, Zhao, & Wang, 2013).
To illustrate the slow progress of computer adaptive personality testing a
comparison must be made with computer adaptive ability testing. The first adaptive test
to make use of computer technology was the Armed Services Vocational Aptitude Battery
or ASVAB (de Ayala, 2009). The ASVAB was ready for computer adaptive testing in
1979 (Gershon, 2004). Although computer technology still needed to progress for the test
to be widely implemented it was, for all intents and purposes, ready for practical testing
(Gershon, 2004). In contrast, computer adaptive personality testing has not yet entered
the practical testing arena (Hsu et al., 2013) with limited simulated computer adaptive
personality test versions – computer adaptive tests that use non-adaptive responses to

15
simulate adaptive testing – available, with none used in praxis (Stark, Chernyshenko,
Drasgow, & White, 2012).
Some of the reasons for the slow development of computer adaptive tests of
personality include the expense of computer based testing; the limited spread of the
internet; the relative novelty of the form of testing; the lack of an integrated and universal
model of personality; and the complexity of measuring personality in a computer adaptive
manner (McCrae, 2002; Ortner, 2008; Stark et al., 2012). However, advances have been
made in these areas and many of these challenges have been overcome making computer
adaptive personality testing attainable (Linacre, 2000; Ortner, 2008; Rothstein & Goffin,
2006).
Despite the challenges faced in the development of computer adaptive tests of
personality, some limited progress has been made. The following section in this chapter
will briefly outline and report on this progress.
1.2. The progress made in the computer adaptive testing of personality
Although computer adaptive personality testing has made some progress; this
progress has been compromised by general lack of application to praxis. For example, the
first personality test to become computer adaptive was the California Psychological
Inventory (CPI) in 1977 (Ben-Porath & Butcher, 1986). Unfortunately, the costs of
computer technology, at the time, made the widespread and un-simulated use of this test
unfeasible, and thus the CPI computer adaptive version fell into relative obscurity (Ben-
Porath & Butcher, 1986). Thankfully, the computer adaptive adaptation of the CPI
garnered the attention of researchers that stimulated interest in the field of computer
adaptive personality testing.

16
Only a year after the computer adaptive CPI was developed, Kreitzberg, Stocking and
Swanson (1978) published an early article entitled Computerized Adaptive Testing:
Principles and Directions. This article proposed that the future of ability, clinical and
personality testing would reside in the computer adaptive domain (Kretizberg et al.,
1978). The authors suggested that the newly applied – at the time – item response theory
model could be used to develop item-banks from which items would be administered to
test-takers in an adaptive manner using computer technology (Kreitzberg et al., 1978).
These authors argued that computer adaptive tests were more efficient – using fewer
items – while still being capable of rigorously estimating the test-taker’s standing on the
latent construct being measured in a fair and reliable manner (Kreitzberg et al., 1978).
Although Kreitzberg et al. (1978) created some theoretical impetus for computer adaptive
testing, little progress was made until the Minnesota Multiphasic Personality Inventory
(MMPI) was analysed using a one-parameter item response theory model for computer
adaptive testing applications (Ben-Porath & Butcher, 1986; Carter & Wilkinson, 1984).
Unfortunately, the technology to make the computer adaptive version of the MMPI
feasible was not yet readily available at the time (Ben-Porath & Butcher, 1986) and this
computer adaptive instrument, like the computer adaptive CPI, fell into obscurity.
With the publication of Computers in Personality Assessment: A Brief Past, an
Ebullient Present, and Expanding Future by Ben-Porath and Butcher (1986), the case
was once again made for the computer adaptive adaptation and development of
personality inventories. Unfortunately, this article reported little practical progress in the
domain, although theoretical progress was slowly being made. Luckily, advances in
computer technology and the development of the five factor model of personality greatly
facilitated the computerisation of personality testing in industry in the 1990’s, albeit in a
non-adaptive manner (Digman, 1989; Goldberg, 1992; Stark et al., 2012).

17
The constraints imposed on the development of computer adaptive tests of
personality were thus starting to lift (Rothstein & Goffin, 2006). However, by 2006
literature still reported on the lack of progress in the computer adaptive personality
domain (Rothstein & Goffin, 2006) with only the MMPI and NEO-PI-R making any
progress in the field (Forbey, Handel, & Ben-Porath, 2000; Reise & Henson, 2000).
Currently, on the international level, the Graduate Record Examination (GRE);
Graduate Management Admission Test (GMAT) and the Test of English as a Foreign
Language (TOEFL) are the most widely used computer adaptive tests with an estimated
11 million users every year (Kaplan & Saccuzzo, 2013). The GRE, GMAT and TOEFL
are ability based and illustrate how far personality testing is lagging behind ability testing
in the computer adaptive domain.
A very similar trend could be seen in South Africa where only computer adaptive
tests of ability were developed for use in praxis such as the General Scholastic Aptitude
Test (GSAT) and the Learning Potential Computerised Adaptive Test (LPCAT)
(Claassen, Meyer, & Van Tonder, 1992; de Beer, 2005). Unfortunately, no computer
adaptive personality tests have been developed or investigated for use in South Africa to
date. However, Hobson (2015) recently developed a computer adaptive test of the Self-
Control subscale of the Trait Emotional Intelligence Questionnaire (TEIQue) in South
Africa. As this inventory is trait-based, it shares a similar item structure to standard
personality inventories.
With the continued growth of personality testing (Stark et al., 2012); the need to
make assessments shorter and more relevant for test-takers (Haley, Ni, Hambleton,
Slavin, & Jette, 2006), and the exponential growth of computer technology; the time for
computer adaptive personality testing has come. It is therefore surprising that a recent

18
article by Simms, Goldberg, Roberts, Watson, Welte and Rotterman (2011) still refer to
a lack of progress in the computer adaptive personality test domain.
One of the possible reasons for the lack of development and research on computer
adaptive personality tests may be because no such inventories are readily available for
investigation and scrutiny (Forbey & Ben-Porath, 2007). Although numerous studies have
investigated whether personality tests can effectively fit item response theory models,
which are an essential requirement for computer adaptive testing, not many have
investigated the functioning of personality inventories using an actual computer adaptive
framework (Forbey & Ben-Porath, 2007). Therefore, most studies focusing on the
computer adaptive testing of personality are feasibility oriented and refrain from
evaluating the psychometric properties of personality tests in their computer adaptive
format (Forbey & Ben-Porath, 2007). The lack of pervasive validity evidence through
computer adaptive simulation/testing of personality inventories have contributed
substantially to the slow progress in this domain.
The lack of validity evidence for computer adaptive tests of personality is a core
area addressed by this study. The next section will give an overview of the objectives of
the present study and how a computer adaptive test of personality will be evaluated for
use in the South African context.
1.3. Overview of the present study
This study aimed to address the lack of progress made in the field of computer
adaptive personality testing through the evaluation and testing of a hierarchical
personality inventory, namely the Basic Traits Inventory or BTI, within a computer
adaptive framework. This was accomplished through completion of three independent
studies which are discussed in Chapter 3, 4, and 5 respectively. The psychometric

19
properties of the BTI were systematically evaluated so that the instrument could be
prepared for computer adaptive testing applications in Chapters 3 and 4 respectively.
After initial psychometric evaluation and preparation, the revised version of the BTI was
simulated as a ‘running’ computer adaptive test within a computer adaptive testing
framework in Chapter 5. Additionally, in Chapter 5 the psychometric properties and
efficiency of the computer adaptive BTI was compared to its non-computer adaptive
counterpart to determine whether they were psychometrically equivalent.
In the next chapter (Chapter 2) key terms in computer adaptive testing is defined
and the statistical measurement models on which such testing depends was discussed. The
equivalence of computer adaptive tests when compared to their non-computer adaptive
counterparts is also explored in Chapter 2. Finally, a process for the development and
evaluation of a computer adaptive test of personality was presented.

20
CHAPTER 2: BACKGROUND OF COMPUTER ADAPTIVE TESTING
“Administer an item that is much too hard, and the candidate may immediately fall into
despair, and not even attempt to do well” – Michael Linacre (2000, p.5)
2.1. Key terms in computer adaptive testing
A distinction has to be made between computer based, adaptive, and computer
adaptive testing because these terms are often confused (Triantafillou, Georgiadou, &
Economides, 2008). Computer based testing refers to the mode of testing whereas
adaptive and non-adaptive testing refers to the testing strategy employed (Triantafillou et
al., 2008).
A computer based test is usually completed by a test-taker via computer
(Triantafillou et al., 2008) and may be either adaptive, or non-adaptive in nature
(Thompson & Weiss, 2011). This makes computer based testing distinct from computer
adaptive testing which is both computer based and adaptive (Thompson & Weiss, 2011).
In an adaptive test the test-taker is given items that closely approximate his/her
ability or trait level (Linacre, 2000; Thompson & Weiss, 2011). This does not mean that
adaptive tests need to always be computer-based. For example, Alfred Binet as early as
1905 adaptively administered items on the Binet-Simon intelligence test to test-takers of
varying ability levels by rank ordering the difficulty of items and then subjectively
deciding, based on the performance of the test-taker, which items were most appropriate
to administer (Linacre, 2000). In computer adaptive testing the computer through the use
of item selection algorithms administers the most appropriate item for the currently
estimated ability/trait level of the test-taker (Lai, Cella, Chang, Bode, & Heinemann,
2003). Therefore, in computer adaptive testing, the computer, not the examiner, selects

21
the most appropriate items for administration. Conversely, non-adaptive tests present the
test-taker with all the items in the item-bank, in the same order, regardless of the test-
takers currently estimated ability or trait level (Walker, Bӧhnke, Cerny & Strasser, 2010).
Therefore, non-adaptive tests may or may not be computer-based depending on
the nature of its administration (Thompson & Weiss, 2011). A test is therefore only
considered computer adaptive if it is (1) computer based, (2) adaptive, and (3) when the
computer selects the items deemed most relevant for the test-taker’s ability or trait level
through the use of pre-specified computer algorithm (Dodd, de Ayala, & Koch, 1995;
Gershon, 2004; Simms et al., 2011).
Another aspect of computer adaptive testing that is not well understood is item
difficulty, in the case of ability testing, and item endorsability, in the case of a statement
to a self-report item. Item difficulty refers to the probability that a test-taker will respond
correctly to an item whereas item endorsability refers to the probability that a test-taker
will respond affirmatively (to some greater or lesser degree in the case of Likert-type
scales) to a statement of a self-report item (de Ayala, 2009; Thompson & Weiss, 2011).
This is why item response theory models which calculate logarithmically the probability
of answering an item correctly (or endorsing an item) are so important in the development
of computer adaptive tests (Linacre, 2000). Most important to self-report measures is the
use of partial credit models where test-takers are given partial credit for responses on
Likert-type scales (Masters, 1982; Verhelst & Verstralen, 2008).
In this way, test-takers with a high ability/trait level should have a higher
probability of endorsing items than test-takers with a lower ability/trait level (Wauters,
Desmet, & Noortgate, 2010). In computer adaptive testing the computer determines
which items, with a relative difficulty/endorsability, will be administered to test-takers of
a particular estimated ability/trait level (Weiss, 2013) and vice versa. Therefore, test-

22
takers of a low ability/trait level will be given more items that approximate this
ability/trait level, and fewer items that are of a greater difficulty or lower endorsability
(Weiss, 2013).
Consequently, no test-taker will be given exactly the same test – with the same
items – as the relative estimated ability/trait level of the test-taker and
difficulty/endorsability of items will be approximately matched for each unique
individual (Thompson & Weiss, 2011).
Consequently, item difficulty/endorsability is matched adaptively to the estimated
ability/trait level on the construct of the test-taker (Meijer & Nering, 1999) and only
enough items are administered to determine his/her ability or trait level with sufficient
precision (de Ayala, 2009). Therefore, potentially numerous items, which provide
relatively little information about the test-taker’s ability or trait level, are left-out,
shortening the test (Thompson & Weiss, 2011). This also makes the test optimally
relevant for the test-takers as they are only exposed to the items that match, or
approximate, their estimated ability/trait level throughout the adaptive testing process
(Haley et al., 2006). This is why computer adaptive tests tend to be more efficient and
relevant for test-takers than their non-adaptive counterparts and are thus favourably
presented in the literature (Wang & Kolen, 2001).
However, the drastic movement away from classical test theory to item response
theory, which is a required measurement model for the development and use of computer
adaptive tests, has raised some doubt about the equivalence of computer adaptive tests
when compared to their well-researched and evaluated non-computer adaptive
counterparts (Ortner, 2008). These doubts have impeded the progress of computer
adaptive personality testing (Ortner, 2008). It is therefore logical to assume that computer
adaptive tests of personality would only be widely accepted and implemented in praxis if

23
they are shown to be psychometrically equivalent to their non-computer adaptive
counterparts. More importantly, computer adaptive personality tests should also exceed
their non-computer adaptive counterparts by increasing test efficiency and overcoming
obstacles encountered in ‘classical’ personality testing. Thankfully, numerous studies
have reported on the psychometric properties of computer adaptive tests in the non-ability
testing domain (Betz & Turner, 2011; Chien, Wu, Wang, Castillo, & Chou, 2009; Forbey
& Ben-Porath, 2007; Gibbons et al., 2008; Hol et al., 2008; Pitkin & Vispoel, 2001; Reise
& Henson, 2000). Unfortunately, only a limited number of these studies report on the
psychometric properties of computer adaptive versions of personality inventories.
Nevertheless, these studies are useful additions to the literature of the current study
because they report on attitudinal measures, which in the tecnical sense, are
indistinguishable from personality testing. Consequently, these studies are reviewed in
the next section.
2.2. Equivalence of computer adaptive tests to non-computer adaptive tests
A meta-analysis by Pitkin and Vispoel (2001) reported on fifteen peer-reviewed
articles that pertain to the properties of computer adaptive tests for self-report (attitudinal)
inventories. This meta-analysis indicated that these computer adaptive tests administered
approximately half the items that non-computer adaptive tests administered while still
reliably, validly and precisely measuring the constructs under consideration (Pitkin &
Vispoel, 2001). In addition, an average internal consistency reliability coefficient of .87
for the computer adaptive tests reviewed was reported indicating a high consistency of
measurement for computer adaptive versions of non-adaptive tests (Pitkin & Vispoel,
2001).

24
Additionally, Gibbons et al. (2008) reported a 96% reduction in the number of items
used to estimate the mood and anxiety levels of outpatient groups using a computer
adaptive version of the Mood and Anxiety Spectrum Scales (MASS). This study reported
a correlation > .90 between the shortened computer adaptive scale of the MASS and the
non-adaptive full scale (Gibbons et al., 2008). These results indicated that the computer
adaptive MASS measured the same constructs using fewer items than its non-adaptive
counterpart.
In another computer adaptive test evaluation of an attitudinal measure, Hol et al.
(2008) reported using only 78% of the original items of the Dominance scale of the
Adjective Checklist, or ACL, while achieving a rigorous standard error of person
parameter estimation of <.30 logits. Even though fewer items were administered, the ACL
computer adaptive version still correlated .99 with the latent trait estimates of the full
scale (Hol et al., 2008).
Similarly, Betz and Turner (2011) reported using 25% of the original 100 items of
the Career Confidence Inventory (CCI) within a standard error of person parameter
estimation of <.40, which is considered rigorous. These authors also reported a strong
correlation (.93) between the ability or trait estimates of the computer adaptive and non-
computer adaptive versions of the CCI, thus demonstrating that the computer adaptive
CCI could reliably, precisely and accurately measure the same constructs as its non-
computer adaptive counterpart.
Reise and Henson (2000) in an attempt to computerise the NEO-PI-R found that the
computer adaptive version of the test used only 50% of the original number of items to
estimate personality traits effectively. Out of the thirty facets of the NEO-PI-R, which are
composed of eight items per facet (with a total number of 240 items) the computer
adaptive version used on average four items per facet, for all the facets, to estimate test-

25
takers’ standing on the latent personality traits (Reise & Henson, 2000). This amounted
to using half the items of the total test. Despite using fewer items the correlation between
trait scores of the computer adaptive and non-computer adaptive version of the NEO-PI-
R was >.91 for all items (Reise & Henson, 2000). This study should be of particular
interest because it demonstrates that a computer adaptive version of a personality scale
can be as precise, accurate, and reliable (and more efficient) than its non-computer
adaptive counterpart.
Computer adaptive tests have also been used in clinical settings as there is a greater
need for instruments to be shorter and more relevant to ease the burden on patients (Chien
et al., 2009). For example, Chien et al. (2009) compared the simulated computer adaptive
version of the Activities of Daily Living (ADL) inventory, which measures how easily
patients are able to complete simple day-to-day activities, with its non-computer adaptive
counterpart. The computer adaptive version of the ADL administered 13.42 items to test-
takers on average whereas the non-computer adaptive version of the ADL administered
all 23 items to test-takers. Additionally, the study found no significant mean differences
between the responses on the computer adaptive version in comparison to the non-
computer adaptive version of the ADL alluding to measurement equivalence between the
two instruments (Chien et al., 2009).
One of the most famous and widely used clinical tools, the MMPI-2, is another
instrument that has garnered interest in the computer adaptive testing domain (Forbey &
Ben-Porath, 2007). Both the computer adaptive version of the MMPI-2 and the non-
computer adaptive version were compared for length and equivalence of measurement
(Forbey & Ben-Porath, 2007). On average, the computer adaptive version of the MMPI-
2 used between 21.6% and 17.5% fewer items to successfully and accurately estimate the
standing of test-takers on its clinical personality scales. Additionally, the computer

26
adaptive version of the MMPI-2 was determined to be demonstrably valid and reliable in
spite of its reduced length (Forbey & Ben-Porath, 2007).
Personal computers are not the only format where computer adaptive tests have been
employed. Computer adaptive tests have also been used on smartphone mobile devices
(Triantafillou et al., 2008). Using an educational assessment converted to a computer
adaptive mobile test (CAT-MD), the authors reported a 22.7% increased test efficiency
while maintaining a robust error of measurement < .33 (Triantafillou et al., 2008). This
study doesn’t even take into account the possible advantages of this format of testing on
test-distribution and reach.
The Rasch partial credit model has also been used to develop a computer adaptive
test of the Centre of Epidemiological Studies – Depression (CES-D) scale (Smits,
Cuijpers, & van Straten, 2011). The findings of this study indicated a 33% decrease in the
number of items used with the computer adaptive version of the CES-D with a rigorous
maximum error of measurement of .40 (Smits et al., 2011).
In South Africa, Hobson (2015) found that the computer adaptive version of the
TEIQue Self-Control subscale correlated highly with the non-adaptive full form version
of the scale (.97) while using only about 10 of the 16 items estimate person trait levels.
As the TEIQue measures trait-emotional intelligence its item structure is relatively
identical to trait-based personality measures and thus indicates that computer adaptive
personality tests may be used effectively in the South African environment.
In summary, these studies indicate that a computer adaptive test of non-ability
constructs (or attitudinal measures) can be considered equivalent to non-computer
adaptive tests while using fewer items, which are more relevant for individual test-takers.
Psychometric properties of the computer adaptive versions of these tests also appear not
to be comprised with sufficient reliability and low measurement error reported.

27
With these studies in mind, researchers need to demonstrate that personality can
make use of a computer adaptive format while still being rigorously equivalent to their
non-computer adaptive counterparts. Such studies will generate the necessary impetus
required for the use of computer adaptive personality tests in praxis. Another motivation
for the development of computer adaptive tests of personality is that these tests are
incredibly efficient and rigorously accurate thus improving measurement in a general and
practical sense.
In order to understand why computer adaptive tests tend to be more efficient and
accurate than their non-computer adaptive counterparts the statistical theory used to
construct these tests was reviewed and investigated. In the following section a brief
overview is given of classical test theory, used for the construction of non-computer
adaptive tests, and item response theory, used for the construction of computer adaptive
tests, so that the advantages of item response theory for test construction, and computer
adaptive test applications, can be explained.
2.3. Classical test theory and item response theory
There has been much criticism about the use of classical test theory especially in
the wake of the development of item response theory (Zickar & Broadfoot, 2009). Where
computer adaptive tests make use of item response theory, most non-computer adaptive
tests make use of classical test theory (Embretson & Reise, 2000; Gershon, 2004;
Macdonald & Paunonen, 2002; Weiss, 2004; Zickar & Broadfoot, 2009).
Item response theory’s genesis can be traced to Fredrick Lord and Melvin
Novick’s Statistical Theories of Mental Test Scores (1968), and Georg Rasch’s seminal
work titled Probabilistic Models for Some Intelligence and Attainment Tests (1960).

28
These works engrained a new psychometric model for the development and
evaluation of tests (Embretson & Reise, 2000; Fisher, 2008b; Traub, 1997). Item response
theory and the family of Rasch Partial Credit models were the result of these seminal
contributions (Traub, 1997). These ‘new’ item response theory models challenged the
classical test theory canon and were referred to by Embretson and Hershberger (1999) as
the ‘new rules of measurement’.
These new rules of measurement hold numerous advantages for testing namely that
items can be matched appropriately to the ability/trait levels of test-takers; that fewer
items can be used while maintaining the inventory’s validity and reliability; that items
can be used independently from other items in the test; and that such items can be
independently implemented across groups of varying characteristics (Gershon, 2004).
Ultimately, these new rules of measurement also allow for adaptive testing, which the
rules of classical test theory cannot facilitate.
The reason why classical test theory cannot facilitate adaptive testing is because the
theory fundamentally differs from item response theory in both the evaluations and the
assumptions it holds. In particular, the way that classical test theory deals with
measurement error when compared to the item response theory is of special importance.
Traub (1997) explains that “Classical Test Theory is founded on the proposition that
measurement error, a random latent variable, is a component of the observed score
random variable” (p. 8). In other words, classical test theory is based on true-score theory
where the observed score of any number of persons, garnered on any number of items on
a scale, is equal to the true score with the addition of measurement error. Refer to the
equation below adapted from Osborne (2008, p. 3).

29
𝑋 = 𝑇 + 𝐸
Where:
X = the observed score for a scale;
T = the true score
E = the error associated with observation
Put another way, the true score is equal to the observed score minus the error associated
with measurement (see below).
𝑇 = 𝑋 − 𝐸
True score theory has numerous consequences for the measurement and estimation
of constructs as it is argued that measurement error has no shared variance with the true
score of any one measurement instance compared to another; and that the error of a
particular measurement instance is independent from the error of any other measurement
instance (Kline, 2005; Zickar & Broadfoot, 2009).
In other words, each test or scale has its own unique systematic error which is
different from the error of any other test/scale, even parallel forms of the same test or
scale (Fisher, 2008a). This error is calculated from the total test statistics and is considered
an average for all the items in a scale. This is unlike item response theory where the error
of measurement for each item is calculated and scrutinized individually (Kline, 2005).
We next discuss the disadvantages and the limiting effect on test flexibility that
mean error estimation creates for instruments based on classical test theory is discussed
next. In contrast we also discuss how item response theory can overcome some of the
limitations imposed by classical test theory assumptions.

30
2.3.1. The problem of mean error estimation in classical test theory
The way the error of measurement is estimated in classical test theory has
disadvantages for measurement because no test-scale measuring a particular construct can
be truly and objectively compared to any other test-scale measuring the same construct
with a different sample with alternate items, or alternate item-ordering (Gershon, 2004;
Traub, 1997). This is because each test-scale based on classical test theory has unique
systematic error, which makes true test-scale equivalence across different test-scales
impossible (de Ayala, 2009). Explained in another way, the error in one test-scale
influences test-scores to some degree, which include the overall mean measurement error,
and is not the same as the measurement error encountered in another test-scale even
though it may be measuring the same construct (Osborne, 2008). This error of
measurement also differs for the same test-scale applied to different samples of test-takers
as each sample has its own unique test-characteristics (Kline, 2005). Therefore, if only a
cluster of items of a full test-scale is used, instead of the whole test-scale, then the mean
standard error changes as it is approximated for the specific test-scale with its unique set
of items as a whole (Osborne, 2008). Consequently, certain items in the test-scale, which
may vary regarding their individual error of measurement depending on the sample tested,
may affect the mean standard error in an overall manner. In this way no two forms of a
test-scale based on classical test theory can really be considered equivalent because the
mean standard error is different and unique for each test-scale employed with a particular
sample (Fisher, 2008a; Kersten & Kayes, 2011).
Where a mean error is generated across many items in classical test theory, item
response theory calculates the error of measurement associated with each item of a test-
scale individually (Kersten & Kayes, 2011). This is advantageous as there is usually a

31
greater error of measurement at the extremes of a trait distribution than near its center
(Harvey & Hammer, 1999; Wauters et al., 2010).
Unfortunately, it is assumed in classical test theory that the test scores for test-takers
who fall on the extremes of the person distribution, with relevance to the latent construct
under investigation, have the same mean error of measurement as the results of test-takers
who fall in the central area of the distribution (Gershon, 2004). This is because the mean
error of measurement is an average that applies across all items of the test-scale in
classical test theory (Kline, 2005). This assumption is imprudent as each item in a test-
scale has a particular endorsability/difficulty that is more, or less, suited to test-takers
with different trait/ability levels. Matching items with a particular endorsability/difficulty
to the trait/ability level of test-takers reduces the error of measurement whereas the
opposite is true of items that poorly target trait/ability level (Sim & Rasiah, 2006).
Consequently, items with higher difficulty (or lower endorsability) are better suited
to test-takers at the top end of the ability/trait continuum, and easier items (or items with
a higher endorsability) are better suited to test-takers at the bottom end of the ability/trait
continuum (Sim & Rasiah, 2006). The better the match of the item difficulty/endorsability
to test-takers at a particular ability/trait level the lower the error of measurement because
the items are approximating the test-takers relative ability/trait level (Sim & Rasiah,
2006).
Put another way, the more closely the difficulty/ endorsability of the item is matched
to the relative ability/trait level of test-takers the more precisely and accurately the
ability/trait is estimated for a particular test-taker (Hambelton & Jones, 1993). Traub
(1997) refers to the historical work of Eisenhart (1986) when he states that “…persons of
considerable note maintained that one single observation, taken with due care, was as
much to be relied on as the mean of a great number.” (p.8).

32
Tests that are dependent on classical test theory introduce greater measurement
error by employing items that are not necessarily approximated to test-takers with
different ability/trait levels across the ability or trait continuum (Hambelton & Jones,
1993). To deal with such error more items are usually administered so that measurement
error and consequently scale reliabilities can be improved despite the increased burden
these extra items place on test-takers.
2.3.2. The impact of the number of test items administered
In classical test theory the more items are included in a test the more accurately and
reliably the test usually measures the latent construct under investigation (Harvey &
Hammer, 1999). This has resulted in instruments with hundreds of items in order to
improve the mean error of measurement and thus reliability (Pallant & Tennant, 2007).
Consequently, most instruments with good psychometric properties have many items to
boost reliability which increases the burden on test-takers and increases the time taken
for tests to be administered. As item response theory determines each item’s
difficulty/endorsability individually, only those items with that are the most relevant for
each test-taker is used (Hambleton & Jones, 1993). This greatly shortens the instrument
and results in a lower error of measurement and consequently acceptable reliability
without the need to have a large number of items administered (Georgiadou, Triantafillou,
& Economides, 2006). It is important to understand however, that items can only be
administered in a targeted manner (adaptive manner) if the items demonstrate local
independence and are invariant across diverse groups.
33
2.3.3. Local independence, person-free items estimation, and item-free person
estimation
The way that the standard error of measurement is dealt with in classical test theory
has further repercussions beyond individual item error and reliability. A major
disadvantage of classical test theory is that test-scales have total scores which are
dependent on the test-scale itself (de Klerk, 2008). With reference to section 2.3.1, if an
error is made on one or more items in a test-scale this error is applicable to all the test-
takers in the norm group (de Klerk, 2008). Because the error of measurement is assumed
to be constant across test-scale items such items are not investigated for their
multicollinearity; therefore, certain test-scale items may be dependent on other test-scale
items for their measurement properties especially regarding their measurement error (de
Klerk, 2008). Test-scale items may therefore be locally dependent as opposed to being
locally independent. Local independence of items is required for adaptive testing to take
place and is discussed in the following section.
2.3.3.1. Local independence
Local independence is a fundamental requirement for test-scales based on item
response theory such as computer adaptive tests (Bond & Fox, 2007; Weiss, 2004). To
determine whether local independence is attained items are tested for their association
with one another (Monseur, Baye, Lafontaine, & Quittre, 2011). Only those items that are
related to one another due to a common latent construct, and not some other construct,
can be considered locally independent (Gershon, 2004). Items that are also dependent on
other items beyond the association they share with the latent construct under investigation
are considered confounding (Monseur et al., 2011). Therefore, each item in a test-scale
should measure the latent construct the test-scale claims to measure, and do so

34
independently from other items in the test-scale (Engelhard, 2013). This is done by
inspecting the correlations of the residuals of items (Dodd et al., 1995) or determining the
dimensionality of the test-scale (Engelhard, 2013).
If the correlations between the residuals – the error component of the test items –
are high, the items are not locally independent but are also dependent on other items in
the test-scale that measure some joint error component (Dodd et al., 1995). This
effectively makes items dependent on other items in the test-scale and also detracts from
measurement of the latent construct under investigation (Engelhard, 2013).
The Rasch rating scale model reports dimensionality and test-dependence through
fit statistics and the intercorrelation of item residuals (Weiss, 2013). The Rasch model
therefore specifies that items in a test-scale need to measure only the construct under
consideration (Engelhard, 2013). Therefore, the test-scale items must measure a single
dimension which can be determined through a principal components analysis of residuals,
or hierarchically testing the single and multifactor models of hierarchical personality
scales as we have done (Engelhard, 2013). If local independence holds where the
correlations between residuals is small and the items of a scale measure only one
underlying construct – a single factor –, then each item can be used independently from
the other items in the test-scale to approximate the latent trait (Kersten & Kayes, 2011).
This allows test-scales based on item response theory to be item-independent and
unidimensional, which greatly maximises the flexibility of testing as singular items can
be used free of the constraints of other items in the test-scale (Kersten & Kayes, 2011).
Although local independence frees test-scale items from other test-scale items so
that items can be used independently and autonomously from the other items in a test-
scale (Monseur et al., 2011), these items are still sample dependent. The next section will
look more closely at how item response theory models can effectively free test-scale items

35
from the sample used to estimate their properties, and conversely how person trait
estimates can be freed from the sample of items employed.
2.3.3.2. Item-free person calibration and person-free item calibration
In classical test theory items are definitively dependent on the sample used to
estimate their difficulty/endorsability and the sample of items used to measure a particular
trait (de Klerk, 2008). Therefore, items based on classical test theory may be test-
dependent and sample dependent which means that the properties of the construct
measured (the true score) is dependent on the nature of the items used and the nature of
the sample used to estimate item properties (Gershon, 2004). As Schmidt and Embretson
(2003) explain, test-dependence is when the trait level of persons is biased by the
characteristics of the items and sample dependence is when the nature of the items is
biased by the sample used to estimate the items’ properties.
A major repercussion of test-dependence and sample-dependence is that the same
instrument with the same administration techniques must be implemented incrementally
and iteratively in the same manner to a group of test-takers that approximate the sample
on which the test items’ properties are based (Embretson & Hershberger, 1999; Schmidt
& Embretson, 2003). Using only certain items of an instrument and comparing results
from these items from varying test-takers to the full instrument or scale (which are based
on a particular norm group) is considered poor practice as the total psychometric
properties of each instrument or scale is different and cannot technically be compared
(Smith & Smith, 2004).
Macdonald and Paunonen (2002) give an example with ability testing where the
relative ability of test-takers is dependent on whether the items are easy or difficult, and
the relative difficulty of the items is dependent on the ability of the test-takers. The authors

36
compare this to tests based on item response theory where each item is calibrated for
relative difficulty with a particular sample and should maintain this difficulty with
persons of varying abilities. Similarly, person ability should remain the same no matter
the sample of items used. Additionally, the ability/trait level measured by the items should
remain invariant if not used in conjunction with other items in the test.
In the Rasch family of item response theory models item difficulties/endorsabilities
are estimated free from person ability and vice versa (Kersten & Kayes, 2011). Although
each item’s relative difficulty/endorsability is determined through calibration with a
particular group of test-takers, and person ability/trait level is calibrated through the
application of a certain item-bank, the Rasch model estimates these parameters (item
difficulty/endorsability and person ability/trait level) without being dependent on the
former or the latter (Bond & Fox, 2007). Item-free person calibration is represented
mathematically in the following formula adapted from Schmidt and Embretson (2003).
𝑙𝑛𝑃(𝑋𝑖1)
1 − 𝑃(𝑋𝑖1)= 𝜃1 − 𝛽𝑖
and
𝑙𝑛𝑃(𝑋𝑖2)
1 − 𝑃(𝑋𝑖2)= 𝜃2 − 𝛽𝑖
Where 𝜃1 and 𝜃2 are the ability/trait level scores for test-taker 1 and test-taker 2
respectively; 𝛽𝑖 is the difficulty/endorsability of the item; and the left hand side of the
equations represent the natural log-odds of the item responses for test-taker 1 (𝑋𝑖1) and
test-taker 2 (𝑋𝑖2) respectively. When taking the difference between the two equations 𝜃1
- 𝜃2 the item effectively drops from the equation resulting in item free person estimation.
Similarly, person-free item estimation can be explained by the following algebraic
formula (adapted from Schmidt & Embretson, 2003):
37
𝑙𝑛𝑃(𝑋1𝑠)
1 − 𝑃(𝑋1𝑠)= 𝜃𝑠 − 𝛽1
and
𝑙𝑛𝑃(𝑋2𝑠)
1 − 𝑃(𝑋2𝑠)= 𝜃𝑠 − 𝛽2
Where 𝜃𝑠 is person s, 𝛽1 is the difficulty/endorsability of item 1, 𝛽2 is the
difficulty/endorsability of item 2; and the left hand of the equation represents the natural
log-odds of the item responses for test-taker s on item 1 (𝑋1𝑠) and item 2 (𝑋2𝑠)
respectively. Taking the difference between the two equations for either person 𝛽1 - 𝛽2
effectively drops the person from the comparison.
In fact, item difficulties/endorsabilities are actually estimated free from the
distribution of persons on whom the items have been calibrated and vice versa, which is
a necessary requirement for measurement invariance (Bond & Fox, 2007).
Thus, the assumption is made that if an item is similar in its difficulty/endorsability
for a number of test-takers, it will most likely maintain this difficulty/endorsability level
with different group of test-takers; and alternatively a group of test-takers will have the
same relative difference in ability/ trait level no matter the difficulty/endorsability of the
test items provided (Kersten & Kayes, 2011). This effectively frees the test from its
dependency on a norm group and allows singular items to be used to discriminate between
different groups of persons with varying abilities.
Item response theory thus determines the item and person properties individually
and in the case of the Rasch family of measurement models does so by ordering the

38
relative difficulties/endorsabilities of items in conjunction with one parameter; the
ability/trait levels of persons (Bond, 2003).
It is this characteristic of Rasch models (person-free item estimation and item-free
person estimation) that allows alternate forms of the test to be generated and compared
and thus for items to be used independently from the whole test, or the persons used to
estimate the properties of the test items (Embretson & Hershberger, 1999). What is
important in item response theory is that the location of an item, and person, on the latent
trait (either more able, or less able, or more difficult, or less difficult) remains the same
(invariant) no matter the sample of persons or items used (Engelhard, 2013). What is also
evaluated in item response theory is whether the individual items function independently
from all the other items in the given instrument or scale (de Klerk, 2008).
2.3.4. Measurement invariance
Local independence, person-free item estimation, and item-free person estimation
allow for measurement invariance. Rasch (1961) defined measurement invariance as a
fundamental requirement of testing where the:
“…comparison between two stimuli should be independent of which particular
individuals were instrumental for the comparison; and it should also be independent of
which other stimuli within the considered class were or might also have been compared.
Symmetrically, a comparison between two individuals should be independent of which
particular stimuli within the class considered were instrumental for the comparison; and
it should also be independent of which other individuals were also compared, on the same
or some other occasion.” (p. 332).
In other words, measurement invariance allows for test-items (stimuli as Rasch
refers to them) to be used free from other test-items; their relative difficulty to be

39
independent of the particular sample of persons used to estimate the item
difficulty/endorsability and vice versa (Engelhard, 2013). This greatly improves the
flexibility of item and test administration and allows items to be used independently and
thus adaptively.
If measurement invariance is established, it frees tests from the constraints imposed
by classical test theory. With these constraints lifted (1) tests can be given to test-takers
without constant referral to a particular norm group. (2) Test items can be administered
independently from the whole test. (3) Items can be targeted to persons with specific
estimated ability/trait levels. (4) Fewer items can be used because irrelevant items for
specific test-takers are excluded. (5) Because items are targeted to test-takers a lower error
of measurement results thus reducing items administered without negatively affecting
reliability. Freedom from these constraints allows tests based on item response theory
models to be used adaptively and thus allows for exploitation of the advantages of
computer adaptive testing, which we expand upon in the next section.
2.4. The advantages of computer adaptive testing
The foremost advantage of using computer adaptive tests in psychometric testing
is their reliance on item response theory, which simultaneously improves the utility and
the rigour with which tests are developed and evaluated (Thompson & Weiss, 2011). In
the previous section some of these advantages have been discussed and the drawbacks of
classical test theory presented. The foremost advantage of item response theory is that it
overcomes many of the psychometric weaknesses, constraints on item administration and
shortcomings of classical test theory (Embretson & Hershberger, 1999; Embretson &
Reise, 2000; Linacre, 2000; Thompson & Weiss, 2011; Wang & Kolen, 2001). However,

40
item response theory also allows for computer adaptive testing, which in itself holds many
practical advantages for testing.
Chien et al. (2009), de Ayala (2009), Forbey and Ben-Porath (2007), Linacre
(2000), and Weiss (2004) discuss some of these practical advantages which include (1)
increased relevance for test-takers; (2) reduction of testing time; (3) reduction of the
burden of assessment; (4) immediate test feedback; (5) assessment in multiple settings;
(6) greater test security; (7) invariant measurement; (8) error estimates on the item-level;
and (9) the general advancement of testing. These practical advantages are elaborated
upon in the forthcoming sections.
2.4.1. Increased relevance for test-takers
Firstly, items of a particular ability (or trait level) are matched to the ability or trait
level of test-takers in computer adaptive testing (Linacre, 2000). Matching an item’s
difficulty or trait level to those of the test-taker allows only the most relevant items, for
particular test takers, to be used in the testing process (Hol et al., 2005). This motivates
and engages test-takers and avoids exposing them to items that are irrelevant to their
ability/trait level. In full-form non-adaptive tests items of varying difficulty/endorsability
are given to every test-taker even if these test-takers have varying ability/trait levels that
do not match such items. Linacre (2002a) describes the administration of items of varying
difficulty/endorsabilities to test-takers with different abilities/trait levels as akin to ‘flow’
which is a hyper-engaged state.
Linacre (2002a) explains that challenges and skills have to be in balance for test-
takers to experience flow in the testing process. For this to happen the relative skills of
test-takers (ability/trait levels) must be matched to the challenges (item
difficulty/endorsability) and engagement for the test-taker. In computer adaptive tests
41
each item’s relative difficulty/endorsability is iteratively matched to approximate the
ability/trait level of the test-taker, which increases the relevance and engagement of the
test for the test-taker (Eggen & Verschoor, 2006). This also reduces the likelihood of
random responding by disengaged test-takers who may feel that items are irrelevant to
them.
2.4.2. Reduction of testing time
Testing time is shortened dramatically in computer adaptive testing with numerous
authors indicating at least a 50% reduction in the number of items used (Eggen &
Verschoor, 2006; Forbey, Handel, & Ben-Porath, 2000; Frey & Seitz, 2009; Stark et al.,
2012). This is because only enough items are administered to measure the particular
ability or trait level in question within the parameters of an acceptable level of precision
(Weiss, 2004).
The number of items administered to a test-taker is dependent on the standard error
with which the test-taker’s ability/trait level is estimated (Weiss, 2004). In most cases a
standard error of .25 or less is considered acceptable but this depends on the context of
the test (Weiss, 2004; Thompson & Weiss, 2011).
Of course, more items are administered for test-takers who have extremes of the
ability/trait in question as fewer items exist that closely approximate the test-taker’s
ability/trait level at these upper and lower extremes and thus increase the standard error
with which the test-taker’s ability/trait level is estimated (Weiss, 2011). More items are
used with such extreme cases to more precisely estimate the ability/trait level of the test-
taker in question thus helping to offset larger measurement error indices (Stark et al.,
2012; Weiss, 2011).Luckily, most test-takers approximate the average levels of a normal
distribution regarding the latent construct under investigation and most items will

42
therefore be matched appropriately to most individual test-takers thus reducing the
number of items required to estimate ability/trait level with an acceptable amount of
measurement error.
Shortening the test substantially has major practical advantages for clinical testing
where test-takers are often distressed and barely capable of completing an inventory.
However, personality testing stands to benefit from an increase in efficiency especially in
industrial/organisational settings where test administration and prolonged testing time is
costly.
2.4.3. Reducing the burden of testing
The burden of testing is also reduced in computerised adaptive testing (Chien et
al., 2009). Most personality tests have hundreds of items which puts strain on the test-
taker (Chien et al., 2009). Shorter, more relevant instruments reduce the strain imposed
on test-takers and this is particularly relevant for test-takers who are exposed to multiple
tests for selection, placement, development, or clinical evaluation or those for whom the
test is not in a first language (Stark et al., 2012).
2.4.4. Immediate feedback after testing
Test-takers and test-administrators are given immediate feedback on results
directly after computer adaptive testing has taken place (Forbey & Ben-Porath, 2007).
With computer adaptive testing, the test-taker’s ability/ trait level is estimated
continuously during the computer adaptive testing process. In this regard test-feedback
can be given directly after test-administration which holds advantages for test-takers such
as reduced anxiety (DiBattista & Gosse, 2006), improved learning (Attali & Powers,
2008), and an improved test experience (Betz & Weiss, 1976). However, computer-based

43
tests based on classical test theory now also offer immediate feedback after testing and
thus means this advantage is not unique to computer adaptive tests.
2.4.5. Testing is not limited to one setting
Computer-based testing is not limited to a single test-administration period and can be
done over the internet (Linacre, 2000). Therefore, anyone with internet connectivity can
complete the test at any time and receive feedback (de Ayala, 2009). This greatly
increases the ‘reach’ and convenience of testing. Again however, this advantage is not
unique to computer adaptive testing, but is also exploited in some computer-based tests
based on classical test theory.
2.4.6. Greater test security
As the test is computer-based and the items used are tailored to the individual test-
taker the test is not as easily invalidated by numerous testing instances (Weiss, 2004).
This is because computer adaptive tests provide numerous so-called ‘parallel forms’ of
the test for each test-taker (Ortner, 2008). As each test taker answers test items in a
different manner, the items presented differ for each test-taker. The items presented are
based on the number of correct/incorrect or endorsed responses that impact what items
with a specific difficulty/endorsability are presented to the test-taker. It is therefore very
difficult for test-takers to anticipate test items as each test administration is unique. The
test-items are also not freely available to the test-taker as they are electronically stored in
an item-bank and not in paper/pencil format. These factors greatly increase the security
of the test and prevent the items of an instrument from falling into the hands of test-takers.
44
2.4.7. Invariant measurement
All the items in an item response theory pre-calibrated item bank are calibrated on
the same scale of measurement (Weiss, 2004). Therefore, these items can be used
independently from the entire item-bank to formulate multiple tests that are not test-
dependent (de Ayala, 2009). Also, these items are estimated free of the test-takers on
which the test has been calibrated (Bond & Fox, 2007). Therefore, the test is applicable
to more than just the test norm group and only requires further calibration with test-takers
in the future to remain psychometrically viable.
2.4.8. Error estimates for each item
A major advantage of item response theory is that each item’s location estimate –
on the latent trait – can be established with a certain standard error (Weiss, 2004).
Consequently, items can be identified that evidence the lowest possible standard error of
location estimates and these can be preferentially administered to test-takers within the
computer adaptive testing framework.
Administering items that have precise location estimates is advantageous as these
items also improve the precision with which person locations are estimated (Thompson
& Weiss, 2011).
2.4.9. Advancement of psychometric testing in general
As computer-based testing is growing quickly and a more advanced test-theory is
being applied to testing; developing instruments based on item response theory advances
the field of psychometric testing. There is also a strong need for psychological tests to
move into the digital realm. With the many advantages of computer-based testing (Chien
et al., 2009) and a desire for shorter more relevant instruments (Gershon, 2004; Haley et

45
al., 2006); computer adaptive testing has become a necessary addition to psychometric
testing.
With the practical and methodological advantages of computer adaptive testing, the
development of computer adaptive tests of personality may hold much promise. This is
especially true for personality testing, which has become prolific in job-selection, job-
placement, and career development in the last 23 years (Higgins, Peterson, Lee, & Pihl,
2007), and yet has not shared the same progress as other constructs in the computer
adaptive arena (Simms et al., 2011). However, before computer adaptive tests of
personality can be developed tests have to pass strict evaluative requirements. We discuss
some of these requirements in the next section.
2.5. The requirements for the development of computer adaptive tests
Weiss (2004) and Hol et al. (2008) list the evaluative requirements an inventory of
items must undergo when being prepared for computer adaptive testing. These
requirements include (a) establishing the dimensionality of a set of items for particular
scales (i.e., ensuring that each scale is unidimensional); (b) calibrating items for each
scale using an item response theory framework or model; (c) and finally simulation of
computer adaptive testing to establish equivalence with the full-form non-adaptive test.
If items of a scale are unidimensional, fit an item response theory model, and are
shown to be equivalent to the non-computer adaptive test when simulated in a computer
adaptive framework, the test-scale items can be considered ready for real-time computer
adaptive testing (Weiss, 2004). The more practical steps of writing computer adaptive
algorithms; initiating real-time testing with test-takers; and then evaluating the real-time
computer adaptive test can then be undertaken.

46
However, the evaluation of the test’s scales for undimensionality, item response
theory model fit, and equivalence through computer adaptive simulation remain the most
important elements in the evaluation and development of a computer adaptive test
because without these fundamental evaluations the test may not function with the
necessary accuracy, precision, efficiency or reliability in its computer adaptive format.
Also, as mentioned earlier most studies have focused on the feasibility of the development
of computer adaptive tests of personality without fundamentally comparing the validity
of computer adaptive versions the tests with their non-computer adaptive counterparts.
This study aims to address this shortcoming in the research.
The development of a computer adaptive test of personality therefore needs to be
justified through extensive analysis, evaluation and testing (de Ayala, 2009; Meijer &
Nering, 1999; Thompson & Weiss, 2011).
2.6. Preview of the contents of the following chapters
The present study has three overarching objectives. Firstly, the dimensionality of
the BTI scales was investigated because unidimensionality of test scales are important for
fit to item response theory models and consequently for computer adaptive applications
(refer to Chapter 3). Therefore, the scales of the BTI were fit to a single, multi, and
bifactor model to determine to what extent a general factor underlies the various facets of
the BTI.
The second objective was to fit the BTI scales to the Rasch rating scale model,
which is an item response theory model (refer to Chapter 4). The fit of the items of the
BTI scales was therefore evaluated and poor fitting items removed to prepare the BTI for
computer adaptive application. Aspects investigated include item and person fit to the
Rasch model, as well as item bias through differential item functioning analysis for ethnic
47
and gender groups. The best fitting items were selected for use and comparison within a
computer adaptive testing framework.
The last objective was to simulate the BTI as a computer adaptive test and compare
the functioning of the computer adaptive version of the BTI with its non-computer
adaptive counterpart (refer to Chapter 5). Aspects investigated include how closely the
computer adaptive BTI scales estimated person parameters to the non-adaptive full form
test, item efficiency, and the standard error of person parameter estimation. These
evaluations were conducted so that the feasibility of the computer adaptive version of the
BTI scales could be determined.
Chapter 6 integrates the findings of Chapter 3, Chapter 4; and Chapter 5 and
provides a more conceptual discussion around the computer adaptive testing of
personality. This chapter will also integrate limitations of the studies, implications for
practice, and recommendations for future research.

48
CHAPTER 3: THE DIMENSIONALITY OF THE BTI SCALES
“It is interesting to ask, to what degree do these domains emerge as multidimensional, and in
turn, does this multidimensionality interfere with our ability to fit an IRT model and scale
individuals on a common dimension?” – Steven P. Reise (2011, pp.83-84).
3.1. Introduction
A fundamental prescription of good psychological measurement is that a psychometric
scale should be unidimensional (i.e., the scale should measure only one attribute), because it
facilitates clear and unambiguous interpretation and allows for total score interpretation of
measurement scales. This is also a fundamental prescription for item response theory models
such as the Rasch rating scale model where the unidimensionality of measurement scales need
to be demonstrated or item and ability/trait parameterization may be biased (Yu, Popp,
DiGangi, & Jannasch-Pennell, 2007).
Since computer adaptive tests are heavily reliant on item and ability/trait parameters to
effectively select and administer items to test-takers; unreliable or biased parameters will
severely undermine the testing process (Thissen, Reeve, Bjorner, & Chang, 2007; Wise &
Kingsbury, 2000). As computer adaptive tests select items based on their relative
difficulty/endorsability and uses the responses to these items to estimate test-takers’ standing
on a single latent construct (Eggen & Verschoor, 2006) the items need to measure such a
construct as exclusively as possible for accurate and precise ability/trait level estimation
(Weiss, 2004).
Whereas fit to an item response theory model is necessary to identify items that do not
meet the assumptions of the model effectively; good fit of such a model is a necessary but not
sufficient condition for the evaluation of dimensionality (Wise & Kingsbury, 2000). Other
49
techniques based in classical test theory and common factor theory, such as exploratory and
confirmatory factor analysis, are often used in conjunction with item response theory models
to analyse and explore the underlying structure of inventories (ten Holt, van Duijn & Boomsma,
2010; Li, Jiao, & Lissitz, 2012; Reise, Widaman, & Pugh, 1993).
Although factor analytic techniques are useful for the investigation of the
dimensionality of personality scales, and complement item response theory, the
unidimensionality of personality scales are often disputed. The structure of hierarchical
personality scales will therefore be discussed in the next chapter.
3.1.1. Testing the dimensionality of hierarchical personality scales
Although unidimensionality is an important and necessary requirement for good
measurement when using classical test theory and one-dimensional item response theory
models; personality scales are not wholly unidimensional in nature (Clifton, 2014). For
instance, personality psychologists routinely use omnibus personality inventories that contain
hierarchical scales, such as the Hogan Personality Inventory (HPI; Hogan & Hogan, 2007) and
the NEO Personality Inventory Revised (NEO-PI-R; McCrae & Costa, 2010). These
inventories measure a small number of broad personality traits (five for the NEO-PI-R, and
seven for the HPI) at the total score level (Costa & McCrae, 1995; Hogan & Hogan, 2007), and
a larger number of narrower traits at the subscale level. Operationally, a broad trait such as
Extroversion is represented by a total score that is the sum of the nested subscale scores that
each measures a narrow aspect of Extraversion. This structure holds the promise of a two-tiered
interpretation, where a broad and general description is obtained at the total score level, and
more specific descriptions are obtained at the subscale score level (cf. Paunonen, 1998).
Therefore, conventional factor analysis of the items of a well-constructed hierarchical
personality scale (e.g. the Extroversion scale of the NEO-PI-R) is likely to yield multiple
50
correlated factors that correspond with the subscales (i.e., a multidimensional solution), which
raises questions about the unidimensionality of personality scales. This has consequences for
the unidimensional assumption of one-dimensional item response theory models, especially in
the wake of the development of multidimensional item response theory which has
circumvented the much held unidimensionality assumption of such models (Segall, 1996;
Wang, Chen, & Cheng, 2004).
Multidimensional item response theory models assume that numerous constructs or
continua underlie a particular scale or item. Since these models assume multidimensionality of
scales or items, the model uses a vector across multiple dimensions to estimate the trait level
for persons on a particular item or set of items (Reckase, 2009). In this way total scores for a
particular set of constructs can be calculated across a number of multidimensional criteria and
subscale scores can also be estimated based on the linking and scaling of multiple dimensions
(Reckase, 2009). Since ability/trait level estimation is based on multiple dimensions these
estimates can be used in multidimensional computer adaptive testing frameworks (Haley et al.,
2006). In contrast, one-dimensional item response theory models provide a single trait estimate
for a single construct, which are used in standard computer adaptive testing frameworks (Li et
al., 2012).
Therefore, multidimensional item response theory models may seem more applicable
to hierarchical personality inventories because these instruments have a possibly
multidimensional structure. Unfortunately, multidimensional item response theory models are
overly complex (violate parsimony); struggle to deal effectively with polytomous items, which
are predominantly used in personality inventories; have item parameters that are estimated with
varying degrees of stability (stability of these models have not been demonstrated); have fewer
tests for model fit; and have complicated total score interpretations (Thissen et al., 2007).

51
It may therefore be simpler and more prudent to initially investigate personality scales
using a one-dimensional item response theory model in conjunction with factor analysis (Li et
al., 2012). Although such models limit the tests in the sense that each scale of the test must be
investigated separately and administered with its own parameter estimates and algorithms, the
parsimony established by one-dimensional item response theory models cannot be denied
(Thissen et al., 2007). Such models are also limited by their strict unidimensionality
assumptions (assumed in one-dimensional item response theory models and imposed by the
researcher in confirmatory factor analytic models).
As the unidimensional structure of hierarchical personality scales are a matter of
contention, the goal of researchers investigating such scales should not be to establish
unidimensionality of scales in the purest sense, but rather to determine whether such scales are
‘unidimensional enough’ for unbiased parameter estimation and measurement within one-
dimensional item response theory frameworks (Reise et al., 2011; Reise, Moore, & Maydue-
Olivares, 2011). If scales are shown to evidence unidimensionality to some dominant degree,
it may allow for the application of one-dimensional item response theory models required for
computer adaptive testing.
To determine whether scales are ‘unidimensional enough’ researchers have to
determine whether a strong and reliable general factor dominates responses to the items that
constitute a total score for a particular personality scale (McDonald, 1999; Reise, Bonifay &
Haviland, 2013; Zinbarg, Revelle, Yovel, & Li, 2005). In essence, the second order factor
structure (general factor), which is represented by a total score on a scale, needs to be compared
to the first order factor structure (group factors) represented by the subscales used. To evaluate
the first and second order structure of the scales of hierarchical personality inventories
psychologists can apply hierarchical factor analytic techniques such as a bifactor analysis

52
(Holzinger & Swineford, 1939). This technique, and its application, is described in the
following section.
3.1.2. Evaluation of the dimensionality of hierarchical personality scales
The bifactor model specifies that a set of manifest variables (e.g., the items of a
personality scale such as Extraversion) is influenced by (a) a general factor that influences each
of the manifest variables, and (b) two or more group factors that each influences only a subset
of the manifest variables (Reise et al., 2013). Typically, the factors of a bifactor model are
specified as orthogonal because the general factor absorbs all the variance that is common to
all the manifest variables (Reise et al., 2010; Reise, Morizot, & Hays, 2007). Operationally,
the general factor corresponds with the total score across all the items and the group factors
correspond with the subscale scores. The group factors can be thought of as residualised
factors. In this sense the group factors, which are represented by subscales, may indicate
whether the subscales reliably measure anything other than the general factor (Reise et al.,
2013).
Consider a hypothetical nine-item scale with a hierarchical structure, where summation
across the nine items yields a total score, and items 1 to 3 constitute Subscale A, items 4 to 6
constitute Subscale B, and items 7 to 9 constitute Subscale C. Three competing factor analytic
models may be specified for the scale, namely a one-factor model (Model 1), a correlated three-
factor model (Model 2), and a bifactor model with a general factor and three group factors
(Model 3). The one-factor model specifies that the nine items measure a single trait, which
implies that the total score should be interpreted (see Figure 1a). The three-factor model
specifies that the nine items measures three separate (but correlated) traits, which imply that
three separate scores should be interpreted. In both these models each item is influenced by
one factor only. The bifactor model, however, specifies that each item is influenced by two

53
factors, namely a general factor that is common to all the items, and a group factor that is
common only to a subset of the items. Because the factors of the bifactor model are specified
as uncorrelated, Model 3 allows for a comparison of the degree to which the variance of an
item is explained by the general factor as opposed to the group factors (Reise et al., 2013).
A bifactor analysis that yields a very strong general factor and trivial group factors
evidences unidimensionality at the scale level. In turn, a weak general factor and strong group
factors indicates multidimensionality at the scale level. Finally, a strong general factor and non-
trivial group factors indicates that interpretation at the scale level is warranted with the joint
possibility of interpretation at the subscale level, in the sense that the general factor captures
reliable trait variance that is common to all the items and the subscales capture reliable trait
variance that is not attributed to the general factor (Reise et al., 2013). Such a model would be
more realistic for hierarchical personality inventories and would be capable of fitting one-
dimensional item response theory models required for computer adaptive testing.
The choice between these three factor models is based on their relative fit with
empirical data (Bollen, 1989). In accord with general scientific principles of parsimonious
description, Model 1 is the most desirable, followed by Model 2, and then by Model 3. In
practice, however, it may turn out that the simpler models do not give a satisfactory account of
the data. Good fit for Model 1 will be achieved if the scale measures one factor exclusively.
Model 2 will fit better than Model 1 if the scale measures three separate factors. In turn, Model
3 will fit better than Model 2 if the scale measures a general factor and three separate group
factors simultaneously.
Since the objective of the study is to prepare the BTI, a hierarchical five factor model
of personality, for computer adaptive testing; the application of a bifactor model to the BTI
scales is warranted. This is primarily because the dimensionality of scales must be confirmed
before application to a one-dimensional item response theory model can take place. An

54
understanding of the theoretical structure and psychometric properties of the BTI is therefore
necessary. Consequently, the following section will briefly describe the BTI regarding its
hierarchical structure and psychometric properties.
3.1.3. The Basic Traits Inventory (BTI)
The BTI is a hierarchical personality inventory that measures the Big Five personality
traits namely Extraversion, Neuroticism, Conscientiousness, Openness to Experience, and
Agreeableness (Taylor & de Bruin, 2006). Each scale consists of four or five subscales, which
in turn consist of between six and ten items.
The structure of the BTI scales and subscales is as follows: Extraversion (36 items) –
Ascendance (7 items), Liveliness (8 items), Positive Affect (6 items), Gregariousness (7 items),
Excitement Seeking (8 items) ; Neuroticism (34 items) – Affective Instability (8 items),
Depression (9 items), Self-consciousness (9 items), Anxiety (8 items); Conscientiousness (41
items) – Effort (8 items), Order (10 items), Duty (9 items), Prudence (6 items), Self-discipline
(8 items); Openness (32 items)– Aesthetic (7 items), Ideas (6 items), Actions (7 items), Values
(6 items), Imaginative (6 items); and Agreeableness (37 items) – Straightforwardness (7 items),
Compliance (8 items), Prosocial Tendencies (8 items), Modesty (7 items), Tendermindedness
(7 items) (Taylor & de Bruin, 2013). The subscales were selected on the basis of Big Five
theory and a comprehensive review of published empirical literature. In particular, previous
factor analytic studies were scrutinised to identify the subscales that best represent each of the
five broad traits. In addition, subscales that saliently loaded only their targeted factors and
demonstrated small loadings on non-targeted factors were selected (Taylor, 2004). The BTI
provides scores on the total score level (referred to as factors) and on the subscale score level
(referred to as facets), and therefore—like the NEO-PI-R and the HPI—it allows for a two-
tiered interpretation of scale scores (Taylor & de Bruin, 2013). To date, factor analyses of the

55
BTI subscales have yielded strong support for the hypothesised five-factor solution (de Bruin,
2014; Metzer, de Bruin, & Adams, 2014; Ramsay, Taylor, de Bruin, & Meiring, 2008; Taylor
& de Bruin, 2006; 2013). However, the hierarchical structure of the five scales of the BTI and
the relative strength of the general factor (corresponding with the total score) and the group
factors (corresponding with the subscale scores) have not been investigated.
The aims of the present study are twofold. Firstly, the study examines the hierarchical
structure of each of the five BTI scales by fitting three factor analytic models, namely: a one
factor model (Model 1), a correlated multifactor model (Model 2), and an orthogonal bifactor
model (Model 3). Secondly, the study demonstrates how the bifactor analytic technique could
be employed for the evaluation of the dimensionality of a hierarchical personality instrument
especially with regard to the subfactors (represented by subscales) possibly introducing
multidimensionality at the scale level. It was hypothesised that the bifactor model would
provide the best fit due to the two-tiered structure of the BTI scales. More generally, the
methods used Examiner 2abasemay guide the evaluation of other hierarchical personality
instruments that are interpreted at both a total score (for scales) and at a subscale level. Most
importantly, this evaluation of the dimensionality of the BTI scales allows the suitability of the
scales for computer adaptive testing applications to be evaluated.
3.2. Method
3.2.1. Participants
Participants were 1,962 South African adults who completed the BTI for selection,
development, counselling and placement purposes. Participants represent working men (62%)
and women (38%) with a mean age of 33 years (SD = 9.08, Md = 33 years) from all provinces
in South Africa. The majority of the participants were Black (54%) and White (36%) with the
remainder being of Mixed Race (6%) and Asian (4%) ethnicities. While not a random sample
56
– convenience sampling using an existing database – participants reflect the white collar
working population demographic in South Africa (Statistics South Africa, 2012). All
participants completed the BTI in English.
3.2.2. Instrument
The BTI makes use of a five-point Likert-type scale with response options that
range from (1) ‘Strongly Disagree’ to (5) ‘Strongly Agree’ (Taylor & de Bruin, 2006,
2013). The BTI has satisfactory reliability on the scale level with each of the five scales
demonstrating Cronbach alpha coefficients of above .87 across different South African
ethnicities (Taylor & de Bruin, 2013). The Cronbach alpha coefficients of the subscales
range from .44 for Openness to Values to .85 for Affective Instability with most of the
subscales reflecting reliability coefficients of above .75 (Taylor & de Bruin, 2013). Factor
analyses of the subscales have yielded strong evidence in support of the construct validity
of the Big Five traits. Further factor analyses indicated good congruence between the
factor structures for Black and White groups in South Africa with Tucker’s phi
coefficients > .93 for the five scales (Taylor & de Bruin, 2013).
3.2.3. Data Analysis
Analyses were conducted using the lavaan package (Rosseel, 2012) in R (R Core
Team, 2013). The data were subjected to three confirmatory factor analytic (CFA)
models as discussed in the introduction. The three CFA models were the single-factor
(Model 1), multifactor (Model 2), and bifactor models (Model 3) respectively.
Each of the CFA models were separately fitted to the five BTI scales. The items
were treated as ordered categorical variables and all parameters were estimated with the
57
mean and variance adjusted weighted least squares (WLSMV) estimator (cf. Flora &
Curran, 2004).
Model fit was evaluated with reference to the WLSMV chi-square (WLSMVχ²),
comparative fit index (CFI; Bentler, 1990), Tucker-Lewis index (TLI; Tucker & Lewis,
1973), and the root mean square error of approximation (RMSEA; Steiger & Lind, 1980).
CFI and TLI values > .95 and RMSEA values < .08 are recommended as cutoffs for
acceptable fit (Browne & Cudeck, 1993; Hu & Bentler, 1999). However, given Kenny
and McCoach’s (2003) observation that the CFI performs poorly in models where there
are many variables per factor, the less stringent cutoff of CFI and TLI > .90 was adopted.
Because the one factor model is nested in the correlated multifactor model and, in
turn, the correlated multifactor is nested in the bifactor model [for a more complete
discussion of nested models in a bifactor context see Chen, West and Sousa (2006) and
Reise et al. (2013)], adjusted chi-square difference tests were employed to test whether
the differences in fit between the models were statistically significant (Bollen, 1989).
McDonald’s (1999) coefficient omega (omegaT) is a reliability coefficient that
was used to determine for each BTI scale the proportion of observed variance jointly
explained by the general and group factors. Coefficient omega hierarchical (omegaH) was
used to determine the proportion of observed variance accounted for by the general factor
alone (Zinbarg et al., 2005). Finally, coefficient omega specific (omegaS) was used to
determine for each subscale the proportion of observed variance explained by the group
factors beyond the general factor (Reise et al., 2013). The proportion of the reliable
variance accounted for by the general factor (PRVG) and the proportion of the reliable
variance accounted for by the group factors (PRVS) was also calculated (cf. Reise et al.,
2013). Generally, PRVG and PRVS are expected to be higher than the corresponding
omegaH and omegaS values, because PRVG and PRVS use only the reliable variance of

58
a scale, whereas omegaH and omegaS use the total variance, which also included error
variance.
3.2.4. Ethical Considerations
Ethical clearance for this study was obtained from the Faculty Ethics Committee
in the Faculty of Management at the University of Johannesburg. Permission to use the
data for research was granted from JvR Psychometrics, which owns the BTI database.
Only BTI data for which test-takers provided consent for research was used.
Confidentiality and anonymity of the data were maintained by not including any
identifying information the BTI data-set.
3.3. Results
Fit statistics of the three models across the five BTI scales are summarised in Table
3.1. The WLSMVχ² indicated that the hypothesis of perfect fit had to be rejected for each
of the five traits across all three models (p < .01). For each of the five scales, the CFI, TLI
and RMSEA indicated better fit for Model 2 than for Model 1, and in turn, better fit for
Model 3 than for Model 2. For each of the five scales, adjusted chi-square difference tests
(refer to Table 3.2) demonstrated that Model 3 fit statistically significantly better than the
competing models (p <.001). Hence, the hypothesis that the bifactor model would provide
the best fit was supported. The remainder of the results focuses on the interpretation of
Model 3.
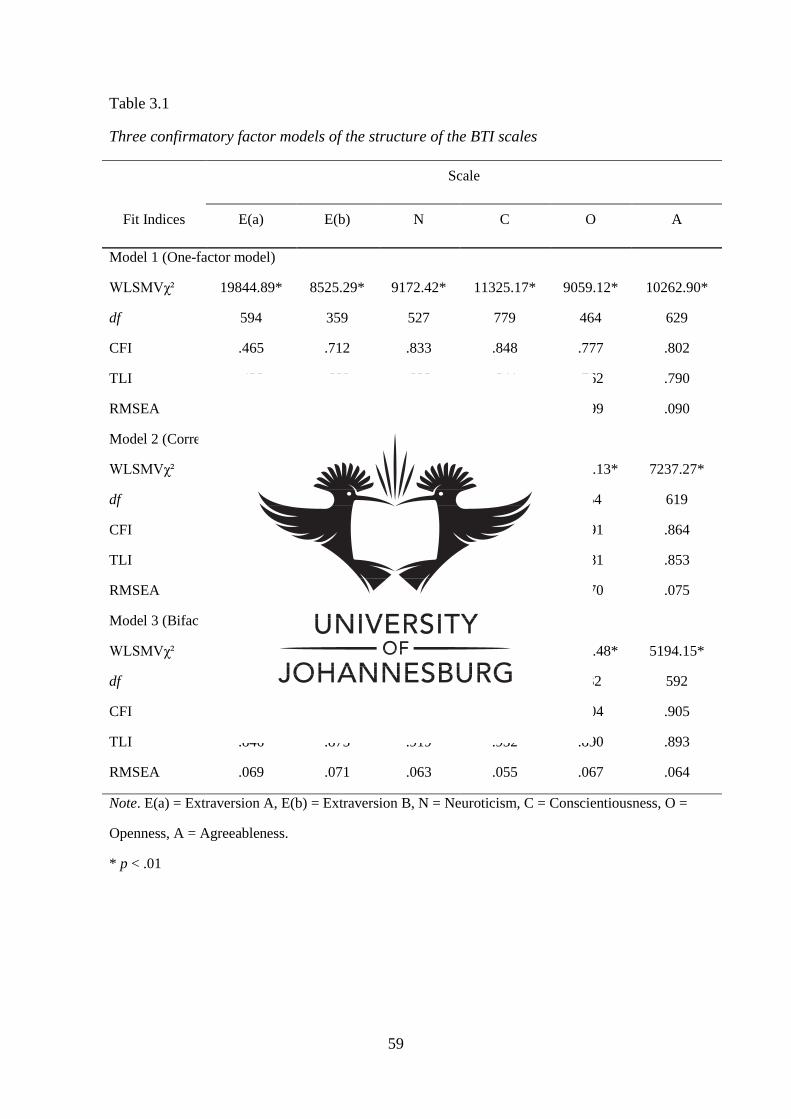
59
Table 3.1
Three confirmatory factor models of the structure of the BTI scales
Scale
Fit Indices E(a) E(b) N C O A
Model 1 (One-factor model)
WLSMVχ² 19844.89* 8525.29* 9172.42* 11325.17* 9059.12* 10262.90*
df 594 359 527 779 464 629
CFI .465 .712 .833 .848 .777 .802
TLI .433 .689 .822 .841 .762 .790
RMSEA .132 .112 .093 .085 .099 .090
Model 2 (Correlated multi-factor model)
WLSMVχ² 7258.89* 4384.69* 5875.50* 5976.71* 4649.13* 7237.27*
df 584 344 521 769 454 619
CFI .815 .858 .897 .925 .891 .864
TLI .800 .843 .889 .920 .881 .853
RMSEA .079 .079 .074 .060 .070 .075
Model 3 (Bifactor model)
WLSMVχ² 5466.95* 3343.01* 4168.27* 4999.26* 4130.48* 5194.15*
df 558 322 493 738 432 592
CFI .864 .893 .929 .939 .904 .905
TLI .846 .875 .919 .932 .890 .893
RMSEA .069 .071 .063 .055 .067 .064
Note. E(a) = Extraversion A, E(b) = Extraversion B, N = Neuroticism, C = Conscientiousness, O =
Openness, A = Agreeableness.
* p < .01
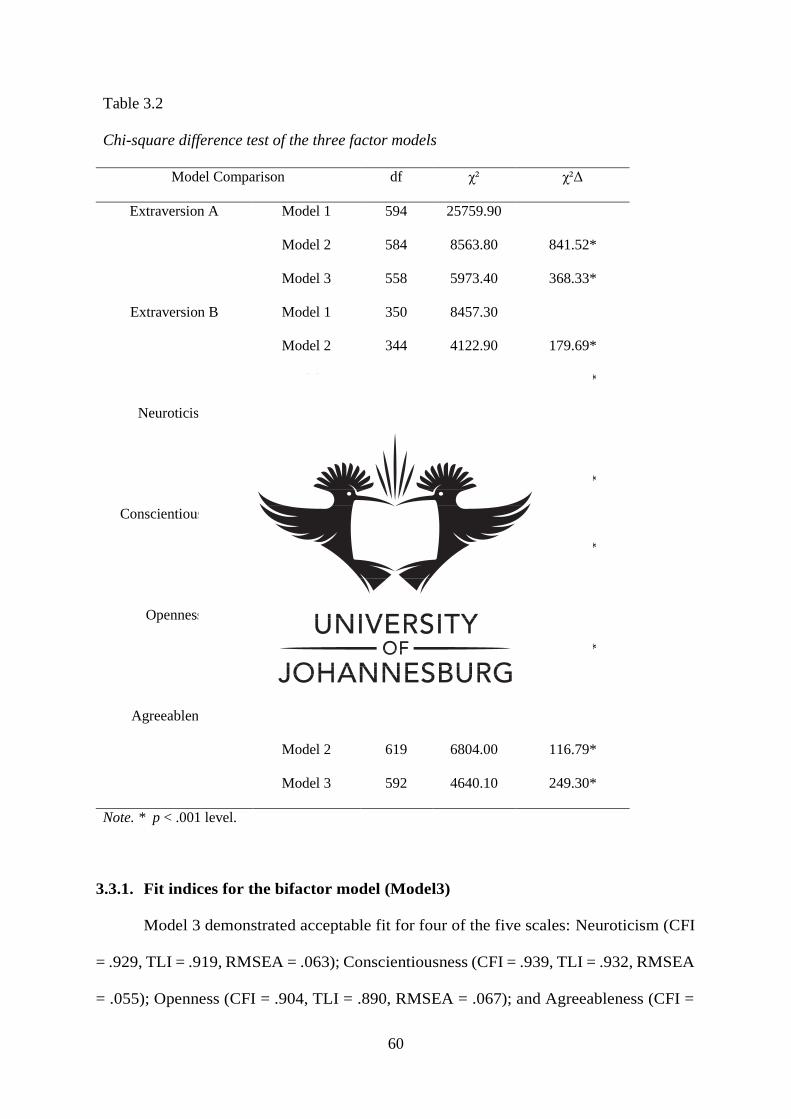
60
Table 3.2
Chi-square difference test of the three factor models
Model Comparison df χ² χ²Δ
Extraversion A Model 1 594 25759.90
Model 2 584 8563.80 841.52*
Model 3 558 5973.40 368.33*
Extraversion B Model 1 350 8457.30
Model 2 344 4122.90 179.69*
Model 3 322 2941.90 209.68*
Neuroticism Model 1 527 7786.60
Model 2 521 4730.50 66.51*
Model 3 493 3130.70 193.18*
Conscientiousness Model 1 779 9467.50
Model 2 769 4515.50 115.91*
Model 3 738 3595.50 79.19*
Openness Model 1 464 8552.60
Model 2 454 4087.90 215.70*
Model 3 432 3521.50 70.94*
Agreeableness Model 1 629 9970.30
Model 2 619 6804.00 116.79*
Model 3 592 4640.10 249.30*
Note. * p < .001 level.
3.3.1. Fit indices for the bifactor model (Model3)
Model 3 demonstrated acceptable fit for four of the five scales: Neuroticism (CFI
= .929, TLI = .919, RMSEA = .063); Conscientiousness (CFI = .939, TLI = .932, RMSEA
= .055); Openness (CFI = .904, TLI = .890, RMSEA = .067); and Agreeableness (CFI =

61
.905, TLI = .893, RMSEA = .064). However, in comparison less satisfactory fit was
obtained for Extraversion (CFI = .864, TLI = .846, and RMSEA = .069).
Closer inspection revealed that the Excitement Seeking subscale contributed
disproportionately to the weaker fit of the Extraversion bifactor model. Removal of the
Excitement Seeking subscale produced an improved CFI (.893) and TLI (.875), and a
somewhat weaker, but still acceptable, RMSEA (.071). Against this background, the
present results for two Extraversion bifactor models are presented in the remainder of the
chapter: Extraversion A contains all five subscales, whereas Extraversion B excludes the
potentially problematic Excitement Seeking facet.
3.3.2. Reliability of the BTI scales
McDonald’s omegaT for the BTI scales was as follows (Cronbach’s alpha is given
in parenthesis): Extraversion A, .92 (.89); Extraversion B, .92 (.90); Neuroticism, .96
(.95); Conscientiousness, .97 (.96); Openness .93 (.91); and Agreeableness, .94 (.93). In
turn, omegaH, which reflects the proportion of total variance explained by the general
factor, was as follows: Extraversion A, .76; Extraversion B, .82; Neuroticism, .92;
Conscientiousness, .92; Openness, .85; and Agreeableness, .87.
The ratio of omegaH to omegaT indicated that the proportion of reliable variance
that consists of general factor variance (PRVG) was as follows: Extraversion A, .82;
Extraversion B, .89; Neuroticism, .96; Conscientiousness, .95; Openness .91; and
Agreeableness, .93. The PRVG and omegaH coefficients indicate that the bulk of the total
variance and the reliable variance of each scale were accounted for by a dominant general
factor. Next, the reliability of the subscales is presented.
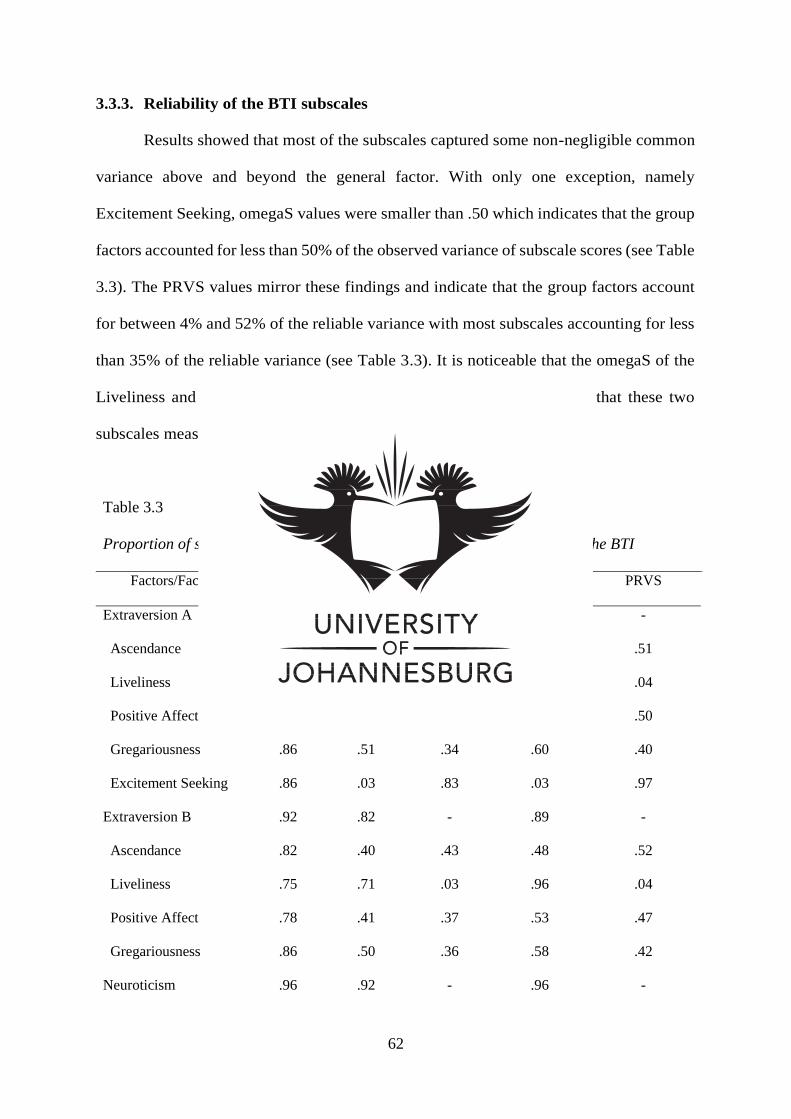
62
3.3.3. Reliability of the BTI subscales
Results showed that most of the subscales captured some non-negligible common
variance above and beyond the general factor. With only one exception, namely
Excitement Seeking, omegaS values were smaller than .50 which indicates that the group
factors accounted for less than 50% of the observed variance of subscale scores (see Table
3.3). The PRVS values mirror these findings and indicate that the group factors account
for between 4% and 52% of the reliable variance with most subscales accounting for less
than 35% of the reliable variance (see Table 3.3). It is noticeable that the omegaS of the
Liveliness and Depression subscales were low (< .10), which suggests that these two
subscales measure mostly a general factor and very little beyond that.
Table 3.3
Proportion of specific and total variance explained by factors and facets of the BTI
Factors/Facets OmegaT OmegaH OmegaS PRVG PRVS
Extraversion A .92 .76 - .82 -
Ascendance .82 .40 .42 .49 .51
Liveliness .75 .72 .03 .96 .04
Positive Affect .78 .40 .39 .50 .50
Gregariousness .86 .51 .34 .60 .40
Excitement Seeking .86 .03 .83 .03 .97
Extraversion B .92 .82 - .89 -
Ascendance .82 .40 .43 .48 .52
Liveliness .75 .71 .03 .96 .04
Positive Affect .78 .41 .37 .53 .47
Gregariousness .86 .50 .36 .58 .42
Neuroticism .96 .92 - .96 -
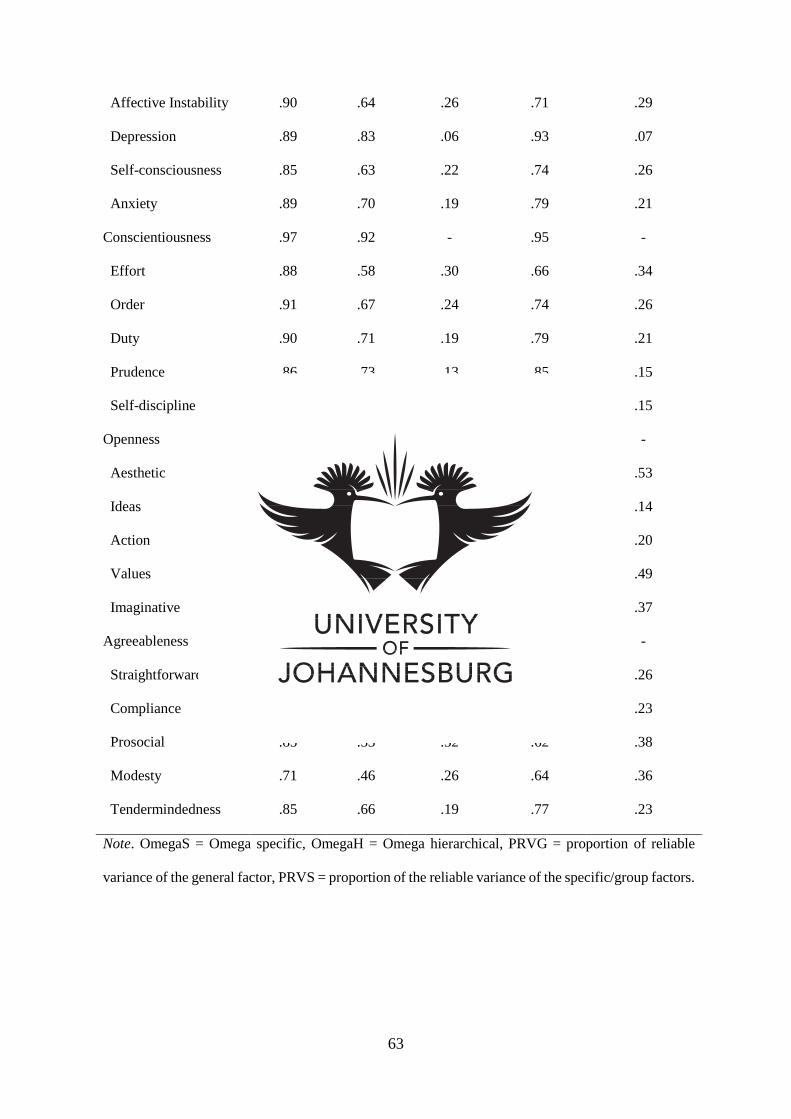
63
Affective Instability .90 .64 .26 .71 .29
Depression .89 .83 .06 .93 .07
Self-consciousness .85 .63 .22 .74 .26
Anxiety .89 .70 .19 .79 .21
Conscientiousness .97 .92 - .95 -
Effort .88 .58 .30 .66 .34
Order .91 .67 .24 .74 .26
Duty .90 .71 .19 .79 .21
Prudence .86 .73 .13 .85 .15
Self-discipline .89 .76 .13 .85 .15
Openness .93 85 - .91 -
Aesthetic .86 .41 .45 .47 .53
Ideas .78 .67 .11 .86 .14
Action .79 .63 .16 .80 .20
Values .62 .31 .31 .51 .49
Imaginative .87 .55 .32 .63 .37
Agreeableness .94 .87 - .93 -
Straightforward .80 .59 .21 .74 .26
Compliance .80 .62 .19 .77 .23
Prosocial .85 .53 .32 .62 .38
Modesty .71 .46 .26 .64 .36
Tendermindedness .85 .66 .19 .77 .23
Note. OmegaS = Omega specific, OmegaH = Omega hierarchical, PRVG = proportion of reliable
variance of the general factor, PRVS = proportion of the reliable variance of the specific/group factors.

64
3.3.4. The bifactor pattern matrix
The bifactor pattern matrix of one scale, namely Neuroticism, is presented to
demonstrate how the general and group factors account for the variance of the items (see
Table 3.4). The pattern matrix reveals how some clusters of items tend to have strong
loadings on the general factor, but weak loadings on a group factor (see for instance items
N9 to N17 that constitutes the Depression subscale) and where certain groups of items
tend to show relatively strong loadings on both the general and group factor (see for
instance items N1 to N8 that constitutes the Affective Instability subscale). The PRVS
(.07) and omegaS (.06) values of the Depression subscale indicate that the group factor
contributes little information beyond the general factor (see Table 3.3). By contrast, the
PRVS (.29) and omegaS (.26) values of the Affective Instability subscale indicate that
the group factor explains a fair proportion of variance beyond the general factor.
Table 3.4
Standardised factor loadings for Neuroticism (Model 3)
Items General Factor Aff.Inst. Depression Self-consc. Anxiety
N1 .54 .61
N2 .54 .64
N3 .64 .33
N4 .61 .55
N5 .66 .37
N6 .67 .19
N7 .65 .18
N8 .58 .08
N9 .58 -.06

65
N10 .66 .03
N11 .76 .04
N12 .68 .18
N13 .81 .13
N14 .47 .06
N15 .66 .24
N16 .57 .24
N17 .62 .54
N18 .25 .28
N19 .58 .13
N20 .49 .36
N21 .67 .21
N22 .55 .53
N23 .25 .53
N24 .76 .26
N25 .59 .27
N26 .50 .10
N27 .53 .54
N28 .56 .09
N29 .65 .15
N30 .60 .22
N31 .65 .29
N32 .72 .31
N33 .61 .74
N34 .66 .14
Note. Aff.Inst. = Affective Instability, Self-consc. = Self-consciousness

66
3.4. Discussion
First the model fit of the bifactor analyses for the BTI is discussed. Then the
dimensionality of the BTI scales is discussed. Lastly we review some of the implications
for fit to one-dimensional item response theory models for the preparation of computer
adaptive tests.
3.4.1. The fit of the bifactor model
This study set out to demonstrate how the hierarchical factor structure of a
personality inventory, namely the BTI, can be evaluated in order to justify whether fit to
unidimensional item response theory models are warranted and thus whether sufficient
undimensionality of hierarchical personality scales are evidenced for computer adaptive
testing. In summary, the results showed that for each of the five BTI scales a bifactor
model fit better than either a one-factor or correlated multiple factor model. The bifactor
results showed that each of the five BTI scales measured a strong general factor and four
or five discernible group factors that correspond with the BTI subscales.
Although the results indicate that each scale is multidimensional, in the sense that
multiple factors are measured (i.e., a general factor and four or five group factors) the
application of such scales to one-dimensional item response theory models appears
justified because each scale measures a dominant trait (as represented by the general
factor) as well. In this regard, results also indicate that each subscale measures a group
factor beyond the general factor. This is indicative of hierarchical personality
measurement where total scores are interpreted for broad traits and subscale scores are
interpreted for nested narrow traits.

67
3.4.2. The dimensionality of the BTI scales
It was demonstrated that the strength of the group factors varies from subscale to
subscale. In this regard, it is recommended that subscale scores that measure weak group
factors (a tentative suggested value of PRVS < .20) evidence the strongest
unidimensionality. On the other hand, it is recommended that PRVS values > .60
(recommended by the author as a suggestion) should be closely scrutinized as subscales
indicating this proportion of specific reliable variance may indicate measurement of
something beyond the general factor. For instance, the Depression and Liveliness
subscales measured little beyond the general factor of Neuroticism indicating strong
evidence of unidimensional measurement for these subscales. However, one subscale,
Excitement Seeking, indicated measurement of something beyond the general factor of
Extraversion (PRVS = .97). However, to determine whether Excitement Seeking should
be excluded before the commencement of computer adaptive testing it is recommended
that the fit of the items first be evaluated with Excitement Seeking included in the item
response theory parameterization process. Similarly, it should be determined whether the
computer adaptive version of the Extraversion scale, with Excitement Seeking included,
estimates test-takers’ standing on the latent trait equivalently to the non-adaptive full form
test-scale. Although the Extraversion B model (with Excitement Seeking removed)
demonstrated better fit to the bifactor model, with improved PRVG and PRVS values,
enough general factor dominance may be available once some poor fitting items are
removed in the item response theory parameterisation process. For this reason,
Excitement Seeking as a subscale for the Extraversion scale was retained in Chapter 4
and 5 respectively.
In general, the subscales indicated a maximal PRVS of .53 with an average PRVS
= .29 (when Excitement Seeking is removed). However, most of the PRVG values were

68
above .80 for the general factors of each scale indicating good general factor dominance.
As a whole these results indicate good evidence for general factor dominance at the scale
level.
3.4.3. Implications for fit to one-dimensional item response theory models
In accord with Reise et al. (2013) and Zinbarg et al. (2005) it is recommended that
personality psychologists evaluate hierarchical personality scales through the separation of the
general factor from the group factors using bifactor analysis. This highlights to what degree
the general factor and group factors account for the variance of the scores on a hierarchical
personality scale. Such an evaluation may give insight into dominance of the general factor for
each hierarchical scale and thus the applicability of such scales for fit to one-dimensional item
response theory models and preparation for computer adaptive testing.
Further, it is recommended that the assumption of unidimensionality of scales
is not violated for scales with a PRVG > .80 and a PRVS < .60.
Whereas only one subscale evidenced possibly interfering reliable specific variance
(Excitement Seeking) for the Extraversion scale, other scales demonstrated evidence of
general factor dominance.
In conclusion, psychologists must account for multidimensionality of scales in
hierarchical personality measurement. If scales are to be interpreted in a two-tiered
manner, then strictly speaking, unidimensionality is a fiction. This is because two-tiered
interpretation requires conceptual and psychometric differentiation of group factors from
the general factors at the subscale level. This differentiation is necessary for subscale
scores to be meaningful. Therefore, hierarchical personality inventories should be
investigated for their dimensionality by scrutinizing the general factor dominance of
scales while evaluating the specific reliable variance accounted for by subscales.

69
What has to be determined is whether the specific variance measured by the
subscales interferes with unidimensional measurement at the scale level. Therefore, the
question is not whether a scale is unidimensional; the question is whether the scale is
‘unidimensional enough’? This question can only be answered if personality
psychologists investigate how group factors (which are represented by subscales)
compete for variance with the general factors (represented by total scores) using a bifactor
approach.
3.5. Overview of Chapter 3 and a preview of Chapter 4
In this chapter it is demonstrated how the BTI, and possibly other hierarchical
personality inventories, can be investigated for dimensionality using a bifactor analysis.
More importantly, it is demonstrated how unidimensionality/ multidimensionality of
scales are a matter of degree. This chapter also evaluated the dimensionality of the BTI
because unidimensionality, a property required for application to one-dimensional item
response theory frameworks, is required for computer adaptive testing.
This evaluation is further built upon in the next chapter (Chapter 4) where the
BTI scales are fit to the Rasch rating scale model, which is a one-dimensional item
response theory model. For computer adaptive testing to commence, unbiased item
parameters need to be generated. Therefore, the next chapter will evaluate the BTI within
a one-dimensional item response theory model. Possibly problematic items are identified
and the scales of the BTI are optimised for computer adaptive testing.

70
CHAPTER 4: FITTING THE BTI SCALES TO THE RASCH MODEL
“A measuring instrument must not be seriously affected in its measuring function by the object
of measurement. To the extent that its measurement function is so affected, the validity of the
instrument is impaired or limited. If a yardstick measured differently because of the fact that it
was a rug, a picture, or a piece of paper that was measured, then to that extent the
trustworthiness of that yardstick as a measuring device would be impaired.” – L.L. Thurstone
(1928, p.547).
4.1. Introduction
The aim of this study was to examine the psychometric properties of the Basic Traits
Inventory (BTI) using the Rasch rating scale model so that a core set of items could be
identified for use within a computer adaptive testing framework. The BTI is a five-factor
hierarchical personality inventory designed and constructed for the South African context (de
Bruin & Rudnick, 2007; Grobler, 2014; Morgan & de Bruin, 2010; Ramsay et al., 2010; Taylor,
2004, 2008; Taylor & de Bruin, 2006, 2013; Vogt & Laher, 2009). Although the psychometric
properties of the BTI have been investigated using the Rasch model, which is a one dimensional
item response theory model (cf. Grobler, 2014; Taylor, 2008, Taylor & de Bruin, 2013), this
model has not been used to prepare the BTI for computer adaptive testing applications.
Item response theory models, and especially the one-dimensional Rasch model, are
pivotal for the development of computer adaptive tests (Ma, Chien, Wang, Li, & Yui, 2014).
This is because items that are used in computer adaptive testing must be ranked along a single
dimension or construct (Linacre, 2000); function independently from one another in an
invariant manner (Ma et al., 2014); and demonstrate a spread of difficulty/endorsability across
a single latent construct so that persons of varying abilities or trait levels can be measured

71
accurately and precisely (Thompson & Weiss, 2011). Another important consideration in the
development of a computer adaptive test is that test items must demonstrate invariance of
measurement across differing groups so that a test-taker’s standing on the latent trait can be
estimated in an unbiased manner (Zwick, 2009). The Rasch model is well suited to these
requirements because it fits data gathered on items to exactly these specifications (Linacre,
2000).
In the past the Rasch model has been applied to the BTI to investigate and evaluate
Rasch model fit, rating scale functioning, differential item functioning across demographic
groups (Taylor, 2006, 2008, Taylor & de Bruin, 2013), and differential item functioning across
language groups (Grobler, 2014). The BTI has also been investigated extensively using
classical test theory techniques such as factor analysis and scale reliability (Metzer et al., 2014;
Taylor, 2004, 2008).
This study aims to evaluate the psychometric properties of the BTI by implementing
the Rasch rating scale model so that core items can be identified for use in computer adaptive
applications. The process of applying the Rasch measurement model to personality inventories
is discussed in the forthcoming sections.
4.1.1. The use of the Rasch model for computer adaptive test development
Some of the information garnered by fitting personality scale data to the Rasch model
include person ability estimates (Mellenbergh & Vijn, 1981), item difficulty or endorsability
estimates (Embretson & Reise, 2000), item and person spread or dispersion across the range of
the latent trait (Bond & Fox, 2007), person and item reliability (Boone, Staver & Yale, 2014),
and rating scale category functioning (Linacre, 2002a). These item response theory evaluations
are a necessary requirement when building and/or evaluating a measurement scale within an
item response theory model because they determine whether the data meet the assumptions of
72
the model (Bond & Fox, 2007). These assumptions are core requirements for the practical
implementation of a computer adaptive test and it is therefore important that the items of a
scale meet these assumptions for computer adaptive testing to be practically viable (Thompson
& Weiss, 2011; Weiss, 2013).
As computer adaptive tests are heavily reliant on the assumptions of item response
theory models (Weiss, 2013), measurement scales that are used in computer adaptive testing
need to meet two broad requirements namely: (1) that the items of the scale measure a single
latent construct only; and (2) that at any level of the latent construct the probability of endorsing
an item within the measurement scale is unrelated to the probability of endorsing any other
item in that scale (Hambleton & Jones, 1993; Streiner, 2010). These requirements are referred
to as the unidimensionality and local independence assumptions (McDonald, 2009; Sick,
2011).
The unidimensionality assumption is important for computer adaptive tests as each item
is selected by a computer algorithm based on its positional standing or rank on a single latent
construct (Linacre, 2000). The positional standing of items on the latent construct is a core
feature for computer adaptive tests where each item is selected by means of its relative position
along the trait continuum in order to estimate a test-taker’s standing on the latent construct of
interest (Thompson & Weiss, 2011). Of course, the positioning of items on the latent construct
presupposes that each item of the scale must measure a single construct and that the items of a
scale should only differ from one another regarding the level, or standing, on the latent
construct measured (Hogan, 2013). Additionally, because each item is used independently to
estimate a test-taker’s standing on the latent construct, each item must demonstrate
independence from any other item at the scale level (Linacre, 2000, Thompson & Weiss, 2011).
The Rasch model is uniquely suited to this purpose as it assumes that each item of a
measurement scale measures a single construct and that each item’s relative location on the

73
latent construct is independent of any other item’s location on that construct (Marais &
Andrich, 2008). This means that if the data fit the Rasch model each item can be used
independently to estimate a test-taker’s standing on the latent construct in question without
depending on the administration of any other item (Baghaei, 2008; Pallant & Tennant, 2007).
Consequently, the Rasch model fits data to these requirements and evaluates to what degree
the items meet them. In the next section some of the fit statistics that are important for the
evaluation of a scale within the Rasch rating scale model are discussed.
.
4.1.2. The application of Rasch diagnostic criteria for psychometric evaluation
The most basic Rasch fit statistics are the mean square fit statistics that indicate how
well the items of a particular measurement scale measure a single construct (Linacre, 2002b).
These fit statistics are referred to as infit and outift mean square fit statistics (Bond & Fox,
2007). Both the infit and outfit mean square statistics indicate whether items of a scale underfit
or overfit the unidimensional Rasch model (Linacre, 2002b). Where underfit indicates that the
items measure something other than the construct of interest (i.e., multidimensionality); overfit
indicates whether items arbitrarily measure the latent construct without really adding any
unique information beyond other items in the scale (Linacre, 2002b). Essentially, underfit
identifies items that do not measure the construct of interest. Overfit, on the other hand,
identifies items that are redundant when compared to other items in the measurement scale.
Fitting personality measurement scale data to the Rasch model also provides
information on the spread of person ‘traitedness’ and item endorsability on a single common
scale of measurement as well as item and person reliability indices that indicate the
reproducibility and consistency of item and person locations on the common latent construct
(Bond & Fox, 2007). Additionally, if a polytomous rating scale is used, as is the case with most
personality scales, Linacre (2002a) suggests that the performance of the rating scale is

74
investigated in addition to basic item fit statistics. This is important because rating scale
categories must be capable of measuring different amounts of the latent construct and must do
so in their intended manner from a lower to higher level of the latent construct (Linacre, 2002a).
Another important issue that needs to be addressed when preparing a measurement
scale for computer adaptive testing is item bias (Weiss, 2013). It is important to realise that
optimal computer adaptive test functioning of a measurement scale is only possible if there is
very little bias when estimating test-takers’ standing on a latent construct (Eggen & Verschoor,
2006). Possible item bias can be reduced by selecting items that remain invariant across
different demographic groups of test-takers (Linacre, 2000; Zwick, 2009). As mentioned
earlier, invariant measurement is very important for computer adaptive tests because fewer
items are administered than in non-adaptive tests. This makes every response to a particular
item by a specific test-taker pivotal to accurately estimate a test-taker’s standing on the latent
construct (Zwick, 2009). Also, because items with a specific endorsability are selected based
on the responses to previous items, biased measurement by a few items in the measurement
scale can have major repercussions for latent construct estimation and consequently the items
which are selected by a computer adaptive algorithm for administration (Zwick, 2009).
For example, if a single item is biased or underfits the Rasch model, the interim trait
estimate for a particular test taker may not be accurate in computer adaptive testing (Walter et
al., 2007). This inaccuracy will result in the selection of items to administer within the
computer adaptive testing framework that are not necessarily relevant or appropriate to the test-
taker and which may result in the inaccurate and imprecise estimation of the test-taker’s
standing on the latent construct measured. Lai et al. (2003) emphasise the importance of
investigating items for differential item functioning (DIF) within the Rasch model before
computer adaptive test applications are implemented to limit any bias when estimating the
latent trait in a computer adaptive manner.

75
Against this background, this study evaluates the BTI for computer adaptive test
preparation by fitting the scales of the BTI to the Rasch rating scale model and investigating
whether each scale meets the assumptions of the Rasch model. This was done in order to select
a number of optimally functioning core items for use within a computer adaptive testing
framework.
4.2. Method
4.2.1. Participants
Participants were South African adults (n =1962) who were assessed on the BTI for
selection, development, counselling and placement purposes. A convenience sampling
procedure was employed as participants were drawn from an existing database. The mean age
of the participants was 33 years (SD = 9 years, Md = 33 years). There were 936 men (62%)
and 647 women (38%). Participants represented the following ethnic groups: Black (54%),
White (36%), Mixed Race (6%) and Asian (4%). Although men and Whites are
overrepresented with respect to the general South African population, the participants roughly
reflect the white collar working population in South Africa (Statistics South Africa, 2011).
Only the Black and White (n = 1746) participants were used for evaluation of
differential item functioning by ethnicity. The mean age of the Black and White group was 34
years (SD = 9 years, Md = 33 years). This group was composed of 647 women (37%) and 1099
men (63%). All participants completed the BTI in English.
4.2.2. Instrument
The BTI measures the five factors of personality through the use of 193 items
which are in the form of behavioural statements such as “I like to meet people” or “I am
organised” (Taylor & de Bruin, 2012). The BTI is a hierarchical personality inventory

76
and has 24 subscales called facets each of which are integrated into the five-factors of
personality (Taylor & de Bruin, 2006, 2013). The BTI items make use of a five-point
Likert-type response scale with response options that range from (1) ‘Strongly Disagree’
to (5) ‘Strongly Agree’ (Taylor & de Bruin, 2006). The BTI has demonstrated good
reliability on the scale level with Cronbach alpha coefficients above .87 across each of
the five scales (Taylor & de Bruin, 2013). Most of the subscales of the BTI reflect
Cronbach alpha coefficients above .75 (Taylor & de Bruin, 2013). Factor analysis of the
subscales have demonstrated strong support for the construct validity of the big five traits.
Good congruence between the factor-structures for Black and White groups in South
Africa have been demonstrated with Tucker’s phi coefficients > .93 for the five scales
(Metzer et al., 2014; Taylor & de Bruin, 2013).
4.2.3. Data Analysis
Each of the five scales of the BTI was fit to the Rasch rating scale model using
Winsteps 3.81 (Linacre, 2014). SPSS 22.0 (IBM Corp, 2013) was used for an analysis of
variance – ANOVA – of item residuals, which were obtained using Winsteps 3.81.
The Rasch rating scale model is a unidimensional measurement model which can
be used when items share the same rating scale (Andrich, 1978, Wright & Masters, 1982).
The Rasch rating scale model estimates item difficulty (or item endorsability) locations,
response category thresholds, and person locations (the person’s relative standing on the
trait) units (Andrich, 1978; Wright & Masters, 1982). The rating scale model for
constructing measures from observations is (Linacre, 2002a; Wright & Douglas, 1986):
77
log( 𝑃𝑛𝑖𝑘/𝑃𝑛𝑖(𝑘−1)) = 𝐵𝑛 − 𝐷𝑖 − 𝐹𝑘
where:
𝑃𝑛𝑖𝑘 is the probability that person n would respond in category k when
encountering item i
𝑃𝑛𝑖(𝑘−1) is the probability that the response to item i would be in response
category k – 1
𝐵𝑛 is the ability level or amount of the latent trait of person n
𝐷𝑖 is the difficulty or endorsability of item i
𝐹𝑘 is the impediment to being observed in rating scale category k relative to
category k – 1
The Rasch rating scale model was selected for the analysis of the BTI scales because
the instrument meets the assumptions of this model (i.e., all the items of the BTI use the
same five-point Likert type scale) and allows the operation of rating scales to be
investigated (Linacre, 2002a). The Rasch rating scale model is a special case of the
Masters partial credit model (Masters, 1982); the Andrich dispersion model (Andrich,
1978) and the Rasch polytomous model (1961) where rating thresholds are constrained
to be equidistant across items and where the item discrimination parameters are held
constant (Koch & Dodd, 1995). The rating scale model was selected over the standard
partial credit model; generalised partial credit model and the graded response model
because the scales of the BTI share the same rating scale structure across all the items
(Ostini & Nering, 2006). It is thus assumed that the difference between the rating scale
thresholds should remain constant as this is congruent to instruments where Likert-type
scales are used in which items and their rating scale are assumed to share the same
meaning across the instrument or scale (Ostini & Nering, 2006). Also, unlike the graded
78
response model or the general partial credit model the item discrimination parameters are
held constant in the rating scale model which is more applicable to a one-parameter item
response theory model like the Rasch model (Hart et al., 2006). The Rasch rating scale
model assumes that the only discrimination parameter between test-takers is the relative
endorsability, or difficulty, of the items administered (Andrich, 1978) whereas the partial
credit model places no restrictions on threshold step values (Masters, 1982) and the
graded response model (Samejima, 1969) includes item discrimination parameters (Koch
& Dodd, 1995). The constrained nature of the Rasch rating scale model thus allow for
invariant measurement where only the probability of endorsing items of a scale is
compared between groups and evaluated for equivalence (Ostini & Nering, 2006). As
previously mentioned invariant measurement across test-takers of varying trait levels
and/or different demographic groups is a key requirement in computer adaptive testing
(Hart et al., 2006).
The following were inspected as per the recommendation of Apple and Neff (2012),
Lai et al. (2003) and Linacre (2000) for each scale of the BTI: summary item and person
fit statistics; individual item fit; person-item dispersion; person separation indices; person
reliability indices; and an evaluation of rating scale category performance. Finally, the
scales were also investigated for differential item functioning for gender and ethnicity.
4.2.4. Ethical Considerations
Ethical clearance for this study was obtained from the Faculty Ethics Committee
in the Faculty of Management at the University of Johannesburg. Permission to use the
data for research was granted from JvR Psychometrics, which owns the BTI database.
Only BTI data for which test-takers provided consent for research was used.

79
Confidentiality and anonymity of the data were maintained by not including any
identifying information the BTI data-set.
4.2.4.1. Evaluating Rasch fit indices
Fit indices, which indicate how well items of a scale meet the requirements of the Rasch
model, were evaluated for the BTI. Following the recommendations of Bond and Fox
(2007) for the fit of personality inventories that employ polytomous items, infit and outfit
mean square statistics < 1.4 and > .60 were considered acceptable. The infit mean square
is empahasised in this study as it is sensitive to irregularities in the responses to items that
are closely targeted to a person’s ability/trait level (Linacre, 2002). In computer adaptive
testing items are often selected that match as closely as possible the person’s relative trait
level (Kingsbury, 2009), which makes infit statistics more applicable than outfit for the
investigation of Rasch model fit. Infit is inlier sensitive as opposed to outfit that is
sensitive to irregularities in responses to items that do not match a person’s ability/trait
level (Linacre, 2002b). Using the infit mean square therefore avoids, to some degree, the
spurious effect of outliers. The BTI was investigated for fit on the overall scale level as
well as on the item level.
4.2.4.2. Person separation indices and reliability.
To evaluate the degree to which the scales separate persons with different trait
levels, person separation and person reliability coefficients were calculated. Following
the recommendations of Lai et al (2003); Linacre (2014) and Wright and Stone (1999)
person reliabilities > .80 and person separation indices > 2.00 were deemed acceptable.

80
Person-item maps that indicate the relative item endorsability relative to the
sample were also generated to determine whether the items of the BTI scales correspond
to person trait levels.
4.2.4.3. Rating scale performance.
Rating scale performance for each scale of the BTI was evaluated by investigating
whether rating scale categories were used sufficiently by the sample and whether response
categories were progressively and monotonically ordered (Apple & Neff, 2012; Linacre,
2002a). Apple and Neff (2012) and Linacre (2002a) suggest that category thresholds are
ordered from higher endorsability, for lower rating scale categories, to lower
endorsability, for higher rating scale categories. Rating scales were also evaluated for fit
and endorsability so that the outfit mean square statistics were < 2.00 and that differences
in threshold endorsability were > .59 but < 5.00 logits (Apple & Neff, 2012; Bond & Fox,
2007).
4.2.4.4. Differential item functioning
Differential item functioning (DIF) was investigated by using an ANOVA of
standardized residuals, which is a latent variable parametric approach, proposed by
Hagquist and Andrich (2004); and Andrich and Hagquist (2014). Although numerous
parametric and non-parametric DIF detection techniques for dichotomous and
polytomous data are available (cf. Teresi, Ramirez, Lai, & Silver, 2008); the ANOVA of
residuals method has the advantage of detecting whether DIF is statistically significant
(for both uniform and non-uniform DIF) for polytomous data (Andrich & Hagquist,
2014). In general, this technique involves applying a two-way ANOVA to the residuals
of item responses. Using the Rasch framework, standardized residuals for every person

81
for every item on a scale was constructed. Each person was then placed in a number of
class intervals (CI) by either their total scores on the scale, or their person ability/trait
estimates as estimated through the Rasch model. A two-way ANOVA was then conducted
on the residuals of the CI, the grouping variable, and an interaction term between the CI
and group variables so that either variable could be controlled for when diagnosing DIF.
In this study, DIF contrasts between the groups as indicators of effect size are used.
A Bonferroni correction for statistical significance tests, as Andrich and Hagquist (2014)
suggest (cf. Bland & Altman, 1995; Tennant & Pallant, 2007), are also applied. The
expected versus empirical item characteristic curves and non-uniform DIF item
characteristic curves for items indicating misfit and possible DIF are additionally included
to establish the severity of such DIF and to present DIF visually.
Not enough data were sourced for the Coloured and Indian demographic groups
and thus, only Black and White ethnic groups were investigated for differential item
functioning by ethnicity (refer to section 4.2.1 for a breakdown of the participants) and
the full sample was used for identification of DIF by gender. DIF was only considered
problematic if the DIF contrasts were statistically significant and were ≥ |.40| logits. This
was done because significant DIF contrasts do not always result in practically significant
DIF. Although Tennant and Pallant (2007) recommend DIF contrasts of ≥ |.50| logits as
practically significant, a decision was made to eliminate items with a DIF contrast ≥ |.40|
to optimise the core item bank. Any DIF contrast ≥ |.50| after item removal was flagged,
however items showing DIF < |.50| after initial item removal was retained for the core
item bank to avoid over-eliminating too many items from each scale or overfitting the
data to the model (Wright & Linacre, 1994).

82
4.3. Results
4.3.1. BTI scale infit and outfit statistics
The mean summary infit and outfit mean square statistics can be viewed in Table
4.1. The items of the BTI scales evidenced satisfactory infit mean square values which
ranged between .99 (Agreeableness) and 1.04 (Neuroticism). These values are close to
the expected value of 1.00. By contrast the mean outfit demonstrated greater deviation
from 1.00 with values ranging from 1.02 (Extraversion) to 1.07 (Conscientiousness). This
shows the presence of some unexpected responses to items that do not closely match
person trait levels.
Table 4.1
Item and person mean summary infit and outfit statistics
Fit Statistics E N C O A
Person Infit 1.02 1.09 1.17 1.10 1.10
SD .51 .65 .73 .70 .72
Person Outfit 1.02 1.05 1.07 1.06 1.04
SD .56 .63 .61 .64 .65
Item Infit 1.01 1.04 1.00 1.01 .99
SD .19 .21 .31 .29 .26
Item Outfit 1.02 1.05 1.07 1.06 1.04
SD .20 .24 .43 .32 .29
Note. E = Extraversion; N = Neuroticism; C = Conscientiousness; O = Openness; A =
Agreeableness
Inspection of individual item-fit statistics (see Table 4.2 and Table 4.3) indicated
some misfitting items by their infit and outfit mean square statistics respectively. These

83
items were flagged for removal. However, the majority of the items per scale fit the Rasch
rating scale model satisfactorily. Before, flagged items were removed by their infit and
outfit mean square statistics the scales were investigated for person separation, reliability
and rating scale functioning.
Table 4.2
Item infit mean squares for the BTI scales
Extroversion Neuroticism Conscientiousness Openness Agreeableness
Item Infit Item Infit Item Infit Item Infit Item Infit
bti37† 1.41 bti59† 1.68 bti107† 1.89 bti144† 1.99 bti186† 1.65
bti12 1.38 bti64† 1.60 bti77† 1.87 bti143† 1.56 bti168† 1.46
bti34 1.37 bti56 1.39 bti78† 1.69 bti147 1.39 bti187† 1.46
bti33 1.30 bti57 1.35 bti86† 1.51 bti145 1.37 bti177† 1.46
bti32 1.28 bti47 1.27 bti114† 1.49 bti121 1.31 bti182† 1.45
bti3 1.28 bti45 1.21 bti89† 1.43 bti135 1.26 bti169 1.33
bti36 1.26 bti67 1.12 bti90 1.14 bti122 1.25 bti161 1.27
bti15 1.17 bti62 1.12 bti88 1.13 bti146 1.21 bti184 1.18
bti31 1.14 bti54 1.10 bti98 1.12 bti130 1.15 bti175 1.13
bti22 1.13 bti61 1.10 bti101 1.11 bti139 1.14 bti171 1.13
bti16 1.11 bti55 1.08 bti81 1.11 bti138 1.05 bti156 1.08
bti38 1.06 bti46 1.06 bti79 1.11 bti137 1.01 bti183 1.06
bti17 1.04 bti63 1.05 bti91 1.04 bti136 1.00 bti173 1.05
bti4 1.01 bti43 1.05 bti120 1.01 bti127 1.00 bti160 1.04
bti2 1.01 bti71 1.01 bti100 1.01 bti152 .98 bti162 .97
bti14 .97 bti70 1.01 bti87 1.00 bti123 .96 bti157 .97
bti10 .96 bti50 .99 bti97 .98 bti148 .94 bti192 .95
bti13 .95 bti69 .98 bti115 .96 bti124 .92 bti172 .94

84
bti35 .94 bti60 .97 bti84 .95 bti153 .83 bti170 .93
bti6 .94 bti66 .97 bti82 .95 bti149 .83 bti185 .91
bti5 .94 bti51 .97 bti103 .90 bti151 .82 bti159 .90
bti9 .93 bti68 .96 bti92 .89 bti133 .81 bti158 .89
bti28 .93 bti52 .96 bti113 .89 bti129 .81 bti193 .89
bti25 .92 bti49 .95 bti111 .88 bti132 .80 bti166 .87
bti20 .90 bti40 .95 bti80 .87 bti126 .78 bti176 .85
bti21 .89 bti41 .89 bti110 .87 bti140 .77 bti181 .84
bti30 .88 bti44 .89 bti116 .84 bti134 .76 bti188 .82
bti1 .85 bti53 .86 bti117 .82 bti150 .75 bti167 .81
bti24 .82 bti42 .83 bti105 .81 bti141 .73 bti178 .81
bti18 .81 bti75 .83 bti83 .81 bti125 .73 bti164 .80
bti7 .80 bti74 .81 bti104 .80 bti131 .68 bti165 .79
bti26 .80 bti72 .77 bti106 .78 bti154 .68 bti163 .76
bti11 .78 bti73 .77 bti94 .77 bti174 .72
bti27 .77 bti65 .74 bti109 .77 bti189 .71
bti29 .77 bti108 .76 bti180 .69
bti19 .76 bti118 .73 bti191 .63
bti93 .73 bti190 .60
bti95 .71
bti99 .70
bti119 .68
bti102 .64
Note. E = Extraversion; N = Neuroticism; C = Conscientiousness; O = Openness; A =
Agreeableness. Items are presented in descending order according to their infit mean squares. † =
items with infit ≥ 1.40.

85
Table 4.3
Item outfit mean squares for the BTI scales
Extroversion Neuroticism Conscientiousness Openness Agreeableness
Item Outfit Item Outfit Item Outfit Item Outfit Item Outfit
bti37† 1.44 bti59† 1.86 bti107† 2.39 bti144† 2.10 bti186† 1.79
bti33 1.40 bti64† 1.72 bti77† 2.35 bti143† 1.77 bti182† 1.64
bti12 1.39 bti56 1.38 bti78† 1.96 bti147† 1.50 bti168† 1.58
bti34 1.39 bti47 1.35 bti114† 1.80 bti121† 1.46 bti187† 1.56
bti32 1.32 bti57 1.16 bti86† 1.73 bti145 1.23 bti177† 1.47
bti3 1.30 bti45 1.10 bti89† 1.69 bti135 1.35 bti169 1.40
bti36 1.29 bti54 1.20 bti98 1.26 bti146 1.34 bti161 1.36
bti15 1.17 bti67 1.19 bti88 1.25 bti130 1.30 bti184 1.23
bti22 1.17 bti61 1.15 bti101 1.20 bti122 1.29 bti175 1.20
bti16 1.14 bti62 1.11 bti120 1.16 bti139 1.19 bti171 1.16
bti31 1.14 bti63 1.11 bti90 1.13 bti138 1.13 bti183 1.15
bti38 1.08 bti55 .99 bti81 1.08 bti136 1.09 bti160 1.14
bti17 1.07 bti46 1.00 bti79 1.02 bti152 1.08 bti156 1.13
bti4 1.01 bti71 1.06 bti97 1.08 bti137 1.03 bti173 1.08
bti2 .97 bti70 1.05 bti103 1.07 bti123 1.01 bti192 1.01
bti14 .96 bti43 1.01 bti115 1.06 bti127 1.00 bti162 .99
bti35 .96 bti60 1.03 bti91 .94 bti148 .99 bti172 .98
bti10 .96 bti49 1.02 bti87 1.03 bti124 .89 bti185 .98
bti13 .92 bti66 1.00 bti84 1.02 bti153 .88 bti157 .98
bti6 .94 bti69 1.00 bti100 .88 bti133 .85 bti170 .96
bti5 .94 bti40 1.00 bti82 1.01 bti149 .84 bti158 .95
bti9 .94 bti50 .97 bti104 .97 bti134 .84 bti166 .95
bti28 .91 bti51 .81 bti92 .94 bti132 .83 bti193 .94

86
bti25 .93 bti41 .97 bti116 .91 bti151 .81 bti159 .92
bti21 .91 bti68 .96 bti111 .89 bti129 .80 bti165 .89
bti20 .91 bti52 .94 bti113 .80 bti140 .80 bti176 .88
bti30 .88 bti42 .90 bti80 .77 bti126 .76 bti181 .88
bti1 .86 bti75 .89 bti110 .83 bti141 .76 bti167 .87
bti24 .86 bti44 .86 bti105 .86 bti125 .75 bti188 .84
bti18 .82 bti53 .76 bti118 .82 bti150 .74 bti178 .81
bti7 .81 bti74 .79 bti117 .80 bti131 .72 bti164 .80
bti26 .79 bti72 .80 bti83 .80 bti154 .71 bti163 .77
bti11 .79 bti73 .72 bti94 .78 bti174 .68
bti27 .78 bti65 .72 bti106 .72 bti189 .70
bti29 .77 bti108 .77 bti180 .67
bti19 .77 bti109 .75 bti191 .63
bti93 .74 bti190 .62
bti95 .70
bti99 .63
bti119 .69
bti102 .63
Note. E = Extraversion; N = Neuroticism; C = Conscientiousness; O = Openness; A = Agreeableness.
Items are presented in descending order according to their outfit mean squares.
† = items with outfit ≥ 1.40
4.3.2. Person separation and reliability indices
Person separation and reliability indices for each of the BTI scales are presented
before the removal of ant items in Table 4.4. Person separation indices ranged between
2.39 and 3.04 and person reliability ranged between .85 and .90 indicating that the scales
of the BTI were able to distinguish between individuals with either a high or low level of

87
the measured personality traits. Cronbach alpha reliability coefficients ranged between
.87 and .94 for the BTI scales indicating acceptable consistency of measurement. These
results were encouraging especially since poor fitting items were included in the analysis.
Table 4.4
Person separation and reliability indices
Construct Person Separation Person Reliability α
Extraversion 2.36 .85 .87
Neuroticism 3.01 .90 .93
Conscientiousness 3.03 .90 .94
Openness 2.39 .85 .88
Agreeableness 2.59 .87 .89
Note. α = Cronbach’s alpha internal consistency reliability
4.3.3. Rating scale performance
Rating scale performance indices for each of the BTI scales can be viewed in Table
4.5. The BTI items employ a five-point rating scale format (1 = Strongly Disagree, 2 =
Disagree; 3 = Neither Agree or Disagree; 4 = Agree; 5 = Strongly Agree). For each of
the five scales the rating scale categories demonstrated a sufficient frequency of usage by
the participants. Outfit mean square statistics for each category of the rating scales
indicated good fit (i.e., outfit mean square < 1.40) with Conscientiousness, Openness and
Agreeableness demonstrating significantly poorer fit for the lowest rating scale category
although the infit mean square for Openness was marginally acceptable. All other
categories evidenced acceptable infit and outfit mean squares. Differences in threshold
endorsability remained within the parameter range for each of the BTI scales indicating
good general threshold separation with no disordering of the thresholds detected.

88
Table 4.5.
Rating scale performance indices
Construct Category Measure Rasch-
Andrich
Thresholds
Percentage
of
Responses
Outfit Infit
Extraversion 1 -2.40 NONE 5.38% 1.25 1.14
2 -1.06 -.92 10.64% .93 .92
3 -.11 -.68 24.20% .90 .92
4 .99 .17 35.84% .91 .92
5 2.71 1.44 23.95% 1.04 1.06
Neuroticism 1 -2.59 NONE 36.58% .98 .95
2 -1.00 -1.27 31.81% .76 .95
3 .02 -.24 17.94% .89 .91
4 1.01 .31 9.87% 1.16 1.06
5 2.54 1.20 3.80% 1.79 1.44
Conscientious
.
1 -2.49 NONE
1.55%
3.01 1.81
2 -1.14 -1.01 4.04% 1.29 1.12
3 -.17 -.76 14.20% .94 .93
4 1.05 .05 38.93% .71 .90
5 2.95 1.72 41.28% .93 .91
Openness 1 -2.35 NONE 3.62% 1.79 1.39
2 -1.03 -.86 8.18% 1.05 1.01
3 -.12 -.64 20.88% .86 .88

89
4 .96 .09 37.67% .85 .95
5 2.68 1.41 29.66% .95 .92
Agreeableness 1 -2.51 NONE 4.45% 1.90 1.49
2 -1.11 -1.07 9.23% .96 .95
3 -.13 -.64 20.78% .83 .87
4 1.04 .11 37.94% .86 .97
5 2.84 1.60 27.60% .95 .94
The person/item dispersion maps, which display the location of items in relation
to the location of persons for each scale, can be viewed in Figures 4.3.3a (Extraversion),
4.3.3b (Neuroticism), 4.3.3c (Conscientiousness), 4.3.3d (Openness), and 4.3.3e
(Agreeableness). The person/item dispersion maps indicate the endorsability of each
item’s Rasch-Andrich threshold (thresholds 1, 2, 3 and 4) for the five-point Likert-type
scale. In general, the Person/item dispersion maps indicate good targeting of items and
persons with item thresholds spread across the trait levels of persons in the sample.
However, the Conscientiousness scale evidenced fewer items targeted at a high level of
the trait than the other scales. Neuroticism evidenced the opposite pattern with fewer
items targeted at lower levels of the trait.
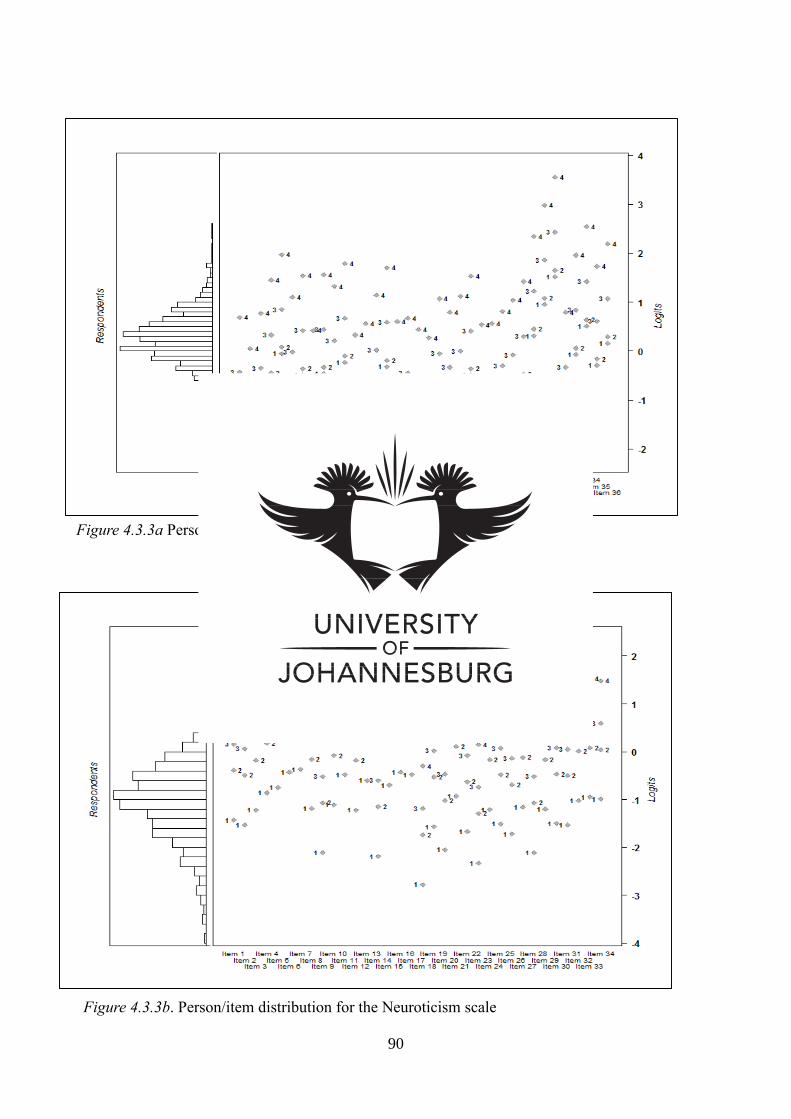
90
Figure 4.3.3b. Person/item distribution for the Neuroticism scale
Figure 4.3.3a Person/item distribution for the Extraversion scale

91
Figure 4.3.3c. Person/item distribution for the Conscientiousness scale
Figure 4.3.3d. Person/item distribution for the Openness scale

92
4.3.4. Differential item functioning
Differential item functioning was investigated for ethnicity (Black and White) and
gender. The DIF contrasts (i.e. the difference in item locations) by ethnic group and by
gender can be viewed in Table 4.6 and Table 4.7, respectively. A DIF contrast with a
negative sign indicates that Black individuals and women scored lower than White
individuals and men respectively. Conversely, a positive sign indicates that Black
individuals and women scored higher than their respective referent groups. An ANOVA
of residuals was used to determine whether DIF was uniform or non-uniform in nature.
Figure 4.3.3e. Person/item distribution for the Agreeableness scale

93
Table 4.6
Practically significant DIF by ethnicity
Extraversion Neuroticism Conscientiousness Openness Agreeableness
Item Contrast Item Contrast Item Contrast Item Contrast Item Contrast
bti1 -.18 bti40 .35 bti77† 1.02 bti121†† .59 bti156 -.36
bti2† -.51 bti41† .39 bti78† .87 bti122† .84 bti157† -.40
bti3† -.51 bti42 .12 bti79† -.49 bti123† -.57 bti158 .16
bti4† -.55 bti43† .40 bti80† -.41 bti124 -.12 bti159 -.24
bti5 -.21 bti44 .37 bti81 .00 bti125 .15 bti160† -.47
bti6 -.34 bti45† .56 bti82 .00 bti126 -.24 bti161 .20
bti7 -.25 bti46 .22 bti83† -.46 bti127 .30 bti162 -.37
bti9 -.14 bti47 -.30 bti84 .28 bti129 .13 bti163 -.33
bti10 .03 bti49 .00 bti86 .12 bti130 -.11 bti164 .25
bti11 .00 bti50 .19 bti87 -.31 bti131 .11 bti165 .00
bti12 .00 bti51 .36 bti88† .49 bti132 .24 bti166 .00
bti13† -.53 bti52 -.32 bti89† .44 bti133 -.25 bti167 -.17
bti14 -.08 bti53 .06 bti90† -.76 bti134 .27 bti168† .49
bti15† .43 bti54 -.29 bti91† -.98 bti135 .26 bti169 .37

94
bti16† .47 bti55 -.36 bti92† -.83 bti136† -.59 bti170 .00
bti17 -.03 bti56 .22 bti93 -.11 bti137 .14 bti171 .00
bti18 -.26 bti57†† -.41 bti94 -.19 bti138 -.19 bti172 .10
bti19 -.15 bti59† -.84 bti95 -.29 bti139 .12 bti173 .16
bti20 .00 bti60 -.35 bti97† .46 bti140 -.28 bti174 -.37
bti21 .13 bti61 .06 bti98† .92 bti141 -.32 bti175 -.16
bti22 .29 bti62† .44 bti99 .21 bti143 -.15 bti176 -.24
bti24 .17 bti63 .24 bti100 .02 bti144 .21 bti177 -.30
bti25 .18 bti64 .10 bti101 .17 bti145 -.31 bti178 .00
bti26 -.36 bti65 .00 bti102 .00 bti146 .14 bti180 -.22
bti27 -.35 bti66 .22 bti103 .24 bti147 .15 bti181 -.20
bti28 -.11 bti67 -.21 bti104 -.26 bti148 -.18 bti182† .51
bti29 -.03 bti68 .00 bti105 .14 bti149 .00 bti183 .19
bti30 .07 bti69 -.08 bti106 -.31 bti150† -.48 bti184 .15
bti31† .50 bti70 -.34 bti107 .00 bti151 -.34 bti185 -.15
bti32† .72 bti71† -.61 bti108 -.39 bti152 .11 bti186 .22
bti33 .39 bti72 -.13 bti109 -.36 bti153 -.15 bti187 -.02
bti34† -.50 bti73† .55 bti110† -.47 bti154 -.23 bti188 .12
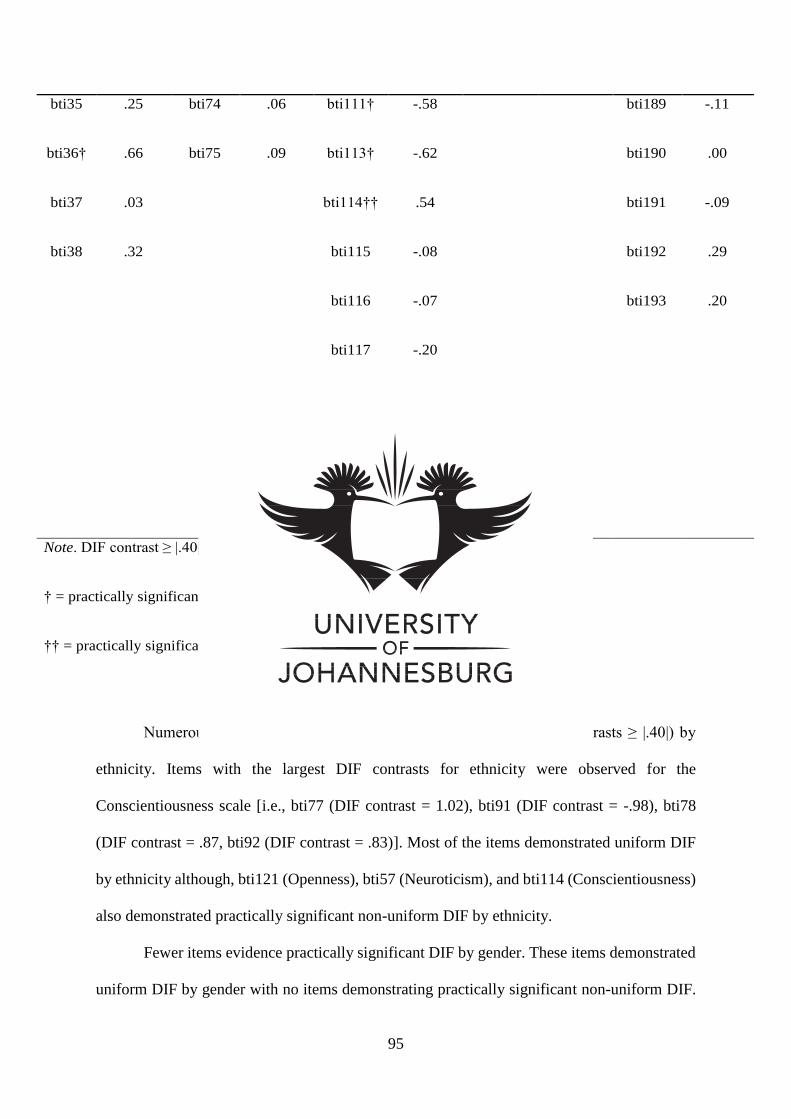
95
Numerous items evidenced practically significant DIF (i.e. DIF contrasts ≥ |.40|) by
ethnicity. Items with the largest DIF contrasts for ethnicity were observed for the
Conscientiousness scale [i.e., bti77 (DIF contrast = 1.02), bti91 (DIF contrast = -.98), bti78
(DIF contrast = .87, bti92 (DIF contrast = .83)]. Most of the items demonstrated uniform DIF
by ethnicity although, bti121 (Openness), bti57 (Neuroticism), and bti114 (Conscientiousness)
also demonstrated practically significant non-uniform DIF by ethnicity.
Fewer items evidence practically significant DIF by gender. These items demonstrated
uniform DIF by gender with no items demonstrating practically significant non-uniform DIF.
bti35 .25 bti74 .06 bti111† -.58 bti189 -.11
bti36† .66 bti75 .09 bti113† -.62 bti190 .00
bti37 .03 bti114†† .54 bti191 -.09
bti38 .32 bti115 -.08 bti192 .29
bti116 -.07 bti193 .20
bti117 -.20
bti118 -.02
bti119 -.14
bti120 .03
Note. DIF contrast ≥ |.40| are printed in boldface.
† = practically significant uniform DIF only
†† = practically significant uniform and non-uniform DIF (ANOVA of residuals)

96
The Conscientiousness scale was the only scale that evidenced no practically significant DIF
by gender at all.
Table 4.7
Practically significant DIF by gender
Extraversion Neuroticism Conscientiousness Openness Agreeableness
Item Contrast Item Contrast Item Contrast Item Contrast Item Contrast
bti1 .17 bti40 -.07 bti77 -.26 bti121† -.52 bti156 .34
bti2 .32 bti41 .02 bti78 -.13 bti122 -.39 bti157 .16
bti3 .38 bti42 -.07 bti79 .10 bti123 -.17 bti158 .14
bti4 .30 bti43 .07 bti80 -.03 bti124 -.02 bti159 .18
bti5 .22 bti44 -.02 bti81 .00 bti125 -.19 bti160 .28
bti6† .41 bti45 -.28 bti82 .00 bti126 .00 bti161 .20
bti7 .12 bti46 .30 bti83 .05 bti127 .17 bti162 .17
bti9 -.14 bti47 .33 bti84 -.08 bti129 .00 bti163 .00
bti10 -.32 bti49 .00 bti86 -.12 bti130 .19 bti164 -.02
bti11 -.08 bti50 .00 bti87 .21 bti131 .14 bti165 .00
bti12 -.12 bti51 -.28 bti88 -.26 bti132 .00 bti166 .03
bti13 .26 bti52 .16 bti89 -.16 bti133 .19 bti167 .19

97
bti14 .08 bti53 .00 bti90 .16 bti134 .00 bti168 -.12
bti15 -.09 bti54 .38 bti91 .23 bti135 -.03 bti169 .11
bti16 -.12 bti55 .34 bti92 .21 bti136 -.10 bti170 .00
bti17 -.33 bti56 .27 bti93 .15 bti137 -.06 bti171 -.38
bti18 -.14 bti57† .40 bti94 .29 bti138 .16 bti172 -.16
bti19 -.16 bti59 .36 bti95 .09 bti139 -.31 bti173 -.17
bti20 -.22 bti60 .34 bti97 -.11 bti140 .29 bti174 -.23
bti21 -.17 bti61 -.31 bti98 -.35 bti141 .16 bti175 .00
bti22 -.26 bti62 -.23 bti99 -.11 bti143 .26 bti176 .00
bti24 -.19 bti63 .05 bti100 -.07 bti144 -.27 bti177 .21
bti25 -.12 bti64 -.19 bti101 -.16 bti145 -.34 bti178 -.32
bti26 -.07 bti65 -.03 bti102 -.13 bti146 .00 bti180 .02
bti27 -.17 bti66 -.19 bti103 .24 bti147 -.11 bti181 -.10
bti28 -.10 bti67 .18 bti104 .14 bti148 -.07 bti182 -.07
bti29 .00 bti68† -.49 bti105 -.08 bti149 -.10 bti183 .10
bti30 -.06 bti69 .10 bti106 .08 bti150 .36 bti184 .16
bti31 -.18 bti70 .10 bti107 -.24 bti151† .52 bti185 .00
bti32 -.14 bti71 -.12 bti108 .28 bti152 .10 bti186 .12
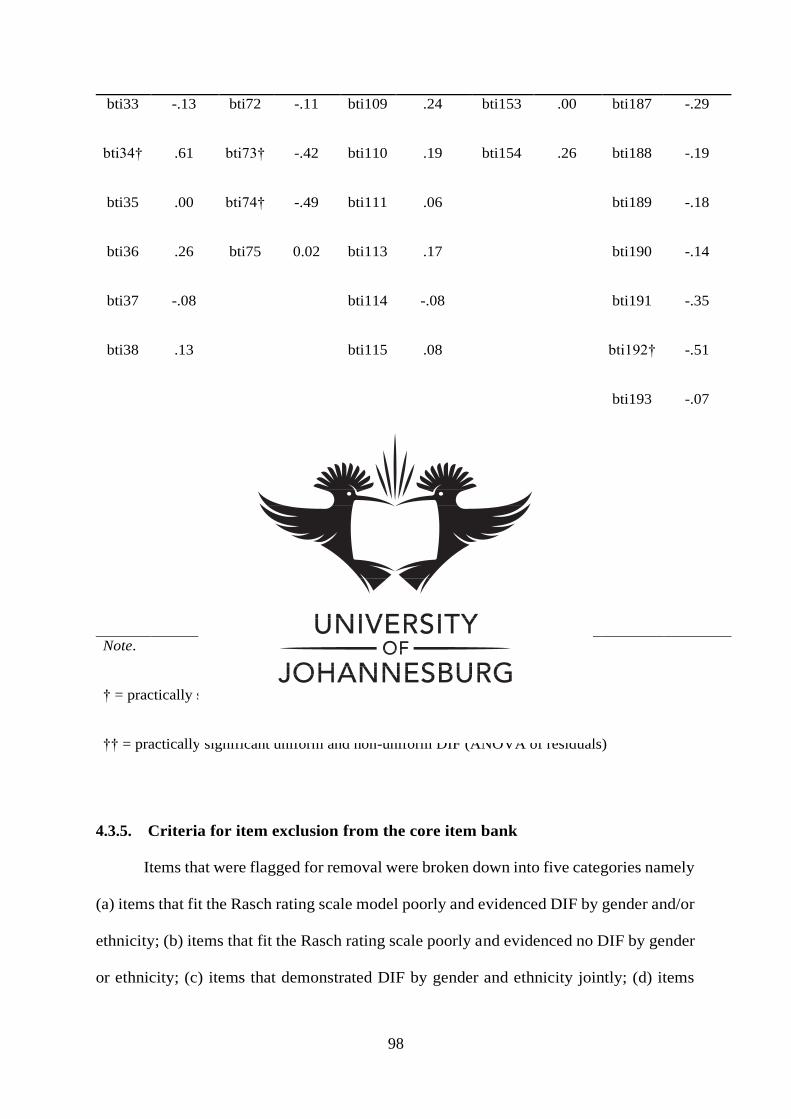
98
bti33 -.13 bti72 -.11 bti109 .24 bti153 .00 bti187 -.29
bti34† .61 bti73† -.42 bti110 .19 bti154 .26 bti188 -.19
bti35 .00 bti74† -.49 bti111 .06 bti189 -.18
bti36 .26 bti75 0.02 bti113 .17 bti190 -.14
bti37 -.08 bti114 -.08 bti191 -.35
bti38 .13 bti115 .08 bti192† -.51
bti116 -.11 bti193 -.07
bti117 -.12
bti118 .00
bti119 .09
bti120 .00
Note.
† = practically significant uniform DIF only
†† = practically significant uniform and non-uniform DIF (ANOVA of residuals)
4.3.5. Criteria for item exclusion from the core item bank
Items that were flagged for removal were broken down into five categories namely
(a) items that fit the Rasch rating scale model poorly and evidenced DIF by gender and/or
ethnicity; (b) items that fit the Rasch rating scale poorly and evidenced no DIF by gender
or ethnicity; (c) items that demonstrated DIF by gender and ethnicity jointly; (d) items

99
that demonstrated DIF by ethnicity alone; and (e) items that demonstrated DIF by gender
alone.
Although some items indicated marginal misfit and no DIF by ethnicity or gender,
this author was conservative and thus also flagged these items for removal. For the
purpose of generating only the best functioning and well performing core item bank for
the BTI computer adaptive test the decision was taken to exclude any poor functioning
items these items for computer adaptive testing. Therefore, all the flagged items identified
were removed. All analyses were re-run and an ANOVA of residuals was generated for
the revised items.
In total, 13 items were flagged for removal from the Extraversion scale; 11 items
from the Neuroticism scale; 18 items from the Conscientiousness scale; 9 items from the
Openness scale; and 8 items from the Agreeableness scale. In total the Extraversion,
Neuroticism, Conscientiousness and Openness scales were left with 23 items each after
flagged items were removed; and the Agreeableness scale was left with 29 items after the
flagged items were removed.
4.3.6. Functioning of the ‘core’ BTI scales
The functioning of the BTI items for each scale was re-investigated after items
identified in section 4.3.3 were removed. All analyses including the infit and outfit mean
squares; person and item separation and reliability; rating scale performance and DIF
analyses were re-run. This was done in order to determine how item removal affected fit
to the Rasch rating scale model, person separation and reliability, rating scale
performance and whether DIF was still present for men and women, and the Black and
White ethnic groups respectively.

100
4.3.6.1. BTI scale infit and outfit statistics after item removal
The mean summary infit and outfit mean square statistics can be viewed in Table
4.8. The items of the BTI scales evidenced improved infit and slightly poorer outfit mean
square values which ranged between 1.00 and 1.08 for the outfit mean square and .99 and
1.02 for the infit mean square. The greatest improvement of fit was evidenced with the
infit and outfit mean square standard deviation values. Although average outfit
deteriorated slightly for some scales, the average infit improved, which may indicate
possibly idiosyncratic responding by some test-takers to items that do not match their trait
levels and not poor fit per se to the Rasch rating scale model.
Table 4.8
Item and person mean summary infit and outfit statistics after item removal
Fit Statistics E N C O A
Person Infit 1.02 1.07 1.10 1.09 1.11
SD .59 .67 .77 .74 .74
Person Outfit 1.01 1.04 1.08 1.05 1.04
SD .59 .65 .75 .70 .68
Item Infit .99 1.02 1.01 1.01 1.00
SD .18 .12 .17 .22 .23
Item Outfit 1.00 1.04 1.08 1.05 1.04
SD .19 .16 .23 .25 .26
Note. E = Extraversion; N = Neuroticism; C = Conscientiousness; O = Openness; A =
Agreeableness
The infit and outfit mean square statistics for each item for each scale of the BTI
can be viewed in Table 4.9 and Table 4.10 respectively. Overall infit and outfit is much
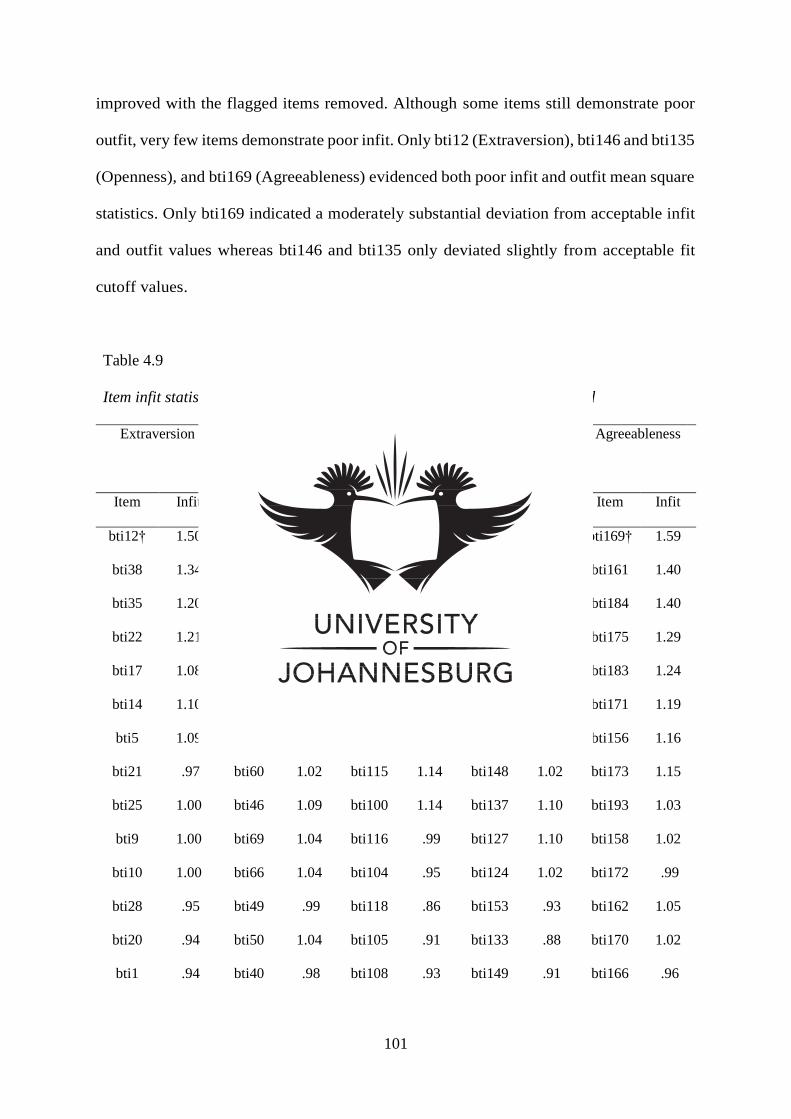
101
improved with the flagged items removed. Although some items still demonstrate poor
outfit, very few items demonstrate poor infit. Only bti12 (Extraversion), bti146 and bti135
(Openness), and bti169 (Agreeableness) evidenced both poor infit and outfit mean square
statistics. Only bti169 indicated a moderately substantial deviation from acceptable infit
and outfit values whereas bti146 and bti135 only deviated slightly from acceptable fit
cutoff values.
Table 4.9
Item infit statistics for the scales of the BTI after flagged items were removed
Extraversion Neuroticism Conscientiousnes
s
Openness Agreeableness
Item Infit Item Infit Item Infit Item Infit Item Infit
bti12† 1.50 bti47 1.31 bti120 1.23 bti146† 1.41 bti169† 1.59
bti38 1.34 bti54 1.16 bti81 1.34 bti135† 1.43 bti161 1.40
bti35 1.20 bti61 1.20 bti87 1.27 bti130 1.28 bti184 1.40
bti22 1.21 bti67 1.16 bti84 1.19 bti145 1.42 bti175 1.29
bti17 1.08 bti63 1.14 bti103 1.09 bti139 1.26 bti183 1.24
bti14 1.10 bti70 1.09 bti101 1.26 bti138 1.13 bti171 1.19
bti5 1.09 bti55 1.12 bti82 1.15 bti152 1.08 bti156 1.16
bti21 .97 bti60 1.02 bti115 1.14 bti148 1.02 bti173 1.15
bti25 1.00 bti46 1.09 bti100 1.14 bti137 1.10 bti193 1.03
bti9 1.00 bti69 1.04 bti116 .99 bti127 1.10 bti158 1.02
bti10 1.00 bti66 1.04 bti104 .95 bti124 1.02 bti172 .99
bti28 .95 bti49 .99 bti118 .86 bti153 .93 bti162 1.05
bti20 .94 bti50 1.04 bti105 .91 bti133 .88 bti170 1.02
bti1 .94 bti40 .98 bti108 .93 bti149 .91 bti166 .96

102
bti30 .92 bti51 1.01 bti94 .91 bti134 .83 bti185 .99
bti7 .90 bti41 .93 bti117 .94 bti126 .88 bti167 .91
bti24 .86 bti52 .99 bti93 .89 bti132 .84 bti165 .88
bti11 .87 bti75 .88 bti106 .90 bti129 .85 bti159 .95
bti18 .82 bti44 .94 bti109 .89 bti140 .82 bti176 .92
bti29 .80 bti42 .86 bti95 .86 bti125 .82 bti181 .88
bti26 .79 bti72 .84 bti119 .78 bti131 .75 bti188 .90
bti19 .79 bti53 .89 bti99 .79 bti141 .77 bti164 .85
bti27 .77 bti65 .78 bti102 .71 bti154 .74 bti178 .85
bti163 .78
bti189 .74
bti174 .73
bti180 .71
bti191 .68
bti190 .64
Note. E = Extraversion; N = Neuroticism; C = Conscientiousness; O = Openness; A =
Agreeableness. Items are presented in descending order according to their infit mean squares. †
= infit ≥ 1.40.

103
Table 4.10
Item outfit statistics for the scales of the BTI after flagged items were removed
Extraversion Neuroticism Conscientiousnes
s
Openness Agreeableness
Item Outfit Item Outfit Item Outfit Item Outfit Item Outfit
bti12† 1.53 bti47 1.38 bti120† 1.48 bti146† 1.62 bti169† 1.69
bti38 1.40 bti54 1.27 bti81† 1.42 bti135† 1.58 bti161† 1.53
bti35 1.26 bti61 1.26 bti87 1.38 bti130† 1.45 bti184† 1.51
bti22 1.25 bti67 1.25 bti84 1.38 bti145 1.24 bti175 1.39
bti17 1.10 bti63 1.22 bti103 1.36 bti139 1.31 bti183 1.37
bti14 1.09 bti70 1.12 bti101 1.35 bti138 1.22 bti171 1.23
bti5 1.10 bti55 1.03 bti82 1.26 bti152 1.18 bti156 1.22
bti21 1.01 bti60 1.09 bti115 1.26 bti148 1.15 bti173 1.19
bti25 1.01 bti46 .98 bti100 1.02 bti137 1.13 bti193 1.15
bti9 .99 bti69 1.08 bti116 1.12 bti127 1.11 bti158 1.11
bti10 1.00 bti66 1.07 bti104 1.09 bti124 .98 bti172 1.07
bti28 .91 bti49 1.06 bti118 .98 bti153 .99 bti162 1.06
bti20 .94 bti50 1.01 bti105 .97 bti133 .92 bti170 1.06
bti1 .94 bti40 1.03 bti108 .97 bti149 .91 bti166 1.04
bti30 .92 bti51 .83 bti94 .95 bti134 .90 bti185 1.04
bti7 .92 bti41 .99 bti117 .92 bti126 .87 bti167 .98
bti24 .90 bti52 .97 bti93 .93 bti132 .86 bti165 .97
bti11 .87 bti75 .95 bti106 .85 bti129 .83 bti159 .96
bti18 .83 bti44 .90 bti109 .88 bti140 .85 bti176 .96
bti29 .81 bti42 .92 bti95 .87 bti125 .84 bti181 .94
bti26 .77 bti72 .89 bti119 .81 bti131 .80 bti188 .92
bti19 .78 bti53 .78 bti99 .79 bti141 .77 bti164 .85
104
bti27 .76 bti65 .76 bti102 .69 bti154 .77 bti178 .84
bti163 .78
bti189 .74
bti174 .68
bti180 .70
bti191 .69
bti190 .65
Note. E = Extraversion; N = Neuroticism; C = Conscientiousness; O = Openness; A =
Agreeableness. Items are presented in descending order according to their OUTFIT mean squares. †
= outfit ≥ 1.40.
4.3.6.2. Person separation and reliability indices after item removal
Person separation and reliability indices are presented in Table 4.11. After flagged
item removal person separation indices ranged between 2.12 and 2.59 and person
reliability ranged between .84 and .91. This indicates that with the flagged items removed
almost no deterioration of internal consistency reliability or item/person separation
indices occurred. This means that the BTI scales after flagged item removal maintain their
ability to distinguish between test-takers with a high or low level of the personality trait
measured and does so in a stable and consistent manner.

105
Table 4.11
Person separation and reliability indices after item removal
Construct Number of items
examined
Person Separation Person Reliability α
Extraversion 23 2.12 .82 .84
Neuroticism 23 2.65 .88 .91
Conscient. 23 2.54 .89 .93
Openness 23 2.25 .84 .86
Agreeableness 29 2.59 .87 .90
Note. α = Cronbach’s alpha
4.3.6.3. Rating scale performance indices after item removal
Rating scale performance indices can be viewed in Table 4.12. Each rating scale
category demonstrated a sufficient frequency of usage by the participants after the flagged
items are removed. Outfit mean square statistics for each category of the rating scales
indicated good fit with only Conscientiousness demonstrating an aberrant outfit value for
the first rating scale category. Differences in threshold endorsability remained within the
given parameters indicating good general threshold separation.

106
Table 4.12
Rating scale performance indices after item removal
Construct Category Measure Threshold No. of Responses Percentage
of
Responses
Outfit Infit
Extraversion 1 -2.46 NONE 3010 6.68% 1.20 1.13
2 -1.09 -.99 5384 11.96% .90 .91
3 -.12 -.71 11376 25.26% .89 .92
4 1.02 .20 15651 34.76% .93 .93
5 2.76 1.49 9609 21.34% 1.05 1.07
Neuroticism 1 -2.72 NONE 15482 34.36% .98 .96
2 -1.07 -1.43 14765 32.77% .77 .93
3 .02 -.29 8786 19.50% .92 .92
4 1.08 .37 4539 10.07% 1.14 1.05
5 2.67 1.35 1490 3.31% 1.71 1.37
Conscientious. 1 -2.79 NONE 355 .79% 3.04 1.67
2 -1.36 -1.34 1281 2.84% 1.39 1.12
3 -.27 -.96 5778 12.82% 1.09 .98
4 1.26 .03 18739 41.57% .79 .88
5 3.44 2.27 18929 41.99% .93 .91
Openness 1 -2.56 NONE 2269 3.62% 1.96 1.44
2 -1.14 -1.12 5128 8.18% 1.08 1.03
3 -.14 -.70 13092 20.88% .91 .91
4 1.08 .14 23618 37.67% .84 .93

107
5 2.92 1.68 18596 29.66% .94 .92
Agreeableness 1 -2.68 NONE 1821 3.20% 2.16 1.62
2 -1.23 -1.27 4342 7.64% 1.04 1.00
3 -.15 -.77 11706 20.60% .88 .89
4 1.16 .19 22447 39.50% .81 .91
5 3.07 1.84 16513 29.06% .94 .93
The person/item distribution maps, which indicate the location of items in relation
to persons for each scale, can be viewed in Figure 4.3.5.3a (Extraversion), 4.3.5.3b
(Neuroticism), 4.3.5.3c (Conscientiousness), 4.3.5.3d (Openness), and 4.3.5.3e
(Agreeableness). Although item to person targeting remained good for Extraversion,
Neuroticism, Openness, and Agreeableness; Conscientiousness demonstrated poorer
item/person targeting at low levels of the trait.
Figure 4.3.5.3a. Person/item distribution for the core Extraversion scale

108
Figure 4.3.5.3b. Person/item distribution for the core Neuroticism scale
Figure 4.3.5.3c. Person/item distribution for the core Conscientiousness scale

109
Figure 4.3.5.3d. Person/item distribution for the core Openness scale
Figure 4.3.5.3e. Person/item distribution for the core Agreeableness scale

110
4.3.6.4. Differential item functioning after item removal
With the flagged items removed only a few items evidenced DIF by ethnicity
namely bti41 (Neuroticism); bti84 (Conscientiousness); bti162 and bti169
(Agreeableness) (refer to Table 4.13). Although these items demonstrate practically
significant uniform DIF contrasts for the Black and White groups these DIF contrasts are
only marginally above the |.40| range. It is also evident that the number of items
indicating DIF has been reduced substantially for each scale of the BTI. Since no items
demonstrated DIF > |.50| the DIF for the items of the BTI were considered acceptable.
Table 4.13
Practically significant DIF by ethnicity
Extraversion Neuroticism Conscientiousness Openness Agreeableness
Item Contrast Item Contrast Item Contrast Item Contrast Item Contrast
bti1 -.18 bti40 .38 bti81 .03 bti124 -.13 bti156 -.39
bti5 -.21 bti41† .41 bti82 .11 bti125 .17 bti158 .20
bti7 -.26 bti42 .13 bti84† .43 bti126 -.26 bti159 -.24
bti9 -.14 bti44† .40 bti87 -.29 bti127 .33 bti161 .24
bti10 .07 bti46 .24 bti93 -.05 bti129 .14 bti162† -.40
bti11 .00 bti47 -.32 bti94 -.15 bti130 -.12 bti163 -.34
bti12 .00 bti49 .00 bti95 -.27 bti131 .12 bti164 .29
bti14 -.07 bti50 .21 bti99 .33 bti132 .28 bti165 .00
bti17 .00 bti51 .38 bti100 .12 bti133 -.28 bti166 .00
bti18 -.28† bti52 -.34 bti101 .30 bti134 .31 bti167 -.18

111
bti19 -.15 bti53 .06 bti102 .07 bti135 .30 bti169† .44
bti20 .00 bti54 -.32 bti103 .39 bti137 .16 bti170 .03
bti21 .17 bti55 -.38 bti104 -.23 bti138 -.21 bti171 .00
bti22 .35 bti60 -.38 bti105 .26 bti139 .14 bti172 .12
bti24 .21 bti61 .06 bti106 -.30 bti140 -.31 bti173 .20
bti25 .23 bti63 .25 bti108 -.39 bti141 -.35 bti174 -.38
bti26 -.38 bti65 .00 bti109 -.36 bti145 -.33 bti175 -.16
bti27 -.37 bti66 .24 bti115 .00 bti146 .16 bti176† -.26
bti28 -.10 bti67 -.23 bti116 .00 bti148 -.19 bti178 .00
bti29 -.02 bti69 -.10 bti117 -.16 bti149 .00 bti180 -.22
bti30 .10 bti70 -.36 bti118 .02 bti152 .13 bti181 -.20
bti35 .30 bti72 -.15 bti119 -.09 bti153 -.16 bti183 .23
bti38 .39 bti75 .10 bti120 .15 bti154 -.26 bti184 .19
bti185 -.14
bti188 .15
bti189 -.10
bti190 .00
bti191 -.08
bti193 .24
Note.
† = practically significant uniform DIF only;
†† = practically significant uniform and non-uniform DIF
Only bti171 demonstrated practically significant DIF by gender for the
Agreeableness scale (refer to Table 4.14). Similarly, to the DIF contrasts obtained for the
ethnic groups, the DIF contrast of bti171 is marginally above the |.40| cut-off range and

112
reflects uniform DIF. Because this DIF was below the |.50| recommended cut-off, the
item was retained.
Table 4.14
Practically significant DIF by gender
Extraversion Neuroticism Conscientiousness Openness Agreeableness
Item Contrast Item Contrast Item Contrast Item Contrast Item Contrast
bti1 .27 bti40 -.13 bti81 -.03 bti124 -.08 bti156 .38
bti5 .33 bti41 .00 bti82 .00 bti125 -.25 bti158 .16
bti7 .21 bti42 -.12 bti84 -.16 bti126 -.06 bti159 .20
bti9 -.07 bti44 -.09 bti87 .20 bti127 .15 bti161 .23
bti10 -.28 bti46 .27 bti93 .12 bti129 -.02 bti162 .19
bti11 .00 bti47 .30 bti94 .30 bti130 .17 bti163 .00
bti12 -.03 bti49 -.09 bti95 .05 bti131 .12 bti164 -.02
bti14 .17 bti50 -.06 bti99 -.20 bti132 .00 bti165 .02
bti17 -.29 bti51 -.35 bti100 -.15 bti133 .18 bti166 .05
bti18 -.07 bti52 .12 bti101 -.26 bti134 -.02 bti167 .22
bti19 -.10 bti53 -.07 bti102 -.23 bti135 -.09 bti169 .13
bti20 -.16 bti54 .36 bti103 .23 bti137 -.11 bti170 .02
bti21 -.11 bti55 .31 bti104 .11 bti138 .14 bti171† -.41
bti22 -.21 bti60 .31 bti105 -.17 bti139 -.38 bti172 -.17
bti24 -.13 bti61 -.39 bti106 .00 bti140 .29 bti173 -.19
bti25 -.03 bti63 .00 bti108 .28 bti141 .14 bti174 -.25
bti26 .00 bti65 -.10 bti109 .23 bti145 -.39 bti175 .00
113
bti27 -.11 bti66 -.26 bti115 .00 bti146 -.07 bti176 .00
bti28 .00 bti67 .14 bti116 -.21 bti148 -.12 bti178 -.35
bti29 .10 bti69 .06 bti117 -.21 bti149 -.15 bti180 .05
bti30 .00 bti70 .05 bti118 -.02 bti152 .07 bti181 -.10
bti35 .11 bti72 -.17 bti119 .05 bti153 .00 bti183 .12
bti38 .23 bti75 .00 bti120 -.07 bti154 .25 bti184 .18
bti185 .02
bti188 -.20
bti189 -.20
bti190 -.15
bti191 -.38
bti193 -.07
Note.
† = practically significant uniform DIF only;
†† = practically significant uniform and non-uniform DIF
4.3.7. Cross-plotting person parameters of the full-test and the reduced test scales
An important consideration after flagged items are removed is whether the reduced
test measures the same trait as the full-length test (i.e. whether persons’ standings on the
latent trait are equivalent across the full-length and reduced tests) (Linacre, 2010).
Following the recommendations of Linacre (2010) cross-plots of person locations for the
full scales of the BTI and the reduced scales of the BTI were constructed. The standard
errors of the person location parameters (also referred to as theta and represented by θ)
were used to construct 95% confidence intervals around the cross-plots. The cross-plots

114
can be viewed below and include Figure 4.3a (Extraversion); Figure 4.3b (Neuroticism);
Figure 4.3c (Conscientiousness); Figure 4.3d (Openness) and Figure 4.3e
(Agreeableness).
Figure 4.3.6a. Cross Plot of Person Measures for the Full and Core Extraversion Scales
-3
-2
-1
0
1
2
3
4
-3 -2 -1 0 1 2 3 4 5
Per
son
Mea
sure
(E
xtr
aver
sion
Fu
ll S
cale
)
Person Measure (Extraversion Core Scale)
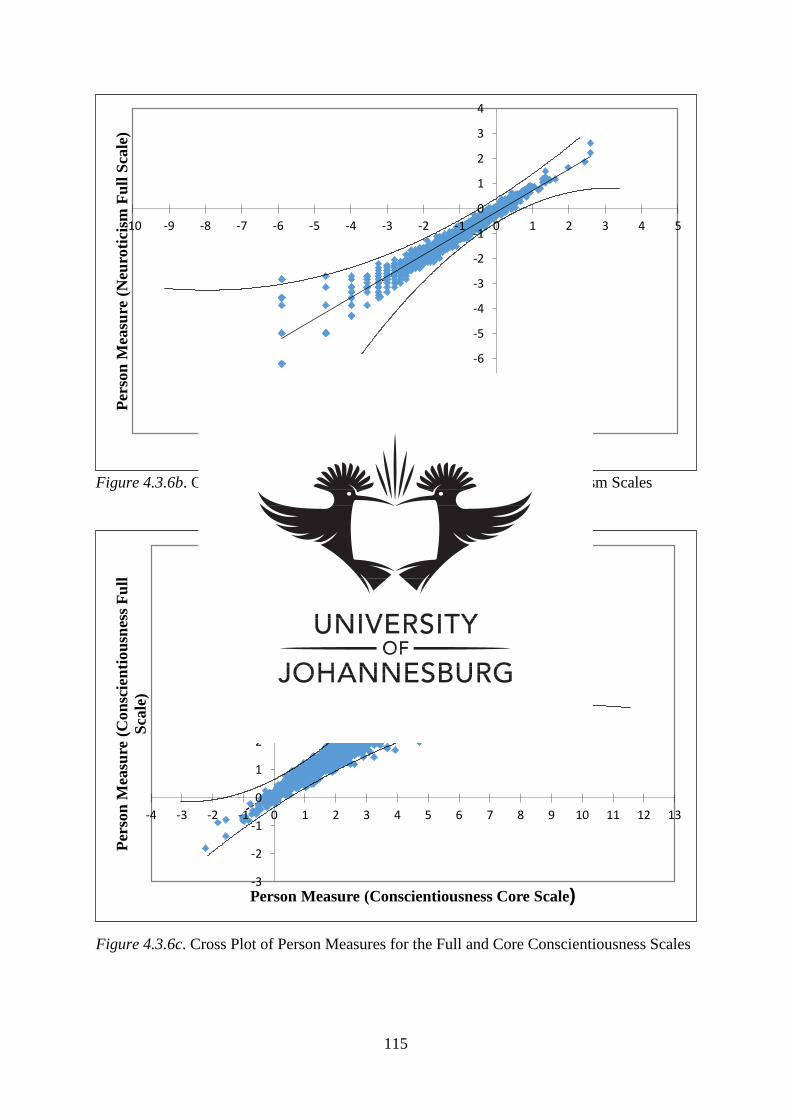
115
Figure 4.3.6b. Cross Plot of Person Measures for the Full and Core Neuroticism Scales
Figure 4.3.6c. Cross Plot of Person Measures for the Full and Core Conscientiousness Scales
-9
-8
-7
-6
-5
-4
-3
-2
-1
0
1
2
3
4
-10 -9 -8 -7 -6 -5 -4 -3 -2 -1 0 1 2 3 4 5
Per
son
Mea
sure
(N
euro
tici
sm F
ull
Sca
le)
Person Measure (Neuroticism Core Scale)
-3
-2
-1
0
1
2
3
4
5
6
7
8
9
-4 -3 -2 -1 0 1 2 3 4 5 6 7 8 9 10 11 12 13
Per
son
Mea
sure
(C
on
scie
nti
ou
snes
s F
ull
Sca
le)
Person Measure (Conscientiousness Core Scale)

116
Figure 4.3.6d. Cross Plot of Person Measures for the Full and Core Openness Scales
Figure 4.3.6e. Cross Plot of Person Measures for the Full and Core Agreeableness Scales
-4
-3
-2
-1
0
1
2
3
4
5
6
7
8
9
10
11
12
-3 -2 -1 0 1 2 3 4 5 6 7 8 9
Per
son
Mea
sure
(A
gre
eab
len
ess
Fu
ll S
cale
)
Person Measure (Agreeableness Core Scale)
-2
-1
0
1
2
3
4
5
6
7
8
9
-3 -2 -1 0 1 2 3 4 5 6 7 8 9 10 11Per
son
Mea
sure
(O
pen
nes
s F
ull
Sca
le)
Person Measure (Openness Core Scale)

117
It is evident from the cross-plots that person measures for the core scales are
generally equivalent to person measures for the full scales (i.e. very few cross-plotted
points fall outside the 95% confidence intervals).
For Extraversion most persons with trait estimates between -1.00 and 2.00 logits
demonstrated approximately equivalent trait estimates across the full and core scales
within an acceptable standard error. However, some marginal separation of person
measures appears to occur beyond 2.50 logits partly because there are fewer persons to
stably estimate trait levels at this end of the trait continuum.
Neuroticism also evidenced approximately equivalent trait estimates for person
measures across the full and reduced scales between -2.50 and 1.00 logits. The most
marked deviation occurs below -3.00 logits. This is because there are nearly no persons
with trait levels within these ranges to accurately estimate person measures.
Conscientiousness also demonstrated approximately equivalent trait estimates
across the full and core scales between -1.00 and 3.50 logits with a marked deviation of
person measures for the full and core scales above 3.50 logits. Although a number of
persons are found to have trait estimates above 3.50 logits for Conscientiousness, fewer
items are available at this level of the trait to consistently and accurately estimate person
parameters which may be responsible for the deviation.
Both Openness and Agreeableness demonstrated good equivalence for person
measures for the full and core scales between -1.00 and 2.50 logits. Deviation of person
parameters for the full and core scales above 2.50 logits for both Openness and
Agreeableness may be due to the lack of persons available at these trait levels to
accurately estimate person parameters,
118
In general, the cross-plots of person measures for the full and core scales indicate
good equivalence. Very few individuals fall outside the 95% confidence intervals and a
strong linear relationship is demonstrated between person measures for each scale.
4.4. Discussion
The primary objective of this study was to evaluate and select a set of Rasch-based
best items from each scale of the BTI for use within a computer adaptive framework. To
do so the scales of the BTI were fit to the Rasch rating scale model. Whereas previous
research has used the Rasch model for the evaluation of test-scales for classical test theory
applications this study aimed to evaluate the BTI scales using an item response theory
model for preparation for application to a computer adaptive testing framework.
Consequently, numerous Rasch diagnostic evaluations were conducted which included
the evaluation of fit statistics to determine whether the items of the BTI scales fit the
Rasch rating scale model; rating scale performance to determine whether the rating scale
structure of the BTI performed adequately so that the same rating scale structure can be
used in computer adaptive applications; item separation and reliability of scales to
determine whether each scale sufficiently separates test-takers’ across the trait continuum
and does so in a consistent manner; and finally a DIF analysis for gender and ethnicity
for each scale to determine whether items perform invariantly across different groups.
The results of these analyses will be discussed in the following sections. Possible future
improvements to the BTI for computer adaptive testing are also discussed along with the
limitations of this study.

119
4.4.1. Rasch rating scale model fit
In general, the fit of the items for each scale of the BTI, without any flagged items
removed, was satisfactory. However, some deviation was observable with slight underfit
detected. On inspection of the item fit statistics for each scale of the BTI a number of
items demonstrated aberrant outfit values. The infit was focused upon since sampling
error may inflate outfit statistics and because in computer adaptive testing item
endorsability/difficulty are generally matched closely to person trait, or ability level. This
makes infit more applicable. Numerous items that demonstrated poor infit were identified
and flagged for removal. Upon removal of these items the mean fit summary statistics for
each scale of the BTI were slightly improved. The greatest improvement was observed
with the infit mean squares and the standard deviations of the mean square values. This
indicates that with the removal of the flagged items; precision of measurement improved
for each scale of the BTI.
Inspection of the item fit statistics for each scale after flagged items were removed
indicated only a small number of possibly poor fitting items although infit and outfit mean
sqaures for these possibly problematic left-over items was marginally poor. These items
were not removed for use within the computer adaptive framework in order to conserve
the number of items in the core item bank. Also, over-removal of items may result in the
data overfitting the model, which may negatively affect the generalizability of the BTI
scales and negatively impact item spread and reliability.
4.4.2. Item spread and reliability
After flagged items were removed the person and item reliability indices showed
no marked deterioration. Although the initial reliabilities for the scales of the BTI were
satisfactory item removal may result in the deterioration of item spread and internal

120
consistency reliability. With the removal of a number of poor fitting items the reliabilities
remained robust.
Person and item spread demonstrated no marked deterioration for the core scales.
There were however, proportions of the sample that were not targeted effectively by
certain scale items. For example, Openness and Neuroticism could benefit from more
items at higher levels of the latent trait, whereas Conscientiousness could benefit from
more items targeted at lower levels of the trait. In general, however, the items of the core
scales demonstrated good spread with most scales measuring between -3.00 and 3.00
logits.
4.4.3. Rating scale performance
Rating scale performance was satisfactory for most of the BTI scales. However,
some of the rating scale categories did demonstrate underfit. The most salient of these
was the Conscientiousness scale where rating scale category one indicated poor outfit
mean squares. Although it is recommended that poorly fitting rating scale categories be
collapsed for better fit to the Rasch rating scale model the number of persons whom
indicated a low level of the trait should also be considered when investigating rating scale
fit indices. In the case of Conscientiousness, very few persons in the sample had a low
level of Conscientiousness which may have inflated outfit statistics for the lower rating
scale category. With the removal of flagged items, no substantial deterioration of the
rating scale fit indices was observed from that of the full test. Person and item separation
indices also remained within the required ranges.

121
4.4.4. DIF by ethnicity and gender
Numerous items were identified that demonstrated uniform and non-uniform DIF
by gender and ethnicity. These items were flagged for removal as DIF is a serious
limitation for computer adaptive testing. It is important to realise that practically
significant DIF is often considered only if such DIF is statistically significant and ≥ |.50|.
A decision was made to remove any items demonstrating DIF ≥ |.40| which by most
standards would be considered acceptable for inclusion in an item bank. If the items that
indicated DIF ≥ |.50| were considered, then only a few items from each scale would be
removed after the initial inspection. Only four items demonstrated practically significant
uniform DIF by ethnicity for the core scales and only one item demonstrated practically
significant uniform DIF by gender. The DIF demonstrated by these items were well below
the |.50| recommended cut-off for statistically significant DIF contrasts. It was therefore
decided to retain these items in order to save as many items as possible for our core item
bank.
4.4.5. Conclusion
Overall the scales of the BTI tend to fit the Rasch rating scale model sufficiently
well. However, as computer adaptive tests use fewer items in varying orders for each test-
taker, and are thus much more reliant on the psychometric properties of individual items,
the scales of the BTI were further refined for use as a computer adaptive test. Poor fitting
items that also demonstrated DIF by either gender or ethnicity were removed from each
scale of the BTI so that a core set of items could be identified. This process has improved
the fit of the BTI to the Rasch rating scale model and has also ensured that most of the
items of the BTI scales remain invariant across groups. However, the fit to the Rasch
rating scale model was not perfect with a small number of items showing marginal

122
underfit for the core scales. There were also some items of the core scales that indicated
marginal DIF for ethnicity and gender.
Although most of the deviations from the Rasch rating scale model can be
explained by possible sampling effects, the true performance of the items retained can
only be evaluated through computer adaptive test simulation where person estimates for
the full non-adaptive test are compared for equivalence. However, an encompassing
analysis of the fit of the BTI scales to the Rasch rating scale model has allowed for
improvement of each scale for computer adaptive application. In this regard the items
retained after evaluation with the Rasch rating scale model have improved the chances
that the computer adaptive version of the test using these selected items will function as
optimally as possible. The evaluation has also acted as a benchmark for the psychometric
properties of the BTI which can now be compared to future analyses for computer
adaptive test improvement.
There are however some limitations to this study that need to be addressed. Firstly,
only the Black and White ethnic groups were compared for DIF by ethnicity.
Unfortunately, the sample used for the study did not have sufficient persons for a
comprehensive DIF analysis with the Coloured and Indian ethnic groups. DIF with these
ethnic groups needs to form part of a future study on the item bank of the BTI so that
items indicating DIF for these groups can be identified and removed. Secondly, item
spread and item/person targeting was sufficient but not perfect for computer adaptive item
banking. Numerous items in the Openness, Neuroticism and Conscientiousness scales
will need to be written to target persons with certain levels if the trait more effectively.
Finally, item banks for computer adaptive testing are usually quite large with a sufficient
number of items generated for parallel items to be used in computer adaptive test
applications. Such parallel item banks are necessary to ensure sufficient item exposure

123
for data collection purposes and also for items to not be overused within a computer
adaptive framework. The number of items for each scale of the BTI may need to be
increased at some stage so that alternate form computer adaptive testing can become
possible. It is therefore strongly recommended that more items are written for each scale
of the BTI to ensure proper item exposure for each core item bank when the test is used
in praxis.
In summary, the BTI core scales appear to have satisfactory Rasch rating scale
model fit for use within a computer adaptive testing framework. It is however
recommended that fit to the Rasch rating scale model be replicated with other samples so
that consistently poor functioning items can be removed.
4.5. Overview of the current chapter and preview of the forthcoming chapter
This chapter investigated the fit of each of the BTI scales to the Rasch rating scale
model so that only the best performing items could be selected for use within a computer
adaptive testing framework. Numerous items (59 items) were flagged as possibly
problematic and were consequently removed from the scales of the BTI. In this way only
the best functioning items were retained for use within a computer adaptive testing
framework for each scale of the BTI. The retained items are referred to as the core item
bank. The core item bank will be used in a computer adaptive testing framework to
estimate person parameters in a simulated manner for each scale of the BTI. These person
parameters are then compared to the non-adaptive version of the core item bank in order
to determine whether the adaptive version of the test is equivalent to its non-adaptive
counterpart. The adaptive core item bank will then be compared to both the adaptive and
non-adaptive versions of the full test in order to determine whether the efficiency garnered

124
by the core item bank also included equivalence to the original non-adaptive full-form
test for each BTI scale.
125
CHAPTER 5: AN EVALUATION OF THE COMPUTER ADAPTIVE BTI
“In principle, tests have always been constructed to meet the requirements of test givers and
the expected performance-levels of the test candidates…giving a test that is much too easy for
candidates is likely to be a waste of time…on the other hand, questions that are much too
hard, also produce generally uninformative test results…” Michael Linacre (2000, pg. 4).
5.1. Introduction
The purpose of this study is to simulate the Basic Traits Inventory as a computer
adaptive test for psychometric comparison with its non-computer adaptive counterpart.
The objectives of this study are thus two-fold: 1) to simulate the scales of the BTI as
computer adaptive tests, and 2) to compare the performance and functioning of the
computer adaptive BTI scales to their non-adaptive paper and pencil versions. The
primary purpose of this comparison is to determine whether the computer adaptive test
versions of the BTI scales are metrically equivalent to the non-adaptive paper and pencil
versions of the BTI scales. Metric equivalence between the computer adaptive test scales
and their non-adaptive paper and pencil counterparts is an important step in the
development of a computer adaptive test as it evaluates whether the computer adaptive
test estimates person parameters – the individual test-takers’ standing on the latent trait –
in a similar manner to the non-adaptive test. As the BTI non-adaptive test has been widely
evaluated for validity, reliability and test-fairness in the literature (Grobler, 2014; Metzer
et al., 2014; Taylor & de Bruin, 2006, 2012, 2013; Taylor, 2008) it can be used as a ‘gold
standard’ for the evaluation of the BTI computer adaptive test-scales.

126
Additionally, computer adaptive test simulation can also be used to evaluate the
performance of the computer adaptive BTI test-scales (i.e., item usage, efficiency, and
measurement precision) for direct comparison the non-adaptive BTI scales.
This chapter begins by giving an overview of computer adaptive test simulation
and the computer adaptive algorithms that are implemented in the computer adaptive
testing process. Then the BTI computer adaptive test-scales are compared to their non-
adaptive counterparts through computer adaptive test simulation. This chapter concludes
by evaluating the feasibility considerations of implementing a computer adaptive version
of the BTI and a discussion of the implications for adaptive testing in industry are also
provided.
5.1.1. Computer adaptive test simulation
Computer adaptive test simulation is a process by which items from a non-adaptive
full-form test – the original paper and pencil version of the test – with associated
respondent data, is scored as if in an adaptive manner using a computer adaptive testing
framework (Smits et al., 2011). The computer adaptive framework has pre-specified
algorithms that select and administer each item, based on its pre-calibrated item location
estimate on the latent construct of interest, for simulated administration to the sample of
test-takers (Choi, Reise, Pilkonis, Hays, & Cella (2010b).
Items are in fact not administered in ‘real time’ in the computer adaptive version
of the BTI scales, but are evaluated as if they are adaptive (Choi et al., 2010b). Since all
the response options for each item has already been made in the non-adaptive version of
the test, these response options are used to artificially select items for adaptive
administration in the simulated computer adaptive versions of the BTI scales (Lai et al.,
2003).

127
Therefore, the simulated computer adaptive versions of the BTI scales select items
based on the prior responses of test-takers on the non-adaptive test and also estimate test-
takers’ standing on the latent trait independently from the non-adaptive versions of the
test scales (Dodd, de Ayala, & Koch 1995). Additionally, the computer adaptive test
scales estimate person location parameters with a pre-specified error of estimation, which
gives an indication of the precision of measurement (Weiss, 2004). Additionally, this
adaptive testing process allows real world simulation of a scale as a computer adaptive
test, which allows for direct comparisons between the adaptive and non-adaptive BTI
scales (Reise et al., 2010).
Computer adaptive simulation also establishes construct validity of the computer
adaptive test and allows numerous additional feasibility evaluations to take place (Dodd
et al., 1995; Walter et al., 2007). For example, an evaluation of the number of items used
to estimate person location estimates can be demonstrated and contrasted with the non-
computer adaptive test scale versions (Wang & Shin, 2010; Ware et al., 2000). The
equivalence between the person parameter estimates estimated by the computer adaptive
test and the non-computer adaptive test can also be established (Haley et al., 2006).
Finally, the item exposure rate and the item information functions can be evaluated for
the computer adaptive test-scales in relation to their accuracy – the correlation of person
estimates between the computer adaptive and non-computer adaptive versions of the test
– and its precision as measured through the standard error of person parameter estimates
(Haley et al., 2006).
These evaluations are pivotal for the development of a computer adaptive test as
they demonstrate whether the results obtained using an item-bank in a computer adaptive
manner can be as accurate, precise and efficient as the results obtained from non-
computer adaptive test scales (Wang & Shin, 2010).

128
Before comparisons are made between the computer adaptive BTI scales and their
non-adaptive counterparts, a brief overview of computer adaptive testing and item banks
are given in the next section. Further elaboration is provided on the computer adaptive
test simulation procedures and some evaluative criteria for the evaluation of a computer
adaptive test are also included.
5.1.2. Item banks used in computer adaptive testing
All computer adaptive tests make use of an item bank from which the computer
algorithms select items for administration (Bjorner, Kosinski, & Ware, 2005; Eggen,
2012). All the items in an item bank have difficulty/endorsability estimates – also referred
to as item location parameters/estimates – which have been psychometrically calibrated
through the application of an item response theory model to the data (Linacre, 2000;
Weiss, 2004). Although an item bank is a conglomeration of items; each cluster of items
has a well-defined construct to which the items are attached (Gu & Reckase, 2007).
Therefore, an item bank can be defined as set of items, each of which measures a single
latent construct that have been calibrated psychometrically so that the sets of items in the
item bank measure across a continuum of a single common dimension and in which each
item can be used for independent administration based on the responses of test-takers (Gu
& Reckase, 2007; Lai et al., 2003; Weiss, 2004).
Therefore, each item in an item bank needs to measure a unidimensional construct
across the construct continuum – from lower ability/trait levels to higher ability/trait
levels – and be capable of doing so in an invariant manner (Haley et al., 2006). What is
most important is that each item has an associated item location estimate that has been
established with a calibration sample usually within an item response theory model
(Thompson & Weiss, 2011). These are referred to as the item location parameters and

129
give an indication of the items’ standing on the latent construct under investigation based
on a particular calibration sample (Gershon, 2004). However, developing item parameters
is not limited to item response theory models and the reader is referred to the use of
categorical confirmatory factor analytic procedures that can be used to construct item
parameters (cf. Maydeu-Olivares, 2001; Muthén, 1984).
The generation of item parameters presupposes that each item bank must go
through an item-calibration stage where the item-data are fit to an item response theory
model, or categorical confirmatory factor analytic model. During the item calibration
stage items must be shown to (1) measure a single latent construct only; (2) have a good
spread of measurement across the latent construct continuum and (3) have item
parameters which remain invariant across different groups of test-takers (Gu & Reckase,
2007). Any item that does not meet these requirements must be eliminated from the item
bank before computer adaptive testing can commence. This is because items that do not
meet these requirements will estimate person location parameters in a biased manner
without the necessary precision or accuracy required for stable latent construct estimation
(Gu & Reckase, 2007).
The primary reasons why item banks must meet these criteria relates to the
processes followed in computer adaptive testing. These processes are discussed in the
next section.
5.1.3. Computer adaptive testing
Computer adaptive testing is a process by which items are selected for
administration from an item bank through the use of a computer algorithm so that the
information that is garnered by the test-takers’ responses are optimised in order to
precisely and accurately estimate the latent trait – person location parameters – of test-

130
takers (Lai et al., 2003). In other words, each test-taker is administered a pre-specified
item, or items, to which the test-takers respond (Gershon, 2004). Each response allows an
interim person location estimate – known as the person parameter estimate – to be
generated of the test-taker’s relative standing (location) on the latent construct within
approximate standard error (Veldkamp, 2003). The items of an adaptive scale are
administered so that the estimated person location parameters are estimated with the
lowest possible standard error and the highest possible item information function (Choi
et al., 2010a).
Thus, each consequent item is selected to minimise the standard error of the person
parameter estimation and maximise the information regarding the test-taker’s standing on
the latent construct through the use of various item selection criteria and person parameter
estimation methods (Eggen, 2012; Hol et al., 2005; van der Linden & Pashley 2000). The
number of items selected for administration in the adaptive scale will therefore be
dependent on how quickly a person’s location on the latent construct can be attained
within an acceptable standard error (Choi et al., 2010a).
In most cases the test-taker’s estimated standing on the latent trait will become
increasingly precise with each successive item administered, which is due to a decreased
standard error of the person parameter estimates and thus improvement in the precision
of person location estimation (van der Linden & Pashley, 2000). Usually, computer
adaptive tests will stop administering items when the standard error of the person location
parameter estimates reaches a certain minimum or acceptable level and the test
information function is maximised (Choi et al., 2010a).
The number of items administered, as well as the precision of measurement, is
greatly dependent on the person and item parameter location relative to one another (Choi,
2009). The better the match between these two elements (ongoing within the adaptive

131
process), the quicker and more precise the person parameters can be estimated. To
maximise the precision with which person parameters are estimated, and reduce the
number of items required to estimate these parameters with specified accuracy, the most
optimal item selection rules must be applied. The next section discusses some of the item
selection rules that can be applied to maximise the precision of person parameter
estimation while maximising the efficiency of the items administered.
5.1.3.1. Item selection rules in computer adaptive testing
It is important to realise that administration of particular items is variable and
based on the prior responses of each test-taker to each administered item. Hol et al. (2005)
explain that the process of item selection usually happens using the variable step size
method where each response to an item provides an associated interim person parameter
estimate which informs item selection for the next administered item. This method selects
an item with an interim estimated item location value that is approximately equal to the
person location parameter estimated from the administration of the previous item (Choi
et al., 2010a; Hobson, 2015). In this way no two administrations of a computer adaptive
test are exactly the same for all test-takers in that each item selected for administration
from the item bank is based wholly on the person responses to each prior item
administered (Weiss, 2004). The core aim of a computer adaptive test is therefore to
match person location estimates with item location estimates in order to obtain the most
precise final person location estimate (Hobson, 2015). This process is relatively universal
for most computer adaptive tests although the algorithms employed do differ regarding
the estimators and item selection criteria used to estimate person location parameters.
Additionally, items of each scale can be administered interchangeably as long as each
interim person parameter is linked to a specified item bank, or scale.

132
There are numerous algorithms available for computer adaptive tests which govern
item selection rules and person parameter estimation methods (cf. Choi, 2009; Gu &
Reckase, 2007; van der Linden & Pashley, 2000). However, the most popular criteria for
item selection in computer adaptive testing is the maximum information criterion
developed by Brown and Weiss (1977) and the maximum posterior precision criterion
developed by Owen (1975) using a maximum likelihood estimator (Gu & Reckase, 2007).
In general, the maximum information criterion – also referred to as the maximum Fisher
information criterion – selects items that maximises the information function when the
current person location parameter for a test-taker is being estimated (Gu & Reckase,
2007). The maximum information criterion allows for an ever increasing precision of
person parameter estimation with the successive administration of each item (Gu &
Reckase, 2007).
The maximum posterior precision criterion is similar to the maximum information
criterion except that the item selection process focuses on minimising the posterior
variance of the person location estimator (van der Linden, 1998). There are other item
selection and estimation criteria such as the maximum global-information criterion; the
likelihood-weighted information criterion; the maximum expected posterior weighted
information criterion; the maximum interval information criterion; the posterior expected
Kullback-Leibler information criterion; and the Bayesian collateral information criterion
to name a few (Choi & Swartz, 2009; Gu & Reckase, 2007; van der Linden, 1998; van
der Linden & Pashley, 2000; Veldkamp, 2003). The purpose of this study is not to give
an overview of the criteria or estimators used for item selection and person location
estimation. For a more in-depth discussion of the criteria for item selection and the
estimators used in computer adaptive tests refer to Gu and Reckase (2007); van der
Linden (1998); and van der Linden and Pashley (2000).

133
It is important to note however that Choi and Swartz (2010) found no substantial
difference in the person estimates or efficiency of item selection for more advanced and
complex item selection and person parameter estimation techniques used with
polytomous items. Similarly, van der Linden and Pashley (2000) also demonstrated that
when more than ten items are administered in computer adaptive testing with
dichotomous items, the person parameter estimates and item efficiency are similar for
most Bayesian item selection criteria. These criteria include the maximum expected
posterior weighted information; the maximum expected information; and the minimum
expected posterior variance.
However, Penfield (2006) demonstrated that the simpler maximum posterior
weighted information criterion outperformed the popular maximum Fisher information
criterion and performed similarly to more advanced Bayesian methods such as the
maximum expected information criterion. Choi and Swartz (2009) also demonstrated that
the maximum posterior weighted information is an accurate and precise item selection
criterion for polytomous items when compared to the more advanced and complex
Bayesian criteria. The maximum posterior weighted information criterion is also utilised
extensively with computer adaptive tests that use polytomous item responses and in which
there may be uncertainty about the initial precision of person parameter estimates (Choi
et al., 2010b). This criterion is often used with two-stage branching where an initial
item(s) in an item bank is administered to all the test takers after which the remainder of
the items are administered adaptively (Choi et al., 2010b).
Such a two stage branching process allows a single item – or a number of items –
that have the highest information function to be used for more accurate initial person
location estimation which is advantageous when the most precise and accurate person
location estimates are desired (Choi et al., 2010b).
134
For these reasons the maximum posterior weighted information criterion may be
the best suited criterion to use with polytomous personality or attitudinal inventory items.
The posterior weighted information criterion was therefore used in this study as the items
adhere to these characteristics and the method provides the best estimation for
polytomous items.
In summary therefore, computer adaptive tests select items from an item bank for
administration based on the preliminary person parameter estimation of individual test-
takers through the use of specified item-selection criteria. However, where computer
adaptive tests do differ substantially from one another is with their respective stopping
rules (Babcock & Weiss, 2009).
5.1.3.2. Stopping rules in computer adaptive testing
A stopping rule is an algorithm that instructs the computer adaptive test to stop
administering additional items to a test-taker once a certain precision of measurement –
or some other in-test criteria – has been attained (Babcock & Weiss, 2009). Stopping rules
are also referred to as termination criteria (Babcock & Weiss, 2009; Choi et al., 2010a).
Usually stopping rules are set in variable-length computer adaptive tests when the
standard error of the person parameter estimate reaches and acceptable level, or if the
remaining unadministered items in the item bank add very little information beyond the
items already administered (Choi et al., 2010a). Alternatively, all the items in an item
bank can be used in an adaptive manner which is usually the case in fixed-length computer
adaptive tests (Babcock & Weiss, 2009).
The most commonly used stopping rule for computer adaptive tests is the standard
error criterion (Choi et al., 2010a; Hogan, 2014). This method instructs the test to stop
administering items when the person parameter estimate of a particular test-taker has been
135
estimated within a minimally acceptable standard error (Zhou, 2012) or if successive
items administered add little cumulative information – or result in minimal improvement
in the standard error of the parameter estimates – than the previously administered items
(Babcock & Weiss, 2009). The major advantage of the standard error stopping rule is that
each person’s parameter estimate needs to be estimated with a certain precision before
the adaptive test-scale stops administering items. The standard error stopping rule thus
tries to ensure that a certain acceptable precision of measurement is achieved for each
test-taker.
Although the standard error criterion is popular, it may undermine the efficiency
of computer adaptive tests because not all person parameter estimates may meet the pre-
specified standard error no matter how many items are administered (Choi et al., 2010b).
This is most prevalent for persons who have a standing on the latent trait that are not well
targeted to the item location parameters of the items in the item bank (Segall, 2005; Segall
& Moreno, 1999). In such cases, all the items in the item bank are often used to estimate
person parameters while these parameters are often not estimated with an acceptable level
of precision. A way to remedy this lack of precision is to write more items that improve
the spread of the item parameters across the construct continuum (Ortner, 2008).
Therefore, the effectiveness of the standard error technique is bolstered or hampered by
the quality and spread of the items in the item bank and the degree to which such items
are targeted, or matched, to person trait levels (Ortner, 2008).
5.1.3.3. Evaluation of computer adaptive test performance
It is evident from the characteristics and processes employed in computer adaptive
testing that the technique diverges greatly from standard fixed length non-adaptive testing
process (Thompson & Way, 2007). Because of this, item banks need to adhere to the

136
requirements set out in section 5.1.2 so that person parameter estimation is as error free
and unbiased as possible. It is also important that computer adaptive tests are compared
to their non-computer adaptive counterparts to determine whether such tests are able to
estimate the standing of persons on the latent trait in an equivalent manner to the non-
computer adaptive tests (Hol et al., 2008). Since the non-adaptive versions of computer
adaptive tests are often well researched with good psychometric properties; comparing
the person parameter estimates of the computer adaptive test-scales to the estimates
procured from the non-adaptive test helps to establish the validity of the computer
adaptive test-scales (Hol et al., 2008). Therefore, the person location estimates of the non-
adaptive test scales provide a benchmark, or ‘gold standard’, for determining whether the
computer adaptive test can attain the same, or similar, person parameter estimates with
greater item efficiency (Vispoel, Rocklin, & Wang, 1994). This is especially important
when applying preselected item selection criteria and stopping rules so that the
effectiveness of these algorithms can be determined.
What is also important is the comparison of a computer adaptive optimised item
bank (a computer adaptive test with fewer, optimised, items than the full-form test) to the
computer adaptive full un-optimised item bank. The optimised item bank refers to items
that have been evaluated for dimensionality, and fit to an item response theory model
(refer to Chapter 3 and Chapter 4). More importantly, an optimised item bank is one where
the criterion of invariant measurement is met so that any items that demonstrate
differential item functioning across trait levels for certain groups of people (i.e., groups
of different ethnicity, gender, first language etc.) are eliminated from the test (refer to
Chapter 4). It is important to compare the computer adaptive functioning of the optimised
item bank to both the non-computer adaptive full form test and the un-optimised full form
computer adaptive item bank so that its performance and efficiency can be established

137
within a computer adaptive framework (Choi et al., 2010b). The reason why the optimised
and un-optimised adaptive and non-adaptive test scales are compared to one another is to
determine whether the removal of poor fitting items –items than demonstrate differential
item functioning or poor fit to the Rasch rating scale model – improves or deteriorates the
precision and accuracy of person location estimation. This precision and accuracy is
usually inferred from the degree of deviation that the person parameter estimates
demonstrate - in the adaptive tests – when compared to the person parameters obtained in
the non-adaptive full form test which, as mentioned earlier, acts as a benchmark
(Thompson & Weiss, 2011). Computer adaptive tests that make use of an un-optimised
item bank often estimate person location parameters with less precision and accuracy than
those with an optimised item-bank (Veldkamp & van der Linden, 2000). This is because
computer adaptive tests are notoriously sensitive to poor functioning items (i.e.,
multidimensionality and differential item functioning) as person location estimation is
based on interim trait location estimates which in turn inform subsequent item selection
in the computer adaptive process (Weiss, 2011; Wise & Kingsbury, 2000). Consequently,
a single poor item can result in imprecise and inaccurate interim person parameter
estimates that may result in the selection and administration of items that do not closely
match the test-takers true trait estimate thus increasing the standard error of the interim
and final person trait estimates (Wise & Kingsbury, 2000). Therefore, testing the
dimensionality and calibrating items using an item response theory model are important
steps that need to be taken before an item bank can be used in a computer adaptive manner
(Linacre, 2000).
Using the most popular criteria, or algorithms, mentioned earlier, a computer
adaptive test also has to be evaluated in terms of its precision, accuracy and efficiency
when compared to its non-computer adaptive counterpart – this also includes the

138
evaluation and comparison of the adaptive un-optimised item bank. A way to evaluate
how a computer adaptive test with an optimised item bank compares to its non-computer
adaptive and un-optimised computer adaptive counterpart is to simulate the process with
real respondent data and compare the results of such computer adaptive test simulation
across the different test forms (Choi et al., 2010a). This process is discussed in the next
section.
5.1.3.4. Simulating a computer adaptive test
Simulation of a computer adaptive test with ‘real’ respondent data is somewhat of
a misnomer. This is because the process of simulation is almost entirely similar to real-
world administration of a computer adaptive test. The only difference between computer
adaptive test simulation and real-world computer adaptive testing is that responses in a
simulated computer adaptive test are taken from the full form non-adaptive test data (after
all the responses are garneted for all the items on the full fixed form test) and run within
the computer adaptive framework, whereas in real-time computer adaptive testing
responses to the items happen in real-time as the test-takers are tested (Hart et al., 2006;
Smits et al., 2011). In other words, a real-world computer adaptive test will administer
items to a respondent and select the next item based on the respondents’ responses in real-
time (Fliege et al., 2005). On the other hand, in computer adaptive test simulation test-
takers complete the non-computer adaptive test and their responses are used post hoc to
simulate the computer adaptive test as if its items were being used adaptively in real-time
(Hogan, 2014). There are other simulation techniques such as generating a simulated
number of respondents with varying trait levels and then using these simulated person
parameter estimates in a computer adaptive testing framework (Fliege et al., 2005; Walter
et al., 2007). However, simulating test-taker responses, and their standing on the latent

139
trait, is a technique that is further removed from real-time testing and thus simulating
computer adaptive tests with real respondent data is considered a closer approximation to
real-time computer adaptive testing. In essence, simulating the test-taker’s standing on
the latent trait is more akin to a true simulation of a computer adaptive test which is why
this technique is used in this study (Wang, Bo-Pan, & Harris, 1999).
The two processes, computer adaptive test simulation with real respondent data
and real-world computer adaptive testing, only differ in respect to the test-takers’
probable psychological reaction when given items that are targeted to their pre-estimated
trait level in real-world setting (Ortner & Caspers, 2011). This is because the fixed form
non-adaptive test gives each participant the same items in a sequential order whereas the
computer adaptive test selects the most applicable items for the test-taker from prior
responses to the items administered (i.e., items are selected based on the interim person
parameter estimates estimated with the administration of previous items). Thus, computer
adaptive test simulation uses the responses to items which have been garnered from a
non-computer adaptive fixed form test which is then applied to a computer adaptive
testing framework with its associated algorithms (Hart et al., 2006).
Consequently, the researcher has no information on how the test-takers may have
reacted psychologically to the mode of testing and whether this has an impact on the trait
estimates attained through computer adaptive testing. This is because the test-takers do
not actually complete the test in an adaptive manner, only their responses are used from
the fixed form non-adaptive version of the test.
The literature does indicate that test-mode differences can affect results. For
example, Ortner and Caspers (2011) found that there were significant differences between
the ability scores of test-takers with higher anxiety levels than those with lower anxiety
levels when administered a computer adaptive test of ability. Hart et al. (2006) also admit

140
that the mode of testing may play a role in the responses test-takers give to items
administered in a real-world computer adaptive test. Therefore, the only limitation of
using a simulated computer adaptive test with real post hoc respondent data to evaluate a
computer adaptive test is that the psychological impact of the mode of testing is not
evaluated.
However, computer adaptive test simulation is still very useful for the comparison
of computer adaptive test-scales with optimised item banks to their non-computer
adaptive test-scale counterparts. Additionally, the computer adaptive test with an un-
optimised item-bank can also be compared to its optimised counterpart to determine how
the item optimisation process has altered measurement.
Another mitigating factor regarding psychological test-mode differences is that
these differences may be less amplified with attitudinal measures, such as personality
tests, where the test-taker is responding to questions about their character and behaviour.
This is contrasted with computer adaptive ability testing where test-anxiety is more far
more pronounced and where the effects of the mode of testing may be more amplified
(Ortner & Caspers, 2011).
Notwithstanding the effect of the mode of testing, computer adaptive test
simulation remains a very useful technique for the evaluation and comparison – to the
fixed form test – of the psychometric properties of a computer adaptive test. Some of the
comparisons that can be made using such a technique include: (a) to what degree the
computer adaptive test scales with optimised item banks recover the trait estimates of the
non-computer adaptive test-scales; (b) how efficient, in terms of item usage, the computer
adaptive test with an optimised item bank is when compared to its non-computer adaptive
counterpart; and (c) whether the administration of items in a computer adaptive manner

141
estimates respondents’ standings on the latent trait equivalently to the fixed form test and
whether it does so with rigorous precision.
Against this background, the current study aims to evaluate the computer adaptive
version of each scale of the BTI with their non-computer adaptive counterparts as well as
the full-form un-optimised computer adaptive versions. Therefore, this study compared
the psychometric properties and person parameter estimates of four different test-forms
of the scales of the BTI, namely: (1) the non-adaptive optimised item banks calibrated in
Chapter 4 (referred to as the non-adaptive core test-scale versions); (2) the computer
adaptive optimised item banks (referred to as the adaptive core test-scale versions); (3)
the non-computer adaptive full form item banks (referred to as the non-adaptive full test-
scale versions); and (4) the computer adaptive un-optimised full form item banks (referred
to as the adaptive full test-scale versions). These four test versions of the BTI were
investigated for each scale of the inventory, namely Extraversion, Neuroticism,
Conscientiousness, Openness, and Agreeableness.
The primary objectives and stages of investigation of this study were therefore to
(1) compare the non-adaptive core test-scales of the BTI with the non-adaptive full test-
scales; (2) compare the adaptive core test-scales with the non-adaptive core test-scales;
(3) compare the adaptive full test-scales with the non-adaptive full test-scales; (4)
compare the adaptive full test-scales with the non-adaptive core test-scales; (5) compare
the adaptive core test-scales with the non-adaptive full test-scales; and (6) compare the
adaptive full test-scales with the adaptive core test-scales. These steps will be discussed
in more depth in the method section of this chapter.
142
5.2. Method
5.2.1. Participants
Participants were selected from an existing database of working adults tested for
development and selection purposes. Consequently, the sample was drawn using the
convenience sampling method. The sample was composed of 1,962 South African adults who
completed the non-adaptive full version of the BTI. Participants represented men (62%) and
women (38%) with a mean age of 33 years (SD = 9.08, Md = 33 years) from various provinces
in South Africa. Ethnically, participants were composed of Black (54%), White (36%), Mixed
Race (6%) and Asian (4%) ethnicities. All participants completed the BTI in English.
5.2.2. Instrument
The BTI items makes use of a five-point Likert-type polytomous response scale
with response options that range from (1) ‘Strongly Disagree’ to (5) ‘Strongly Agree’
(Taylor & de Bruin, 2006, 2013). The BTI demonstrated satisfactory reliability on the
scale level with each of the five scales yielding Cronbach alpha coefficients above .87
across different South African ethnic groups (Taylor & de Bruin, 2013). Further factor
analyses indicated good congruence between the factor structures for Black and White
groups in South Africa with Tucker’s phi coefficients > .93 for the five scales (Taylor &
de Bruin, 2013).
Each scale of the BTI was further shortened and optimised by fitting the scales to
the Rasch rating scale model (refer to Chapter 4). A shortened optimised version of each
test-scale, which is composed of the core item banks to be used for computer adaptive
testing, was thus developed. Four of the five core scale were composed of 23 items,
namely for Extraversion, Neuroticism, Conscientiousness and Openness respectively
with Agreeableness optimised to 29 items. The original scales were composed of 36 items

143
for Extraversion, 34 items for Neuroticism, 41 items for Conscientiousness, 32 items for
Openness, and 37 items for Agreeableness. The core test-scale versions were thus
considerably shorter than the original fixed form test scales. The items for the core test-
scales were selected based on their fit to the Rasch rating scale model and a lack of any
practically and statistically significant differential item functioning. Item and person
parameters for the non-adaptive full test-scales and the non-adaptive core test-scales were
generated so that these parameters could be compared with the person parameters
estimated in the non-computer adaptive fixed form test versions.
5.2.3. Data Analysis
Computer adaptive test simulations were conducted using the Firestar computer
adaptive testing simulation software program version 1.2.2 developed by Choi (2009).
The Firestar computer adaptive simulation software uses the R framework (R Core Team,
2013) for statistical computing. This framework was used to generate adaptive core and
adaptive full person parameter estimates for comparison. Item parameters, person
responses, and person parameters were generated for the non-adaptive full version and
the non-adaptive core item bank for each scale of the BTI using the Rasch rating scale
model in Winsteps 3.81 (Linacre, 2014). Item parameters, person responses and person
parameters were then input into the Firstar framework for computer adaptive test
simulation using pre-selected item selection, person parameter estimation and stopping
rules. These rules are briefly discussed in the following sections.
5.2.3.1. Item selection rules
For computer adaptive test simulation, the maximum posterior weighted
information criterion was used (van der Linden, 1998) for item selection with an expected

144
a priori estimator (Bock & Mislevy, 1982) as recommended by Choi et al. (2010) for use
with polytomous items (refer to section 5.1.3.1). The two-stage branching technique was
used, where a single fixed item with the highest information function based on the
posterior distribution of items was administered to all respondents before the remaining
items were administered adaptively. The two-stage branching technique allows interim
person parameter estimates to be more precisely estimated and is recommended for use
with items that use a polytomous responses, or with test scales where interim person
parameter estimation may be unreliable (Choi et al., 2010a).
5.2.3.2. Selection of item response theory model
All computer adaptive test simulations were conducted using item and person
parameter estimates obtained with the Rasch rating scale model (Wright & Douglas,
1986), which is a special case of the partial credit model where item discrimination
parameters are held constant and rating thresholds are constrained to be equidistant across
all the items of a scale (Andrich, 1978). This was done in the Firestar computer adaptive
testing framework by setting the item parameter discrimination index to one for all items
and using the Generalized Partial Credit Model option (GPCM, Choi, 2009).
5.2.3.3. Selection of stopping rules
Stopping rules were based on the standard error of person parameter estimates
where the computer adaptive test would stop administering items once an acceptable level
of measurement error for the person trait estimates was attained (Choi et al., 2009). The
standard error of person parameter estimation criterion used in item response theory is
related to the reliability of a test-scale in classical test theory where a measurement scale
with an internal consistency reliability of .90 corresponds to a standard error of about .33
145
(Rudner, 2014). Therefore, the standard error stopping rule was set to .30 in order to
estimate person parameter values as precisely as possible. It should therefore be noted
that the standard error of person parameter estimation was set to a very stringent level.
Wang and Shin (2010) recommends that for most test-takers their estimated person
parameters should fall within the 95% confidence intervals within a specified standard
error for acceptable precision of person parameter estimation. The standard error of the
parameter estimates stopping rule was used instead of the maximum information
termination criterion because this technique allows for more precise person-parameter
estimation (Wang & Shin, 2010).
5.2.3.4. Evaluation criteria for the computer adaptive test versions
The Pearson product moment correlation between person parameter estimates for
the various test forms (i.e., adaptive core, non-adaptive core, non-adaptive full and
adaptive full) was used to establish how well the adaptive core test-scales functioned.
According to Hol et al. (2008) and Wang & Shin (2010) a correlation ≥ .90 between
person parameter estimates generate for the adaptive and non-adaptive test-scale versions
reflect a high level of person parameter equivalence between these test form versions.
The shared variance between person parameter estimates (𝑅2) was also calculated to
compare between the person parameter estimates of various test forms.
5.2.3.4.1. Comparison 1: Comparing the non-adaptive core to the non-
adaptive full test-scales
The first step was to evaluate the correlations between the person parameter
estimates of the non-adaptive core test-scales with the non-adaptive full test-scales of the
BTI because this allows us to establish a baseline on the equivalence of the two non-

146
computer adaptive forms of the BTI scales. Equivalence between these two forms
indicates that the two test-scale forms measure the same construct despite the fact that
fewer items are available in the core versions. In essence, this first comparison helps to
eliminate the possibility that the shortened and optimised nature of the core test-scales
changed the estimation of person parameters substantially and thus allowed us to control
for this when investigating other properties such as the effect of adaptive administration.
5.2.3.4.2. Comparison 2: Comparing the adaptive and non-adaptive versions of
the test
Secondly, the correlation of the person parameter estimates of the adaptive core
version of the test-scales were evaluated against the corresponding non-adaptive core test-
scale counterparts. The same procedure was used with the adaptive full test-scales and
their non-adaptive full test-scale counterparts. This helped to determine to what degree
the adaptive nature of the test-scales possibly altered the psychometric properties of these
scales. Therefore, if equivalence between the person parameter estimates of the adaptive
and non-adaptive versions of each test-scale was reached, then it could be assumed that
the adaptive nature of the test-scales did not significantly affect the person parameter
estimates of the original non-computer adaptive test-scales in any substantial way. On the
other hand, if equivalence between the person parameter estimates of these test forms was
not found it may indicate that the adaptive nature of the test-scales changed the way
person parameters were estimated for the different test forms. Of course, this is dependent
on whether equivalence between the person parameter estimates of the non-adaptive core
and adaptive full test-scales was reached in the first comparison. This is because poor
equivalence at this stage may indicate fundamental differences related to the items used
in the test-scales and not the adaptive nature of these scales per se.

147
5.2.3.4.3. Comparison 3: Comparing the adaptive core test with the non-adaptive
full versions of the test
The third step was to evaluate the correlations between the person parameter
estimates of the adaptive core version of the test-scales with the person parameter
estimates of the non-adaptive full version of the test-scales and vice versa. This
comparison is the focus of most computer adaptive test evaluations (cf. Choi et al., 2010b;
Hart et al., 2006; Hogan, 2014; Smits et al., 2011; Walter et al., 2007). In this comparison
two sets of correlations between person parameter estimates were evaluated.
Firstly, the person parameter estimates of the adaptive core versions of the test-
scales were compared to the person parameter estimates of the non-adaptive full form
versions of the test-scales. This was done to establish whether the adaptive core versions
of the test-scales were able to recover the person parameter estimates of the non-adaptive
full versions of the test-scales. If equivalence between person parameter estimates of these
two forms were found it would mean that the adaptive nature of the core version of the
test-scales did not interfere with person parameter estimation in any substantial manner.
Cross-plots of person parameter estimates were generated using the adaptive core and
non-adaptive full test-scale forms because the adaptive core versions of the test-scales
would be used in the practical computer adaptive testing process. These cross-plots were
presented with the person parameter estimates’ 95% standard error confidence interval
bands to see whether the person parameter estimates of the full-form non-adaptive test-
scales differed substantially from the person parameter estimates estimated using the
adaptive core versions of the test-scales. If the majority of parameter estimates fell outside
the 95% confidence intervals then the test-scale forms could be considered non-

148
equivalent, the opposite is true if most of the cross-plotted person parameter estimates fall
within the 95% confidence interval bands.
If there was little equivalence between the person parameter estimates of these two
test-scale forms, it may indicate that the adaptive core versions were not measuring the
same construct(s) in the same manner as the non-adaptive full version of the test-scales.
The opposite was also investigated where the person parameter estimates of the
adaptive full version of the test-scales were compared to the person parameter estimates
of the non-adaptive core test-scale versions. This informs us as to whether the adaptive
nature of the full version of the test-scales resulted in significant changes to the way
person parameters were estimated for test-takers. Of course this step is dependent on the
equivalence between the person parameter estimates of the test forms established in the
first and second BTI scale comparisons.
5.2.3.4.4. Comparison 4: Comparing the adaptive core test with the adaptive full
versions of the test
The final step in the process of investigating the correlations of person parameter
estimates of the computer adaptive version of the BTI was to compare the person
parameter estimates of the adaptive core version of the test-scales with the person
parameter estimates of the adaptive full version of the test-scales. This is a very important
step as the optimisation process of the core version of the test-scales is put into question.
As demonstrated in Chapter 3 and 4, item banks need to meet numerous criteria before
they are considered ready for practical computer adaptive testing. If the full form of the
test-scale, when simulated in a computer adaptive manner, generates person parameter
estimates that are equivalent to the core version of the test-scales it indicates that the
extensive preparation that the item bank has undergone may have been fruitless.
149
However, if there is poor equivalence between the person parameter estimates of the two
test forms, then this may also indicate that fundamentally the two forms are not measuring
the same construct. Therefore, this stage should indicate person parameter estimate
equivalence to some moderate degree for both versions for the same construct to be
measured; and for the adaptive core version to demonstrate ‘purer’ measurement after
extensive preparation for computer adaptive testing (refer to Chapter 3 and 4). Again, this
comparison is only useful if it has been established from Comparison 1 that the two forms
of the test-scales with different numbers of items were equivalent; and from Comparison
2 that the adaptive nature of the test did not interfere with measurement of the construct
of interest; and finally from Comparison 3 that the adaptive core test was able to recover
the person parameter estimates of the non-adaptive full test. Once these aspects were
investigated the comparison between adaptive versions of the core and full test-scales
could be evaluated to determine whether extensive preparation of an item bank for
computer adaptive testing resulted in optimising measurement.
5.2.3.5. Other performance criteria for computer adaptive tests
Although comparison of the correlations between the person parameter estimates
of test-forms is important to determine whether the adaptive core versions can recover the
original person parameter estimates of the non-adaptive full test-scales; other
performance indices must also be evaluated. More specifically, the performance of the
adaptive core test-scale versions must be compared to the adaptive full test-scale versions
in order to determine whether the adaptive core test-scales perform more effectively than
the adaptive full version of the test-scales. Choi et al. (2010), Thompson and Weiss (2011)
and Hogan (2014) recommend that comparisons be made between the adaptive full form
150
and adaptive core test-scale versions in order to determine whether the adaptive core test-
scales outperform the longer adaptive test-scales.
These psychometric comparisons include item usage statistics such as the number of
items administered over the trait continuum and the mean number of items used; the mean
item information functions of the items administered including the maximum attainable
information within a specific trait level; and the mean standard error of person parameter
estimation (Wang & Shin, 2010). In general, all these comparisons are relative, in that
they are compared across test forms. However, Wang and Shin (2010) suggests that these
criteria must favour the computer adaptive test version of the optimised item bank to
justify the use of this form of testing.
5.2.4. Ethical Considerations
Ethical clearance for this study was obtained from the Faculty Ethics Committee
in the Faculty of Management at the University of Johannesburg. Permission to use the
data for research was granted from JvR Psychometrics, which owns the BTI database.
Only BTI data for which test-takers provided consent for research was used.
Confidentiality and anonymity of the data were maintained by not including any
identifying information the BTI data-set.
5.3. Results
Firstly, the correlations between person parameter estimates for the adaptive core
and adaptive full test-scale versions were presented using the expected a priori (EAP)
estimator. The results of the correlations between the person parameter estimates of the
different version of the BTI scales namely the adaptive core, non-adaptive core, non-
adaptive full and adaptive full test-scale versions were then presented. A summary of the

151
item usage statistics, mean standard error of person parameter estimation and mean person
parameter estimates were also presented to evaluate the efficiency of the adaptive full and
adaptive core test-scales. Finally, the efficiency of each test-form was compared with
reference to the item usage statistics.
5.3.1. Comparing person parameter estimates of the different BTI scales
5.3.1.1. Extraversion
It can be noted in Table 5.1 that the person parameter estimates of the non-adaptive
core and non-adaptive full test-scales demonstrated a strong correlation of .95. This
means that the non-adaptive core and non-adaptive full test-scale versions shared
approximately 90% of the variance for their respective person parameter estimates for the
Extraversion scale.
Table 5.1
Correlations between test-form person parameter estimates for the BTI
Extraversion scale
Measure Adaptive Core Non-Adaptive Core Non-Adaptive Full
Adaptive Core ___
Non-Adaptive Core .93*** ___
Non Adaptive Full .89*** .95*** ___
Adaptive Full .82*** .74*** .81***
Note. *** = p < .001
Furthermore, this indicated that person parameter estimates of the shortened core
version of the Extraversion test-scale was approximately equivalent to the full non-
adaptive version of the Extraversion test-scale and that the shortened and optimised nature

152
of the non-adaptive core test version did not affect the person parameter values estimated
in any substantial manner.
The correlations between the person parameter estimates of the adaptive core and
non-adaptive core version of the Extraversion scale also indicated a strong correlation of
.93. This means that the adaptive core version of the test-scale shared approximately
86.49% of the variance with the non-adaptive core version of the test-scale and thus the
adaptive nature of the core version did not drastically alter the values of the person
parameter estimates. However, the correlation between the person parameter estimates of
the adaptive full and non-adaptive full test-scale versions of the Extraversion scale
evidenced a slightly lower correlation of .81 when compared to the correlation between
adaptive core and non-adaptive core person parameter estimates. The person parameter
estimates of the adaptive full and non-adaptive full test-scale versions shared
approximately 65.61% of the variance which was substantially lower than the shared
variance between the person parameter estimates of the adaptive core and non-adaptive
core versions of the test-scales. This indicated that the person parameter estimates were
substantially affected by the adaptive nature of the test-scale in either its full or core form.
When the person parameter estimates of the adaptive core test-scale for the
Extraversion scale was compared to the non-adaptive full version of the test-scale a strong
correlation was found (.89). This indicated that the adaptive core version shared
approximately 79.21% of the variance with the non-adaptive full test-scale. Therefore,
the adaptive core version of the Extraversion scale recovered the person parameter
estimates of the full non-adaptive version of the test-scale very well. As the recovery of
the person parameters are especially critical for the validation of the computer adaptive
test version of the BTI scales a cross-plot between the person parameter estimates of the
adaptive core and non-adaptive full test-scales is presented in figure 5.3.1.1.

153
It can be noted from the cross-plot that the person parameter estimates for both the
adaptive core and non-adaptive full test-scale version was approximately equivalent
within the 95% standard error confidence interval bands. This was evident because most
of the cross-plotted person parameter estimates fell within the 95% standard error
confidence interval bands with only a few falling outside these bounds.
Figure 5.3.1.1 Cross Plot of Person Measures for the Adaptive Core and Non-Adaptive Full
Scales of Extraversion
Conversely, the adaptive full test-scale was unable to recover the non-adaptive core
person parameter estimates as effectively – with a correlation of .74. Thus, the adaptive
full test-scale shared approximately 54.76% of the variance with the non-adaptive core
test-scale person parameter estimates. Also, the adaptive core version of the test-scale
was better able to recover the original non-adaptive full form person parameter estimates
-3
-2
-1
0
1
2
3
4
-3 -2 -1 0 1 2 3 4
Per
son
Mea
sure
(A
dap
tive
Core
)
Person Measure (Non-Adaptive Full)

154
(r =. 89) than the adaptive full test-scale, which evidenced a slightly lower correlation of
.81.
The correlation between the person parameter estimates of the adaptive full and
adaptive core test-scales was .82. This indicated that the adaptive core and adaptive full
test-scale versions of the BTI shared approximately 67.24% of the variance across their
respective person parameter estimates. This means that there was a substantial difference
between the person parameter estimates for the adaptive core and non-adaptive core test-
scales of the Extraversion scale when compared to the adaptive full and non-adaptive full
test-scales. When the recovery of the person parameter estimates of the adaptive core test-
scale and the non-adaptive full test-scale were considered; it appeared that the adaptive
core test-scales recovered the person parameter estimates of the non-adaptive full test-
scale and the non-adaptive core test-scale more optimally than the adaptive full test.
5.3.1.2. Neuroticism
Table 5.2 displays the correlation coefficients between the different person
parameter estimates of the different test-scale versions for the Neuroticism scale. It can
be noted that the correlation between the person parameter estimates for the non-adaptive
core and non-adaptive full test-scales were approximately equivalent at .97.

155
Table 5.2
Correlations between test-form person parameter estimates for the BTI
Neuroticism scale
Measure Adaptive Core Non-Adaptive Core Non-Adaptive Full
Adaptive Core ___
Non-Adaptive Core .96*** ___
Non Adaptive Full .94*** .97*** ___
Adaptive Full .94*** .92*** .93***
Note. *** = p < .001
Consequently, the variance shared between the person parameter estimates of the
non-adaptive core and non-adaptive full test-scales of the Neuroticism scale was
approximately 94.09%. This indicated that the optimised and shortened nature of the core
test scale did not alter the person parameter estimates substantially when compared to the
non-adaptive full test-scale.
When the person parameter estimates for the adaptive versions of the test-scales
(core and full scales) were compared to the person parameter estimates of their non-
adaptive counterparts, the adaptive core test-scale demonstrated a higher correlation (.96)
than the adaptive full test-scale (.93). When the shared variance between person
parameter estimates was compared, the adaptive core test-scale shared 92.16 % of the
variance with its non-adaptive core test-scale counterpart whereas the adaptive full test-
scale shared 86.49% of the variance with its non-adaptive full test-scale counterpart. This
indicated that the adaptive core version of the test-scale was better able to recover its own
non-adaptive person parameter estimate when compared to the adaptive full version of
the test-scale.
156
When the person parameter values of the adaptive core test-scale were compared
to the person parameter values of the non-adaptive full test-scale a correlation of .94 was
found. As the adaptive core test-scale is the scale that will be used in practical adaptive
testing a cross-plot of person parameters between the adaptive core and non-adaptive full
test-scales was generated (refer to figure 5.3.1.2 below).
Figure 5.3.1.2 Cross Plot of Person Measures for the Adaptive Core and Non-Adaptive Full
Scales of Neuroticism
It can be noted in this figure that the person parameter estimates estimated by the
adaptive core test-scale version was approximately equivalent to the person parameters
estimated using the non-adaptive full test-scale version within the 95% standard error
confidence interval bands. This indicates that the adaptive core version of the test-scale
-7
-6
-5
-4
-3
-2
-1
0
1
2
3
4
-8 -7 -6 -5 -4 -3 -2 -1 0 1 2 3 4
Per
son
Mea
sure
(A
dap
tive
Co
re)
Person Measure (Non-Adaptive Full)

157
is capable of recovering the person parameters of the original non-adaptive full form test-
scale quite well.
However, when the person parameter values of the adaptive full test-scale were
compared to the non-adaptive core test-scale the correlation was slightly lower at .92. The
person parameter values estimated by the adaptive core test-scale therefore shared
approximately 88.36% of the variance with the person parameter values estimated by the
original non-adaptive full version of the test-scale. The adaptive core version of the test-
scale therefore recovered the person parameter values of the original non-adaptive full
form test-scale quite well. In comparison, the person parameter values estimated by the
adaptive full test-scale shared 84.64% of the variance with the person parameter estimates
of the non-adaptive core test-scale. This indicated some deviation of the person parameter
estimates of the adaptive full test-scale when compared to the adaptive core test-scale.
Additionally, the adaptive core test-scale was able to recover the person parameter
estimates of the original non-adaptive full form test-scale slightly better with a correlation
of .94 when compared to the adaptive full test-scale which had a correlation of .93 with
the original non-adaptive full form test-scale. The correlation of person parameter
estimates between the adaptive core test-scale and the adaptive full test-scale indicated
that approximately 88.36% of the variance between person parameter estimates was
shared. This demonstrated that the adaptive full and adaptive core test-scales of the
Neuroticism scale were almost equivalent. However, slightly improved correlations of
the adaptive core test-scale person parameter estimates, when compared to the adaptive
full test-scale, indicated that the adaptive core version was slightly better able at
estimating person parameters equivalently to the original full form test-scale of the
Neuroticism scale.

158
5.3.1.3. Conscientiousness
Table 5.3 summarises the correlations between the person parameter estimates of
the different versions of the Conscientiousness scale. The correlation between the person
parameter estimates for the non-adaptive core and non-adaptive full versions of the test-
scale of the Conscientiousness scale was .94.
Table 5.3
Correlations between test-form person parameter estimates for the BTI
Conscientiousness scale
Measure Adaptive Core Non-Adaptive Core Non-Adaptive Full
Adaptive Core ___
Non-Adaptive Core .95*** ___
Non Adaptive Full .93*** .94*** ___
Adaptive Full .85*** .86*** .93***
Note. *** = p < .001
The person parameter estimates of the non-adaptive full test scale and the non-
adaptive core test-scale shared approximately 88.36% of the variance. This indicated that
the difference in items administered between the optimised shortened core version of the
test-scale and the full version of the test-scale had little impact on the person parameter
estimates. When the person parameter estimates of the adaptive core and the adaptive
full test scales were compared to their non-adaptive counterparts the correlation between
these person parameter estimates for the adaptive core and non-adaptive core (.95) test-
scales was slightly higher than for the adaptive full and non-adaptive full test-scales (.93).
The person parameter estimates of the adaptive core thus shared 90.25% of the variance
with its non-adaptive core counterpart whereas the person parameter estimates of the

159
adaptive full version of the test shared 86.49% of the variance with its not-adaptive full
test-scale counterpart. This indicated that the adaptive core test-scale was better able at
recovering its own non-adaptive person parameter estimates than the adaptive full test-
scale.
In contrast to the Extraversion and Neuroticism scales the adaptive full version of
the Conscientiousness scale recovered the original full form non-adaptive person
parameter estimates just as well as the adaptive core test-scale both evidencing a
correlation of .93. The adaptive core and the adaptive full test-scale of the
Conscientiousness scale thus shared the same variance across person parameter estimates
(86.49%). However, the adaptive full test-scale was not able to recover the person
parameter estimates of the non-adaptive core test-scale as well (r = .86) as the adaptive
core version of the test could recover the person parameter estimates of the non-adaptive
full test-scale (r = .93). If this result is taken into account when the correlation between
the person parameter estimates of the two adaptive versions of the test-scales are
compared (.85) it becomes evident that the adaptive core test-scale estimated person
parameters somewhat differently from the adaptive full test-scale. The person parameter
estimates of the adaptive core version of the test shared approximately 72.25% of the
variance with the adaptive full version of the test and the person parameter estimates of
the adaptive full test-scale shared approximately 73.96% of the variance with the non-
adaptive core test-scale. This indicates that there was a slight difference in person
parameter estimation between the adaptive core and adaptive full test-scales for the
Conscientiousness scale. However, as the adaptive core test-scale was able to recover its
own non-adaptive person parameter estimates better than the adaptive full version of the
test-scale it may indicate better performance, albeit slightly, for the adaptive core test-
scale.

160
Consequently, if the cross-plot of the person parameters of the adaptive core and
non-adaptive full test-scale versions is referred to (refer to figure 5.3.1.3c), both sets of
parameter estimates indicated approximate equivalence within the 95% standard error
confidence interval bands. This outcome indicates good equivalence of person parameter
estimation between the adaptive core and the non-adaptive full form test-scale.
Figure 5.3.1.3 Cross Plot of Person Measures for the Adaptive Core and Non-Adaptive Full
Scales of Conscientiousness
5.3.1.4. Openness
The correlation between the person parameter estimates of the non-adaptive core
and non-adaptive full test-scales of the Openness scale was strong at .96 (refer to table
5.4). This indicated that the person parameter estimates of the non-adaptive full test-scale
-4
-3
-2
-1
0
1
2
3
4
5
6
7
8
-3 -2 -1 0 1 2 3 4 5 6 7 8Mea
sure
(A
dap
tive
Core
)
Measure (Non-Adaptive Full)

161
shared approximately 92.16 % of the variance with the person parameter estimates of the
non-adaptive core test-scales.
Table 5.4
Correlations between test-form person parameter estimates for the BTI Openness
scale
Measure Adaptive Core Non-Adaptive Core Non-Adaptive Full
Adaptive Core ___
Non-Adaptive Core .96*** ___
Non Adaptive Full .92*** .96*** ___
Adaptive Full .89*** .86*** .91***
Note. *** = p < .001
Consequently, the optimised and shortened nature of the core test-scale appeared
to make little difference to person parameter estimates. When the person parameter
estimates of the adaptive core and adaptive full test-scales were compared to their non-
adaptive counterparts; the adaptive core test-scale evidenced a stronger correlation (.96)
compared to the adaptive full (.91) test-scale for person parameters estimated. The
adaptive core person parameter estimates shared approximately 92.16% of the variance
with the non-adaptive core test-scale, whereas the person parameter estimates of the
adaptive full version of the test shared 82.81% of the variance with the person parameter
estimates of the its non-adaptive counterpart. Consequently, this indicates that the
adaptive core test-scale was better able to recover the person parameter estimates of its
non-adaptive counterpart than the adaptive full test-scale. Also, when the correlations
between person parameter estimates for the adaptive core and the full form non-adaptive
test-scales (.92) and the adaptive full and non-adaptive full test-scales (.91) were

162
compared, the adaptive core test-scale was slightly better able to recover the person
parameter estimates of the non-adaptive full test-scale. The shared variance between the
person parameter estimates of the adaptive core and non-adaptive full test-scales
amounted to 84.64% whereas the shared variance between the person parameter estimates
of the adaptive full and non-adaptive full test-scales amounted to 82.81%. These results
indicated that the adaptive core test-scale was slightly better at recovering person
parameter values estimated by the full non-adaptive version of the test.
When the person parameter estimates of the adaptive full version of the test was
correlated to the non-adaptive core version of the test (.86) a slightly greater deviation
between person parameter estimates was found. This is especially evident when the
correlation between the person parameter estimates of the adaptive core test-scale and the
non-adaptive full test-scale (.92) was considered. This means that the person parameter
estimates of the adaptive core test-scale shared approximately 84.64% of the variance
with the person parameter estimates of the non-adaptive full test-scale.
Again, as this is an important comparison (adaptive core with non-adaptive full)
the person parameter estimates of both versions were cross-plotted within their respective
95% standard error confidence interval bands (refer to figure 5.3.1.4 below).

163
Figure 5.3.1.4 Cross Plot of Person Measures for the Adaptive Core and Non-Adaptive Full
Scales of Openness
It can be noted from the cross-plot of person parameters that the person parameters
are approximately equivalent between the adaptive core and non-adaptive full test scale
versions within the 95% standard error confidence interval bands. This indicated that the
shortened and adaptive core scale was able to recover the same person parameter
estimates estimated by the non-adaptive full form test-scale.
The adaptive full test-scale, on the other hand, shared only about 73.96% of the
variance with the person parameter estimates of the non-adaptive core test-scale. If this
result is taken into consideration when the correlation between person parameter
estimates for the adaptive core and the adaptive full test-scales are considered (.89) – with
a shared variance of 79.21% – then it becomes evident that the person parameter estimates
of the adaptive core test-scale differed somewhat from the person parameter estimates of
-3
-2
-1
0
1
2
3
4
5
6
7
-3 -2 -1 0 1 2 3 4 5 6 7 8Mea
sure
(A
dap
tive
Core
)
Measure (Non-Adaptive Full)

164
the adaptive full test-scale. However, since the adaptive core test-scale was better able to
recover its own non-adaptive core and the non-adaptive full person parameter estimates
when compared to the adaptive full test-scale; the adaptive core test-scale slightly
outperformed the adaptive full test-scale of the Openness scale.
5.3.1.5. Agreeableness
The correlations between the person parameter estimates for the non-adaptive full
test-scale and the non-adaptive core test-scale of the Agreeableness scale evidenced a
strong correlation of .97 (refer to table 5.5). This means that that the person parameter
estimates of the non-adaptive core and non-adaptive full test-scale versions shared
approximately 94.09% of the variance.
Table 5.5
Correlations between test-form person parameter estimates for the BTI
Agreeableness scale
Measure Adaptive Core Non-Adaptive Core Non-Adaptive Full
Adaptive Core ___
Non-Adaptive Core .93*** ___
Non Adaptive Full .92*** .97*** ___
Adaptive Full .86*** .79*** .86***
Note. ***p < .001
Consequently, the shortened and optimised nature of the non-adaptive core test-
scale appeared to make little difference to the estimated person parameter values.
However, the adaptive core test-scale appeared to recover its non-adaptive person
parameter estimates better than the adaptive full test-scale. The adaptive core test-scale
165
person parameter estimates correlated .93 with the non-adaptive core test-scale person
parameter estimates; and the adaptive full test-scale person parameter estimates correlated
.86 with the non-adaptive full test-scale person parameter estimates.
A cross-plot of person parameter estimates, as estimated by the adaptive core and
non-adaptive full form test-scales for Openness, are presented in figure 5.3.1.5 below.
Figure 5.3.1.5 Cross Plot of Person Measures for the Adaptive Core and Non-Adaptive Full
Scales of Agreeableness
It can be noted from the figure that the person parameter estimates of the adaptive
core test-scale were approximately equivalent to the person parameters estimated by the
non-adaptive full test-scale (within the bounds of the 95% standard error confidence
intervals). This once again indicates that the adaptive core version of the test-scale was
able to effectively recover the person parameter estimates estimated by the non-adaptive
full form of the scale.
-4
-3
-2
-1
0
1
2
3
4
5
6
7
-4 -3 -2 -1 0 1 2 3 4 5 6 7 8
Mea
sure
(A
dap
tive
Core
)
Measure (Non-Adaptive Full)

166
The correlations between the person parameter estimates of the different test
scales translated to 86.49% shared variance between person parameter estimates for the
adaptive core and non-adaptive core test-scales compared to 73.96% shared variance
between the person parameter estimates for the adaptive full and non-adaptive full test-
scales.
Additionally, if the correlation between the person parameter estimates of the
adaptive core test-scale and the non-adaptive full test-scale is considered (.92) and
compared to the correlation between the person parameter estimates of the adaptive full
and non-adaptive full test-scales (.86); it became evident that the adaptive core test-scale
was better able to recover the person parameter values of the non-adaptive full test-scale
version. The difference between the adaptive full and adaptive core test-scales becomes
even more pronounced when the person parameter estimates of either test-scale was
correlated to the non-adaptive core test-scale and non-adaptive full test-scale respectively.
The person parameter estimates of the adaptive core test-scale correlated .92 with the
person parameter estimates of the non-adaptive full test-scale and the person parameter
estimates of the adaptive full test-scale correlated .79 with the person parameter estimates
of the non-adaptive test-scale. This translated to a shared variance between person
parameter estimates for the adaptive core and non-adaptive full test-scales of 84.64%
compared to the shared variance between person parameter estimates of the adaptive full
and non-adaptive core test-scales of approximately 62.41%.
When the person parameter estimates of the adaptive core test-scale were
compared directly to the person parameter estimates of the adaptive full test-scale the
correlation was .86 with an associated shared variance of 73.96%. These results indicated
that the person parameter estimates of the adaptive core test-scale version of the
Agreeableness scale differed substantially from the person parameter estimates of the

167
adaptive full test-scale version. However, since the adaptive core test-scale was better
able to recover its own non-adaptive person parameter estimates as well as the person
parameter estimates of non-adaptive full test-scale in comparison to the adaptive full test-
scale; it can be argued that the adaptive core test-scale performed better than its adaptive
full test-scale counterpart.
The next section summarises the correlations for person parameter estimates
between the adaptive full and adaptive core test-scale versions. This section also presents
summary statistics on the performance of the adaptive full test-scale versions and how
this compares to the performance of the adaptive core test-scale versions. The
performance of either the test-scale versions was evaluated by looking at the person
parameter recovery statistics, item usage statistics, the mean standard error of person
parameter estimation, and the mean person parameter values.
5.3.2. Computer adaptive core test performance indices
Correlations between the person parameter estimates of the different test forms
have indicated that the adaptive core versions for each of the scales of the BTI recover
the person parameter estimates of the non-adaptive full test-scales as well, if not better
than, the adaptive full test-scale versions. This bodes well for the computer adaptive test
performance of the core adaptive test-scale versions. However, there are numerous other
computer adaptive performance indices that need to be evaluated to determine whether
the core adaptive versions function better than the full adaptive versions of the test-scales.
Table 5.6 summarises a number of comparison indices between the adaptive core and the
adaptive full test-scales of the BTI.

168
5.3.2.1. Recovery of the adaptive core and adaptive full person parameters
In the previous section, the correlations between person parameter estimates for
the different test-scale versions of the BTI were reported. Table 5.6 summarises the
correlations between person parameter estimates for the non-adaptive versions of both the
Table 5.6
Performance indices of the adaptive core and adaptive full test-scales
Indices Extraversion Neuroticism Conscientiousness Openness Agreeableness
Core Full Core Full Core Full Core Full Core Full
r NA .93 .81 .96 .93 .95 .93 .96 .91 .93 .86
r Full .89 ___ .94 ___ .93 ___ .92 ___ .91 ___
Start Item bti11 bti25 bti40 bti42 bti103 bti103 bti153 bti153 bti158 bti166
Mn. Item 11.84 9.91 13.82 12.71 20.41 18.02 14.53 12.07 14.79 11.97
Mn Info. .48 .48 .47 .48 .46 .47 .47 .48 .47 .47
Mean SE .29 .29 .30 .30 .32 .30 .30 .29 .30 .29
Min SE .28 .27 .28 .28 .28 .28 .28 .27 .28 .28
Max SE .40 .30 .41 .37 .38 .33 .40 .37 .35 .34
SE SD .01 .01 .02 .01 .03 .01 .02 .01 .01 .01
SE Range .12 .03 .13 .09 .10 .05 .12 .10 .08 .06
Mean θ .47 .27 -.97 -.92 1.76 1.40 .98 .78 .99 .76
Min θ -1.71 -2.21 -3.36 -3.53 -2.20 -2.24 -1.54 -1.46 -2.18 -2.15
Max θ 3.10 2.35 2.31 2.41 3.62 3.61 3.47 3.52 3.62 3.61
θ SD .60 .54 .83 .78 1.03 .80 .70 .59 .73 .60
θ Range 4.80 4.56 5.68 5.93 5.82 5.85 5.01 4.99 5.80 5.76
Note. SE = standard error; SD = standard deviation; Mean Items = mean number of
items administered; Mean Info. = mean item information; r NA = correlation with non-adaptive version;
r Full = correlation with non-adaptive full scale; θ = theta or the person parameter estimate.

169
core and full test-scales (rNA) for ease of reference. It also summarises the correlations
between the person parameter estimates of the adaptive core and adaptive full test-scales
and the non-adaptive full test-scales (rFull). What can be noted in this summary of
correlations is that (a) the adaptive core test-scale versions better recover the non-adaptive
core person parameter estimates than the adaptive full test-scale versions do; and (b) that
for all the scales of the BTI, except for Conscientiousness, the adaptive core test-scales
recover the person parameter estimates of the non-adaptive full test scales better than the
adaptive full test-scale versions. For Conscientiousness the adaptive core version equals
the recovery of the adaptive full test-scale for the person parameter estimates. The next
section reports on the summary of item usage statistics.
5.3.2.2. Summary of the item usage statistics
The computer adaptive test-scale versions of the BTI use a two-stage branching
technique where certain starting items are given to all the test-takers in a uniform manner.
These items and their usage can be viewed in Table 5.6. For both the Conscientiousness
and Openness core and full adaptive test-scales, bti103 and bti153 were administered as
starting items. For Extraversion, bti11 was administered for the adaptive core test-scale
and bti25 for the adaptive full test-scale. For Neuroticism, bti40 was administered for the
adaptive core test-scale and bti42 for the adaptive full test-scale. Finally, for
Agreeableness, bti158 was administered for the adaptive core test-scale and bti166 for the
adaptive full test-scale. These items had the highest information functions for each scale
of the BTI and were situated near the middle of the trait distribution for persons.
Therefore, these items were considered the most optimal for interim person parameter
estimation using the fixed two-stage branching technique.

170
The mean number of items administered by the adaptive core and adaptive full
test-scale versions indicated that the adaptive full test-scales used on average fewer items
to estimate the latent trait than other test-scale versions. The difference between the
average number of items used by the adaptive full and adaptive core test-scales were as
follows: Extraversion 1.91 items; Neuroticism 1.11 items; Conscientiousness 2.39 items;
Openness 2.39 items; and Agreeableness 2.82 items. On average the adaptive full test-
scales used 2.12 fewer items than the adaptive core test version to accurately estimate
person parameters. Further item usage statistics for the adaptive full and adaptive core
test-scales can be viewed from Figure 5.1a to 5.5b in Appendix A.
5.3.2.2.1. Number of items administered for the adaptive core and full test
scales
For Extraversion the adaptive full test-scale version most frequently administered
9 items per test-taker whereas the adaptive core test-scale most frequently administered
11 items per test-taker. The most frequently administered number of items per test-taker
for the Neuroticism adaptive full test-scale was 10 items compared to 11 items for the
adaptive core test-scale. For Conscientiousness the most frequently administered number
of items per test-taker was 13 for the adaptive full test-scale version whereas the adaptive
core test-scale version most frequently administered 23 items. For Openness both the
adaptive full and adaptive core test-scale versions administered 11 items most frequently
per test-taker. Finally, for Agreeableness the adaptive full test-scale version administered
11 items most frequently per test-taker whereas the adaptive core test-scale version
administered 12 items most frequently per test-taker.
Although fewer items were available for administration in the adaptive core item
bank more items were administered to estimate the latent trait for test-takers than the

171
longer adaptive full test-scales. It can also be noted that the mean item information
functions were relatively equivalent between the adaptive core and full test-scale
versions. Because the adaptive core test-scale versions had fewer items to administer with
approximately the same mean item information as the longer adaptive full test-scales;
more items were used by the adaptive core test-scales to estimate person parameters. This
is because some items that target the extremes of the person distributions have been
removed from use in the adaptive core test-scale versions (refer to Chapter 4) and thus
fewer items are available to target persons at the extremes of the person trait distribution.
This results in slightly higher item usage by the adaptive core test-scale versions and is
not unexpected.
The next section reports on the mean item information, standard error of person
parameter estimation and person parameter statistics for the adaptive full and adaptive
core test-scale versions. The efficiency of items administered with the non-computer
adaptive test-scale versions of the BTI were also compared.
5.3.2.2.2. Summary of the mean item information, standard error of person
parameter estimates and person parameter statistics
As mentioned in the previous section the items have relatively similar mean
information function values regardless of whether the adaptive full or adaptive core test-
scale versions were administered. What can be noted in Table 5.6 is that the mean
information functions of the items differ marginally between the adaptive full and
adaptive core test-scale versions with the adaptive core test-scales evidencing slightly
lower mean item information statistics. This may have resulted in slightly higher item
usage statistics for the adaptive core test-scales. The item information functions relative
to the latent trait and the standard error of person parameter estimation can be seen in
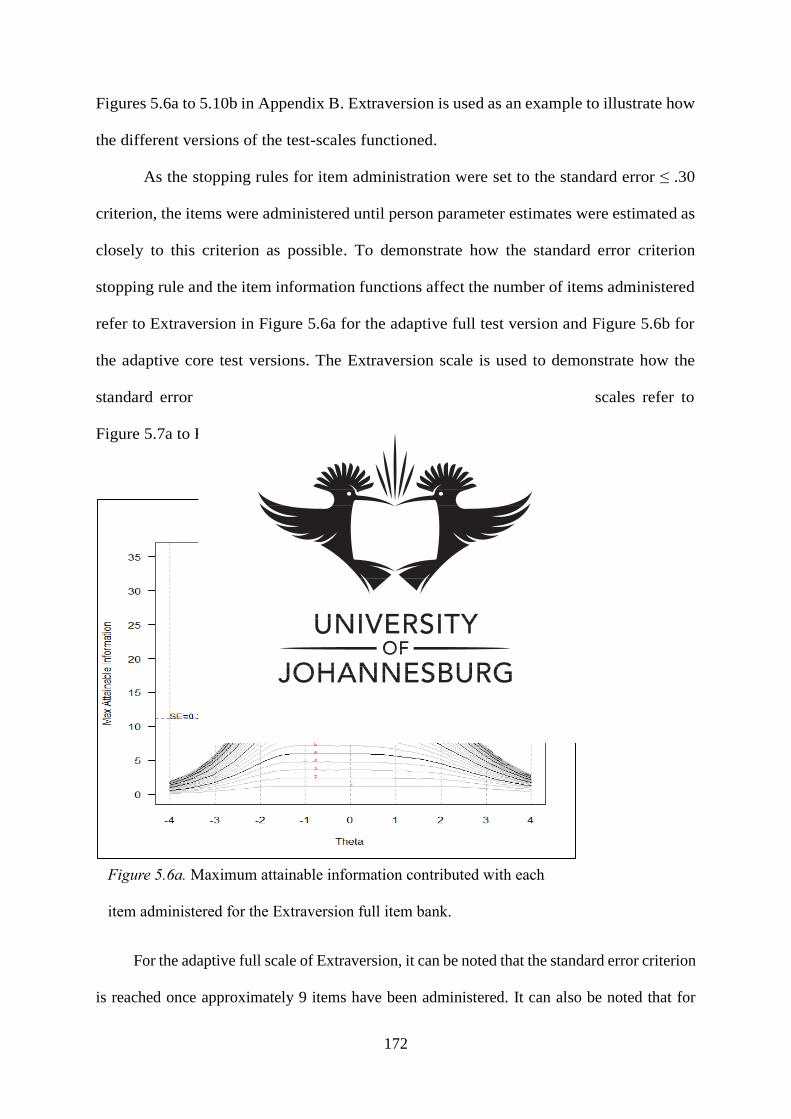
172
Figures 5.6a to 5.10b in Appendix B. Extraversion is used as an example to illustrate how
the different versions of the test-scales functioned.
As the stopping rules for item administration were set to the standard error ≤ .30
criterion, the items were administered until person parameter estimates were estimated as
closely to this criterion as possible. To demonstrate how the standard error criterion
stopping rule and the item information functions affect the number of items administered
refer to Extraversion in Figure 5.6a for the adaptive full test version and Figure 5.6b for
the adaptive core test versions. The Extraversion scale is used to demonstrate how the
standard error criterion affected the items administered. For the other scales refer to
Figure 5.7a to Figure 5.15b in the appendix of this document.
For the adaptive full scale of Extraversion, it can be noted that the standard error criterion
is reached once approximately 9 items have been administered. It can also be noted that for
Figure 5.6a. Maximum attainable information contributed with each
item administered for the Extraversion full item bank.

173
each item administered the highest attainable information (per item) is found near the center of
the trait distribution as this is where the item parameters are most optimally targeted to person
parameters and is thus where the most information per item is available. At the extremes of the
trait distribution available item information ‘dwindles’ as fewer items that measure very low
or high levels if the trait were available for administration. Also, there were fewer persons
available at these extreme low and high trait levels for adequate item parameter estimation thus
resulting in slightly less precise item parameters.
This can be noted when the mean standard error of the person parameter estimates is
taken into account in Table 5.6. For example, if the trait level at the standard error of person
parameter estimates of .30 is contrasted between the adaptive full and adaptive core test-scale
versions for Extraversion it can be noted that item information, as a product of the range of the
trait, is slightly greater for the adaptive full version of the test-scales. This was because there
Figure 5.6b. Maximum attainable information contributed with each
item administered for the Extraversion core item bank.

174
were more items available for administration for the adaptive full test-scale versions than for
the adaptive core test-scale versions which allowed for improved trait-item targeting.
However, the mean standard error for each scale, for both the adaptive full and adaptive
core test-scales, remained within acceptable limits and did not deviate greatly from one another
(refer to Table 5.6). Only Conscientiousness had a mean standard error of .32 which was
slightly above the required mean standard error cut-off of .30 but still within the recommended
standard error ≤ .33, which is considered a very stringent criterion. What was different between
the adaptive full and adaptive core test-scale versions was the range of the person parameter
estimates and mean standard error, where the adaptive core test-scales had a slightly greater
person parameter estimate range and standard error range than the adaptive full test-scale. This
can be attributed to the precision of measurement which is directly related to the number of
items available for administration in the item bank.
When the standard deviation indices were consulted in Table 5.6 for the person parameter
estimates and the mean standard error of person parameter estimates; the adaptive core test-
scale evidenced slightly higher standard deviation values than the adaptive full test-scale for
both these indices. This was because fewer items were available to target the extremes of the
measured trait for each scale, but it also indicates better relative item parameter spread.
When the item usage statistics across the trait continuum was consulted in Appendix C
from Figures 5.11a to 5.15b it can also be noted that more items were administered at higher
and lower trait levels of the trait continuum to reach the standard error criterion of ≤ .30.

175
Figure 5.11a shows that for the adaptive full test-scale version of Extraversion at most
10 items were needed to reach the standard error ≤ .30 criterion for persons whose loadings fell
between -1.00 and 1.00 logits. However, above and below these trait levels more and more
items were needed to reach the standard error criterion. For example, above 2.00 logits up to
30 items were needed to reach the standard error criterion, although the frequency of
administering more than 10 items to reach this criterion was relatively small.
Figure 5.11a. Number of items administered across the trait continuum
for the Extraversion full item bank.

176
In contrast, the adaptive core test-scale version used between 10 and 12 items most
frequently to estimate person parameters within the standard error criterion. Also, there was
more frequent administration of more than 12 items for persons with a trait level above 2.00
logits than for the adaptive full test-scale version. A similar pattern of item administration can
be seen for the other scales of the BTI between the adaptive core and adaptive full test-scale
versions. Therefore, a smaller item bank with fewer items targeted at the extremes of the trait
distribution results in proportionately higher item usage statistics.
This is most evident with the Conscientiousness scale. With reference to Chapter 4
Conscientiousness was one of the only scales of the BTI where items – with a certain item
difficulty - were unable to target persons with high levels of the Conscientiousness trait
(although persons with high levels of the trait were present in the sample distribution). With
reference to the mean items administered for Conscientiousness in Table 5.6 for the adaptive
Figure 5.11b. Number of items administered across the trait continuum
for the Extraversion core item bank.

177
full and adaptive core test-scale versions it can be noted that both test versions used more items
to reach the standard error criterion than the other scales. In most cases the adaptive core test-
scale version administered all 23 items in the shortened item bank to reach the standard error
criterion (see Figure 5.3a and 5.3b in Appendix A). Conscientiousness also had the highest
mean standard error of person parameter estimation for the adaptive core test-scale version
when compared to the other adaptive core test-scale versions for the other scales.
The maximum attainable information per item administered reflects these findings (refer
to Figures 5.6a to 5.10b in the appendix of this document), particularly how the maximum
information functions of the adaptive core test-scale version become smaller as a product of
the range of the trait measured when compared to the adaptive full test-scale version (refer to
Figure 5.8b and 5.8a in Appendix B). Finally, with reference to the item usage statistics in
Appendix A it can be noted that the administration of more items at the extremes of the trait
distribution was more frequent for the adaptive core test-scale version of Conscientiousness
than for any other adaptive core test-scale version for the other scales of the BTI (refer to Figure
5.13a and 5.13b). The adaptive core test-scale versions of all the other scales followed a similar
pattern to the Conscientiousness scale with more items being administered to reach the standard
error criterion. However, major efficiency gains were still made when a comparison between
the adaptive core test-scale versions and the non-adaptive full test-scale versions were made
thus, to some degree, justifying the slightly higher item usage statistics. The efficiency of the
items administered are reported in the next section.
5.3.2.3. Efficiency gains of adaptive item administration compared to non-adaptive
administration
Table 5.7 summarises the proportion of test items that were not administered on average
by the adaptive test-scale versions in comparison to the non-adaptive test-scale versions. What

178
is evident are the gains in efficiency made by both the adaptive core and adaptive full test-scale
versions when compared to their full form non-adaptive test-scale versions.
Table 5.7
Percentage of items not administered by the adaptive test versions
Scale Adaptive Core/ Non-
Adaptive Full
Adaptive Full/ Non-
Adaptive Full
Adaptive Core/ Non-
Adaptive Core
Extraversion 67% 72% 49%
Neuroticism 59% 63% 40%
Conscientiousness 50% 56% 11%
Openness 55% 62% 37%
Agreeableness 60% 68% 49%
Note. Percentages reflect the proportion of items that were not administered by the adaptive test
versions in comparison to the non-adaptive test versions
On average the adaptive core test-scale versions resulted in between a 50% to 67%
greater efficiency of item usage when compared to the non-adaptive full form test-scales. This
amounts to an average item administration reduction of approximately 58%. The adaptive full
test-scales improved item administration efficiency by between 56% and 72% when compared
to the non-adaptive full test-scale versions. This resulted in an even higher item administration
reduction of approximately 64%. There are also gains in efficiency when the shortened
adaptive core test-scale versions are compared to their own non-adaptive core test-scale version
with efficiency gains ranging from between 11% to 49%. On average the adaptive core test-
scales had a 37% item administration reduction when compared to the non-adaptive core test-
scales. This means that the adaptive core and adaptive full test-scales of the BTI reduced
average item administration by about one third.
179
5.4. Discussion
Against the background of previous literature on the comparison of computer adaptive
test-scale versions with their non-adaptive counterparts, results indicate that computer adaptive
tests can be more efficient, as accurate and precise as their non-computer adaptive counterparts
(cf. Betz & Turner, 2011; Chien et al., 2009; Forbey & Ben-Porath, 2007; Gibbons et al., 2008;
Hobson, 2015; Hol et al., 2008; Pitkin & Vispoel, 2001; Reise & Henson, 2000; Smits et al.,
2011; Triantafillou et al., 2008). Direct comparison between the computer adaptive test-scale
versions of inventories and their non-adaptive counterparts is an essential step in the evaluation
of a computer adaptive tests that can determine the metric equivalence and feasibility of such
adaptive tests (cf. Mead & Drasgow, 1993; Pomplun, Frey, & Becker, 2002; Vispoel, Wang,
& Bleiler, 1997; Vispoel et al., 1994; Wang & Kolen, 2006).
This study aimed to determine whether an optimised computer adaptive test could be
as efficient, accurate and precise as the non-computer adaptive test-scale counterparts.
Consequently, the purpose of this study was to evaluate the BTI as a computer adaptive
test by comparing, through computer adaptive test simulation, the functioning of the computer
adaptive test-scales of the BTI to their non-adaptive fixed form test-scale counterparts. This
was accomplished through the generation of an optimised “core” item bank for each scale of
the BTI, which was simulated within a computer adaptive test framework. This simulation
made use of real test-taker response data garnered using the un-optimised “full” non-adaptive
BTI test-scale forms. Comparison between the estimated person parameter values for the non-
adaptive core, adaptive core, adaptive full and non-adaptive full test-scale forms were made.
Item usage statistics, the standard error of person parameter estimates and the mean item
information functions were then compared between the adaptive core and adaptive full test-
scale versions.

180
The outcome of the correlations between person parameter estimates for the various
test-scale forms are discussed and then the computer adaptive performance indices between
the adaptive full and adaptive core test-scale versions are evaluated. The limitations of this
study are then discussed and recommendations made for future research.
5.4.1. Correlations between person parameter estimates of the various adaptive and
non-adaptive test forms
Comparisons between the person parameter estimates for the various test forms lent
extensive support for the use of the adaptive core test-scale version. This is most notable when
the comparison between the person parameter estimates for the adaptive core and adaptive full
test-scale versions and the non-adaptive core and non-adaptive full test-scale versions were
evaluated. Whereas the shortened and optimised nature of the non-adaptive core item bank
made little difference to person parameter estimates when compared to the non-adaptive full
form test-scale versions, the adaptive nature of the test-scales altered the way person
parameters were estimated across the adaptive core and adaptive full test-scale versions.
On average the adaptive core test-scale versions of the BTI were able to recover the non-
adaptive full and non-adaptive core test-scale person parameter estimates better than the
adaptive full test-scale versions could. However, there were some differences between the
person parameter estimates of the adaptive core and adaptive full test-scale versions when they
were directly compared. These results indicated that the optimised core item bank was
relatively equivalent to the non-adaptive un-optimised item banks. However, person parameter
estimates diverged somewhat between the adaptive core and adaptive full test-scale versions,
which may indicate that the optimised nature of the core item banks used in a computer adaptive
manner may estimate person parameter in a slightly different manner.
181
An even greater difference between person parameter estimates can be observed between
the adaptive full test version person parameter estimates and the non-adaptive core test version
person parameter estimates. Finally, divergence between the person parameter estimates of the
adaptive core and adaptive full test-scale versions were noted for every scale of the BTI. There
were thus definite differences between the person parameter estimates of the adaptive core and
adaptive full test-scale versions. This may be due to a number of factors; however, it is
postulated that the relative imprecision of the un-optimised items in the adaptive full test-scales
are to blame for these differences. It is thus emphasised the importance of ensuring that item
banks are sufficiently evaluated and calibrated before computer adaptive testing frameworks
are applied to item banks.
What needed to be established in this study was whether the adaptive core test-scales
differed in an optimal manner from the adaptive full test-scale versions regarding the different
person parameter estimates. If the optimised nature of the items of the adaptive core test-scale
versions were taken into account, then the differences between the adaptive core and adaptive
full test-scale versions indicated that the adaptive core test-scales were able to more accurately
estimate person parameters than the adaptive full test-scale versions of the BTI. This
conclusion was reached because the adaptive full item bank possesses numerous items that
evidenced differential item functioning and poor fit to the Rasch rating scale model (refer to
Chapter 4). Conversely, the adaptive core test version utilised an item bank that evidenced
almost no differential item functioning or poor fit to the Rasch rating scale model. This
difference is not noticeable when the person parameters of the non-adaptive versions of the
test-scales are compared because the correlations between these versions indicated more or less
equivalent person parameter estimates. However once the item banks become adaptive, person
parameter estimates start to diverge between the optimised and un-optimised item banks. There
is thus evidence to suggest that the adaptive nature, and the level of item optimisation, of the

182
test-scales were the primary reasons that different person parameter estimates are obtained with
the adaptive versions of the test-scales.
Because the adaptive testing process estimates person parameter values using fewer items
and because the administration of consequent items are dependent on the interim person
parameter estimates garnered by previous items administered; computer adaptive item banks
are acutely sensitive to items that do not strictly measure a single construct (unidimensionality)
and which demonstrate differential item functioning for different groups of test takers.
Therefore, linear non-adaptive versions of the test-scale demonstrated approximate
equivalence because every item in the item bank was administered. However, once the test
functions adaptively, the administration of a number of suboptimal items substantially alters
the final person parameter estimates.
Let us explain this process using a metaphor of navigation. If one wishes to reach a
specific final destination one requires accurate current location data to plot a course to the final
destination. If the interim person parameter estimates are akin to the current location of the
navigator; the items are akin to quality of the global positioning system used, which is
indicative of the current parameter location data; and the destination is the final standing on
the latent trait measured; then each current location estimate must be highly accurate and
precise for the navigator to reach his or her final destination within a pre-specified acceptable
error. In non-adaptive testing each item gives accurate – in the case of the optimised item bank
– and sometime less accurate current location data – in the case of the un-optimised item bank.
If two navigators set off to a final location where one only uses the most accurate current
location data garnered from the best global positioning systems (akin to the optimised item
bank) and the other uses somewhat accurate current location data from less accurate global
positioning systems (akin to the un-optimised item bank) then both would likely reach a
different destination. Although the navigator which used the less accurate current location data

183
would be in a slightly different destination than the navigator that used only the accurate
estimates; enough accurate current location data was given for navigator two to come close to
the destination of navigator one. This is akin to the non-adaptive test-scales where enough
optimised items existed in the un-optimised item bank to estimate final person parameter
locations closely to that of the optimised item bank. In summary, the addition of these well-
performing items compensate for the poorer functioning items resulting in a person parameter
estimate that is still relatively accurate and precise.
However, if the two navigators are given fewer current location data estimates to find
their final destination (akin to adaptive testing), and each current location is dependent on the
accuracy of the previous location (item selection based on interim person location parameters);
then the two navigators may reach vastly different destinations. This is akin to adaptive testing
where each item allows an interim person parameter value to be estimated and the choice of
the next item is dependent on the person parameter estimates garnered by the previous item.
Therefore, “adaptive navigation” requires only the most accurate current location data (interim
person parameter estimates) to reach the final destination (final person parameter estimates).
In a similar way, the final person parameter estimates of the test-scales using the un-optimised
item bank in an adaptive manner, results in an inaccurate final person parameter estimate
compared to the adaptive optimised test-scale versions.
5.4.2. Adaptive core and adaptive full performance indices
The performance indices of the adaptive core in comparison to the adaptive full test-scale
versions (refer to Table 5.6) indicate most notably that the adaptive full test version (a) used
marginally fewer items to estimate person parameter values for the test-takers; and (b) was able
to estimate person parameters with a slightly lower standard error. It was postulated that these
results were directly associated with the number of items in the item bank and how the item

184
location parameters of these items were targeted to the person location parameters of the
sample of persons (refer to Chapter 4 and Figures 4.3.5.3a – e).
The adaptive full test version had many more items in their respective item banks and
also had numerous items that targeted the extremes of the trait continuum when compared to
the adaptive core test-scale versions. This difference in the number of items available and their
respective item location estimates may have resulted in slightly improved performance indices
for the adaptive full test-scales when compared to the adaptive core test scales. However, the
full item banks were not optimised and thus the accuracy of the final person parameter
estimates of the adaptive full test-scales can be called into question.
From an adaptive perspective the poorest functioning scale was Conscientiousness as it
has the lowest item usage efficiency for the adaptive core test and also had the highest standard
error for this test form. However, the standard error of person parameter estimation for
Conscientiousness was still acceptable at .32. Unfortunately, the adaptive core test version for
Conscientiousness administered all 23 items of the optimised item bank too frequently in order
to reach this low standard error. This indicates that the core Conscientiousness item bank may
not have enough items available for optimal person parameter targeting.
Therefore, the adaptive core test version of Conscientiousness administers more items
than its adaptive full counterpart to reach the standard error criterion of person parameter
estimates. This problem persists for the other adaptive core test-scale versions of the BTI,
albeit less so. It is therefore recommended that more items that target the upper and lower
extremes of the trait distribution be written for each adaptive core item bank for the BTI so that
the item efficiency of each scale is improved as the standard error criterion is reached.
However, on average the differences between the item usage statistics and the standard
error of person parameter estimates was marginally different for the adaptive core and adaptive
full test-scales. In addition, the adaptive full test-scales may not as accurately estimate person

185
parameters as the adaptive core test-scales as they do not make use of the optimised item banks.
In this way the adaptive core test-scales were more accurate albeit slightly less precise at
estimating final person parameter values for test-takers.
5.4.3. Item usage statistics
Major efficiency gains were made by the adaptive core and adaptive full test-scales when
compared to the non-adaptive full form test-scale versions. The difference in item efficiency
between the adaptive full and adaptive core test-scales was relatively small (6%) with both
versions only administering about a third of the items compared to the non-adaptive full form
test-scales. The adaptive full test-scales did however demonstrate much greater item efficiency
than the adaptive core test-scales when they are compared to their respective non-adaptive
counterparts (non-adaptive full and non-adaptive core). This result can be misleading because
the adaptive full test-scales have many more items in their respective item banks that the
adaptive core test versions in a proportional manner. Item efficiency in an absolute sense
between the adaptive core and adaptive full test-scales were therefore approximately
equivalent.
5.4.4. Implications for computer adaptive testing of personality
What has become evident from this study is that the computer adaptive test-scales of
the BTI, whether optimised or un-optimised, recover the person parameter estimates of the
non-adaptive full form test-scales in an equivalent manner. A corollary to this outcome is the
divergent person parameter values that are obtained when the adaptive core and adaptive full
test-scale person parameter estimates are compared. These outcomes underline the importance
of scale and item optimisation before computer adaptive testing is implemented. It also
emphasises that computer adaptive test-scales can be as accurate and precise at estimating

186
person parameter locations on the latent trait as the non-adaptive full form test-scales. The only
difference is the major gains in efficiency that the computer adaptive versions of the BTI scales
have made.
These findings have a direct impact for the future of personality testing. As personality
inventories are used widely for personnel selection, development and placement the shortening
of inventories to improve efficiency is a salient goal. Additionally, perceived test applicability
for the individual is also of major importance. More often than not, individual test-takers have
to respond to numerous items that have little bearing to them personally. Alternatively, to boost
the reliability of inventories, test-takers may need to respond to numerous items that have
approximately identical content in tests developed using only classical test theory. These
characteristics of personality inventories based on classical test theory, reduce test-taker
motivation and also reduce the overall face-validity of the instrument being administered. Since
it has been demonstrated that computer adaptive scales of the BTI demonstrate approximate
equivalence to the non-adaptive linear test-scales; computer adaptive testing can be
implemented to save time and reduce the burden on the test-taker while still producing person
parameter estimates that are accurate, precise and reliable.
5.4.5. Recommendations for future research
5.4.5.1. The impact of test-mode differences
Although this study demonstrated metric equivalence between the non-computer
adaptive and computer adaptive versions of the BTI scales, further research and validity
considerations need to be taken into account in future research.
Firstly, test-mode differences need to be investigated in future research endeavours.
Although the psychometric properties of computer adaptive simulated tests are employed with
real respondent data, and the equivalence of computer adaptive tests to their non-computer

187
adaptive counterparts can be evaluated, this research creates a framework for studying possible
test-mode differences. Within this study each test-taker completed the non-adaptive full form
of the test for each scale of the BTI. Therefore, the mode of testing was the same for all
respondents and the respondents were not exposed to the adaptive nature of the computer
adaptive test version in real-time. It is therefore recommended that future studies compare the
non-adaptive full form BTI test scores with test scores obtained through ‘real-time’ computer
adaptive testing with the same sample of test-takers. Test-mode differences may not be as great
as for ability-based inventories, but the effects of the test-mode must be determined for
computer illiterate individuals as well as for populations that are unfamiliar with psychometric
testing in general. These boundary cases are especially important in the South African context
where large proportions of the population do not have access to computers and for which
psychometric testing is novel.
5.4.5.2. Over exposure of items and content balancing
Computer adaptive testing relies heavily on a pre-calibrated item bank from which the
test draws items for administration. Often times certain items may be over-administered and
other items may be under-administered. Usually, items that have item location parameters at
the upper and lower extremes of the latent trait are underused because these items are not well
targeted to persons, whereas items closer to the center of the person distribution, which are well
targeted to person trait levels are overused. Item overexposure is not as disadvantageous as
with tests of ability where familiarity with an item may invalidate the item, but it does have
repercussions for items that are underused. Generally, underused items become arbitrary as
there is little data to evaluate them. Although item under- and overexposure can easily be
remedied by altering the exposure rate of items, or generating ‘testlets’ where different items

188
can be used in parallel form adaptive item-banks, item exposure balancing needs to be
conducted for real-world computer adaptive testing.
Content balancing on the other hand, refers to the degree of representation that different
items from different constructs or sub-constructs enjoy during computer adaptive
administration (Lu et al., 2010). Content balancing is an important consideration when
developing and using computer adaptive tests. Firstly, a certain number of items need to be
used that measure different domains so that person measures on these domains can be
accurately estimated. It is of no use to have 20 items that measure only Conscientiousness and
no items that measure Extraversion in a personality test. Content balancing thus needs to be
done on the scale level of personality tests. However, since personality tests measure distinct
constructs at the scale level, computer adaptive tests of personality can ideally be independently
administered per scale to ensure content coverage of the five personality factors.
However, where content balancing becomes critical is at the subscale level. At this level
enough items have to be administered from a number of subdomains to accurately and precisely
measure and report at the total score level. For example, the Extraversion scale may report on
an Extraversion total score, but is this total score calculated using all the subdomains of
Extraversion (i.e., Ascendance, Liveliness, Positive-Affectivity, Gregariousness, and
Excitement Seeking) or only one or two? Furthermore, different test-takers may be
administered very different items from different subdomains thus making comparison between
the person parameter estimates of test-takers difficult.
Since general factor dominance was demonstrated for the BTI scales (refer to Chapter
3) and only the person parameters at the total score level (scale level) were compared, content
balancing was not used in this study. Additionally, not enough items were available for each
facet of the BTI to make content balancing feasible. However, content balancing is an
important feature that should be included in real-time computer adaptive testing, ensuring that

189
enough items are available for administration at the subscale level. Three content balancing
techniques are popular in the literature namely the Constrained Model (Kingsbury & Zara,
1989), the Modified Multinomial Model (Chen, Ankenmann, & Spray, 1999) and the Modified
Constrained Model (Leung, Chang, & Hau, 2000). Generally, the use of the Modified
Multinomial Model and the Modified Constrained Model are recommended for modern content
balancing in computer adaptive attitudinal measures (Leung, Chang, & Hau, 2003).
5.4.6. Conclusion and final comments
The results of this study therefore indicate that the adaptive core test-scale versions were
more accurate when estimating person parameters than the adaptive full test-scale versions.
Also, the adaptive core test versions, although using on average more items to estimate person
parameters, remained highly efficient when compared to the non-adaptive full-form test-scale
versions.
Conversely, the adaptive full test-scales were more precise when estimating final person
parameter location values and used on average fewer items to do so than the adaptive core test-
scales. In addition, item efficiency was much higher for the adaptive full test-scale versions
than the adaptive core test-scale versions when compared to their respective non-adaptive test
forms.
When these aspects are taken into account it should be argued that the more accurate, not
precise or necessarily efficient, test version be used in practice. This is because the purpose of
psychometric measurement is to accurately estimate test-takers’ standing on the latent construct
of interest and this tenant should not be compromised. There are also other mitigating factors
that motivate the use of the adaptive core test version over the adaptive full test version. Firstly,
as stated before the adaptive core tests are more accurate at estimating person parameters than
the adaptive full test-scales. Secondly, the difference between the precision of measurement

190
for the adaptive core and adaptive full test-scales was marginal. Thirdly, adaptive core test-
scales only used on average two items more than the adaptive full test-scales, which is a small,
if not negligible, difference. And finally, the adaptive core test-scales remained highly efficient
when compared to the non-adaptive full form test-scales.
It is also possible to write more items for the adaptive core item banks to increase
precision of measurement and bolster item usage efficiency. If these aspects are taken into
account, the adaptive core test versions can be considered superior to both the non-adaptive
full form test versions and adaptive full test versions for the scales of the BTI. Considering
these results, it can be confidently argued that the time for computer adaptive testing of
personality has truly come.

191
CHAPTER 6: DISCUSSION AND CONCLUSION
“Moreover, computerized psychological assessment introduces the possibility of more
advanced test administration procedures, which were impossible to implement in
conventional paper-and-pencil testing.” – Hol et al. (2008, p.12).
6.1. Introduction
In this chapter the Chapters 3, 4, and 5 discussions of the studies conducted are
integrated. The background of the three studies is briefly discussed and the objectives of the
studies are revisited. The unique contributions of the studies and the findings for each objective
are then provided. The chapter concludes by making recommendations for practice, discussing
the limitations of the studies, and making suggestions for future research.
6.1.1. Aims and objectives of the three studies
The superordinate aim of this research study was to prepare and evaluate a personality
inventory for computer adaptive test application. Generally, this objective aimed to address the
apparent lack of progress made in the field of computer adaptive personality testing (refer to
Chapter 1 and 2 for a more detailed discussion). Two initial objectives were therefore important
namely (1) evaluating the psychometric properties of a personality inventory to determine
whether computer adaptive test application was feasible and, (2) testing how a personality
inventory would function as a computer adaptive test.
To meet these objectives this research study was broken into three independent studies.
The first study (Chapter 3) investigated the dimensionality of the BTI, a personality inventory
developed in South Africa that is based on the five-factor taxonomy, whereas the second study
evaluated the psychometric properties of the BTI using item response theory to prepare the
scales of the BTI for computer adaptive testing (Chapter 4). The final study (Chapter 5)

192
simulated the BTI as a computer adaptive test within and computer adaptive testing framework
to determine whether it was comparable to its own non-computer adaptive version, which acted
as a benchmark for the computer adaptive test-scale versions. These steps taken in these three
studies are required when evaluating a test for computer adaptive test applications. The
rationale and objectives of each of these studies is discussed in the next section.
6.1.2. Study 1 objectives: The dimensionality of the BTI scales
Because computer adaptive tests select items measuring specific latent constructs to
administer to test-takers, and because these items are used to estimate the trait level of test-
takers, each set of items (measurement scales) used in computer adaptive testing must
demonstrate the measurement of a dominant single construct. This is referred to as
unidimensional measurement, which is a prescription for computer adaptive testing and testing
in general. If items used in an item-bank for computer adaptive testing do not primarily measure
a single ‘known’ construct, then item and person parameters derived from computer adaptive
testing may be inaccurate and imprecise. Therefore, the main objective of the first study was
to investigate the dimensionality of the BTI on the factor/scale and facet/subscale levels.
Ideally, each factor/scale of the BTI should demonstrate unidimensionality as the computer
adaptive test would measure at the factor/scale level and not the facet/subdimensional level.
The main objective of this study was therefore to determine whether each of the factors/scales
of the BTI demonstrated sufficient evidence for unidimensionality to justify fitting the scales
to an item response theory model to prepare the scales for computer adaptive testing
applications.

193
6.1.3. Study 2 objectives: Fitting the BTI scales to the Rasch model: Evaluation and
selection of a core item bank for computer adaptive testing
Computer adaptive tests ultimately estimate person parameters, on the construct of
interest, using an item-response theory framework. It is therefore necessary to investigate how
well items of a test fit an item-response theory model. Poor fit to an item-response theory model
would not bode well for computer adaptive testing and may negate the precision and accuracy
of person trait estimation with a computer adaptive framework (refer to Chapter 4 for a more
in-depth discussion). The objective of the second study was therefore to evaluate how well the
items of the factors/scales of the BTI fit the Rasch rating scale model. A secondary objective
of this study was to generate item difficulty parameters to use within a computer adaptive
testing framework and remove items that may not function effectively within this framework.
6.1.4. Study 3 objectives: An evaluation of the simulated Basic Traits Inventory
computer adaptive test
In essence, the first two studies evaluated and prepared the scales of the BTI for computer
adaptive test application. Study 3 (Chapter 5) actually simulates the scales of the BTI as a
computer adaptive tests to determine how equivalent the person parameter estimates of the
computer adaptive tests were to the person parameters estimated using the non-computer
adaptive versions of the test-scales. Ideally, person parameter estimates should be
approximately equivalent across the non-adaptive and adaptive versions of the BTI scales for
practical computer adaptive testing to be considered. Other important considerations should
also be taken into account such as the item efficiency of the computer adaptive test and the
precision with which the computer adaptive test estimates person parameters while making
item efficiency gains. Therefore, the main objective of this study was to evaluate the

194
performance of the computer adaptive versions of the scales of the BTI relative to their non-
adaptive full form counterparts.
With these objectives in mind, the results and outcomes of each of these studies is
discussed in the next three sections. First, an overview of the findings for each study is
presented. The limitations of the three studies are then discussed and some recommendations
for future research are made.
6.2. Discussion of Results for the Three Studies
As mentioned in the previous section, the main objectives of study 1 and study 2 was to
investigate the psychometric properties of the BTI to evaluate whether the BTI could be used
as a computer adaptive test. The third study evaluated how well the scales of the BTI performed
within a computer adaptive framework. Consequently, the results of study 1 and 2 are first
discussed, followed by a discussion of the results study 3.
6.2.1. Study 1 results: The dimensionality of the BTI scales
In the first study three confirmatory factor analytic models namely: (1) a general factor
model (where a common factor accounts for the majority explained variance); (2) a group
factor model (where sub-factors account for the majority explained variance); and (3) a bifactor
model (where the general factor accounts for the largest proportion of the explained variance
while sub-factors account for a smaller proportion of the unique variance simultaneously) were
evaluated for each scale of the BTI. This was done in order to determine whether a single
unidimensional construct (i.e., the general factor) or a number of constructs (i.e., the group
factors) accounted for the majority of the explained variance for each scale of the BTI. This is
important because if the general factor model is ‘best fitting’ then interpretation of a total score

195
at the scale level of the BTI is justified. However, if the group factor model demonstrates the
best fit, then the interpretation of a total scale score is not justified. If the latter were true, then
computer adaptive test-scales would have to be developed for each facet or subscale. Total
score interpretation at the scale level, on the other hand, would be required if a computer
adaptive test is developed to measure a single unidimensional construct at the scale level as
was the aim of this study (i.e., Extraversion, Neuroticism, Conscientiousness, Openness, and
Agreeableness.
The results indicated the presence of strong general factors for each of the five BTI scales.
Only Extraversion demonstrated some limited evidence of multidimensionality, with the
Excitement Seeking sub-factor explaining some unique variance beyond the general
Extraversion factor. Although each scale demonstrated general factor dominance, in the sense
that a general factor accounted for the largest proportion of explained variance for each scale
of the BTI, each sub-factor also explained unique variance not attributed to the general factor.
The results therefore suggested that a common factor model was not strictly applicable
to the scales of the BTI. In other words, each sub-factor also explained some unique variance
beyond the general factor. Similarly, the group factor model also did not fit sufficiently well
to justify pure interpretation at the facet level. This result indicated that computer adaptive
testing at the subscale level would not be feasible or psychometrically plausible. Results thus
suggested that a bifactor model was the most applicable for each scale of the BTI. A bifactor
model posits that each scale of a test has a common factor (general factor) that accounts for the
largest proportion of the explained variance, as well as a number of group factors that account
for a smaller proportion of the unique variance beyond the common factor. This was not
unexpected however, as personality constructs are not usually orthogonal, and the BTI is a
hierarchical personality inventory with well-defined factors (scales) and sub-factors (referred
to as facets). It was thus hypothesised that the bifactor model would be the best fitting model

196
because this model purports the use of both a general factor and a number of group factors.
However, to justify the use of a computer adaptive test format for each scale of the BTI, the
bifactor model should demonstrate that the general factor still accounts for the largest
proportion of explained common variance, whereas the group factors (sub-factors) account for
a markedly smaller proportion of the unique variance. This was indeed the case even though
each model (common factor, group factor, and bifactor) demonstrated evidence of
multidimensionality, in the sense that multiple factors are measured (i.e., the general/common
factor and four or five group factors) the use of total scores for each factor was not unjustified.
Technically however, the bifactor model also indicates possible interpretation at the sub-
factor level, but the degree of general factor dominance as well as the lack of sufficient items
at the subscale level for computer adaptive test applications rendered this option wholly
unfeasible. This was primarily because the general/common factor still accounted for most of
the explained variance in each scale of the BTI, while a smaller proportion of the unique
variance was accounted for by the sub-factors.
The Excitement Seeking subscale of the BTI, although accounting for a larger proportion
of the unique variance beyond the general Extraversion factor, still demonstrated relative
general factor dominance. It was thus decided that this scale would remain ‘intact’ when
evaluating the items of the BTI using a one-dimensional item response theory model (i.e., the
Rasch rating scale model) in study 2. If fit to this model for the Extraversion scale indicated
substantially poor fit indices for most items, Excitement Seeking would be dropped for
computer adaptive test adaptation. However, with the removal of a limited number of poor
fitting items for the Extraversion scale good fit to the Rasch model was achieved and thus
Excitement Seeking was retained for computer adaptive test application. Scale fit to the Rasch
rating scale model is elaborated on in the next section.

197
6.2.2. Study 2 results: Fitting the BTI scales to the Rasch model
Once the dimensionality of the BTI scales was judged ‘sufficiently unidimensional’; the
items of the five scales of the BTI were fit to the one-dimensional Rasch rating scale model.
The objective of fitting the items of the scales of the BTI to the Rasch rating scale model was
twofold. Firstly, it was determined whether the fit of the data to the Rasch rating scale model
was sufficient to justify computer adaptive testing on the scale level. Secondly, item and person
parameters were developed for use within a computer adaptive testing framework for each of
the five scales of the BTI.
With regard to the first objective, each scale of the BTI was evaluated for fit using the
infit and outfit mean square statistics, person and item separation indices and reliability, rating
scale performance indices, and DIF across gender and ethnicity.
The majority of the items of the BTI demonstrated good fit to the Rasch rating scale
model with some items not fitting the model sufficiently well to justify their inclusion. Person
and item separation indices were also, for the most part, satisfactory with item and person
reliability indicating similarly satisfactory results. Although the items demonstrated uniform
or non-uniform DIF by gender and ethnicity, some items also demonstrated DIF for both gender
and ethnicity jointly. Poor fitting items and items that demonstrated DIF were removed and the
revised item pool for each scale demonstrated satisfactory fit to the Rasch rating scale model.
In total, the items of the scales of the BTI were reduced to 23 items for Extraversion,
Neuroticism, Conscientiousness, and Openness to Experience, and 29 items for Agreeableness.
Item and person parameters were thus generated for use in a computer adaptive testing
framework based on the reduced scales of the BTI. However, to demonstrate that the reduced
scales still measure the same constructs and are able to estimate person parameters equivalently
to the full scales, cross-plots the person parameters of the full scales (i.e., the scales where no
items were removed) with the person parameter estimates of the reduced scales (i.e., the scales

198
where items were removed due to DIF and misfit) were generated. Results indicated that there
was sufficient equivalence between the person parameter estimates of the full test and the
reduced test to justify the use of the reduced scales and their associated person and item
parameters for computer adaptive testing applications.
6.2.3. Study 3 results: An evaluation of the computer adaptive BTI
The final study in this research was to evaluate the performance of a computer adaptive
test of personality by contrasting it with the full non-adaptive version of the test. Because study
1 and 2 indicated that the items of the scales of the BTI meet the psychometric requirements
for computer adaptive test applications, the reduced scales of the BTI (scales that have had
poor fitting items and items that demonstrate DIF removed) were used within the computer
adaptive testing framework. However, it was also determined whether the reduced BTI scales
estimated person parameters differently (i.e., person parameter estimates and item efficiency)
when compared to the adaptive version of the full non-reduced scales. This was done in order
to contrast the two adaptive forms of the test with one another.
To reduce the impact of different computer adaptive testing procedures all item selection
rules, person parameter estimation functions, and stopping rules were held constant for each
scale and test version of the BTI. Results indicated that the computer adaptive versions of the
scales (both the full adaptive and core adaptive scales) outperformed the non-adaptive full and
core scales. Although fewer items were administered with a robust standard error for both the
adaptive full and adaptive core scales of the BTI, the greatest gains in item administration
efficiency was made between the non-adaptive full and adaptive full scales of the BTI.
Although the adaptive core scales still made item gains when compared to their non-adaptive
core counterparts these gains were not as dramatic as those made between the adaptive full and
non-adaptive full scales. This was simply because of the reduced item pool in both cases.

199
Generally, the adaptive versions of the BTI scales made efficiency gains of 50% or more for
both the adaptive full and adaptive core versions of the test when compared to their non-
adaptive counterparts. This was a major reduction in item administration while each scale still
maintained a robust standard error of person parameter estimation of ≤ .30. Additionally, the
adaptive core and adaptive full versions of the scales of the BTI were able to recover the person
parameter estimates of the non-adaptive full versions of the scales. These results indicate that
the computer adaptive versions of the scales of the BTI functioned effectively within a
computer adaptive testing framework.
6.3. Limitations and suggestions for future research
Although the three studies indicated that the BTI can be used in a computer adaptive
testing framework, while maintaining satisfactory precision of measurement, two opportunities
for future research can be earmarked. Firstly, the item pools used for computer adaptive testing
tend to be large. These item pools contain numerous items to ensure (1) test security where
‘testlets’ or alternate item pools are used in each computer adaptive testing process for different
groups of test-takers, and (2) these item pools cover the continuum of the latent constructs from
a very low level of the trait to a very high level of the trait. In classical testing a single test with
a fixed number of items is considered sufficient. However, in computer adaptive testing item
pools used in the adaptive process should be much larger than the scales used in classical test
theory. This is because the computer adaptive test may rely very heavily on a single cluster of
best performing items and exclude a number of functional items from administration (refer to
the discussion on item under and overexposure in Chapter 5).
To ensure that test-takers receive test items that are relevant and varied is important
for face validity and test security. Methodologically, the psychometrician would like to
generate data on most of the items in the item bank so that their psychometric properties can

200
be further investigated or that test items can be revised over time. This can be achieved by
making use of content balancing procedures (refer to the discussion on content balancing in
Chapter 5). In this study only a fixed set of items from the original fixed form test were
available. Additionally, the computer adaptive test-scales reported on the scale level only.
Because of these considerations content balancing was not included in this study.
However, in future studies reporting on the practical testing of the computer
adaptive scales content balancing will need to be applied. It was also recommended that fixed
branching mechanisms – where a certain number of items are administered to all test-takers in
a non-adaptive manner after which the test adaptively selects from the items not used – were
implemented. In this way data on items can be obtained if the adaptive test does not administer
a certain cluster of items sufficiently. If the BTI scales are to be used in a computer adaptive
manner for practical testing, then more items will need to be written to bolster the item pool
over time. With enough items ‘testlet item pools’ can be created where the larger item pool is
split into a number of smaller independent item pools in order to maximise item exposure.
These item pools can then be administered in an alternate manner thus improving test-security
and ensuring that enough data is obtained for each item within each item pool.
It was further recommended that future research include the creation of items that
target trait levels at the extreme higher and lower ends of the trait-continuum for each BTI
scale. Although the endorsability of items was well-targeted to the trait level of the sample
under investigation, smaller groups of individuals at the extremes of the distribution did not
have items targeted as well to their particular trait levels. Generating items that target
individuals with extreme trait levels will further improve the precision of measurement and
may also further reduce the number of items that need to be administered during assessment.
It was also recommended that future research concentrate on the test-mode effects
of real-time computer adaptive testing. Although computer adaptive test simulation

201
approximates the computer adaptive process the real influence of the mode of testing on the
test-taker needs to be determined. These testing-mode effects can have implications for test-
takers who are not familiar with this type of testing and may/may not impact on test-validity.
6.4. Implications for practice
The major outcome of this study was to demonstrate that personality can be successfully
measured using computer adaptive testing procedures. The conservative nature of
psychometric testing has resulted in a multitude of tests using classical test theory techniques,
but with few making progress into the computer adaptive testing domain. It is important to
emphasise however, that classical test theory techniques of test construction are just as relevant
today as they have been in the past, but innovation and progress is needed in the psychometric
testing domain to ensure that testing remains relevant and up-to-date.
Computer adaptive tests reduce testing time; increase the relevance of items to test-takers
because the item difficulty is matched to person ability, or traitedness; increase test security;
and allow for quicker test-result reporting. In the case of the BTI up to 50% of the items of
each scale were not administered while the scales approximated personality traits with accuracy
and precision. The reduction in testing time and the practical and cost benefits of this
improvement in efficiency already justifies the research and development of computer adaptive
tests of personality. With the continued popularity of personality testing and the burden that
tests with many items place on the test-taker, computer adaptive testing can greatly improve
the testing experience for the test-taker and the test-administrator. However, test-developers
need to be aware of the increased sophistication, capital cost and complexity of computer
adaptive testing systems.
Another implication for practice is the improved test-security associated with the item
pools of computer adaptive tests. No two computer adaptive tests are the same as each test-

202
taker’s relative ‘traitedness’ informs item selection and administration. In this way it becomes
difficult for test-takers to fake on a computer adaptive test or to learn which items are associated
with specific constructs. Test security is further improved in the sense that ‘testlets, or’ multiple
alternate item pools, can be used as well.
Finally, the greatest strength of using computer adaptive testing in the personality domain
is that item invariance is a prerequisite for computer adaptive testing. In this way different sets
of items can be used to rank test-takers on the same trait continuum. This greatly improves the
flexibility of the testing process for test administrators.
6.5. Conclusion
The main objective of this study was to prepare and evaluate a test of personality for
computer adaptive testing applications. The results demonstrated that a computer adaptive test
of personality can function as effectively as a non-computer adaptive test of personality while
improving the relevance and efficiency of the test. In conclusion the computer adaptive testing
of personality is an area of great promise with numerous applications in practice.

203
References
Andrich, D. (1978). A rating formulation for ordered response categories. Psychometrika, 43,
561-573. doi: 10.1007/BF02293814
Andrich, D., & Hagquist, C. (2014). Real and artificial differential item functioning in
polytomous items. Educational and Psychological Measurement, 1-23. doi:
10.1177/0013164414534258
Apple, M. T., & Neff, P. (2012). Using Rasch measurement to validate the Big Five Factor
Marker Questionnaire for a Japanese university population. Journal of Applied
Measurement, 18, 276-296.
Attali, Y., & Powers, D. (2008). Effect of immediate feedback and revision on psychometric
properties of open-ended GRE subject test items. Princeton, NJ: Educational Testing
Service.
Babcock, B., & Weiss, D. J. (2009). Termination criteria in computerized adaptive tests.
Variable-length CATs are not biased. In, D. J. Weiss (Ed.), Proceedings of the 2009
GMAC conference in computerized adaptive testing. Retrieved from
http://www.psych.umn.edu/psylabs/CATCentral/.
Baghaei, P. (2008). Local dependency and Rasch measures. Rasch Measurement
Transactions, 21, 1105-1106.
Ben-Porath, Y. S., & Butcher, J. N. (1986). Computers in personality assessment: A
brief past, and ebullient present, and an expanding future. Computers in Human
Behaviour, 2, 167-182. doi: 10.1016/0747-5632(86)90001-4
Betz, N. E., & Turner, B. M. (2011). Using item response theory and adaptive testing in
online career assessment. Journal of Career Assessment, 19, 274-286. doi:
10.1177/1069072710395534
204
Betz, N. E., & Weiss, D. J. (1976). Psychological effects of immediate knowledge of
results and adaptive ability testing: Research report 76-4. Arlington, VA: Office
of Naval Research.
Bentler, P. M. (1990). Comparative fit indexes in structural models. Psychological
Bulletin, 107, 238-246. doi: 10.1037/0033-2909.107.2.238
Bjorner, J. B., Kosinski, M., & Ware, J. E. (2005). Computerized adaptive testing and
item banking. In, P. Fayers, and R. Hays (Eds.), Assessing quality of life in clinical
trials (2nd ed.). Los Angeles, CA: Oxford University Press.
Bland, M. J., & Altman, D. G. (1995). Multiple significance tests: The Bonferroni
method. British Medical Journal, 310, 170. doi: 10.1136/bmj.310.6973.170
Bock, R. D., & Mislevy, R. J. (1982). Adaptive EAP estimation of ability in a
microcomputer environment. Applied Psychological Measurement, 6, 431-444.
doi: 10.1177/014662168200600405
Bollen, K. A. (1989). Structural equations with latent variables. New York: John Wiley
& Sons.
Bond, T. G. (2003). Validity and assessment: a Rasch measurement perspective.
Metodologia de las Ciencias del Comportamiento, 5, 179-194.
Bond, T. G., & Fox, C. M. (2007). Applying the Rasch model: Fundamental measurement in
the human sciences (2nd ed.). Mahwah, NJ: Lawrence Erlbaum.
Boone, W. J., Staver, J. R., & Yale, M. S. (2014). Rasch analysis in the human sciences.
Dodrecht, Netherlands: Springer.
Browne, M. W. & Cudeck, R. (1993). Alternative ways of assessing model fit. In, K. A.
Bollen and J. S. Long (Eds.), Testing structural equation models (pp. 136-162). Beverly
Hills, CA: Sage
205
Brown, J. M., & Weiss, D. J. (1977). An adaptive testing strategy for achievement test
batteries: Research report number 77-6. Minneapolis, MN: University of Minnesota.
Carter, J. E., & Wilkinson, L. (1984). A latent trait analysis of the MMPI. Multivariate
Behavioral Research, 19, 385-407. doi: 10.1207/s15327906mbr1904_2
Chen, S., Ankenmann, R. D., & Spray, J. A. (1999, April). The relationship between
item exposure rate and test overlap rate in computerized adaptive testing. Paper
presented at the annual meeting of the National Council on Measurement in
Education. Montreal, Canada.
Chen, F. F., West, S., & Sousa, K. (2006). A comparison of bifactor and second-order models
of quality of life. Multivariate Behavioral Research, 41, 189–225.
doi:10.1207/s15327906mbr4102_5
Chien, T. W., Wu, H. M., Wang, W. C., Castillo, R. V., & Chou, W. (2009). Reduction
in patient burdens with graphical computerized adaptive testing on the ADL scale:
Tool development and simulation. Health and Quality of Life Outcomes, 7, 39-44.
doi: 10.1186/1477-7525-7-39
Choi, S. W. (2009). Firestar: Computerized adaptive testing simulation program for
polytomous item response theory models. Applied Psychological Measurement,
33, 644-645. doi: 10.1177/0146621608329892
Choi, S. W., Grady, M. W., & Dodd, B. G. (2010a). A new stopping rule for computer
adaptive testing. Educational and Psychological Measurement, 70, 1-17. doi:
10.1177/0013164410387338.
Choi, S. W., Reise, S. P., Pilkonis, P. A., Hays, R. D., & Cella, D. (2010b). Efficiency
of computer adaptive short forms compared to full-length measures of depressive
symptoms. Quality of Life Research, 19, 125-136. doi: 10.1007/s11136-009-9560-
5

206
Choi, S. W., & Swartz, R. J. (2009). Comparison of CAT item selection criteria for
polytomous items. Applied Psychological Measurement, 33, 419-440. doi:
10.1177/0146621608327801.
Claassen, N.C.W., Meyer, H. M., & van Tonder, M. (1992). Manual for the General
Scholastic Aptitude Test (GSAT) Senior: Computer Adaptive Test. Pretoria, South
Africa: Human Sciences Research Council.
Clifton, S. (2014). Dimensionality of the Neuroticism Basic Traits Inventory scale.
Unpublished Masters Dissertation. Johannesburg, South Africa: University of
Johannesburg.
Costa, P. T., & McCrae, R. R. (1995). Domains and facets: Hierarchical personality
assessment using the revised NEO Personality Inventory. Journal of Personality
Assessment, 64, 21-50. doi: 10.1207/s15327752jpa6401_2
Crocker, L., & Algina, J. (1986). Introduction to classical and modern test theory.
Orlando, FL: Holt, Rinehart and Wilson.
Davis, L. L., & Dodd, B. G. (2005). Strategies for controlling item exposure in computerized
adaptive testing with the partial credit model. Pearson Research Reports.
de Ayala, R. J. (2009). The theory and practice of item response theory. New York, NY: The
Guilford Press.
de Beer, M. (2005). Development of the Learning Potential Computerised Adaptive
Test (LPCAT). SA Journal of Psychology, 35(4), 717-747. doi:
10.1177/00812463050350040
de Bruin, G. P. (2014). Measurement invariance of the Basic Traits Inventory in South
African job-applicants: A cross-cultural test of the Five-Factor model of personality.
Article submitted for review to Personality and Individual Differences.

207
de Bruin, G. P., & Rudnick, H. (2007). Examining the cheats: The role of conscientiousness
and excitement seeking in academic dishonesty. South African Journal of Psychology,
37, 153-164.
de Klerk, G. (2008). Classical test theory (CTT). In M. Born, C.D. Foxcroft & R. Butter
(Eds.), Readings in Testing and Assessment. International Test Commission.
DiBattista, D., & Gosse, L. (2006). Test anxiety and the Immediate Feedback
Assessment Technique. Journal of Experimental Education, 74, 311-327. doi:
10.3200/JEXE.74.4.311-328
Digman, J. M. (1989). Five robust trait dimensions: development, stability, and utility.
Journal of Personality, 57, 195–214. doi: 10.1111/j.1467-6494. 1989.tb00480.x
Digman, J. M. (1990). Personality structure: Emergence of the five-factor model.
Annual Review of Psychology, 41, 417-440. doi:
10.1146/annurev.ps.41.020190.002221
Dodd, B. G., de Ayala, R. J., & Koch, W. R. (1995). Computerized adaptive testing with
polytomous items. Applied Psychological Measurement, 19, 5-22. doi:
10.1177/014662169501900103
Eggen, J. H. M. (2012). Computerized adaptive testing item selection in computerized
adaptive learning systems. In, J. H. M. Eggen and B. P. Veldkamp (Eds.),
Psychometrics in practice at RCEC. Enscheded, Netherlands: University of
Twente.
Eggen, T. J. H. M., & Verschoor, A. J. (2006). Optimal testing with easy or difficult
items in computerized adaptive testing. Applied Psychological Measurement, 30,
379-393. doi: 10.1177/0146621606288890
208
Eisenhart, C. (1986). Laws of error II: The Gaussian distribution. In, S. Kotz and N. L.
Johnson (Eds.), Encyclopaedia of statistical sciences (Vol 4) (pp.547-562).
Toronto, Canada: Wiley.
Embretson, S. E., & Hershberger, S. L. (1999). Summary and future of psychometric
methods in testing. In S. E. Embretson & S. L. Hershberger (Eds.), The new rules
of measurement: What every psychologist and educator should know. Mahwah,
NJ: Lawrence Erlbaum and Associates.
Embretson, S. E., & Reise, S. P. (2000). Item response theory for psychologists.
Mahwah, NJ: Lawrence Erlbaum Publishers.
Engelhard, G. (2013). Invariant measurement: Using Rasch models in the social,
behavioural, and health sciences. New York, NY: Routledge.
Fisher, W. P. (2008a). Other historical and philosophical perspectives on invariance in
measurement. Measurement, 6, 190-212. doi: 10.1080/15366360802265961
Fisher, W. P. (2008b). A social history of the econometric origins of some widely used
psychometric models. Manuscript submitted for publication to The European
Journal of the History of Economic Thought.
Fliege, H., Becker, J., Walter, O. B., Bjorner, J. B., Klapp, B. F., & Rose, M. (2005).
Development of a computer-adaptive test for depression (D-CAT). Quality of Life
Research, 14, 2277-2291. doi: 10.1007/s11136-005-6651-9
Flora, D. B., & Curran, P. J. (2004). The empirical evaluation of alternative methods of
estimation for confirmatory factor analysis with ordinal data. Psychological
Methods, 9, 466-491. doi: 10.1037/1082-989X.9.4.466
Forbey, J. D., & Ben-Porath, Y. S. (2007). Computerized adaptive personality testing: A
review and illustration with the MMPI-2 computerized adaptive version.
Psychological Assessment, 19, 14-24. doi: 10.1037/1040-3590.19.1.14

209
Forbey, J. D., Ben-Porath, Y. S., & Arbisi, P. A. (2012). The MMPI-2 computerized
adaptive version (MMPI-2-CA) in a VA medical outpatient facility. Psychological
Assessment, 24, 628-639. doi: 10.1037/a0026509
Forbey, J. D., Handel, R. W., & Ben-Porath, Y. S. (2000). A real data simulation of
computerized adaptive administration of the MMPI-A. Computers in Human Behavior,
16, 83-96. doi: 10.1037/1040-3590.4.1.26
Frey, A., & Seitz, N. N. (2009). Multidimensional adaptive testing in educational and
psychological measurement: Current state and future challenges. Studies in Educational
Evaluation, 35, 89-94. doi: 10.1016/j.stueduc.2009.10.007
Gershon, R. C. (2004). Computer adaptive testing. In E. V. Smith & R. M. Smith (Eds.),
Introduction to Rasch measurement (pp. 601 – 629). Maple Grove, MN: JAM
Press.
Georgiadou, E., Triantafillou, E., & Economides, A. A. (2006). Evaluation parameters
for computer-adaptive testing. British Journal of Educational Technology, 37,
261-278. doi: 10.1111/j.1467-8535.2005.00525.x.
Gibbons, R. D., Weiss, D. J., Kupfer, D. J., Frank, E., Fagiolini, A., Grochocinski, V. J.,
Bhaumik, D. K., Stover, A., Bock, R. D., & Immekus, J. C. (2008). Using
computerized adaptive testing to reduce the burden of mental health assessment.
Psychiatric Services, 59, 361-368. doi: 10.1176/appi.ps.59.4.361
Goldberg, L. R. (1992). The development of markers for the Big-Five factor structure.
Psychological Assessment, 4, 26-42. doi: 10.1037/1040-3590.4.1.26
Grobler, S. (2014). The impact of language on personality assessment with the Basic Traits
Inventory. Unpublished doctoral thesis. Pretoria, South Africa: University of South
Africa.

210
Gu, L., & Reckase, M. D. (2007). Designing optimal item pools for computerized adaptive
tests with Sympson-Hetter exposure control. In, D. J. Weiss (Ed.), Proceedings of the
2007 GMAC conference on computerized adaptive testing. Retrieved from
http://www.psych.umn.edu/psylabs/CATCentral/
Hagquist, C., & Andrich, D. (2004). Detection of differential item functioning using analysis
of variance. Paper presented at the Second International Conference on Measurement in
Health. Perth, Australia: Murdoch University.
Haley, S. M., Ni, P., Hambleton, R. K., Slavin, M. D., & Jette, A. M. (2006). Computer
adaptive testing improved accuracy and precision scores over random item selection in
a physical functioning item bank. Journal of Clinical Epedemiology, 59, 1174-1182.
doi: 10.1016/j.jclinepi.2006.02.010
Hambleton, R. K., & Jones, R. W. (1993). A comparison of classical test theory and
item response theory and their applications to test development. Educational
Measurement: Issues and Practice, NCME Instructional Module, 38-46.
Harvey, R. J., & Hammer, A. L. (1999). Item response theory. The Counseling
Psychologist, 27, 353-383. doi: 10.1177/0011000099273004
Hart, D. L., Cook, K. F., Mioduski, J. E., Teal, C. R., & Crane, P. K. (2006). Simulated
computerized adaptive test for patients with shoulder impairments was efficient
and produced valid measures of function. Journal of Clinical Epidemiology, 59,
290-298. doi: 10.1016/j.jclinepi.2005.08.006
Higgins, D. M., Peterson, J. B., Lee, A. G. M., & Pihl, R. O. (2007). Prefrontal
cognitive ability, intelligence, Big Five personality, and the prediction of advanced
academic and workplace performance. Journal of Personality and Social
Psychology, 93, 298-319. doi: : 10.1037/0022-3514.93.2.298

211
Hobson, E. G. (2015). Using the Rasch model in a computer adaptive testing application to
enhance the measurement quality of emotional intelligence. Unpublished doctoral
thesis. Johannesburg, South Africa: University of Johannesburg.
Hogan, T. (2014). Using a computer-adaptive test simulation to investigate test coordinators’
perceptions of a high-stakes computer-based testing programme. Published doctoral
dissertation. Georgia State University, Georgia.
Hogan, R., & Hogan, J. (2007). Hogan Personality Inventory manual. Tulsa, OK:
Hogan Assessment Systems.
Hol, A. M., Vorst, H. C. M., & Mellenbergh, G. J. (2005). A randomized experiment to
compare conventional, computerized, and computerized adaptive administration of
ordinal polytomous attitude items. Applied Psychological Measurement, 29, 159-
183. doi: 10.1177/0146621604271268
Hol, A. M., Vorst, H. C. M., & Mellenbergh, G. J. (2008). Computerized adaptive
testing of personality traits. Journal of Psychology, 216, 12-21. doi: 10.1027/0044-
3409.216.1.12
Holzinger, K. J., & Swineford, F. (1939). A study in factor analysis: The stability of a
bifactor solution. Supplementary Educational Monographs, no.48. Chicago, IL:
University of Chicago Press.
Hsu, C. L., Zhao, Y., & Wang, W. C. (2013). Exploiting computerized adaptive testing
for self-directed learning. Education in the Asia-Pacific Region: Issues, Concerns,
and Prospects, 18, 257-280. doi: 10.1007%2F978-94-007-4507-0_14
Hu, L., & Bentler, P. M. (1999). Cutoff criteria for fit indexes in covariance structure
analysis: Conventional criteria versus new alternatives. Structural Equation
Modeling: A Multidisciplinary Journal, 6, 1-55. doi: 10.1080/10705519909540118

212
IBM Corp. (2013). IBM SPSS statistics for Windows version 22.0. Amonk, NY: IBM
Corp.
Kaplan, R. M., & Saccuzzo, D. P. (2013). Psychological testing: Principles,
applications and issues (8th ed.). Belmont, CA: Wadsworth Cengage-Learning.
Kenny, D. A., & McCoach, D. B. (2003). Effect of the number of variables on measures
of fit in structural equation modeling. Structural Equation Modeling, 10, 333-351.
doi: 10.1207/S15328007SEM1003_1
Kersten, P., & Kayes, N. M. (2011). Outcome measurement and the use of Rasch
analysis: A statistics-free introduction. New Zealand Journal of Physiotherapy, 39,
92-99.
Kingsbury, G. G. (2009). Adaptive item calibration: A process for estimating item
parameters within a computerized adaptive test. In D. J. Weiss (Ed.), Proceedings
of the 2009 GMAC conference on computerized adaptive testing.
Kingsbury, G. G., & Zara, A. R. (1989). Procedures for selecting items for
computerized adaptive tests. Applied Measurement in Education, 2, 359-375. doi:
10.1207/s15324818ame0204_6
Kline, T. J. B. (2005). Psychological testing: A practical approach to design and
evaluation. Thousand Oaks, CA: Sage Publications.
Koch, W. R., & Dodd, B. G. (1995). An investigation of procedures for computerized
adaptive testing using the successive intervals Rasch model. Educational and
Psychological Measurement, 55, 976-990. doi: 10.1177/0013164495055006006
Kreitzberg, C. B., Stocking, M. L., & Swanson, L. (1978). Computerized adaptive
testing: Principles and directions. Computers & Education, 2, 319-329. doi:
10.1016/0360-1315(78)90007-6

213
Lai, J. S., Cella, D., Chang, C. H., Bode, R. K., & Heinemann, A. W. (2003). Item
banking to improve, shorten and computerize self-reported fatigue: An illustration
of steps to create a core item bank from the FACIT-Fatigue Scale. Quality of Life
Research, 12, 485-501. doi: 10.1023%2FA%3A1025014509626
Leung, C-K., Chang, H-H., & Hua, K-T. (2000, April). Content balancing in stratified
computerized adaptive designs. Paper presented at the annual meeting of the
American Educational Research Association. New Orleans, Los Angeles.
Leung, C-K., Chang, H-H., & Hua, K-T. (2003). Computerized adaptive testing: A
comparison of three content balancing methods. The Journal of Technology,
Learning and Assessment, 5, 1-16. Available from http://www.jtla.org
Li, Y., Jiao, H., & Lissitz, R.W. (2012). Applying multidimensional IRT models in
validating test dimensionality: An example of K-12 large-scale science
assessment. Journal of Applied Testing Technology, 13, 1-27. Available online at
http://www.jattjournal.com/index.php/atp/article/view/48367
Linacre, J. M. (2014). Winsteps® Rasch measurement computer program. Beaverton,
Oregon: Winsteps.com
Linacre, J. M. (2010). When to stop removing items and person in Rash misfit analysis.
Rasch Measurement Transactions, 23, 1241.
Linacre, J. M. (2002a). Optimizing rating scale category effectiveness. Journal of Applied
Measurement, 3, 85-106. doi: 10.1.1.424.2811&rep=rep1&type=pdf
Linacre, J. M. (2002b). What do infit and outfit, mean-square and standardized mean? Rasch
Measurement Transactions, 16, 878.
Linacre, J. M. (2000). Computer-adaptive testing: A methodology whose time has
come. In S. Chae, U. Kang, E. Jeon & J. M. Linacre (Eds), Development of

214
Computerized Middle School Achievement Test. Seoul, South Korea: Komesa
Press.
Lord, F. N., & Novick, M. R. (1968). Statistical theories of mental test scores. Reading,
MA: Addison-Wesley.
Ma, S-C., Chien, T-W., Wang, H-H., Li, Y-C., & Yui, M. S. (2014). Applying
computerized adaptive testing to the negative acts questionnaire-revised: Rasch
analysis of workplace bullying. Journal of Medical Internet Research, 16, e50.
doi: 10.2196/jmir.2819.
Macdonald, P., & Paunonen, S. V. (2002). A Monte Carlo comparison of item and
person statistics based on item response theory versus classical test theory.
Educational and Psychological Measurement, 62, 921-943. doi:
10.1177/0013164402238082
Marais, I., & Andrich, D. (2008). Effects of varying magnitude and patterns of response
dependence in the unidimensional Rasch model. Journal of Applied Measurement,
9, 105-124.
Masters, G. N. (1982). A Rasch model for partial credit scoring. Psychometrika, 47,
149-174. doi: 10.1007/BF02296272
Maydeu-Olivares, A. (2001). Multidimensional item response theory modeling of
binary data: Large sample properties of NOHARM estimates. Journal of
Educational and Behavioural Statistics, 26, 115-132. doi:
10.3102/10769986026001051
McCrae, R. R. (2002). NEO-PI-R data from 36 cultures: further intercultural
comparisons. In R. R. McCrae, & J. Allik (Eds.), The Five-Factor Model of
Personality Across Cultures (pp. 105–125). New York, NY: Kluwer Academy.

215
McCrae, R. R., & , Allik, J. (2002). The Five-Factor Model of personality across
cultures. New York, NY: Kluwer Academy.
McCrae, R. R., & Costa, P. T. (2010). NEO inventories: Professional manual. Lutz, FL:
Psychological Assessment Resources Inc.
McDonald, R. P. (1999). Test theory: A unified treatment. Mahwah, NJ: Lawrence
Erlbaum and Associates.
Mead, A. D., & Drasgow, F. (1993). Equivalence of computerized and paper-and-pencil
cognitive ability tests: A meta-analysis. Psychological Bulletin, 114, 449-458. doi:
10.1037/0033-2909.114.3.449
Meijer, R. R., & Neiring, M. L. (1999). Computerized adaptive testing: Overview and
introduction. Applied Psychological Measurement, 23, 187-194. doi:
10.1177/01466219922031310
Mellenbergh, G. J., & Vijn, P. (1981). The Rasch model as a loglinear model. Applied
Psychological Measurement, 5, 369-376.
Metzer, S. A., de Bruin, G. P., & Adams, B. G. (2014). Examining the construct validity of
the Basic Traits Inventory and the Ten-Item Personality Inventory in the South African
context. SA Journal of Industrial Psychology, 40(1), 1–9. doi:10.4102/sajip.v40i1.1005
Monseur, C., Baye, A., Lafontaine, D., & Quittre, V. (2011). PISA test format assessments
and the local independence assumption. IERI Monograph Series: Issues and
Methodologies in Large-Scale Assessments, 4, 131-155.
Morgan, B., & de Bruin, K. (2010). The relationship between the big five personality traits
and burnout in South African university students. South African Journal of Psychology,
40, 182-191.

216
Muthén, B. (1984). A general structural equation model with dichotomous, ordered
categorical, and continous latent varaible indicators. Psychometrika, 49, 115-132. doi:
10.1007/BF02294210
Ortner, T. M. (2008). Effects of changed item order: A cautionary note to practitioners
on jumping to computerized adaptive testing for personality assessment.
International Journal of Selection and Assessment, 16, 249-257. doi:
10.1111/j.1468-2389.2008.00431.x
Ortner, T.M., & Caspers, J. (2011). Consequences of test anxiety on adaptive versus
fixed item testing. European Journal of Psychological Assessment, 27, 157-163.
doi: 10.1027/1015-5759/a000062
Osborne, J. (2008). Best practices in quantitative methods: An introduction to Rasch
measurement. Sage Research Methods Online, 50-70. doi:
10.4135/9781412995627
Ostini, R., & Nering, M. L. (2006). Polytomous item response theory models:
Quantitative applications in the social sciences. London, England: Sage
Publications.
Owen, R. J. (1975). A Bayesian sequential procedure for quantal response in the context
of adaptive mental testing. Journal of the American Statistical Association, 70,
351-356. doi: 10.1080/01621459.1975.10479871
Pallant, J. F., & Tennant, A. (2007). An introduction to the Rasch measurement model:
An example using the Hospital Anxiety and depression scale (HADS). British
Journal of Clinical Psychology, 46, 1-18. doi: 10.1348/014466506X96931
Paunonen, S. V. (1998). Hierarchical organisation of personality and prediction of behavior.
Journal of Personality and Social Psychology, 74, 538-556. doi: 10.1037/0022-
3514.74.2.538

217
Penfield, R. D. (2006). Applying Bayesian item selection approaches to adaptive tests using
polytomous items. Applied Measurement in Education,19, 1–20. doi:
10.1207/s15324818ame1901_1
Pitkin, A. K., & Vispoel, W. P. (2001). Differences between self-adapted and computerized
adaptive tests: A meta-analysis. Journal of Educational Measurement, 38, 235- 247.
doi: 10.1111/j.1745-3984.2001.tb01125.x
Pomplun, M., Frey, S., & Becker, D. F. (2002). The score equivalence of paper and
computerized versions of a seeded test of reading comprehension. Educational and
Psychological Measurement, 62, 337-354.
Rasch, G. (1960). Probabilistic models for some intelligence and attainment tests.
Chicago, IL: University of Chicago Press.
Rasch, G. (1961). On general laws and meaning of measurement in psychology. In J.
Neyman (Ed.), Proceedings of the fourth Berkeley Symposium on mathematical
statistics and probability. Berkeley, CA.
Ramsay, L. J., Taylor, N., de Bruin, G. P., & Meiring, D. (2008). The big five personality
factors at work: A South African validation study. In, J. Deller (Ed.), Research
contributions to personality at work (pp. 99-112). Munich, Germany: Rainer
HamppVerlag.
Raykov, T., & Marcoulides, G. A. (2006). A first course in structural equation modeling
(2nd ed.). Mahwah, NJ: Lawrence Erlbaum Associates Inc.
R Core Team (2013). R: A language and environment for statistical computing. R
Foundation for Statistical Computing. Vienna, Austria: http://www.R-project.org/.
Reckase, M., D. (2009). Multidimensional item response theory: Statistics for social and
behavioral sciences. New York, NY: Springer.
218
Reise, S. P., Bonifay, W. E., & Haviland, M. G. (2013). Scoring and modeling psychological
measures in the presence of multidimensionality. Journal of Personality Assessment,
95, 129-140. doi: 10.1080/00223891.2012.725437
Reise, S. P., & Henson, J. M. (2000). Computerization and adaptive administration of
the NEO PI-R. Assessment, 7, 347-364. doi: 10.1177/107319110000700404
Reise, S. P., Moore, T. M., & Haviland, M. G. (2010). Bifactor models and rotations:
Exploring the extent to which multidimensional data yield univocal scale scores.
Journal of Personality and Assessment, 92, 544-559. doi:
10.1080/00223891.2010.496477
Reise, S. P., Moore, T. M., & Maydue-Olivares, A. (2011). Target rotations and assessing the
impact of model violations on the parameters of unidimensional item response theory
models. Forthcoming in Educational and Psychological Measurement.
Reise, S. P., Morizot, J., & Hays, R. D. (2007). The role of the bifactor model in resolving
dimensionality issues in health outcomes measures. Quality of Life Research, 16, 19-31.
doi: 10.1007/s11136-007-9183-7
Reise, S. P., Widaman, K. F., & Pugh, R. H. (1993). Confirmatory factor analysis and item
response theory: Two approaches for exploring measurement invariance. Psychological
Bulletin, 114, 552-566. doi: 10.1037/0033-2909.114.3.552
Rosseel, Y. (2012). lavaan: An R package for structural equation modeling. Journal of
Statistical Software, 48, 1-36. Available online at
www.jstatsoft.org/article/view/v048i02/v48i02.pdf
Rothstein, M. G., & Goffin, R. D. (2006). The use of personality measures in personnel
selection: What does current research support? Human Resource Management
Review, 16, 155-180. doi: 10.1016/j.hrmr.2006.03.004

219
Rudner, L. M. (2014). An on-line, interactive, computer adaptive testing tutorial 11/98.
Retrieved online from http://echo.edres.org:8080/scripts/cat/catdemo.htm
Samejima, F. (1969). Estimation of latent ability using a response pattern of graded scores.
Psychometrika Monograph Supplement, No. 17.
Schmidt, K. M., & Embretson, S. E. (2003). Item response theory and measuring abilities. In,
J. A. Schinka, W. F. Velicer, & I. B. Weiner (Eds.), Hanbook of psychology volume 2:
Research methods in psychology (pp. 429 - 445). Hoboken, NJ: Wiley & Sons.
Segall, D. O. (2005). Computerized adaptive testing. Amsterdam, Netherlands: Encyclopedia
of Social Measurement.
Segall, D. O. (1996). Multidimensional adaptive testing. Psychomtrika, 61, 331-354. doi:
10.1007/bf02294343
Segall, D. O., & Moreno, K. E. (1999). Development of the computerized adaptive testing
version of the armed services vocational aptitude battery. In, F. Drasgow and J. B.
Olsen-Buchanan (Eds.), Innovations in computerized assessment. New York, NY:
Lawrence Erlbaum.
Sick, J. (2011). Rasch measurement in language education part 6: Rasch measurement and
factor analysis. SHIKEN: JALT Testing & Evaluation SIG Newsletter, 15, 15-17.
Sim, S. M., & Rasiah, R. I. (2006). Relationship between item difficulty and
discrimination indices in true/false-type multiple choice questions of a para-
clinical multidisciplinary paper. Annals of the Academy of Medicine, Singapore,
35, 67-71.
Simms, L. J., Goldberg, L. R., Roberts, J. E., Watson, D., Welte, J., & Rotterman, J. H.
(2011). Computerized adaptive assessment of personality disorder: Introducing the
CAT-PD project. Journal of Personality Assessment, 93, 380-389. doi:
10.1080/00223891.2011.57747

220
Smith, E. V., & Smith, R. M. (2004). Introduction to Rasch measurement: Theory,
models and applications. Maple Grove, MN: JAM Press.
Smits, N., Cuijpers, P., & van Straten, A. (2011). Applying computerized adaptive
testing to the CES-D scale: A simulation study. Psychiatry Research, 188, 147-
155. doi: 10.1016/j.psychres.2010.12.001
Stark, S., Chernyshenko, O. S., Drasgow, F., & White, L. A. (2012). Adaptive testing
with multidimensional pairwise preference items: Improving the efficiency of
personality and other non-cognitive assessments. Organizational Research
Methods, 15, 463-487. doi: 10.1177/1094428112444611
Statistics South Africa (2012). Census 2011 census in brief. Report No. 03-01-41. Pretoria,
South Africa: Statistics South Africa
Steiger, J. H. & Lind, J.C. (1980, June). Statistically-based tests for the number of common
factors. Paper presented for the annual Spring meeting of the Psychometric Society,
Iowa City, IA.
Streiner, D. L. (2010). Measure for measure: New developments in measurement and item
response theory. Canadian Journal of Psychiatry, 55, 180-186.
Taylor, N. (2004). The construction of a South African five-factor personality inventory.
Unpublished master’s dissertation. Rand Afrikaans University, Johannesburg,
South Africa.
Taylor, N. (2008). Construct, item, and response bias across cultures in personality
measurement. Unpublished doctoral thesis. Johannesburg, South Africa: University of
Johannesburg.
Taylor, N., & De Bruin, G. P. (2006). Basic Traits Inventory: Technical manual.
Johannesburg, South Africa: Jopie van Rooyen & Partners.

221
Taylor, N., & de Bruin, G. P. (2013). Basic Traits Inventory: Technical manual (3rd ed.).
Randburg, South Africa: JvR Psychometrics.
Taylor, N., & de Bruin, G. P. (2012). The Basic Traits Inventory. In S. Laher and K. Cockroft
(Eds.), Psychological assessment in South Africa: Research and applications.
Johannesburg, South Africa: LittleWhiteBakkie Publishers.
ten Holt, J. C., van Duijn, M. A. J., & Boomsma, A. (2010). Scale construction and
evaluation in practice: A review of factor analysis versus item response theory
applications. Psychological Test and Assessment Modeling, 52, 272-297.
Tennant, A., & Pallant, J. F. (2007). DIF matters: A practical approach to test
differential item functioning makes a difference. Rasch Measurement
Transactions, 20, 1082-1084.
Teresi, J. A., Ramirez, M., Lai, J-S., & Silver, S. (2008). Occurrences and sources of
differential item functioning (DIF) in patient-reported outcome measures:
Description of DIF methods, and review of measures of depression, quality of life
and general health. Psychology Science Quarterly, 50, 538-612.
Thissen, D., Reeve, B. B., Bjorner, J. B., & Chang, C-H. (2007). Methodological issues for
building item banks and computerized adaptive scales. Quality of Life Research, 16,
109-119. doi: 10.1007/s11136-007-9169-5
Thompson, T., & Way, D. (2007). Investigating CAT designs to achieve comparability with a
paper test. In, D. J. Weiss (Ed.), Proceedings of the 2007 GMAC Conferencd on
Computerized Adaptive Testing. Retrieved online from
http://www.psych.umn.edu/psylabs/catcentral/pdf%20files/cat07tthompson.pdf
Thompson, N. A., & Weiss, D. J. (2011). A framework for the development of computerized
adaptive tests. Practical Assessment, Research & Evaluation, 16. Available online:
http://pareonline.net/getvn.asp?v=16&n=1.

222
Thurstone, L. L. (1928). Attitudes can be measured. American Journal of Sociology, 33, 529-
554.
Traub, R. E. (1997). Classical test theory in historical perspective. Educational
Measurement: Issues and Practice, 16, 8-16. doi: 10.1111/j.1745-
3992.1997.tb00603.x
Triantafillou, E., Georgiadou, E., & Economides, A. A. (2008). The design and
evaluation of a computerized adaptive test on mobile devices. Computers &
Education, 50, 1319-1330. doi: 10.1016/j.compedu.2006.12.005
Tucker, L. R., & Lewis, C. (1973).A reliability coefficient for maximum likelihood factor
analysis. Psychometrika, 38, 1-10. doi: 10.1007/BF02291170
van der Linden, W.J. (1998). Bayesian item selection criteria for adaptive testing. Journal of
Educational and Behavioral Statistics, 22, 203-226. doi: 10.1007/BF02294775
van der Linden, W. J., & Pashley, P. J. (2000) Item selection and ability estimation in
adaptive testing. In, W. J. van der Linden and C. A. W. Glass (Eds.), Computerized
adaptive testing: Theory and practice. Amsterdam, Netherlands: Kluwer Academic
Publishers.
Veldkamp, B. P. (2003). Item selection in polytomous CAT. In, H. Yanai, A. Okada, K.
Shigemasu, Y. Kano, and J. J. Meulman (Eds.), New developments in psychometrics.
Tokyo, Japan: Springer-Verlag.
Veldkamp, B. P. , & van der Linden, W. J. (2000). Designing item pools for computerized
adaptive testing. In, W. J. van der Linden and C. A. W. Glas (Eds.), Computerized
adaptive testing: Theory and practice (pp.149-162). London, UK: Kluwer Academic
Publishers.
Verhelst, N. D., & Verstralen, H. H. F. M. (2008). Some considerations on the partial credit
model. Psicologica, 29, 229-254.

223
Vispoel, W. P., Rocklin, T. R., & Wang, T. (1994). Individual differences and test
administration procedures: A comparison of fixed-item, computerized-adaptive, and
self-adapted testing. Applied Measurement in Education, 53, 53-79. doi:
10.1207/s15324818ame0701_5
Vispoel, W. O., Wang, T., & Bleiler, T. (1997). Computerized adaptive and fixed-item
testing of music listening skill: A comparison of efficiency, precision, and concurrent
validity. Journal of Educational Measurement, 34, 43-63. doi: 10.1111/j.1745-
3984.1997.tb00506.x
Vogt, L., & Laher, S. (2009). The five factor model of personality and
individualism/collectivism in South Africa: An exploratory study. Psychology in
Society, 37, 39-54.
Walker, J., Böhnke, J.R., Cerny, T., & Strasser, F. (2010). Development of symptom
assessments utilising item response theory and computer adaptive testing – A practical
method based on a systematic review. Critical Reviews in Oncology/Hematology, 73,
47-67. doi: 10.1016/j.critrevonc.2009.03.007
Walter, O. B., Becker, J., Bjorner, J. B., Fliege, H., Klapp, B. F., & Rose, M. (2007).
Development and evaluation of a computer adaptive test for ‘Anxiety’ (Anxiety-CAT).
Quality of Life Research, 16, 143-155. doi: 10.1007/s11136-007-9191-7
Wang, X., Bo-Pan, W., & Harris, V. (1999). Computerized adaptive testing simulations using
real test-taker responses. Law School Admission Council Computerized Testing
Report. LSAC Research Report Series.
Wang, W-C., Chen, P-H., & Cheng, Y-Y. (2004). Improving measurement precision of test
batteries using multidimensional item response theory models. Psychological Methods,
9, 116-136. doi: 10.1037/1082-989x.9.1.116
224
Wang, T., & Kolen, M. J. (2001). Evaluating comparability in computerized adaptive
testing: Issues, criteria and an example. Journal of Educational Measurement, 38,
19-49. doi: 10.1111/j.1745-3984.2001.tb01115.x
Wang, H. W., & Shin, C. D. (2010). Comparability of computerized adaptive and paper
and pencil tests. Test, Measurement and Research Services Bulletin, 13, 1-7.
Available online at
http://images.pearsonassessments.com/images/tmrs/tmrs_rg/Bulletin_13.pdf
Ware, J. E., Jr., Bjorner, J. B., & Kosinski, M. (2000). Practical implications of item
response theory and computerized adaptive testing: a brief summary of ongoing
studies of widely used headache impact scales. Medical.Care, 38, 1173-1182.
Wauters, K., Desmet, P., & Van den Noortgate, W. (2010). Adaptive item-based
learning environments based on item response theory: Possibilities and challenges.
Journal of Computer Assisted Learning, 26, 549-562. doi: 10.1111/j.1365-
2729.2010.00368.x
Weiss, D. J. (2004). Computerized adaptive testing for effective and efficient
measurement in counseling and education. Measurement and Evaluation in
Counseling and Development, 37, 70-84.
Weiss, D. J. (2011). Better data from better measurements using computerized adaptive
testing. Journal of Methods and Measurement in the Social Sciences, 2, 1-27.
Weiss, D. J. (2013). Item banking, test development, and test delivery. In, K. F.
Geisinger, B. A. Bracken, J. F. Carlson, J. C. Hansen, N. R. Kuncel, S. P. Reise, &
M. C. Rodriguez (Eds). APA handbook of testing and assessment in psychology,
Vol. 1: Test theory and testing and assessment in industrial and organizational
psychology, (pp.185-200). Washington, DC: American Psychological Association.
225
Wise, S. G., & Kingsbury, G.G. (2000). Practical issues in developing and maintaining a
computerized adaptive testing program. Psicologia, 21, 135-155.
Wright, B. D., & Douglas, G. A. (1986). A rating scale model for objective
measurement. Mesa Psychometric Laboratory, Memorandum No.35.
Wright, B. D., & Linacre, J. M. (1994). Reasonable mean-square fit values. Rasch
Measurement Transactions, 8, 370.
Wright, B. D., & Masters, G. N. (1982). Rating scale analysis. Chicago, Il: MESA Press.
Wright, B. D., & Stone, M. H. (1999). Measurement Essentials (2nd ed.). Wilmington, DC:
Wide Range, Inc.
Yu, C. H., Popp, S. O., DiGangi, S., & Jannasch-Pennell, A. (2007). Assessing
unidimensionality: A comparison of Rasch modeling, parallel analysis, and TETRAD.
Practical Assessment, Research & Evaluation, 12. Available online:
http://pareonline.net/getvn.asp?v=12&n=14
Zhou, X. (2012). Designing p-optimal item pools in computerized adaptive tests with
polytomous items. Unpublished doctoral dissertation. Michigan State University.
Zickar, M. J., & Broadfoot, A. A. (2009). Partial revival of a dead horse? Comparing
classical test theory and item response theory. In C. E. Lance & R. J. Vandenberg
(Eds.), Statistical and methodological myths and urban legends: Doctrine, verity
and fable in the organizational and social sciences. New York, NY: Routledge
Publishers.
Zinbarg, R. E., Revelle, W., Yovel, I., & Li, W. (2005). Cronbach’s α, Revelle’s β, and
Mcdonald’s ωH: their relations with each other and two alternative conceptualizations
of reliability. Psychometrika, 70, 123–133. doi:10.1007/s11336-003-0974-7

226
Zwick, R. (2009). The investigation of differential item functioning in adaptive tests. In, W.
J. van der Linden and C. A. W. Glas (Eds.), Statistics for the social and behavioral
sciences: Elements of adaptive testing (pp.331-352). New York: Springer.

227
Appendix A: Item usage statistics for the adaptive full and adaptive core test versions
Figure 5.1b. Item administration of the Extraversion core adaptive
scale.
0
200
400
600
800
1000
1200
1400
5 6 7 8 9 10 11 12 13 14 15 16 17 18 19 20 21 22 23
Num
ber
of
Per
sons
Number of Items Administered
Figure 5.1a. Item administration of the Extraversion full adaptive
scale.
0
200
400
600
800
1000
1200
1400
5 8 11 14 17 20 23 26 29 32 35
Num
ber
of
Per
sons
Number of Items Administered

228
Figure 5.2b. Item administration of the Neuroticism full adaptive scale.
0
200
400
600
800
1000
1200
1400
5 8 11 14 17 20 23 26 29 32
Num
ber
of
Per
sons
Number of Items Administered
Figure 5.2b. Item administration of the Neuroticism core adaptive
scale.
0
200
400
600
800
1000
1200
1400
5 8 11 14 17 20 23
Num
ber
of
Per
sons
Number of Items Administered

229
Figure 5.3a. Item administration of the Conscientiousness full adaptive
scale.
0
50
100
150
200
250
300
5 8 11 14 17 20 23 26 29 32 35 38 41
Num
ber
of
Per
sons
Number of Items Administered
0
200
400
600
800
1000
1200
1400
5 8 11 14 17 20 23
Num
ber
of
Per
sons
Number of Items Administered
Figure 5.3b. Item administration of the Conscientiousness core
adaptive scale.

230
Figure 5.4a. Item administration of the Openness full adaptive scale.
0
100
200
300
400
500
600
700
800
900
1000
5 8 11 14 17 20 23 26 29 32
Num
ber
of
Per
sons
Number of Items Administered
Figure 5.4b. Item administration of the Openness core adaptive scale.
0
100
200
300
400
500
600
5 8 11 14 17 20 23
Num
ber
of
Per
sons
Number of Items Administered

231
Figure 5.5a. Item administration of the Agreeableness full adaptive
scale.
0
200
400
600
800
1000
1200
5 7 9 11 13 15 17 19 21 23 25 27 29 31 33 35 37
Num
ber
of
Per
sons
Number of Items Administered
Figure 5.5b. Item administration of the Agreeableness core adaptive
scale.
0
100
200
300
400
500
600
700
800
5 8 11 14 17 20 23 26 29
Num
ber
of
Per
sons
Number of Items Administered
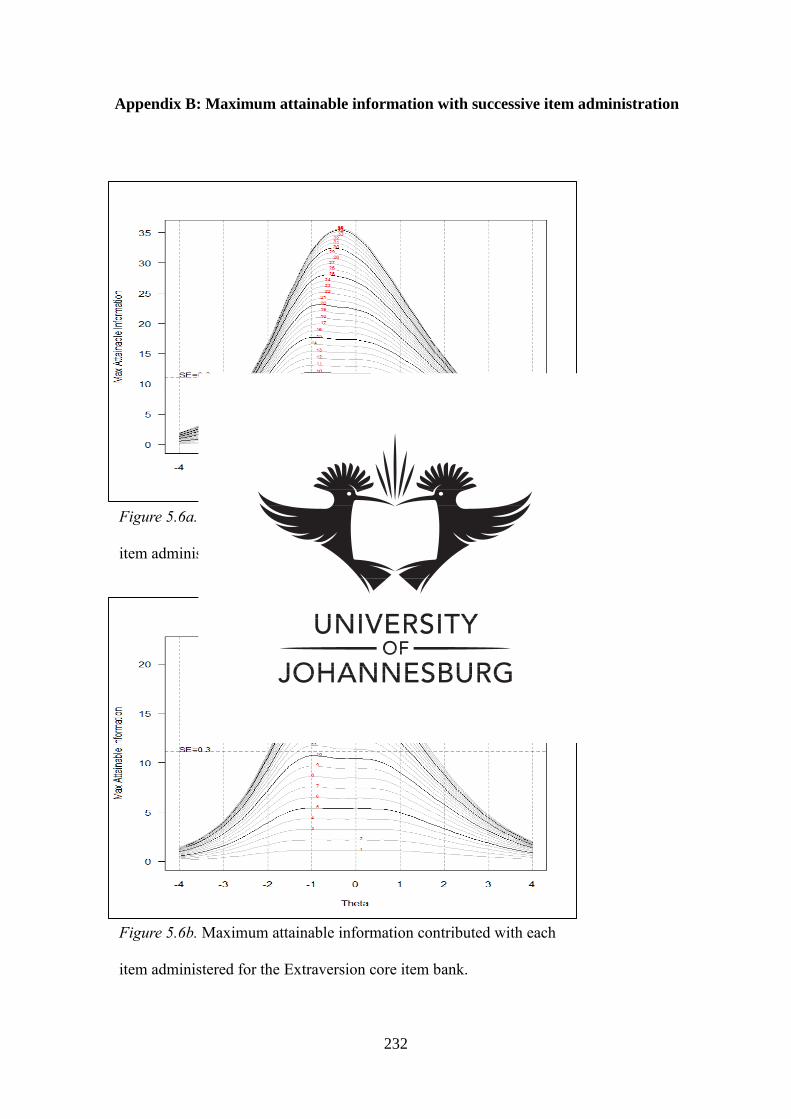
232
Appendix B: Maximum attainable information with successive item administration
Figure 5.6a. Maximum attainable information contributed with each
item administered for the Extraversion full item bank.
Figure 5.6b. Maximum attainable information contributed with each
item administered for the Extraversion core item bank.

233
Figure 5.7a. Maximum attainable information contributed with each
item administered for the Neuroticism full item bank.
Figure 5.7b. Maximum attainable information contributed with each
item administered for the Neuroticism core item bank.

234
Figure 5.8a. Maximum attainable information contributed with each
item administered for the Conscientiousness full item bank.
Figure 5.8b. Maximum attainable information contributed with each
item administered for the Conscientiousness core item bank.

235
Figure 5.9a. Maximum attainable information contributed with each
item administered for the Openness full item bank.
Figure 5.9b. Maximum attainable information contributed with each
item administered for the Openness core item bank.

236
Figure 5.10a. Maximum attainable information contributed with each
item administered for the Agreeableness full item bank.
Figure 5.10b. Maximum attainable information contributed with each
item administered for the Agreeableness core item bank.
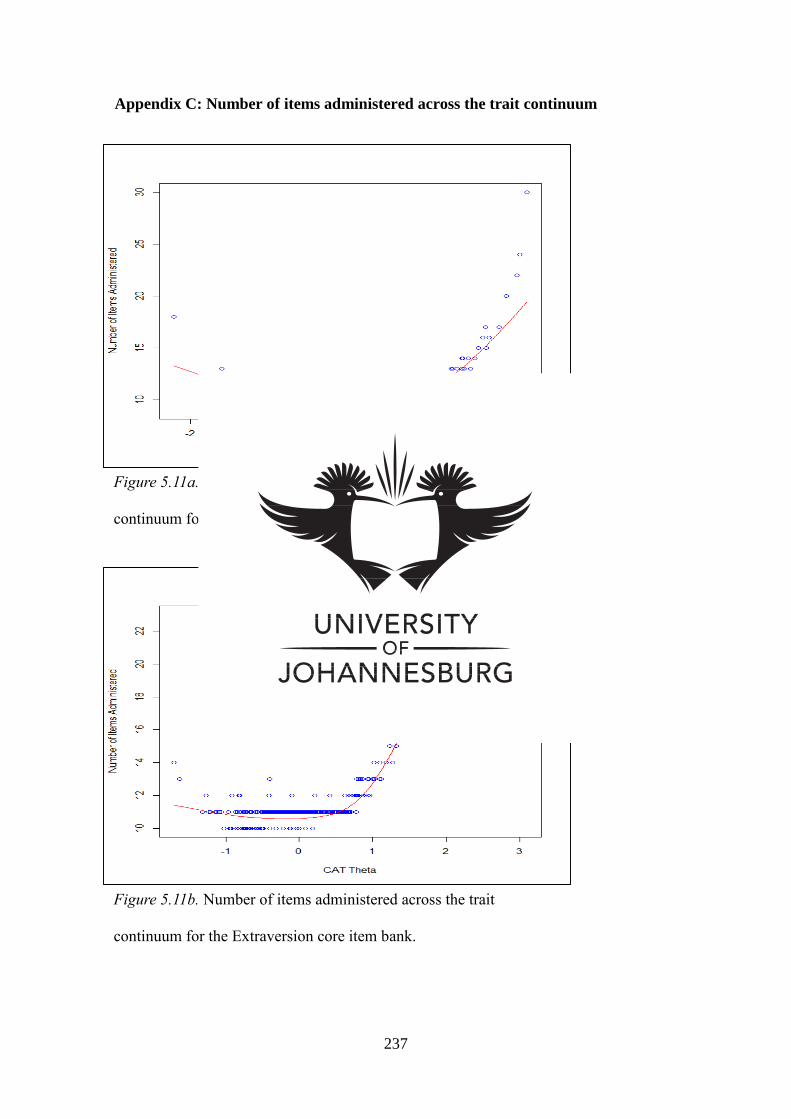
237
Appendix C: Number of items administered across the trait continuum
Figure 5.11a. Number of items administered across the trait
continuum for the Extraversion full item bank.
Figure 5.11b. Number of items administered across the trait
continuum for the Extraversion core item bank.
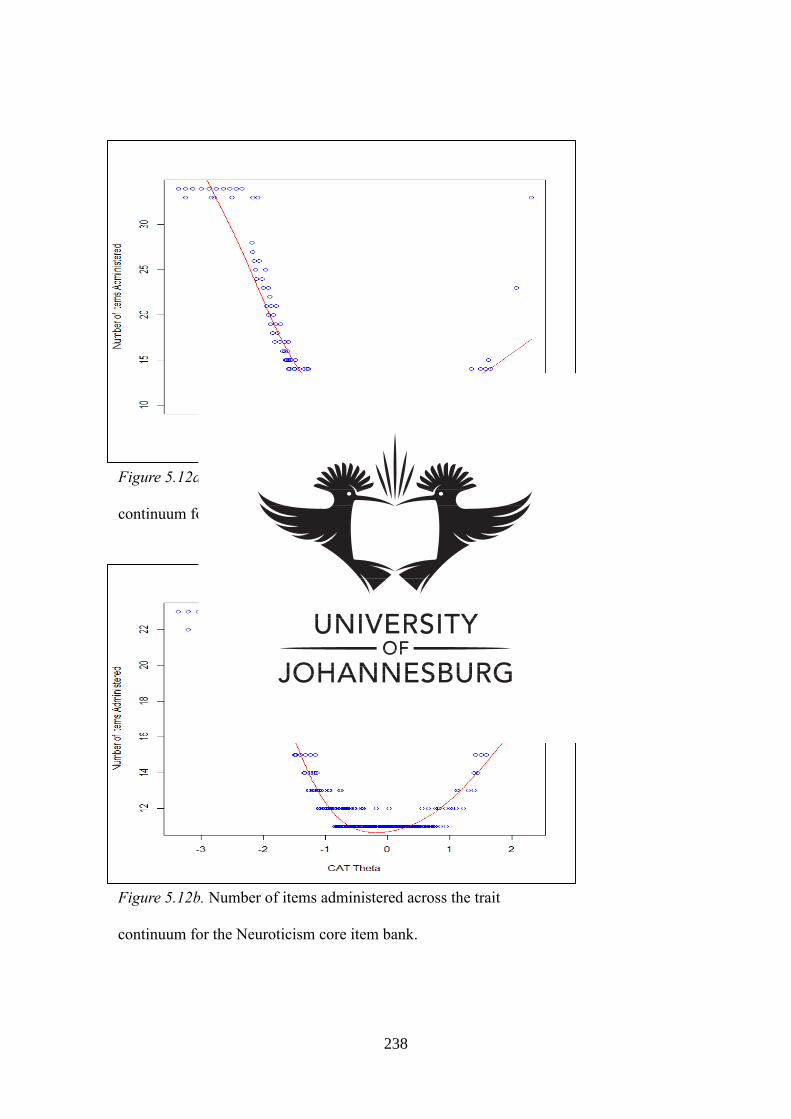
238
Figure 5.12a. Number of items administered across the trait
continuum for the Neuroticism full item bank.
Figure 5.12b. Number of items administered across the trait
continuum for the Neuroticism core item bank.

239
Figure 5.13a. Number of items administered across the trait
continuum for the Conscientiousness full item bank.
Figure 5.13b. Number of items administered across the trait
continuum for the Conscientiousness core item bank.

240
Figure 5.14a. Number of items administered across the trait
continuum for the Openness full item bank.
Figure 5.14b. Number of items administered across the trait
continuum for the Openness core item bank.
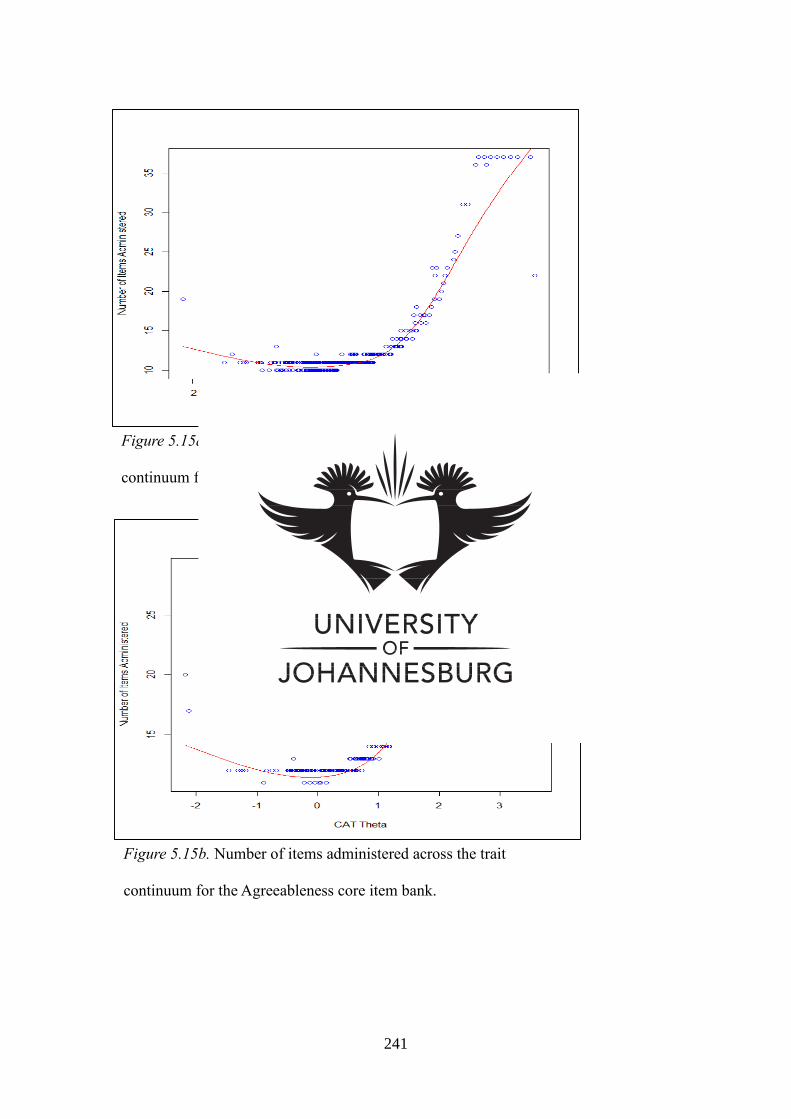
241
Figure 5.15a. Number of items administered across the trait
continuum for the Agreeableness full item bank.
Figure 5.15b. Number of items administered across the trait
continuum for the Agreeableness core item bank.