Development and assessment of broadband surface albedo ... · from Clouds and the Earth’s Radiant...
19
Development and assessment of broadband surface albedo from Clouds and the Earth’s Radiant Energy System Clouds and Radiation Swath data product David Rutan, 1 Fred Rose, 1 Miguel Roman, 2 Natividad Manalo-Smith, 1 Crystal Schaaf, 2 and Tom Charlock 3 Received 27 June 2008; revised 14 January 2009; accepted 29 January 2009; published 30 April 2009. [1] We describe a method to determine broadband albedo globally over land viewed by the Clouds and the Earth’s Radiant Energy System (CERES) scanning radiometers on board the TRMM, Terra, and Aqua satellites. This albedo is used as a surface boundary condition for a fast radiation transfer code in the Surface and Atmospheric Radiation Budget (SARB) subsystem of the CERES processing scheme. Cloudy sky surface albedo is estimated from derived clear sky values. Clear sky surface albedo is assessed by comparing the CERES/SARB-based surface albedo with the bidirectional reflectance distribution function (BRDF)–based surface albedo supplied by the MODIS land surfaces group. The SARB method employs broadband observations at the top of atmosphere (TOA) and assumes relative spectral shape of surface albedo. The MODIS group uses higher spatial resolution observations in several shortwave window channels to retrieve spectral surface albedos and then scales up to broadband surface albedo. Comparisons over snow-free land show good agreement between the two independent products on the scale of the CERES footprint. Biases run approximately 0.005 absolute or 0.02 relative with SARB albedo, generally lower than MODIS. We find little dependence on view geometry and slight functional dependence on aerosol optical depth. The value selected for a priori surface spectral albedo is important, but not critical, when retrieving broadband surface albedo with broadband TOA data. However, based on calculations, aerosol forcing to TOA flux changes in spectral albedo shape can affect aerosol forcing for as much as would a 15% absolute change in the original broadband surface albedo. Citation: Rutan, D., F. Rose, M. Roman, N. Manalo-Smith, C. Schaaf, and T. Charlock (2009), Development and assessment of broadband surface albedo from Clouds and the Earth’s Radiant Energy System Clouds and Radiation Swath data product, J. Geophys. Res., 114, D08125, doi:10.1029/2008JD010669. 1. Introduction [2] Clouds and the Earth’s Radiant Energy System (CERES) instruments [Wielicki et al., 1996] on NASA’s Tropical Rainfall Measurement Mission (TRMM), and Earth Observing System (EOS) Terra and Aqua satellites measure broadband shortwave and longwave energy reflected and emitted at the Top of the Atmosphere (TOA) as a follow on to the NASA Earth Radiation Budget Experiment (ERBE [Barkstrom and Smith, 1986]). CERES however goes beyond ERBE with advanced data products that synthesize broadband observations with other EOS data streams. One such product is the Clouds and Radiation Swath (CRS) developed by the CERES Surface and Atmo- spheric Radiation Budget (SARB) working group [Charlock et al., 1997, 2006]. SARB runs a fast radiation transfer calculation whose location is dictated by the CERES field of view. The TRMM satellite is in a precessing orbit of 36°; it observes the tropics and midlatitudes at varying times of day. Terra and Aqua are in sun-synchronous orbits, and so view all latitudes. These orbits and the viewing capabilities of CERES and other instruments on board enable surface albedo estimates for the entire globe and for different times of day. [3] Broadband surface albedo is generally defined as the ratio of shortwave solar irradiance (generally between 0.2 mm and 4.0 mm) reflected by a surface to the irra- diance impinging on that same surface. Since incoming irradiance is dependent on atmospheric state, reflected irradiance is dependent upon surface properties, and both change over time, surface albedo is then clearly a continu- ously varying function of atmospheric and surface condi- tions. Hence the accuracy of a retrieval method for broadband surface albedo depends upon an accurate de- scription of the atmosphere and the reflective properties of a surface over time. The goal of this paper is to describe JOURNAL OF GEOPHYSICAL RESEARCH, VOL. 114, D08125, doi:10.1029/2008JD010669, 2009 Click Here for Full Articl e 1 Science Systems and Applications, Inc., Hampton, Virginia, USA. 2 Department of Geography, Center for Remote Sensing, Boston University, Boston, Massachusetts, USA. 3 Science Directorate, NASA Langley Research Center, Hampton, Virginia, USA. Copyright 2009 by the American Geophysical Union. 0148-0227/09/2008JD010669$09.00 D08125 1 of 19
-
Upload
trinhquynh -
Category
Documents
-
view
214 -
download
1
Transcript of Development and assessment of broadband surface albedo ... · from Clouds and the Earth’s Radiant...
Development and assessment of broadband surface albedo
from Clouds and the Earth’s Radiant Energy System
Clouds and Radiation Swath data product
David Rutan,1 Fred Rose,1 Miguel Roman,2 Natividad Manalo-Smith,1 Crystal Schaaf,2
and Tom Charlock3
Received 27 June 2008; revised 14 January 2009; accepted 29 January 2009; published 30 April 2009.
[1] We describe a method to determine broadband albedo globally over land viewed bythe Clouds and the Earth’s Radiant Energy System (CERES) scanning radiometers onboard the TRMM, Terra, and Aqua satellites. This albedo is used as a surface boundarycondition for a fast radiation transfer code in the Surface and Atmospheric RadiationBudget (SARB) subsystem of the CERES processing scheme. Cloudy sky surface albedois estimated from derived clear sky values. Clear sky surface albedo is assessed bycomparing the CERES/SARB-based surface albedo with the bidirectional reflectancedistribution function (BRDF)–based surface albedo supplied by the MODIS land surfacesgroup. The SARB method employs broadband observations at the top of atmosphere(TOA) and assumes relative spectral shape of surface albedo. The MODIS group useshigher spatial resolution observations in several shortwave window channels to retrievespectral surface albedos and then scales up to broadband surface albedo. Comparisonsover snow-free land show good agreement between the two independent products on thescale of the CERES footprint. Biases run approximately 0.005 absolute or 0.02 relativewith SARB albedo, generally lower than MODIS. We find little dependence on viewgeometry and slight functional dependence on aerosol optical depth. The value selectedfor a priori surface spectral albedo is important, but not critical, when retrieving broadbandsurface albedo with broadband TOA data. However, based on calculations, aerosolforcing to TOA flux changes in spectral albedo shape can affect aerosol forcing for asmuch as would a 15% absolute change in the original broadband surface albedo.
Citation: Rutan, D., F. Rose, M. Roman, N. Manalo-Smith, C. Schaaf, and T. Charlock (2009), Development and assessment of
broadband surface albedo from Clouds and the Earth’s Radiant Energy System Clouds and Radiation Swath data product, J. Geophys.
Res., 114, D08125, doi:10.1029/2008JD010669.
1. Introduction
[2] Clouds and the Earth’s Radiant Energy System(CERES) instruments [Wielicki et al., 1996] on NASA’sTropical Rainfall Measurement Mission (TRMM), andEarth Observing System (EOS) Terra and Aqua satellitesmeasure broadband shortwave and longwave energyreflected and emitted at the Top of the Atmosphere (TOA)as a follow on to the NASA Earth Radiation BudgetExperiment (ERBE [Barkstrom and Smith, 1986]). CEREShowever goes beyond ERBE with advanced data productsthat synthesize broadband observations with other EOS datastreams. One such product is the Clouds and RadiationSwath (CRS) developed by the CERES Surface and Atmo-
spheric Radiation Budget (SARB) working group [Charlocket al., 1997, 2006]. SARB runs a fast radiation transfercalculation whose location is dictated by the CERES field ofview. The TRMM satellite is in a precessing orbit of 36�; itobserves the tropics and midlatitudes at varying times ofday. Terra and Aqua are in sun-synchronous orbits, and soview all latitudes. These orbits and the viewing capabilitiesof CERES and other instruments on board enable surfacealbedo estimates for the entire globe and for different timesof day.[3] Broadband surface albedo is generally defined as the
ratio of shortwave solar irradiance (generally between�0.2 mm and 4.0 mm) reflected by a surface to the irra-diance impinging on that same surface. Since incomingirradiance is dependent on atmospheric state, reflectedirradiance is dependent upon surface properties, and bothchange over time, surface albedo is then clearly a continu-ously varying function of atmospheric and surface condi-tions. Hence the accuracy of a retrieval method forbroadband surface albedo depends upon an accurate de-scription of the atmosphere and the reflective properties ofa surface over time. The goal of this paper is to describe
JOURNAL OF GEOPHYSICAL RESEARCH, VOL. 114, D08125, doi:10.1029/2008JD010669, 2009ClickHere
for
FullArticle
1Science Systems and Applications, Inc., Hampton, Virginia, USA.2Department of Geography, Center for Remote Sensing, Boston
University, Boston, Massachusetts, USA.3Science Directorate, NASA Langley Research Center, Hampton,
Virginia, USA.
Copyright 2009 by the American Geophysical Union.0148-0227/09/2008JD010669$09.00
D08125 1 of 19

methodologies developed to accomplish this task for thefield of view of CERES instruments and evaluate theresulting clear sky spectral and broadband estimates againstindependent observations.[4] The accurate determination of surface albedo on a
global scale is also important because of concerns regardinganthropogenic changes to the environment and its effects onradiation balance. With the advent of NASA’s Earth Ob-serving System satellites the enhanced observations of EOSmake it possible to retrieve surface albedo with moreconfidence; one goal, for example, is estimating the radia-tive forcing effect of surface albedo due to changes in landcover. Radiative forcing due to anthropogenic changes toglobal surface albedo is addressed in the 4th IPCC reportAR4-WG1-Chapter 2.5 [Forster et al., 2007]. There theauthors describe radiative forcing from surface albedo(reflecting land cover changes since 1750) is generally onthe order of �0.1 W m�2 to �0.2 W m�2 globally [Forsteret al., 2007]. This is a near balance of obviously large localchanges of opposing sign. CERES has the advantage ofbeing a broadband instrument, viewing the majority of theshortwave spectrum, thus potentially giving excellent esti-mates of broadband surface albedo at CERES footprint timeand space scales. The CERES/SARB algorithm describedand assessed in this paper supplies a surface albedo that hasa nominal spatial scale of �30 km at the Earth’s surface. In‘‘downstream’’ CERES data products, a similar algorithm isrun for grid box means to give global, gridded surfacealbedo estimates. These later CERES data products canbetter assess the impact of global surface albedo on radia-tive forcing. Here we focus on methodology and assessmentof the surface albedos used to run the SARB radiationtransfer model on a footprint-by-footprint basis and includea section on the connection between surface albedo andaerosol forcing to the shortwave flux at the top of theatmosphere.[5] In this paper we consider data from EOS Terra Flight
Model 1 (FM1) and Flight Model 2 (FM2) CERES instru-ments and the radiation transfer model used in calculatingthe profile of irradiance beneath CERES observations.Methodology for the other CERES instrument data streamsis the same. We pay particular attention to the method ofdefining surface characteristics observed beneath CERESfootprints. Resulting surface albedos are compared to sur-face observations, but these point measurements are gener-ally inadequate for validation of surface albedos determinedunder the large footprints, except for unusually homoge-neous sites. Subsequently we use surface albedo derivedby the MODerate resolution Imaging Spectroradiometer(MODIS) instrument on board Terra to assess SARBalbedos. This data product originates from narrow bandchannels of the MODIS instrument. The algorithm is basedon establishing a theoretical BRDF every eight days [Luchtet al., 2000b; Schaaf et al., 2002] and has producedvaluable new data sets that provide both spectral albedoin the MODIS channels and estimates of broadband albedoat a number of spatial and temporal scales. To assess theSARB albedo, MODIS albedos are closely matched inspace and time and then integrated within the field of viewof the CERES instrument where we find a close agreementbetween broadband surface albedo from these two nearlyindependent sources.
[6] We use the most currently available, respective gen-erations of retrievals for surface albedo from MODIS andCERES that are matched in time. The MODIS Land Teamuses Terra Collection 5 MODIS radiances as its source. TheSARB albedos presented are from CERES CRS Edition 2Bdata product, which includes inputs based on the earliergeneration of Terra Collection 4 MODIS radiances. For thenext few years, the analyst seeking several years of con-current surface albedos from both MODIS and CERESwould likely employ the respective generations of MODISand CERES used here. CERES CRS albedos using Collec-tion 5 of MODIS have not yet been released. The CRS dataproduct used here can be overwhelming due to the CERESsampling rate. The CERES Time Interpolation SpatialAveraging (TISA) working group takes CRS footprintsurface albedo and averages them over the globe into amonthly, 1 � 1� grid, at the CERES overpass times. Thesemaps, which may be more convenient than footprint data,depending on one’s application, are found at the CERES/ARM Validation Experiment (CAVE) home page (http://www-cave.larc.nasa.gov/cave/fsw-sfcalb/).
2. Clouds and Earth’s Radiant Energy System(CERES)
2.1. CERES Instruments
[7] CERES instruments measure broadband radiance inthree channels, shortwave (SW) reflected (mostly from0.2 mm to 4.0 mm), ‘‘total broadband’’ (mostly 0.2 mm to100.0 mm), and in the window range of�8.0 mm to 12.0 mm.Longwave (LW) emitted radiation (mostly 4.0 mm to100.0 mm) is inferred as the difference between the total andSW channels. CERES Preflight Model (PFM) operated for8 months on board the TRMM satellite in 1998. Four otherCERES instruments are currently on board EOS satellites,FM1 and FM2 onboard Terra, and on Aqua, Flight Models3 and 4 (FM3 and FM4). The data rate of the CERESinstruments is 100 footprints per second. Spatially thefootprint size is variable depending on satellite altitudeand instrument view angle. The shape of the CERESaperture and the response of the instrument in terms ofenergy detected, assuming a 95% response, convolve to anapproximate 31 km � 30 km area at the surface of the Earthfor a nadir view for the Terra footprint [Green and Wielicki,1997, Table 4.4-1]. In this paper we utilize CERES TerraFM1 and FM2 observations in cross-track mode.[8] Because direct measurements of irradiance upwelling
to a satellite can represent the ERB accurately at only verycourse time and space scales [Smith and Green, 1981], it ispreferable to scan for radiance and infer irradiance byapplying scene-dependent, empirically based statisticalmodels [Suttles et al., 1988]. CERES surpasses ERBE inthis regard, both by inferring the scene from high resolutionMODIS data [Minnis et al., 2003] and by applying fairlyrobust angular distribution models (ADMs [Loeb et al.,2005]) founded on the complex CERES rotating azimuthplane scan (RAPS) mode to establish BRDF on the scale of�30 km broadband footprints; no other EOS instrument canemploy RAPS to buttress the products of its routine cross-track scan. The error due to this inversion cannot be knownfor any single CERES footprint but it can be estimated forgroups of footprints [Loeb et al., 2005, 2007]. Its effect
D08125 RUTAN ET AL.: DEVELOP/ASSESS SFC ALBEDO FOR CERES CRS
2 of 19
D08125

however will be inherent in our derivation of surfacealbedo. After computing aggregate estimates of root meansquare error as a function of scene type, Loeb et al. [2007]gives the rough estimate of a TOA SW error due toinversion using ADMs of approximately 5% due to surfacescene type. This estimate will be used later in a sensitivitytable to analyze its effect on our estimate of broadbandsurface albedo. Land surface albedo is inferred from a cloudscreened set of these measurements and the radiativetransfer code described in the next section; the code iscomparable to those used in some Global Climate Models(GCMs). The CERES derived land albedo presented hereconstitutes a surface boundary condition for climate modelsthat is consistent with the ERB observations that are oftenused to validate the climate models at TOA.
2.2. CERES: Surface and Atmospheric RadiationBudget (SARB)
[9] Within the CERES science team SARB group istasked with calculating vertical profiles of heating rates,globally, and continuously beneath CERES footprint obser-vations of TOA fluxes [Charlock et al., 1997, 2006]. This isaccomplished using a fast radiation transfer code originallydeveloped by Fu and Liou [1993] and subsequently mod-ified by the SARB team [Kato et al., 2005; Rose andCharlock, 2002]; hereafter referred to as Langley Fu andLiou 2005 or (LFL05). The baseline data product for theSARB subsystem is the Clouds and Radiative Swath (CRS).Each CRS file contains one hour of CERES footprint dataand includes CERES TOA observed radiances and fluxesand an analyses of those MODIS pixels collocated withinthe larger CERES footprint, which supply cloud propertiesinside the footprint. Along with CERES TOA fluxes andcloud analyses, CRS files include column fluxes at fiveatmospheric pressure levels (Surface, 500 hPa, 200 hPa,70 hPa, and TOA). These fluxes are a subset of the radiationtransfer calculations, which are executed at higher verticalresolutions. A key input for SW calculations is spectralsurface albedo under all sky conditions and for any locationon the globe.
2.3. SARB: Radiation Transfer Modeland Model Input
[10] The SW portion of the LFL05 model is a delta-two-stream radiation transfer code with fifteen spectral bandsfrom 0.175 mm to 4.0 mm. Cloud optical properties withinthe CERES field of view are defined in a separate CERESdata product, the Single Satellite Flux (SSF) product. In theSSF, MODIS imager pixels are collocated within the largerCERES footprint and weighted by the energy distribution ofthe CERES instrument. From these MODIS values, cloudproperties, including cloud fraction [Minnis et al., 2003,2004] are derived and used as input for the radiation transfermodel. The only cloud product used in this paper is thecloud mask. Aerosol optical depths are input from MODIS(MOD08D3) product [Remer et al., 2005]. When lackingthe instantaneous MOD08D3 product in a CERES footprint,the first alternate is the daily, gridded MOD04, and thesecond is the Model for Atmospheric Transport and CHem-istry (MATCH [Collins et al., 2001]), supplied courtesy ofDr. David Fillmore at NCAR, Boulder, CO. MATCH is aglobal aerosol model that assimilates MODIS retrievals of
AOD. The MATCH model is also used to define aerosolconstituents (using Optical Properties of Aerosol andClouds, OPAC) optical properties from Hess et al. [1998],and an update to Tegen and Lacis [1996], desert dustproperties supplied courtesy of Dr. Andrew Lacis of GISS,and places aerosols throughout the vertical atmosphericcolumn. Pressure, temperature, and water vapor profilesare specified from GEOS-4.0 [Bloom et al., 2005], a 1�gridded reanalysis data product from Goddard ModelingAssimilation Office. Ozone comes from the National Centerfor Environmental Prediction, Stratospheric MonitoringGroup Ozone Blended Analysis (SMOBA) product [Yanget al., 2000]. The radiation transfer model, LFL05, istypically run for CERES footprints in which MODIS cloudproperties have been derived (�2 million per day) using upto 36 atmospheric levels.
3. Determination of Surface Albedo
3.1. Estimating Broadband Surface Albedo FromCERES Observations
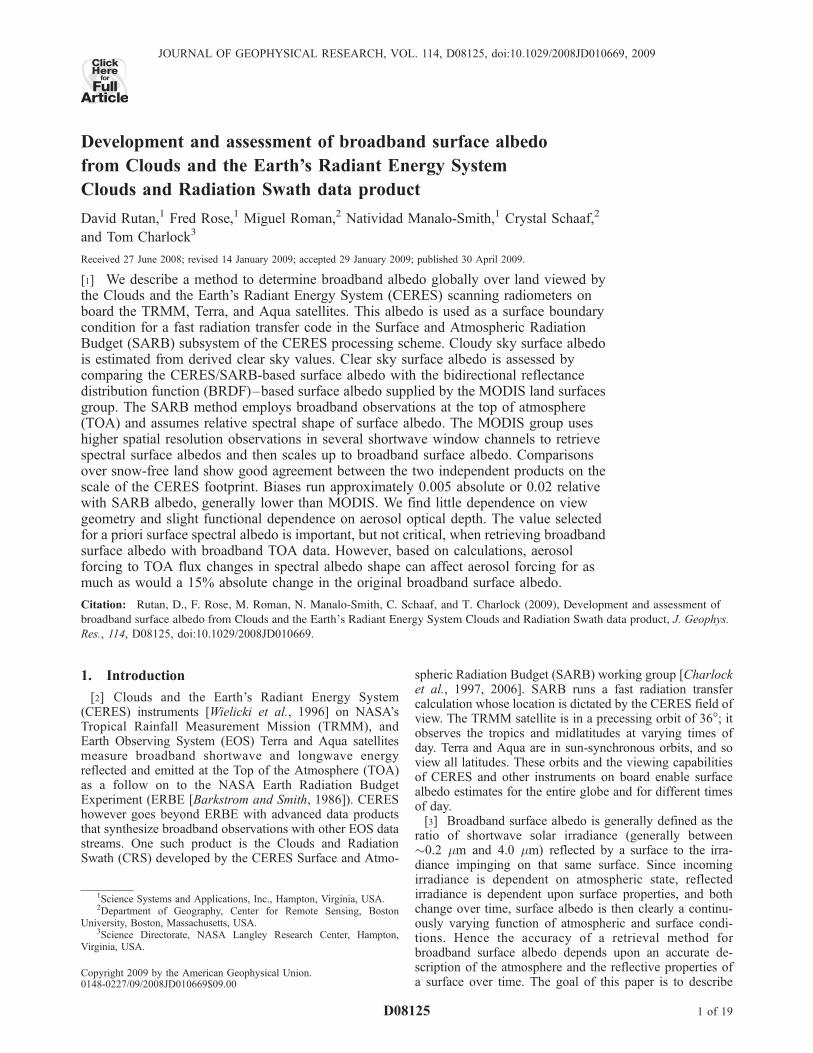
[11] As described above LFL05 currently models 15spectral intervals (shown in Figure 1) between 0.17 mmand 4.0 mm in the shortwave spectrum. For each daytimeCERES observation where LFL05 is run, both a surfacescene-dependent albedo spectral shape and an initial esti-mate of broadband surface albedo are required for thebroader SARB operation. We now describe how these areretrieved for clear CERES footprints. To determine thesevalues the code uses a logic sequence based on scene typedetermined by MODIS imager pixels collocated within thelarger CERES footprint and a fixed 1/6� equal angleresolution global surface scene type map discussed below.After scene type is determined the algorithm utilizes look-up tables (LUT), based on radiation transfer models, toestimate an initial broadband albedo aclr that is consistentwith the observed broadband albedo at TOA. The fullLFL05 radiative transfer code is not run at the footprintscale for this first step. This initial estimate is similar toprevious methodologies for determining surface albedo[Gupta et al., 2001; Pinker and Laszlo, 1992; Rutan etal., 2006]. For land, snow and ice surfaces under clear skies,the LUT is based on a parameterization of LFL05 itself.Model dependencies are shown in equation (1).
aclr ¼ LUTfaTOA;m; taod ;waod ; Taod ; pw;Psfc;O3;Tsfcg ð1Þ
[12] Inputs to the LUT include CERES observed TOAalbedo (aTOA), cosine solar zenith angle m, aerosol opticaldepth taod, one minus aerosol single scatter albedo (waod),aerosol type Taod, column precipitable water (pw), surfacepressure (Psfc), ozone (O3), and a coarse initial spectralshape parameter, Tsfc defined as ln(Avis/Anir) where Avis andAnir are bands 11 (0.5–0.7 mm) and 12 (0.7–1.3 mm) asshown in Figure 1 and whose determination is based onobserved scene types as described in section 3.2.[13] Equation (1) describes a LUT that is required to
determine clear sky surface albedo globally under a broadrange of meteorological conditions from high altitude, dryregimes such as the Antarctic plateau to moist tropicalforests to bright deserts. To give an idea of the impact onthe LUT to most inputs a simple sensitivity study is shown
D08125 RUTAN ET AL.: DEVELOP/ASSESS SFC ALBEDO FOR CERES CRS
3 of 19
D08125
in Tables 1 and 2. There we chose a base state atmosphereshown in the top row and fixed cosine solar zenith angle of0.5 for all runs. Next each of the remaining seven inputvariables are modified lower, then higher, one at a timeholding the other base state variables to their originalvalues. Table 1 shows that for most vegetated scenes theLUT is most sensitive to aerosol optical depth, precipitablewater and TOA albedo. For brighter scenes, Table 2 showsthe LUT is more sensitive to precipitable water, TOAalbedo, and aerosol single scatter albedo.[14] The surface albedo of water (free of sea ice) is not
retrieved using equation (1). Instead, it is specified from aLUT based on the Coupled Ocean Atmosphere RadiationTransfer (COART) [Jin et al., 2004]. This LUT has inputsof solar zenith angle, wind speed, aerosol optical depth andchlorophyll concentration. Solar zenith angle comes fromCERES ephemeris data and aerosol optical depth and windspeed are available from the same products described forSARB radiation transfer described briefly above in section2.3. Global chlorophyll data products were not availablewhen CERES CRS Edition 2B was begun and so chloro-phyll is set to a constant of 0.1 mg/m3.
3.2. Estimating Albedo Spectral Shape for 15 LFL05SW Bands
[15] We now address the derivation of albedo spectralshape across the required 15 LFL05 SW bands as shown inFigure 1. Because global data sets of spectral albedos werenot available in the time for the full stream of CERESprocessing, albedo spectral shape was estimated by anotherroute. For snow and sea ice scenes, a LUT based on aspecialized COART model with surface snow grains [Jin etal., 1994, 2008] gives albedo spectral shape. Both theCERES cloud algorithm and daily microwave maps from
NSIDC and NOAA identify snow and ice. For non–snowland scenes the SARB algorithm depends upon associatingpredefined spectral albedos to a global surface scene typemap developed from the 1 km resolution map InternationalGeosphere Biosphere Programme (IGBP) scene types avail-able from the United States Geological Survey (USGS) athttp://eros.usgs.gov/products/landcover/glcc.php. We addan 18th type, ‘‘Tundra’’, to distinguish high altitude andhigh latitude desert scenes by folding in the Global Eco-system Map, available from the same USGS web site listedabove. Where IGBP identifies ‘‘barren’’ and the GlobalEcosystems map identifies ‘‘tundra’’ we change the IGBPtype to ‘‘tundra.’’[16] To create the operational surface scene type map, we
decrease the spatial resolution of the USGS IGBP map inthe following manner. Each 1 km IGBP type is assigned aspectral albedo from the literature or field experiments aslisted in Table 3. These spectral albedos readily supply asimple fixed broadband albedo for the 18 IGBP scene types.The 1 km broadband surface albedos are integrated over10-minute (1/6�) equal angle grid boxes. The resulting aver-age is compared to the list of 18 scene type based values andthe closest matching IGBP type yields the albedo spectralshape that will represent that particular 10’ grid box. Analternative might be to simply histogram IGBP types withineach 10-minute box; but with such a method the integratedenergy of the scene is potentially lost; and as we are lessconcerned with actual vegetation type and more concernedwith approximating the amount of radiation reflected withina given 10’ box, we use the former method.[17] A further intricacy arises in the selection of albedo
spectral shape because of the convention for placement ofIGBP scene types within CERES footprints. The CERESdata stream allows for up to eight surface types to be
Figure 1. Shortwave spectral bands used in LFL05 radiation transfer model and associated spectralalbedo used in CRS processing for IGBP scene types, mixed forest and barren desert.
Table 1. Surface Albedo LUT Model Sensitivity to Various Input Variablesa With Initial TOA Albedo Typical of Land Scenes
PW O3 taod ln(Vis/NIR) Psfc waod aTOA
Base State 1 cm 350 dbu 0.15 0 950 mb 0.025 0.2
DInput 0.5 3.0 300 400 0.05 0.35 �1 1 1000 900 0.01 0.05 0.195 0.205Surface aclr 0.170 0.193 0.175 0.179 0.194 0.147 0.180 0.175 0.174 0.180 0.177 0.177 0.170 0.185Range aclr 0.023 0.004 �0.047 �0.005 0.006 �0.000 0.015
aBase state atmosphere along with cos(SZA) = 0.5 gives surface albedo aclr = 0.177.
D08125 RUTAN ET AL.: DEVELOP/ASSESS SFC ALBEDO FOR CERES CRS
4 of 19
D08125

defined in any footprint. Two arrays define the scene andpercentage of each scene within the footprint. We use thefirst array to act as a pointer to each scene’s associatedalbedo spectral shape and the second array supplies weightsfor averaging the albedo spectral shapes within the foot-print. These two arrays then supply a first estimate of analbedo spectral shape, afp(n) shown in equation (2) where nrepresents the 15 spectral intervals of the LFL05 SWradiation transfer code (see Figure 1) and wi are normalizedweights based on the percentage of each IGBP scene typefound in any CERES footprint. Integrating this albedospectral shape gives a broadband albedo Afp flag. Notethe IGBP based albedo spectral shapes do not vary overtime, except for snow and ice, and so variability in theCERES IGBP vector, and subsequently our albedo spectralshape, is based purely on geography.
afpðnÞ ¼Xn�scenes
i¼1
aiðnÞwi ð2Þ
[18] We now have estimates for the CERES footprint ofobserved surface broadband albedo from the LUT, aclr, andalbedo spectral shape from the IGBP map afp(n); the nextstep is to reconcile the two. This is done simply bymultiplying the ratio of aclr to Afp times the albedo spectralshape afp(n) as shown in equation (3).
ainitðnÞ ¼ afpðnÞ *aclr
Afp
� �ð3Þ
[19] ainit is then the initial spectral albedo input as thesurface boundary condition for running LFL05 in CERES/SARB processing for clear sky footprints. The retrievedbroadband surface albedo is the ratio of the upwelling anddown-welling fluxes at the surface, as computed by LFL05.[20] Initial broadband surface albedo for footprints view-
ing land surfaces where CERES has identified clouds isspecified in a different manner. Derivation of an albedospectral shape is identical to that for clear sky. Howeverthere is no instantaneous retrieval of a broadband cloudysky land surface albedo. Instead, a ‘‘history’’ map of albedois created by preprocessing 1 month of CERES data at atime. Using the LUT in equation (1) all clear sky footprintsfor a month are examined in advance and the minimumclear sky albedos are saved on a 1/6� equal angle resolutiongrid. If a grid box is cloudy for the entire month a historicalvalue is retained or the clear sky albedo is based solely onassumed surface vegetation type. To utilize these historymap values for cloudy sky footprints we require a method to‘‘move’’ the broadband albedo from the solar zenith angle atwhich they were observed to the ‘‘diffuse’’ solar zenithangle (53� the Gaussian quadrature point at which the two-stream is solved) which is used for all cloudy sky calcu-
lations in SARB processing. To accomplish this we chosethe diurnal model described by Briegleb et al. [1986] shownin equation (4). It assumes a semi-infinite canopy withrandomly angled leaves for each vegetation type. Eachscene type is assigned a ‘‘D’’ value which defines theamount by which albedo will change as a function ofchanging solar zenith angle. D values are determined fromthe same source as the spectral albedo for each IGBP scenetype.
aðm1Þ ¼ aðm0Þð1þ DÞ
ð1þ 2Dm1Þð4Þ
[21] We do not attempt to validate cloudy sky albedos inthis paper. Though the limitations of this model have beenelucidated [seeWang et al., 2007], due to restrictions on alter-ing CERES climate data products, methodology once estab-lished is not changed unless new data product ‘‘Editions’’are released.
4. Impacts of Aerosols and Albedo SpectralShape on TOA SW Aerosol Forcing
[22] How important is the assumption for albedo spectralshape of surface reflection when retrieving broadbandsurface albedo with observations of broadband TOA fluxsuch as CERES? In contrast to the MODIS technique,which uses satellite spectral radiances and a model toexplicitly determine spectral reflection at the surface andthen follows with an expression for broadband surfacealbedo, the CERES method is simple. Calculations in thissection show that for typical land surfaces, the retrieval of
Table 3. IGBP Scene Types and Source of Albedo Spectral Shape
Scene Type Spectral Curve Source
1. Evergreen Needleleaf Forest Briegleb et al. [1986]2. Evergreen Broadleaf Forest Briegleb et al. [1986]3. Deciduous Needleleaf Forest Briegleb et al. [1986]4. Deciduous Broadleaf Forest Briegleb et al. [1986]5. Mixed Deciduous Forest Briegleb et al. [1986]6. Closed Shrubland Briegleb et al. [1986]7. Open Shrubland Pinker and Karnieli [1995]8. Woody Savanna Briegleb et al. [1986]9. Savanna Zhou et al. [2001]10. Grassland Zhou et al. [2001]11. Permanent Wetland Briegleb and Ramanathan [1982]12. Cropland Zhou et al. [2001]13. Urban Briegleb et al. [1986] (18)14. Crop/Natural Vegetation Mosaic Zhou et al. [2001]15. Permanent Snow/Ice Jin et al. [1994]16. Barren/Desert Pinker and Karnieli [1995]17. Water Bodies Jin et al. [2004]18. Tundra Briegleb et al. [1986]19. Fresh Snow Jin et al. [1994]20. Sea Ice Jin et al. [1994]
Table 2. Surface Albedo LUT Model Sensitivity to Various Input Variablesa With Bright Initial TOA Albedo Typical of Snow Scenes
PW O3 taod ln(Vis/NIR) Psfc waod aTOA
Base State 0.8 cm 350 dbu 0.15 0 950 mb 0.025 0.6
DInput 0.1 1.5 300 400 0.05 0.35 �1 1 1000 900 0.01 0.05 0.585 0.615Surface aclr 0.692 0.782 0.749 0.759 0.756 0.751 0.755 0.753 0.756 0.752 0.752 0.765 0.733 0.775Range aclr 0.091 0.010 �0.005 �0.002 �0.004 0.013 0.042
aBase state atmosphere along with cos(SZA) = 0.5 gives surface albedo aclr = 0.754.
D08125 RUTAN ET AL.: DEVELOP/ASSESS SFC ALBEDO FOR CERES CRS
5 of 19
D08125

broadband surface albedo with broadband TOA albedo asan input parameter is fairly insensitive to the assumedalbedo spectral shape of surface reflection; this providessome confidence in the CERES method. It will also beapparent that CERES and MODIS products for surfacealbedo hinge on the fidelity of their assumptions foraerosols, both of which rely on the MODIS aerosol retriev-als of Remer et al. [2005]. Also while factors like broadbandaerosol forcing at TOA are strongly influenced by thebroadband surface albedo [i.e., Betts et al., 2007], thespectral shape of surface albedo can also have a secondary,but significant impact on broadband aerosol forcing.[23] To analyze this effect we chose three distinct spectral
shapes, one for a flat spectral albedo, one for a Mixed Forestscene and one for a Barren Desert scene. The Mixed Forestand Desert shapes are shown in Figure 1. LFL05 calcula-tions with these shapes yield a broadband surface albedo of0.3 for a midlatitude summer atmosphere and m = 0.5.Upwelling SW fluxes at TOA from LFL05 are shown inFigure 2. These runs are based on three spectral shapes(Mixed Forest, Barren Desert, and spectrally flat), differentvalues for integrated broadband surface albedo (0.1, 0.2,0.3) and aerosol optical depths (0.0, 0.2) of OPAC conti-nental aerosol. At the TOA we find the first order effect is,of course, the increase in broadband surface albedo. Thelower triplet of lines for aerosol free conditions are nearlycoincident; here a retrieval of broadband surface albedowith an observed broadband flux at TOA is almost insen-sitive to the assumption for spectral shape. The second ordereffect is the change in AOD, which, regardless of spectralshape for surface reflection, increases the TOA SW fluxvery linearly with broadband surface albedo. The dashedline in Figure 2 shows that for a given value of observedSW at TOA, an error of 0.2 in the specification of AOD
would yield an error of 0.04 in the retrieved broadbandsurface albedo.[24] The effect of albedo spectral shape is small but not
negligible, and is larger when aerosol is included in thecalculation. In general, if one fixes albedo spectral shapeand decreases broadband surface albedo, the effect will beto increase the aerosol forcing to TOA SW flux. This isshown in Table 4 where we have used our predeterminedspectral shape for Mixed Forest. At a solar zenith angle of60�, a change in broadband albedo from 0.3 to 0.2 results ina change in aerosol forcing at TOA of over 3 W m�2. Hencea 33% reduction in broadband surface albedo (0.3 to 0.2) iscompensated by an approximately 28% increase in TOAaerosol forcing to SW flux (11.9 W m�2 to 15.2 W m�2).[25] In Table 5, one finds that changing albedo spectral
shape but keeping broadband albedo fixed, results in achange in aerosol forcing to TOA SW that is smaller,1.4 W m�2. Although this is only half the change to aerosolforcing of that effected by the broadband albedo change of0.1 (0.2 versus 0.3) in Table 4, it remains notable.[26] A final way to consider the effect of albedo spectral
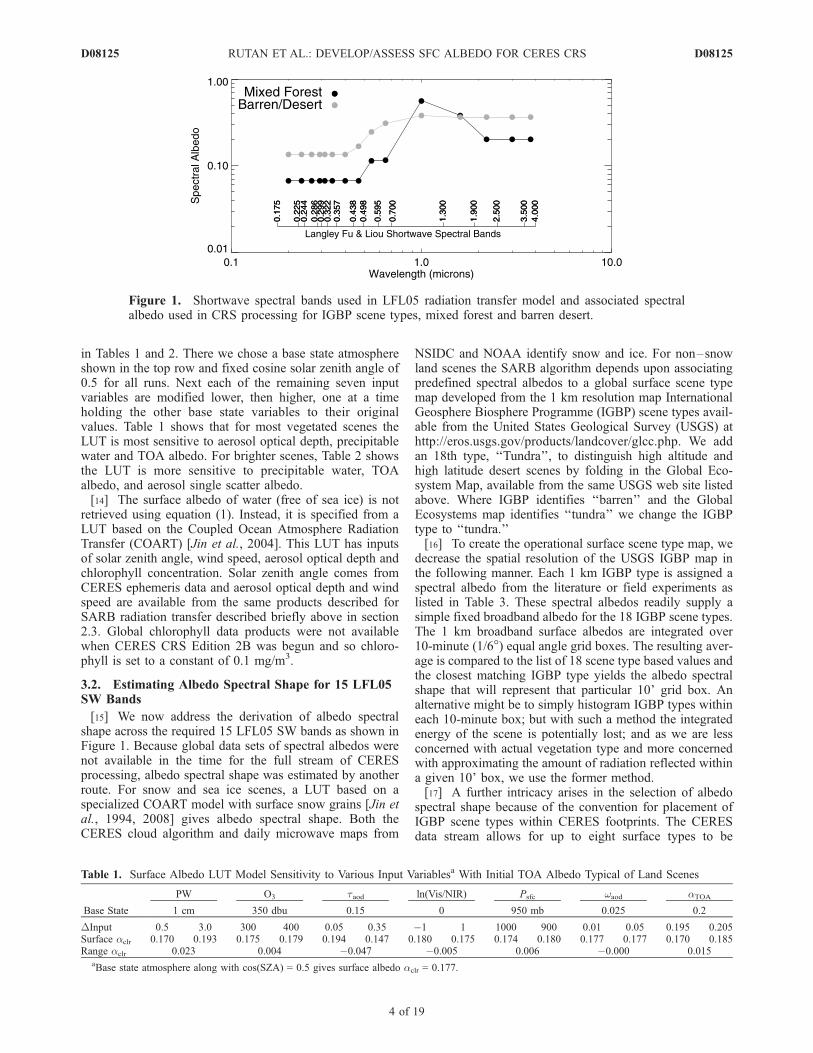
shape on TOA aerosol forcing is to look at the spectralforcing at the TOA as a function of aerosol type. Figure 3does this by showing the aerosol forcing to TOA albedospectrally for two different aerosol types with fixed aerosoloptical depth of 0.2. Again the mixed forest spectral shape(small reflection in the visible but sharply larger in the nearinfrared) is used in the radiation transfer calculation andspectral forcing in the LFL05 bands is shown for a conti-nental aerosol (solid circles) and 2 mm dust particles (opencircles). Though total broadband aerosol forcing is approx-imately the same, spectrally the effect is quite different forthe two aerosol types. The continental aerosol particles aresmall and have most of their impact in shorter wavelengths.
5. Assessment of CRS Surface Albedo
[27] Jin et al. [2003] and others have pointed out thatvalidation and assessment of satellite based surface albedosis in essence a scaling problem. In their paper validatingMODIS BRDF based surface albedo they compared theirresults against a number of various sources includingobservations from 10-m towers at several locations aroundthe United States and scaling up 30 m LANDSAT data tothe 1 km MODIS pixels. They used a minute-by-minutetime series of observed downwelling SW at the surface[Long and Ackerman, 2000] to exclude surface albedosmeasurements made under cloudy conditions from theircomparison. MODIS gives distinct surface albedo productsfor ‘‘white sky’’ (isotropic illumination) and ‘‘black sky’’(clear sky) conditions. By weighting MODIS black/whitesky albedos by observed direct/diffuse incoming SW flux atthe surface, Jin et al. [2003] were able to match 10-m toweralbedo observations to within an absolute accuracy of�0.02 albedo units for most months of the year.
Figure 2. Change in TOA SW flux with change in spectralsurface albedo and aerosol optical depth.
Table 4. Effect of Decreasing Broadband Surface Albedo on
Aerosol Forcing to SW Flux up at TOA
asfc
SW up TOA(Clear Sky, AOD = 0.2)
SW up TOA(Pristine, AOD = 0.0)
Aerosol Forcing(Clear � Pristine)
0.3 189.4 W m�2 177.5 W m�2 11.9 W m�2
0.2 148.8 W m�2 133.7 W m�2 15.2 W m�2
D08125 RUTAN ET AL.: DEVELOP/ASSESS SFC ALBEDO FOR CERES CRS
6 of 19
D08125
5.1. Comparison of CRS Albedo to GroundObservations
[28] For the assessment of our derived clear sky albedoswe have selected a number of regions where CERES data isroutinely subset for validation purposes. Chosen are 25locations scattered about the globe based on both theirscene type and availability of surface observed albedo. Allcomparison locations are shown in Figure 8. The sites thatinclude ground observations of albedo include the Depart-ment of Energy’s Atmospheric Radiation Program (ARM)Southern Great Plains sites, NOAA’s Global MonitoringDivision (GMD) Surface Radiation (SURFRAD [Augustineet al., 2000]) and several Baseline Surface Radiation Net-work (BSRN) project [Ohmura et al., 1998], all of whichadhere to the strict observational standards set by the BSRNproject guidelines.[29] The assessment of CRS surface albedo with ground
measurements is even more problematic than the MODISalbedos because of the enormous footprint size (Figure 4).Most surface observation sites are fenced, often a 10-mtower viewing only a patch of grass that is surrounded by adifferent ecosystem (i.e., land grazed by cattle or used togrow crops). This incompatibility was seen by Roesch et al.[2004] when they compared MODIS to surface observa-tions. This is confirmed in Figure 5 where CRS data and theMODIS 5 km pixel closest to a surface site are compared toa number of surface observed albedos from 14 locationswithin our set of validation sites where albedo is observed atthe surface. Because most of the spatial inhomogeneitiesthat influence surface reflection over land are generallyconstant, it is then not possible to ‘‘trade space and time’’as was successfully done for ocean albedo [Jin et al., 2005]during the CLAMS campaign [Smith et al., 2005]. Incontrast to the MODIS validation of Jin et al. [2003], thesurface albedos of CRS and MODIS (described in the nextsection) in Figure 5 are investigated at the footprint scale ofCERES; ground measurements of the downwelling direct/diffuse ratio are not used to adjust the satellite-retrieved
albedo; and ground measurements are not used to screen forcloud effects.[30] For all 4 months considered CERES and MODIS
derived albedos are on average lower than observationsfrom, on average, �0.02 up to �0.05% absolute. Thistranslates into 10% to 25% differences in albedo relativeto the surface observations. The comparison might be morefavorable if the view from 10 m approximated the surround-ing landscape on a much larger scale. However snow cover,which is often extensive, can produce sharp seasonal con-trasts in surface albedo over large areas that are faithfullyrepresented by point measurements. Figure 6 shows a timeseries over five years comparing observed albedo and CRSsurface albedo at the SURFRAD Fort Peck, MT site[Augustine et al., 2000]. For this plot, points represent themean albedo for a month, retrieved or observed, where thatmonthly mean is calculated solely at the time of the CERESobservation. The Terra overpass is typically at about 1030LST, so these are not true diurnal monthly mean values. InFigure 6 we find the SARB algorithm described in thepreceding sections accurately captures interannual variabil-ity in albedo particularly due to snow events.
5.2. MODIS Surface Albedo (MCD43C2)
[31] Our comparisons to this point have not been consis-tent in scale (Figure 4): The surface albedos in Figures 5 and6 are measured (retrieved by CRS) at scale of 10 m (30 km).The MODIS retrievals described below and seen in Figure 5are at a 5-km scale. In this section we scale MODISproducts up to the larger size of the CERES footprints(Figure 7). Such a consistent footprint-to-footprint approachis recommended by the Committee on Earth ObservationSatellites (CEOS) Working Group on Calibration/Validation(WGCV), Land Product Validation (LPV) albedo subgroup(http://lpvs.gsfc.nasa.gov/). We have chosen the MODISdata product MCD43C2 v005 to compare with surfacealbedo produced from the upward/downward ratio of CRSflux calculation under clear skies. MCD43C2 is a snow free
Table 5. Effect of Differing Spectral Albedo Shape on Aerosol Forcing to SW Flux up at TOA
Spectral ShapeSW up TOA
(Clear Sky, AOD = 0.2)SW up TOA
(Pristine, AOD = 0.0)Aerosol Forcing(Clear � Pristine)
Mixed forest 189.4 W m�2 177.5 W m�2 11.9 W m�2
Desert 187.6 W m�2 177.1 W m�2 10.5 W m�2
Figure 3. Spectral forcing of TOA albedo due to two different aerosol types.
D08125 RUTAN ET AL.: DEVELOP/ASSESS SFC ALBEDO FOR CERES CRS
7 of 19
D08125

gridded data product with 0.05� equal angle spatial resolu-tion. The gridded product is described in detail by Gao et al.[2005]. This resolution corresponds to an approximate 5 km‘‘pixel’’ size. Temporally, the MODIS Version 5 algorithmdelivers empirical BRDFs from clear sky MODIS imagerdata every eight days using overlapping 16-day windows[Lucht et al., 2000b; Schaaf et al., 2002]. The MODISBRDF/Albedo algorithm is similar to other kernel-drivenschemes used to obtain anisotropy and albedo information
used by the POLarization and Directionality of the Earth’sReflectances (POLDER) instrument [Hautecœur and Leroy,1998; Bicheron and Leroy, 2000; Maignan et al., 2004;Bacour and Breon, 2005] satellite sensor and Meteosat Sec-ond Generation (MSG) SEVIRI instrument [van Leeuwenand Roujean, 2002; Geiger et al., 2004]. Coefficients mod-eling the isotropic, volume, and geometric-optical surfacescattering of observed vegetation and surface elementsare derived for direct (‘‘Black Sky’’) and wholly diffuse
Figure 4. Cartoon showing CERES footprint, MODIS grid, and IGBP grid relative to one another.
Figure 5. CERES CRS and MODIS 5 km albedo compared to observed surface albedos at 14 landsurface sites during 4 months in 2001.
D08125 RUTAN ET AL.: DEVELOP/ASSESS SFC ALBEDO FOR CERES CRS
8 of 19
D08125

(‘‘White Sky’’) radiation. These coefficients represent the16-day window. They are recombined to form albedo (bothspectral and broadband) using equation (5).
aðnÞ ¼ awsðnÞ * Cðm; taod ;TaodÞ þ absðnÞ* ð1� Cðm; taod ; TaodÞÞ ð5Þ
[32] The total albedo, at the seven spectral intervals andthree broadbands indicated as n is then a linear combinationof the white (aws) and black (abs) sky albedos (which arederived directly from the coefficients supplied on theMCD43C2 data product) and the coefficient C which isgiven by a look-up table that is a function of aerosol opticaldepth, aerosol type Continental (chosen for all calculationsin this comparison) or Maritime, MODIS wavelength, andsolar zenith angle. The look-up table is supplied along withthe data product. Spectrally, the product supplies sevennarrowband visible and near infrared channels and threebroadband estimates based on weighting functions de-scribed by Liang et al. [1999]. These data have beenvalidated in several publications. The accuracy of theMODIS operational albedos marked as high quality by thequality assurance flags is less than 5% relative at validationsites studied thus far and even those albedo values with lowquality flags have been found to be within 10% relative offield data [Jin et al., 2003; Salomon et al., 2006]. To matchthe CERES footprints temporally with MODIS data wehave restricted the CERES observations to within the16-day period of the MCD43C2 data product and selectedonly two MODIS files per month. For example, in January2001 we chose MODIS files dated January 1 and January17. The BRDFs in these files are drawn from clear skyMODIS pixels from January 1 through January 16 andJanuary 17 through February 1 respectively, the same timeperiods within which we match the CERES footprints to theMODIS data. This avoids the possibility of selecting aCERES footprint for more than one comparison. TheMODIS Collection 4 AOD (the actual MOD08 retrieval ispreferred but the interpolated daily average MOD04 orMATCH aerosol assimilation are more commonly used) isan important parameter in the determination of the CRSsurface albedo by CERES. In contrast, the MCD43C2 v005coefficients for a 16-day window employed MODISCollection 5. To achieve a footprint-by-footprint comparison
(i.e., recommendation of CEOS) that is more relevant tousers (note last paragraph of Introduction), we express theMODIS surface albedo from the MCD43C2 v005 coeffi-cients with the same Collection 4 AODs used by CRS.
5.3. Integration of MODIS Into a CERES CRSFootprint Field of View
[33] Matching the MODIS data to the CERES field-of-view is necessary for an appropriate comparison of the two
Figure 6. Time series of observed (black) and CRS retrieved albedo near Fort Peck, MT. Valuesrepresent a mean for the month at the time of CERES observations.
Figure 7. Schematic of placement of MODIS gridded‘‘pixels’’ inside of larger CERES footprint and integrationweights.
D08125 RUTAN ET AL.: DEVELOP/ASSESS SFC ALBEDO FOR CERES CRS
9 of 19
D08125

Figure 8. Map showing locations on the globe where the CERES and MODIS albedos are collocatedfor comparison. Sites are divided into 25 land and 4 desert locations.
Figure 9. Comparison of CRS surface albedo to MODIS albedo integrated within coincident CERESfootprints.
D08125 RUTAN ET AL.: DEVELOP/ASSESS SFC ALBEDO FOR CERES CRS
10 of 19
D08125
products. The term ‘‘footprint’’ refers to a CERES field-of-view (FOV) of the surface while the term ‘‘pixel’’ will bedefined as the MCD43C2 0.05� grid box. Our methodologyfor matching MODIS pixels to the CERES footprint followsthis path. We locate a CERES footprint center on the 0.05�MODIS grid and determine footprint length. The footprint
itself is associated with a smoothly varying ‘‘point spreadfunction’’ (PSF) that describes the change in detectorresponse with respect to the location of an energy sourcewithin the footprint. This energy response changes as afunction of viewing zenith angle (VZA), elongating in theforward view and compressing in the back as shownschematically in Figure 7. Hence the center of a CERESfootprint (given as a latitude and longitude at the surface inall CERES data products) is the energetic center withrespect to view zenith angle (Figure 7). The length andshape of a footprint thus changes from a near circle withdiameter �30 km at nadir view angle, to an ellipsoidalshape with length near 200 km at 70�VZA. When integrat-ing other variables within a CERES footprint one needs totake this energy response into account giving less weightto pixels near the edge of the footprint and more weight topixels near the center.
Table 6. Monthly Mean Albedo Differences Between CRS
Albedo and MODIS Albedo Integrated Within CERES Terra
FM1 for Land Footprints for 4 Months in 2001
January April July October All Months
CRS mean 0.145 0.150 0.154 0.161 0.154MODIS mean 0.153 0.153 0.158 0.165 0.158Absolute bias �0.008 �0.003 �0.003 �0.003 �0.004Absolute RMS 0.020 0.018 0.013 0.015Relative bias �5.2% �2.0% �2.0% �1.8% �2.4%
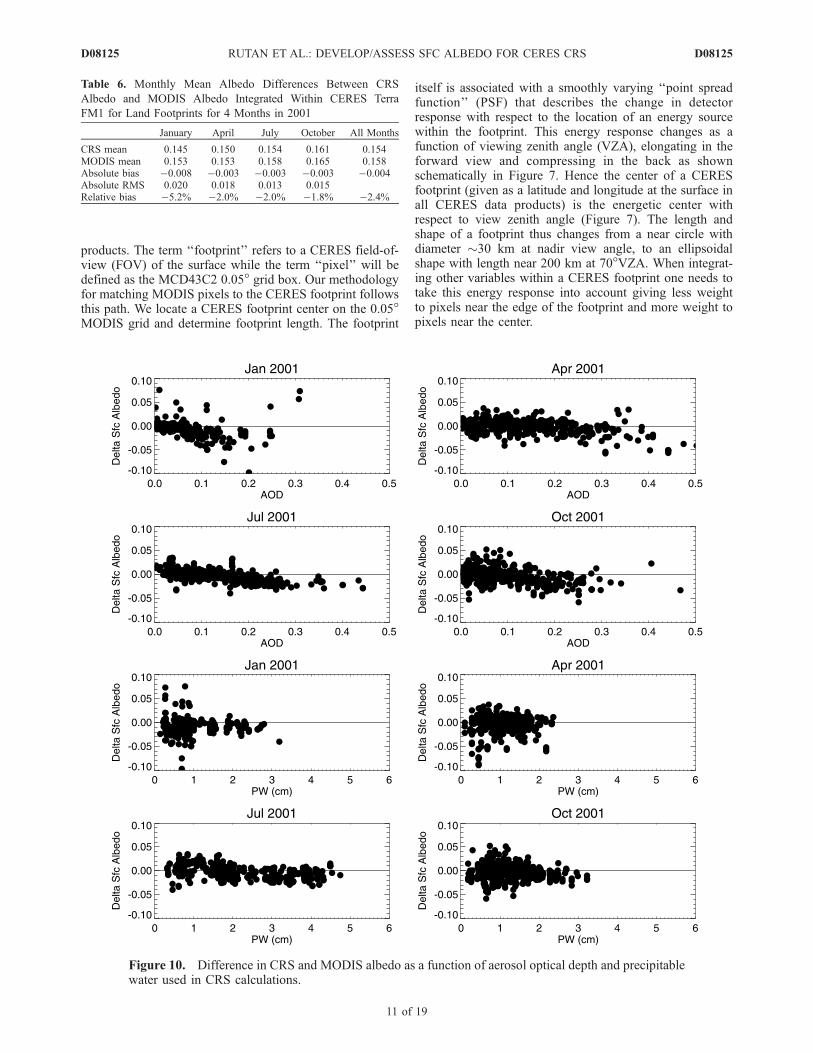
Figure 10. Difference in CRS and MODIS albedo as a function of aerosol optical depth and precipitablewater used in CRS calculations.
D08125 RUTAN ET AL.: DEVELOP/ASSESS SFC ALBEDO FOR CERES CRS
11 of 19
D08125
[34] For the purposes of this study we assume the CERESfootprint is a circle whose center is located by the CERESsurface latitude/longitude with a radius of 1/2L (where L isthe length of the CERES footprint along the scan angle.) Weapproximate the energy response of the instrument as anormalized distance of 1/L from this center. MODIS albe-dos are then integrated within the CERES footprint, weight-ing the MODIS regions as d/L where ‘‘d’’ is the physicaldistance from the footprint center to the center of theMODIS pixel. At nadir viewing angles the CERES footprintwill closely match with our assumption. However as VZAincreases the circular shape and actual area viewed willbegin to diverge. The more heterogeneous the surface is inelevation, scene type etc.. . . the more error we might expectdue to these assumptions.[35] In this comparison we only consider footprints free
of clouds as determined in the CERES data product. CERESCRS product includes an independent cloud analysis of
MODIS 1 km observations within each CERES footprint[Minnis et al., 2003]. We only consider footprints where theCERES cloud fraction is 0.0, which is to say the cloudalgorithm determined all collocated MODIS 1 km pixels tobe cloud free. At times, the MODIS BRDF albedo uponwhich we locate the CERES footprint is incomplete. Weinterpolate the MODIS BRDF coefficients in space if themissing portion of the field is less than 20% of the footprint.Otherwise we disregard that footprint.
6. Results of CRS and MODIS BroadbandAlbedo Comparison
6.1. Assessment of CRS Broadband Surface Albedoat ‘‘Land’’ Sites
[36] In this section we compile results of the MODISsurface albedo integrated within CERES footprints for eightMCD43C2 data files. Chosen were the months of January,
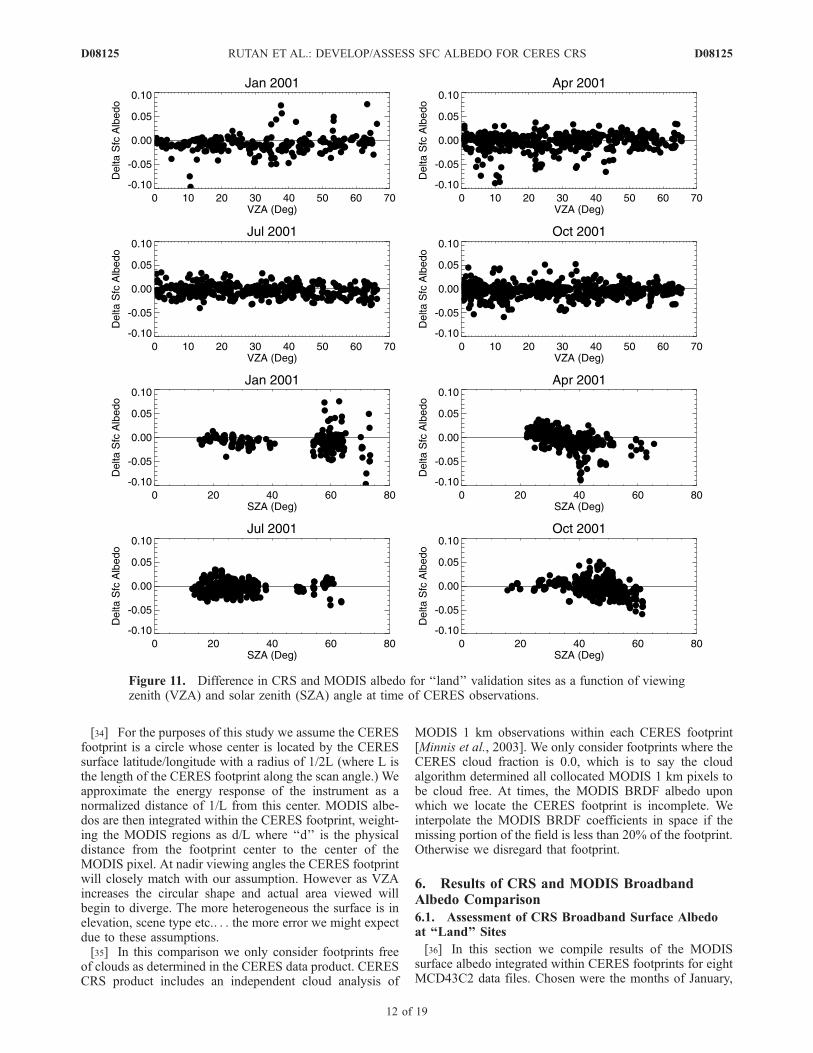
Figure 11. Difference in CRS and MODIS albedo for ‘‘land’’ validation sites as a function of viewingzenith (VZA) and solar zenith (SZA) angle at time of CERES observations.
D08125 RUTAN ET AL.: DEVELOP/ASSESS SFC ALBEDO FOR CERES CRS
12 of 19
D08125

April, July, and October 2001. Figure 8 shows the locationson the globe where comparisons were made. These regionswere previously designated ‘‘CERES validation regions’’and are approximately 111 km square regions where subsetsof CERES data are extracted from formal data processingfor the purpose of validating CERES algorithms. For ourpurposes we retain only footprints whose center is less than25 km from each surface site for each satellite overpass tolimit the sample. Black filled diamonds indicate land surfacesites and open diamonds are designated desert surface sites.[37] Complete results for 25 land sites for the months
considered are shown in Figure 9. The majority of thesesites are located in the northern hemisphere. Subsequentlythe number of clear sky comparisons peak in Octoberwhereas in January, due to snow in the scenes, which hasbeen removed, we find the least number of clear skycomparisons. Though there is some seasonal variability,overall the comparisons are quite good as measured bymean bias and RMS for each month as shown in Table 6.Bias for all months is negative with a mean of �0.004absolute, leaving a relative bias of just �2.4% (as if CERESwere ‘‘darker’’ than MODIS). The RMS runs from a low of0.013 in July to 0.020 in January.[38] The conspicuous ‘‘tail’’ of low CRS albedos in April
2001 (Figure 9b) is largely due to data from a singlelocation (north latitude 53.5, longitude 273.9) with ever-green forest to the south of Hudson Bay in eastern Canada(Figure 8). There, MODIS albedo remains stable near 0.10
while the CRS albedo varies between 0.03 and 0.13. Thereasons behind the retrieved surface albedos (as low as0.03), which is so low as to strain credibility for a largefootprint over land, is instructive for the EOS user. Collec-tion 4 AOD reported by the MODIS Atmosphere Team forthis site in April 2001 are both quite high and quite variable.The algorithm used by the MODIS Land Team preferen-tially chooses cloud-free pixels with low AOD (less obscu-ration) for the retrieval of surface albedo, so MCD43C2v005 coefficients supplied by the MODIS Land Team aregenerally founded on the low AOD observations in each16-day block. While equation (5) shows that the MODISsurface albedo explicitly depends on AOD, the day-to-daychange in AOD has only a fairly small effect by apportion-ing the fraction of ‘‘white’’ and ‘‘black’’ sky. The dashedline in Figure 2 draws attention to the contrastingly largeimpact of any change in AOD on the CRS albedo. As
Figure 12. Comparison of CRS and MODIS albedo at four desert locations around the globe.
Table 7. Monthly Mean Albedo Differences Between CRS
Albedo and MODIS Albedo Integrated Within CERES Terra
Footprints at Four Desert Locations for 4 Months in 2001
January April July October All Months
CRS mean 0.283 0.284 0.278 0.289 0.283MODIS mean 0.292 0.289 0.284 0.291 0.289Absolute bias �0.008 �0.006 �0.007 �0.002 �0.006Absolute RMS 0.019 0.017 0.021 0.018Relative bias �2.7% �2.1% �2.5% 0.7% �2.1%
D08125 RUTAN ET AL.: DEVELOP/ASSESS SFC ALBEDO FOR CERES CRS
13 of 19
D08125

MODIS pixels are very small, there are usually a sufficientnumber in a local domain for the 16-day reporting period forthe MODIS surface albedo product. Because CERES foot-prints are large, they are often not clear. Thus everyavailable clear CERES footprint over land is used to retrievea surface albedo, regardless of AOD. For the site in easternCanada in April 2001, CRS reported 20 clear footprints withsimultaneous retrievals of AOD by MODIS. The thirteenCERES CRS footprints with high AOD (mean 0.67) gavean unrealistically low mean surface albedo of 0.05; the otherseven (mean AOD of 0.32) had a mean albedo of 0.11. Thesurface albedos from the MODIS Land Team are in this case(the tail) more realistic than those from CERES, and thesource of this CERES deficiency in surface albedo appearsto lie in some surprisingly high values of AOD from theMODIS aerosol product. The range of expected values fromthe MODIS v004 aerosol product defined by Remer et al.
[2005] is ±0.05 ± 0.15taod when compared to surfaceobserved aerosol from the AERONET network. Thoughhigh, it is unknown if the value of .67 lies outside this rangeas there is no surface observation against which to compare.However the LUT sensitivity is largest to aerosol opticaldepth over snow free land albedos as shown in Table 2. Ifthe radiative transfer calculations with the MODIS surfacealbedos were run for the high AOD cases, they would yieldTOA albedos much larger than those observed with theCERES broadband instrument; we know this because theCRS calculations (having low surface albedos) agree withCERES observations. Such a conspicuous tail of low albedo(Figure 9b) is not found to the same degree in any othermonth. However the CRS routine of retrieving a surfacealbedo value for every clear CERES footprint over land,regardless of the uncertainty for the input AOD, has yielded
Figure 13. Difference between CRS and MODIS albedo at desert locations as a function of aerosoloptical depth and precipitable water.
D08125 RUTAN ET AL.: DEVELOP/ASSESS SFC ALBEDO FOR CERES CRS
14 of 19
D08125
a product which is much more noisy than MODIS; note theresults for 14 sites in Figure 5.[39] Departing the tail of Figure 9b, we return to the
domain of 25 sites for all 4 months. In Figures 10 and 11 weshow the difference between CRS and MODIS albedos as afunction of AOD and precipitable water (Figure 10) andsolar zenith and viewing zenith angles (Figure 11). In eachcase there appears little functional relationship except forthe case of aerosol optical depth where differences typicallyincrease as AOD increases. Recall that while MODISalbedos (equation (5)) assume only two aerosol types(continental or marine), the MATCH assimilation used byCERES supplies up to seven types (large dust, small dust,sulfate, marine, soot, soluble organic carbon, and insolubleorganic carbon) that are used to assign the spectral singlescattering albedos and asymmetry parameters. The atmo-spheric correction used in the CERES retrieval of surface
albedo includes the effect of absorption by aerosols that aremore variable than in the MODIS retrieval.
6.2. Assessment of CRS Broadband Surface Albedoat ‘‘Desert’’ Sites
[40] Figure 12 and Table 7 compare surface albedos atfour desert sites only. Again, this comparison is quite goodboth visually and in terms of absolute and relative biases,�2.1% for desert versus �2.4% for all sites. Despite thelarger mean surface albedo over deserts, the homogeneousnature of the desert scenes produces values for the absoluteRMS (Table 7) that are hardly larger than those for all sites(Table 6). The four desert sites (Figure 12 and Table 7) canbe placed in three categories: Albedos less than 0.2 comefrom the SURFRAD Desert Rock, NV (DRA) site. Thosebetween 0.2 and 0.3 are located at the BSRN, Tamanrasset,Algeria (TAM) site. Albedos greater than 0.3 come from the
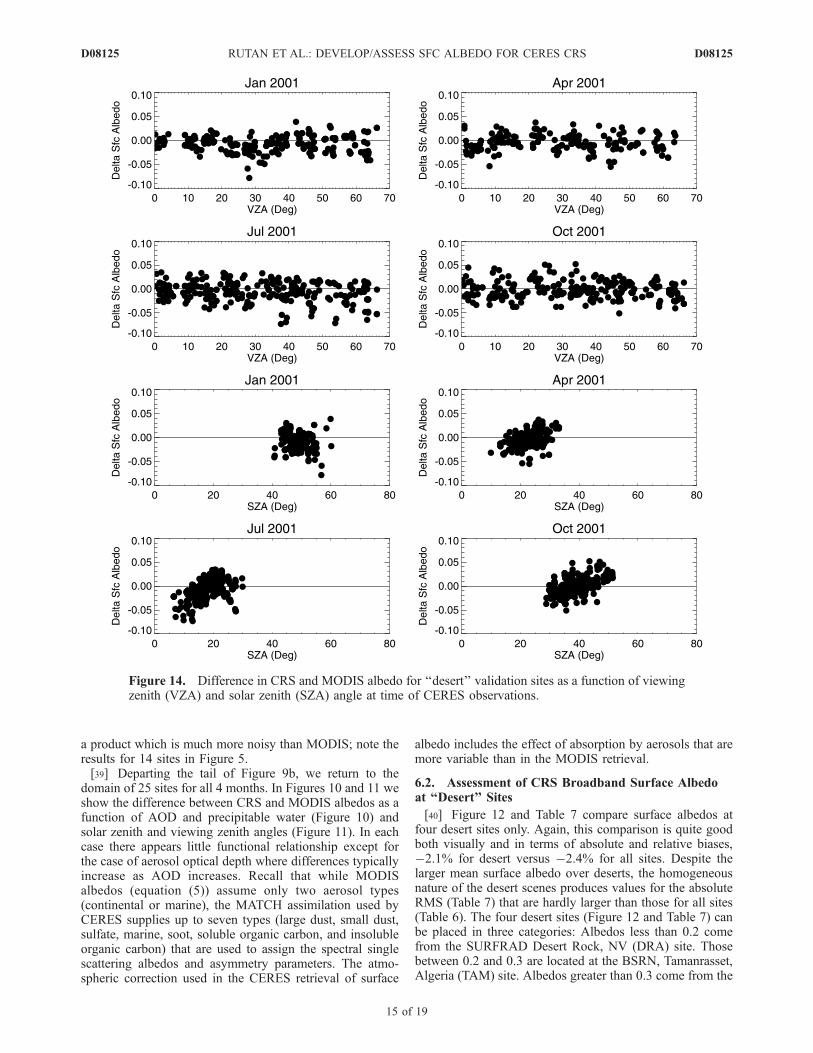
Figure 14. Difference in CRS and MODIS albedo for ‘‘desert’’ validation sites as a function of viewingzenith (VZA) and solar zenith (SZA) angle at time of CERES observations.
D08125 RUTAN ET AL.: DEVELOP/ASSESS SFC ALBEDO FOR CERES CRS
15 of 19
D08125
BSRN, Sede Boqer, Israel (SBO) site and the Saudi SolarVillage (SSV [Myers et al., 1999]) site. Each of the threedesert categories displays a characteristic bias: At DRACRS albedo is consistently greater than the MODIS. AtTAM, CRS albedo is consistently lower than MODIS. Alsoat SBO and SSV the two retrievals tend to agree.[41] The difference of CERES and MODIS albedos in
Figure 13 (the desert analog to Figure 10) again shows littlerelationship to precipitable water, but a stronger dependenceon AOD. For the deserts however there is significantly moreaerosol found (note that the x axis scale has doubled overthat shown for the land sites in Figure 10). Figure 14 showsthe difference between MODIS and CRS albedos as afunction of VZA and SZA. The ‘‘clumping’’ of footprintsas a function of VZA shows that regionally there isdependence of the comparison on view zenith angle, attimes approaching 1% to 2% absolute albedo. Likewisewith solar zenith angle, in every season but January thereappears a positive trend of the difference as SZA increases.When the desert data are broken down site by site, themajority of the solar zenith angle dependence is attributableto footprints at TAM during April, July and October but notJanuary. The effect is exacerbated by the fact that DRA hasa permanent positive bias. The reason for the dependence atTAM during Northern Hemisphere summer is at this pointunknown though one possibility may be the fidelity of the
MODIS BRDF model. At these times at TAM there wasvery little Collection 5 aerosol available to the land surfacesgroup for the derivation of the BRDF.
6.3. Assessment of CRS Albedo Spectral Shape
[42] Surface albedo input into LFL05 model is in 15spectral bands between 0.2 mm and 4.0 mm. As stated abovespectral shape used in SARB is solely a function of the (upto eight) spectral shapes based on the IGBP types found inthe CERES footprint. CERES/SARB has compiled only 16different IGBP types, each with a respective spectral shape,to span the globe; the coverage of snow and ice is the onlyseasonality. On the other hand, MODIS BRDFs and albedosare not constrained to such assumptions for albedo spectralshape, as they are retrieved using MODIS radiances fromseven narrowband channels. MODIS albedo spectral shapesthemselves are of course dependent on the ability of theMODIS algorithm to retrieve a representative BRDF modelgiven available clear sky radiances retrieved over each 16-day period. Over snow, desert (with heavy aerosol loading)and persistently cloudy areas the MODIS BRDF can anddoes, revert to a default model which is noted in MCD43C2quality parameters within the MODIS data product. Sowhereas we might assume that CERES has the greaterpotential to retrieve a quality broadband surface albedo,the MODIS instrument is capable of retrieving a better
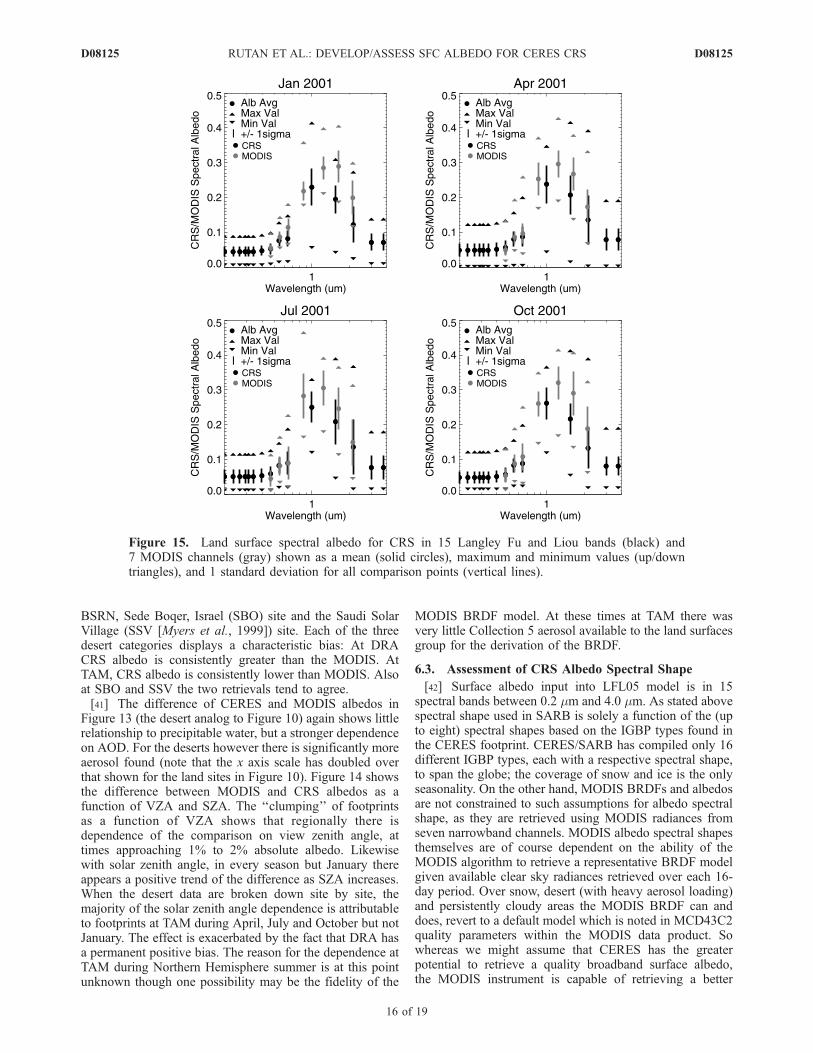
Figure 15. Land surface spectral albedo for CRS in 15 Langley Fu and Liou bands (black) and7 MODIS channels (gray) shown as a mean (solid circles), maximum and minimum values (up/downtriangles), and 1 standard deviation for all comparison points (vertical lines).
D08125 RUTAN ET AL.: DEVELOP/ASSESS SFC ALBEDO FOR CERES CRS
16 of 19
D08125

albedo spectral shape. So the question of how well do theCERES albedo spectral shapes compare to those from theMODIS data product arises? As a gross assessment of apriori spectral shape used by CRS, statistics were compiledas a function of wavelength for the resulting spectralalbedos from the footprints in Figures 9 (land) and 12(desert). These statistics were then plotted; means (solidcircles), standard deviations (vertical bars), minimums andmaximums (hats), in Figures 15 (land) and 16 (desert). Thecolor gray indicates results from MODIS, black, resultsfrom CRS. For all land surface types in Figure 15 we find afairly good agreement in the shortwave portion of thespectrum below 1 micron in all months with some keydifferences. In January the 0.63 mm channel is brighter inMODIS than in the CRS average. In fact, the mean CRSvalue falls near the minimum MODIS value. At the impor-tant 0.86 mm channel (band 0.69–1.30 mm for LFL05)means and standard deviations are comparable, but mini-mum values of CRS are significantly lower than those ofMODIS. Mean values match well in April and July, thoughare lower for CRS in January and October. The comparisonis not as good for wavelengths greater than 1.0 micron,where for each month the CRS values underestimate thosereported by the MODIS product. These wavelengths con-tribute to the consistently negative tendency of CRS broad-band albedo (compared with MODIS) shown in Figures 9and 12. Roughly 23% of the solar insolation at the surface is
found at wavelengths above 1.0 mm, for a climatologicalmidlatitude summer at a solar zenith of 60�. It appears thatCRS albedo spectral shapes could be improved by foldingin MODIS values. Figure 16 shows the same spectral albedocomparison as Figure 15 but for four desert sites whosebroadband albedo comparison is found in Figure 12. Asdesert scenes tend to simpler spectral shape, these compar-isons match slightly better than those for the land scenes.Below 1 micron the comparison is quite good however,again for wavelengths greater than 1 micron the CERESCRS spectral shapes underestimate the mean values foundat the desert sites by the MODIS albedos.
7. Conclusions
[43] We have described in detail the methodology forderiving clear and cloudy sky broadband albedo and spec-tral shape for use, globally; by applying the radiationtransfer routines used in CERES/SARB subsystem thatproduces the Clouds and Radiation Swath (CRS) dataproduct. The importance of accurately defining spectralsurface albedo is justified due to the impact of the interac-tion of aerosols and albedo with respect to the forcing ofSW flux at the top of the atmosphere. For clear sky foot-prints the methodology is assessed against an independentproduct from the higher spectral resolution MODIS instru-ment on board the same EOS Terra satellite. Comparisons of
Figure 16. Desert surface spectral albedo for CRS in 15 Langley Fu and Liou bands (black) and7 MODIS channels (gray) shown as a mean (solid circles), maximum and minimum values (up/downtriangles), and 1 standard deviation for all comparison points (vertical lines).
D08125 RUTAN ET AL.: DEVELOP/ASSESS SFC ALBEDO FOR CERES CRS
17 of 19
D08125

the CERES CRS surface albedo to surface observed albedosfrom radiometers mounted at 10 m are untenable. Instead, asencouraged by the CEOS/WGCV/LPV Albedo Subgroup,we integrate MODIS BRDF based albedos into the CERESfootprints and compare these integrated values against theratio of the upward to downward fluxes as calculated by theSARB code. Matching these independent products in spaceand time, and weighting the MODIS according to anapproximation of the energy response of the CERES instru-ment, shows significantly improved results over compar-isons with albedo observed from instruments mounted on10-m towers as found in Figure 5. Over land sites, meandifference for all footprint comparisons are �0.004 abso-lute, or 2.4% relative to the MODIS product means. RMSalso remains small from 0.015 to 0.020 depending onmonth. These values of RMS are approximately 10%relative to the MODIS albedo mean.[44] When only the more homogeneous desert footprints
are considered, absolute bias remains approximately thesame at �0.006. However, mean albedo and mean solarzenith angle for these latitudes also increase and the relativebias with respect to mean MODIS albedo actually drops to2.1%. Mean RMS for the four desert months/footprintsconsidered is approximately 0.02 or less than 10% of theMODIS mean albedo.[45] For both desert and land scene types, for all months,
we find the difference between the two albedo productsincreases as aerosol optical depth increases. There was somedependence in desert scenes of the albedos on VZA of theCERES instruments as well as a slight positive slopedependence of the desert albedos on SZA. These depen-dencies tend to cancel in the mean. A comparison ofspectral shapes, based on a gross average of all footprintsfor the two clear sky scene types, determined that in generalthe two products match better in the shorter wavelengthsthan for those above 1 micron.[46] Each large, clear CERES CRS footprint over land
has its own retrieval for surface albedo. The CRS productfor land surface albedo at Terra overpass appears to bereasonably accurate but rather noisy with input for AOD asa principal source of the noise. A comparison with MODISretrievals and ground-based observations indicates CRSsurface albedos tend to have a low bias. Filtering basedon AOD may be the way to a produce a more usefulmonthly CRS surface albedo. Succeeding generations ofCERES data products for surface albedo may be moreuseful for calculation of aerosol forcing by incorporatinginformation on spectral albedo from the MODIS LandTeam.
[47] Acknowledgments. The authors would like to thank the anony-mous reviewers whose close reading and suggestions led to a better-organized and stronger paper. CERES data are supplied from the NASALangley Research Center Atmospheric Sciences Data Center. MODIS dataare supplied from the NASA Goddard Distributed Active Archive Center.ARM data are made available through the U.S. Department of Energy aspart of the Atmospheric Radiation Measurement Program. GMD data aremade available through the NOAA’s Earth System Research Laboratory/Global Monitoring Division-Radiation (G-RAD). SURFRAD data are madeavailable through NOAA’s Air Resources Laboratory/Surface RadiationResearch Branch. IGBP and Global Ecosystem maps are made availablefrom the USGS Earth Resources Observation and Science (EROS) dataCenter. C. Schaaf and M. Roman are supported by NASA NNX08AE94Aand DOE DE-FG02-06ER64178.
ReferencesAugustine, J. A., J. J. DeLuisi, and C. N. Long (2000), SURFRAD – ANational Surface Radiation Budget Network for Atmospheric Research,Bull. Am. Meteorol. Soc., 81(10), 2341–2358.
Bacour, C., and F.-M. Breon (2005), Variability of biome reflectance direc-tional signatures as seen by POLDER, Remote Sens. Environ., 98, 80–95, doi:10.1016/j.rse.2005.06.008.
Barkstrom, B. R., and G. L. Smith (1986), The Earth radiation budgetexperiment: Science and implementation, Rev. Geophys., 24, 379–390.
Betts, R. A., P. D. Fallon, K. K. Goldewijk, and N. Ramankutty (2007),Biogeophysical effects of land use on climate: Model simulations ofradiative forcing and large-scale temperature change, J. Agric. For.Meteorol., 142(2–4), 216–233.
Bicheron, P., and M. Leroy (2000), Bidirectional reflectance distributionfunction signatures of major biomes observed from space, J. Geophys.Res., 105, 26,669–26,681.
Bloom, S., et al. (2005), Documentation and Validation of the GoddardEarth Observing System (GEOS) Data Assimilation System - Version4, Tech. Rep. Series on Global Modeling and Data Assimilation104606, 26. (Available at http://gmao.gsfc.nasa.gov/systems/geos4/)
Briegleb, B. P., and V. Ramanathan (1982), Spectral and diurnal variationsin clear sky planetary albedo, J. Appl. Meteorol., 21, 1160–1171.
Briegleb, B. P., P. Minnis, V. Ramanathan, and E. Harrison (1986), Com-parison of regional clear-sky albedos inferred from satellite observationsand models comparisons, J. Clim. Appl. Meteorol., 25, 214–226.
Charlock, T. P., F. G. Rose, D. A. Rutan, T. A. Alberta, D. P. Kratz, L. H.Coleman, G. L. Smith, N. M. Smith, and T. D. Bess (1997), Clouds andthe Earth’s Radiant Energy System (CERES) algorithm theoretical basisdocument: Compute surface and atmospheric fluxes (subsystem 5).(Available at http://science.larc.nasa.gov/ceres/ATBD/)
Charlock, T. P., F. G. Rose, D. A. Rutan, Z. Jin, and S. Kato (2006),The global surface and atmosphere radiation budget: An assessmentof accuracy with 5 years of calculations and observations, paper presentedat 12th Conference on Atmospheric Radiation (AMS), 10–14 July,Madison, Wis. (Available at http://ams.confex.com/ams/Madison2006/techprogram/programexpanded_345.htm)
Collins, W. D., P. J. Rasch, B. E. Eaton, B. V. Khattatov, J.-F. Lamarque,and C. S. Zender (2001), Simulating aerosols using a chemical transportmodel with assimilation of satellite aerosol retrievals: Methodology forINDOEX, J. Geophys. Res., 106, 7313–7336.
Forster, P., et al. (2007), Changes in atmospheric constituents and in radia-tive forcing, in Climate Change 2007: The Physical Science Basis. Con-tribution of Working Group I to the Fourth Assessment Report of theIntergovernmental Panel on Climate Change, edited by S. Solomon,et al., pp. 129–234, Cambridge Univ. Press, New York.
Fu, Q., and K.-N. Liou (1993), Parameterization of the radiative propertiesof cirrus clouds, J. Atmos. Sci., 50, 2008–2025.
Gao, F., C. B. Schaff, A. H. Strahler, A. Roesch, W. Lucht, andR. Dickinson (2005), MODIS bi-directional reflectance distribution func-tion and albedo climate modeling grid products and the variability ofalbedo for major global vegetation types, J. Geophys. Res., 110,D01104, doi:10.1029/2004JD005190.
Geiger, B., O. Samain, F. Baret, O. Hagolle, P. Bicheron, J.-L. Roujean,L. Franchisteguy, and M. Leroy (2004), Multi-sensor data fusion forderiving bio-physical variables in the Cyclopes project, in Geoscienceand Remote Sensing Symposium, IGARSS ’04. Proceedings, 4, 2524–2527.
Green, R., and B. A. Wielicki (1997), Clouds and the Earth’s RadiantEnergy System (CERES) Algorithm Theoretical Basis Document: Con-volution of imager cloud properties with CERES footprint point spreadfunction (Subsystem 4.4). (Available at http://science.larc.nasa.gov/ceres/ATBD/)
Gupta, S. K., D. P. Kratz, P. W. Stackhouse, and A. C. Wilber (2001), TheLangley parameterized shortwave algorithm (LPSA) for surface radiationbudget studies, NASA TP 2002-211272, 31 pp.
Hautecœur, O., and M. Leroy (1998), Surface bidirectional reflectance dis-tribution function observed at global scale by POLDER/ADEOS, Geo-phys. Res. Lett., 25, 4197–4200.
Hess, M., P. Koepke, and I. Schult (1998), Optical properties of aerosolsand clouds: The software package OPAC, Bull. Am. Meteorol. Soc., 79,831–844.
Jin, Z., K. Stamnes, W. F. Weeks, and S. C. Tsay (1994), The effects of seaice on the solar energy budget in the atmosphere-sea ice-ocean system: Amodel study, J. Geophys. Res., 99, 25,281–25,294.
Jin, Y., C. B. Schaaf, C. E. Woodcock, F. Gao, X. Li, A. H. Strahler,W. Lucht, and S. Liang (2003), Consistency of MODIS surface bi-directional reflectance distribution function and albedo retrievals: 2.Validation, J. Geophys. Res., 108(D5), 4159, doi:10.1029/2002JD002804.
D08125 RUTAN ET AL.: DEVELOP/ASSESS SFC ALBEDO FOR CERES CRS
18 of 19
D08125

Jin, Z., T. P. Charlock, W. L. Smith, and K. Rutledge (2004), A parameter-ization of ocean surface albedo, Geophys. Res. Lett., 31, L22301,doi:10.1029/2004GL021180.
Jin, Z., T. P. Charlock, K. Rutledge, G. Cota, R. Kahn, J. Redemann,T. Zhang, D. A. Rutan, and F. Rose (2005), Radiative transfer mod-eling for the CLAMS experiment, J. Atmos. Sci., 62, 1053–1071.
Jin, Z., T. P. Charlock, P. Yang, S. R. Hudson, and S. G. Warren (2008),Snow optical properties for different particle shapes with application tosnow grain size retrieval and MODIS/CERES radiance simulation overAntarctic, Remote Sens. Environ., 112, 3563–3581.
Kato, S., F. G. Rose, and T. P. Charlock (2005), Computation of domain-averaged irradiance using satellite-derived cloud properties, J. Atmos.Ocean. Technol., 22b, 146–164.
Liang, S., A. H. Strahler, and C. W. Walthall (1999), Retrieval of landsurface albedo from satellite observations: A simulation study, J. Appl.Meteorol., 38, 712–725.
Loeb, N. G., S. Kato, K. Loukachine, and N. Manalo-Smith (2005), Angu-lar distribution models for top-of-atmosphere radiative flux estimationfrom the Clouds and the Earth’s Radiant Energy System on the Terrasatellite. part I: Methodology, J. Atmos. Ocean. Technol., 22, 338–351.
Loeb, N. G., S. Kato, K. Loukachine, N. Manalo-Smith, and D. R. Doelling(2007), Angular distribution models for top-of-atmosphere radiative fluxestimation from the Clouds and the Earth’s Radiant Energy System on theTerra satellite. part II: Validation, J. Atmos. Ocean. Technol., 22, 338–351.
Long, C. N., and T. P. Ackerman (2000), Identification of clear skies frombroadband pyranometer measurements and calculation of downwellingshortwave cloud effects, J. Geophys. Res., 105, 15,609–15,626.
Lucht, W., C. B. Schaaf, and A. H. Strahler (2000b), An algorithm for theretrieval of albedo from space using semi-empirical BRDF models, IEEETrans. Geosci. Remote Sens., 38, 977–998.
Maignan, F., F.-M. Breon, and R. Lacaze (2004), Bidirectional reflectanceof Earth targets: Evaluation of analytical models using a large set ofspaceborne measurements with emphasis on the hot spot, Remote Sens.Environ., 90, 210–220.
Minnis, P., D. F. Young, S. Sun-Mack, P. W. Heck, D. R. Doelling, andQ. Trepte (2003), CERES cloud property retrievals from imagers onTRMM, Terra, and Aqua, in Remote Sensing of Clouds and the Atmo-sphere VIII, edited by K. P. Schaefer et al., Int. Soc. for Opt. Eng.,SPIE Proc., 5235, 37–48.
Minnis, P., D. F. Young, S. Sun-Mack, Q. Z. Trepte, R. R. Brown,S. Gibson, and P. Heck (2004), Diurnal, seasonal, and interannual varia-tions of cloud properties derived for CERES from imager data [CD-ROM],in Proc. of the Thirteenth American Meteorological Society ConferenceSatellite Oceanography and Meteorology, Norfolk, Va., 20–24 Sept.,P6.10.
Myers, D. R., S. Wilcox, M. Anderberg, S. H. Alawaji, N. M. Al Abbadi,and M. Y. bin Mahfoodh (1999), Saudi Arabian solar radiation networkof data for validating satellite remote-sensing systems, in Earth Obs. Sys.IV SPIE, vol. 3750, edited by W. L. Barnes, 18–20 July, Denver, Colo.(Available at http://spie.org/x1848.xml)
Ohmura, A., et al. (1998), Baseline Surface Radiation Network (BSRN/WCRP): New precision radiometry for climate change research, Bull. Am.Meteorol. Soc., 79(10), 2115–2136.
Pinker, R. T., and A. Karnieli (1995), Characteristic spectral reflectance of asemi-arid environment, Int. J. Remote Sens., RS100424.
Pinker, R. T., and I. Laszlo (1992), Modeling of surface solar irradiancefor satellite applications on a global scale, J. Appl. Meteorol., 31,195–211.
Remer, L. A., et al. (2005), The MODIS aerosol algorithm, products, andvalidation, J. Atmos. Sci., 62, 947–973.
Roesch, A., C. Schaaf, and F. Gao (2004), Use of moderate-resolutionimaging spectroradiometer bi-directional reflectance distribution function
products to enhance simulated surface albedo, J. Geophys. Res., 109,D12105, doi:10.1029/2004JD004552.
Rose, F. G., and T. P. Charlock (2002), New Fu-Liou Code Tested withARM Raman Lidar and CERES in pre-CALIPSO Exercise, Extendedabstract for 11th Conference on Atmospheric Radiation (AMS), 3–7June, Ogden, Utah.
Rutan, D., T. Charlock, F. Rose, S. Kato, S. Zentz, and L. Coleman (2006),Global Surface Albedo from CERES/TERRA Surface and AtmosphericRadiation Budget (SARB) Data Product, in Proceedings of 12thConference on Atmospheric Radiation (AMS), 10 – 14 July 2006,Madison, Wis. (Available at http://ams.confex.com/ams/Madison2006/techprogram/programexpanded_345.htm)
Salomon, J. G., A. H. Strahler, F. Gao, and Y. Jin (2006), Validation of theMODIS bi-directional reflectance distribution function and albedo retrie-vals using combined observation from the Aqua and Terra platforms,IEEE Trans. Geosci. Remote Sens., 44(6), 1555–1564.
Schaaf, C. B., et al. (2002), First operational BRDF albedo nadir reflectanceproducts from MODIS, Remote Sens. Environ., 83, 135–148.
Smith, G. L., and R. N. Green (1981), Deconvolution of wide field-of-viewradiometer measurements of earth-emitted radiation. part I: Theory,J. Atmos. Sci., 38, 461–473.
Smith, W. L., Jr., T. P. Charlock, R. Kahn, J. V. Martins, L. A. Remer, P. V.Hobbs, J. Redemann, and C. K. Rutledge (2005), EOS-TERRA aerosoland radiative flux validation: An overview of the Chesapeake Lighthouseand Aircraft Measurements for Satellites (CLAMS) experiment, J. Atmos.Sci., 62, 903–918.
Suttles, J. T., R. N. Green, P. Minnis, G. L. Smith, W. F. Staylor, B. A.Wielicki, I. J. Walker, D. F. Young, V. R. Taylor, and L. L. Stowe (1988),Angular radiation models for the earth-atmosphere system, vol. I: Short-wave Radiation, NASA Ref. Publ. RP-1184, 147 pp.
Tegen, I., and A. A. Lacis (1996), Modeling of particle size distribution andits influence on the radiative properties of mineral dust aerosol, J. Geo-phys. Res., 101, 19,237–19,244.
van Leeuwen, W., and J.-L. Roujean (2002), Land surface albedo from thesynergistic use of polar (EPS) and geo-stationary (MSG) observing sys-tems: An assessment of physical uncertainties, Remote Sens. Environ.,81, 273–289.
Wang, Z., X. Zeng, and M. Barlage (2007), Moderate resolution imagingspectroradiometer bidirectional reflectance distribution function-based al-bedo parameterization for weather and climate models, J. Geophys. Res.,112, D02103, doi:10.1029/2005JD006736.
Wielicki, B. A., B. R. Barkstrom, E. F. Harrison, R. B. Lee III, G. L. Smith,and J. E. Cooper (1996), Clouds and the Earth’s Radiant Energy System(CERES): An earth observing system experiment, Bull. Am. Meteorol.Soc., 77, 853–868.
Yang, S.-K., S. Zhou, and A. J. Miller (2000), SMOBA: A 3-D daily ozoneanalysis using SBUV/2 and TOVS measurements. (Available atwww.cpc.ncep.noaa.gov/products/stratosphere/SMOBA/smoba_doc.shtml)
Zhou, Y., K. C. Rutledge, T. P. Charlock, N. C. Loeb, and S. Kato (2001),Atmospheric correction using MODTRAN for TOA and surface BRDFcharacteristics from high resolution spectroradiometeric/angular measure-ments from helicopter platform, Adv. Atmos. Sci., 18, 984–1004.
�����������������������T. Charlock, Science Directorate, NASA Langley Research Center, Mail
Stop 420, 21 Langley Boulevard, Room 170, Hampton, VA 23681-2199,USA.N. Manalo-Smith, F. Rose, and D. Rutan, Science Systems and
Applications, Inc., 1 Enterprise Parkway, Suite 200, Hampton, VA 23666,USA. ([email protected])M. Roman and C. Schaaf, Department of Geography, Center for Remote
Sensing, Boston University, 675 Commonwealth Avenue, Room CAS 436,Boston, MA 02215, USA.
D08125 RUTAN ET AL.: DEVELOP/ASSESS SFC ALBEDO FOR CERES CRS
19 of 19
D08125