Development and application of a photometric method in ...
65
DEVELOPMENT AND APPLICATION OF A PHOTOMETRIC METHOD IN QUALITY EVALUATION OF BENZIMIDAZOLE ANTHELMINTHICS IN NAIROBI CITY COUNTY A THESIS SUBMITTED IN PARTIAL FULFILMENT OF THE REQUIREMENTS FOR THE AWARD OF THE DEGREE OF MASTER OF PHARMACY IN PHARMACEUTICAL ANALYSIS OF THE UNIVERSITY OF NAIROBI JOHNSON KIBIRA MURAGE B. Pharm. (Nairobi) U59/6793/2017 Department of Pharmaceutical Chemistry School of Pharmacy UNIVERSITY OF NAIROBI June 2020
Transcript of Development and application of a photometric method in ...

DEVELOPMENT AND APPLICATION OF A PHOTOMETRIC METHOD IN
QUALITY EVALUATION OF BENZIMIDAZOLE ANTHELMINTHICS IN
NAIROBI CITY COUNTY
A THESIS SUBMITTED IN PARTIAL FULFILMENT OF THE REQUIREMENTS
FOR THE AWARD OF THE DEGREE OF MASTER OF PHARMACY IN
PHARMACEUTICAL ANALYSIS OF THE UNIVERSITY OF NAIROBI
JOHNSON KIBIRA MURAGE
B. Pharm. (Nairobi)
U59/6793/2017
Department of Pharmaceutical Chemistry
School of Pharmacy
UNIVERSITY OF NAIROBI
June 2020

i
DECLARATION
I, Johnson Kibira Murage, declare that this thesis is my original work and, to the best of my
knowledge, has not been submitted elsewhere for examination, award of a degree or
publication.
Sign………………………………….. Date……………………………..
Dr. Johnson Kibira Murage (B. Pharm)
U59/6793/2017
This research thesis has been submitted for examination with our approval as University
Supervisors.
Sign…………………………………. Date……………………………..
Dr. Beatrice Amugune Ph.D.
Senior lecturer
Department of Pharmaceutical Chemistry
University of Nairobi.
Sign…………………………………. Date……………………………..
Dr. Peter M. Njogu Ph.D.
Lecturer
Department of Pharmaceutical Chemistry
University of Nairobi.
Sign…………………………………. Date……………………………
Dr. Stanley N. Ndwigah Ph.D.
Senior lecturer
Department of Pharmaceutical Chemistry
University of Nairobi

ii
UNIVERSITY OF NAIROBI
Declaration of Originality Name of Student: Johnson Kibira Murage
Registration Number: U59/6793/2017
College: Health Sciences
Faculty/School/Institute: School of Pharmacy
Department: Pharmaceutical Chemistry
Course Name: Master of Pharmacy in Pharmaceutical Analysis
Title of the work
Development and application of a photometric method in quality evaluation of
benzimidazole anthelminthics in Nairobi City County
DECLARATION
1. I understand what Plagiarism is and I am aware of the University’s policy in this regard.
2. I declare that this Thesis is my original work and has not been submitted elsewhere for
examination, award of a degree or publication. Where other people’s work or my own work has
been used, this has been properly acknowledged and referenced in accordance with the
University of Nairobi’s requirements.
3. I have not sought or used the services of any professional agencies to produce this work.
4. I have not allowed, and shall not allow anyone to copy my work with the intention of passing
it off as his/her own work.
5. I understand that any false claim in respect of this work shall result in disciplinary action in
accordance with University Plagiarism Policy.
Signature……………………………………………………….
Date…………………………………………………………….

iii
DEDICATION
I dedicate this research thesis to my wife, Maureen Atieno, and my children, Diana Mumbi and
William Irungu for their encouragement and patience. They provided the strength that kept me
moving on.

iv
ACKNOWLEDGEMENTS
I wish to deeply acknowledge my supervisors, Dr. B. K. Amugune, Dr. P. M. Njogu and Dr.
S. N. Ndwigah for their tireless efforts in guiding my research, generous support and constant
encouragement. Their suggestions and constant corrections saw me to the end of my research
work.
I also wish to acknowledge my sister, Nancy, whose offer to finance my studies encouraged
me to register for the course.
No words can accurately describe my gratitude towards the University of Nairobi through the
Department of Pharmaceutical Chemistry for granting me a scholarship that financed my
studies.
I also wish to acknowledge the staff of Drug Analysis and Research Unit (DARU): - J. M.
Nguyo, O.K. King’ondu, H. N. Mugo, J. S. Mang’oi, J. K. Nyamatari, C. K. Kinyae and E. A.
Owiti for their unending support and invaluable guidance and assistance during my
laboratory sessions.
The list would not be complete without the mention of the National Quality Control Laboratory,
and particularly Dr. H.K. Chepkwony and Dr. Mwaura who facilitated the use of their High
Performance Liquid Chromatograph (HPLC) in the validation of my method.
Finally, I wish to deeply acknowledge the financial assistance I received from the World Bank
through MAPRONANO ACE, Makerere University, Uganda which contributed greatly to the
success of my research.

v
Table of Contents DECLARATION .......................................................................................................................................... i
Declaration of Originality ........................................................................................................................ ii
DEDICATION ........................................................................................................................................... iii
ACKNOWLEDGEMENTS .......................................................................................................................... iv
LIST OF TABLES ..................................................................................................................................... viii
LIST OF FIGURES ..................................................................................................................................... ix
LIST OF SYMBOLS AND ABBREVIATIONS ................................................................................................. x
ABSTRACT .............................................................................................................................................. xii
CHAPTER ONE: INTRODUCTION .............................................................................................................. 1
1.1 Neglected tropical diseases .............................................................................................................. 1
1.2 Helminthiasis ..................................................................................................................................... 2
1.3 Chemotherapy of helminthic infections ........................................................................................... 3
1.3.1 Piperazine ................................................................................................................................... 3
1.3.2 Benzimidazoles .......................................................................................................................... 4
1.3.3 Levamisole, morantel and pyrantel ........................................................................................... 4
1.3.4 Paraherquamide ........................................................................................................................ 4
1.3.5 Macrocyclic lactones and milbemycins ...................................................................................... 4
1.3.6 Cyclodepsipeptides .................................................................................................................... 5
1.3.7 Metrifonate ................................................................................................................................ 5
1.3.8 Isoquinolines .............................................................................................................................. 5
1.3.9 Bithionol ..................................................................................................................................... 5
1.4 Potential new drug candidates against food-borne trematodiasis .................................................. 5
1.5 Benzimidazole anthelminthics .......................................................................................................... 6
1.6 Mode of action of benzimidazole anthelminthics ............................................................................ 9
1.7 Methods of analysis for benzimidazoles ......................................................................................... 10
1.8 The study problem and justification ............................................................................................... 12
1.9 Research question ........................................................................................................................... 13
1.10 The study objectives ..................................................................................................................... 13
1.10.1 General objective ................................................................................................................... 13
1.10.2 Specific objectives .................................................................................................................. 13

vi
CHAPTER TWO: EXPERIMENTAL ........................................................................................................... 14
2.1 Introduction .................................................................................................................................... 14
2.2 Method development ..................................................................................................................... 14
2.2.1 Chemicals, reagents and solvents ............................................................................................ 14
2.2.2 Working Standards ................................................................................................................... 14
2.2.3 Instrumentation ....................................................................................................................... 15
2.2.4 Determination of a suitable solvent ........................................................................................ 15
2.2.5 Choice of wavelength of analysis ............................................................................................. 15
2.2.6 Choice of working concentration ............................................................................................. 15
2.2.7 Method ..................................................................................................................................... 16
2.3 Method Validation .......................................................................................................................... 16
2.3.1 Introduction ............................................................................................................................. 16
2.3.2 Linearity and range .................................................................................................................. 16
2.3.3 Precision ................................................................................................................................... 16
2.3.3.1 Repeatability ..................................................................................................................... 17
2.3.3.2 Intermediate precision ...................................................................................................... 17
2.3.4 Accuracy ................................................................................................................................... 17
2.3.5 Orthogonal HPLC analysis ........................................................................................................ 18
2.3.5.1 Introduction ...................................................................................................................... 18
2.3.5.2 Preparation of solvents and mobile phase (USP 2018) .................................................... 18
2.3.5.3 Preparation of standard and test solutions (USP 2018) ................................................... 18
2.3.5.4 The chromatographic analysis (USP 2018) ....................................................................... 18
2.3.6 Specificity ................................................................................................................................. 19
2.4 Analysis of commercial samples ..................................................................................................... 19
2.4.1 Introduction .............................................................................................................................. 19
2.4.2 Acquisition of samples ............................................................................................................. 19
2.4.3 Preparation of the calibration curve ........................................................................................ 20
2.4.4 Sample preparation ..................................................................................................................... 20
2.4.4.1 Tablets ................................................................................................................................... 20
2.4.4.2 Suspension ............................................................................................................................ 20
CHAPTER THREE: RESULTS AND DISCUSSION ....................................................................................... 21
3.1 Method development ..................................................................................................................... 21
3.1.1 Choice of solvent ...................................................................................................................... 21
3.1.2 Choice of wavelength of analysis ............................................................................................. 21

vii
3.1.3 Choice of working concentration ............................................................................................. 24
3.2 Method Validation .......................................................................................................................... 24
3.2.1 Linearity and Range.................................................................................................................. 24
3.2.2 Precision ................................................................................................................................... 26
3.2.2.1 Repeatability ..................................................................................................................... 26
3.2.2.2 Intermediate precision ...................................................................................................... 26
3.2.3 Accuracy ................................................................................................................................... 26
3.2.4 Orthogonal HPLC assay: Results............................................................................................... 28
3.2.3 Specificity ................................................................................................................................. 29
3.3 Analysis of commercial products .................................................................................................... 29
3.3.1 Samples analysed ..................................................................................................................... 29
3.3.2 Assay results ............................................................................................................................ 29
CHAPTER FOUR: GENERAL DISCUSSION, CONCLUSION AND RECOMMENDATIONS ............................ 32
4.1 Conclusion ....................................................................................................................................... 32
4.2 Major findings ................................................................................................................................. 32
4.3 Recommendations .......................................................................................................................... 33
References ............................................................................................................................................. 33
APPENDIX: CHROMATOGRAMS OF THE ORTHOGONAL ANALYSIS ................................... 37

viii
LIST OF TABLES
Table 1.1: Infective agents for some neglected tropical diseases..…………………….……..1
Table 1.2: Common soil-transmitted helminths and their estimated global prevalence……...3
Table 1.3: Helminths and drugs for their treatment………….………………………….……3
Table 1.4: Some brands of albendazole available in the Kenyan market…………….………8
Table 1.5: Some brands of mebendazole available in the Kenyan market………….…….….9
Table 3.1: Results of analyses of commercial products at 133 nm……………….………....24
Table 3.2: Repeatability studies for the developed method…………………………………26
Table 3.3: Intermediate precision studies for the developed method….…………….………26
Table 3.4: Recovery of albendazole at 80% of working concentration…………….….……26
Table 3.5: Recovery of albendazole at 100% of working concentration…………….……...26
Table 3.6: Recovery of albendazole at 120% of working concentration…………….……...27
Table 3.7: Recovery of mebendazole at 80% of working concentration…..……….……….27
Table 3.8: Recovery of mebendazole at 100% of working concentration……………….….27
Table 3.9: Recovery of mebendazole at 120% of working concentration……………….….27
Table 3.10: Recovery of albendazole at 80, 100 and 120% of the working concentration…27
Table 3.11: Recovery of mebendazole at 80, 100 and 120% of the working concentration..27
Table 3.12: Results of the orthogonal HPLC analysis……………………………………….28
Table 3.13: Results of analyses of commercial products for albendazole…………………...29
Table 3.14: Results of analyses of commercial products for mebendazole………………….30

ix
LIST OF FIGURES
Figure 1.1: Examples of some benzimidazole that have been used as
anthelminthics………………………………………………………….…………………..….7
Figure1.2: Conversion of probenzimidazoles into the respective benzimidazoles………..…..8
Figure 3.1: Ultraviolet absorption spectrum for albendazole in 0.1M methanolic
HCl……………………………………………………………………………………….…..21
Figure 3.2: Ultraviolet absorption spectrum for mebendazole in 0.1M methanolic
HCl………………………………………………………………………………………...…22
Figure 3.3: Linearity and range plot for albendazole at 233 nm…………………….……….22
Figure 3.4: Linearity and range plot for mebendazole at 233 nm………………………..…..23
Figure 3.5: Plot of absorbance against concentration for albendazole at 294 nm.….….……25
Figure 3.6: Plot of absorbance against concentration for mebendazole at 294 nm..….....…..25

x
LIST OF SYMBOLS AND ABBREVIATIONS
% Per cent
˚C Degrees Celsius
µl Microliter
µm Micrometre
BP British Pharmacopoeia
C18 A chromatographic stationary phase consisting of a hydrocarbon
chain with 18 carbon atoms
cm Centimetre
CV Coefficient of variation
DALYs Disability adjusted life years
DARU Drug Analysis and Research Unit
EU European Union
FDA Food and Drug Administration
GABA Gamma-amino butyric acid
GIT Gastrointestinal tract
GSK GlaxoSmithKline
HCl Hydrochloric acid
HPLC High Performance Liquid Chromatography
HPLC-MS High Performance Liquid Chromatography-Mass Spectrometry
ICH International Council for Harmonization of Technical Requirements
for Pharmaceuticals for Human Use.
MDGs Millennium development goals
mg Milligram
ml Millilitre
mm Millimetre
MRL Maximum Residue Limit
NTDs Neglected Tropical Diseases
ODS Octadecylsilane
PPB Pharmacy and Poisons Board
RSD Relative standard deviation
SD Standard deviation
STH Soil transmitted helminths
TB Tuberculosis

xi
USA United States of America
USP United States Pharmacopeia
UV Ultra Violet
WHO World Health Organization
YLD Years lost to disability
YLL Life years lost through early death

xii
ABSTRACT
Introduction: Neglected Tropical Diseases (NTDs) are a group of communicable diseases
which are prevalent in the tropics affecting more than one billion people. Helminthiases are
classified among NTDs. Treatment and prevention of these infections is very costly to
developing economies. The communities most afflicted are poor and have limited access to
essential resources for their livelihood. Poor quality drugs for NTDs may lead to death or
prolonged treatment without achieving the desired results. The limited resources used in
purchasing poor quality drugs will therefore be wasted instead of being put to good use.
Study Objectives: The general objective of the study was to determine the quality of
benzimidazole anthelminthics in the Kenyan market using a simple, rapid and inexpensive
spectroscopic method. More specifically, the study aimed to explore the utility of an ultra-
violet (UV) spectroscopic method in the determination of the quality of benzimidazole
anthelminthics in the Kenyan market.
Method: The adaptability of a method reported in the literature by Agrawal et al for the
analysis of albendazole was investigated for the analysis of albendazole and mebendazole. In
the method development phase, two solvents were investigated; 0.1M hydrochloric acid (HCl)
with 0.05% sodium lauryl sulphate and 0.1M methanolic HCl. Two wavelengths for detection
were also investigated; 233 and 294 nm. The working concentration (12 μg/ml) was adapted
from the method used by Agrawal et al. The method was validated for precision, accuracy,
specificity, linearity and range as per the International Council for Harmonization (ICH)
guidelines.
The developed method was then used in the assay of commercial products available in
pharmaceutical wholesale outlets in Nairobi.

xiii
Results and discussion: The suitable solvent of analysis for the analytes was found to be 0.1M
methanolic HCl. The wavelength of analysis was set at 294 nm. The range was over which
linearity was established was way beyond the 80 to 120% of the working concentration
specified by the ICH. Upon validation, the method was found to have good linearity (R2 =
0.9988 for both albendazole and mebendazole). The method exhibited good precision with the
same day coefficient of variation (CV) of 0.184 and 0.579% and the intermediate CV of 0.230
and 0.162% for mebendazole and albendazole respectively against the ICH limit of 2%. This
meant that the developed method was precise for the analytes.
Out of 32 commercial samples analysed, five (15.6%) did not comply with compendial
specifications. Of great concern is that three (9.4%) of the non-compliant samples were low-
cost generic products. These are the products which are popular with the majority members of
the society who have a low income. Intra-brand batch variation was also observed. Out of three
batches of product A002T analysed, one did not comply with compendial specifications. It was
also observed that both batches of product M001S, the suspension of an innovator product, did
not comply with compedial specifications.
Utility of results: A major limitation in the analysis of benzimidazole anthelminthics is the
lack of reliable, simple, rapid and low-cost methods of analysis. The developed method serves
to fill this gap. It can be used in the analysis of raw materials and finished products. It can also
be used in the establishment of the quality of products prior to registration. The method will
prove very useful in post market surveillance of quality of benzimidazole anthelminthics.

1
CHAPTER ONE: INTRODUCTION
1.1 Neglected tropical diseases
Neglected tropical diseases (NTDs) are a group of communicable diseases (Table 1.1) which
are prevalent mostly in the tropics affecting more than one billion people. Treatment and
prevention of these infections is very costly especially to developing economies (WHO, 2010).
The global burden of NTDs, as calculated using the disability adjusted life years (DALYs), is
huge. The DALYs is calculated as the sum total of life years lost through early death (YLL)
plus the years lost to disability (YLD). The global burden of diseases (GBD) due to NTDs is
estimated as 56.6, malaria at 46.5 while tuberculosis (TB) stands at 34.7 DALYs (Fenwick,
2012) which illustrates the significance of NTDs to global ill health.
Table 1.1: Infective agents for some neglected tropical diseases
Infective agents Neglected Tropical Diseases
Bacteria Buruli ulcer, Hansen’s disease (Leprosy), Trachoma, Endemic
treponematoses (Yaws).
Protozoa Chaga’s disease, Sleeping sickness (Human African Trypanosomiasis),
Leishmaniasis.
Viruses Dengue, Chikungunya, Rabies.
Helminths Guinea-worm disease (Dracunculiasis), Ascariasis, Trichuriasis,
Hookworm, Echinococcosis, Food-borne trematodiases, Lymphatic
filariases, Taeniasis/Cysticercosis.
Fungi Mycetoma, Deep mycoses including Chromoblastomycosis.
Others Ectoparasites including Scabies, Snake-bite envenomation.
Approximately 800 million people worldwide are infected with Ascaris, 600 million have
Trichuris worms while 600 million have one or another species of hookworm. Hookworms
usually infect adults as well as children while other worms are usually found in children.
Neglected Tropical Diseases greatly impacted on the achievement of millennium development
goals (MDGs). For instance maternal health (MDG5) could not be improved or child mortality
reduced when one of the major causes of poor birth outcomes was anaemia caused by the
parasitic infections carried by millions of women of child-bearing age in rural areas of

2
developing nations (Fenwick, 2012; Qian and Zhou, 2016). The NTDs continue to pose a
challenge to the achievement of sustainable development goals (SDGs). Elimination of extreme
poverty involves the expansion of the reach to crucial interventions and technologies from
high- to low-income economies. This should of essence include the assurance of quality of
drugs (Sachs, 2012). It is therefore important to ensure that medicines that are availed for the
treatment of NTDs meet high quality criteria for human use.
1.2 Helminthiasis
Helminths are the commonest infectious agents in developing countries. Their global disease
burden exceeds better known conditions, such as malaria and tuberculosis. Being NTDs, very
little research by commercial pharmaceutical companies is conducted towards the development
of new anthelminthics. Yet due to their occurrence among the world’s poorest communities,
helminths afflict a huge population.
There are two major phyla of helminths, nematodes and platyhelminthes. The nematodes
(round worms) include the major intestinal worms (also known as the soil-transmitted
helminths – STH) and the filarial worms that cause lymphatic filariases and onchocerciasis.
The Platyhelminthes (flat worms) include flukes (trematodes) and tape worm (cestodes) (Hotez
et al., 2008).
Ascariasis, trichuriasis and hookworms are the three main STHs. The gastrointestinal tract
(GIT) of a child living in poverty in a developing country is likely to be parasitized with at least
one and in many cases all the three STHs. This results in impaired physical, intellectual and
cognitive development of the child. Table 1.2 shows the estimated global prevalence of
common helminth infections.

3
Table 1.2: Common soil-transmitted helminths and their estimated global prevalence
Helminth Disease Estimated global prevalence
(millions)
Ascaris lumbricoides Common roundworm
infection
807-1221
Trichuris trichuria Whipworm infection 604-790
Necator americanus and
Acylostoma duodenale
Hookworm infection 570-750
Strongyloides stercoralis Threadworm infection 30-100
Enterobius vermicularis Pinworm infection 4-25% of children
Toxocara canis and
Toxocara cati
Visceral and ocular larva
migrans
1.5-70% of children
Adopted from (Bethony et al., 2006).
1.3 Chemotherapy of helminthic infections
Anthelminthics are the mainstay of chemotherapy of parasitic infections in human and
veterinary animals. Because of the status of helminthiases as NTDs, there is a very small
number of therapeutic agents available for their treatment (Table 1.3). Indeed, most of the drugs
that are available for the treatment of helminthic infections in humans were first developed as
veterinary medicines (Holden-Dye and Walker, 2007). Anthelminthics are classified on the
basis of their chemical structure and mode of action. The various classes are described in the
sections that follow.
Table 1.3: Helminths and drugs for their treatment
Infection Drugs
Schistosomiasis Antimonials, Metrifonate, Oxamniquine, Praziquantel
Cestodiasis Niclosamide, Benzimidazoles, Praziquantel
Fascioliasis Praziquantel, Closantel and Halogenated Salicylamides
Intestinal round worms Piperazine, benzimidazoles, Morantel, Pyrantel, Levamisole,
Avermectins and Milbemycins, Closantel and Halogenated
Salicylamides, Emodepsides
1.3.1 Piperazine
This drug was first used as an anthelminthic in the 1950s. It is a weak gamma-amino butyric
acid (GABA) agonist that causes flaccid reversible paralysis of body wall muscle of the
helminth. This facilitates the expulsion of the nematode (Holden-Dye and Walker, 2007).
Though piperazine is not effective against filariases, diethyl carbamazine is a more effective
anthelminthic and the drug of choice for filariasis and loiasis (Hawking, 1979).

4
1.3.2 Benzimidazoles
Benzimidazoles are the subject of this study. They are discussed in detail in Section 1.5.
Benzimidazoles act by inhibiting the dimerization of α- and β-tubulin to form protozoal
microtubules. This inhibition is lethal to the helminth.
1.3.3 Levamisole, morantel and pyrantel
These anthelminthics are nicotinic receptor agonists. They elicit spastic muscle paralysis due
to prolonged activation of excitatory nicotinic acetylcholine receptors on body wall muscle of
the helminths.
1.3.4 Paraherquamide
Paraherquamide A and marcfortine are both oxindole alkaloids, originally isolated from
Penicillium paraherquei and Penicillium roqueforti, respectively. Paraherquamide and its
derivative 2-deoxy-paraherquamide, are antagonists of β-nicotinic acetylcholine receptor
subtypes. This induces flaccid paralysis in the nematodes thus facilitating their expulsion (Epe
and Kaminsky, 2013). The activity of paraherquamide against sheep nematodes has been
observed though no commercial preparation is available (Besier, 2007).
1.3.5 Macrocyclic lactones and milbemycins
Ivermectin was introduced as an anthelminthic in the 1980s. It is a semi-synthetic derivative of
avermectin which is a large macrocyclic lactone fermentation product of Streptomyces
avermitilis. The synthesis of ivermectin is achieved through the selective hydrogenation of the
C22 – C23 double bond in avermectins 1a and 1b using the Wilkinson’s homogeneous
hydrogenation catalyst (Campbell et al., 1983; Fink, 1988). Other ivermectin analogues
developed after its discovery includes moxidectin, milbemycin oxime, doramectin, salamectin,
abamectin and eprinomectin.
Ivermectin causes a potent and persistent paralysis of nematode neurones and pharyngeal and
body wall musculature. It interacts with a range of ligand-gated ion channels including
acetylcholine-gated chloride channels, histamine-gated chloride channels, GABA-gated
chloride channels and glycine receptors. Its anthelminthic activity is however attributed to its
high affinity for nematode glutamate-gated chloride channels. Ivermectin activates these
channels, opening them slowly and irreversibly. This leads to long-lasting hyperpolarisation of
the neurone or muscle cell thus blocking further function. Paralysis of the nematode that
facilitates expulsion follows (Wolstenholme and Rogers, 2005).

5
1.3.6 Cyclodepsipeptides
Emodepside is a semi-synthetic derivative of PF1022A, a fermentation product obtained from
the fungus, Mycelia sterilia. Emodepside is effective against isolates of parasites that are
resistant to benzimidazoles, levamisole and ivermectin. Emodepside binds to a presynaptic
receptor in nematodes leading to the release of an unknown transmitter which exerts a
postsynaptic membrane to cause flaccid paralysis of the pharynx and somatic musculature in
nematodes. This facilitates their expulsion (Harder et al., 2005).
1.3.7 Metrifonate
Metrifonate is an antischistosomal drug that is effective against Schistosoma haematobium. It
is non-enzymatically converted into dichlorvos, an organophosphate cholinesterase inhibitor.
Accumulation of acetylcholine in the helminth leads to flaccid paralysis that causes their
detachment from the walls of blood vessels. The helminths are hence swept by the blood to the
lungs where they are unable to survive (Cioli et al., 1995).
1.3.8 Isoquinolines
This class includes praziquantel and oxamniquine. Praziquantel is the drug of choice for all
fluke infections except Fasciola species. It interacts with calcium ion channels. It has been
shown to induce rapid vacuolisation and disintegration of teguments of parasites. Oxamniquine
is used in the treatment of Schistosoma mansoni infections. It is an irreversible protein synthesis
inhibitor in the trematode leading to the death of the trematode (Lambertucci et al., 1989).
1.3.9 Bithionol
Bithionol was previously used for the treatment of fascioliasis and paragonimiasis. It has
however been largely replaced by triclabendazole and praziquantel.
1.4 Potential new drug candidates against food-borne trematodiasis
Certain drugs which are currently used in the treatment of other diseases have shown potential
as anthelminthics. These include the artemisinins and synthetic peroxides, mefloquine and
tribendimine. Artemisinin derivatives, namely artemether and artesunate have been studied
recently in different trematode-rodent models. All liver and intestinal flukes tested were
affected by artemisinins in rodent models. Studies have also been carried out in sheep and
rabbit models with promising results.
To overcome the chemical, economic and biopharmaceutical shortcomings of synthetic
artemisinins, studies have been done on the synthetic peroxide OZ78 with promising results.
Structure-activity relationship studies in sheep infected with Fasciola hepatica have revealed
the potential for the development of clinically useful products (Zhao et al, 2010). Mefloquine

6
has been reported to show antischistosomal properties against Schistosoma mansoni and S.
japonicum in infected mice (Holden-Dye and Walker, 2007; Keiser and Utzinger, 2008).
1.5 Benzimidazole anthelminthics
Thiabendazole was the first benzimidazole and highly efficacious broad spectrum
anthelminthic to be developed. Since the introduction of thiabendazole, benzimidazoles with
improved efficacy and extended spectra of activity have been developed. Parbendazole,
cambendazole, mebendazole and oxibendazole were benzimidazole products of research
conducted after the introduction of thiabendazole. Other benzimidazoles include fenbendazole,
oxfenbendazole, albendazole, triclabendazole and luxabendazole (McKellar and Scott, 1990)..
However, poor gastrointestinal absorption and low water solubility of the earlier
benzimidazoles led to the development of probenzimidazoles. Probenzimidazoles are prodrugs
that are converted into the respective benzimidazoles in vivo upon administration. Netobimin
and febantel are examples of probenzimidazoles. Febantel, upon absorption, is converted into
fenbendazole (McKellar and Scott, 1990) while Netobimin is converted in the gastrointestinal
tract into albendazole. Netobimin is a water-soluble probenzimidazole that can be formulated
for parenteral and oral administration in veterinary medicine. Upon oral administration,
netobimin undergoes nitro-reduction and cyclization to convert it into albendazole, the active
form. This activation is mediated by gastrointestinal microorganisms rather than liver
microsomal enzymes. Thus when given parenterally, very low levels of albendazole are
detected in the blood. This may suggest that development of netobimin did not solve the
pharmacokinetic challenges (poor absorption) of albendazole. Activation of febantel into
fenbendazole is thought to occur in the liver. (Lanusse et al, 1992).
Figure 1.1 shows chemical structures of some benzimidazoles that have been used as
anthelminthics while Figure 1.2 is a schematic diagram of the conversion of some
probenzimidazoles into their respective benzimidazoles.

7
N
NS
N
H
C
O
Mebendazole
H3C
CH
H3C
O C NHN
N S
N
O
HCambendazole
F CN
N
NH C
O
O
OCH3
HFlubendazole
CH3CH2CH2 O N
N
NH CCH3
O
H
Oxibendazole
F S O N
N
NH C
O
O
O
OCH3
H
Luxabendazole
CH3CH2CH2CH2N
N
NH C
O
OCH3
HParbendazole Cl Cl
O
N
N
S
Cl
CH3
H
Triclabendazole
CH3CH2CH2 S N
N
NH C
O
OCH3
H
Albendazole
S N
N
NH C
O
OCH3
H
Fenbendazole
N
N
NH C
O
OCH3
H
Thiabendazole
Figure 1.1: Examples of some benzimidazoles that have been used as anthelminthics

8
S NH
NH
C
C
NH
N
C
O
OCH3
C
O
OCH3
O
CH2 O CH3
SN
N
NH C
O
OCH3
H
Fenbendazole
CH3CH2CH2 S N
NO2
C
NH
NH
CH2CH2 S
O
O
OH
C
O
OCH3
Netobimin
CH3CH2CH2 SN
N
NH C
O
OCH3
H
Albendazole
Febantel
Figure 1.2: Conversion of some probenzimidazoles into the respective benzimidazoles
A survey of various pharmaceutical wholesale outlets revealed that only albendazole and
mebendazole are available in the Kenyan market as broad spectrum benzimidazole
anthelminthics for human use. The brands identified in the market are as indicated in Tables
1.4 and 1.5.
Table 1.4: Some brands of mebendazole available in the Kenyan market
Brand Name Manufacturer Tablets Oral suspension
1. Vermox® Johnson and Johnson 6 × 100 mg
1 × 500 mg
20 mg/ml × 30 ml
2. Mebendazole® Regal 6 × 100 mg N/A
3. Natoa® Lab and Allied 6 × 100 mg 20 mg/ml × 30 ml
4. Vermont® Dawa Limited 6 × 100 mg 20 mg/ml × 30 ml
5. Vermisan® Biodeal N/A 20 mg/ml × 30 ml
6. Minyua® Cosmos 6 × 100 mg 20 mg/ml × 30 ml
N/A – Not available

9
Table 1.5: Some brands of albendazole available in the Kenyan market
Brand Name Manufacturer Tablets Oral Suspension
1. Zentel® GlaxoSmithKline (GSK) 2 × 200 mg 20 mg/ml × 20 ml
2. Alben® Beecham/GSK 1 × 400 mg 40 mg/ml × 10 ml
3. ABZ® Indoco 1 × 400 mg 40 mg/ml × 10 ml
4. Emitel® Njimia Kenya 1 × 400 mg 40 mg/ml × 10 ml
5. Wombit® Biodeal 2 × 200mg 40 mg/ml × 10 ml
6. Albaxate® Sphinx N/A 40 mg/ml × 10 ml
7. Albasol® Regal 2 × 200 mg 40 mg/ml × 10 ml
8. D-Worm® Dischem N/A 40 mg/ml × 10 ml
9. Olworm® Biopharma 2 × 200 mg 40 mg/ml × 10 ml
10. Zolex® Medico 1 × 400 mg N/A
11. Tanzol® Shaliva 1 × 400 mg 40 mg/ml × 10 ml
12. Benaworm® Benmed 1 × 400 mg 40 mg/ml × 10 ml
13. Albalite® Skylight N/A 40 mg/ml × 10 ml
14. Altoa® Lab and Allied 2 × 200 mg 40 mg/ml × 10 ml
N/A – Not available
1.6 Mode of action of benzimidazole anthelminthics
The biochemical target for benzimidazole anthelminthics is the β-tubulin, a cytoskeletal protein
which is a building block of microtubules present in all eukaryotic cells. Microtubules are
critical cytoskeletal polymers which are made of repeating α- and β-tubulin dimers.
Microtubules are involved in cellular morphology, cell transport, cell motility and cell division
(Nogales, 2000).
Benzimidazoles elicit their anthelminthic actions by binding to β-tubulin with a 25-400 fold
greater affinity for nematode tubulin than mammalian tubulin. The binding inhibits
polymerization of α- and β-tubulin sub-units into microtubules. In rapidly dividing cells, this
inhibition leads to cell death. In non-dividing cells, several effects on homeostatic mechanisms
is elicited, often leading to non-lethal expulsion of the nematodes (Lacey, 1990). These effects
include inhibition of glucose uptake in helminths with a compensatory depletion of glycogen
stores, uncoupling of oxidative phosphorylation, depletion of Adenosine triphosphate (ATP)
levels and inhibition of fumarate reductase, an essential anaerobic enzyme (Lacey, 1988).

10
Studies of receptor interactions reveal that a phenylalanine residue at position 200 of the
helminth β-tubulin is necessary for binding of benzimidazoles. Hence resistance to
benzimidazole anthelminthics has been attributed to a mutation at this position which
commonly involves replacement of phenylalanine with tyrosine. Unfortunately, structural
modification of the drugs cannot be used to overcome resistance because mammalian β-tubulin
has a tyrosine residue at the same position. This complicates the development of new drugs,
especially considering that the search of benzimidazoles with improved spectra of activity and
efficacy has proved frustrating (Martin et al., 1997; McKellar and Scott, 1990).
1.7 Methods of analysis for benzimidazoles
The British Pharmacopoeia (BP) has described a high performance liquid chromatographic
(HPLC) method for the assay of liquid preparations of albendazole for veterinary use. The
method uses 1% methanolic sulphuric acid as the solvent for both the sample and the standard
API. Gradient elution is used with two mobile phases; 0.015M ammonium dihydrogen
orthophosphate and methanol. A stainless steel column of specific dimensions is
recommended. It is packed with octadecylsilyl silica gel particles (5 µm). The injection volume
is 20 μl and a flow rate of 0.7 ml/min at ambient column temperature. An ultraviolet (UV)
detector set at 292 nm is used.
The United States Pharmacopeia (USP) on the other hand has described a HPLC method for
the assay of both tablet and liquid preparations of albendazole for human use. For the analysis
of oral suspension, the USP recommends the use of monobasic sodium phosphate as the mobile
phase buffer. The mobile phase consists of water and methanol in the ratio 2:3. The method
recommends the use of standard albendazole USP as an external standard. Detection is
accomplished using an UV detector set at 308 nm. The USP recommends a 4 mm x 25 cm
column packed with 5 µm particles. The stationary phase is octadecylsilane (ODS, C18). The
injection volume is 20 μl and the flow rate set at about 2 ml/minute.
For the assay of albendazole tablets, the USP recommends monobasic ammonium phosphate
as the mobile phase buffer. The choice of buffer influences peak shape and resolution (Tindall
and Dolan, 2002). The mobile phase consists of water and methanol in the ratio 2:3. The
method recommends standard parbendazole USP as an internal standard. Not less than 20
tablets should be used for the assay. Detection is accomplished using a UV detector set at 254
nm. The recommended column is the same as for the suspension. The tailing factor should not
be more than 2.0 while the column efficiency should not be less than 1000 theoretical plates
11
Further the USP describes a UV spectroscopic method for the assay of mebendazole oral
suspension. The procedure involves several extraction steps of mebendazole between 96%
formic acid and chloroform. Isopropyl alcohol is then used as the solvent in the final step of
sample preparation for the extracted drug.
For the assay of mebendazole tablets the USP describes a HPLC method. The mobile phase
consists of methanol and 0.05M monobasic potassium phosphate in the ratio 60:40 v/v. The
pH is adjusted to 5.5 with either 0.1M phosphoric acid or 0.1M sodium hydroxide.
Other scientists have developed methods for the determination of benzimidazoles. De Ruyck
et al described a HPLC-mass spectrometry (HPLC-MS) method for the analysis of
benzimidazole anthelminthic residues in milk (De Ruyck et al, 2002). Specifically, the method
was developed to determine levamisole and the benzimidazoles thiabendazole,
oxfenbendazole, oxibendazole, albendazole, fenbendazole, triclabendazole and the
probenzimidazole febantel in milk. This was necessitated by the fact that in the wet season, the
treatment of dairy cows for endoparasites is done. Failure to withdraw the anthelminthics at
the right time in milk-producing animals may lead to the presence of anthelminthic residues in
milk.
Agrawal et al described a simple spectroscopic method for the determination of albendazole in
dissolution studies (Agrawal et al, 2005). The method can be used for the analysis of
albendazole both in the bulk and dosage forms. The solvent used was 0.1N HCl with 0.05%w/v
sodium lauryl sulphate (SLS). Absorbance was measured at 229nm. The method was validated
as per ICH guidelines.
A stability-indicating HPLC method for the analysis of mebendazole has also been described
(Al-Kurdi et al, 1999). The solvent used to prepare the analytes was 0.1M methanolic
hydrochloric acid. To prepare the degradation product, mebendazole raw material was
dissolved in 1M sodium hydroxide solution, heated to boiling under reflux for 30 minutes,
cooled and neutralized with 1M nitric acid. The chromatographic separation was carried out
using a stainless steel column of specific dimensions from WATERS, packed with 5µm
particles. The mobile phase was 0.05M monobasic potassium phosphate: Methanol:
Acetonitrile (5:3:2 v/v/v) at a flow rate of 1 ml/min. All measurements were made at room
temperature. The injection volume was 20 µl.

12
Several other analytical methods have been described by other researchers with varied results
(Msagati and Nindi, 2001; Santaladchaiyakit and Srijaranai, 2013; Zrnčić et al., 2014).
1.8 The study problem and justification
Helminthic infections pose a great challenge to healthcare delivery systems in developing
countries (Crompton, 1999; Hotez et al., 2008). In a mass deworming programme in schools
in Western Kenya, it was noted that the prevalence of STH before the deworming exercise was
34.8% with Ascaris lumbricoides being the most prevalent followed by hookworm infestations
and Trichuris trichuria. After two rounds of mass deworming, STH prevalence dropped to
19.7% with prevalence decreasing to about 15%, 2% and 5% for A. lumbricoides, hookworm
and T. trichuria respectively (Nikolay et al., 2015). The fact that prevalence did not reduce to
zero can be explained by many factors, among them the use of sub-standard anthelminthics.
Other factors may include poverty that makes treatment inaccessible (Bethony et al., 2006).
For pre-school and school-going children, maternal education can contribute to helminth
infection. The mother may not exercise good hygiene or may not be aware of the available
treatment options. Consumption of unboiled water and poorly cooked meat are also
contributing factors (Wang et al., 2012). Repeated infections, inadequate food intake and
Human immunodeficiency virus and acquired immune deficiency syndrome (HIV/AIDS) can
also contribute to persistent helminth infections (Oyewole et al., 2002; Wolday et al., 2002).
Finally, age, environment (climate and topography), household clustering and drug resistance
are also contributing factors (Hotez et al., 2008).
A literature review revealed that no study has ever been conducted to establish whether the
benzimidazole anthelminthic products available in the Kenyan market conform to compendial
specifications. It is therefore possible that after registration, the quality of the product may
gradually deteriorate to sub-compendial specifications. Lack of conformance to compendial
specifications would complicate the already heavy disease burden posed by helminthic
infections. Limited resources would therefore be spent on treatment with no positive results.
Such resources can be redirected towards improving hygiene and the general quality of the
healthcare delivery system. It is worth noting that provision of universal health coverage is one
among the presidential big four agenda in Kenya in addition to enhancement of manufacturing,
provision of affordable housing and enhancement of food and nutrition security (Otinga, 2018).
It is therefore necessary to conduct this study and guarantee effective treatment to patients who
depend on these drugs as we make a major contribution to national development. The resultant

13
analytical method can also be used in the assessment of residues of anthelminthics in foods
such as in milk and meat.
Many analytical methods are quickly moving towards HPLC. This leaves ultraviolet (UV)
spectrophotometers underutilised in many analytical laboratories. Developing a UV
spectroscopic analytical method will therefore increase on the utility of this valuable
equipment. Spectroscopic methods are also faster than HPLC methods. Spectroscopy requires
less skill on the part of the analyst than HPLC. Fewer solvents and other reagents are used in
spectroscopy than in HPLC.
1.9 Research question
Can the prevalence of substandard benzimidazole anthelminthics in Nairobi City County be
established using a newly developed and validated ultraviolet spectrometric method?
1.10 The study objectives
1.10.1 General objective The main objective of this study is to determine the quality of benzimidazole anthelminthics in
Nairobi City County using a simple, rapid and inexpensive spectroscopic method.
1.10.2 Specific objectives
a. To develop and validate a simple and rapid spectroscopic method in the analysis of
benzimidazole anthelminthic drugs.
b. To determine the quality of benzimidazole anthelminthic drugs on the Nairobi City
County using the developed method.

14
CHAPTER TWO: EXPERIMENTAL
2.1 Introduction
Method development is a very important part of pharmaceutical analysis. A developed method
helps in the determination of the quality of active pharmaceutical ingredients (APIs) in raw
materials and dosage forms. A good analytical method should utilise readily available reagents,
solvents and equipment. It should be simple, rapid, precise, reliable, accurate, reproducible,
robust and cost effective.
With many analytical methods moving towards HPLC, spectroscopy seems to be an interesting
area for analytical method development. Compared to liquid chromatographs, UV
spectrophotometers are much more affordable. Although HPLC is more accurate, precise and
reproducible than spectrophotometry, the latter is simpler and faster. When faced with the
analysis of many samples, it would be prudent to use a simple spectroscopic method for the
analysis and only use HPLC as a confirmatory method of analysis for those samples that do
not comply with compendial standards with spectrophotometry. This study involved the
development of a simple, rapid, accurate, reproducible, reliable, precise and cost-effective
method for the analysis of benzimidazole anthelminthics namely albendazole and mebendazole
both as bulk raw material and dosage forms. The developed method was then used to establish
the quality of these benzimidazole anthelminthics available on the Kenyan market.
2.2 Method development
2.2.1 Chemicals, reagents and solvents
Methanol of HPLC grade (Finar Ltd, India) was obtained from Chemoquip Ltd Nairobi.
Analytical grade concentrated hydrochloric acid and sodium lauryl sulphate were provided by
the Drug Analysis and Research Unit (DARU).
2.2.2 Working Standards
Both albendazole and mebendazole working standards were provided by Dawa
Pharmaceuticals through DARU.

15
2.2.3 Instrumentation
All weighing was performed using a Sartorius top loading electronic weighing balance
(Sartorius GMBH, Germany). Absorbance was measured using a Genesys 10S UV-Vis
Spectrophotometer (ThermoFisher Scientific, China).
A Merck Hitachi HPLC machine (Hitachi Ltd, Tokyo, Japan) kindly availed by the National
Quality Control Laboratory (NQCL) was used for the orthogonal HPLC analysis of commercial
samples. It was equipped with an L-7100 low pressure quaternary pump; an L-7200
autosampler; an L-7400 variable UV detector set at 308 nm; an L-7350 thermostatic column
oven maintained at 40oC and an L-7000 computer interphase. A Varian HPLC column 250 ×
4.0 mm LiChrospher 100-5 RP 18 End capped column was used for the analysis.
2.2.4 Determination of a suitable solvent
The first step in the method development was the determination of a solvent suitable for
dissolving both APIs. Two solvents were investigated. The first one was 0.1M HCl with 0.05%
sodium lauryl sulphate (SLS). This was the solvent used by Agrawal et al in the development
of a UV spectroscopic method of analysing albendazole for solubility studies (Agrawal et al.,
2015). The second solvent was 0.1M methanolic HCl, the solvent used by Al-Kurdi et al for
the preparation of samples in their HPLC method development for the analysis of mebendazole
(Al-Kurdi et al., 1999).
2.2.5 Choice of wavelength of analysis
For the sake of simplicity, it was decided to use a common wavelength suitable for absorbance
measurements for both active pharmaceutical ingredients (APIs). To accomplish this, the UV
spectra of each API were run independently between 200 and 400 nm before being overlaid.
This was accomplished by preparing a solution with a nominal concentration of 12 μg/ml for
each API. This was the working concentration used by Agrawal et al in their method
development (Agrawal et al., 2015). First, a stock solution with a concentration of 1 mg/ml
was prepared by weighing 50 mg of the respective API into a 50 ml volumetric flask which
was dissolved in about 25 ml of 0.1M methanolic HCl and made to volume with the same
solvent. Then 0.3 ml of this solution was diluted to 25 ml in a volumetric flask to make the
working solution.
2.2.6 Choice of working concentration
In their study, Agrawal et al had used 12 μg/ml as their working concentration (Agrawal et al.,
2015). This was adopted as the working concentration for both APIs in the study. It fell within

16
the linear range for both APIs. To prepare a working solution, a 1 mg/ml stock solution of the
respective API was prepared by weighing 50 mg of the API into a 50 ml volumetric flask. A
minimum amount of 0.1M methanolic HCl was added and the flask shaken to dissolve the API
and made to the mark with the same solvent. Then 0.3 ml of this solution was pipetted into a
25 ml volumetric flask and made to volume with 0.1M methanolic HCl.
2.2.7 Method
The method that was taken to the validation stage involved the preparation of a 12 µg/ml
working solution of each API and measuring the absorbance at 294 nm.
2.3 Method Validation
2.3.1 Introduction
The objective of validation of an analytical procedure is to ascertain that the method is suitable
for its intended purpose. The various attributes of the analytical method, that is, precision,
specificity, accuracy, linearity and range, limits of detection and quantitation and robustness
are usually investigated as per ICH guidelines (ICH Q2B (R1), 2005).
2.3.2 Linearity and range
The linearity and linearity range of the developed method were determined using linear
regression analysis. A 1.0 mg/ml stock solution of the respective API was prepared by
weighing 50mg of the respective API into a 50 ml volumetric flask, dissolving with minimum
0.1M methanolic HCl, and the solution made to volume with the same solvent. To prepare the
working solutions, aliquots of this solution were transferred into 25 ml volumetric flasks and
made to volume with the same solvent to make solutions of 4, 8, 12, 16, 20, 24, 28 32, 36 and
40 µg/ml nominal concentration of the respective API. This represented a range of between
33.3 and 333.3% of the working concentration. The absorbances of these dilutions were
measured at 294 nm. The data obtained were then plotted using Microsoft Excel spread sheet
and subjected to linear regression analysis.
2.3.3 Precision
Precision of an analytical method seeks to establish the degree of scatter of results of replicate
analyses of the same sample from each other. Precision is expressed by the coefficient of
variation (CV) of the replicate measurements. The ICH recommends the establishment of
precision at three levels; repeatability, intermediate precision and reproducibility (ICH Q2B
(R1), 2005). In this study, repeatability and intermediate precision were determined as outlined

17
in sections 2.3.3.1 and 2.3.3.2 respectively. Reproducibility was not determined because there
was no collaborating laboratory in this method development research.
2.3.3.1 Repeatability
About 50 mg of each API were weighed into a 50ml volumetric flask and made to volume with
0.1M methanolic HCl. Then 0.3 ml of this solution was transferred to a 25 ml volumetric flask
and made to volume with the solvent. Absorbance of this solution was determined six times at
294 nm. The standard deviation (SD), relative standard deviation (RSD) and CV of this data
were then determined.
2.3.3.2 Intermediate precision
For this study, the procedure for the determination of repeatability (section 2.3.3.1) was
followed but carried out after 57 days. The ICH requires that intermediate precision should be
determined on a different day from repeatability. I therefore carried on with other tests after
determining repeatability and on the 57th day, I created time to determine the intermediate
precision.
2.3.4 Accuracy
For the developed method, accuracy was established by adding a known amount of the analyte
(API) to a solution of a commercial product at 80, 100 and 120% of the working concentration
(ICH Q2 (R1), 2005) (Office on Drugs and Crime, 2009). The percentage recovery of the
analyte was determined. At each level, the determinations were done in triplicate.
To prepare the samples for analysis, an amount of the commercial drug product equivalent to
about 40, 50 and 60 mg of the respective API was weighed into a 50 ml volumetric flask. An
amount of the standard that would give a final concentration of about 4 μg/ml of the standard
in the final dilution was also weighed into each flask. This was done by weighing about 16.7
mg of the respective API standard into each of the 50 ml volumetric flask containing the
commercial product sample. A minimum amount of 0.1M methanolic HCl was added to the
flask to dissolve the analyte. The solution was sonicated for five min to facilitate dissolution.
It was then made to volume with 0.1M methanolic HCl. This solution was then filtered. Then
0.3 ml of the filtrate was pipetted into a 25 ml volumetric flask and made to volume with the
solvent. The absorbance of this solution was measured at 294 nm.

18
2.3.5 Orthogonal HPLC analysis
2.3.5.1 Introduction
During method development a switch of wavelength was made from 233 nm to 294 nm. This
necessitated comparison of the results obtained from analyses at 294 nm with those of a
validated method (HPLC) to confirm their reliability and accuracy. The suspension dosage
form of product A001 (albendazole) was chosen because it had shown discrepancies with
results obtained at 233 nm and those obtained at 294 nm. The HPLC procedure for the analysis
of albendazole described in the USP 2018 was used.
2.3.5.2 Preparation of solvents and mobile phase (USP 2018)
Solution A was prepared by mixing methanol and hydrochloric acid in the ratio 99:1. Solution
B consisted of a solution of 13.75 g/l monobasic sodium phosphate. The mobile phase was
prepared by mixing methanol and solution B in the ratio 60:40.
2.3.5.3 Preparation of standard and test solutions (USP 2018)
To prepare the working standard stock solution, 20 mg of the albendazole working standard
were accurately weighed into a 20 ml volumetric flask. About 10 ml of solution A were added
and the flask shaken for sample to dissolve. The solution was made to volume with solution A
to give a solution with a 1 mg/ml nominal concentration. To prepare the working standard
solution, 5 ml of the stock solution were pipetted into a 50 ml volumetric flask and made to
volume with the mobile phase. The solutions were prepared in duplicate.
To prepare test stock solutions, the density of the suspension was determined. An amount of
the suspension equivalent to 25 mg albendazole was accurately weighed into a 25 ml
volumetric flask. About 10 ml of solution A were added and the flask shaken to dissolve. The
solution was sonicated for 5 min to facilitate dissolution and made to volume with solution A.
The solution was then filtered. To prepare the working test solution, 5 ml of the filtrate were
pipetted into a 50 ml volumetric flask and made to volume with the mobile phase. The solutions
were prepared in triplicate.
2.3.5.4 The chromatographic analysis (USP 2018)
The injection volume was set at 20µl and the flow rate at 1 ml/min. To determine the run time,
one of the standards was injected manually. The albendazole peak eluted between 11 and 12
min. No other peak eluted even after a run of 25 min. The run time was therefore set at 15 min.
The system suitability solution was standard I. The system was programmed to inject the
system suitability solution six times continuously and run the chromatograms of the standards

19
and test solutions four times each. A 4 × 250 mm column (see section 2.2.3) and a UV detector
set at 308 nm were used.
2.3.6 Specificity
Specificity of an analytical procedure is its capability to analyse the compound of interest
(analyte) in the presence of other components that may be present. These include degradation
products, related compounds and excipients (ICH Q2B (R1), 2005). It therefore defines the
degree of interference by these components in the analytical process. The process of testing for
accuracy (section 2.3.4) involves the analysis of the API in the presence of these components.
This therefore helped in the determination of the specificity of the analytical method. The
method was as follows: To prepare the samples for analysis, an amount of the commercial drug
product equivalent to about 40, 50 and 60 mg of the respective API was weighed into a 50 ml
volumetric flask. An amount of the standard that would give a final concentration of about 4
μg/ml of the standard in the final dilution was also weighed into each flask. This was done by
weighing about 16.7 mg of the respective API standard into each of the 50 ml volumetric flask
containing the commercial product sample. A minimum amount of 0.1M methanolic HCl was
added to the flask to dissolve the analyte. The solution was sonicated for five min to facilitate
dissolution. It was then made to volume with 0.1M methanolic HCl. This solution was then
filtered. Then 0.3 ml of the filtrate was pipetted into a 25 ml volumetric flask and made to
volume with the solvent. The absorbance of this solution was measured at 294 nm.
2.4 Analysis of commercial samples
2.4.1 Introduction
The primary objective of this study was to develop a simple, rapid, reliable and cost-effective
photometric method for the analysis of benzimidazole anthelminthics available in the Kenyan
market. This would help regulatory authorities in monitoring the quality of these drugs and
help solve, in part, the prevalence of helminth infections in the Kenyan population. Out of the
several benzimidazoles that have been used as anthelminthics, preliminary surveys only came
across albendazole and mebendazole brands in the market. A simple photometric method of
analysis would allow for the analysis of many samples.
2.4.2 Acquisition of samples
Most of the samples (specific product batches) were acquired from wholesalers in the Central
Business District (CBD) of Nairobi City County and a few wholesalers located in the outskirts
of the city. Though this was not encountered, expiry date would have been used as the basis of

20
selection in the event that two batches were encountered, with the shorter expiry batch being
selected. An attempt was made at comparing what was available from wholesale outlets with
what was available in the retail outlets. It was established that the retail outlets were indeed
getting their stocks from the wholesalers.
2.4.3 Preparation of the calibration curve
The linear plots used in the determination of linearity and linearity range (section 2.3.2) were
also used as the calibration curves for both APIs.
2.4.4 Sample preparation
2.4.4.1 Tablets
Twenty tablets were accurately weighed and crushed to a fine powder. An amount of the
powder equivalent to 50 mg of the respective API was accurately weighed into a 50 ml
volumetric flask. About 25 ml of 0.1M methanolic HCl was added and the flask shaken to
dissolve the API. The solution was ultrasonicated for 5 min, made to volume with the same
solvent and the solution filtered. Then 0.3 ml of the filtrate was pipetted into a 25 ml volumetric
flask and made to volume with the same solvent. The absorbance of this solution was measured
at 294 nm. The samples were prepared in triplicate.
2.4.4.2 Suspension
Twenty millilitres of the suspension was used for the analysis. The density of the suspension
was determined using a 10 ml density bottle. An amount of the suspension equivalent to 50 mg
of the respective API was accurately weighed into a 50 ml volumetric flask. About 25 ml of
0.1M methanolic HCl was added and the flask shaken to dissolve. The solution was
ultrasonicated for 5 min, made to volume with the same solvent and the solution filtered. Then
0.3 ml of the filtrate was pipetted into a 25 ml volumetric flask and made to volume with the
same solvent. The absorbance of this solution was measured at 294 nm. The samples were
prepared in triplicate.

21
CHAPTER THREE: RESULTS AND DISCUSSION
3.1 Method development
3.1.1 Choice of solvent
After testing API solubility in the two solvents namely 0.1M HCl with 0.05% Sodium Lauryl
Sulphate and 0.1M methanolic HCl, both albendazole and mebendazole were found to have
reliable solubility in 0.1M methanolic HCl. This solvent was therefore used for the remaining
steps in the development of the analytical method.
3.1.2 Choice of wavelength of analysis
The spectra for both APIs are provided in Figures 3.1 and 3.2. For both APIs a peak of
maximum absorption was observed between 230 and 236 nm. It was decided to settle on 233
nm as it was the wavelength of maximum absorption for mebendazole while albendazole
showed reliable absorption as it was close to its wavelength of maximum absorption (231 nm).
The linearity and range for both APIs were studied at this wavelength. The results are presented
in Figure 3.3 and 3.4.
Figure 3.1: Ultraviolet absorption spectrum for albendazole in 0.1M methanolic HCl
22
Figure 3.2: Ultraviolet absorption spectrum for mebendazole in 0.1M methanolic HCl
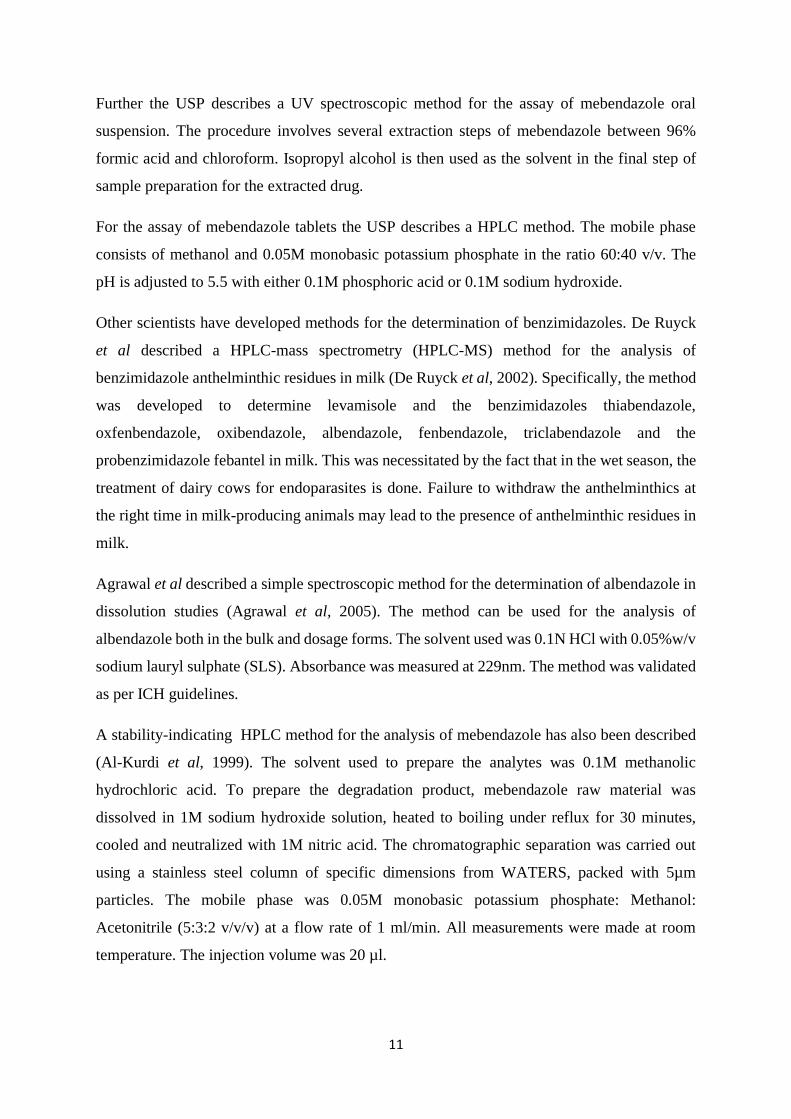
Figure 3.3: Linearity and range plot for albendazole at 233 nm
y = 0.0918x + 0.0454R² = 0.9964
0.000
0.500
1.000
1.500
2.000
2.500
0.000 5.000 10.000 15.000 20.000 25.000
Ab
sorb
ance
Concentration (μg/ml)

23
Figure 3.4: Linearity and range plot for mebendazole at 233 nm
The range studied was between 4 and 20 μl/ml (33.3 to166.7% of the working concentration).
This was well beyond the 80 to 120% range recommended by ICH. Both APIs showed good
linearity with a coefficient of determination, R2, of 0.9964 and 0.9993 for albendazole and
mebendazole respectively.
This wavelength also showed good precision with a coefficient of variation (CV) of 0.108 and
0.137% for albendazole and mebendazole respectively
At this point, it was decided to apply the method in the analysis of 10 commercial products to
test for matrix interferences. Since spectroscopic methods are not separatory, it may be possible
for matrix interference to occur from excipients, related substances and degradation products
with chromophores that absorb at the analytical wavelength. Matrix interference has been
known to lead analysts to result to derivative UV spectroscopy (Rojas and Ojeda, 2009; Wang
and Asgharnejad, 2000). This requires highly skilled analysts. The equipment is also more
expensive hence adding to the cost of analysis. It was not possible to establish with certainty
all the excipients used by various manufacturers. Considering that some products were white
while some were coloured, it was suspected that different manufacturers use different
excipients in their products. The results of these analyses are as shown in Table 3.1.
y = 0.1055x - 0.0362R² = 0.9993
0.000
0.500
1.000
1.500
2.000
2.500
0.000 5.000 10.000 15.000 20.000 25.000
Ab
sorb
ance
Concentration (μg/ml)

24
Table 3.1: Results of analyses of commercial products at 233 nm
Product API Dosage Form Batch Average (%) Comment*
A001T Albendazole Tablets 1 102.6 Complies
A001S Albendazole Suspension 1 130.3 Does not comply
A002S Albendazole Suspension 1 105.7 Complies
A003S Albendazole Suspension 1 99.9 Complies
A004S Albendazole Suspension 1 101.2 Complies
M001T Mebendazole Tablets 1 106.7 Complies
M001S Mebendazole Suspension 2 116.0 Does not comply
M002T Mebendazole Suspension 1 103.1 Complies
M002S Mebendazole Suspension 1 118.1 Does not Comply
*USP 2018 specification for content (not less than 90.0% and not more than 110.0% of the label claim).
These results indicate that some products (A001S, M001S and M002S) had overages of the
respective APIs by USP standards. Based on this it was decided to repeat the analysis at a
different wavelength. After overlaying the spectra for a second time, 294 nm was selected as a
suitable wavelength. A repeat analysis of products A001S and M001S whose content fell out
of the range specified by the USP at 233 nm was performed at 294 nm. The results of the
analysis of product A001S fell within the range specified by the USP while the results of
product M001S were still out of range. This further suggested the possibility of interference at
233 nm for product A001S. An orthogonal HPLC analysis performed later (see sections 2.3.5
and 3.2.4) agreed with the results of analysis at 294 nm. This wavelength was therefore adopted
for further development of the analytical method.
3.1.3 Choice of working concentration
Based on the work of Agrawal et al, a working concentration of 12 μg/ml was settled on. This
concentration fell within the linear range for both APIs.
3.2 Method Validation
3.2.1 Linearity and Range
Figures 3.5 and 3.6 indicate the results obtained.

25
Figure 3.5: Plot of absorbance against concentration for albendazole at 294 nm
Figure 3.6: Plot of absorbance against concentration for mebendazole at 294 nm
Both APIs exhibited good linearity with a coefficient of determination, R2, of 0.9989 as shown
in the respective figures.
y = 0.0482x - 0.0008R² = 0.9989
0.000
0.500
1.000
1.500
2.000
2.500
0.000 5.000 10.000 15.000 20.000 25.000 30.000 35.000 40.000 45.000
Ab
sorb
ance
Concentration (μg/ml)
y = 0.0339x - 0.0101R² = 0.9989
0
0.2
0.4
0.6
0.8
1
1.2
1.4
1.6
0 5 10 15 20 25 30 35 40 45
Ab
sorb
ance
Concentration (μg/ml)

26
3.2.2 Precision
3.2.2.1 Repeatability
Table 3.2 presents the results of the repeatability studies
Table 3.2: Repeatability studies for the developed method
API SD RSD CV (%)
Albendazole 0.000447 0.001084 0.184
Mebendazole 0.00379 0.00579 0.579
Since the CV should be less than 2%, the results indicated that the developed method exhibited
good repeatability as the data for both APIs was within the acceptable range.
3.2.2.2 Intermediate precision
The results of intermediate precision studies are presented in table 3.3
Table 3.3: Intermediate precision studies for the developed method
API SD RSD CV (%)
Albendazole 0.001 0.00230 0.230
Mebendazole 0.001 0.00162 0.162
The ICH recommends that the CV should be less than 2%. The results obtained were within
the ICH limits showing that the developed methods exhibited good intermediate precision.
3.2.3 Accuracy
As explained in section 2.3.4, the amounts of drug product and standard in the tables below
were dissolved in 50 ml of 0.1M methanolic HCl. Aliquots of 0.3 ml of this stock solution
were diluted to 25 ml to make the working solutions. Absorbance of this working solution
was measured at 294 nm.
The data for the determination of accuracy is presented in the Tables 3.4, 3.5, 3.6, 3.7, 3.8
and 3.9.
Albendazole
Table 3.4: Recovery of albendazole at 80% of working concentration
Sample Drug Product (g) Standard (g) Absorbance
1 0.0862 0.0177 0.471
2 0.0860 0.0178 0.487
3 0.0854 0.0203 0.506

27
Table 3.5: Recovery of albendazole at100% of the working concentration
Sample Drug Product (g) Standard (g) Absorbance
1 0.1086 0.0174 0.542
2 0.1068 0.0173 0.528
3 0.1077 0.0173 0.553
Table 3.6: Recovery of albendazole at 120% of the working concentration
Sample Drug Product (g) Standard (g) Absorbance
1 0.1283 0.0180 0.640
2 0.1278 0.0179 0.634
3 0.1285 0.0170 0.642
Mebendazole
Table 3.7: Recovery at mebendazole 80% of the working concentration
Sample Drug Product (g) Standard (g) Absorbance
1 0.0611 0.0167 0.714
2 0.0606 0.0183 0.727
3 0.0626 0.0193 0.725
Table 3.8: Recovery of mebendazole at 100% of the working concentration
Sample Drug Product (g) Standard (g) Absorbance
1 0.0756 0.0172 0.818
2 0.0765 0.0209 0.839
3 0.0760 0.0167 0.823
Table 3.9: Recovery of mebendazole at 120% of the working concentration
Sample Drug Product (g) Standard (g) Absorbance
1 0.0910 0.0172 0.901
2 0.0910 0.0169 0.874
3 0.0913 0.0176 0.948
The accuracy of the method through recovery of analyte is summarised in Tables 3.10 and
3.11 for albendazole and mebendazole respectively.
Table 3.10: Recovery of albendazole at 80, 100 and 120% of the working concentration
Recovery Level (%) 80 100 120
Recovery (%) 104.3 100.0 102.3
The average recovery for the three levels was found to be 102.3%.

28
Table 3.11: Recovery of mebendazole at 80, 100 and 120% of the working concentration
Recovery Level (%) 80 100 120
Recovery (%) 106.6 104.6 101.5
The average recovery for the three levels was found to be 104.2%.
The accuracy of an analytical procedure reflects the closeness of agreement between the value
that is accepted as the conventional true value and the value found. The Food and Drug
Administration (FDA) of the United States of America (USA) requires that the recovery should
be 100 ± 2% at each concentration over the range of 80% to 120% of the working concentration
(Shabir, 2003).
Though the results (102.3% and 104.2% recovery for albendazole and mebendazole
respectively) were slightly above the upper limit at some concentrations for both APIs,
developed method was therefore found to acceptable accuracy.
3.2.4 Orthogonal HPLC assay: Results
Label claim: each 5 ml contains 100mg albendazole
Density of suspension: 1.0201 g/ml
Two solutions of the working standard were prepared. Using each of these standard solutions,
chromatograms of each of three test solutions were run. The percentage of the label claim of
each test solution was then calculated independently using these chromatograms and the
average determined.
The chromatograms from the assay are presented in the Appendix. The results of the assay are
presented in table 3.12
Table 3.12: Results of the orthogonal HPLC analysis
Standard Test replicates Assay (%)
1 1 109.7
2 108.6
3 109.0
2 1 104.7
2 103.7
3 104.1

29
The overall percentage of the label claim for both standards and all injections is 106.6%. This
compares well with result obtained by the developed method – 107.3%. This further confirms
the accuracy of the developed method.
3.2.3 Specificity
For the developed method, the results of the recovery studies indicate that the method is capable
of discriminating the analyte in the presence of the components likely to be present in the
commercial products including excipients, related substances and products of degradation. The
method was therefore found to be specific for albendazole and mebendazole.
3.3 Analysis of commercial products
3.3.1 Samples analysed
Nine albendazole and two mebendazole brands were found in stock during the period of the
study. Five of the albendazole brands were available in both tablet and suspension dosage
forms. Two were available as tablets only while two were available as suspensions only. Both
mebendazole brands were available in both tablet and suspension dosage forms. For the
purpose of this study, the analysed brands were coded to ensure confidentiality in report
writing.
3.3.2 Assay results
The results of the assays are summarized in Tables 3.13 and 3.14. Out of 32 samples analysed,
five samples (15.6%) did not comply with compendial specifications. From the information
gathered in the field, albendazole is the more popular anthelminthic compared to mebendazole.
This is because it is administered as a single dose and several low-cost generic brands are
available. It is therefore of great concern when a low-cost generic brand fails to conform to
compendial specification since these drugs are more affordable and therefore mostly used by a
greater percentage of the population. It came as a surprise that the suspension of the innovator
product of mebendazole had an overage of the API hence did not conform to compendial
specification. This is because the innovator product is usually used as the gold standard when
studying the pharmaceutical equivalence of generic products. Also, inter-batch variation was
observed with product A002T, a tablet dosage form of albendazole which is a popular
anthelminthic. One batch of the product had an overage of the API hence did not comply with
compendial specifications.

30
The percentage of the label claim for all the products was calculated as shown below for sample
one of batch one of product A001S.
Label claim: Each 5 ml of the suspension contains albendazole BP 100 mg
Density of the suspension = 1.0212 g/ml
Equation of the calibration curve:
A = 0.0339c – 0.0101 where
A = absorbance and
c = concentration
The weights of the triplicate samples were 2.5579 g, 2.5635 g and 2.5468 g
The absorbances of the triplicate samples were 0.425, 0.410 and 0.446 respectively.
Using sample one:
0.425 = 0.0339c – 0.0101
0.425 + 0.0101 = 0.4351 = 0.0339c
c = 0.4351/0.0339 = 12.8348 µg/ml
This means that 25 ml of the working solution contains
25 × 12.8348 = 320.87 µg = 0.32087 mg
Since the working solution was prepared from 0.3 ml of the stock solution, this translates to
50/0.3 × 0.32087 = 53.4783 mg albendazole in the weighed sample
From the density, the volume of the sample = 2.5579/1.0212 = 2.5048 ml
From the assay, 2.5048 ml of the product contains 53.4783 mg albendazole
Therefore 5 ml of the product contains (5/2.5048) × 53.4783 = 106.7516 mg albendazole
Percentage of the label claim = 106.7516/100 × 100 = 106.8%
Similarly, the percentage of the label claim of samples two and three were 102.8% and 112.4%
respectively.
The average percentage of the label claim for batch one was therefore
(106.8 + 102.8 + 112.4)/3 = 107.3%

31
Table 3.13: Results of analyses of commercial products for albendazole
Product code Dosage form Batch Assay (%) Comment*
A001S Suspension 1
2
3
107.3
108.4
107.3
Complies
Complies
Complies
A001T Tablets 1
2
3
96.6
98.6
100.1
Complies
Complies
Complies
A002S Suspension 1
2
104.1
105.0
Complies
Complies
A002T Tablets 1
2
3
98.3
145.4
96.9
Complies
Does not comply
Complies
A003S Suspension 1
2
3
98.0
97.1
96.2
Complies
Complies
Complies
A003T Tablets 1
2
96.8
99.6
Complies
Complies
A004S Suspension 1 100.2 Complies
A004T Tablets 1
2
97.2
95.9
Complies
Complies
A005S Suspension 1 87.2 Does not comply
A005T Tablets 1 103.3 Complies
A006T Tablets 1 93.3 Complies
A007S Suspension 1 109.0 Complies
A008T Tablets 1 100.3 Complies
A009S Suspension 1 7.9 Does not comply *USP 2018 specification for content (not less than 90.0% and not more than 110.0% of the label claim).
Table 3.14: Results of analyses of commercial products for mebendazole
Product code Dosage form Batch Assay (%) Comment*
M001S Suspension 1
2
112.9
111.5
Does not comply
Does not comply
M001T Tablets 1
2
102.5
105.7
Complies
Complies
M002S Suspension 1
2
103.4
100.0
Complies
Complies
M002T Tablets 1 99.6 Complies *USP 2018 Specification for content (not less than 90.0% and not more than 110.0% of the label claim).

32
CHAPTER FOUR: GENERAL DISCUSSION, CONCLUSION AND RECOMMENDATIONS
4.1 Conclusion
A UV spectroscopic method for the analysis of benzimidazole anthelminthics albendazole and
mebendazole was developed. The suitable solvent for the analysis was found to be 0.1M
methanolic hydrochloric acid. A wavelength of 294 nm was found to be suitable with negligible
matrix interferences by excipients and other substances that may be present in commercial
products like related substances and degradation products. Over a range of 33.3 to 333.3% of
the working concentration, the developed method was found to exhibit good linearity for both
APIs.
The development and validation of a spectroscopic method for the analysis of benzimidazole
anthelminthics available in the Kenyan market provides an alternative method for their
analysis. The developed method uses a readily available and cost-effective solvent – HPLC
grade methanol. Sample preparation is a simple process. The use of a single wavelength of
analysis means that the UV spectrophotometer can be set up by a skilled analyst while the
actual measurements are carried out by a less skilled analyst.
The validation of the developed method confirms that the method is linear, precise, sensitive
and accurate. Compared to HPLC the method is simple, cost effective, faster and requires less
skilled personnel. Whereas it took a whole day to analyse one sample using HPLC, up to four
samples could be analysed in one day with the developed method. This is because compared
to HPLC, the developed method has a shorter turn-around-time. This proves especially useful
when a large number of samples is to be analysed within a limited period of time. The results
of the HPLC analysis of A001S batch 3, an albendazole suspension, showed good agreement
with the results obtained using the developed method.
4.2 Major findings
Analysis of commercial products revealed the presence of benzimidazole anthelminthic
products that do not conform to compendial specifications for assay. This emphasizes the need
for a fast, reliable, versatile and cost-effective method of analysis of these products after
marketing authorization has been granted.
33
4.3 Recommendations
The developed method can be applied in the analysis of benzimidazole anthelminthics
countrywide and the results compared with those obtained in Nairobi. Bearing in mind that
only repeatability and intermediate precision were determined, the method can be adapted by
different laboratories to allow for the determination of its reproducibility. Because of its
versatility, the method can be adopted routinely by policy makers and implementers. The
success of this study should also stimulate research into the possibility of using UV
spectrophotometry in the analysis of other anthelminthics that have chromophores in their
structures.
References
Agrawal, V., Chaturvedi, S., Amresh, G., 2015. Simple and Precise UV Spectrophotometric
Method Development for Estimation of Albendazole for Dissolution Study.
Al-Kurdi, Z., Al-Jallad, T., Badwan, A., Jaber, A.M.Y., 1999. High performance liquid
chromatography method for determination of methyl-5-benzoyl-2-benzimidazole
carbamate (mebendazole) and its main degradation product in pharmaceutical dosage
forms. Talanta 50, 1089–1097. https://doi.org/10.1016/S0039-9140(99)00212-X
Besier, B., 2007. New anthelmintics for livestock: the time is right. Trends in Parasitology
23, 21–24.
Bethony, J., Brooker, S., Albonico, M., Geiger, S.M., Loukas, A., Diemert, D., Hotez, P.J.,
2006. Soil-transmitted helminth infections: ascariasis, trichuriasis, and hookworm.
The Lancet 367, 1521–1532. https://doi.org/10.1016/S0140-6736(06)68653-4
Campbell, W.C., Fisher, M.H., Stapley, E.O., Albers-Schonberg, G., Jacob, T.A., 1983.
Ivermectin: a potent new antiparasitic agent. Science 221, 823–828.
Cioli, D., Pica-Mattoccia, L., Archer, S., 1995. Antischistosomal drugs: past, present… and
future? Pharmacology & therapeutics 68, 35–85.
Crompton, D.W.T., 1999. How Much Human Helminthiasis Is There in the World? The
Journal of Parasitology 85, 397. https://doi.org/10.2307/3285768
De Ruyck, H., Daeseleire, E., De Ridder, H., Van Renterghem, R., 2002. Development and
validation of a liquid chromatographic–electrospray tandem mass spectrometric
multiresidue method for anthelmintics in milk. Journal of Chromatography A, 7th
International Symposium on Hyphenated Techniques in Chromatography and

34
Hyphenated Chromatographic Analyzers 976, 181–194.
https://doi.org/10.1016/S0021-9673(02)00936-6
Epe, C., Kaminsky, R., 2013. New advancement in anthelmintic drugs in veterinary
medicine. Trends in parasitology 29, 129–134.
Fenwick, A., 2012. The global burden of neglected tropical diseases. Public Health 126, 233–
236. https://doi.org/10.1016/j.puhe.2011.11.015
Fink, D.W., 1988. Ivermectin, in: Analytical Profiles of Drug Substances. Elsevier, pp. 155–
184.
Harder, A., Holden–Dye, L., Walker, R., Wunderlich, F., 2005. Mechanisms of action of
emodepside. Parasitology research 97, S1–S10.
Hawking, F., 1979. Diethylcarbamazine and new compounds for the treatment of filariasis,
in: Advances in Pharmacology. Elsevier, pp. 129–194.
Holden-Dye, L., Walker, R.J., 2007. Anthelmintic drugs. WormBook 2, 1–13.
Hotez, P.J., Brindley, P.J., Bethony, J.M., King, C.H., Pearce, E.J., Jacobson, J., 2008.
Helminth infections: the great neglected tropical diseases. J Clin Invest 118, 1311–
1321. https://doi.org/10.1172/JCI34261
Keiser, J., Utzinger, J., 2008. Efficacy of Current Drugs Against Soil-Transmitted Helminth
Infections: Systematic Review and Meta-analysis. JAMA 299, 1937–1948.
https://doi.org/10.1001/jama.299.16.1937
Lacey, E., 1990. Mode of action of benzimidazoles. Parasitology Today 6, 112–115.
https://doi.org/10.1016/0169-4758(90)90227-U
Lacey, E., 1988. The role of the cytoskeletal protein, tubulin, in the mode of action and
mechanism of drug resistance to benzimidazoles. International journal for
parasitology 18, 885–936.
Lambertucci, J.R., Modha, J., Doenhoff, M., 1989. Schistosoma mansoni: the therapeutic
efficacy of oxamniquine is enhanced by immune serum. Transactions of the Royal
Society of Tropical Medicine and Hygiene 83, 362–363.
Lanusse, C.E., Nare, B., Gascon, L.H., Prichard, R.K., 1992. Bioconversion of netobimin
pro-drug by gastrointestinal fluids of ruminants. European journal of drug metabolism
and pharmacokinetics 17, 121–128.
Martin, R., Robertson, A., Bjorn, H., 1997. Target sites of anthelmintics.
McKellar, Q.A., Scott, E.W., 1990. The benzimidazole anthelmintic agents-a review. Journal
of Veterinary Pharmacology and Therapeutics 13, 223–247.
https://doi.org/10.1111/j.1365-2885.1990.tb00773.x

35
Msagati, T.A., Nindi, M.M., 2001. Determination of benzimidazole anthelmintic compounds
by supported liquid membrane extraction and liquid chromatography. Journal of
separation science 24, 606–614.
Nikolay, B., Mwandawiro, C.S., Kihara, J.H., Okoyo, C., Cano, J., Mwanje, M.T., Sultani,
H., Alusala, D., Turner, H.C., Teti, C., Garn, J., Freeman, M.C., Allen, E., Anderson,
R.M., Pullan, R.L., Njenga, S.M., Brooker, S.J., 2015. Understanding Heterogeneity
in the Impact of National Neglected Tropical Disease Control Programmes: Evidence
from School-Based Deworming in Kenya. PLOS Neglected Tropical Diseases 9,
e0004108. https://doi.org/10.1371/journal.pntd.0004108
Nogales, E., 2000. Structural insights into microtubule function. Annual review of
biochemistry 69, 277–302.
Office on Drugs and Crime, 2009. Guidance for the validation of analytical methodology and
calibration of equipment used for testing of illicit drugs in seized materials and
biological specimens a commitment to quality and continuous improvement. United
Nations, New York.
Otinga, R., 2018. President Uhuru Kenyatta’s Big Four agenda [WWW Document].
Tuko.co.ke - Kenya news. URL https://www.tuko.co.ke/266801-president-uhuru-
kenyattas-big-four-agenda-real-deal-why.html?probtn_random=tvdxbpa3lc00
(accessed 11.22.18).
Oyewole, F., Ariyo, F., Sanyaolu, A., Oyibo, W.A., Faweya, T., Monye, P., Ukpong, M.,
Okoro, C., 2002. Intestinal helminthiasis and their control with albendazole among
primary school children in riverine communities of Ondo State, Nigeria. Southeast
Asian journal of tropical medicine and public health 33, 214–217.
Qian, M.-B., Zhou, X.-N., 2016. Global burden on neglected tropical diseases. The Lancet
Infectious Diseases 16, 1113–1114.
Rojas, F.S., Ojeda, C.B., 2009. Recent development in derivative ultraviolet/visible
absorption spectrophotometry: 2004–2008: A review. Analytica chimica acta 635,
22–44.
Sachs, J.D., 2012. From millennium development goals to sustainable development goals.
The Lancet 379, 2206–2211.
Santaladchaiyakit, Y., Srijaranai, S., 2013. Preconcentration and simultaneous analysis of
benzimidazole anthelmintics in milk samples by ultrasound-assisted surfactant-
enhanced emulsification microextraction and high-performance liquid
chromatography. Food analytical methods 6, 1551–1560.

36
Shabir, G.A., 2003. Validation of high-performance liquid chromatography methods for
pharmaceutical analysis: Understanding the differences and similarities between
validation requirements of the US Food and Drug Administration, the US
Pharmacopeia and the International Conference on Harmonization. Journal of
chromatography A 987, 57–66.
Tindall, G.W., Dolan, J.W., 2002. Mobile-phase buffers, part I-the interpretation of pH in
partially aqueous mobile phases. LCGC North America 20, 1028–1032.
Wang, L., Asgharnejad, M., 2000. Second-derivative UV spectrometric determination of
simvastatin in its tablet dosage form. Journal of pharmaceutical and biomedical
analysis 21, 1243–1248.
Wang, X., Zhang, L., Luo, R., Wang, G., Chen, Y., Medina, A., Eggleston, K., Rozelle, S.,
Smith, D.S., 2012. Soil-transmitted helminth infections and correlated risk factors in
preschool and school-aged children in rural southwest China. PLoS One 7, e45939.
WHO, WHO, W.H., 2010. Working to Overcome the Global Impact of Neglected Tropical
Diseases: First WHO Report on Neglected Tropical Diseases. World Health
Organization.
Wolday, D., Mayaan, S., Mariam, Z.G., Berhe, N., Seboxa, T., Britton, S., Galai, N., Landay,
A., Bentwich, Z., 2002. Treatment of Intestinal Worms Is Associated With Decreased
HIV Plasma Viral Load: JAIDS Journal of Acquired Immune Deficiency Syndromes
31, 56–62. https://doi.org/10.1097/00126334-200209010-00008
Wolstenholme, A.J., Rogers, A.T., 2005. Glutamate-gated chloride channels and the mode of
action of the avermectin/milbemycin anthelmintics. Parasitology 131, S85–S95.
Zrnčić, M., Gros, M., Babić, S., Kaštelan-Macan, M., Barcelo, D., Petrović, M., 2014.
Analysis of anthelmintics in surface water by ultra high performance liquid
chromatography coupled to quadrupole linear ion trap tandem mass spectrometry.
Chemosphere 99, 224–232.

37
APPENDIX: CHROMATOGRAMS OF THE ORTHOGONAL ANALYSIS

38

39

40

41

42

43

44

45

46

47

48

49

50

51