Development and Analysis of the Rice Value Chain for the ...
48
Volume 1 No: 1 (2017) Development and Analysis of the Rice Value Chain for the Hohoe and Jasikan Districts of the Volta Region, Ghana Richard Ampadu-Ameyaw, Rose Omari and George Owusu Essegbey October 2017
Transcript of Development and Analysis of the Rice Value Chain for the ...

Volume 1 No: 1 (2017)
Development and Analysis of the Rice Value Chain for the Hohoe and Jasikan Districts of the Volta
Region, Ghana
Richard Ampadu-Ameyaw, Rose Omari and George Owusu Essegbey
October 2017

Citation Ampadu-Ameyaw, R, Omari R and Owusu Essegbey G, (2017). Development and Analysis of the Rice Value Chain for the Hohoe and Jasikan Districts of the Volta Region, Ghana. FARA research Results Vol 1(1) PP 48.
Corresponding Author Dr. Richard AMPADU-AMEYAW ([email protected] ) FARA encourages fair use of this material. Proper citation is requested
Forum for Agricultural Research in Africa (FARA) 12 Anmeda Street, Roman Ridge PMB CT 173, Accra, Ghana Tel: +233 302 772823 / 302 779421 Fax: +233 302 773676 Email: [email protected] Website: www.faraafrica.org Editorials Dr. Fatunbi A.O ([email protected]); Dr. Abdulrazak Ibrahim ([email protected] ), Dr. Augustin Kouevi([email protected] ) and Mr. Benjamin Abugri([email protected])
ISSN: 2550-3359
.
About FARA The Forum for Agricultural Research in Africa (FARA) is the apex continental organisation responsible for coordinating and advocating for agricultural research-for-development. (AR4D). It serves as the entry point for agricultural research initiatives designed to have a continental reach or a sub-continental reach spanning more than one sub-region. FARA serves as the technical arm of the African Union Commission (AUC) on matters concerning agricultural science, technology and innovation. FARA has provided a continental forum for stakeholders in AR4D to shape the vision and agenda for the sub-sector and to mobilise themselves to respond to key continent-wide development frameworks, notably the Comprehensive Africa Agriculture Development Programme (CAADP). FARA’s vision is; “Reduced poverty in Africa as a result of sustainable broad-based agricultural growth and improved livelihoods, particularly of smallholder and pastoral enterprises” its mission is the “Creation of broad-based improvements in agricultural productivity, competitiveness and markets by strengthening the capacity for agricultural innovation at the continental-level”; its Value Proposition is the “Strengthening Africa’s capacity for innovation and transformation by visioning its strategic direction, integrating its capacities for change and creating an enabling policy environment for implementation”. FARA’s strategic direction is derived from and aligned to the Science Agenda for Agriculture in Africa (S3A), which is in turn designed to support the realization of the CAADP vision.
About FARA Research Result (FRR) FARA Research Report (FRR) is an online organ of the Forum for Agricultural Research in Africa (FARA). It aims to promote access to information generated from research activities, commissioned studies or other intellectual inquiry that are not structured to yield journal articles. The outputs could be preliminary in most cases and in other instances final. The papers are only published after FARA secretariat internal review and adjudgment as suitable for the intellectual community consumption.
Disclaimer “The opinions expressed in this publication are those of the authors. They do not purport to reflect the opinions or views of FARA or its members. The designations employed in this publication and the presentation of material therein do not imply the expression of any opinion whatsoever on the part of FARA concerning the legal status of any country, area or territory or of its authorities, or concerning the delimitation of its frontiers”.

Acknowledgements
This work was carried out within the Program of Accompanying Research for Agricultural Innovation (PARI), the PARI project is coordinated at the global level by the Center for Development Studies (ZEF), University of Bonn in Germany. The PARI project is also coordinated in Africa by the Forum for Agricultural Research in Africa (FARA). The funding for this work is provided by the German Federal Ministry of Economic Cooperation and Development (BMZ). The authors wish to acknowledge the contributions of the different individuals in ZEF and FARA for the reviews of the proposals and the final outputs of the research endeavours. The contributions of Dr. Fatunbi Oluwole and its team in FARA, as well as Dr. Heike Baumüller and her team at ZEF are well acknowledged. The authors further wish to acknowledge the contributions of all the rice value chain actors in the Hohoe and Jasikan Districts, which enabled us to gather quality data for this report. We are also indebted to the Jasikan District Director for Agriculture as well as the Hohoe and Jasikan Districts Extension Officers who played a key role in organizing the rice value chain actors and facilitating the formation and inauguration of the Rice Innovation Platforms in both Districts. We would also like to thank all the facilitators of the participatory workshops that were also used to gather data for this report. They are Mark Kofi Fynn (Value Chain Development Expert), Rev. Mrs. Nyuime Adiepena and Mrs. Rose Gadagoe who are both value addition experts. We also acknowledge the contributions of all the participants at these workshops as that enabled us to get much insight into the constraints and interventions for the rive value chain. They include rice farmers and processors in the two project districts as well as Researchers in CSIR-STEPRI. We are also indebted to Seyram and Enyonam, National Service Personnel who played various roles including data collection, data entry and analysis.

Summary
The Programme of Accompanying Research for Agricultural Innovation (PARI) is supported by the German Government through GIZ and implemented in Africa by the Forum for Agricultural Research in Africa (FARA). The project is aimed at facilitating functionality and efficiency of innovation platforms and innovation research uptake in Ghana and other African countries. This aspect of the project is aimed at improving rice production, processing and marketing in a way that improves the livelihood of the poor. To establish an effective monitoring and evaluation system that would effectively measure progress towards achieving the project objectives and targets, different data collection methods including surveys, focus group discussions and participatory workshops were conducted. Data were collected to have an in-depth understanding of the constraints in the rice value chain and to identify intervention strategies for addressing the constraints through the value chain analysis approach. The study was conducted in the Volta Region because of several factors including promoting pro-poor marketing opportunities for enhancing income, productivity and livelihoods of the resource-poor value chain actors. The objectives of the study were to:
a) provide baseline information that would justify the formation of Innovation Platforms (IPs) in the districts, provide the entry point for the IPs and information against which performance of the IPs could be evaluated;
b) identify and understand the production and postharvest processes including marketing constraints and hindrances in the rice value chain;
c) identify innovation opportunities along the value chain for research and investments to generate socio-economic benefits;
d) conduct a value chain analysis to recognise which activities are the most valuable and which ones could be improved to provide competitive advantage; and
e) provide a basis for comparison among the different rice-growing areas of Ghana as a means for advising policy makers in the provision of incentives and assistance to the actors in different areas.
The rice value chain comprises various actors who perform different functions starting from input supply to rice production, intermediate trading, milling, processing, marketing and distribution, and consumption. The major constraints related to rice production include lack of efficient equipment for land preparation, high cost of land preparation, lack of irrigation facilities, low soil fertility, absence of agro-chemical shops in the communities, difficulty in controlling birds, rodents, and termites, lack of combined harvesters for timely harvesting, and lack of information on consumer preference for various rice varieties. Post-production constraints of the rice value chain include high amounts of broken rice grains due to over-dried paddies occasioned by delayed harvesting; discolouration of rice grains due to excessive rainfall at harvest time; lack of vital components such as destoners by rice millers; lack of graders, cleaners, and important equipment such as sealing/stitching and packaging machines, weighing scales, and hammer mills. Marketing of rice is hampered by the low quality of milled rice, poor labelling and branding. Intervention strategies for enhancing input supply include developing efficient seed multiplication and distribution systems; facilitating linkages among land systems; improving

access to tractor services; and integrating ICT into all the strategies. To enhance rice production, the proposed interventions should include identifying local agro-chemical dealers and linking them to farmers; commissioning research in disease and pest control; building capacity in good agricultural practices; improving access to finance; developing an effective agricultural extension system; developing and improving irrigation facilities; improving on-farm mechanisation facilities; and strengthening farmer-based organisations. The interventions proposed for improving milling and processing include establishing public-private partnership (PPP) arrangements with milling and processing centres; supporting investment in good and efficient milling technologies and equipment with all the vital components such as destoners, graders, sorters, and cleaners; clustering processors and encouraging the use of common processing facilities at demonstration and other centres; providing training and education for farmers on appropriate post-harvest handling of rice; ensuring compliance with national and international standards and best practices; establishing strong producer-processor linkages for easy access to credit; and providing and supporting construction of appropriate storage facilities. For effective marketing and distribution of rice products, the proposals were to develop and improve road networks; provide training in packaging and branding; expand market channels; strengthen processor-buyer-consumer linkages; improve information flow along the value chain; promote local rice using strong selling points such as its health and nutritional properties; and revise government policy to support production and consumption of local rice. Consumer sensitisation and strengthen linkages with catering establishments, institutions involved in institutional feeding such as schools, hospitals, and prisons were proposed to boost consumption of local rice. The research and innovation opportunities identified for development of the rice value chain include:
• a detailed consumer study to understand drivers of consumers’ and traders’ preferences;
• understanding the nature of the disease that causes wilting few weeks after transplanting and identifying interventions;
• innovative ways of controlling birds, rodents, and termites;
• developing new rice products and improving the quality of existing rice products;
• scaling-up the involvement of local artisans in fabricating rice mills and their vital components; and
• developing and implementing an innovative rice marketing strategy
Key Words:
Rice, Value Chain Development, Value Chain Analysis, Ghana, Intervention strategies

Introduction
Imported rice has today become one of the most widely consumed food grains in many African countries including Ghana. The rice crop serves as a major food security strategy or crop in many countries in the developing region of Africa, especially in sub-Saharan Africa. In the past, the production of rice was mostly at the subsistence level to meet the food needs of the family. From a subsistence level of production, rice production has become increasingly, a market crop with much potential for the farming population. In Ghana, rice plays an important role in the food and agriculture sector by providing employment and important livelihood sources for many poor households, although it is mainly cultivated by resource-poor, smallholder farmers (MoFA, 2014). Cultivating rice therefore has become one of the major survival strategies for households living in communities where the crop is cultivated. With interest in the crop reaching international and continental levels, governments are encouraging more households, particularly poor rural people who are either jobless or underemployed to venture into the production and processing of the crop through various initiatives. The Forum for Agricultural Research in Africa (FARA) with support from the German Government through their agency, GIZ, is spearheading the development and production of food commodities in the sub-region through the project, Programme for Accompanying Research in Agricultural Innovations (PARI). Among others, this programme aims at ensuring that priority crops of the country gain such popularity that they will enhance and support poor households in their bid to escape poverty. This is to be achieved through research and development activities by country partners or National Agricultural Research Systems such as the CSIR-STEPRI. In fulfilment of this purpose, this project was set up as part of the activities of FARA through GIZ sponsorship to promote pro-poor market-oriented rice production for improving farm productivity, income, and livelihoods. As a way of monitoring and evaluating the development process in the region in relation to rice development for food security, poverty reduction, and employment creation, this baseline study was carried out by the CSIR-STEPRI as part of the broad objective of research and development activities aimed at promoting the rice sector development in some selected countries including Ghana. The Ghana study aims at using the value chain approach to study the rice sub-sector in the selected districts and to solicit support for small-scale rice value chain actors. The intension here is to improve employment, income and food and nutrition security of the poor rural households in the study area and the Volta Region as a whole. This is also in fulfilment of the objectives of ‘the world without hunger programme’. In pursuit of this overall objective, the authors examined a number of issues in the rice value chain of the selected districts. These included to:
a) provide baseline information that will justify the formation of Innovation Platforms (IPs) in the districts, provide the entry point for the IPs, as well as information against which performance of the IPs could be evaluated;
b) identify and deeply understand the production and postharvest constraints, including marketing constraints and hindrances in the rice value chain;
c) identify innovation opportunities along the value chain for research and investment to generate socio-economic benefits. Assessment of innovation opportunities will cover

technological, institutional, and infrastructural innovations as well as opportunities in marketing, policies, and social interactions among the actors along the rice value chain.
d) conduct value chain analysis so as to recognise which activities are the most valuable (i.e. are the sources of cost or differentiation an advantage?) and which ones could be improved to provide competitive advantage. Smart analysis of gains from adjustment of the interventions of different actors will be assessed and the information will feed into the development of business plans for the PARI project, the innovation platforms, and individuals in the rice value chain
e) provide a basis of comparison among the different rice-growing areas of Ghana as a means of advising policy makers in the provision of incentives and assistance to the actors in different areas.
Context for value chain development The Government of Ghana has shown and lived up to its commitment of spending at least 10 percent of its national budget on agriculture as required in the CAADP framework. However, commitment to poor smallholder farmers (as expressed in the FASDEP II and METASIP) is yet to be clearly seen. The situation so far has been that of a demonstrable dedication to the non-poor smallholder producers in the cocoa sub-sector. Thus, increased spending on agriculture has not prioritised, in relative terms, the poor farmers in the crops and livestock sub-sector (OXFAM 2012). The CAADP goal of reducing inequality and attainment of food self-sufficiency could therefore become a major challenge for Ghana if this trend continues. Unlike the national budgetary distribution, the study found that donor support to agriculture (though difficult to comprehensively track due to multiple pathways of interventions) seems to have targeted the poor smallholder producers. However, the high dependence of Ghana on development aid (about 50 percent of MoFA income envelop) raises issues of sustainability in maintaining and increasing the present level of agricultural investment. Despite Ghana’s budgetary allocation of at least 10 percent of the national budget to the agriculture sector, growth of the sector continues to dwindle. Thus, CAADP’s objective of achieving at least a 4 percent annual growth rate for agricultural output and exports in order to induce a growth rate of 6 percent in the rest of the economy is not being achieved by Ghana. Research is needed to explain why this increasing budgetary allocation is not commensurate with agricultural growth. In summary, the principles of CAADP are as follows:
• Allocation of 10% of national budgets to the agricultural sector • The principle of agriculture-led growth • Implementation principles that assign the roles and responsibilities of programmes • Exploitation of regional complementarities and cooperation • The principles of policy efficiency, dialogue, review, and accountability, shared by all
NEPAD programmes • The principles of partnerships and alliances to include farmers, agribusiness, and civil
society communities • Implementation of all the above should result in a 6 percent average annual sector growth
rate at the national level.

The Malabo declaration commits African governments to: • ending hunger; • enhancing agriculture’s contribution to economic growth and a significant poverty
reduction objective (at least by half). To achieve these, there is a need to (1) establish and/or strengthen inclusive public-private partnerships for at least five priority agricultural commodity value chains with strong linkages to smallholder agriculture; (2) create job opportunities for at least 30 percent of the youth in agricultural value chains; (3) support and facilitate preferential entry and participation for women and youth in gainful and attractive agri-business opportunities.
• tripling intra-African trade in agricultural goods and services; • enhancing resilience of production systems and livelihoods to reduce vulnerability; and • enhancing investment finance in agriculture (both public and private).
Value chain development at Regional Economic Communities (RECs) Regional Agricultural Investment Plans (RAIPs) of RECs also highlight (regional) value chain development. For instance, the 2006 Abuja Food Security Summit highlights strategic commodities such as cassava, sorghum and millet at sub-regional level. The Malabo Declaration calls for boosting intra-regional trade in agricultural goods and services. Value chain development in Ghana In the Food and Agriculture Sector Development Policy (FASDEP II), “A value chain approach to agricultural development will be adopted with value addition and market access given more attention”. “MoFA will partner with the national agriculture research system to ensure that research focuses on the development of value chains of commodities targeted for food security, income growth and diversification, external markets, and linkage with industry”. The priority value chains identified as staples are maize, cassava, rice, yam, and cowpea while cash crops are mango, palm oil, rubber, plantain, citrus + cotton, soy, and sheanut. In the Medium-Term Agriculture Sector Investment Plan (METASIP), the need to “Conduct value chain analysis on viable livelihood opportunities” and to “Develop pilot value chains for one selected commodity in each ecological zone” is clearly stated. Another strategy would be to “Establish links to input and output markets and service providers (strengthen value chain)”. The crops selected for productivity improvement are maize, rice, sorghum, cassava, and yam. Value chain concept World Bank 2010: “Chains composed of companies …that interact to supply goods and services are variously referred to as productive chains, value chains, filières, marketing chains, supply chains, or distribution chains. These concepts vary mainly in their focus on specific products or target markets.” “What they have in common, however, is that they all seek to capture and describe the complex interactions of firms and processes that are needed to create and deliver products to end users.” IDS Study 2010: “There is a simple element at the heart of value chain analysis. The idea of a chain is a metaphor for connectedness. It highlights the simple point that most goods and services are produced by a complex and sequenced set of activities. In many cases, these activities are

split across a number of economic agents (people, enterprises, cooperatives). How these different economic agents interact matters for development. USAID 2010: “Series of actors and activities needed to bring a product from production to the final consumer”. “Value chains are a chain of actors but they operate like a system. … We can’t just focus on production without ensuring that there is sufficient processing capacity to absorb increases or without ensuring that there is market demand and access to markets”. FAO 2007: “we use the term value chain to characterise a system composed by different actors, activities and institutions, all functioning inter-relatedly, so as to enable the accomplishment of a common goal”. Generic definition of value chain
• the sequence of related business activities (functions) from the provision of specific inputs for a particular product to primary production, transformation, marketing, and up to final consumption
• the set of enterprises that performs these functions, i.e., the producers, processors, traders and distributors of a particular product.
Methodology Various techniques were employed in gathering data for this report. These included a review of relevant documents obtained from internet searches and selected libraries, a survey among rice value chain actors using a structured questionnaire, focus group discussions, in-depth interviews, and discussions in participatory workshops. Survey Since there was no list of association members, all members of the rice farmers’ association in the communities were invited and all those present were interviewed with a semi-structured questionnaire. This was done with the assistance of the local extension officers, who helped in differentiating farmers from household individuals. The Rice Farmers’ Associations were made up of various actors in the rice value chain (including farmers, millers, traders, processors, input dealers). Whereas farmers participated in both the survey and focus group discussions, other actors participated only in the focus group discussions because they were fewer. In the interviews, the methodology and objective of the survey was explained to the respondents before its commencement. This was done to ensure that biases were reduced to the barest minimum. The arrangements also helped in ensuring a true representation of gender, age, size of operation and other socio-economic and demographic characteristics in the focus group composition and survey.

Focus Group Discussions and in-depth interviews In the focus group discussions (FGDs), four groups of actors: women rice farmers, men rice farmers, processors (men and women) and millers (men and women) were interviewed. All four group discussions were facilitated and moderated by different resource persons, who were all scientists working on the project. While each of the scientists in each team served as a facilitator, the research assistants were around to record proceedings and activities. The discussions were guided by an interviewed guide consisting of open ended questions that required responses that would complement the survey responses. In answering the questions, the group members led and to some extent dominated the discussion since as insiders they knew better about the general affairs of the farmers. The moderator was responsible for keeping the discussion on track so that the information required was obtained as accurately as possible. Two rounds of FGDs were conducted; the first round was exploratory while the second was conducted to provide missing information and to further probe the information obtained from the first round of FGDs and the enumerator survey. In both Akpafu and Hohoe, four FGDs were held–-one each with women rice farmers, men rice farmers, processors (men and women), and millers (men and women). Female scientists conducted the FGDs for the women farmers and processors who were predominantly women. In the two rounds of FGDs, the first round was mainly used as a means of making preliminary contacts with the actors to introduce the study and to agree on the schedule for conducting the FGDs. The second round of the FGDs was designed to provide information where there were gaps that existed after the first FGDs and the baseline survey were conducted. It was aimed at clarifying information that needed further proving and consensus. Issues covered during the second FGDs included, mainly, cross-cutting issues on differences between genders, resources, opportunities, and constraints. An in-depth interview was conducted with one rice processor who is not a member of any of the groups and a caterer who participated in the school feeding programme in the Hohoe District. In the conduct of the survey, the enumerators included research assistants, extension officers, and some teachers who volunteered to assist with the survey. This strategy was adopted because of language barriers. The extension officers and the local teachers were very conversant with the local language of the people, hence the need for the research team to employ them. Participatory workshops Three workshops were held–-two with rice farmers and processors and the third with researchers (with various backgrounds, including Agricultural Economists, Food Scientists and Technologists, Sociologists, Economists) and policy makers. All the three workshops were aimed at providing an in-depth understanding of the constraints in the rice value chain and finding comprehensive solutions through capacity development. One of the workshops for the rice value chain actors focused on rice value addition with the objective of increasing utilisation of rice in the production of various nutritious and quality products, adding value to broken rice grains to minimise waste and increase income, and diversifying income sources of rice value chain actors. The second workshop for the value chain actors focused on planning, entrepreneurship, marketing, business management, and accounting. The workshop for researchers and policy makers was aimed at deepening understanding of researchers and policy makers on value chain development,

sharpening skills in value chain analysis, and improving skills in identifying appropriate interventions specifically for rice value chain development in Ghana. Through a number of group exercises and discussions at all the three workshops and using an adapted simplified form of ValueLinks1 methodology, data was collected for rice value chain analysis, identification of interventions and strategies for upgrading the value chain, means of facilitating value chain development processes, and implementation strategies. The ValueLinks methodology is summarised in Figure 1.
Figure 2.1; Value Links Methodology
1 ValueLinks is an evolving concept that embraces the generic methodology of value chain promotion. It addresses
value chains as economic, institutional and social systems and can be applied to business opportunities at the bottom
of the pyramid. It is planned to produce sector-specific as well as country-specific versions of ValueLinks that address
specific needs.

Findings
The Agriculture Sector of Ghana The agriculture sector of Ghana spans from the input supply end (e.g. seeds and fertilisers) to the final consumer of products. Over the years, the sector has experienced a strong growth towards commercialisation and contribution to national Gross Domestic Product, which is currently dwindling. Although declining, agriculture has played and still plays an important role in Ghana’s economy. The sector, which dominated the Ghanaian economy for years through its contribution to Gross Domestic Product (GDP), currently contributes less than a quarter of total GDP (ISSER, 2013). As compared to the industry and service sectors, which contributed 7.0 and 10.2 percent respectively to GDP, the agriculture sector recorded a discouraging growth rate of 1.3 percent in 2012 (ibid, 2013). This has been attributed to low productivity growth of the sector, which has been described in several ways by authors as the backbone of the country (ISSER, 2012). In spite of the meagre contribution to GDP, the agriculture sector still has a significant impact on employment, food security and livelihoods of a considerable number of households in the country. Against the backdrop of increasing population and tightened economy, this statistic suggests that increasing food production through area expansion and/or yield of various food crops, especially the staples, must be the way forward. It is only through this approach that the ambitious goals of government for increased agricultural productivity can be met (Breisinger and Diao, 2008). As one of the policies of government to increase productivity of the sector, a programme to supply improved planting materials was initiated and due to the high import bill of rice into the country, the rice crop was particularly targeted. Records show that in 2015 alone, a total of about 100,000 farmers benefited from the programme (ISSER, 2016). In addition, government through the private sector imported tractors, threshers, and power tillers among other machinery and distributed it to some rice farmers in an effort to increase production and productivity of the rice crop. With these and other policy initiatives of rice, it was expected that the gap between domestic production and importation of rice would decrease. Yet the trend seems not to have changed. This gap has been attributed to several variables but the high cost of production seems to be one of the most cited reasons. Statistics indicate that the high cost of producing the crop locally has made it difficult for local production to compete with the imported rice on the markets. This is a source of worry that must be corrected in order not to discourage the local small-scale producers, whose income and livelihoods solely depend on rice cultivation and processing. An overview of the Rice Sector in Ghana Ghana’s rice sector is diverse; the crop is cultivated in at least three ecologies, mainly by smallholders (MoFA, 2014). These ecologies include rainfed upland, rainfed lowlands/inland valleys, and irrigated lowlands. About 75 percent of Ghana’s rice is produced under rainfed condition in the lowland/inland valleys (Bam, 2012) and the ten regions in the country produce some rice. In spite of the potentials in the regions, the Northern, Upper East, and Volta regions are known for high volumes production of rice in Ghana (see Figure 2.2). Presently, the crop

occupies about 11 percent of the total area under cereals, representing about 5 percent of the total arable land area of Ghana (SARI, 2014).
Source: SRID/MOFA 2013 Figure 3.1: Rice-producing regions and their proportion of total production in Ghana
As pointed out earlier, the majority of the rice in the country is imported mainly from Vietnam and Thailand. Other top rice exporters to Ghana include the United States and Pakistan (Develop Economies, 2010). On a scale of 1 to 5, with 1 being the highest quality, rice from South-East Asian countries has a score of 2.4 while Ghanaian rice has a score of about 4.7. The gap in scoring is attributed to the quality of rice from the two sources and explains why consumers prefer imported rice. Research has shown that the perceived poor quality of locally produced rice is a major constraint to its acceptability compared to imported rice, and hence the higher demand for imported rice over locally produced rice (Bam et al., 2013). As a result, Thai and Vietnamese rice is popular in the urban areas, where consumers are less price conscious (even though the difference in price is not big.) In view of the quality gap, Amanor-Boadu (2012) has suggested that policy focus needs to shift from merely expanding rice production in the country to enhancing the quality of domestic rice with an objective of making it competitive on Ghanaian consumers’ preference scale. In Ghana, rice consumption has increased rapidly over the years and is currently estimated at about 45 kg/year/per person. This creates a wide gap between demand and supply and has contributed to the scarcity of the grain and its high price. However, consumption exceeds
BRONG AHAFO
1%
NORTHERN38%
EASTERN 4%
UPPER WEST1%
ASHANTI6%
VOLTA14%
WESTERN5%
CENTRAL 1%
GREATER ACCRA
3%
UPPER EAST27%

production by far and that creates a huge deficit that is offset by large volumes of rice imports into the country. In 2012, the Food and Agriculture Organization reported an annual average production of 145,000 mt of rice whereas the prevailing annual consumption is about 800,000 mt. In order to meet the supply deficit, Ghana imports about 70 percent of its rice consumption requirement from Asia (China, Thailand and Vietnam) and the USA. A combination of increasing urbanisation, consumers’ income and preference of Ghanaians for imported (“perfumed/polished”) rice are driving rice imports to unprecedented high levels (Amikuzuno et al., 2013). In recent years, the government has been working to reduce its agricultural imports by boosting the level of domestic production. The private sector has been seen to be playing key roles in this regard and a number of state-led initiatives aimed at improving production have increased. The Ministry of Food and Agriculture (MoFA) projects a doubling of rice production by 2018 under a programme dubbed the National Rice Development Strategy (NRDS), instituted in 2009. Among other goals, the NRDS seeks to improve land and water management practices and access to government services as well as establish partnerships with the private sector (OBG, 2013). In spite of all these initiatives, Ghana remains a net importer of rice, which is costing the country about $500 million in foreign exchange annually (Bam et al., 2013), although it is the most widely traded agricultural commodity in the county. On average, Ghana is about 33 percent self-sufficient in rice production and was expected to increase to 75 percent by 2015 FAOSTAT (2013). Rice production, area harvested, and consumption in Ghana Given the importance of rice consumption in Ghana in recent years, it is of interest to note its relative significance in overall food crop production and consumption. Domestic rice production in Ghana has been increasing over the years. Rice production has been fluctuating throughout the 1990s and early 2000s. However, between 2007 and 2010, it was observed that production levels shot up at an exponential rate, then fell between 2010 and 2011 and began to rise again. The high levels of production witnessed between 2007 and 2010 could be attributed to increased land area under cultivation in addition to some favourable public policies. The policies include the fertiliser subsidy programme and the creation of a better investment climate through the encouragement of Public Private Partnerships (PPPs). To increase local rice production and consumption, the government of Ghana is undertaking rice upscaling programmes with the goal of achieving a rice production growth rate of 20 percent per annum, to attain self-sufficiency by 2018 and reach a surplus of 13 percent or 111,940 metric tons. Indeed, in May 2008, Ghana was one of the first countries within the Coalition for African Rice Development (CARD) to launch its National Rice Development Strategy (NRDS) for the period 2009-2018. The objectives of the NRDS include increasing domestic production and promoting consumption of local rice through quality improvement by targeting both domestic and sub-regional markets.

Source: Bam et al., 2013
Figure 3.2: Volumes of locally produced, imported, and consumed rice in Ghana
The data from 2004-2011 further exemplify the fact that rice consumption exceeds production, an observation made even in recent times. This trend is threatened to further widen if appropriate mechanisms are not put in place to support local production in order to meet part or all of the deficit (see. FAOSTAT, 2013). Domestic rice production increased by about 97 percent between 2000 and 2010 and fell by 2011. Rice consumption on the other hand increased by 56 percent, leaving a net deficit of 41 percent. The deficit was met by a 22 percent increase in imports. Consumption since 2007 has been rising steadily even when production and imports have been fluctuating. This indicates that the rice sector in Ghana needs more investment to boost production in order to meet the ever-increasing demand by consumers. At present, Ghana depends heavily on imported rice, which accounts for approximately 65 percent of total rice consumption in the country. This growth in imports has grown rapidly over the last decade or so.
0
100000
200000
300000
400000
500000
600000
700000
800000
2000 2001 2002 2003 2004 2005 2006 2007 2008 2009 2010 2011
Mil
led
ric
e (M
T)
Year
Domestic production
Consumption
Imports

16
Actors in the rice value chain The actors in both the Hohoe and Jasikan rice value chain include farmers, input dealers, millers, processors, traders, and caterers. The characteristics of these actors are presented in the next sections. Demographic characteristics of respondents The data from the two districts were combined for purposes of analysis. Table 3.1 shows some selected demographic characteristics of respondents surveyed in the districts during the baseline study. In this study, attempts were made to capture some important socio-demographic factors of the respondents that could have a significant impact on the objectives under discussion as depicted in Table 3.1. In all, 73 farmers responded to the questionnaires. Since there was no list of farmers or value chain actors, the authors were not in any position to tell what percentage of farmers the 73 farmers represented.
Table 3.1. Demographic characteristics of respondents
Variables Category Frequency Percentage
Sex of respondents Male
33 45.2
Female 44 54.8
Age of respondents 26-35
5 6.8
36-45 11 15.1 46+ 57 78.1
Marital Status Single
5 6.8
Married 54 74.0
Divorced 9 12.3 Separated 4 5.5 Widow 1 1.4
level of education None
2 2.7
Basic 27 37.0 High School 36 49.3
Tertiary 8 11.0
Total 49 100.0
Source: Field Survey October 2016

17
For the differences found between genders (in their attitude and way of thinking) the authors first explored the gender characteristics of respondents. In all, about 33 respondents representing 45.2 percent were males. This suggests that the female population in the communities that took part in the study numbered 44 and represented 54.8 percent of the total number of respondents. Traditionally, more males were engaged in farming than females; however, the above result appears to deviate from the norm and identifies a need for assessing how far farming has come to be women friendly. The next variable of interest examined was the age of the respondents. Generally, the results showed a predominance of able-bodied middle-aged farmers in the rice farming business of the Volta Region. The survey results indicated that 57 percent of the respondents were more than 46 years old. This was followed by those within the ages of 36 and 45 years, which constituted about 15.1 percent of the total respondents interviewed. The result showed that 5 people representing 6.8 percent of total respondents in the survey were between 26 and 35 years old. The study further assessed the marital status of the respondent, and it was observed that 74 percent were married. The others included 6.8 percent who were single, 12.3 percent who were divorcees and another 5.5 percent who claimed they had separated from their spouses. Only one person out of the 73 who were interviewed had lost the husband at the time of the interview. The farmer’s level of education is believed to influence their access to best agricultural practice, and therefore their level of profitability ‘all other things being equal’. The results revealed that 49 percent of the respondents or 36 interviewees had completed Senior High School (SHS). Another 37.0 percent had had Basic school education by the time of the interview; only two people had never had any classroom or formal education. Again, it was observed that eight people had had tertiary education and were still farming. The distribution of educational levels of the respondents confirms the reality that in many rural farming communities, majority of the educated are often middle-aged people, most of whom control resources in their communities. In this context, majority of the farmers are educated and this is expected to have greater influence on their innovation abilities, make them more receptive to changes and dynamics of the rice value chain and accept newer technologies that may boost rice production. Experience in Rice Farming The level of rice production activity and skills of producers could be assessed based on the number of years one has spent in farming; this can be determined by years of experience in farming enterprises. This study asked respondents to provide the number of years they had been engaged in rice farming. Table 3.2 indicates the experience of farmers or respondents in both districts in the rice farming business.

18
Table 3.2. Experience of farmers in farming rice
No. of years Frequency Percentage
Less than 2 years 3-5 years 6-7 years More than 8 years
14 10 28 25
18.1 13.0 36.4 32.5
Total 77 100.0
Source: Field Survey October 2016, The data presented show that most of the respondents had been cultivating rice for years. From the data, more than a third of the respondents had been farming rice for 6--7 years. Another 32.5 percent had been cultivating the crop for more than 8 years. The focus group suggested that even those who recorded fewer years in farming had been cultivating rice with their parents or spouses or some other relatives until the time of the survey when they had owned land to farm the crop. Generally, the results indicate that the respondents had enough experience in rice cultivation. This is critical in technology dissemination, adoption, and use because the people already have some skills and are not new to the crop with respect to how it is grown. Description of the rice value chain The rice value chain is composed of various actors who perform different functions. These functions start from input supply to rice production, intermediate trading, milling, processing, marketing and distribution, and consumption. Figure 3.3 depicts the rice value chain map for Jasikan and Hohoe Districts.
Figure 3.3: Rice value chain map
Inpu
Rice
Proc
M
Inter
Who
Input
dealers
Land
owners,
Small-scale
Milers
Traders,
Rice
importers,
Processors
, Medium
scale
farmers
Small scale
individuals &
group Farmers,
Own
consump
Processing &
value addition
Manual
milling-
Pounding
Industrial
Millers
Consum
ers
Traders,
Institutions,
Exporters,
Processors
Feed Market,
Poultry
producers
Animal
feed
production Rice Value Chain

19
Input supply The major inputs required for rice production are land, seed, agrochemicals (fertiliser, weedicides/herbicides, and pesticides). Services required include tractor services for land preparation, labour services for weeding and other tasks, and land hiring. These are discussed in the following sections Farm size and land ownership The size of land allocated to rice farming is critical in this study as it provides the basis for the team to monitor and compare progress or otherwise of the situation in the study area after some time. Table 3.3. Farm size allocated to rice
Farm size (acres) Frequency Percentage
Less than 0.5 0.5 -1.5 1.5 – 2.5 2.5- 5 More than 5.0
5 20 32 16 4
6.5 26.1 41.6 20.7 5.1
Total 77 100.0
Source: Field Survey October 2016, Table 3.3 shows the distribution of farm sizes allocated to rice farming among the respondents. The statistics indicate that majority of the respondents had rice farms that exceeded 0.8 ha. Generally, the data set indicates that smaller numbers of the respondents allocated land sizes smaller than 0.2 ha and bigger than 2 ha to rice. While about 41.6 percent of the respondents allocated 0.5-1.0 ha of their land to rice farming, 20.7 percent allocated 1-2 ha of the land they cultivated or possessed to rice farming. In many cases size of land acquired, particularly among those who rented farm lands, was associated with experience or number of years one had spent cultivating the crop. It is believed that since new entrants into the rice activities usually have less experience and tend to be risk averse relative to experienced farmers, they tend to go in for small pieces of land. As they gain experience over the years, they go in for large parcels. This is not surprising as the distribution of farm size allocated to rice cultivation among the respondents in the district surveyed varied with the number of years farmers had spent in farming rice. The study looked at the form of farm land ownership that prevailed in the districts and revealed that some farmers did not own the land on which they farmed. Nevertheless, other farmers owned the land on which they farmed, but on diverse arrangements as shown in Figure 5. Thirty-four respondents (46.9 percent) owned the land on which they farmed while another 39(51%) did not own the land they cultivated. This indicates that majority of the farmers do not have their own land. Farmers generally use inherited or family-owned land for rice cultivation.

20
Source: Field survey November 2016 Figure 3.4: Ownership of the land cultivated This Figure 3.4 shows that on the basis of ownership of land, majority of respondents own the land they cultivate through inheritance. About 20.4 percent of the respondents rent the land on which they farm, while another 22.4 percent cultivate family land. The data set shows that 10.2 percent of the respondents own the land they cultivate through purchase and another 6.1 have access to land through other forms of arrangements. This confirms the varied forms of land arrangements in the districts surveyed. Motivation to rent out land for farming The study attempted to find out reasons why some farmers rented out land to others. It showed that renting out land to others served as a source of income to some people in the districts of study. This is illustrated in Figure 3.5 below. Figure 3.5 illustrates factors that would motivate respondents to rent out land for farming purposes. It indicates that about 38.8 percent of respondents claimed that they were motivated by the size of their plots while 40.3 claimed that proximity to water sources for irrigation motivated them to rent out portions of or all their land”. It was observed that the need for money also motivated some respondents (17.9 percent) to rent-out plots of land as a way of earning more income. The study pointed out that about 1.5 percent of respondents were motivated to rent out land based on the fact that they tried to avoid plots from remaining fallow.
Percent, Inherited, 40.8
Percent, Purchased, 10.2
Percent, Family property, 22.4
Percent, other, 6.1
Percent, System, 20.4
Ownership of the Land

21
Source: Field Survey November 2016
Figure 3.5. Land rent considerations
Table 3.4. Mode of renting out land in the community
Mode of renting out land in the comm. Frequency Percentage
Fixed annual fee renewable 35 45.5 Nonrenewable over period of time 9 11.7
Share cropping basis 33 42.8
Total 44 100.0
Source: field survey November 2016 From Table 3.4, 45.5 and 42.8 percent rent out their land based on the fixed annual fee renewable and share cropping basis respectively. Another 9 (11.7 percent) claimed their land was given out based on non-renewable terms over periods decided on by both parties. These forms of arrangement also show how diverse land acquisition arrangements in the districts are and how these could influence farm operations, use and profitability and even adoption of technologies. Generally, it becomes obvious that the most frequently used land allocation arrangement in the communities studied is the fixed annual fee which is renewable. In the case of the share cropping
38.8
40.3
17.9
1.5 1.5
Per
cen
tage
Consideration when renting out land
Proximity to Water

22
system, it was observed that sharing of the proceeds could be challenging sometimes. In most cases, it was observed that the farmer takes 1 bag of rice per acre of land (1 acre usually yields 5-8 100-kg bags. Respondents said that during unfavourable seasons, negotiations between the two parties--land owners and tenant farmers--can reduce the proportion of share below the above-stated arrangements. Rice production It has been reported in the literature in many sub-Saharan African countries that many people, particularly rural dwellers, often eke out a living from several sources including farming and hunting as well as marketing of agricultural produce. These diverse ways of making a living are an important strategy for many poor people. This study sought to find out how many farmers or respondents in this survey played diverse roles in the rice sector of the region. Table 3.5 displays roles of the farmers in the rice value chain in the districts studied. In this study, the results show that 19 farmers who participated in the study were land owners. Table 3.5. Roles in the rice value chain
Variables Category Frequency Percent
Land owner Yes 19 26.0
Farmer Yes 67 93.1
Miller Yes 5 5.9
Trader (paddy rice) Yes 14 19.1
Trader (milled Rice) Yes
9
12.4
Tractor operator Yes
1
1.3
Processor Yes 2 4.1
Source: Field Survey October 2016 Fourteen other respondents reported that apart from farming, they sold rice in paddy form in the markets. Majority of the respondents stated that they farmed many crops including the crop of study, rice. In this survey, the results show that only two people were processing rice into other rice products for the market. The study observed that the rest of the roles did not have many participants. This could be an avenue for other youth in the communities to be employed. The results of the study show that while majority, if not all, of the respondents did a bit of farming, only a few were found to be involved in other value chain roles in the districts.

23
Source: Field Survey November 2016
Figure 3.6: Income sources Figure 3.6 represents the primary source of income of respondents. The study indicated that majority of the farmers interviewed grew rice and other food and cash crops as mentioned earlier; therefore, the primary source of their income was farming. It was also observed that the next most important occupation in terms of that which provided respondents with a primary source of income was trading in rice. The analysis of data revealed that about 18.4 percent of the respondents traded in rice, particularly the paddy and that served as the second source of income to the respondents. The other sources of income according to the survey results included renting out of land, rice milling and others that included dependence on farming other food and cash crops such as maize, cassava, and plantain as well as cocoa. As pointed out earlier, petty trading was another form of income sources to some of the respondents; majority of petty traders were women, with their husbands providing support when the women were not available. Others also mentioned credit from the Union in their communities to which they belonged as another source of income. The pie chart in Figure 3.7 depicts the varieties of rice cultivated. The chart shows that 34.7 percent of the farmers at Akpafu cultivated white rice while 28.6 percent cultivated brown rice.
2
75.5
218.4
20
10
20
30
40
50
60
70
80
Land owner Rice Farming Rice milling Trading(paddingrice)
Others
Pe
rce
nta
ge
Primary source of Income

24
Source: Field Survey November 2016
Figure 3.7: Rice varieties cultivated However, Figure 3.7 shows that 34.7 percent of the farmers cultivated both brown and white rice; thus, most of the farmers cultivated both varieties of rice. Among those who cultivated brown rice, it was observed that majority cultivated local types such as “Viwonor”, Damansa, and Tema brown. The latter was insignificant among the brown rice growers in the districts, while demand for local rice Viwonor was very high and most of the farmers were found to be cultivating it. In the case of the white rice, it was observed that most farmers were cultivating Togo Marshal and Jasmine 85 with Togo Marshall being cultivated by majority of the farmers. It has been observed that growing several varieties of rice in a particular area may not always be in the best interest of the farmers as the various agronomic practices that often come with a particular variety may be confusing. Moreover, farmers are continually experimenting with varieties and lack extension advice, factors that compound the already complex challenge facing them. It is recommended that, among others, plant breeders and agronomists find solutions to low yields, disease resistance, lodging under high wind conditions, tolerance to flooded or parched soil conditions, and length of growing season. Tolerance traits for these factors should be incorporated into some varieties that will be introduced to the farmers, rather than giving them a long array of varieties.
Milling Rice milling is a critical stage in the rice value chain. It entails pre-cleaning, removing the husk (dehusking or dehulling), paddy separation, whitening or polishing, separation of white rice, rice
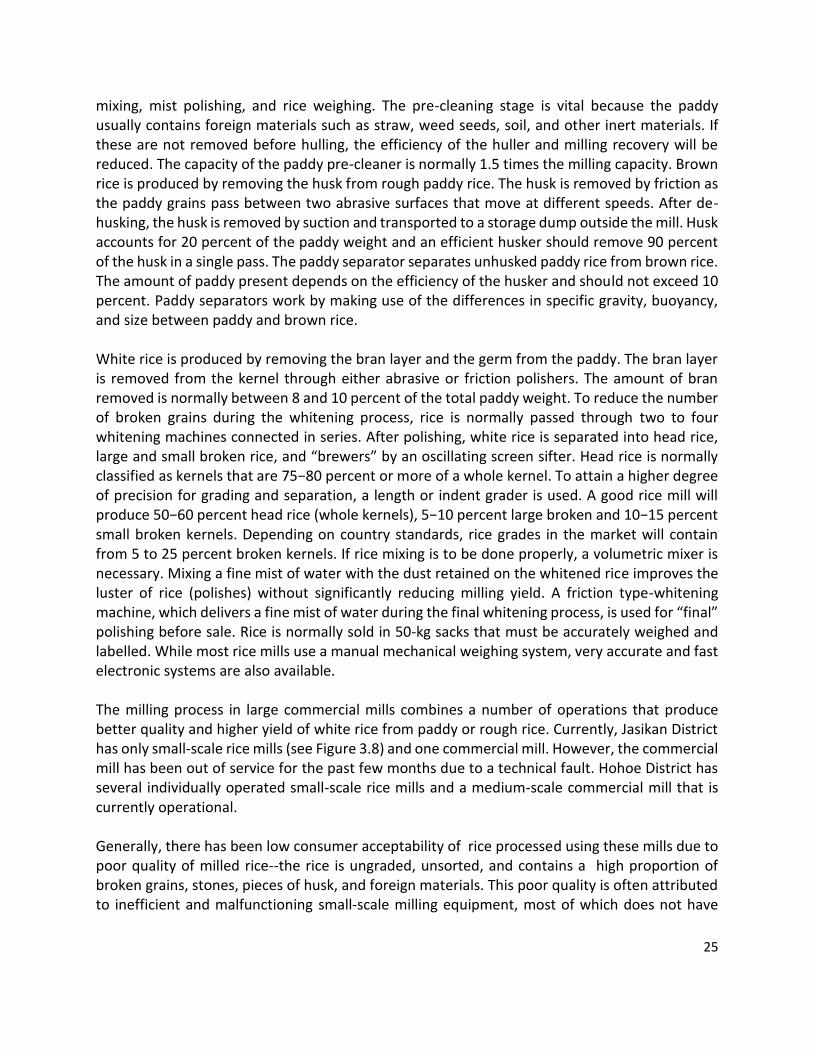
25
mixing, mist polishing, and rice weighing. The pre-cleaning stage is vital because the paddy usually contains foreign materials such as straw, weed seeds, soil, and other inert materials. If these are not removed before hulling, the efficiency of the huller and milling recovery will be reduced. The capacity of the paddy pre-cleaner is normally 1.5 times the milling capacity. Brown rice is produced by removing the husk from rough paddy rice. The husk is removed by friction as the paddy grains pass between two abrasive surfaces that move at different speeds. After de-husking, the husk is removed by suction and transported to a storage dump outside the mill. Husk accounts for 20 percent of the paddy weight and an efficient husker should remove 90 percent of the husk in a single pass. The paddy separator separates unhusked paddy rice from brown rice. The amount of paddy present depends on the efficiency of the husker and should not exceed 10 percent. Paddy separators work by making use of the differences in specific gravity, buoyancy, and size between paddy and brown rice. White rice is produced by removing the bran layer and the germ from the paddy. The bran layer is removed from the kernel through either abrasive or friction polishers. The amount of bran removed is normally between 8 and 10 percent of the total paddy weight. To reduce the number of broken grains during the whitening process, rice is normally passed through two to four whitening machines connected in series. After polishing, white rice is separated into head rice, large and small broken rice, and “brewers” by an oscillating screen sifter. Head rice is normally classified as kernels that are 75−80 percent or more of a whole kernel. To attain a higher degree of precision for grading and separation, a length or indent grader is used. A good rice mill will produce 50−60 percent head rice (whole kernels), 5−10 percent large broken and 10−15 percent small broken kernels. Depending on country standards, rice grades in the market will contain from 5 to 25 percent broken kernels. If rice mixing is to be done properly, a volumetric mixer is necessary. Mixing a fine mist of water with the dust retained on the whitened rice improves the luster of rice (polishes) without significantly reducing milling yield. A friction type-whitening machine, which delivers a fine mist of water during the final whitening process, is used for “final” polishing before sale. Rice is normally sold in 50-kg sacks that must be accurately weighed and labelled. While most rice mills use a manual mechanical weighing system, very accurate and fast electronic systems are also available. The milling process in large commercial mills combines a number of operations that produce better quality and higher yield of white rice from paddy or rough rice. Currently, Jasikan District has only small-scale rice mills (see Figure 3.8) and one commercial mill. However, the commercial mill has been out of service for the past few months due to a technical fault. Hohoe District has several individually operated small-scale rice mills and a medium-scale commercial mill that is currently operational. Generally, there has been low consumer acceptability of rice processed using these mills due to poor quality of milled rice--the rice is ungraded, unsorted, and contains a high proportion of broken grains, stones, pieces of husk, and foreign materials. This poor quality is often attributed to inefficient and malfunctioning small-scale milling equipment, most of which does not have

26
important components such as destoners, whiteners, cleaners, and sorters and graders. The operators often lack the appropriate skills to operate, maintain, and repair the mills.
Processing
Food processing is one of the critical sectors of Ghana’s economy due to its enormous contribution to employment creation, reduction in postharvest losses, foreign exchange earnings, and shelf life extension among others. Food processing ensures constant availability of food in various forms and facilitates product distribution and growth of the national economy. Due to its importance to the growth of Ghana’s economy, agro-processing features prominently in Ghana’s policies such as the Food and Agriculture Sector Development Policy I and II (FASDEP I & II), METASIP, national trade policy, and Growth and Poverty Reduction Strategy (GPRS II). Agro-processing contributes significantly to value addition, which is vital for increasing competitiveness and acceptability of locally produced products both at the domestic and international markets. All over the world more value is being placed on value-added products while the prices of primary and raw commodities continue to decline on the world market. The fall in prices negatively affects the economy of Ghana in terms of foreign exchange earnings and consequently the country’s developmental
activities are slowed down. Food processing in particular is important especially at the micro-level where 95 percent of the actors are women (MOFA 2001). Already, the limited knowledge in post-harvest management results in high post-harvest losses of about 20--30 percent for cereals and legumes (MOFA, 2007). This is further worsened by inefficient agro-processing technologies and inadequate delivery of extension services to women in particular. In Jasikan District, there was no rice processor but in Hohoe District, six processors were found. The processors were all women and they produced various rice products from the milled rice. The products included cereal-legume breakfast mixes, weaning foods, pastries, cookies and cakes. These products are marketed in the district and in other areas including the Greater Accra region. During focus group discussions with the actors, it was revealed that several post production constraints negatively affected marketing, utilisation and consumption of local rice. Hence to help address these challenges, a training workshop was organised for the rice value chain actors to enhance their skill in processing rice into various appealing and marketable products. The overall objectives of the training were to increase utilisation of rice in the production of various
Figure 3.8: Small-scale rice mill

27
nutritious and quality products, add value to broken rice grains, and diversify income sources of rice value chain actors. The specific objectives were to enhance skills in weanimix production (cereal-legume mix) using the recommended Ministry of Health and UNICEF weanimix formula; soybean processing before milling into flour; pastries and baked goods production using rice-wheat composite flour; hygienic food handling, processing and packaging; as well as costing of raw materials and inputs.
Figure 3.9: Processed and packaged rice product Figure 3.10: Training in rice value addition Marketing Marketing is another critical area of the rice value chain globally. Although we may look at this activity as a tail end activity, it is important to give it the necessary attention as it determines in many cases the speed of growth of production of the crop. This study looked at which of the two forms of rice in terms of milled and paddy were mostly marketed by producers.

28
Figure 3.11 shows that about 81.6 percent of respondents claimed they sell their rice mainly in paddy while the remaining 18.4 percent sell their rice in the milled form. This simply means that most of the farmers sell their products in paddy form.
The study assessed the mechanisms employed by the traders to sell their rice. The results showed that while 51 percent of the respondents (Fig 3.12) sold their products to traders, who came from far and near, 18.4 percent sold their rice to wholesalers. Another 10.2 percent claimed they sold their rice directly to retailers. About 8.2 percent employed other methods while processors (4.1 percent) and middlemen (6.1 percent) were rarely employed.
Figure 3.12: Process of selling the rice by farmers

29
Figure 3.13 Determination of the price of rice The pricing system in any business-like agriculture is one of the paramount areas to all value chain stakeholders. This study attempted to explore how prices for the rice produced and processed in the districts are determined. Figure 3.13 shows that about 44.7 percent of farmers indicated that the price of their produce was determined by the farmers themselves. The others indicated that the price of the rice they sold on the market was determined by government and other stakeholders. Since government is no longer operating the control price system, one respondent was skeptical about the view that government determined the price of the farm level produce but the questionnaire did not have a follow up question to probe this further. Furthermore, lack of appropriate storage facilities compels farmers to sell paddy rice immediately after harvest at low prices. Even if the paddy rice is stored in anticipation of higher prices in the future, it gets destroyed by rodents and pests. These challenges coupled with poor marketing strategies for local rice reduces its marketability and farmers’ income. The challenges largely affect women because they are the most involved in rice production, processing, and marketing.
Series1, Farmer, 44.7, 45%
Series1, Gov't, 27.7, 27%
Series1, Wholesaler,
27.7, 28%
Who determines the price of rice
Farmer
Gov't
Wholesaler

30
Institutional of Support To improve the competitiveness of the rice value chain, every actor or stakeholder has an important role to play. These actors and stakeholders have been categorised into micro, meso, and macro as shown in Figure 3.14.
Instutitions available The study explored the institutions available in the communities of study that provided support services as a way of ascertaining which institutions were present and accessible in the
Figure 3.14: Different varieties of milled rice being sold by traders in the open market

31
communities to provide various forms of support to the stakeholders or value chain actors. With this information, the study focused on identifying the institutions (formal and informal) in the communities. Table 3.6. Types of institutions available
Variables Categories Frequency Percentage
Informal lender-individual lenders Yes 23 46.9
Formal Lenders (banks/ financial) Yes 15 30.6
Non-Governmental Organization Yes 10 20.4
Friends and Relatives Yes 11 22.4 Group Base micro-finance Yes 11 22.4 Susu and saving group Yes 20 40.8 Farmer Cooperative Yes 7 14.3
Source: Field Survey 2016
Table 3.6 shows the types of institutions available in the communities and the percentage of respondents who attested to the roles in the districts. About 23(46.9 percent) of the respondents agreed that there was “Informal lender-individual lenders”, another 15(30.6 percent) of them agreed that formal lending institutions like banks were available to support farmers. Also, the result showed the existence of 10(20.4 percent) NGOs that provide financial services. About 11(22.4 percent) of the farmers rely on friends and relatives/families for financial help. Group- Based Micro-finance records showed that 11(22.4 percent) and 20(40.8 percent) of the farmers had received help from Susu and Saving groups in the locality. Interestingly, only 7(14.3 percent) of the respondents received financial help from the Farmers’ Cooperative. This shows the extent to which cooperatives in the country have fallen. Financial services The rural finance systems are among the most important sources of farm financing as they provide farmers and other clients easy access to farm credit. However, the initial survey of the area pointed to the fact that the rural finance systems were not well developed in the rural communities, even though their presence in surrounding urban communities was encouraging. This was not too much of a surprise as in most countries, microcredit tends to develop first in urban areas, where opportunities abound for its use in trade, acquisition of household appliances, and motorbikes, among other uses. During the survey, we realised that opportunities for use of credit was on the increase. We therefore attempted to explore how respondents in the survey area financed their farm and related operations such as processing and marketing of produce.

32
The respondents cited Plan Ghana as one of the institutions that helped farmers and other processors to establish village loan and saving schemes to support production, processing, and marketing of rice in the districts. In the scheme, the beneficiaries pointed out that they contributed to the scheme to enable them borrow money for their operations. It was observed that in the districts, three different groups were established by Plan Ghana; these included Sile (Nenyo), Kudue (Lorlor), and Mawuko. The respondents also mentioned other sources of finance including individual private lenders and personal savings. Interest on loans from the Plan Ghana scheme was 10 percent on every GHS100 a person collected; this is payable within the period of preproduction and marketing. Some of the challenges enumerated by the interviewees included the fact that poor harvest sometimes made it difficult for them to repay loans borrowed. According to the borrowers, this situation often created problems between borrowers and lenders. In spite of these difficulties, some respondents said some of those private individuals who lend money to them were often flexible and understanding. They often allowed them to pay back after the following season’s harvest. Table 3.7. Loan application and reasons for not applying for loan
Applied for loan in the past 12 months Total
Reasons for not applying for loan Yes No
Have enough money 0 2 2
Afraid of losing collateral 0 7 7 Do not have enough collateral/ did not qualify for the loan
2 3 5
Afraid cannot pay back the loan 0 6 6 High interest rate 0 2 2 Not allowed to borrow 1 1 2 Others 0 1 1
Total 3 22 25
Source: Field Survey November 2016 Table 3.7 shows a cross tabulation of loan application in the past 12 months before the study and the reasons for not applying for the loan. The result showed that only 25 farmers responded to both questions. Out of these proportions, 22 farmers did not apply for loans while 3 applied. The reasons for not applying were given by seven farmers as, ”Being afraid of losing collateral in the event of default”. Six other farmers were afraid they might not be able to pay back the loan and so did not apply. Another significant reason was that farmers did not qualify or did not have collateral for the loan. Other reasons like high interest rate, not being allowed to borrow, not having enough money, amomg other reasons accounted for the farmers’ failure to apply for the loan.

33
Farmer groups and organisations It has been observed that working with farmers and stakeholders in a group is better and yields higher dividends than having to follow farmers one after the other or individually. Some authors have pointed out that given the small average size of rice farms across countries in developing countries, and the subsistence and poverty reduction needs of the people who farm the land, group activities should be strengthened. Therefore, the authors had special interest in observing how the groups worked. The study found that most of the groups in the communities were weak and in constant need of training and other types of support be it technical, economic, or institutional. This has prompted the establishment of innovation platforms in the districts studied, for which studies and other trainings will be carried out. Constraints in the rice value chain The constraints identified in the rice value chain have been categorised into two: production and post-production constraints, and are discussed in the following sections. Production Constraints One major challenge that the farmers bitterly complained about is the difficulty they had with land preparation, particularly since machinery was inadequate. Farmers stated that better land preparation equipment, small-scale mechanisation, and improved agronomy were essential for cultivation of rice in the area to improve production. Although irrigation of farms was not a common sight in the area, the famers agreed that improving irrigation systems in the area would enhance cultivation of the crop on a commercial scale. They agreed that increasing production of high-yielding varieties of rice requires well-prepared lands, ready to receive rice seedlings. They cited the use of hands and less efficient tools in preparing land as one of the difficulties they encountered during the peak season. They agreed that while the use of power tillers and other simple equipment could be of enormous benefit to them, these were lacking. They acknowledged that smaller, cheaper, two-wheel tractors (or power tillers) were more likely to be useful in the area, given the situation in rice-growing rural areas. The FGDs revealed that in relation to rice production, farmers faced challenges such as high cost of land preparation, lack of water/irrigation facilities, lack of efficient equipment for land preparation, access to fertile land, absence of agro-chemical shops in the communities, control of birds and rodents, lack of combined harvesters for timely harvesting, lack of information on consumers’ preferred rice choices, and emergence of a disease that affects rice few weeks after transplanting, causing the leaves to wilt. As coping strategies, the farmers set traps for rodents-- feed rodents with fried fish mixed with indocid (medicine). They also spread nets on farms to scare away birds. Post production constraints In relation to post production activities, the challenges that negatively impacted operations included (a) over-dried paddy mainly due to delayed harvesting, which led to high levels of broken rice; (b) too much rain causing discolouration of grains; (c) termites affecting grain quality in fields; (d) drying paddy too close to the ground thus introducing stones; (e) threshing rice on

34
metal tanks/barrels thus introducing metal pieces, which can only be detected and removed by mills with a special magnet. Other challenges are lack of destoners, graders, cleaners in rice mills, sealing/stitching and packaging machine; weighing scales; hammer mill hence the processed rice flour needs to be sieved manually to get smoother and smaller particle sizes; and absence of labels and branding on whole sale packages. Some of the coping strategies are engaging local artisans to dismantle and study the China mill and fabricate some components locally using thicker metal sheets. Through these components, cleaners have been produced, which are currently being used to clean rice seeds before packaging. Other coping strategies are manual grading and sorting, and using broken brown rice in particular for processed products. It was observed that harvesting, threshing, and local transportation of the grains to the mills were difficult tasks that urgently needed to be addressed. Harvesting paddy on small parcels of land using knives, then drying on the farm before milling as is the practice currently is likely to continue. Since the current system is not as efficient as would be expected, the quality of marketable rice is likely to be lower compared to that of imported rice, given that imported rice has an edge over local rice. This in the long run affects the rice value chain actors and may serve as a disincentive to local production and thereby defeat the government’s objective of attempting to raise production levels of local rice. A closely associated aspect of the post-harvest problem is the issue of losses due to milling and poor quality (resulting in broken rice). Milling (husking and polishing), and cleaning of the grain play a major role in rice marketing and therefore any challenge that these processes may face will cause a serious repercussion in the industry’s development. This is more so when at the moment bagging and branding are either not done or are carried out on a smaller scale. The cleaning that follows milling is also not done well because the right equipment for such activities is not available. Cleaning equipment (using screens and blown air) of different sizes and efficiencies is urgently required. Such equipment could be housed at a central cleaning and bagging facility, which could be operated by the innovation platform. Currently some processing (value addition) equipment is kept in the custody of the innovation platform. Another area of critical importance to the growth of the rice sub-sector in the districts and Ghana as a whole is the post-harvest processes and marketing. This is one area in which improvement in the rice value chain can make a giant stride by providing employment and income and thereby reducing poverty and hunger in the long run. In Ghana, grain loss between harvesting and consumption is in the range of 40-60 percent. A drop in this loss through reduction in post-harvest losses, all things being equal, will increase the quality of rice on the market, thereby making rice production and marketing more competitive with respect to imported grain. Accordingly, serious efforts must be made in future work on rice in the districts. Barriers to utilisation of local rice for commercial catering and institutional feeding are (a) low volume of expansion; (b) tendency of traders to mix local rice with cheaper and inferior imported brands; (c) local rice relatively more expensive than imported rice; (d) seasonal availability; and (e) texture of cooked rice deteriorating few hours after cooking. Training needs The training needs of the farmers include alternative uses of rice stalk and husk as in production of mushroom, charcoal, and macaroni; and building material. The needs also include proper

35
methods of land preparation and preparation of organic fertiliser/manure. The post-production training needs include processing rice into pastries and other value added products; hygienic way of roasting soybeans to brown evenly; using moisture detectors to determine the moisture content of paddy rice before milling; educating farmers on the right time to harvest; hygienic and appropriate post-harvest handling practices prior to milling; how to extend shelf life of the milled rice and processed products for instance by controlling pests and rodents; packaging including stitching, sealing, labelling and appropriate packaging material to use; record keeping, accounting and marketing; and maintenance and repair of equipment. A rice mill has several functions that are not being used for lack of knowledge and skill in its operation. Training is required on how to make maximum use of the mill. Table 3.8 shows results from respondents for the trainings needed to improve rice farming. Table 3.8. Some of the major training needs
Source:
Field Survey November 2016 Intervention strategies to improve the rice value chains With all these challenges and opportunities identified, the authors were interested in knowing what the respondents would like to see as interventions to support the promotion and improvement of rice value chain activities in the communities. The import of this was to help the respondents improve the activities by ensuring that a high price, high quality grain, and accessible market that provides opportunities for a more stable income flows are enjoyed in the local economy. Intervention strategies cited by respondents during the survey, focus group discussions and key informant interviewees are discussed in this section. Figure 3.15 shows the interventions cited by the respondents during the survey.
Area of training Yes No Total
Good agricultural techniques in rice production 33 15 48 Product quality improvement 26 22 48 Record keeping 20 28 48 Marketing 22 26 48
Business Management 24 17 41

36
Source: Field Survey November 2016 Figure 3.15: Interventions needed by rice farmers Figure 3.15 displays the needed intervention as proposed by the respondents. From the information gathered from the farmers during the interview, the land on which they farm is not level—it has ant hills and trees. To grow well, rice needs smooth and level land. Because of the tree stumps, tractor services are hard to access. Most tractor operators complain about the stumps, because they damage their machines. Machines and equipment are not available to develop and prepare land for large-scale cultivation; this makes it difficult to get machines to hire for farming. The few that are available in the surrounding villages and towns are inadequate and costly. Moreover, they delay in providing the services requested. The FGDs also emphasised these training needs and interventions, which include provision of combined harvesters for timely rice harvesting; sealing/stitching machines; trailers from transporting rice to storage/sales points; and information on consumers’ preferred rice varieties. The training needs of the farmers include alternative uses of rice stalk and husk as for mushroom production, production of charcoal, macaroni production, and as building material; proper methods of land preparation; and preparation of organic fertiliser/manure. Key interventions required are access to money to buy larger amounts of rice and store them for future sales, expansion of the current storage facility, provision of sealing and stitching machine and hammer mill as well as interventions that will ensure all year-round availability of rice. The post-production training needs include training in: processing rice into pastries and other value added products; hygienic ways of roasting soybeans to brown evenly; using moisture detectors to determine the moisture content of paddy rice before milling; educating farmers on the right time to harvest and hygienic and appropriate post-harvest handling practices prior to milling;
Series1, land preparation, 46.6
Series1, Training, 26.5
Series1, Trainning and financing, 26.5
Intervention

37
how to extend shelf life of the milled rice and processed products by controlling pests and rodents, for example; packaging, including stitching, sealing, labelling, and appropriate packaging material to use; record keeping, accounting and marketing; and maintenance and repair of equipment. The participatory workshops resulted in the identification of intervention strategies for the rice value chain, which are presented in Table 3.9. Intervention strategies for enhancing the supply of inputs include: developing efficient seed multiplication and distribution systems; facilitating linkages between actors and land systems; improving access to tractor services; and integrating ICT into all the strategies. To enhance rice production, the proposed interventions include identifying local agro-chemical dealers and linking them to farmers; commissioning research into controlling pests and diseases; building capacity in good agricultural practices; improving access to finance; developing an effective agricultural extension system; developing and improving irrigation facilities; improving on-farm mechanisation facilities such as combined harvesters; and strengthening farmer-based organisations. The interventions proposed for improving milling and processing include establishing PPP arrangements with milling and processing centres; supporting investment in good and efficient milling technology and equipment (with all the vital components such as de-stoners, graders, sorters, and cleaners); clustering processors and encouraging the use of common processing facilities at demonstration and other centres; providing training and education for farmers on appropriate post-harvest handling of rice; ensuring compliance with national and international standards and best practices; establishing strong producer-processor linkages for easy access to credit; and providing and supporting construction of appropriate storage facilities. Sensitising consumers and strengthening linkages with catering establishments and institutions involved in institutional feeding such as schools, hospitals, prisons were proposed to boost consumption of local rice.

38
Table 3.9. Intervention strategies in the rice value chain
Input supply Rice production Milling and processing Distribution Consumption
• Develop efficient seed multiplication and distribution systems o Strengthen the seed
production unit of MOFA
o Build capacities of local seed growers
• Facilitate linkages between actors and land systems o Establish
favourable land tenure arrangements
o Facilitate advocacy with chiefs and traditional rulers to release land for farming
o Reform current legislation to ensure favourable tenure arrangements
• Improve access to tractor services
• Identify local agro-chemical dealers and link them to farmers
• Commission research into infestation by pests and diseases
• Build capacity in good agricultural practices
• Improve access to finance o Government and
NGOs should facilitate farmers’ linkage to financial institutions and investors
o Encourage formation of self-help groups/village savings and loan scheme
• Establish PPP arrangements with milling and processing centres
• Support investment in good and efficient milling technology and equipment (with all the vital components such as de-stoners, graders, sorters, cleaners)
• Cluster processors and encourage the use of common processing facilities at demonstration and other centres
• Improve packaging of paddy, milled and processed rice
• Provide training and education for farmers on appropriate post-harvest handling of rice
• Develop and improve road network o Negotiate with
relevant government institutions involved in institutional feeding
• Provide training in packaging and branding o Package rice in
affordable retail packs
• Expand market channels o Encourage
exportation of local rice
o Identify niche markets for Ghana’s rice in the diaspora
• Sensitise consumers o Provide information on
nutritional quality o Develop and provide rice
recipes and cooking guidelines
o Organise exhibitions, rice fairs and cooking demonstrations
o Develop an appropriate pricing strategy to attract a wider market
o Provide information on sales outlets
o Generate and provide market information
• Strengthen linkages with catering establishments, institutions involved in institutional feeding such as schools, hospitals, and prisons

39
o Identify tractor owners and link them to farmers
o Facilitate nucleus arrangement by private sector
o MoFA mechanisation centre should play a key role in procuring and selling machinery at discounted prices
• Integrate ICT into all the strategies above
o Improve farmer-trader linkages
o Facilitate the establishment of inventory credits
o Promote PPP arrangements
• Develop an effective agricultural extension system o Encourage
farmer-farmer extension
• Develop and improve irrigation facilities. o Government
and private sector should play a key role.
o Facilitate development of small-scale irrigation facilities by development partners
• Improve on-farm mechanisation
• Ensure compliance with national and international standards and best practices
• Research into the development of various rice products to increase its utilisation
• Establish strong producer-processor linkages for easy access to credit
• Promote quality assurance and reasonable pricing
• Link millers and processors to efficient markets
• Provide and support construction of appropriate storage facilities
• Integrate ICT into the above strategies.
• Strengthen processor-buyer-consumer linkages
• Improve information flow along the value chain o Create
innovation platforms to enhance this information flow
• Promote local rice using strong selling points such as its health and nutritional properties o Employ social
media and social marketing
• Revise government policy to support production and consumption of local rice
• Integrate ICT into the above strategies.

40
facilities e.g. combined harvesters o Facilitate nucleus
arrangement by private sector
o MoFA mechanisation centre should play a key role in procuring and selling machinery at discounted prices
• Strengthen farmer-based organisations
• Integrate ITC into all the above strategies

41
3.9 Opportunities in research and innovation The research and innovation opportunities identified in the production stage of the rice value chain analysis include (1) conduct detailed consumer study to understand drivers of consumer choices; (2) conduct research on the disease that causes wilting few weeks after transplanting and identify interventions; and (3) devise innovative ways of bird and rodent control. Research and innovation opportunities identified in the post-production stage include (1) an opportunity to develop new rice products and improve quality of existing rice products; (2) an opportunity to scale up the involvement of local artisans in fabricating rice mills and its vital components; and (3) development and implementation of an innovative rice marketing strategy.
Conclusion This paper explored the activities of the value chain actors in two selected districts–Jasikan and Hohoe, of the Volta Region. It has emerged that rice, which did not originate in Ghana, has grown from subsistence production to a commercially cultivated crop. It now provides employment, income, and food security for a large number of households in the region and the country at large. The increase in local production of this new cash crop in the country has resulted from the significant amount of low land ecologies present, introduction of new varieties and technologies and techniques of rice production. These have been coupled with increases in demand for local rice consumption and changing patterns of consumption both at the regional and national levels over the years. Unfortunately, rice production has coincided with generally high increases in costs of production, a decrease in the delivery of extension services and support as well as some other challenges. Amidst these constraints in the rice sub-sector whether at the regional or national levels, farmers and other actors have worked tirelessly to commercialise the crop. In Ghana, rice production and processing have mainly been rural agriculture and agri-business activities carried out by small populations of resource-poor, small-scale farmers and groups. Most of them operate through the use of household labour and small, inefficient machinery and other tools. These individuals or groups have often been associated with processing and marketing activities linked to the creation of some economic activities that provide services and support; these services and support enable the development, promotion, and sustainability of rice production, processing, and commercialisation in the country. These activities have led to identification and employment of various groups of actors including producers (farmers), processors (handlers, millers and others) and traders as well as consumers. Contrary to observations in most sub-Saharan Africa, production and processing including marketing of rice in the Volta Region of Ghana have been the work of mostly women, although the men have been known to produce a large quantity of the crop in the region. These activities in the rice value chain in the region provide opportunities for the vulnerable in society to get involved and participate in activities of their choice. This may explain the reason behind the involvement of majority of women in the communities who were found to be participating

42
in the cultivation of the new cash crop. The only activity that was found to be dominated mainly by men was the milling of paddy rice. There was no case of a woman milling rice. This is not to say that rice milling is a no-go area for the women but rather to make a case for women to be trained on how to mill quality rice. The base line study revealed that quality grain production, processing, and marketing are a major challenge among actors. These operations were found to be influenced by certain technical, economic, and institutional factors that research needs to identify and a solution found as a way of improving the sub sector’s activities. The study observed that while rice is cultivated mainly in rural areas, it is consumed mainly in urban areas. This implies a need for effective transportation systems to enable the produce to reach the main consumers in time. This is one way by which the local rice can effectively reach the market and compete with imported rice that seems to have flooded the urban market. The availability of improved technologies and techniques of processing rice within the country should give actors, especially producers, the opportunity to improve production and processing as well as marketing the crop. Unfortunately, this expected improvement was not observed among the small-scale producers and processing operators. This was evident from the state of technology and processing quality of rice in the communities as well as quality of rice packaging on the market. One important inadequacy and limitation observed was the lack of labelling of local rice. Reliance on the current status of activities in the sub-sector, particularly in the region, will hinder technical and institutional change and therefore economic fortunes of the actors. Such reliance can only be avoided if a change in management is deliberately practised based on local adaptation or environment. Skills and attitudes of producers and other actors need to be improved in the context of what they are currently doing and how to improve their stake in the sub-sector. Accordingly, it is suggested that production and processing techniques and skills as well as investment in improved technology creation and adoption should be a priority of the national government and other stakeholders, particularly the private sector. The land challenges and irrigation limitations in the areas of cultivation clearly show that equipment and machinery are some of the necessary supplies required to improve production of quality grains and competitiveness of the commodity chain. A detailed analysis and understanding of the socio-economic, cultural, and institutional context under which the commodity chain operates are required. Recommendations In line with the findings, the following recommendations are made as a way of moving forward the rice production, processing, and marketing in the region.
• Due to the high costs of production resulting from high input costs (in terms of accessibility and affordability) of especially fertilisers and labour, rice activities especially production are low and very challenging for the resource-poor smallholders. It is therefore suggested that government through the District Assemblies and other supporting agencies of the developing partners and non-governmental organisations (both local and international) assist farmers in the best way possible. One of such ways is to link farmer associations with major distributors or input dealers.

43
• The quality and distribution of seeds as well as extension need improvement. It was observed that while production and number of rice farmers increases in the communities, extension services and personnel continue to dwindle. The choice of rice variety to cultivate should not just be left to the farmers but should be based on market survey. Monitoring of farm activities can and should however be entrusted to the extension services through various means such as the innovation platforms.
• It was observed that while irrigation was critical and problematic in the rice-growing communities, the land forms and structure were not ideal for rice cultivation. It is suggested that government and other financial and private sector enterprises including donor groups (local and international) should be seen to be supporting investment in irrigation as well as land management if rice productivity is to be improved.
• The issue of quality standards was found to be critical to improving rice production and quality in the area of study. These improvements can also come from proper use of appropriate machinery. Accordingly, this study recommends that investment in new equipment such as polisher and destoners should be a priority. This is one way by which the country’s rice farmers and processors can effectively compete with foreign producers and processors whose products are flooding the country’s markets.
References Amanor-Boadu, V. (2012): Rice Price Trends in Ghana (2006-2011): A USAID Monitoring, Evaluation and Technical Support Services (METSS) Research and Issue Paper Series No. 02-2012 Amikuzuno, J., Issahaku, G. and Daadi, E.B.(2013): Price Transmission between Imported and Local Rice Markets in a Liberalised Economy: Are Ghana’s Rice Wars Just Much I Do about Nothing? Journal of Economics and Sustainable Development Vol.4, No.20, 2013 Bam, R.K., Acheampong, G.K. and Dankyi, A.A. (2013): The Appraisal and Perspectives of the Technical Systems of Rice Processing in Ghana. A Paper presented at the workshop on rice processing systems in Sub-Saharan Africa, Accra, Ghana. March 13 – 14 , 2013 Breisinger, C. and Diao, X. (2008): Agriculture for development in Ghana: New opportunities and challenges. IFPRI Disucssion Paper, Washington, DC Britwum A., D., Enu-Kwesi, F. and Akorsu, A. (2005): Unilever Ghana Research Report, Centre for Development Studies, (CDS) University of Cape Coast FAOSTAT (2013) Food and Agriculture Organisation Statistics. Accessed from www.faostat,org on 15th March, 2014

44
ISSER (2013): State of the Ghanaian Economy, 2012 ISSER (2016): State of the Ghanaian Economy, 2015 MOFA (2014), Rice Sector Support Project. Accessed from http://mofa.gov.gh/site/?page_id=736 on 26th March, 2014 SARI (2014): Baseline and Value Chain Report on the Rice Sector Development Hub in Navrongo, Upper East Region of Ghana. An Unpublished Technical Report Submitted to the Africa Rice Center, Benin

45
Appendix A: Summary of Findings from FGD
Production Post production
Challenges • Finance
• Land preparation expensive
• lack of water/irrigation facilities
• Lack of efficient equipment for land preparation
• Poor access to land
• Poor access to farm implements (such as cutlass, hoes, boots)
• Absence of agro-chemical shops in the communities
• Bird control
• Rodent control
• Lack of combined harvesters for timely harvesting
• Difficulty in repaying loan from banks
• Climate change is affecting farming so the risk is higher
• Lack of information on rice types preferred by consumers
• AGRA variety provided by MoFA in 2015 was mixed with other varieties so they mature at different times making harvesting difficult. This caused losses to the farmers.
• A disease is affecting the rice few weeks after transplanting and the leaves start wilting
• Over-dried paddy mainly due to delayed harvesting affects grain quality; for example, the percentage of broken rice increases.
• Too much rain also affects rice quality by, for example, discolouring the grains.
• Termites also affect grain quality on field.
• Drying paddy too close to the ground can introduce stones in the rice.
• Threshing rice on metal tanks/barrels introduces metal pieces that can only be detected and removed by mills with a special magnet
• Lack of destoners, graders, cleaners
• lack of sealing/stitching and packaging machine
• Lack of weighing scale
• Lack of hammer mill hence the processed rice flour needs to be sieved manually to get smoother/smaller particle sizes.
• Absence of labels and branding on whole sale packages
• High percentage of broken rice.

46
Caterers
• Low volumes of expansion make rice unsuitable for institutional feeding.
• Mixing local rice with cheaper imported brands
• Relatively higher price
• Not always available
• Texture of cooked rice deteriorates few hours after cooking.
Coping mechanisms • Set traps for rodents or feed rodents with fried fish mixed with indocid (medicine)
• Spread nets on farm to scare away birds
- Engage local artisans to dismantle and study the China mill and fabricate some components locally using thicker metal sheets. Through these, cleaners have been produced, which are currently being used to clean rice seeds before packaging.
- Broken brown rice used for processed products and has helped to reduce waste and diversify income sources.
- Manual grading and sorting
Interventions required
• Combined harvesters for timely rice harvesting
• Sealing/stitching machines
• Trailers from transporting rice to storage/sales points
• Information on consumers preferred rice varieties
• Money to buy larger amounts of rice and store
• Expansion of the current storage facility provided by MoFA
• Sealing and stitching machine
• Hammer mill
• Interventions that will ensure all-year availability of rice

47
Training needs • Alternative uses of rice stalk and husk e.g. for mushroom production, production of charcoal, macaroni production and as building material.
• Proper methods of land preparation
• Preparation of organic fertiliser/manure
• Processing rice into pastries and other value added products
• Hygienic way of roasting soybeans to brown evenly
• Using moisture detectors to determine the moisture content of paddy rice before milling.
• Rice mill has several functions that are not being used for lack of knowledge and skill in its operation. Training is required on how to make maximum use of the mill.
• Educating farmers on the right time to harvest and hygienic and appropriate post-harvest handling practices prior to milling
• How to extend shelf life of the milled rice and processed products e.g. by controlling pests and rodents
• Packaging, including stitching, sealing, labelling, and appropriate packaging material to use
• Record keeping, accounting and marketing
• Maintenance and repair of equipment
Innovation/research opportunity
- Conduct detailed consumer study to understand drivers of consumer choices
- Conduct research on the disease that causes wilting
- Processed rice products are new in Ghana hence there is an opportunity to develop new products

48
few weeks after transplanting and identify interventions
- Devise innovative ways of bird and rodent control
and improve quality of existing products
- Opportunity to scale up the involvement of local artisans in fabricating rice mills and its vital components
- Develop innovative marketing strategy for rice.