DEVELOPING WESTMINSTER’S CITY...
35
ENERGY DEVELOPING WESTMINSTER’S CITY PLAN Booklet No. 14 Westminster City Plan Revision January 2015
Transcript of DEVELOPING WESTMINSTER’S CITY...

ENERGY DEVELOPING WESTMINSTER’S CITY PLAN
Booklet No. 14 Westminster City Plan Revision January 2015

Energy policy raises issues central to the prosperity and well-being of us all. Every day we count on the lights turning on or the computer working when we flick the switch; equally we will all be affected as our City gets warmer. These are not only considerations for the future; concerns which have arisen in recent years over the security and capacity of central London’s energy supply show that they have to be a priority for action now, to ensure Westminster’s continued success and attractiveness as a place for investment. In this booklet the Council sets out its proposed approach to energy issues in taking planning decisions. These include energy efficiency and carbon reduction, building on national policy and the London Plan to reduce future climate change and make our built environment more cost-effective. They are also a result of changes to government rules and regulations. The booklets explains what we intend to do before our new City Plan is formally adopted as well as the new policies themselves, and include the cost of carbon in relation to carbon offsetting. It also deals with encouraging a more proactive approach to planning for the City’s future energy needs. These issues are not just part of a green agenda, but simple good business. Better performing buildings are an increasing priority for occupants as they ensure a degree of protection from rising energy prices and compliance with national energy performance standards that could otherwise limit their commercial life. Less energy intensive development will reduce strains on the power infrastructure, already under stress, risking fewer power outages. We are now inviting your comments on our approach and look forward to working with you to ensure that the new planning policy provides an effective means of tackling the issues around energy.
FOREWORD
CLLR ROBERT DAVIS
Councillor Robert Davis DL Deputy Leader, Westminster City Council Cabinet Member for Built Environment
2

CONTENTS
Trends 1. Policy Context 2. Why is it Important? 3. Future Proofing: a changed climate 4. National and Regional Targets 5. Westminster’s Carbon Emissions 6. Local Energy Security
Insights 1. Design Limitations: Conserving Historic
Integrity 2. Design Limitations: Other 3. Design Insights: Opportunities 4. Insights: Why is the policy needed? 5. What target is proposed? 6. Is this achievable onsite in
Westminster? 7. Arriving at a cost of carbon 8. Calculating the offset payment 9. How will the tariff apply? Recommendations 1. Design 2. Sustainability criteria and assessments 3. Decentralised Energy Networks 4. Renewables
Left and cover: solar photovoltaic pitched roof form, Hanover Square, Westminster City Council (2013)
3

TRENDS POLICY CONTEXT This booklet sets the Council’s proposed approach to energy and carbon through its approach to carbon reduction targets up to the introduction of the national ‘zero carbon’ agenda. It also covers policies relating to renewables, district energy and overheating. Whilst all policies will need to be taken into account, some aspects of this topic are included in the separate booklet dealing with Design, and, in relation to lighting, Planning and Pollution Control. In this booklet, references to the “City Plan” are to the completed local plan which will integrate the Strategic policies (adopted by the Council in November 2013) and City Management policies which will be adopted as a result of the current review process. It is also noted that the City Council is currently preparing a Sustainability Strategy which is clearly interrelated to the policies discussed in this report.
4
Specific policies covered in this booklet include: Strategic policies S28 - Design and S39 - Decentralised Energy Networks and S40 – Renewable Energy And the following proposed City Management policies: CS28.1 - Sustainable Design Assessment CM29.1 - Managing Overheating and Air Conditioning

5
In March 2014 the Government concluded its Housing Standards Review, stating that energy efficiency standards relating to residential buildings will in future be set through the Building Regulations only, and that planning authorities will not be allowed to set local policies. The commitment to delivering ‘zero carbon’ homes from 2016 was reaffirmed at the same time. The Government also announced its intention to “wind down” the Code for Sustainable Homes (CSH). Further details on the transitional arrangements are still to be announced for those buildings currently undergoing assessment under the Code. In the meantime an update has been issued to bring it into line with the recent update to the Building Regulations. The Queen’s speech in June 2014 confirmed that the Zero Carbon Homes standard would be set at the equivalent of CSH level 5, although it would be sufficient for development to achieve CSH level 4, and pay an ‘Allowable Solutions’ offset payment to achieve the standard. Smaller sites (yet to be defined) will be exempted. While these announcements affect Councils wishing to set their own carbon reduction targets for homes and setting requirements based on the Code for Sustainable Homes these announcements currently do not prevent local planning authorities from setting energy or sustainability standards or carbon targets in relation to commercial buildings, and also do not prevent policies requiring a percentage of energy to be generated from renewable sources under the Planning and Energy Act 2008. Until the making of the proposed changes to the Building Regulations and other legislation to implement Government policy, the London Plan’s policies relating to energy and housing, such as its carbon reduction targets set out in Policy 5.2 still form part of the Council’s Development Plan and will be implemented as such, as set out in this booklet.
Housing Standards Review and Queen’s Speech
London Plan and GLA Guidance on Energy Assessments The Mayor of London published an update to his ‘Guidance on Preparing Energy Assessments’ in April 2014, to coincide with the changes to Part L of the Building Regulations – which deal with conservation of fuel and power) which came into effect on 6 April 2014. This confirms that in respect of Policy 5.2 of the London Plan the Mayor will apply a target of 35% beyond the 2013 edition of Part L, which is deemed broadly equivalent to the previous target of 40% beyond the standards in the 2010 version of Part L. In this booklet the targets are expressed relative to Part L 2013.

TRENDS WHY IS IT IMPORTANT? In September 2013 the first of three Intergovernmental Panel on Climate Change Working Groups published its findings towards the IPCC 5th Assessment Report. This calculated for the first time the amount of carbon dioxide that we can continue to emit into the atmosphere without dangerous climate change occurring. Governments around the world have pledged to limit temperature rises to 2˚C above pre-industrial levels.
Extreme Weather and Climate Events Climate scientists agree that by the early part of the 21st century it is likely that there will be: o Warmer and/or fewer cold days and nights over most land areas and more frequent hot days and nights over most land areas. o Heavy precipitation events (very heavy rain, snow, hail etc) with an increase in how often these events occur, the intensity of the downpour, and the amount of precipitation falling during the event. o Increased incidence and/or magnitude of extreme high sea level. By the end of the 21st century the warmer temperatures are virtually certain, with heatwaves very likely. The impacts affecting heavy rainfall and sea level rises are very likely. By the end of the century warmer and more frequent hot days and nights will be very likely. The Met Office issued a report in March 2014 stating that the UK will see an increase in extreme weather events with wetter winters, and hotter, drier summers.
Risks for London Heatwave: London experienced major heatwaves in 2003 and 2006. These are expected to be increasingly likely and more intense as average summers get hotter, and as London grows. In addition, • the Urban Heat Island effect arising from built up areas emitting and retaining heat
amplifies summer night-time temperatures, • homes in London are less insulated than cooler parts of the UK, and therefore
overheat more easily, and • poor air quality is also thought to compound the impact of high temperatures. For these reasons, above 24.7ºC, Londoners seem to be more vulnerable than the rest of the UK, with a higher rate of deaths and ill effects. High temperatures also affect the transport network, electricity supply and water use, and drive up power usage from cooling units, often increasing outside temperatures due to waste heat. Drought: London clay is corrosive and weakens pipes that are then subjected to ground instability as it shrinks during droughts and swells during rainfall. This affects gas supplies directly when pipes are compromised, and electricity supplies when gas or water pipes burst. Flood: Flooding can disrupt energy supplies, impacting on underground supply lines, substations, basement plant rooms and power stations.
The authors were “unequivocal” that climate change is happening as a result of human activity and that limiting climate change “will require substantial and sustained reductions of greenhouse gas emissions”. To hold warming to 2˚C, total emissions cannot exceed 1,000 gigatons of carbon. Yet by 2011, more than half of that total "allowance" – 531 gigatons – had already been emitted. In March 2014 the second Working Group reported. It showed how
climate change is already having an effect, with melting sea ice and thawing permafrost, coral reef dying, heat waves, heavy rainfall and disasters around the globe with worse set to come.
Key findings included: •Crop yields, especially wheat and corn are decreasing, threatening future price spikes and unrest •Potential water and food shortages threaten human security with conflict a possibility.
•Inequalities mean that the poor will suffer most, with inequalities being exacerbated, and making it more difficult for people to climb out of poverty. •There are limits to what can be achieved: emissions should be cut now and measures planned to enable us to adapt to climate change.
6

“The field of Responsible Property Investment (RPI) has gained increasing prominence and acceptance among real estate investors[...] The inclusion of RPI principles into investors’ decision-making processes is driven by several factors. The most prominent drivers [...]are: •A need to better understand the impact of environmental and social issues such as climate change, resource scarcity, and mass urbanisation on macro property trends that could damage or enhance the long-term performance of property assets and businesses. •Gaining a competitive advantage by getting ahead of more stringent regulatory environmental and social requirements. These...have the potential to impact risk/adjusted returns and cost structures by requiring, for instance that buildings are improved or retrofitted to meet a particular environmental performance. •Responding to tenant demands for more environmentally efficient buildings that could contribute to lower tenants’ occupancy costs and environmental impacts. • It is the fiduciary responsibility of property investors to understand the implications of environmental and social issues on the performance of their investments and to seek appropriate risk-adjusted investment returns as well as economic ways to improve the sustainability of the assets they buy and hold.”
Responsible Property Investment: What the Leaders are doing (2nd
edition, 2012) Produced by the Property Working Group of the United Nations Environment Programme Finance Initiative
“91% of [facility management] professionals view corporate reputation as a primary driver for green workplace objectives” “71% cite financial drivers as benefits of pursuing workplace environmental objectives. ”
Low Carbon Workplace Report “Green Ambitions for the Workplace”
“Of late we are witnessing an important transition, the uptake of responsible investment approaches into asset and investment management practices driven by a new
factor, the related investment risks. Indeed a growing number of practitioners are being convinced by a body of analytical research, anecdotal evidence and their in-
house analysis, that points towards risks of depreciation, obsolescence, longer voids, and taxes for
less sustainable and green buildings. ”
Tatiana Bosteels, “Drivers for Responsible Property Investment: time to move from risks to opportunities?” UKGBC (2012)
TRENDS Why is it important? Property Professionals View:
7

NATIONAL AND REGIONAL TARGETS The Climate Change Act 2008 set out legally binding targets for carbon reduction, equating to an 80% reduction by 2050. The London Plan (published by the Mayor of London and formally part of Westminster’s development plan) sets an even more stringent target of a 60% reduction by 2025. Under the Energy Act 2011, from 2018 non-residential properties cannot be let without an energy performance certificate rating of ‘E’ or better. New residential buildings (with the exception of ‘smaller sites’) will need to meet the government’s Zero Carbon standard from 2016, and other new buildings will need to meet it from 2019. The Government have stated in June 2014 that the Zero Carbon Homes standard will be equivalent to Code for Sustainable Homes level 5, although developers may build to level 4 as long as they offset to level 5 through ‘allowable solutions’ under which payments can be made in lieu of solutions within developments. This will be contained in the Infrastructure Bill with further changes made to the Building Regulations.
2020
2013 2014 2015 2016
‘Zero carbon’ all residential. Onsite + ‘Allowable Solutions’
‘Zero carbon’ all non domestic buildings
Buildings with an EPC less than ‘E’ can’t be rented out
London Plan 40% carbon reduction beyond Part L 2010 - major development
2025
London Plan 60% carbon reduction
2050
National Target 80% carbon reduction
2018 2017 2019 2020
TRENDS
“At least 17% - and possibly as
much as 35% - of British commercial
buildings could be unfit for renting out in five years’ time, because
of their poor EPC Ratings”.
Consultants WSP analysed more than 4000 EPCs, and warned that this figure could rise even further as the Building Regulations standards rise (2013)
APR 2015 CIL adoption date and CIL regulations scale back of s106 starts
TIMELINE CARBON REDUCTION AND COMMUNITY INFRASTRUCTURE LEVY
8

TRENDS WESTMINSTER’S CARBON EMISSIONS
With only 1-1.5% of Westminster’s stock of buildings being replaced annually, it is estimated that in 2050 some 70% of existing buildings will still be in use, with 40% having been built prior to the 1985 (when the Building Regulations Part L was first introduced). In Westminster this figure could well be higher still, given the large proportion of heritage buildings. While it is right to seek to make reductions from heritage buildings, the extent to which these can be delivered can be constrained. This makes it particularly important to have more stringent policies to curtail rising carbon dioxide emissions from new build development.
Overall Westminster is among the 5 largest emitting local authority areas in the UK . It has the highest job density in London; it also has a 24 hour economy with some parts of the West End as busy at 3am as they are at 3pm. Westminster’s emissions mainly come from the built environment, with about 75% coming from commercial buildings. As Westminster has very little industry, the vast majority of emissions are from offices, hotels and shops. This highlights the importance of carbon reduction standards for commercial buildings. The Department of Energy and Climate Chance estimates Westminster’s emissions at 3220kt for 2010. In 1990 they were estimated at 3199kt. This indicates that at best, no progress was made over this 20 year period towards meeting the Mayor’s target of reducing the City’s emissions by 60% by 2025 (relative to 1990 levels).
9

INSIGHTS Local energy security
• The lack of capacity in Central London’s energy infrastructure directly affects development through expensive connection charges or requirements for substations. In Victoria recently one developer had to pay for a substation to be sited within its new development, reducing available development space. The cost of the substation plus the value of lost retail floorspace at basement level ran to £11.5m.
• Developers have to reserve or request a connection at the very start of the development process, increasing the upfront costs, weakening cash flow and, potentially affecting viability.
• In order to remove or reduce these barriers to growth, the current infrastructure needs to be improved. The potential for improvement relies on investment in the network, preferably before development starts. However, the amount that distribution network operators can invest in their networks is heavily regulated by Ofgem.
• Buildings with lower energy requirements, and those that incorporate combined heat and power (CHP) or combined cooling heating and power stations(CCHP), and renewable technologies reduce the strain on the local grid network. Reducing this pressure on the local grid distribution network can work towards improved local energy security.
“The West End has an extremely high and growing density of electricity demand and, as identified by a number of businesses, developers and planners who gave evidence to the Commission, this density of demand creates problems, including long lead-in times for securing new electricity connections and capacity constraints across the network.”
West End Commission Report (2013)
“In its evidence the Westminster Property Association highlighted that ‘security and resilience of energy supplies are a growing concern. This is an issue which goes to the heart of UK energy generation, distribution and regulation. The needs of the West End are quite exceptional, in national terms, and similar to those of the City of London...there is an urgent need to make real progress. ”
West End Commission Report (2013)
There is growing evidence that central London is at risk from severe weaknesses in capacity and maintenance of its energy infrastructure and that meeting these needs ad hoc is unnecessarily expensive, and impedes development and growth.
10

INSIGHTS Fuel Poverty
The findings regarding indirect impacts include: • Cold housing has negative effects on
children’s educational attainment, emotional well-being and resilience.
• Fuel poverty reduces dietary choices and opportunities for healthy diets.
• Cold housing leads to reduced dexterity and increases the risk of accidents and injuries in the home.
Most recent figures from DECC (dating from 2011) put the number of fuel poor households in Westminster at 7,804, or 8.3% of the population.
Fuel Poverty is an area in which the Council is able to have an impact, through activities including retrofitting of housing to improve it energy efficiency. It is also an area of work that could benefit from carbon reduction funds collected via ‘offsetting’ funds of the kind proposed in this document. There is overwhelming evidence that health and environmental inequalities are inextricably linked, with poor environments contributing significantly to poor health and health inequalities. Fuel poverty, previously defined as where a household must spend more than 10% of its disposable income on fuel costs, is now defined by a ‘low income high cost’ measure where fuel costs that are above the national median level and where spending that amount would leave a residual income below the official poverty line. The Marmot Review Team report into The Health Impacts of Cold Homes and Fuel Poverty assessed direct and indirect health impacts associated with cold homes: http://www.instituteofhealthequity.org/projects/the-health-impacts-of-cold-homes-and-fuel-poverty. As part of the Health and Social Care Act 2012, many public health duties that were the responsibility of the NHS moved over to local government. The national Public Health Outcomes Framework (PHOF) identifies a number of indicators that can help reduce inequalities in life expectancy and healthy life expectancy. One of these indicators is the percentage of residents living in fuel poverty. Another PHOF indicator is excess winter deaths which is closely associated with fuel poverty. The direct impacts of fuel poverty include: • Excess Winter Deaths (EWDs) almost three times higher in the
coldest quarter of housing than in the warmest quarter. • Children living in cold homes are more than twice as
11
likely to suffer from a variety of respiratory problems than children living in warm homes. •Mental health is negatively affected by fuel poverty and cold housing for any age group. •More than 1 in 4 adolescents living in cold housing are at risk of multiple mental health problems compared to 1 in 20 adolescents who have always lived in warm housing. •Cold housing increases the level of minor illnesses such as colds and flu and exacerbates existing conditions such as arthritis and rheumatism.

INSIGHTS Conserving Historic Integrity Westminster is rich in heritage assets, with 77% of the area covered by Conservation Areas, and over 11,000 listed structures, (equivalent to about 30%of all buildings in the City). This can mean that there is much less scope for large-scale redevelopment. Heritage buildings are highly valuable – socially, environmentally and economically. This has to be taken into account alongside the threats that future climate change and rising energy prices may pose to the future economic use and marketability of these buildings. Commercial occupiers are increasingly demanding better environmental performance and greater energy efficiency and legislation will prevent landlords from renting out properties with an EPC rating of less than an ‘E’ from 2018. It is not as simple as saying that energy efficiency measures are impossible in heritage buildings – they can be key to ensuring buildings have a viable future. Reducing the energy consumption of buildings within a conservation area or listed buildings can be more complicated and expensive however, as there will often be limitations on the types of measures that will be considered appropriate. The Council has produced a number of publications aimed at encouraging greater uptake of energy efficiency measures in existing buildings – its Guide to Retrofitting Historic Buildings, and ‘Improving Historic Soho’s Environmental Performance’ can both be downloaded from the Council’s website.
Clockwise from top left A: All buildings in Westminster; B Conservation Areas; C: Unlisted Buildings outside Conservation Areas D: Unlisted buildings inside Conservation Areas.
12
A
D C
B

INSIGHTS Design Limitations: Other The following building design issues have an impact on energy:
Tall buildings Whilst having some advantages in terms of efficiency of land use, these require more energy in vertical transport, higher maintenance costs, and are less likely to have natural ventilation and openable windows. They also have relatively less net floorspace due to building cores, and less roofspace for renewables.
Deep plan offices Offices where the distance wall-to-wall is larger than from floor to floor are more likely to require additional lighting and ventilation, with daylight dimmable lighting controls having less effect, and greater likelihood of mechanical cooling being required.
Density of city development High development density can lead to overshadowing, which limits options for solar photovoltaic panels. Concerns over poor air quality, and the need for additional HGVs to deliver fuel to site make alternative solid sources of fuel such as biomass (usually in the form of combustible wooden pellets) less feasible. Wind turbines are also less likely to work in a built up area. There can also be pressure to build more subterranean development, which may require significant excavation of spoil and concrete and steel use, and these in turn can have higher embodied carbon content, although offset by higher thermal efficiencies. Competing demands for roof space, particularly where roof terraces are a priority can limit the potential to install renewables and green roofs.
Sealed windows can lead to overheating, necessitating
installation of air conditioning,
Air conditioning uses energy, creates noise, and expels warm
air, adding to the urban heat Island effect, which compounds
air pollution, making it more likely that future developments will
require sealed windows and air conditioning.
Noise and poor air quality from existing traffic and other sources in built up urban areas, leads to
conditions for sealed windows to ensure acceptable standards are
met.
The figure above illustrates the links between noise, air quality and energy.
Market expectations Many of the things purchasers and occupiers of new developments expect to ensure their comfort – such as heating and cooling or protection from noise - require potentially energy intensive design choices such as air conditioning, large spaces requiring heating and lighting and high water usage.
13

INSIGHTS Design Insights: Opportunities Density of development The density of Westminster’s built environment, together with its extensive broad mixture of uses, presents an opportunity for decentralised energy with potential for positive returns on investment. (‘Westminster’s Energy Masterplan, (2014) Parsons Brinkerhoff). Key to the economic case for decentralised energy is a balanced energy and heating/hot water load, to ensure that the plant can run for as many hours as possible. Mixed use developments will be more likely to have this balanced demand for heating and hot water throughout a 24 hour period.
High property values Development within Westminster commands a price premium and is more robust than in some other parts of the UK. To some extent at least, Westminster does not face the same viability constraints experienced in other parts of the country. Demand for low energy buildings Occupiers of new developments are increasingly seeking premises which are low carbon and resource efficient. This is increasingly being recognised by developers and agents. Innovation in technology New energy technologies are emerging all the time. In particular, hydrogen fuel cells are emerging as a viable technology with the
potential to deliver very significant carbon reductions. These are being tested on a number of developments in London and the rest of the UK. Retrofitting There are significant retrofit opportunities in London and the development industry is becoming more familiar with the issue, with significant programmes of support and investment coming from the London Mayor and other organisations. There is also a growing familiarity with the Passivhaus standard, which promotes a super energy efficient building fabric and construction which reduces the heating/cooling needs of a building so traditional systems are not required.. Government policy The Green Deal and Energy Company Obligation (ECO) funding may present an opportunity to lever funding towards some of the more difficult measures such as solid wall insulation. Zero carbon offsetting In August 2013 the Government issued consultation on the carbon offsetting process to achieve the zero carbon home standard from 2016, entitled ‘Next Steps to Zero Carbon Homes: Allowable Solutions’. This follows its restatement of its commitment to zero carbon homes from 2016 in the 2013 Budget. Its evolving definition of allowable solutions, which forms a key part of the definition of zero carbon, is intended to provide a flexible delivery mechanism. To date the Government has signalled an intention for a similar approach to commercial buildings in 2019, although there is as yet no detail on this.
14
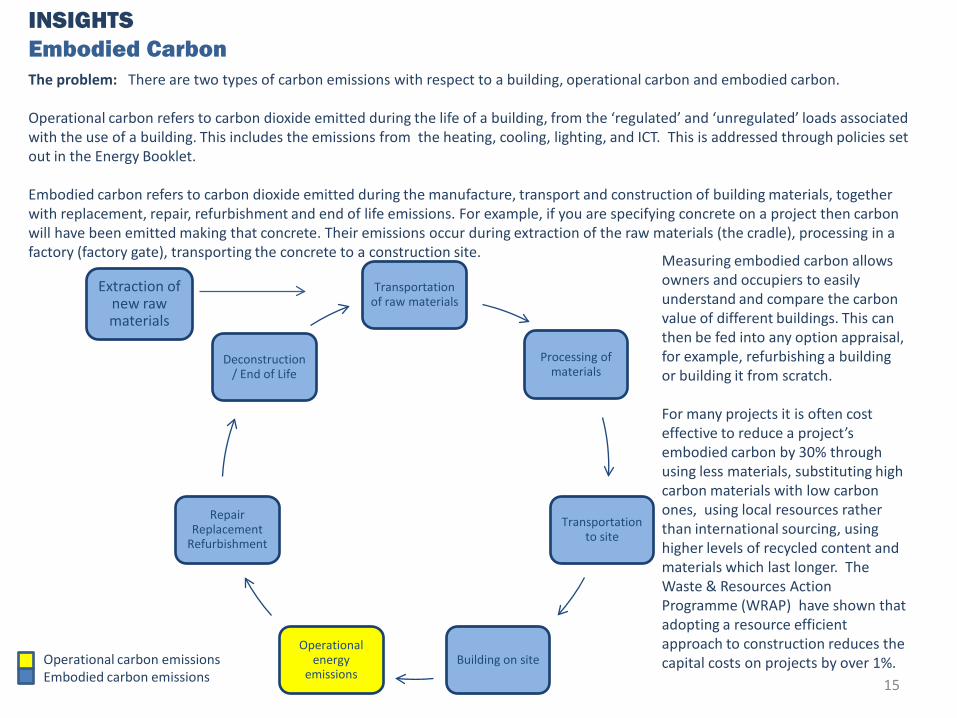
INSIGHTS Embodied Carbon The problem: There are two types of carbon emissions with respect to a building, operational carbon and embodied carbon. Operational carbon refers to carbon dioxide emitted during the life of a building, from the ‘regulated’ and ‘unregulated’ loads associated with the use of a building. This includes the emissions from the heating, cooling, lighting, and ICT. This is addressed through policies set out in the Energy Booklet. Embodied carbon refers to carbon dioxide emitted during the manufacture, transport and construction of building materials, together with replacement, repair, refurbishment and end of life emissions. For example, if you are specifying concrete on a project then carbon will have been emitted making that concrete. Their emissions occur during extraction of the raw materials (the cradle), processing in a factory (factory gate), transporting the concrete to a construction site.
Transportation of raw materials
Processing of materials
Transportation to site
Building on site Operational
energy emissions
Repair Replacement
Refurbishment
Deconstruction / End of Life
Operational carbon emissions Embodied carbon emissions
Extraction of new raw materials
Measuring embodied carbon allows owners and occupiers to easily understand and compare the carbon value of different buildings. This can then be fed into any option appraisal, for example, refurbishing a building or building it from scratch. For many projects it is often cost effective to reduce a project’s embodied carbon by 30% through using less materials, substituting high carbon materials with low carbon ones, using local resources rather than international sourcing, using higher levels of recycled content and materials which last longer. The Waste & Resources Action Programme (WRAP) have shown that adopting a resource efficient approach to construction reduces the capital costs on projects by over 1%.
15
INSIGHTS why are policies on energy and carbon needed? As Westminster’s emissions are high and continuing to rise, a focus on emissions from new buildings, as well as reductions from existing buildings is important to ensure that Westminster is:
– making the most efficient use of its energy infrastructure, and ensuring its people and businesses are less exposed to future energy supply problems;
– more competitive as businesses would be better insulated from rising energy prices;
– making a proportionate contribution to mitigating the extent of future climate change events;
– less exposed to the potential economic threat of commercial properties that cannot be rented out after 2018 if they fail to meet minimum EPC ratings; and
– protecting the health and wellbeing of its most vulnerable residents as there is compelling evidence that the negative impacts of climate change disproportionately affect our most vulnerable residents.
These problems can begin to be tackled through better performing new buildings (driven by carbon reduction targets) and a programme of carbon reduction measures targeting existing buildings to reduce their energy demand, funded in part via carbon offsetting payments where targets cannot be met onsite. Payments can be spent on delivering a reduction in carbon emissions across the built environment, with a particular focus on the council’s housing estates and community facilities.
RECOMMENDATIONS: What carbon target is proposed? The Council propose that a series of staged targets apply to commercial development starting with targets which implement the London Plan policies 5.2 and 5.4 from publication of this booklet for major development, and then increasing in stages: • first, ‘feasible’ targets identified by ARUP in its study for the Council, •Then steps towards a zero carbon policy to apply in line with the Government intention that this should apply by 2019 to all non residential development (excepting ‘smaller sites’ which are yet to be defined by Government) This is summarised on page 17, which explains the approach the Council will take now, on formal adoption of the City Plan, and in 2019. The Council’s approach is intended to secure the highest reasonably achievable carbon reductions having regard to feasibility and viability, providing a stepped approach to zero carbon and giving the sector an opportunity to adjust. Where carbon targets cannot be met onsite, an “offsetting” approach is proposed (explained with worked examples on pages 24 and 25). This uses a “cost of carbon” based on the cost of saving equivalent carbon emissions elsewhere in Westminster. The Council intends to revisit this cost of carbon at regular intervals, to ensure that it remains robust. Consultation on any changes will take place on each occasion. Viability Financial viability is a key issue. All proposed City Plan policies will be assessed to ensure that taken together they will not make development unviable. The viability implications of applying policy in particular cases will also be considered. It is worth noting that payments to offset non delivery of the Council’s renewables policy are already being collected without undue effects on development viability. Longer term, policies (proposed from adoption of the City Plan onwards) will be assessed for viability, taking account of the fact that these are likely to be increasingly overtaken by mandatory national standards
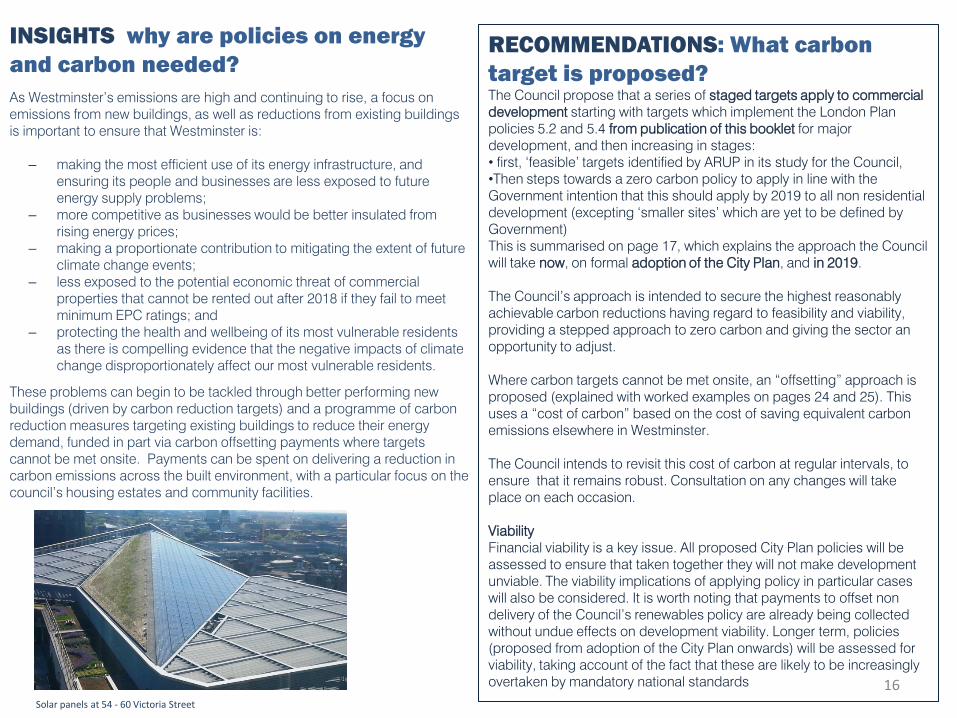
Solar panels at 54 - 60 Victoria Street
16

Summary of Carbon Reduction Targets Westminster 2014 - 2019 Stage
Development type/size
Jan 2014 (cost of carbon at £7560 per tonne)
... See page 21-22
Adoption of City Plan (review cost of carbon in
2015) ...see page 23
April 2017 (Review/consult
on cost of carbon)
April 2018 (Adopt
reviewed cost of carbon)
April 2019
...See page 24
New build resi 10 or more units
40% beyond Part L 2010 or 35% beyond Part L 2013 as per London Plan Policy 5.2
Until such time as residential development removed from scope of planning energy targets
Change of use to resi/refurbishment >1000m2
40% beyond Part L 2010 or 35% beyond Part L 2013 as per London Plan Policy 5.2
Until such time as residential development removed from scope of planning energy targets
New build non resi <200m2
18% beyond Part L 2013, as per ARUP study (addendum) from adoption date. Offset cost £4800/t
As previous
As previous
Zero Carbon as per National Policy
New build non resi 200m2 – 1000m2
23% beyond Part L 2013, as per ARUP study (addendum) from adoption date. Offset cost £4800/t
As previous
As previous Zero Carbon as per National Policy
New build non resi >1000m2
40% beyond Part L 2010 or 35% beyond Part L 2013 as per London Plan Policy 5.2
As previous As previous
As previous Zero Carbon as per National Policy
Extensions 100-500m2 (excl. listed building) – non resi
18% above BR 2013 as per ARUP study from adoption date. Offset cost £4800/t
As previous
As previous Zero Carbon applying principle of National Policy
Extensions >500m2 non resi
23% above BR 2013, as per ARUP study from adoption date. Offset cost £4800/t
As previous
As previous Zero Carbon applying principle of National Policy
Change of use resi to commercial/refurb >1000m2
40% beyond Part L 2010 or 35% beyond Part L 2013 as per London Plan Policy 5.2 and 5.4.
As previous As previous
As previous Zero Carbon applying principle of National Policy
Direction of travel
17

INSIGHTS – are the targets achievable onsite? Arup were commissioned by the Council to look at technical (i.e. practical) feasibility of applying on-site carbon targets beyond Building Regulations Part L 2010 requirements. Arup looked at a sample of actual cases (resi and non resi) – dating from 2010-2012, and also at notional developments designed to target zero carbon and proposed a series of carbon reduction targets which it considered could feasibly be achieved on site. Arup also calculated a carbon price of £7,800 based on these targets. Although the study also tested residential carbon targets, these are not being taken forward, and policy approach set out in this booklet applies only to commercial buildings. In June 2014 ARUP submitted an addendum to the original study, which recalculated the targets (and therefore also the carbon price) downwards based on removing any requirements relating to residential development, following the Government announcement that planning authorities will not in future be able to set carbon reduction targets on residential development, and rebasing the targets to express them relative to Part L 2013 which has come into force since the original study. These new feasible targets set out on the table on page 17, are those from the ARUP Addendum study, except where London Plan policy 5.2 already applies a higher target. Feasibility of targets It is worth noting that the research was based on technologies and design and construction standards/techniques and policy context applicable at the date of the research. In 2012 the London Plan Policy 5.2 required a 25% improvement on Building Regulations, and Westminster’s Core Strategy policy required “exemplary standards of sustainable design” although the level was not specified in the policy.
Development category
Feasible Carbon reduction target (from ARUP Addendum, rebased against part L 2013)
New build non residential <200m2
18%
New build non residential >200m2
23%
Extensions 100-500m2 (excl. listed building)
18%
Extensions >500m2 23%
Change of use to non residential/refurbishment >1000m2
18%
The carbon targets recommended by ARUP in the original study ranged from 25% to 30% (against Part L2010) in respect of commercial buildings and were considered to deliberately represent a conservative approach to what is feasible on-site today. Developments considered for the study were inevitably targeting policy requirements and using technology available at the time the study was conducted. The study showed that at the time it was carried out in fact that new build developments could feasibly achieve an emissions reduction of up to 38%, and developments for change of use to non residential could achieve up to 46%. However a conservative approach to target setting has been adopted, setting targets that are less than the maximum considered feasible. This has also been borne out by recent GLA research into the impact of its energy policies “Energy Planning: Monitoring the Implementation of Energy Policies for 2012” This showed that on average major development achieved carbon reductions of 33%, 33% and 36% (over Part L 2010) in each of 2010, 2011 and 2012.
18

The yellow line on the graph below illustrates the new lower proposed cost of carbon abatement in Westminster ( which is based on excluding decentralised energy from the potential measures that might be funded). This is lower than the figure originally generated because the addendum study removes residential development emissions from the scope of carbon that the council needs to abate, and with the ‘feasible carbon targets’ rebased to take account of the recent tightening of Part L there is a further reduction of 7,900tCO2. As far as possible, the council expects the required carbon savings to be made on-site. Where the relevant target is not fully met on-site, the difference between the required figure and what is achieved on-site will be offset as shown on pages 25-26. Unlike the offsetting calculation set out in the GLA Supplementary Planning Guidance on Sustainable Design, this figure is not multiplied by 30 years, as the calculation assumes that these measures are replaced or renewed at the end of their useful life with another CO2 offsetting solution. The price is also based on excluding decentralised energy from the list of potential projects, assuming that these may be funded through the Council’s Community Infrastructure Levy (CIL) – a charge on new development intended to fund infrastructure.
Deriving the local cost of carbon The cost of energy improvement measures in Westminster is much higher than elsewhere, partly due to the large number of heritage buildings and designations making energy efficiency measures more expensive, but also due to the types of opportunities available (few lofts and cavity walls), a higher labour and ancillary costs. For these reasons a national price of carbon applied in Westminster wouldn’t enable sufficient carbon reduction measures. The carbon price has been calculated by estimating future emissions from all non residential development and applying the feasible targets (page 18) to determine a target for emissions reduction over the lifetime of the City Plan policy (16,200tCO2/year). The price per tonne was derived from the cost of delivering a range of carbon saving projects elsewhere in the borough. The list of potential carbon saving projects, each delivering a measure of carbon reduction in the city was compiled and sorted by capital cost per tonne to identify the most cost effective measures. By plotting these project savings (sorted by cost effectiveness) on a graph (right) , ARUP derived a cost curve based on non residential development meeting the targets it has deemed feasible on site. The costed range of projects identified gave a figure of £4,800 per tonne of carbon (including a 5% element for administration).
19
16,200 tCO2/yr
= £4,800/tCO2
7,900 tCO2 saving from Part L 2013
Cost of carbon abatement in Westminster not including decentralised energy schemes for Part L 2013 buildings. The yellow line indicates the estimated emissions included in the feasible onsite emissions reduction targets

What could the carbon funds be spent on? Measure group Measure Total Potential
Carbon saving [tonnes per annum]
Total capital expenditure [Million £]
Total Cumulative Saving [tonnes per annum]
Cumulative £/tonne saving
Residential energy efficiency (EE) Retrofit
Loft Insulation 720 0.6 720 770
Storage Heaters Residential 3600 4.0 4300 1100
Residential EE Retrofit
Cavity wall insulation
520 1.1 4800 1200
Air Source Heat Pumps
Commercial 2900 8.9 7700 1900
Residential EE Retrofit
Replacement Glazing
150 1.0 7800 2000
Solar Thermal Commercial 4900 39.8 12700 4400
Solar PV Commercial 5000 48.3 18300 5700
Solar PV Residential 12000 103.1 30300 6800
Solar Thermal Residential 12400 136.7 42800 8000
Residential EE Retrofit
Solid wall insulation
110 2.2 42900 8100
The projects listed above were ordered by cost-effectiveness, and the cumulative £/tonne saving column figures were plotted on the graph on page 19 against the carbon savings required to determine the overall price. This is based on an estimate of the gap between emissions from development coming forward meeting Building Regulations, and the targets, based on new build (with an assumption that half of all new build coming forward will be smaller than 200m2, and half will be over this size threshold). It is considered that in most cases measures of this kind will NOT constitute infrastructure which would trigger the provisions of the Community Infrastructure Levy regulations “scaling back” the pooling of section 106 contributions. This matter will be kept under review as this policy is developed. Decentralised energy is likely to involve “infrastructure”, meaning that the ability to use section 106 agreements to fund it (particularly across a number of developments) will be legally restricted). Carbon offsets will be collected through s106 agreements and will be applied to things that are not “infrastructure”.
20

Carbon price in relation to the London Plan policy 5.2 Currently the London Plan policy 5.2 requires a 35% improvement against Part L 2013 for all major development, both residential and non residential, with offsetting payable at the Local Authority’s published cost of carbon where this is not achieved on site. To determine an appropriate carbon price for the purpose of offsetting where developments do not achieve the GLA target, the same methodology for calculating the carbon price has been used, considering total emissions anticipated from residential and non residential development (as the GLA policy applies to all major development) with the slightly higher target of 35% (which increases the total annual carbon emissions sought to be offset to 39,200tpa – i.e. resulting in the yellow line moving further along the x-axis) but with a reduction to reflect the improvement that will result from the tightening of Part L 2013 Building Regulations. This results in a carbon price of £7560/tonne, see the graph below. This price will be applied to all major development residential and non residential which does not achieve this target on site from the date of publication of this booklet. At a future date the Government has announced that such standards will not be able to apply to residential development, but until this happens the Council has to be in general conformity with the London Plan. It should be noted that unlike the suggested figure contained in the GLA Supplementary Planning Guidance on Sustainable Design (April 2014) of £60/tonne this figure does not need to be multiplied by 30 years.
21
Cost of carbon abatement in Westminster not including decentralised energy schemes for domestic and non-domestic Part L 2013 buildings. The yellow line indicates the estimated emissions included in the feasible onsite emissions reduction targets.

October 2013 until earliest of adoption of City Plan or March 2016: Implementing London Plan Policy 5.2 and 5.4
Development category Onsite carbon reduction target (over Building Regulations part L 2013 Target Emissions Rate)
New build resi 10 or more units 35% *
Change of use to resi/refurbishment >1000m2
35%*
New Build non resi >1000m2
35%
Extensions >1000m2 (excl. listed building)
35%
Change of use to non resi/refurbishment >1000m2
35%
These development categories in the table apply the London Plan definition of “major development”. After the draft City Plan policies are published, the council will move to use of its own definition (published in the Glossary to Westminster’s City Plan: Strategic Policies, which defines major development for residential as either 10 units or more, or 1000m2) as those policies gain weight in the taking of planning decisions during 2015. Until the City Plan is published no carbon reduction targets would apply to development which falls below the threshold of major development. However it is important to move towards adopting policies that capture as much development as possible in Westminster, especially as it is envisaged that standards will exclude residential development, as the cumulative impact of many smaller applications are very important in tackling this issue. The Government has also announced in relation that ‘smaller sites’ will be exempted from requirements to achieve zero carbon homes standard, and this will be consulted on and embedded in regulations. Currently it is still open to the Council to set policy requirements for commercial development, and no size threshold has been announced. Viability issues will be considered in each case in accordance with the principles set out by national government in the National Planning Policy Framework.
During this period, the Council will be implementing London Plan policies (5.2 – Minimising Carbon Emissions, 5.3 – Sustainable Design and Construction and 5.4 – Retrofitting). These policies are already part of Westminster’s development plan and have applied here since July 2011. The following principles have informed the development categories and reduction targets in the table: • These policies apply to “major developments”. In the London Plan these are defined as
those involving construction of 10 or more dwellings, or developments where the commercial floorspace will be 1000 sq m or more and include residential development. The Housing Standards Review may in future result in residential development being excluded.
• London Plan Policy 5.4 - Retrofitting requires the environmental impact of existing
urban areas to be brought up to the Mayor’s standards of sustainable design and construction, in particular minimising carbon dioxide emissions and making efficient use of natural resources.
• The London Plan targets are informed by evidence about performance of new
development since 2004. Proposals approved by the Mayor since 2007 have achieved typical savings of 30-40% above Building Regulations, with about a quarter exceeding 40%.
22
* Until residential standards taken out of the planning system

From Adoption of City Plan targets - March 2019
Development category Onsite carbon reduction target (expressed as over Building Regulation part L 2013) Target Emissions Rate
New build non resi <200m2 The higher of Building regulation target or 18% beyond Part L 2013
New build non resi >200m2 The higher of Building regulations target or 23% beyond Part L 2013
New Build non resi >1000m2
The higher of Building regulations target or 35% beyond Part L 2013
Extensions 100-500m2 (excl. listed building) non resi The higher of Building regulations target or 18% beyond Part L 2013
Extensions >500m2 non resi The higher of Building regulation target or 23% beyond Part L 2013
Change of use to non resi/refurbishment >1000m2 The higher of Building regulation target or 35% beyond Part L 2013
These targets will be set in the City Plan and reflect implementation of announced national policy for a zero carbon target for non-domestic buildings. Again, these targets assume national Government implementing new Building Regulation standards in line with its announced intention.
23

April 2019 onwards
Development category Onsite carbon reduction target (over Building Regulation part L 2013) Target Emissions Rate)
New build non resi <200m2 Zero carbon
New build non resi >200m2 Zero carbon
New Build non resi >1000m2
Zero carbon
Extensions 100-500m2 (excl. listed building) non resi Zero carbon
Non resi Extensions >500m2 Zero carbon
Change of use to non resi/refurbishment >1000m2 Zero carbon
These targets will be set in the City Plan and reflect announced national policy for introduction of a zero carbon target for non-domestic buildings. Again, these targets are based on national Government implementing new Building Regulation standards in line with its announced intention. Should the timing change, the Council will continue to apply the targets in the City Plan until the Government’s intentions are made clear.
24
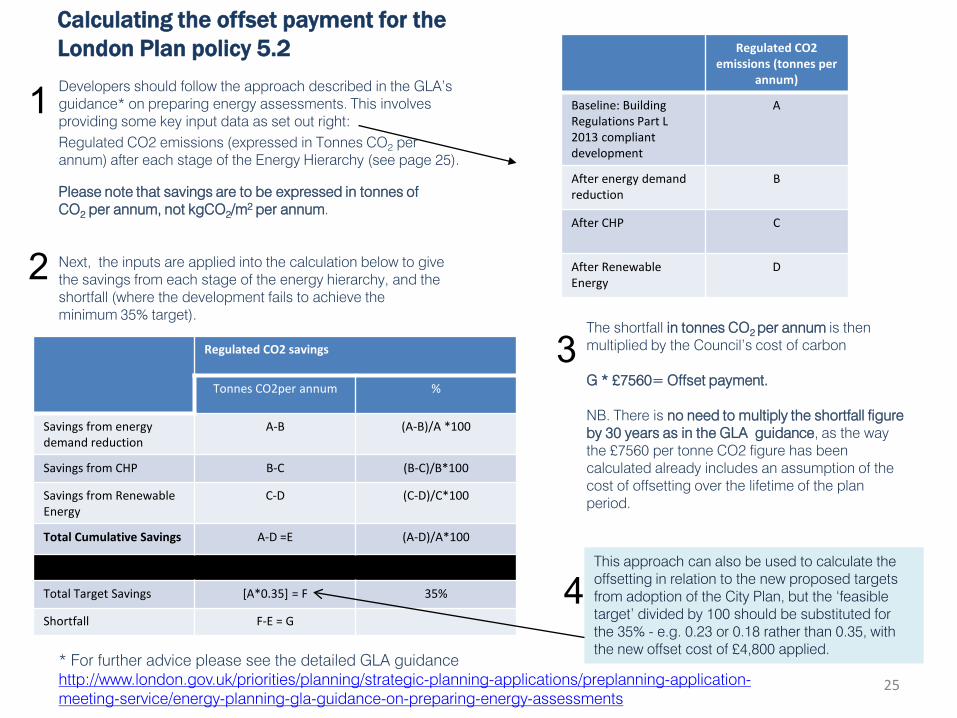
Calculating the offset payment for the London Plan policy 5.2 Developers should follow the approach described in the GLA’s guidance* on preparing energy assessments. This involves providing some key input data as set out right: Regulated CO2 emissions (expressed in Tonnes CO2 per annum) after each stage of the Energy Hierarchy (see page 25).
Please note that savings are to be expressed in tonnes of CO2 per annum, not kgCO2/m2 per annum. Next, the inputs are applied into the calculation below to give the savings from each stage of the energy hierarchy, and the shortfall (where the development fails to achieve the minimum 35% target).
The shortfall in tonnes CO2 per annum is then multiplied by the Council’s cost of carbon G * £7560= Offset payment. NB. There is no need to multiply the shortfall figure by 30 years as in the GLA guidance, as the way the £7560 per tonne CO2 figure has been calculated already includes an assumption of the cost of offsetting over the lifetime of the plan period.
1
2
3
25
* For further advice please see the detailed GLA guidance http://www.london.gov.uk/priorities/planning/strategic-planning-applications/preplanning-application-meeting-service/energy-planning-gla-guidance-on-preparing-energy-assessments
Regulated CO2 emissions (tonnes per
annum)
Baseline: Building Regulations Part L 2013 compliant development
A
After energy demand reduction
B
After CHP C
After Renewable Energy
D
Regulated CO2 savings
Tonnes CO2per annum %
Savings from energy demand reduction
A-B (A-B)/A *100
Savings from CHP B-C (B-C)/B*100
Savings from Renewable Energy
C-D (C-D)/C*100
Total Cumulative Savings A-D =E (A-D)/A*100
Total Target Savings [A*0.35] = F 35%
Shortfall F-E = G
4 This approach can also be used to calculate the offsetting in relation to the new proposed targets from adoption of the City Plan, but the ‘feasible target’ divided by 100 should be substituted for the 35% - e.g. 0.23 or 0.18 rather than 0.35, with the new offset cost of £4,800 applied.

Example: A demolition and redevelopment achieves a 31.6% saving through onsite measures and will offset the remainder based on the following information in its Energy Strategy: Baseline against Part L 2010 = 174 tonnes CO2, Emissions after energy demand reduction measures = 164 tonnes, Emissions after CHP savings = 121 tonnes Emissions after photovoltaics savings = 119 tonnes.
The calculation is as follows: 1. Savings from energy demand reduction: (174 – 164) /174 * 100 = 5.74% 2. Savings from CHP: (164-121) / 164 * 100 = 26.22% 3. Savings from Renewable Energy: (121-119) / 121 * 100 = 1.65% 4. Total Cumulative Savings (against a target of 35%): (174 –119) / 174 * 100 = 31.6% 55/174*100 = 31.6% 5. Total Target Savings: 174 * 0.35 = 60.9 6. Shortfall: 60.9 – 55 = 5.9 tonnes CO2 Payment : 5.9 * £7560 = £44604
Where (all expressed in tonnes CO2) A = 174 B = 164
C = 121 D = 119
An indicative online calculator is available alongside this consultation booklet. This will be available for developers to calculate their CO2 savings/shortfall and any payment arising.
26
Regulated CO2 emissions (tonnes per
annum)
Baseline: Building Regulations Part L 2013 compliant development
A
After energy demand reduction
B
After CHP C
After Renewable Energy
D
Regulated CO2 savings
Tonnes CO2per annum %
Savings from energy demand reduction
A-B (A-B)/A *100
Savings from CHP B-C (B-C)/B*100
Savings from Renewable Energy
C-D (C-D)/C*100
Total Cumulative Savings
A-D =E (A-D)/A*100
Total Target Savings [A*0.35] = F 35%
Shortfall F-E = G

RECOMMENDATIONS DESIGN POLICY S28 DESIGN
…
Through its design, use of materials and execution, development will make a positive contribution to the townscape and urban realm, and to its environmental performance. In particular, it will
…
Development will:
• Minimise Reduce energy use and emissions that contribute to climate change during the life-cycle of the development with an aspiration towards zero carbon. In applying this policy the Council will apply the following hierarchy:
1. Measures to reduce energy use
2. Use of decentralised energy (see policy S39)
3. Use of renewable energy (see policy S40)
• Ensure the reduction, reuse or recycling of resources and materials, including water, waste and aggregates.
…
The above will include providing for an extended life-time of the buildings and spaces itself through excellence in design quality, high quality durable materials and detail, efficient operation, and the provision of high quality floorspace so that they can adapt to changing circumstances over time, including the risks and consequences of future climate change, and how it may alter the way buildings and the wider urban environment are used and experienced.
Proposed addition to text introduces the concept of meeting zero carbon. This is supported by the proposed City Management policy on sustainability assessments (see next page), which sets out the detailed expectations for different types of development, and the circumstances in which any shortfall will need to be off-set to ensure the built environment delivers a ‘step-change’ in building performance.
Only the changes proposed to this policy dealing with energy are shown; others dealing with other aspects of design are set out in the booklet on Design.
Proposed addition to text reiterates the importance of both mitigation of and adaptation to climate change in the design of development. Buildings need to be designed to meet the needs of occupiers in the future, including a changed climate and a larger number of extreme weather events (see, for example, the measures to deal with over-heating referred to on page 30).
Only text directly relevant to this booklet is shown here. The booklet on “Design” contains other parts of the policy wording
27
The insertion of this text is intended to ensure developments apply the London Plan energy hierarchy

SUSTAINABILITY CRITERIA AND ASSESSMENTS NEW POLICY CM28.3: SUSTAINABLE CRITERIA AND ASSESSMENTS Development will meet the relevant standards (including relevant CO2 reduction levels) set out in the table below, and submit the relevant design stage assessment to demonstrate compliance. Where it has been demonstrated that it is not appropriate, practicable or viable to meet the relevant CO2 reduction standard on-site, the development will meet the highest standard reasonably achievable, and offset any unmet CO2 emissions at the Council’s cost of carbon, so long as this payment is calculated to exceed £2,000.
Type /size of residential development
April 2015 or adoption date if later (% improvement against BR 2013)
April 2016 (% improvement against BR 2013)
April 2019 (% improvement against BR 2013)
New build non resi <200m2 18% As previous Zero carbon
New build non resi 200-1000m2 23% As previous Zero carbon
New build non resi >1000m2 35% As Building Regs 2016 or 35% (whichever
greater)
Zero carbon
Extensions non resi*2100-500m2 (Excluding listed)
18% As previous Zero carbon
Extensions non resi*2 500m2 (Excluding listed)
23% As previous Zero carbon
Change of use to non-resi/refurb >1000m2
18% As Building Regs 2016 or 35% (whichever
greater)
Zero carbon
This approach provides a similar flexibility to that proposed by the Government’s definition of Allowable Solutions, with a carbon reduction target on site and in keeping with Policy 5.2E of the London Plan.
*1 Refurbishment which includes a substantial alteration in the building fabric and services *2 Only the extension should be assessed
The payment in lieu value will be regularly recalculated (at least every three years) . Currently £7560/tCO2 for the purposes of offsetting the London Plan policy 5.2, moving to £4800/tCO2 on adoption of the City Plan policies.
For all developments included in the table . an energy statement will be required with the planning application. However, the requirement will be proportional to the size of the scheme. This will be clarified in supporting text. An online calculator tool will be developed to support calculation of the extent to which the carbon reduction target is met and any offsetting required.
For reasons of space, only that part of this table relevant to energy efficiency is shown here. Other parts of this policy is shown in the Design Booklet.
28
The requirements tighten over time, in line with national Building Regulations targets, giving time to developers to gear up.

POLICY S39 ENERGY INFRASTRUCTURE DECENTRALISED ENERGY NETWORKS The Council will work with developers utility providers, regulators and others to better plan for, coordinate and facilitate delivery of resilient energy infrastructure and supply to support the City’s development and growth. Existing energy infrastructure will be protected. All development will minimise demand for energy through sustainable design and construction including incorporation of demand management measures. Major development proposals should demonstrate engagement with infrastructure providers to identify the infrastructure needs they give rise to and to ensure these are addressed promptly and effectively to serve the development. Infrastructure that is or has previously been in use as part of a heating network district heat network (DHN) will be protected. The council will use its planning powers as appropriate to ensure it is upgraded or brought back into use. Major developments should be designed to link to and extend existing heat and energy networks DHNs in the vicinity, or those planned within 500m of the site (where this is likely to be operational within two years or such other period agreed by the Council as being reasonable in the circumstances) except where the council agrees that it is not practical or viable to do so. In other circumstances, the following principles will be applied:
• Where a major development is located within an area identified as feasible for a DHN in the Council’s Decentralised Energy Masterplan , but no firm plans exist as to who will build the network or by when, provision should be made within the development to enable future connection.
• Where a major development is located within an area where a DHN is to be provided but there is no programme to connect the site due to cost, distance and/or lack of plans for intervening sites, the development should be designed on the basis of its own CHP and provision for future connection, with a requirement to install the CHP unless a connection can be made to the DHN within two years or such other period agreed by the council as being reasonable in the circumstances.
DECENTRALISED ENERGY NETWORKS
The Council’s DE Masterplan , (to be published during the course of this consultation period) identifies those areas with the greatest opportunity to develop DHNs. Sites within these areas must support the networks to ensure they are delivered.
Applicants must provide sufficient detail to enable this policy to be assessed, particularly where it is considered impractical or unviable to connect to a decentralised energy network. In such cases, full details of the alternative site-wide energy scheme must be provided.
It might be necessary for a site connecting to a DEN to undertake further works to enable other applicants to connect in future, for example ensuring that as their site is built, a connection route is provided bridging a link to a DEN for other future neighbouring developments.
29

• Where there are firm plans to connect a site to a DHN but the network build out will not reach the site until two years or longer after the development is complete, a major development should be designed for a DHN connection from the outset, with temporary provision of heat from heat only boilers.
In all cases, the council will have regard to factors affecting technical feasibility (including in particular where all available technologies would have unacceptable impacts on local air quality) and financial viability. In larger major developments located in places the Council’s Decentralised Energy Masterplan identifies as DHN ‘kick-start’ areas, oversized plant rooms should be provided with sufficient space for additional CHP capacity and thermal storage adequate to support initiation of a DHN . In major developments secondary heating systems within buildings should be designed to allow efficient connection to a DHN. Smaller developments will be encouraged to be enabled to connect into heat and energy networks DHNs, and will be expected to connect where they are located within 100m of an existing DHN, where it is practical, viable, and appropriate to the scale of development, to do so. Where appropriate waste heat should be captured and used in DHNs
Over 200 residential units or site area of >4 hectares; or proposed gross floorspace of 10,000 m2 or site area of 2 hectares or more 5000m2 of floorspace
POLICY CM 39 DISTRICT COOLING NETWORKS: Where the Council’s DE Masterplan identifies district cooling as technically feasible and financially viable major development should be designed to initiate, link to, or extend a site wide cooling network, except where it is not practical or viable to do so.
Where networks exist, every effort should be made to ensure development connects to it including taking opportunities to connect smaller developments.
e.g. The radiators and pipework within a building
A map will be provided and kept up to date
KEY QUESTION: The Council is considering the extent to which it should set a policy in relation to waste heat. What approach should be taken to waste heat?

RENEWABLES
POLICY S40 RENEWABLE ENERGY
All major development throughout Westminster should maximise on-site renewable energy generation to achieve at least 20% reduction of carbon dioxide emissions, and where feasible, towards zero carbon emissions, except where the council considers that it is not appropriate or practicable due to the local historic environment, air quality and/or site constraints.
Smaller-scale development will integrate renewable technologies into the design of the scheme where appropriate practical and viable, to maximise renewable energy generation and reduce demand on national energy supplies.
Development including biofuel and/or biomass combustion will not be acceptable unless adequate abatement measures are adopted to ensure no adverse impact on air quality.
The Council considers that reducing energy consumption overall and diversifying local sources of renewable energy is key to improving energy security. For this reason, every opportunity to consider the use of renewables should be taken, not just on major schemes, although it is recognised that there are practical limitations and cases where it will be unfeasible or unviable to do so.
Developers should include details in their application setting out what renewables have been considered, what is proposed, and where renewables have been discounted, wholly or in part, the reasons why with particular reference to their appropriateness, practicality or viability. This assessment should be proportional to the size of the development.
Adopted City Plan: Strategic Policies Policy CS39
Current technology of energy generators reliant on biofuel and biomass result in air emissions which are polluting at a local level. It may be that future plant resolves these air quality issues and biomass/biofuel generation becomes appropriate in Westminster. Therefore the policy is an enabling one, relying on future technologies, rather than one which prohibits this type of renewable generation.
31
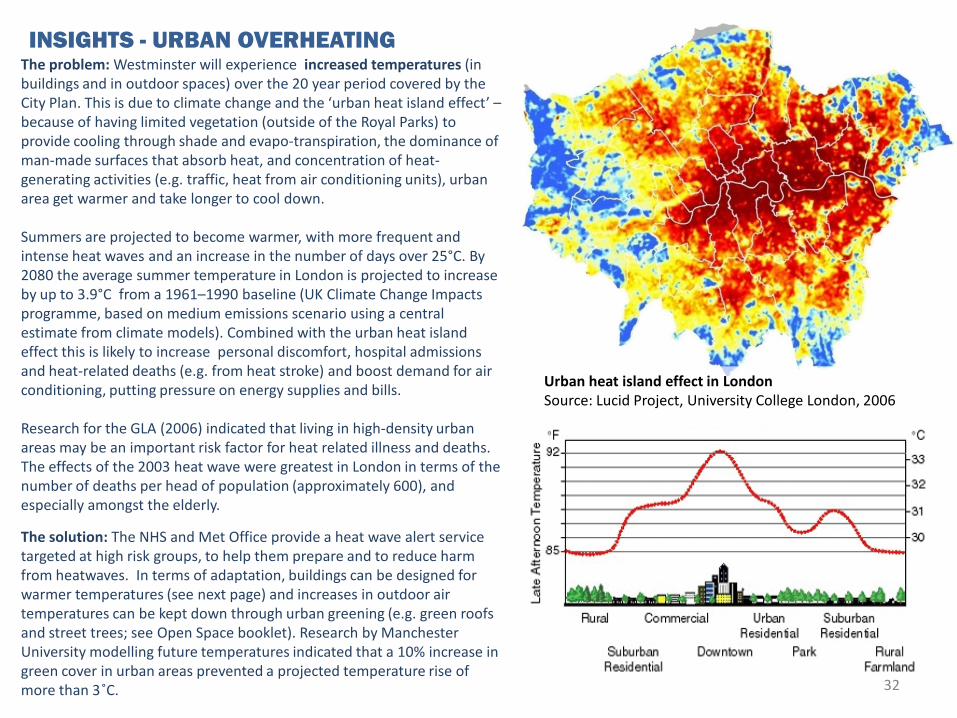
INSIGHTS - URBAN OVERHEATING The problem: Westminster will experience increased temperatures (in buildings and in outdoor spaces) over the 20 year period covered by the City Plan. This is due to climate change and the ‘urban heat island effect’ – because of having limited vegetation (outside of the Royal Parks) to provide cooling through shade and evapo-transpiration, the dominance of man-made surfaces that absorb heat, and concentration of heat-generating activities (e.g. traffic, heat from air conditioning units), urban area get warmer and take longer to cool down. Summers are projected to become warmer, with more frequent and intense heat waves and an increase in the number of days over 25°C. By 2080 the average summer temperature in London is projected to increase by up to 3.9°C from a 1961–1990 baseline (UK Climate Change Impacts programme, based on medium emissions scenario using a central estimate from climate models). Combined with the urban heat island effect this is likely to increase personal discomfort, hospital admissions and heat-related deaths (e.g. from heat stroke) and boost demand for air conditioning, putting pressure on energy supplies and bills. Research for the GLA (2006) indicated that living in high-density urban areas may be an important risk factor for heat related illness and deaths. The effects of the 2003 heat wave were greatest in London in terms of the number of deaths per head of population (approximately 600), and especially amongst the elderly.
The solution: The NHS and Met Office provide a heat wave alert service targeted at high risk groups, to help them prepare and to reduce harm from heatwaves. In terms of adaptation, buildings can be designed for warmer temperatures (see next page) and increases in outdoor air temperatures can be kept down through urban greening (e.g. green roofs and street trees; see Open Space booklet). Research by Manchester University modelling future temperatures indicated that a 10% increase in green cover in urban areas prevented a projected temperature rise of more than 3˚C.
Urban heat island effect in London Source: Lucid Project, University College London, 2006
32

Future buildings must be designed to promote lower energy consumption to cool occupants, through the use of natural ventilation and ‘adaptive comfort’ measures, such as enabling the occupants to open or close windows and shutters. While internal temperatures will never be as low as actively air conditioned buildings, designing a naturally managed building which allow occupants to control the internal environment adjusting to external conditions has been found to increase occupant satisfaction. It is how the difference between internal and external conditions is felt that is more important than the actual temperatures achieved. In fact, air conditioned buildings have been associated with decreased occupant wellbeing (Steemers & Manchanda, 2010). Research has shown that even in mild summers recommended summer comfort temperatures and overheating thresholds (26 C in bedrooms; 28 C in living rooms, offices and schools (CIBSE 2005; 2006)) are already being exceeded by more than 1% of occupied houses studied in London (Beizaee et al, 2013). New buildings need to be future-proofed, ensuring that internal temperatures can be maintained at a healthy, comfortable level for occupants, today and in the future. Design measures to achieve this include avoiding full height glazing or south-facing single aspect flats. Overheating is not just caused by well insulated buildings, but through a combination of internal heat gains, lack of solar shading, and badly designed or absent ventilation. Incorporating solar shading, combined with good ventilation are crucial adaptation strategies in both new build and refurbishments. While the addition of external shading can cause significant design challenges, other design responses such as the use of low energy practices, such as the specification of energy efficient appliances and improvement of lighting, can also help reduce unwanted internal heat gains. In Mediterranean traditions, taller floor to ceiling heights (greater than 2.7 metres) are useful for allowing the natural stratification. The presence of thermal mass in buildings can also provide summer cooling of 3–5 C, generating significant decreases in summer cooling energy demand (Hacker et al, 2008). This is only possible if secure night cooling is implemented to release built-up heat from the daytime, as failure to do so may cause overheating. When refurbishing, covering up solid walls with insulation can decrease the available thermal mass of existing buildings meaning internal wall insulation upgrades need to be considered carefully to ensure thermal comfort in a warming climate. If buildings are not able to be easily adapted to extreme temperatures, occupants may resort to ad hoc installation of air conditioning units, generating significant increases in a building’s typical energy use (Hacker et al, 2005). Air conditioning units also operate by ‘dumping’ excess heat outside the building, which only serves to further increase external temperatures and exacerbate the Urban Heat Island effect (Tremeac et al, 2012; Vardoulakis & Heaviside, 2012), these units should therefore be avoided.
INSIGHTS - URBAN OVERHEATING
33

NEW POLICY CM29.1 MANAGING OVERHEATING AND AIR CONDITIONING New buildings, extensions and alterations to existing buildings (including changes of use) will be designed to minimise the risk of internal overheating both now and taking account of future climate change. The design approach should follow the sequential cooling hierarchy below:
1. Minimise internal heat generation through energy efficient design (lighting, heating, etc)
2. Reduce the amount of heat entering a building in summer (addressing orientation, shading, reflectivity, fenestration, insulation and by incorporating green roofs/urban greening)
3. Manage the heat within the building through exposed internal thermal mass and high ceilings
4. Passive ventilation (e.g. cross ventilation, passive stack ventilation, night purging)
5. Mechanical ventilation (where practicable this should be provided in localised areas where required to supplement the above measures rather than throughout the building)
6. Active cooling systems (ensure they are the lowest carbon options; where practicable this should be provided in localised areas where required to supplement the above measures rather than throughout the building)
Applicants are required to demonstrate to the council’s satisfaction that they are unable to comply with each step of the hierarchy before they can move to the next. Where it is used, air conditioning will be conditioned to ensure its use and energy demand are minimised, and adverse effects are avoided. For major developments, and those highlighted as social and community land uses, applicants must demonstrate that the risk of overheating has been addressed effectively in all areas by providing internal temperature modelling (using dynamic simulation software and taking climate change into account) as part of the planning application. Applications for air conditioning units, will need to demonstrate that all other design measures set out above have been assessed and where appropriate implemented before new air conditioning units will be approved.
RECOMMENDATIONS OVERHEATING
This hierarchy is based on London Plan Policy 5.9. It requires developments to incorporate measures which will ensure adaptation to rising summer temperatures likely over their lifetimes, while minimising , as far as practicable, the need for active cooling systems - which are energy hungry, increase CO2 emissions, emit significant heat, have negative visual and amenity impacts and could make buildings dependent on them increasingly expensive to operate.
The council already requires modelling of internal temperatures for major applications where there are significant concerns about overheating; adoption of this policy will strengthen the basis for securing more robust modelling to ensure that the risk of overheating is mitigated and air conditioning units reduced.
Modelling requirements will be explained in the text supporting this Policy or in a supplementary planning document. It will include requirements to use the latest climate projections (e.g. UKCP09 as of 2013) and model performance for design summer years. Use of adaptive comfort standards (ASHRAE Adaptive Standard 55-2010, and standard BS EN 15251:2007) or non-adaptive models (CIBSE Guide A (2006) overheating criteria).
Proposals for conversion and adaptation of existing buildings may have more limited options for passive cooling. The council will take this into account when evaluating how such schemes have complied with the policy. However, particularly in new buildings there will be opportunities to avoid or minimise the necessity for them. Air-conditioning units can result in adverse impacts on visual amenity, noise, vibration, the urban heat island and energy use.
Uses in the C2, C2A and D1 classes.
34
Refer also to policy CM28.8 in the Design Booklet on Plant and Machinery

This booklet is part of the informal consultation for developing the statutory policies in Westminster’s local plan. It builds on previous consultation on the City Management Plan. Further information can be found at westminster.gov.uk/planning-policy.
This booklet only includes the proposed policy. However, the Westminster’s local plan will include supporting text. This supporting text includes:
• Introductory text, setting out the background to the topic.
• Policy application: guidance as to how the policy will be applied, including details of how things will be measured or calculated etc.
• Reasoned justification: this is an explanation required by law to accompany a policy, setting out why a policy is applied.
• Glossary definitions: the statutory definitions used for terms that are included in the policies.
If you wish to discuss the issues raised in this booklet with somebody, please telephone 020 7641 2503.
Have Your Say Reading List To comment on anything in this booklet, please email [email protected] or write to us at: City Planning 11th Floor Westminster City Hall 64 Victoria Street London SW1E 6QP Your comments will form part of the statutory record of consultation and will be made available on our website and to the public. Your contact details will not be made available, but we will use them to stay in touch with you about future policy development. If you do not want us to stay in touch, please let us know in your response.
The London Offices Crane Survey, (Winter 2013) Drivers Jonas Deloitte Capacity of Central London’s Energy Infrastructure (January 2013) British Council Offices West End Commission Report (30 April 2013) Retrofitting Historic Buildings (2013) Westminster City Council Improving Historic Soho’s Environmental Performance (February 2013) Sturgis Carbon Profiling Carbon Policy Feasibility Assessment (2013) Arup Addendum note to Carbon Policy Feasibility Assessment (August 2014) Arup Zero Carbon Hub resources which can be downloaded from the Zero Carbon Hub website Westminster’s Decentralised Energy Masterplan (2014) Parsons Brinkerhoff Power [To be published]
Images: p7, Relative indicative power demand, UK Power Networks; p10 “Pumphouse, Pimlico District Heating Undertaking”, (2012) Jodi Squirmelia used under a Creative Commons Attribution-NonCommercial-ShareAlike license 2.0 Generic http://creativecommons.org/licenses/by-nc-sa/2.0/legalcode
35