Developing of climate data for building simulation with future weather conditions in a danish...
12
Page 1 of 12 ABSTRACT Today, climate models are used frequently to describe past, current or future climate conditions in par- ticular building simulation. A research study of how future climate change will affect the future indoor environment and buildings energy use in a Danish context has been conducted. To fulfil this research study, information of how climate models are developed are needed as well. The research study includes an objective descriptive approach from both Danish and global research of the given topic. The gathered information from the publications is evaluated with respect to indicators for the quality of the journals as well as the authors. The method used for development of the Danish design reference year, is not clear, and to have a full knowledge of how the climate change will affect building simulation in a Danish context, further research is needed. This research for development of a new Danish weather file will require both a descriptive and analytical research. 1 INTRODUCTION In many ways, it is desired to could have an ac- curate model for weather conditions and future climate change. This could be for a shorter or a longer period, and could be used for projection of a building’s energy consumption over its lifetime or the indoor environment under future climate conditions. These climate models are used fre- quently to describe past, current or future climate conditions. This has led to the question: “What influence has weather data on building simula- tion, and how can future climate change affect building simulation performance in a Danish con- text?” To answer this research question a litera- ture research has been conducted. When doing research, there are different methods and approaches there could be used. Depending on the system of inquiry, a quantitative, qualita- tive or mixed method approach should be used. The quality of the executed research is depending on that, the chosen research method is clear, and that objectivity is high throughout the research project. Inclusion of publications and work done by other researchers is important to require new knowledge and back up assumptions in the re- search project. To evaluate the quality of these publications, certain indicators can guide the re- searcher to evaluate if the information gathered is appropriate or not. 2 RESEARCH METODS System of inquiry and research methods When a researcher is making a research design, the particular research design frame is made of the researcher’s own assumptions of how the na- ture affects the reality of the given topic, and how to understand it. These assumptions is defined as “system of inquiry” (Polkinghorne 1983) or as a “paradigm” (Denzin, Lincoln 1998). Both of them includes a complete picture or package of large groups of research and represents the whole process from the beginning to the end. When a researcher is researching a new field, and estab- lishing a new paradigm, prior understanding is to be reconstructed. This process of generating new understanding and establishing new paradigm is difficult, time consuming and met with much re- sistance (Kuhn 1962). In order to require a wide field of information, input from qualitative, quan- titative or mixed methods can be used. “Quantitative research” is based on measure- ment of quantity or amount (Kothari, ebrary 2004). This research method is often associated with systematic empiric investigations or statis- tic, mathematic or computational techniques. When having phenomena there can be hard to ex- press in terms of quantity, but is relating to qual- ity or kind, “qualitative research” is concerned. An example could be investigation of reasons for human behaviour (why some people are moti- vated to think or do things in a certain way and Developing of climate data for building simulation with future weather conditions in a Danish context Rasmus Madsen and Casper Thalund Hansen Aarhus University, Department of Engineering, Denmark Project 1 – Research Methods in Civil and Architectural Engineering, master’s degree program, fall 2015
-
Upload
rasmus-madsen -
Category
Engineering
-
view
119 -
download
0
Transcript of Developing of climate data for building simulation with future weather conditions in a danish...

Page 1 of 12
ABSTRACT
Today, climate models are used frequently to describe past, current or future climate conditions in par-ticular building simulation. A research study of how future climate change will affect the future indoor environment and buildings energy use in a Danish context has been conducted. To fulfil this research study, information of how climate models are developed are needed as well. The research study includes an objective descriptive approach from both Danish and global research of the given topic. The gathered information from the publications is evaluated with respect to indicators for the quality of the journals as well as the authors. The method used for development of the Danish design reference year, is not clear, and to have a full knowledge of how the climate change will affect building simulation in a Danish context, further research is needed. This research for development of a new Danish weather file will require both a descriptive and analytical research. 1 INTRODUCTION
In many ways, it is desired to could have an ac-curate model for weather conditions and future climate change. This could be for a shorter or a longer period, and could be used for projection of a building’s energy consumption over its lifetime or the indoor environment under future climate conditions. These climate models are used fre-quently to describe past, current or future climate conditions. This has led to the question: “What influence has weather data on building simula-tion, and how can future climate change affect building simulation performance in a Danish con-text?” To answer this research question a litera-ture research has been conducted.
When doing research, there are different methods and approaches there could be used. Depending on the system of inquiry, a quantitative, qualita-tive or mixed method approach should be used. The quality of the executed research is depending on that, the chosen research method is clear, and that objectivity is high throughout the research project. Inclusion of publications and work done by other researchers is important to require new knowledge and back up assumptions in the re-search project. To evaluate the quality of these publications, certain indicators can guide the re-searcher to evaluate if the information gathered is appropriate or not.
2 RESEARCH METODS
System of inquiry and research methods When a researcher is making a research design, the particular research design frame is made of the researcher’s own assumptions of how the na-ture affects the reality of the given topic, and how to understand it. These assumptions is defined as “system of inquiry” (Polkinghorne 1983) or as a “paradigm” (Denzin, Lincoln 1998). Both of them includes a complete picture or package of large groups of research and represents the whole process from the beginning to the end. When a researcher is researching a new field, and estab-lishing a new paradigm, prior understanding is to be reconstructed. This process of generating new understanding and establishing new paradigm is
difficult, time consuming and met with much re-sistance (Kuhn 1962). In order to require a wide field of information, input from qualitative, quan-titative or mixed methods can be used. “Quantitative research” is based on measure-ment of quantity or amount (Kothari, ebrary 2004). This research method is often associated with systematic empiric investigations or statis-tic, mathematic or computational techniques. When having phenomena there can be hard to ex-press in terms of quantity, but is relating to qual-ity or kind, “qualitative research” is concerned. An example could be investigation of reasons for human behaviour (why some people are moti-vated to think or do things in a certain way and
Developing of climate data for building simulation with future weather
conditions in a Danish context
Rasmus Madsen and Casper Thalund Hansen
Aarhus University, Department of Engineering, Denmark Project 1 – Research Methods in Civil and Architectural Engineering, master’s degree program, fall 2015
Page 2 of 12
other people in another way), it are called “Moti-vation research” there is a type of qualitative re-search (Kothari, ebrary 2004). Quantitative and qualitative research is however not as discrete as they appear, and should be viewed as different ends of a continuum (Newman, Benz 1998). A study could be more qualitative than quantitative or vice versa. If placed in the middle of this con-tinuum, the approach “mixed methods research” is concerned. Here, the main assumption is that a combination of qualitative and quantitative ap-proaches will provide a more complete under-standing of the research problem, than either ap-proach alone (Creswell 2014). The researcher starts a project with certain as-sumptions about what they will learn and how they will learn it during their inquiry, and these assumptions are called knowledge claims (Cre-swell 2003). At the start of a project, the re
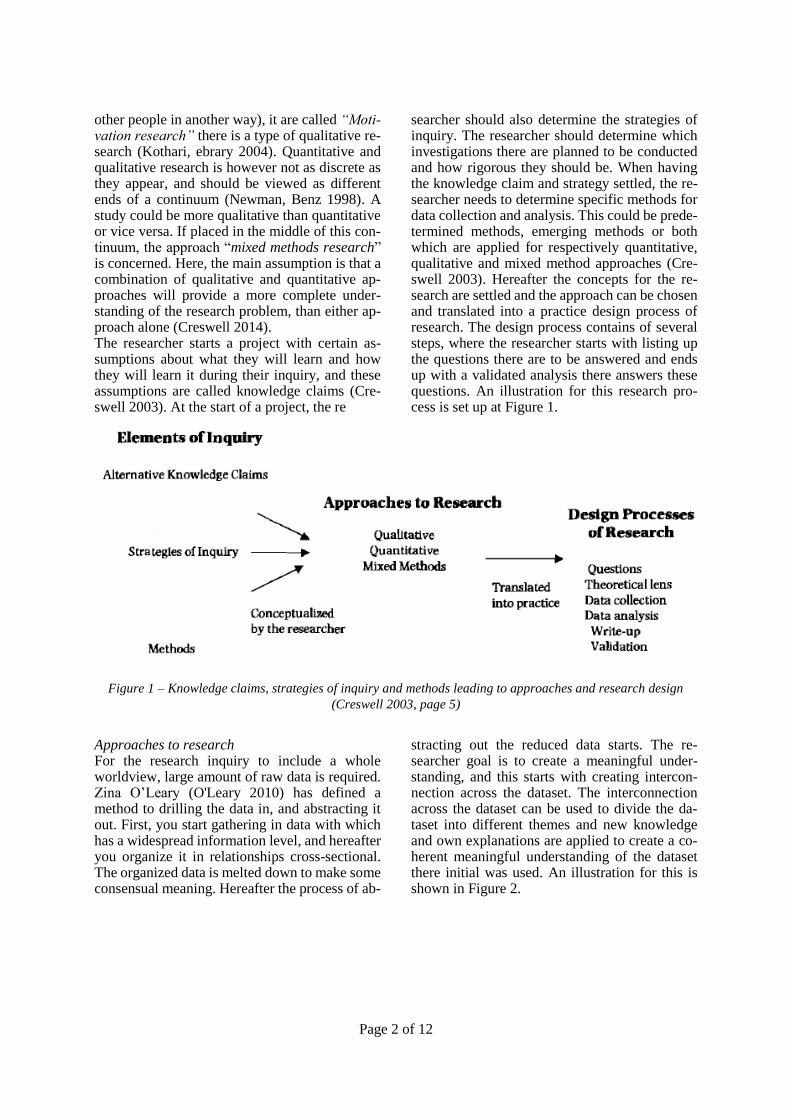
searcher should also determine the strategies of inquiry. The researcher should determine which investigations there are planned to be conducted and how rigorous they should be. When having the knowledge claim and strategy settled, the re-searcher needs to determine specific methods for data collection and analysis. This could be prede-termined methods, emerging methods or both which are applied for respectively quantitative, qualitative and mixed method approaches (Cre-swell 2003). Hereafter the concepts for the re-search are settled and the approach can be chosen and translated into a practice design process of research. The design process contains of several steps, where the researcher starts with listing up the questions there are to be answered and ends up with a validated analysis there answers these questions. An illustration for this research pro-cess is set up at Figure 1.
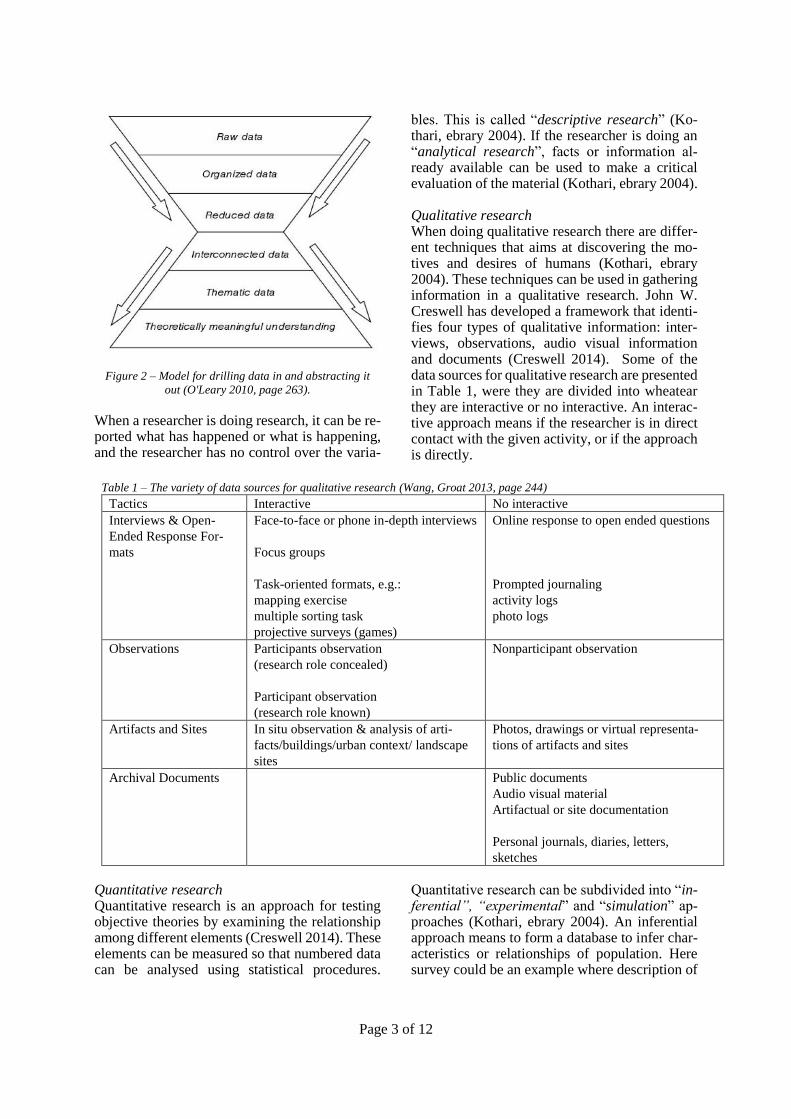
Approaches to research For the research inquiry to include a whole worldview, large amount of raw data is required. Zina O’Leary (O'Leary 2010) has defined a method to drilling the data in, and abstracting it out. First, you start gathering in data with which has a widespread information level, and hereafter you organize it in relationships cross-sectional. The organized data is melted down to make some consensual meaning. Hereafter the process of ab-
stracting out the reduced data starts. The re-searcher goal is to create a meaningful under-standing, and this starts with creating intercon-nection across the dataset. The interconnection across the dataset can be used to divide the da-taset into different themes and new knowledge and own explanations are applied to create a co-herent meaningful understanding of the dataset there initial was used. An illustration for this is shown in Figure 2.
Figure 1 – Knowledge claims, strategies of inquiry and methods leading to approaches and research design
(Creswell 2003, page 5)
Page 3 of 12
Figure 2 – Model for drilling data in and abstracting it
out (O'Leary 2010, page 263).
When a researcher is doing research, it can be re-ported what has happened or what is happening, and the researcher has no control over the varia-
bles. This is called “descriptive research” (Ko-thari, ebrary 2004). If the researcher is doing an “analytical research”, facts or information al-ready available can be used to make a critical evaluation of the material (Kothari, ebrary 2004). Qualitative research When doing qualitative research there are differ-ent techniques that aims at discovering the mo-tives and desires of humans (Kothari, ebrary 2004). These techniques can be used in gathering information in a qualitative research. John W. Creswell has developed a framework that identi-fies four types of qualitative information: inter-views, observations, audio visual information and documents (Creswell 2014). Some of the data sources for qualitative research are presented in Table 1, were they are divided into wheatear they are interactive or no interactive. An interac-tive approach means if the researcher is in direct contact with the given activity, or if the approach is directly.
Table 1 – The variety of data sources for qualitative research (Wang, Groat 2013, page 244)
Tactics Interactive No interactive
Interviews & Open-
Ended Response For-
mats
Face-to-face or phone in-depth interviews
Focus groups
Task-oriented formats, e.g.:
mapping exercise
multiple sorting task
projective surveys (games)
Online response to open ended questions
Prompted journaling
activity logs
photo logs
Observations Participants observation
(research role concealed)
Participant observation
(research role known)
Nonparticipant observation
Artifacts and Sites In situ observation & analysis of arti-
facts/buildings/urban context/ landscape
sites
Photos, drawings or virtual representa-
tions of artifacts and sites
Archival Documents Public documents
Audio visual material
Artifactual or site documentation
Personal journals, diaries, letters,
sketches
Quantitative research Quantitative research is an approach for testing objective theories by examining the relationship among different elements (Creswell 2014). These elements can be measured so that numbered data can be analysed using statistical procedures.
Quantitative research can be subdivided into “in-ferential”, “experimental” and “simulation” ap-proaches (Kothari, ebrary 2004). An inferential approach means to form a database to infer char-acteristics or relationships of population. Here survey could be an example where description of
Page 4 of 12
trends, views or opinions of a population is made by studying a sample of that population. A survey can be conducted using structured interviews or questionnaires for which the intent of generaliz-ing a sample to a population (Fowler 2009). An experimental approach strides for determin-ing, if a specific action influences an outcome or result (Creswell 2014). This could be assessed by providing a specific action or treatment to one group and abstain it from another, and determine how both groups score on an outcome. A simulation approach constructs an artificial en-vironment, ex a building or a room, where rele-vant information or data can be generated (Ko-thari, ebrary 2004). With a simulation, it is al-lowed to observe a system, or its subsystem, in a controlled environment. The simulation approach can be useful in building models for understand-ing and investigating future conditions. The sim-ulation approach is useful where the experiments would be to detailed, and has its advantages in a
period of a year can be simulated in a few minutes or even seconds. In an economical perspective, simulations can give a much cheaper answer to the given task, than to build a physical model and test over the given period. Mixed methods research Mixed methods involve combining or integrating quantitative and qualitative research and data into a study (Creswell 2014). When quantitative and qualitative data are implemented into a research database, it could be used to check the validity or explain tendencies of the other. A well-known combination of subjective and ob-jective data is the comforts equation by P.O. Fanger (1970). Here many experiments with the subjective feeling of an indoor environment in combination with the measured parameters is set to give a general equation for thermal comfort (Fanger 1970).
3 QUALITY OF A LITERATURE REVIEW
All types of scientific research’s purpose are to
make progress for each specific field of science.
Scientific research is communicated through dif-
ferent types of literature; such as papers, tech-
nical reports, books and conference proceedings.
The scientific literature can be split into two basis
categories for primary and secondary literature.
Primary literature is publications of original re-
search, and can be published in the listed types of
literature including theses and dissertations. The
secondary literature publishes condense for the
already known knowledge, which could be pre-
sented in textbooks, manuals, treatises and re-
views which collection of research for a specific
topics (Humboldt State University 2015). Find-
ing the right literature for a specific task can be a
time-consuming process, and the amount of liter-
ature for some topics could be overwhelming. To
efficient reading of scientific papers, Hanson
(Hanson 2000) has made a guide that includes
five steps for how to read a paper. These five
steps are shown in Table 2. The most important
initial condition for reviewing scientific papers,
is always why are you doing it? Strategies to re-
view a scientific paper should be different, if it
should be used for an overview, or it should be
used for challenging the method and arguments
in the papers.
Table 2 – How to read a paper (Hanson 2000)
Preparation:
Quiet place
Pencil, paper, photocopy of article
Deciding what to read:
Read title, abstract
Read it, file it or skip?
Read for breadth:
What did they do?
Skim introduction, headings, graphics,
definitions, conclusions and bibliog-
raphy.
Consider the credibility
How useful is it?
Decide whether to go on
Read in depth:
How did they do it?
Challenge their arguments
Examine assumptions
Examine methods
Examine statics
Examine reasoning and conclusion
How can I apply their approach to my
work
Take notes:
Make notes as you read
Highlight major points
Note new terms and definitions
Summarize tables and graphs
Write a summary

Page 5 of 12
Universities are doing the main part of research,
but also governments and NGOs are doing some.
Objectivity is key element of research, and the re-
search should be free from financial conflicts and
interest. Objectivity should protect the scientist
and university, and most important should the
public confidence and trust for taxes sponsor the
research (The University of Mississippi 2011).
The scientific papers are very important in order
to publish the actual science, and distribute the
knowledge in a global perspective. The journals
have a high impact because of the procedure with
peer review of independent experts. The major
journals with a high acknowledgement receive
more articles than they can publish. It is difficult
to get science published in these major journals,
but that can also be a quality check for the actual
scientific research quality.
There have been written overwhelming many sci-
entific papers over the years and every year dif-
ferent journals publish new papers. In 2006 an es-
timated 1.3 million papers were published in
23,750 journals (Lauri, Björk et al. 2009). Today
it is possible to generate a scientific paper with
yourself as author, reference and all general re-
quirements for layout for a scientific paper online
(Stribling, Krohn et al. 2005). Some homepages
are willing to publish the work for payment, and
often they do not have any review of the actual
work. In the search for papers in the critical re-
view study, there has been found a paper from a
publisher called Hindawi Publishing Corpora-
tion, which uses the “Authors-pays model”. This
paper contains method for generating typical
metrological year (Haixiang Zang, Qingshan Xu
et al. 2012). The method in the paper for creating
typical metrological year, are looking similar to
the methods described in other papers from more
recognised journals. Richard Poynder (2012)
comments on the business model for the Hindawi
Publishing Corporation, and finds some critique
that he thinks could have influence on the quality.
"More broadly, we have to conclude that, how-
ever ethical and effective a publisher Hindawi it-
self may be, the author-side gold OA model may
turn out to be a flawed model, since it can too
easily be exploited by disreputable (predatory)
publishers — to the detriment of the global re-
search endeavor” (Poynder 2012).
Consistency for publishing the research at an
open access model will be that the scientific qual-
ity could be lowered and other researchers avoid
the knowledge because of the publication model
and publisher of the journal.
With the high yearly amount of published papers
and fluctuating quality of journals, some indica-
tors for the quality of journals and authors are
needed.
Impact metrics
Impact metrics are an indicator for the citations
of the journal. One of the most common metrics
is the “Impact Factor”, which measures the aver-
age citations per publication, and is published
every year by Thomson Reuters. A rule of thumb
for research in buildings states that in impact fac-
tor below 1 is low and above 3 is excellent. In
other areas, the conditions may be otherwise. An-
other common metric is the Source-Normalized
Impact per Paper (SNIP) that measures the cita-
tions relative to average for discipline (an SNIP
> 1 means journals are cited more than average
for the field). Every year Elsevier makes a list of
21,900 journals SNIP, IPP and SJR metrics (Else-
vier B.V. 2015). At each journals homepage it is
different if they provide an impact metric or not.
Thomson Reuters does also keep a list of the
world’s most important and influential journals
(Testa 2012). This is a way to have a database of
qualified and serious journals. Another list of this
kind is the Danish bibliometric list (Uddannelses-
og Forskningsministeriet 2015), there contains a
research indicator for journals.
Authors H-index
The h-index is a measure of how productive an
author is, and what citation impacts his publica-
tions has. The h-index indicates the authors most
cited papers and the number of citations they
have in other publications. The definition of the
h-index is that a scholar with an index of h has
published h papers, which has been cited in other
papers at least h times (McDonald 2005). An au-
thors h-index can be checked at Google Scholar,
there is a database on citations of publications.
For it to be possible to check an authors h-index
it is required for him to have a user profile, that
keeps track of published papers and citations.

Page 6 of 12
The total number of papers does not account for
the quality of the scientific work, while the num-
ber of scientific citations is a more appropriate in-
dicator, where the h-index is intended to measure
the quality and quantity of scientific output.
There is however a number of situations where
the h-index may provide misleading information:
The citation level and behaviour are field-de-
pendent, which makes comparison across disci-
plines difficult. The h-index can be manipulated
through self-citations, or even computer-gener-
ated publications. Google Scholar does not con-
tain all publications with their respective authors,
and therefore not all citations. If an authors h-in-
dex cannot be found, it can either mean that there
are no citations the authors work, or it is just not
registered.
In context to the critical literature review that is
done here, an exercise of making a review has
been done, and is submitted in Appendix A – Ex-
ercise with reviews.
4 LITERATURE REVIEW
In Denmark, all simulations for buildings perfor-mance must use the weather file Danish Design Reference Year 2013 (BR10, 2014). The Danish Meteorological Institute (DMI) collects data from different weather stations in Denmark. DMI has in collaboration with the Danish building re-search institute developed and published the Dan-ish Design Reference Year (DDRY) (Wang, Scharling et al. 2013b). This development is re-ported in several technical reports for DMI on the establishment of a new reference year. In 2012, there were published a new Design Reference Year (DRY), which contains observations from DMI's station network, where the parameters global radiation, relative humidity, temperature and wind speed was included (Wang, Scharling et al. 2012). The new DRY were made for calcu-lation in the solar energy sector, because of the old DRY (1975-1990), no longer represented the current climate conditions (Wang, Scharling et al. 2013a). In 2013 a DDRY weather file was pub-lished, this was no longer only for the solar en-ergy sector but also for national building permits. All building permits from 2014 are required to use the newest DDRY, which are hourly-based
climate data (Wang, Scharling et al. 2013b). The Technical rapport from Wang et al (Wang, Schar-ling et al. 2013a) gave no indication of how and why the data for the new DDRY were selected, because of lack of references to relevant stand-ards for how to statistic generate a design refer-ence year. The DDRY is developed for different months of the period 2001-2010. The typical months for the DDRY is set up in Table 3, and no clear consensus is seen between the choosing months. The only expression for selection of the exact months is this passage:
“Each month has been selected with the climato-logical premises in mind, that it should exhibit typical climatological variation. This means no extremes, yet some variation is indeed tolerated” (Wang, Scharling et al. 2013b).
One of the problems with making science without any described method is to reproduce the refer-ence year. The reference year is produced by opinions from the authors, and that could be dif-ferent if other has done the same work.
Table 3 – The twelve typical months from the period 2001-2010, used for DDRY (Wang, Scharling et al. 2013b, page 6)
Month Jan Feb Mar Apr May Jun Jul Aug Sep Oct Nov Dec
Year 2009 2009 2006 2010 2006 2005 2009 2009 2009 2008 2010 2009
In 2015, there is an investigation for the Danish climate data impacts on energy performance for solar collectors done by Janne Dragsted et al. (Dragsted, Furbo et al. 2015). The investigation have shown the difference for using the old Dan-ish reference year from the number of years ex-tending 1975-1990 and local weather data from 2002-2010. The investigation shows the im-portance of using the newest weather data, but also the difference for using local weather data
compared with a national weather data. The devi-ation for using local weather data compared with old reference year gave a 14 % higher energy pro-duction in the solar collectors. The investigation is missing to compare the new DDRY with the local data from the same period 2002-2010. That would have shown the differences between using local weather data compared with the national DDRY on building simulation.
Page 7 of 12
It has not been possible to find any other pub-lished paper for how climate change influences building simulations or how the DDRY are com-posed. In global perspective there are several re- searches for the impact of climate change for building simulation, and how different types of climate data are composed with a scientific repro-ducible method.
In Poland 2004, there was developed a typical meteorological year (TMY) for the period 1971 to 2000. This are compared by Grudzi ska and Jakrusik (Grudzi ska, Jakusik 2015) with more actual climate data from 2001-2012. Results shows that the energy consumption, simulated in BSim for cooling, in a residential building was
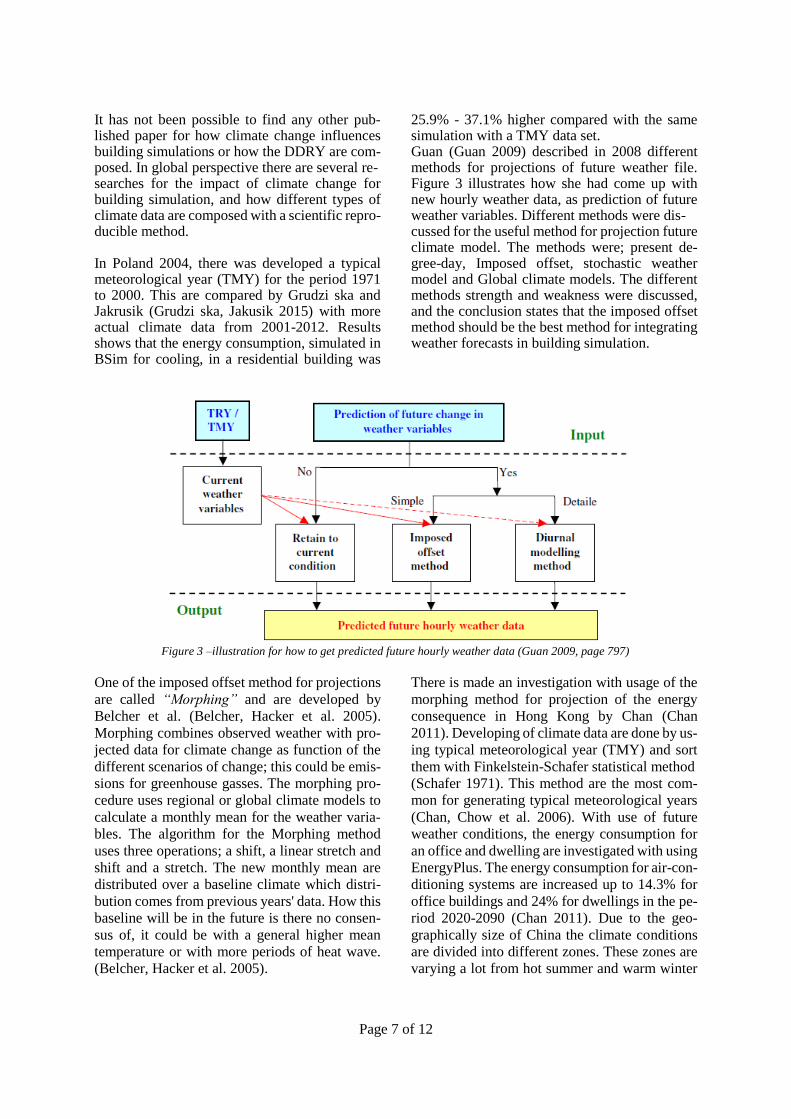
25.9% - 37.1% higher compared with the same simulation with a TMY data set. Guan (Guan 2009) described in 2008 different methods for projections of future weather file. Figure 3 illustrates how she had come up with new hourly weather data, as prediction of future weather variables. Different methods were dis- cussed for the useful method for projection future climate model. The methods were; present de-gree-day, Imposed offset, stochastic weather model and Global climate models. The different methods strength and weakness were discussed, and the conclusion states that the imposed offset method should be the best method for integrating weather forecasts in building simulation.
One of the imposed offset method for projections
are called “Morphing” and are developed by
Belcher et al. (Belcher, Hacker et al. 2005).
Morphing combines observed weather with pro-
jected data for climate change as function of the
different scenarios of change; this could be emis-
sions for greenhouse gasses. The morphing pro-
cedure uses regional or global climate models to
calculate a monthly mean for the weather varia-
bles. The algorithm for the Morphing method
uses three operations; a shift, a linear stretch and
shift and a stretch. The new monthly mean are
distributed over a baseline climate which distri-
bution comes from previous years' data. How this
baseline will be in the future is there no consen-
sus of, it could be with a general higher mean
temperature or with more periods of heat wave.
(Belcher, Hacker et al. 2005).
There is made an investigation with usage of the
morphing method for projection of the energy
consequence in Hong Kong by Chan (Chan
2011). Developing of climate data are done by us-
ing typical meteorological year (TMY) and sort
them with Finkelstein-Schafer statistical method
(Schafer 1971). This method are the most com-
mon for generating typical meteorological years
(Chan, Chow et al. 2006). With use of future
weather conditions, the energy consumption for
an office and dwelling are investigated with using
EnergyPlus. The energy consumption for air-con-
ditioning systems are increased up to 14.3% for
office buildings and 24% for dwellings in the pe-
riod 2020-2090 (Chan 2011). Due to the geo-
graphically size of China the climate conditions
are divided into different zones. These zones are
varying a lot from hot summer and warm winter
Figure 3 –illustration for how to get predicted future hourly weather data (Guan 2009, page 797)
Page 8 of 12
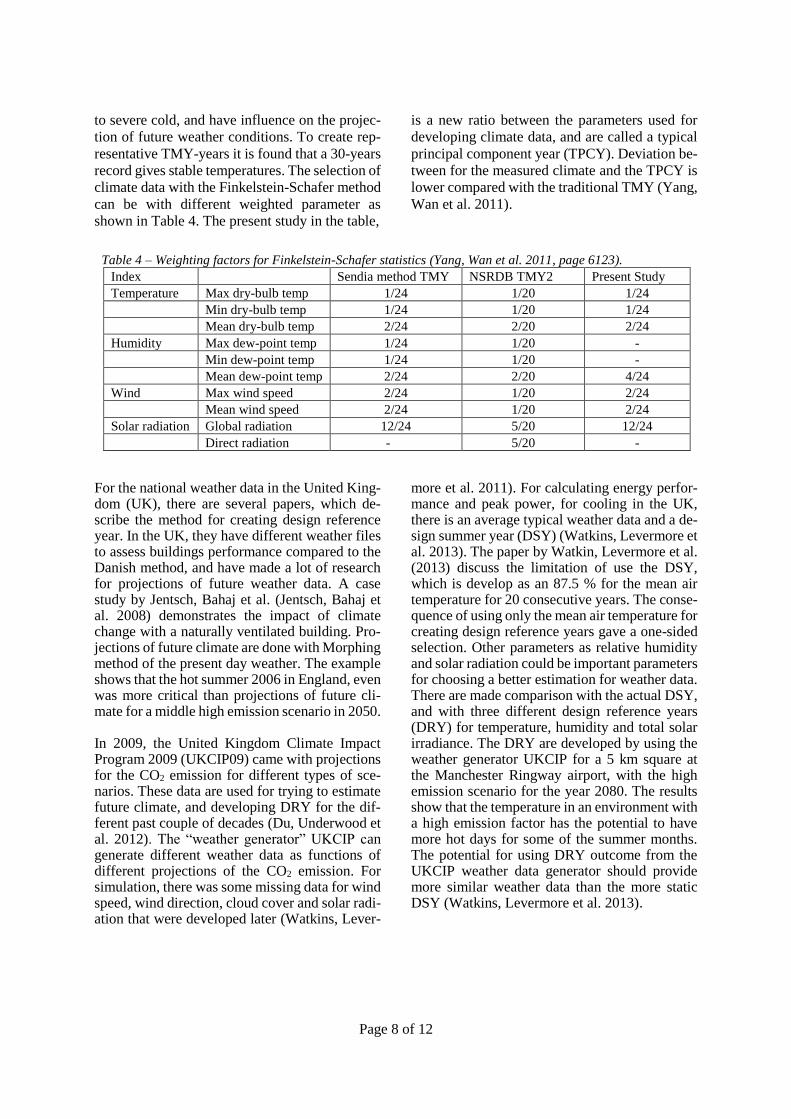
to severe cold, and have influence on the projec-
tion of future weather conditions. To create rep-
resentative TMY-years it is found that a 30-years
record gives stable temperatures. The selection of
climate data with the Finkelstein-Schafer method
can be with different weighted parameter as
shown in Table 4. The present study in the table,
is a new ratio between the parameters used for
developing climate data, and are called a typical
principal component year (TPCY). Deviation be-
tween for the measured climate and the TPCY is
lower compared with the traditional TMY (Yang,
Wan et al. 2011).
For the national weather data in the United King-dom (UK), there are several papers, which de-scribe the method for creating design reference year. In the UK, they have different weather files to assess buildings performance compared to the Danish method, and have made a lot of research for projections of future weather data. A case study by Jentsch, Bahaj et al. (Jentsch, Bahaj et al. 2008) demonstrates the impact of climate change with a naturally ventilated building. Pro-jections of future climate are done with Morphing method of the present day weather. The example shows that the hot summer 2006 in England, even was more critical than projections of future cli-mate for a middle high emission scenario in 2050. In 2009, the United Kingdom Climate Impact Program 2009 (UKCIP09) came with projections for the CO2 emission for different types of sce-narios. These data are used for trying to estimate future climate, and developing DRY for the dif-ferent past couple of decades (Du, Underwood et al. 2012). The “weather generator” UKCIP can generate different weather data as functions of different projections of the CO2 emission. For simulation, there was some missing data for wind speed, wind direction, cloud cover and solar radi-ation that were developed later (Watkins, Lever-
more et al. 2011). For calculating energy perfor-mance and peak power, for cooling in the UK, there is an average typical weather data and a de-sign summer year (DSY) (Watkins, Levermore et al. 2013). The paper by Watkin, Levermore et al. (2013) discuss the limitation of use the DSY, which is develop as an 87.5 % for the mean air temperature for 20 consecutive years. The conse-quence of using only the mean air temperature for creating design reference years gave a one-sided selection. Other parameters as relative humidity and solar radiation could be important parameters for choosing a better estimation for weather data. There are made comparison with the actual DSY, and with three different design reference years (DRY) for temperature, humidity and total solar irradiance. The DRY are developed by using the weather generator UKCIP for a 5 km square at the Manchester Ringway airport, with the high emission scenario for the year 2080. The results show that the temperature in an environment with a high emission factor has the potential to have more hot days for some of the summer months. The potential for using DRY outcome from the UKCIP weather data generator should provide more similar weather data than the more static DSY (Watkins, Levermore et al. 2013).
Table 4 – Weighting factors for Finkelstein-Schafer statistics (Yang, Wan et al. 2011, page 6123).
Index Sendia method TMY NSRDB TMY2 Present Study
Temperature Max dry-bulb temp 1/24 1/20 1/24
Min dry-bulb temp 1/24 1/20 1/24
Mean dry-bulb temp 2/24 2/20 2/24
Humidity Max dew-point temp 1/24 1/20 -
Min dew-point temp 1/24 1/20 -
Mean dew-point temp 2/24 2/20 4/24
Wind Max wind speed 2/24 1/20 2/24
Mean wind speed 2/24 1/20 2/24
Solar radiation Global radiation 12/24 5/20 12/24
Direct radiation - 5/20 -
Page 9 of 12
5 EVALUATION OF THE USED RESEARCH METHODS
Literature within the field of climate data, the de-velopment of weather files, building simulation and buildings energy consumption’s dependency on future weather conditions, contains a huge amount of publications and in general very much raw data. A literature review has been made, with the intention of creating an inquiry there is as widespread as possible. The literatures within these topics are research done in different loca-tions in the world (UK, Poland and China). The information has been organized to see the inter-connection between the used methods, and a con-nection back to usage of this research in a Danish context. Most of the reviewed literature has used a quantitative approach to their research. How-ever, it has been difficult to determine which method that has been used for making the current
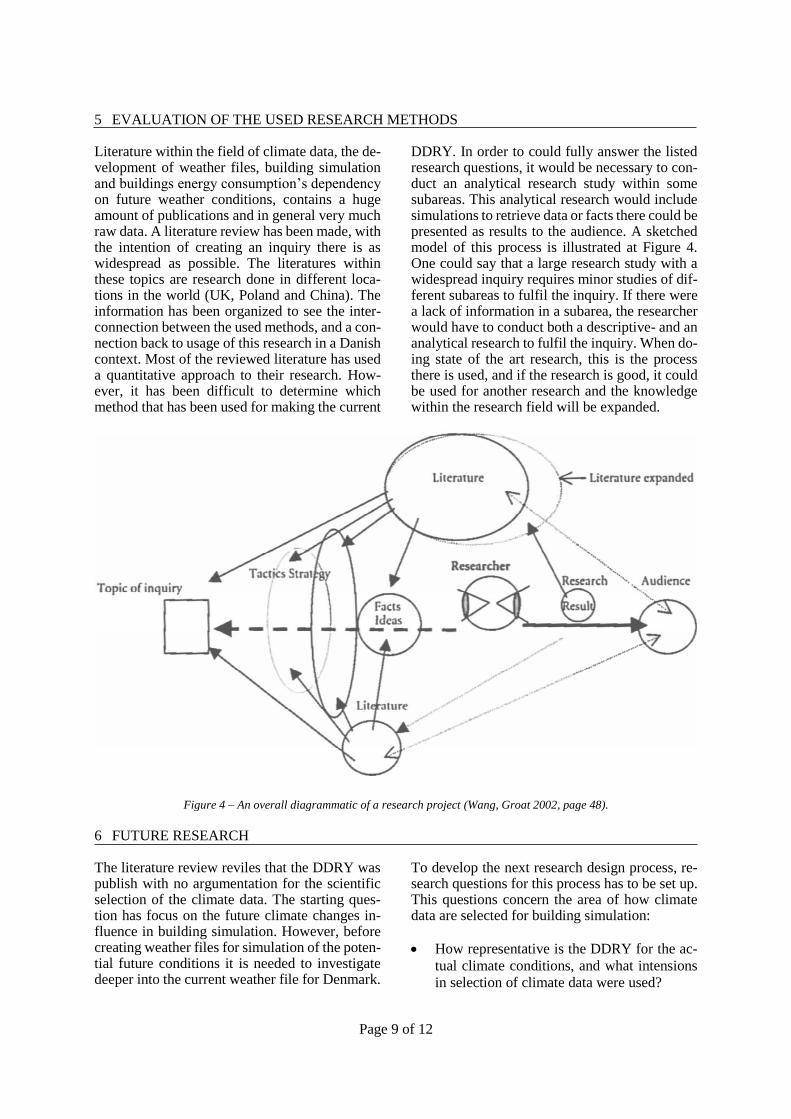
DDRY. In order to could fully answer the listed research questions, it would be necessary to con-duct an analytical research study within some subareas. This analytical research would include simulations to retrieve data or facts there could be presented as results to the audience. A sketched model of this process is illustrated at Figure 4. One could say that a large research study with a widespread inquiry requires minor studies of dif-ferent subareas to fulfil the inquiry. If there were a lack of information in a subarea, the researcher would have to conduct both a descriptive- and an analytical research to fulfil the inquiry. When do-ing state of the art research, this is the process there is used, and if the research is good, it could be used for another research and the knowledge within the research field will be expanded.
Figure 4 – An overall diagrammatic of a research project (Wang, Groat 2002, page 48).
6 FUTURE RESEARCH
The literature review reviles that the DDRY was publish with no argumentation for the scientific selection of the climate data. The starting ques-tion has focus on the future climate changes in-fluence in building simulation. However, before creating weather files for simulation of the poten-tial future conditions it is needed to investigate deeper into the current weather file for Denmark.
To develop the next research design process, re-search questions for this process has to be set up. This questions concern the area of how climate data are selected for building simulation:
How representative is the DDRY for the ac-
tual climate conditions, and what intensions
in selection of climate data were used?
Page 10 of 12
What is the difference between the climate
data in the DDRY and the climate data de-
veloped with a scientific method for selec-
tion like TMY or TMY2?
What influence has the priority of parame-
ters such as temperature, relative humidity,
wind speed, and solar radiation on the selec-
tion of climate data in a Danish context?
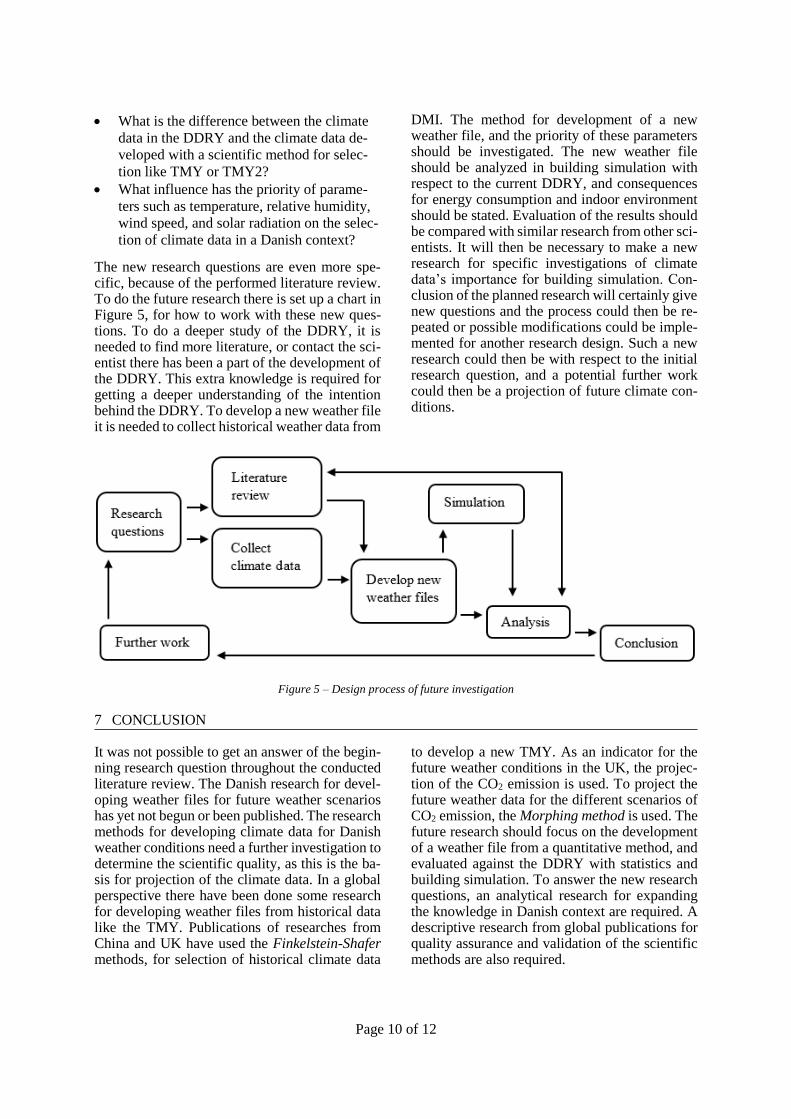
The new research questions are even more spe-cific, because of the performed literature review. To do the future research there is set up a chart in Figure 5, for how to work with these new ques-tions. To do a deeper study of the DDRY, it is needed to find more literature, or contact the sci-entist there has been a part of the development of the DDRY. This extra knowledge is required for getting a deeper understanding of the intention behind the DDRY. To develop a new weather file it is needed to collect historical weather data from
DMI. The method for development of a new weather file, and the priority of these parameters should be investigated. The new weather file should be analyzed in building simulation with respect to the current DDRY, and consequences for energy consumption and indoor environment should be stated. Evaluation of the results should be compared with similar research from other sci-entists. It will then be necessary to make a new research for specific investigations of climate data’s importance for building simulation. Con-clusion of the planned research will certainly give new questions and the process could then be re-peated or possible modifications could be imple-mented for another research design. Such a new research could then be with respect to the initial research question, and a potential further work could then be a projection of future climate con-ditions.
Figure 5 – Design process of future investigation
7 CONCLUSION
It was not possible to get an answer of the begin-ning research question throughout the conducted literature review. The Danish research for devel-oping weather files for future weather scenarios has yet not begun or been published. The research methods for developing climate data for Danish weather conditions need a further investigation to determine the scientific quality, as this is the ba-sis for projection of the climate data. In a global perspective there have been done some research for developing weather files from historical data like the TMY. Publications of researches from China and UK have used the Finkelstein-Shafer methods, for selection of historical climate data
to develop a new TMY. As an indicator for the future weather conditions in the UK, the projec-tion of the CO2 emission is used. To project the future weather data for the different scenarios of CO2 emission, the Morphing method is used. The future research should focus on the development of a weather file from a quantitative method, and evaluated against the DDRY with statistics and building simulation. To answer the new research questions, an analytical research for expanding the knowledge in Danish context are required. A descriptive research from global publications for quality assurance and validation of the scientific methods are also required.
Page 11 of 12
8 REFERENCES
BELCHER, S., HACKER, J. and POWELL, D.,
2005. Constructing design weather data for fu-
ture climates. Building Services Engineering Re-
search and Technology, 26(1), pp. 49-61.
BR10, 31.12.2014, 2014-last update, Building
Regulations 2010 7.2.1 stk. 2. Available:
http://bygningsreglemen-
tet.dk/br10_05_id107/0/42.
CHAN, A.L.S., 2011. Developing future hourly
weather files for studying the impact of climate
change on building energy performance in Hong
Kong. Energy & Buildings, 43(10), pp. 2860-
2868.
CHAN, A.L.S., CHOW, T.T., FONG, S.K.F.
and LIN, J.Z., 2006. Generation of a typical me-
teorological year for Hong Kong. Energy Con-
version and Management, 47(1), pp. 87-96.
CRESWELL, J.W., 2014. Research design:
qualitative, quantitative, and mixed methods ap-
proaches. Fourth edition, international student
edition edn. Los Angeles, Calif.: SAGE.
CRESWELL, J.W., 2003. Research design:
qualitative, quantitative, and mixed method ap-
proaches. 2. ed. edn. Thousand Oaks, Calif.:
Sage Publications.
DENZIN, N. and LINCOLN, Y., 1998. Hand-
book of Qualitative Research. Thousand Oaks,
CA: Sage.
DRAGSTED, J., FURBO, S., ANDERSEN, E.,
PERERS, B. and NIELSEN, K.P., 2015. Calcu-
lated Thermal Performance of Solar Collectors
Based on Measured Weather Data from 2001-
2010. Energy Procedia, 70, pp. 49-56.
DU, H., UNDERWOOD, C. and EDGE, J.,
2012. Generating design reference years from
the UKCP09 projections and their application to
future air-conditioning loads. Building Services
Engineering Research & Technology, 33(1), pp.
63-79.
ELSEVIER B.V., 20-12-2015, 2015-last update,
Journal Metrics. Available:http://www.journal-
metrics.com/.
FANGER, P.O., 1970. Thermal comfort: Analy-
sis and applications in environmental engineer-
ing. Copenhagen: Danish Technical Press.
FOWLER, F.J., 2009. Survey research methods.
4. ed. Thousand Oaks: Sage Publications.
GRUDZI SKA, M. and JAKUSIK, E., 2015.
The efficiency of a typical meteorological year
and actual climatic data in the analysis of energy
demand in buildings. Building Services Engi-
neering Research and Technology, 36(6), pp.
658.
GUAN, L., 2009. Preparation of future weather
data to study the impact of climate change on
buildings. Building and Environment, 44(4), pp.
793-800.
HAIXIANG ZANG, QINGSHAN XU,
PENGWEI DU and KATSUHIRO
ICHIYANAGI, 2012. A Modified Method to
Generate Typical Meteorological Years from the
Long-Term Weather Database. Hindawi Pub-
lishing Corporation.
HANSON, M.J., 6.1.2000, 2000-last update, Ef-
ficient Reading of Papers in Science and Tech-
nology. Available: http://www.cs.colum-
bia.edu/~hgs/netbib/efficientReading.pdf.
HUMBOLDT STATE UNIVERSITY,
7.12.2015, 2015-last update, Searching the Sci-
entific literature [Homepage of Humboldt State
University], [Online]. Available: http://lib-
guides.hum-
boldt.edu/c.php?g=303801&p=2029395.
JENTSCH, M.F., BAHAJ, A.S. and JAMES,
P.A.B., 2008. Climate change future proofing of
buildings?Generation and assessment of build-
ing simulation weather files. Energy & Build-
ings, 40(12), pp. 2148-2168.
KOTHARI, C.R. and EBRARY, I., 2004. Re-
search methodology: methods & techniques. 2.
rev. ed. edn. New Delhi: New Age International
(P) Ltd., Publishers.
KUHN, T.S., 1962. The structure of scientific
revolutions. Chicago: The University of Chicago
Press.
LAURI, M., BJÖRK, B. and ROOS, A., 2009.
Scientific journal publishing: yearly volume and
open access availability. Information Research,
14(1).

Page 12 of 12
MCDONALD, K., 08.11.2005, 2005-last up-
date, Physicist Proposes New Way to Rank Sci-
entific Output [Homepage of Phys.org],
[Online]. Available: http://phys.org/news/2005-
11-physicist-scientific-output.html.
NEWMAN, I. and BENZ, C.R.,1942-, 1998.
Qualitative-quantitative research methodology:
exploring the interactive continuum. Carbon-
dale: Southern Illinois University Press.
O'LEARY, Z., 2010. The essential guide to do-
ing your research project. Los Angeles: SAGE.
POLKINGHORNE, D., 1983. Methodology for
Human Sciences: Systems of Inquiry. Albany:
SUNY Press.
POYNDER, R., 17.9.2012, 2012-last update,
The OA Interviews: Ahmed Hindawi, founder of
Hindawi Publishing Corporation [Homepage of
http://www.richardpoynder.co.uk/], [Online].
Available: http://www.richard-
poynder.co.uk/Hindawi_Interview.pdf.
SCHAFER, J.M.F., 1971. Improved goodness-
of-fit tests. Oxford University Press.
STRIBLING, J., KROHN, M. and AGUAYO,
D., 18.12.2015, 2005-last update, SCIgen - An
Automatic CS Paper Generator
[Homepage of pdos.csail.mit.edu], [Online].
Available: https://pdos.csail.mit.edu/ar-
chive/scigen/.
TESTA, J., 5-2012, 2012-last update, The
Thomson Reuters journal selection process
[Homepage of Thomson Reuters], [Online].
Available: http://wokinfo.com/essays/journal-se-
lection-process/.
THE UNIVERSITY OF MISSISSIPPI, 2011-
last update, Objectivity in Research. Available:
https://www.research.olemiss.edu/coi/objecti-
vity.
UDDANNELSES- OG FORSKNINGSMINI-
STERIET, 10-2015, 2015-last update, Autori-
tetslister for serier og forlag. Available:
http://ufm.dk/forskning-og-innovation/statistik-
og-analyser/den-bibliometriske-forskningsindi-
kator/autoritetslister.
WANG, P.G., SCHARLING, M., WITTCHEN,
K.B. and KERN-HANSEN, C., 2013a. Teknisk
Rapport 13-18 2001 – 2010 Dansk Design Refe-
rence Year Supplerende datasæt.
WANG, P.G., SCHARLING, P.G., NIELSEN,
K.P., WITTCHEN, K.B. and KERN-HANSEN,
C., 2013b. Technical Report 13-19 - 2001 –
2010 Danish Design Reference Year - Reference
Climate Dataset for Technical Dimensioning in
Building, Construction and other Sectors.
WANG, P.R., SCHARLING, M. and NIELSEN,
K.P., 2012. DMI Teknisk Rapport 12-17 - 2001
– 2010 Design Reference Year for Denmark.
WANG, D. and GROAT, L.N., 2002. Architec-
tural research methods. First Edition / David
Wang, Linda N. Groat edn. Hoboken: Wiley.
WANG, D.,1954- and GROAT, L.N., 2013. Ar-
chitectural research methods. Second Edition /
David Wang, Linda N. Groat edn. Hoboken:
Wiley.
WATKINS, R., LEVERMORE, G. and PAR-
KINSON, J., 2013. The design reference year ?
a new approach to testing a building in more ex-
treme weather using UKCP09 projections.
Building Services Engineering Research &
Technology, 34(2), pp. 165-176.
WATKINS, R., LEVERMORE, G. and PAR-
KINSON, J., 2011. Constructing a future
weather file for use in building simulation using
UKCP09 projections. Building Services Engi-
neering Research & Technology, 32(3), pp. 293-
299.
YANG, L., WAN, K.K.W., LI, D.H.W. and
LAM, J.C., 2011. A new method to develop typ-
ical weather years in different climates for build-
ing energy use studies. Energy, 36(10), pp.
6121-6129.