Developing Habitat Models and Monitoring Techniques for ...
53
Developing Habitat Models and Monitoring Techniques for Nine Bird Species of Clark County, 2008 - 2013 (2005-GBBO-581-P) Elisabeth Ammon, Jen Ballard, and Jock Young Great Basin Bird Observatory
Transcript of Developing Habitat Models and Monitoring Techniques for ...

Developing Habitat Models and Monitoring Techniques for Nine Bird Species of Clark
County, 2008 - 2013
(2005-GBBO-581-P)
Elisabeth Ammon,
Jen Ballard, and Jock Young
Great Basin Bird Observatory

Project Objectives
• Establish population baselines for nine species: distribution, abundance
• Model habitats for nine species
• Establish monitoring program for landbirds
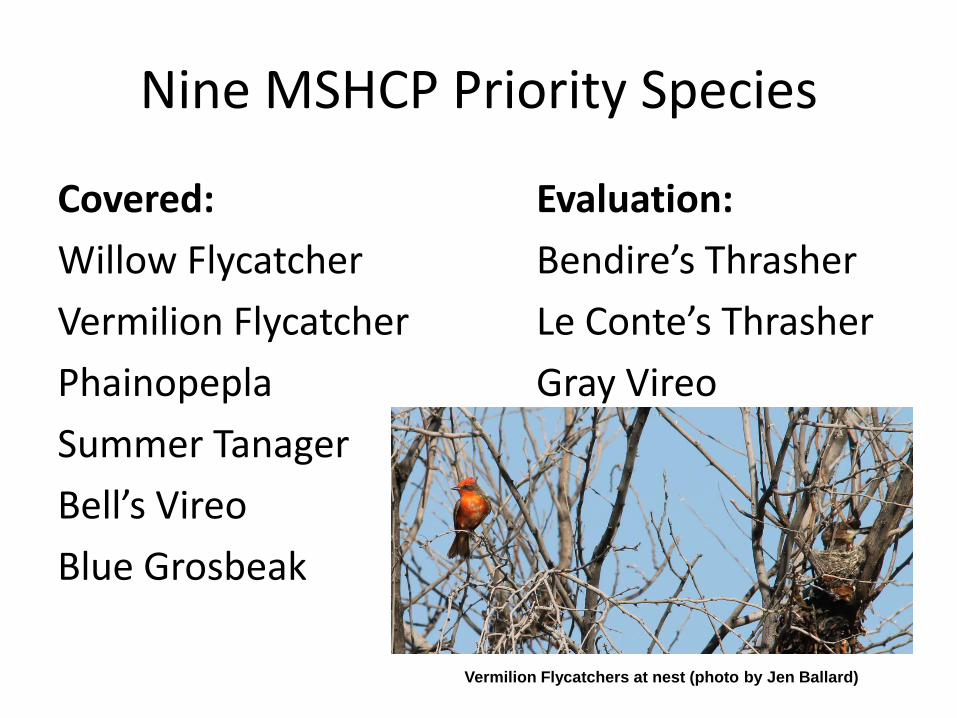
Nine MSHCP Priority Species
Covered: Evaluation:
Willow Flycatcher Bendire’s Thrasher
Vermilion Flycatcher Le Conte’s Thrasher
Phainopepla Gray Vireo
Summer Tanager
Bell’s Vireo
Blue Grosbeak
Vermilion Flycatchers at nest (photo by Jen Ballard)

Task 1: Developing Population Size Estimates
• Field Methods:
– Point count based surveys (in distance intervals)
– Double-sampling using intensive area searches
– Some double-observer sampling
– Multiple time intervals to allow for removal method

Task 1: Developing Population Size Estimates
• Draft Results: – Estimated populations without correction for
detectability
– Sample population estimates and inferential population estimates
– Inferential population differed primarily for salt desert habitats (due to DoD lands)

Task 2: Model Distribution and Habitats of Each Species
• Methods: – Random habitat-stratified survey design
– Restratification and drawing new sample in 2012
– Inclusion of all Nevada Bird Count data for Clark County (2003 – 2013) for distributions
– Predictive maps based on spatial habitat models
– (additional spatial and field vegetation data analyses before final report)

Task 2: Model Distribution and Habitats of Each Species
• Results: – Presence and absence maps for each species
– Predicted distributions and densities

Task 3: Establish Landbird Monitoring Plan
• Methods: – Original random scatter from Heaton et al.’s
2004/05 Clark County spatial data
– Restratification based on newly available layers from Clark County in 2012
– Tests of additional survey methods for effectiveness on rare species (call-playback)
– Testing various methods for detectability estimation

Clark County, 2008-13: Sampling and Detection Sites of all 9 Species Combined

Draft Results
• Bell’s Vireo
Photo by Martin Meyers

Population Size Estimates: Bell’s Vireo
# surveys (transect-year) # transects
Sample Pop
Inferential Pop
Agriculture 15 5 65 65
Coniferous Forest 39 13 0 0
Joshua Tree 110 51 0 0
Lowland Riparian 75 31 287 291
Mesquite-Catclaw 40 32 0 0
Mojave Scrub 92 53 0 0
Montane Riparian 1 1 0 0
Pinyon-Juniper 80 37 0 0
Sagebrush 20 7 0 0
Salt Desert 18 13 0 0
Total 490 243 352 356

Actual Distribution

Predicted Distribution
(birds/3.14 ha)

Bell’s Vireo Actual Habitat Use (from spatial data)

Draft Results
• Phainopepla
Photo by Scott Page

Population Size Estimates: Phainopepla
# surveys (transect-year) # transects
Sample Pop
Inferential Pop
Agriculture 15 5 183 183
Coniferous Forest 39 13 0 0
Joshua Tree 110 51 2062 2475
Lowland Riparian 75 31 530 538
Mesquite-Catclaw 40 32 465 470
Mojave Scrub 92 53 5102 5367
Montane Riparian 1 1 0 0
Pinyon-Juniper 80 37 0 0
Sagebrush 20 7 0 0
Salt Desert 18 13 113 483
Total 490 243 8455 9516

Actual Distribution

Predicted Distribution
(birds/3.14 ha)

Phainopepla Actual Habitat Use (from spatial data)

Draft Results
• Blue Grosbeak

Population Size Estimates: Blue Grosbeak
# surveys (transect-year) # transects
Sample Pop
Inferential Pop
Agriculture 15 5 15 15
Coniferous Forest 39 13 0 0
Joshua Tree 110 51 0 0
Lowland Riparian 75 31 320 325
Mesquite-Catclaw 40 32 0 0
Mojave Scrub 92 53 0 0
Montane Riparian 1 1 0 0
Pinyon-Juniper 80 37 163 172
Sagebrush 20 7 0 0
Salt Desert 18 13 0 0
Total 490 243 499 513

Actual Distribution

Predicted Distribution
(birds/3.14 ha)

Blue Grosbeak Actual Habitat Use (from spatial data)

Draft Results
• Summer Tanager
Photo by Jen Ballard

Population Size Estimates: Summer Tanager
# surveys (transect-year) # transects
Sample Pop
Inferential Pop
Agriculture 15 5 0 0
Coniferous Forest 39 13 0 0
Joshua Tree 110 51 0 0
Lowland Riparian 75 31 37 38
Mesquite-Catclaw 40 32 0 0
Mojave Scrub 92 53 0 0
Montane Riparian 1 1 0 0
Pinyon-Juniper 80 37 22 23
Sagebrush 20 7 0 0
Salt Desert 18 13 0 0
Total 490 243 59 61

Actual Distribution

Summer Tanager Actual Habitat Use (from spatial data)

Draft Results
• Vermilion Flycatcher
Photo by Jen Ballard

Population Size Estimates: Vermilion Flycatcher
# surveys (transect-year) # transects
Sample Pop
Inferential Pop
Agriculture 15 5 58 58
Coniferous Forest 39 13 0 0
Joshua Tree 110 51 0 0
Lowland Riparian 75 31 47 47
Mesquite-Catclaw 40 32 0 0
Mojave Scrub 92 53 0 0
Montane Riparian 1 1 0 0
Pinyon-Juniper 80 37 0 0
Sagebrush 20 7 0 0
Salt Desert 18 13 0 0
Total 490 243 105 105

Actual Distribution
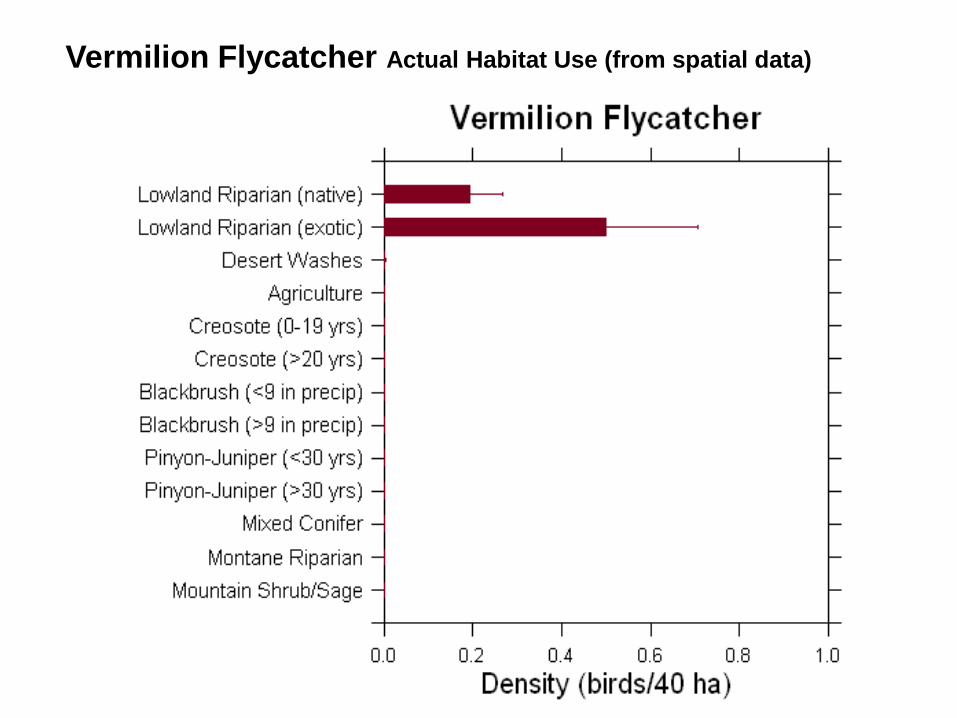
Vermilion Flycatcher Actual Habitat Use (from spatial data)

Draft Results
• Willow Flycatcher (may or may not be Southwestern subspecies)
Photo by Martin Meyers

Population Size Estimates: Willow Flycatcher
# surveys (transect-year) # transects
Sample Pop
Inferential Pop
Agriculture 15 5 0 0
Coniferous Forest 39 13 0 0
Joshua Tree 110 51 0 0
Lowland Riparian 75 31 3 3
Mesquite-Catclaw 40 32 0 0
Mojave Scrub 92 53 0 0
Montane Riparian 1 1 0 0
Pinyon-Juniper 80 37 0 0
Sagebrush 20 7 0 0
Salt Desert 18 13 0 0
Total 490 243 3 3

Actual Distribution

Willow Flycatcher Actual Habitat Use (from spatial data)

Draft Results
• Bendire’s Thrasher
Bendire’s Thrasher (photo by Martin Meyers)

Population Size Estimates: Bendire’s Thrasher
# surveys (transect-year) # transects
Sample Pop
Inferential Pop
Agriculture 15 5 0 0
Coniferous Forest 39 13 0 0
Joshua Tree 110 51 516 619
Lowland Riparian 75 31 0 0
Mesquite-Catclaw 40 32 20 20
Mojave Scrub 92 53 194 204
Montane Riparian 1 1 0 0
Pinyon-Juniper 80 37 0 0
Sagebrush 20 7 0 0
Salt Desert 18 13 0 0
Total 490 243 730 843

Actual Distribution

Bendire’s Thrasher Actual Habitat Use (from spatial data)

Draft Results
• Le Conte’s Thrasher

Population Size Estimates: Le Conte’s Thrasher
# surveys (transect-year) # transects
Sample Pop
Inferential Pop
Agriculture 15 5 0 0
Coniferous Forest 39 13 0 0
Joshua Tree 110 51 2320 2785
Lowland Riparian 75 31 0 0
Mesquite-Catclaw 40 32 170 172
Mojave Scrub 92 53 4567 4805
Montane Riparian 1 1 0 0
Pinyon-Juniper 80 37 8 9
Sagebrush 20 7 0 0
Salt Desert 18 13 136 584
Total 490 243 7202 8354

Actual Distribution

Le Conte’s Thrasher Actual Habitat Use (from spatial data)

Draft Results
• Gray Vireo

Population Size Estimates: Gray Vireo
# surveys (transect-year) # transects
Sample Pop
Inferential Pop
Agriculture 15 5 0 0
Coniferous Forest 39 13 769 872
Joshua Tree 110 51 1665 1998
Lowland Riparian 75 31 0 0
Mesquite-Catclaw 40 32 0 0
Mojave Scrub 92 53 737 775
Montane Riparian 1 1 0 0
Pinyon-Juniper 80 37 4797 5065
Sagebrush 20 7 189 209
Salt Desert 18 13 0 0
Total 490 243 8157 8920

Actual Distribution

Predicted Distribution
(birds/3.14 ha)

Gray Vireo Actual Habitat Use (from spatial data)

Take-Home Messages
• Distributions and predictive models are important for planners! Where to do/not do things on the landscape
• Site-specific habitat models are important for implementers! What to do/not do in a particular location
• Monitoring is important for all partners! Do Clark County land uses have a net impact or benefit on bird populations and bird distributions; does a particular project benefit a priority species

Next Steps (before draft report due date October 15, 2013)
• Statistical habitat models
• Predictive model refinement using different spatial data sets (2013)
• Formalization of final monitoring plan (2013)

Next Steps – cont’d
• Invitation to a ½ day meeting at Clark County offices in mid - late January, 2014
• You are all invited
• We will discuss specific applications of these data for land managers

Acknowledgments • Clark County Desert Conservation Program • The Nature Conservancy, Nevada Field Office • U.S. Fish and Wildlife Service • National Park Service • Bureau of Land Management • U.S. Forest Service • Bureau of Reclamation • Southern Nevada Water Authority • USGS Snake River Field Station • Nevada Department of Wildlife • Otis Bay Ecological Consultants • University of Nevada, Las Vegas • Many other Nevada Bird Count partners • GBBO field crews and volunteers • Ralph Phenix