Developing Expert-Based Assumptions on Future Fertility ...
25
Developing Expert-Based Assumptions on Future Fertility, Mortality, and Migration Guy Abel 1 , Stuart Basten 2 , Regina Fuchs 1 , Alessandra Garbero 3 , Anne Goujon 1 , Samir K.C. 1 , Elsie Pamuk 1 , Fernando Riosmena 4 , Nikola Sander 1 , Tomáš Sobotka 1 , Erich Striessnig 1 , and Kryštof Zeman 1 1 Wittgenstein Centre for Demography and Global Human Capital, 2 University of Oxford, 3 International Fund for Agricultural Development, 4 University of Colorado at Boulder Joint Eurostat/UNECE Work Session on Demographic Projections, 29-31/10/2013, Rome, Italy PDF Creator - PDF4Free v2.0 http://www.pdf4free.com
Transcript of Developing Expert-Based Assumptions on Future Fertility ...
Developing Expert-Based Assumptions onFuture Fertility, Mortality, and Migration
Guy Abel1, Stuart Basten2, Regina Fuchs1, Alessandra Garbero3, Anne Goujon1, SamirK.C. 1, Elsie Pamuk1, Fernando Riosmena4, Nikola Sander1, Tomáš Sobotka1, ErichStriessnig1, and Kryštof Zeman1
1 Wittgenstein Centre for Demography and Global Human Capital, 2 University ofOxford, 3 International Fund for Agricultural Development, 4 University of Colorado atBoulder
Joint Eurostat/UNECE Work Session on Demographic Projections, 29-31/10/2013, Rome, Italy
PDF Creator - PDF4Free v2.0 http://www.pdf4free.com

Outline
• Introduction• Future of fertility
– High fertility countries*– Low fertility countries*
• Future of mortality• Future of migration• Education differentials• Scenarios
* Based on fertility levels and Human Development index
PDF Creator - PDF4Free v2.0 http://www.pdf4free.com

Introduction
• Context: Global population projections bylevels of educational attainment– See Lutz, W., Butz, W., and S. KC. 2014
forthcoming. World population and human capitalin the 21st century. Oxford University Press.
• Two main novelties compared to previousrounds of projections:– Scope (6 education categories, 171 countries)– Methodology: Expert-based modeling
Introduction
PDF Creator - PDF4Free v2.0 http://www.pdf4free.com

General methodology for the assumptions for themedium scenario
• Fertility, mortality and migration assumptionsderived independently
• 4 major steps in scenario making:1. Learning from past and present trends
2. The expert questionnaire
3. The meta-expert meeting
4. Combining elements from experts, meta-experts andmodel
Introduction
PDF Creator - PDF4Free v2.0 http://www.pdf4free.com

Step 1: Model of historical analogy• Based on past levels and decreases of
fertility across countries between 1970and 2005 (UN 2010)
– - Constraint 1: country’s level (+/-10 percent) at any 5-year period.
– - Constraint 2: decreases in fertility(+/- 5 percentage points) relative tothe previous period
– - Taking the mean fertility declinefor all countries fulfilling these 2constraints, represents the expectedfertility decline for the following 5-year period.
Future fertility of high fertility countries
PDF Creator - PDF4Free v2.0 http://www.pdf4free.com

Step 2: Incorporate source expert responses• By developing a model that translates responses from
arguments to respective changes in fertility.
Future fertility of high fertility countries
Countries Nbr ofrspdts* bycountry
Total nbrofrspdts*
Afghanistan, Bhutan, Bolivia, Botswana,Ecuador, Haiti, Lesotho, Maldives, Mali,Mongolia, Morocco, Mozambique,Niger, Oman, Palestine, Panama, PapuaNG, Peru, Senegal, Sri Lanka, Sudan,Tanzania, Venezuela, Zambia
1 24
Burkina Faso, Ethiopia, Kenya, Rwanda,South Africa, Suriname
2 12
Malawi, Malaysia, Vietnam 3 9
Indonesia, Philippines, Uganda 4 12
Egypt 5 5
Bangladesh, Pakistan 6 12
Nigeria 7 7
Ghana 10 10
Nepal 12 12
India 37 37
Total 3.25 (Av.) 140 (N)
* Nbr of rspdts = Number of respondents
Figure: Predicted percentage change in TFR,2010-2050, % TFR=0.15(0.009)×AGGSCORE;Adjusted R2=0.87
PDF Creator - PDF4Free v2.0 http://www.pdf4free.com

Step 3: Incorporate meta-expertise
• Meeting in Dhulikhel,Nepal:– Discussion about the
drivers of fertility acrossworld regions
– Formulation of numericalestimates of fertility (for14 countries) in 2030 and2050.
– From there, we calculatedtwo rates of decrease:2010-2030 and 2030-2050.
Future fertility of high fertility countries
Figure: TFR in Bangladesh: Past estimates,1993-2007, and meta-experts assumptions2030 & 2050
Source: DHS (1993/4, 1996/7, 1999-2000, 2004, 2007) and meta-experts (2030, 2050)
PDF Creator - PDF4Free v2.0 http://www.pdf4free.com
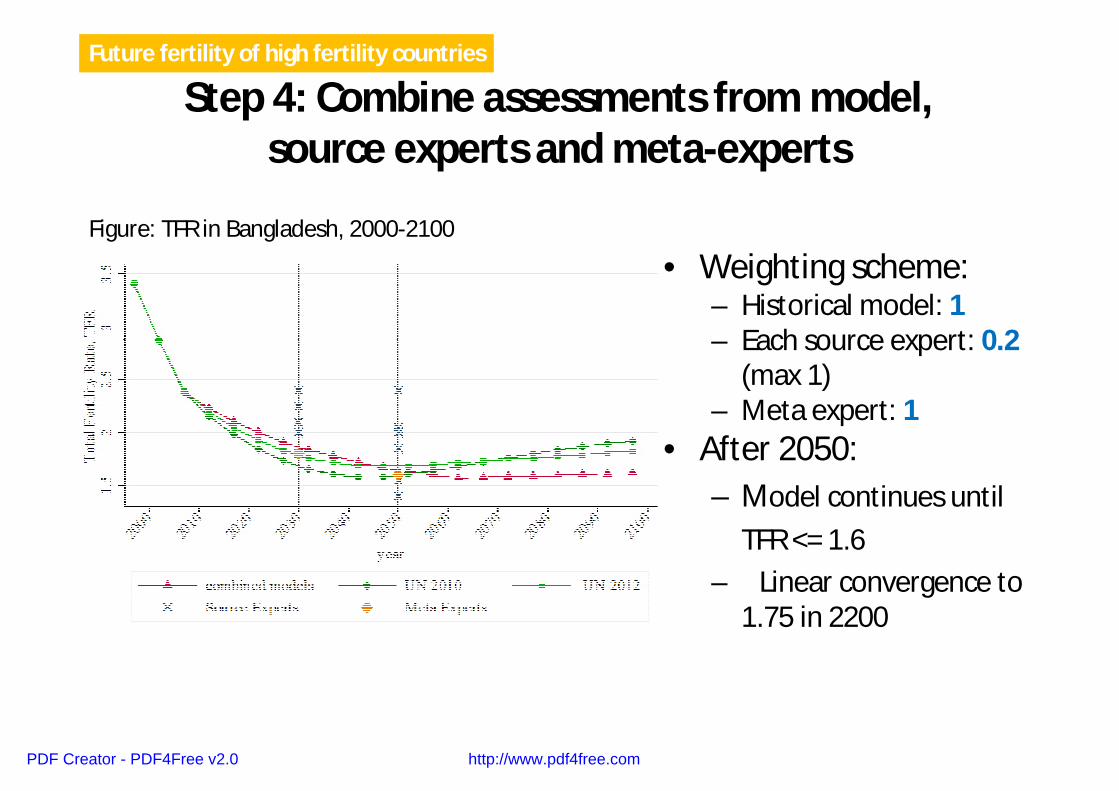
Step 4: Combine assessments from model,source experts and meta-experts
• Weighting scheme:– Historical model: 1– Each source expert: 0.2
(max 1)– Meta expert: 1
• After 2050:– Model continues until
TFR <= 1.6
– Linear convergence to1.75 in 2200
Future fertility of high fertility countries
Figure: TFR in Bangladesh, 2000-2100
PDF Creator - PDF4Free v2.0 http://www.pdf4free.com

Low fertility expert-based modeling
• Derive point estimates for TFR in 2030 and 2050 for anumber of key countries (13).
• Extrapolate by analogy TFR in 2030 and 2050 to allremaining low-fertility countries.
• Account for the effect of the on-going economic recession:– Compiling recent information on annual fertility trends– Assumption that fertility rates were likely to fall somewhat in
the most affected countriesNo country would see a fertility increase in the period 2010-15.
• Period TFR levels in low-fertility countries slowly convergeto 1.75 in 2200).
Future fertility of low fertility countries
PDF Creator - PDF4Free v2.0 http://www.pdf4free.com

Figure: TFR in Austria, estimates and projections, 1980-2050
Future fertility of low fertility countries
PDF Creator - PDF4Free v2.0 http://www.pdf4free.com
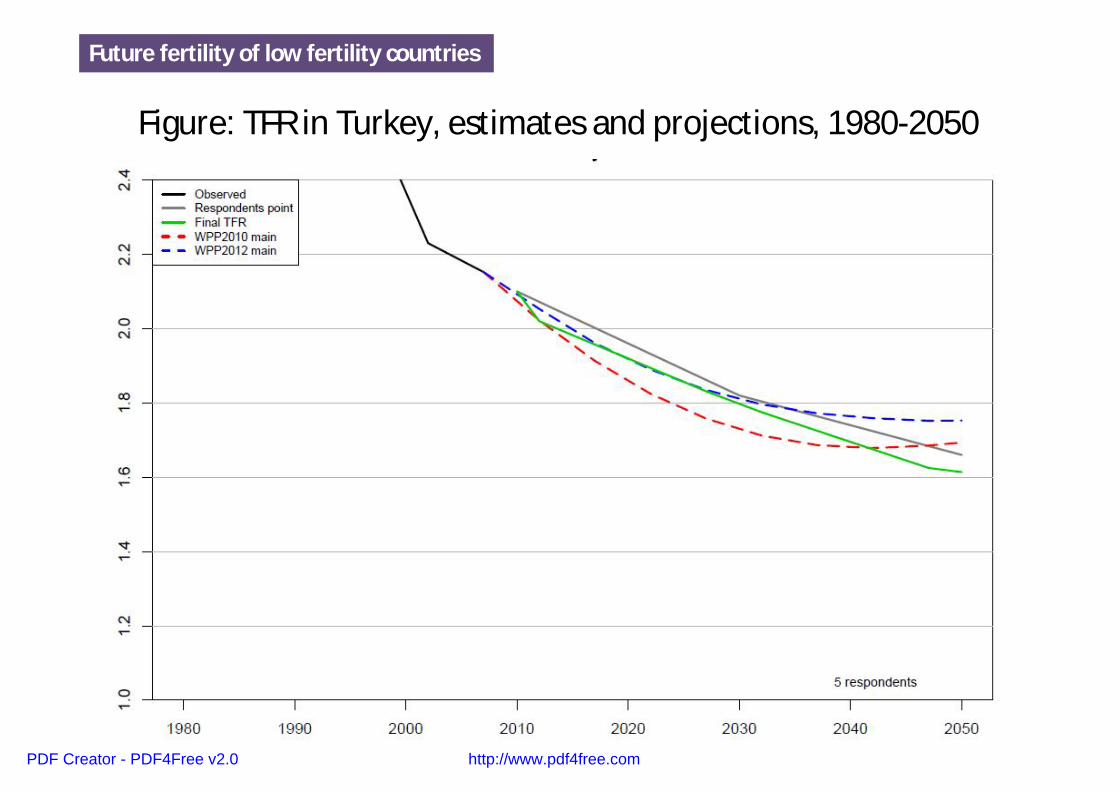
Future fertility of low fertility countries
Figure: TFR in Turkey, estimates and projections, 1980-2050
PDF Creator - PDF4Free v2.0 http://www.pdf4free.com

Future fertility of low fertility countries
Figure: TFR in Sweden, estimates and projections, 1980-2050
PDF Creator - PDF4Free v2.0 http://www.pdf4free.com

Mortality assumptions: Regional convergence
• The statistical model: Convergence to Japan’s female life expectancy as globalforerunner.
– Increase of 2 years per decade: from 86.1 years in 2005-2010 to 104.2 in 2095-2100.• Step 1: Regional forerunners in 22 regions
– Female life expectancies were projected so that the change in life expectancies converges tothe assumed change in Japan (econometric model).
• Step 2:– The regional model is applied for countries within each region that are assumed to follow
their regional forerunners.– For HIV-affected countries and two high mortality countries (Haiti and Afghanistan) the UN
Medium-Variant life expectancies (2011) were assumed until the period 2045-2050. After2050 life expectancies to the end of the century were projected using the model with Namibia(as the forerunner country for this group of countries.)
• Step 3:– Combine model results with the expert assessments by a weighting procedure:– Statistical model: 1– Each source expert: 0.2 (max 1)– Meta expert: 1
• Step 4:– Derive life expectancies for males by applying the difference between the female and overall
life expectancy in the UN medium variant
Future mortality
PDF Creator - PDF4Free v2.0 http://www.pdf4free.com

Future mortality
Figure: Female e0 in Botswana, estimates and projections,1950-2100
PDF Creator - PDF4Free v2.0 http://www.pdf4free.com

Future mortality
Figure: Female e0 in Nepal, estimates and projections, 1950-2100
PDF Creator - PDF4Free v2.0 http://www.pdf4free.com

Future mortality
Figure: Female e0 in Austria, estimates and projections,1950-2100
PDF Creator - PDF4Free v2.0 http://www.pdf4free.com
• Migration is hard to project and difficult to quantify -> use of simple net migration models.
• Multi-regional projection models (Rogers 1975) are conceptually much better because theyincorporate place to place migration flows, but they are very complex.
• The bi-regional model (Rees and Wilson 1977) is a reduced form of the multiregionalmodel, which retains directional migration whilst reducing data requirements and inputassumptions.
• In the bi-regional setting, the world is divided into just two regions, and migration betweeneach country & rest of the world is modelled simultaneously.
• Its use has been hindered by the dearth of data on international migration flows.
• We draw on new flow tables estimated using UN migrant stock data (Abel 2013).
• Estimates are by sex, age pattern is assumed to follow a modified Rogers schedule.
Future migration
Migration projection based on a flow model
PDF Creator - PDF4Free v2.0 http://www.pdf4free.com

• Assumptions are made for each country‘s immigration and emigration flow by age/sex.
• Assumptions are made on rates (rather than levels), and migration is modelled as afunction of origin population size -> no risk of negative populations!
• Unlike fertility and mortality, migrationassumptions are not based on pointprojections
• Instead, we draw on the impact and validityof a set of qualitative statements regardingfuture drivers of migration (strongagreement among experts on key drivers).
Future migration
PDF Creator - PDF4Free v2.0 http://www.pdf4free.com

• Meta-experts recommended to assume a continuation of current trends as the mostlikely scenario
• Immigration and emigration rates estimated for the period 2005-10 to remain constantuntil 2055-60. The figure shows the example of Austria.
• For selected countries that experienced recent immigration waves, we lower theassumed rate over the first two projection periods (e.g. Spain, Gulf countries).
Future migration
PDF Creator - PDF4Free v2.0 http://www.pdf4free.com

Differentials by education in fertility
Education differentials
PDF Creator - PDF4Free v2.0 http://www.pdf4free.com

Differentials by education in mortality
Figure: Assumed difference in years in life expectancy at age15 between six education categories
Education differentials
PDF Creator - PDF4Free v2.0 http://www.pdf4free.com

Base-year population by education
Education differentials
PDF Creator - PDF4Free v2.0 http://www.pdf4free.com
Other scenarios
• High and low fertility scenarios:– 20% +/- than medium by 2030 (expert based)– 25% +/- than medium by 2050+ (expert-based)
• High and low mortality scenarios:– 1 year +/- than medium– special for HIV/AIDS countries
• High and low migration scenarios:– 50% +/- in net-migration than medium– Special scenarios: “Rise of the East” and “Steady
Global Growth”
Scenarios
PDF Creator - PDF4Free v2.0 http://www.pdf4free.com

Comparison baseline model and final model
Future fertility of high fertility countries
PDF Creator - PDF4Free v2.0 http://www.pdf4free.com