Developing Enterprise Database help shed the burden of ... Enterprise... · Developing Enterprise...
24
Developing Enterprise Database help shed the burden of legacy technology Manjit K. Sooch Alameda – Contra Costa Transit District (AC Transit) Enterprise Software Engineer Oakland, California
Transcript of Developing Enterprise Database help shed the burden of ... Enterprise... · Developing Enterprise...

Developing Enterprise Database
help shed the burden of legacy
technology
Manjit K. Sooch
Alameda – Contra Costa Transit District (AC Transit)
Enterprise Software Engineer
Oakland, California

4/21/2015 2
AC Transit Systems and Enterprise Database

Comparison Table Before and After
Enterprise DatabaseDepartment and Application Before After
Training and Education
Management System
Legacy Access
Database
Web Based .NET MVC
HTML5 Application,
data stored in SQL
Server Database and
using Enterprise
Database for other
sources
Customer Service Complaint
System
Legacy Classic
ASP Application
Information Service AD Updater N\A
Scheduling Bus Stop Work
Order System
N\A
Mobile Website Legacy PHP
web page
Key Performance Indicators
(KPIs)
Manual KPIs
4/21/2015 3
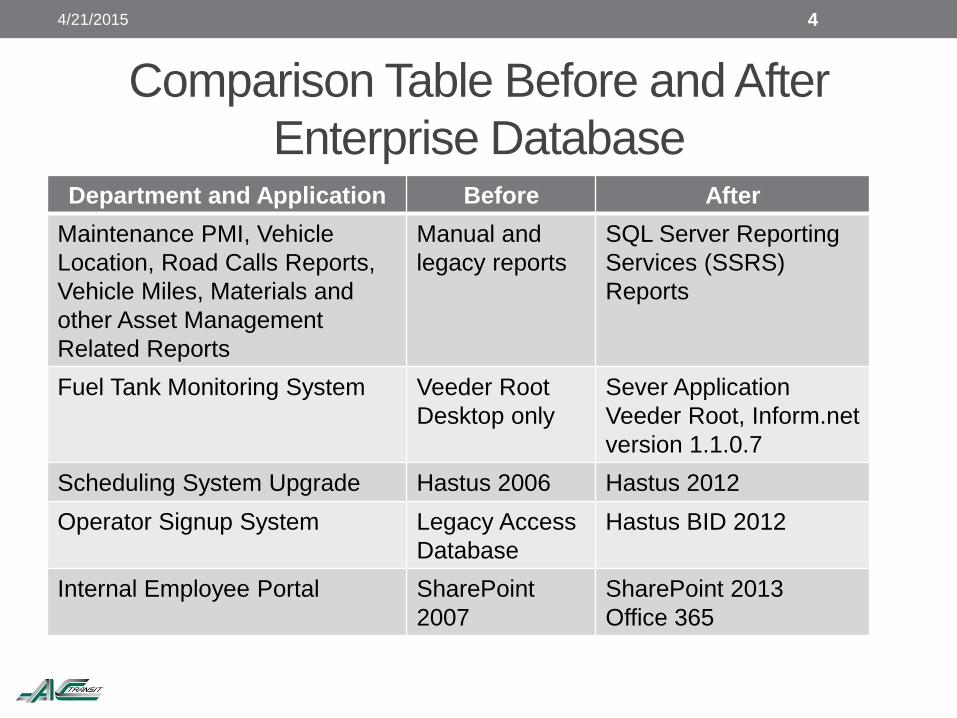
Comparison Table Before and After
Enterprise DatabaseDepartment and Application Before After
Maintenance PMI, Vehicle
Location, Road Calls Reports,
Vehicle Miles, Materials and
other Asset Management
Related Reports
Manual and
legacy reports
SQL Server Reporting
Services (SSRS)
Reports
Fuel Tank Monitoring System Veeder Root
Desktop only
Sever Application
Veeder Root, Inform.net
version 1.1.0.7
Scheduling System Upgrade Hastus 2006 Hastus 2012
Operator Signup System Legacy Access
Database
Hastus BID 2012
Internal Employee Portal SharePoint
2007
SharePoint 2013
Office 365
4/21/2015 4
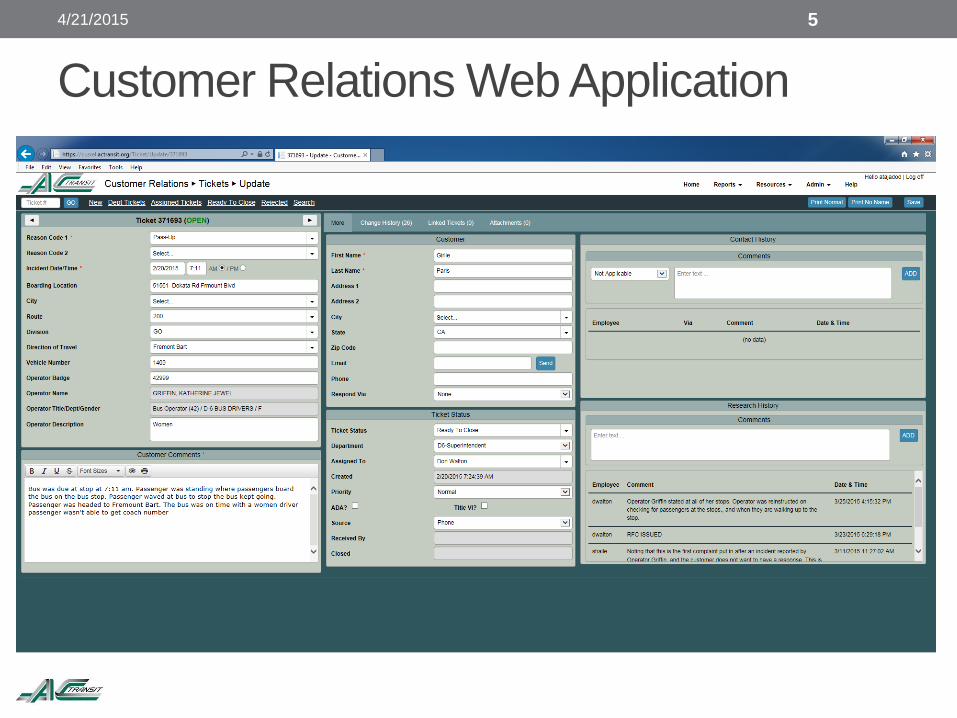
Customer Relations Web Application
4/21/2015 5

Training and Education Web Application
4/21/2015 6

Active Directory Updater Web Application
4/21/2015 7

Bus Stop Work Orders System
4/21/2015 8

AC Transit Mobile Site
4/21/2015 9

Managing with KPIs
4/21/2015
Managing with KPI’s
Frequency: Daily, Monthly, Quarterly, Yearly
10
Decision Makers are…

4/21/2015
Frequency: Daily, Monthly, Quarterly, Yearly
11
Operations

4/21/2015 12
Miles Between Chargeable Road Calls KPI
4/21/2015
Frequency: Daily, Monthly, Quarterly, Yearly
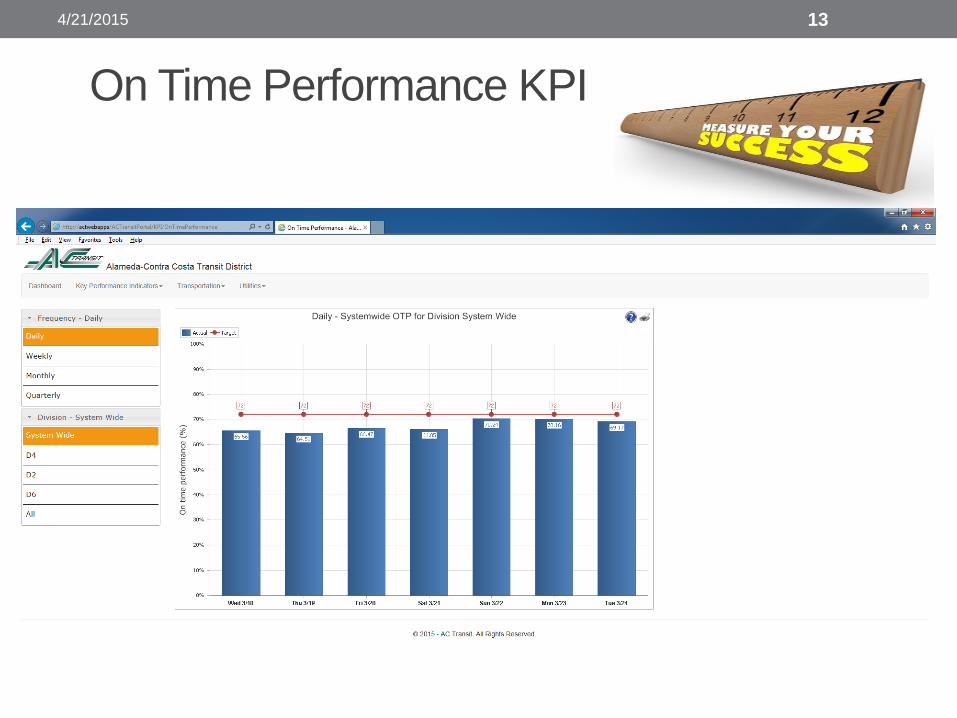
13
On Time Performance KPI
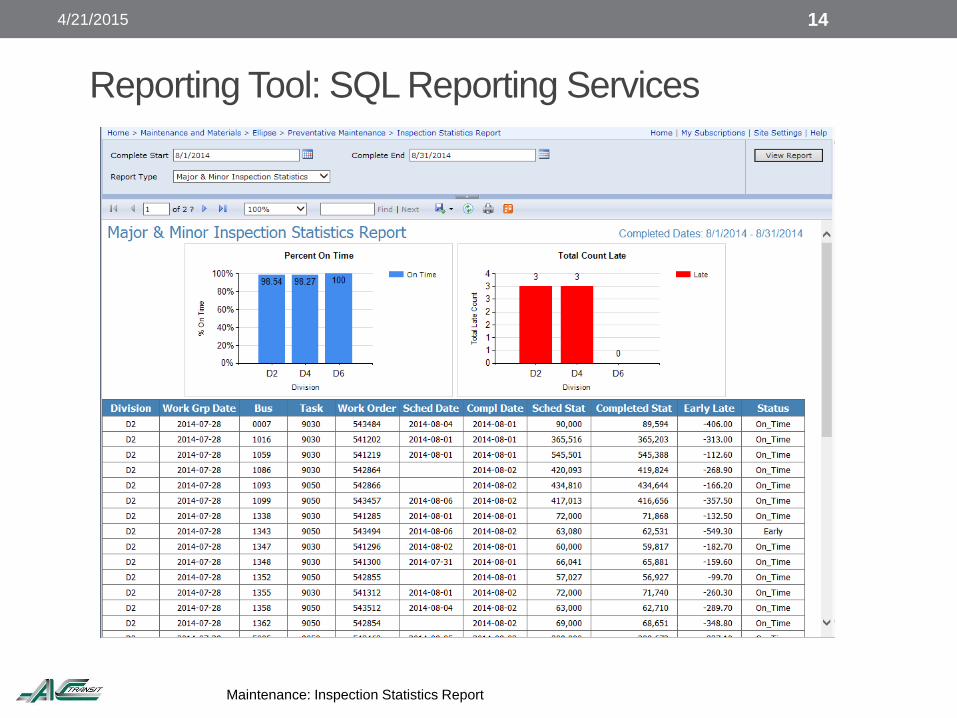
4/21/2015 14
Reporting Tool: SQL Reporting Services
Maintenance: Inspection Statistics Report
4/21/2015
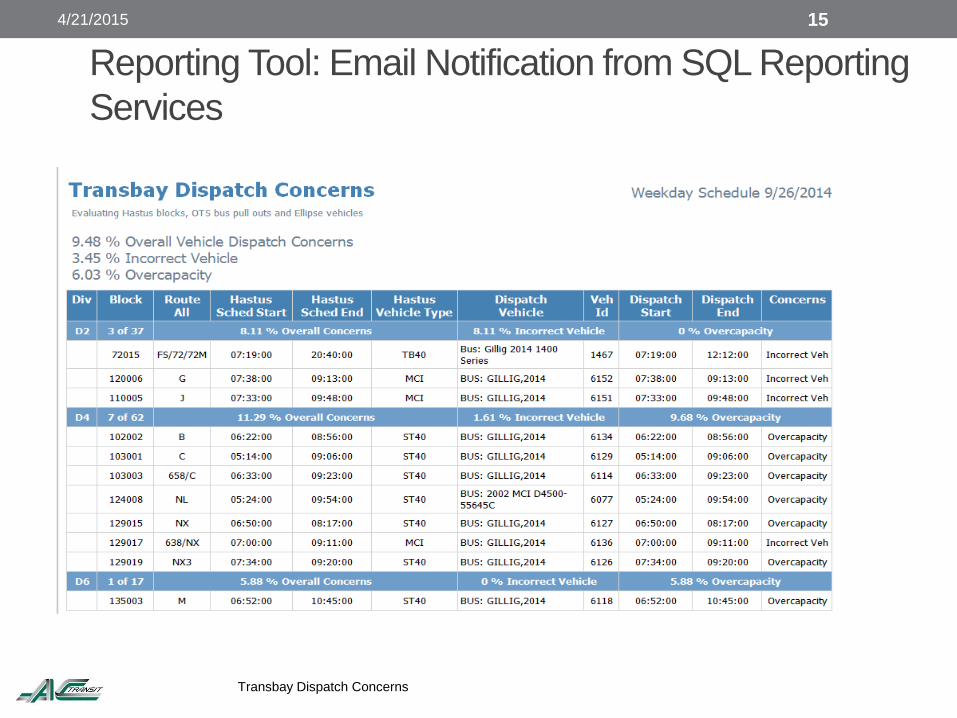
Transbay Dispatch Concerns
15
Reporting Tool: Email Notification from SQL Reporting
Services

4/21/2015
Ridership (Average Daily Passengers)
16
Reporting Tool: Microsoft .Net Web Application HTML5
and MVC
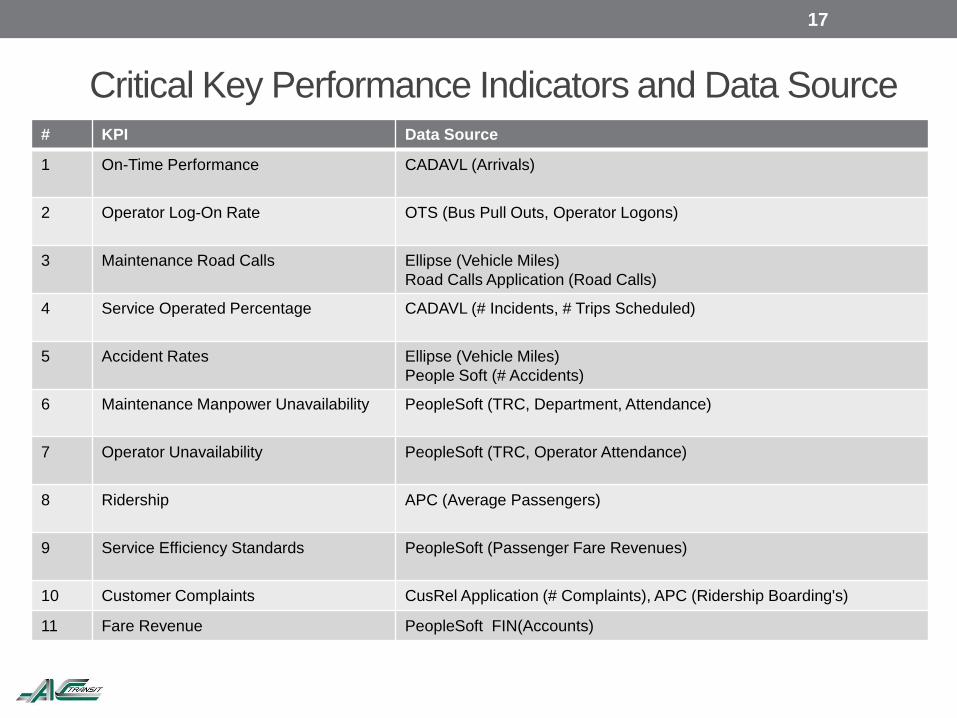
# KPI Data Source
1 On-Time Performance CADAVL (Arrivals)
2 Operator Log-On Rate OTS (Bus Pull Outs, Operator Logons)
3 Maintenance Road Calls Ellipse (Vehicle Miles)
Road Calls Application (Road Calls)
4 Service Operated Percentage CADAVL (# Incidents, # Trips Scheduled)
5 Accident Rates Ellipse (Vehicle Miles)
People Soft (# Accidents)
6 Maintenance Manpower Unavailability PeopleSoft (TRC, Department, Attendance)
7 Operator Unavailability PeopleSoft (TRC, Operator Attendance)
8 Ridership APC (Average Passengers)
9 Service Efficiency Standards PeopleSoft (Passenger Fare Revenues)
10 Customer Complaints CusRel Application (# Complaints), APC (Ridership Boarding's)
11 Fare Revenue PeopleSoft FIN(Accounts)
17
Critical Key Performance Indicators and Data Source

KPI Target Aug '14 Apr - Jun '14
On Time Performance 72% 68.57% 68.15%
Miles Between Chargeable Road Calls 5200 6592.61 5350.28
Service Operated, Rollout 99.50% 99.58% 99.76%
Accident Rate 4 3.86 4.32
Maintenance Manpower Unavailability 22% 20.46% 24.06%
Operator Unavailability 22.50% 24.71% 24.33%
Logon Rate 95% 89.51% 88.58%
Ridership, Average Daily Passengers N/A --- ---
Service Efficiency StandardsN/A --- ---
Pay Hours to Platform Hours
Fare Revenues N/A --- ---
Customer Complaints15 0 ---
Complaints Per 100K Boarding
18
Dashboard: Data Table

19
Dashboard

“Executive management needs to be able to do daily, weekly, and
monthly assessments on the performance of service being provided to
our customers.
The Key Performance Indicators allow the management team to take
corrective action quickly to avoid any major impact on our customers.
When monitored daily, the management team ensures that the transit
service is operating at peak performance.”
- Chief Operating Officer
James Pachan
20
Quotes from Decision Makers
“Any company needs a road map to assess its current location;
determine its destination and intended route; identify
landmarks/benchmarks along the way; and realize its objectives. AC
Transit’s development and utilization of Key Performance Indicators
have provided us such a map.
Employees can now see and understand their role in achieving
tangible performance measures, and monitor their progress on a
regular basis. This is an effective motivational tool and fosters team
building given the inter-departmental nature of our collective efforts,
both of which ultimately lead to success.”
- Director of Transportation
Christopher Beach
21
Quotes from Decision Makers

“In any professional sport, teams need to know the plan, execute the
play and more importantly know the score to see if they are winning the
game. The same principle applies to our industry; we need to know
how well we are doing in order to adjust our game plan to achieve our
goals.
Working with IS, we created score cards for key performance
indicators; employees at all locations can see how their efforts are
measuring up to District goals which builds a competitive drive to
improve performance.”
- Director of Maintenance
Salvador Llamas
22
Quotes from Decision Makers

23
Next Steps…Upcoming Projects
Public facing Key Performance Indicators
AC Transit Website: Responsive
New CAD\AVL System
Upgrade Asset Management System (Ellipse 8.0)
SQL Server Consolidation
Google Transit Feed Standards Real Time (GTFS-RT)
Vehicle Updates and Service Updates
AC Transit Schedule data and AVL Real Time API in .NET
Upgrading Legacy and Manual Reports: Transportation, Claims, Time Keeping,
and Scheduling
Rewrite of Vendor Registration and Procurement Tools
Hastus 2012 Daily Operations
Warranty Application

24
Questions…