Developing Competitive Fertilizer Markets in Africa ... · PDF filev Developing Competitive...
48
Developing Competitive Fertilizer Markets in Africa: Policy Lessons from FTF Country Assessments November 2015
Transcript of Developing Competitive Fertilizer Markets in Africa ... · PDF filev Developing Competitive...

Developing Competitive Fertilizer Markets in Africa:
Policy Lessons from FTF Country Assessments
November 2015

i
Acknowledgments
This is a summarized update of a background paper written for the African Union’s “2014 Africa
Year of Agriculture and Food Security” CAADP Partnership Platform meeting held in Durban
(IFDC, 2014). It draws material from USAID-funded fertilizer market assessments by IFDC in
12 Feed the Future (FTF) countries, an extensive review of literature on fertilizer markets in
Africa, recommendations from the Technical Convening of Seed and Fertilizer Policy Experts in
Addis Ababa, Ethiopia, organized by USAID and partner organizations (IFDC, 2013), and other
sources including reports from the African Union and the New Partnership for Africa’s
Development (NEPAD) Agency on the progress related to the 2006 Abuja Declaration on
Fertilizer.
This synthesis has been put together by Joshua Ariga, Senior Economist, Markets, Economics
and Policy (ME&P) Unit of IFDC, with technical support from Maria Wanzala, IFDC Senior
Economist & Director, East and South Africa Division, African Fertilizer and Agribusiness
Partnership (AFAP), and reviews from colleagues at ME&P (Latha Nagarajan, Porfirio Fuentes
and Sarah Gavian). Much of the information and data used in this paper was collected from
fertilizer value chain players from across Africa – importers, distributors, farmers, support
institutions and ministries of agriculture. IFDC’s Africa Divisions provided crucial logistics
support for the FTF market assessments. We extend our appreciation to David Atwood, Food
Security Policy Advisor, USAID BFS, for his support on policy-related work. The accuracy of
the information is the sole responsibility of the authors.

ii
Table of Contents
Executive Summary ........................................................................................................................ v
1. Background ............................................................................................................................. 1
2. Key Agriculture Challenges in Sub-Saharan Africa ............................................................... 3
2.1 Consumption and Role of Fertilizers in SSA Agriculture ........................................... 6
2.2 Fertilizer Requirements from 12 FTF Country Market Assessments ......................... 8
3. Challenges and Policies Constraining Fertilizer Markets in SSA ........................................... 9
3.1 Import and Custom Procedures and Regulations Relating to Fertilizer Trade .......... 10
3.2 Investment in Infrastructure Including Ports and Roads ........................................... 13
3.3 The Nature and Challenges of Fertilizer Subsidies in Africa .................................... 15
3.3.1 Non-Targeted Subsidy with Government Importation and
Distribution .................................................................................................. 16
3.3.2 Non-Targeted Subsidy with Private Sector Importation and
Distribution .................................................................................................. 16
3.3.3 Targeted Subsidy with Importation and Distribution by Private
Sector ........................................................................................................... 16
3.3.4 Targeted Subsidy with Importation by Private Sector and
Distribution by Government ........................................................................ 17
3.4 Supply-Side Constraints ............................................................................................ 19
3.5 Demand-Side Constraints .......................................................................................... 20
3.6 Incorporating Women and Youth in Value Chains ................................................... 21
3.7 Finance/Investment in Value Chain Activities .......................................................... 22
4. Conclusions and Recommendations ...................................................................................... 23
4.1 Status of Fertilizer Policy Frameworks and Recommended Actions for Some
Countries ................................................................................................................... 23
4.2 Road Map in Support of African Union .................................................................... 27
4.2.1 Policy Action Area 1: Allocate More of the National Budget to
Agronomic Research and Extension ........................................................... 28
4.2.2 Policy Action Area 2: Develop and Harmonize Policy and
Regulatory Frameworks .............................................................................. 30
4.2.3 Policy Action Area 3: Allocate Budget to a Fund that Supports
Innovative Fertilizer Financing Mechanisms .............................................. 32
4.2.4 Policy Action Area 4: Public-Private Dialogue and Joint Action on
Fertilizer Policy ........................................................................................... 33
References ..................................................................................................................................... 36

iii
Tables
Table 1. Yield Potential with Fertilizer Use in Africa ............................................................... 7
Table 2. Estimated Fertilizer to Meet FTF Country Agricultural Growth Targets .................... 9
Table 3. Summary of Key Challenges to Market Development in SSA ................................. 10
Table 4. Summary of Tariff and Non-Tariff Barriers to Trade in Africa ................................ 12
Table 5. Port and Inland Haulage Constraints in Africa .......................................................... 14
Table 6. Fertilizer Subsidy and Public Agricultural Expenditures in Selected African
Countries, 2008-2011 ................................................................................................ 15
Table 7. Four Categories of Subsidy Programs in Africa ........................................................ 16
Table 8. Status of Fertilizer Policy Frameworks and Suggested Actions for Some
Countries .................................................................................................................... 24
Table 9. Summary of Action Area 1: Goals and Actions to Establish Sustainable
Research and Extension Systems ............................................................................... 29
Table 10. Area 2: Actions and Targets to Develop and Harmonize Policy and Regulatory
Frameworks ............................................................................................................... 31
Table 11. Summary of Action Area 3: Goals and Actions to Establish a Fund to Support
Innovative Financing Activities for the Fertilizer Value Chain ................................ 32
Table 12. Summary of Action Area 4: Goals and Actions to Establish Public-Private
Dialogue and Joint Action on Policy ......................................................................... 34
Figures
Figure 1. Trend in Undernourished for Africa Compared to All Developing Countries ............ 3
Figure 2. Fertilizer Nutrient Use by Regions (2012, kg/ha) ....................................................... 4
Figure 3. World Cereal Yields (mt/ha) ....................................................................................... 5
Figure 4. Intensification vs. Area Expansion (Asia and SSA) .................................................... 6
Figure 5. Fertilizer Consumption (Nutrients, NPK kg/ha) for Some African Countries,
2012 ............................................................................................................................. 8
Figure 6. Schematic of Major Port Operations ......................................................................... 13
Figure 7. Average Vessel Dwell Time at Various Ports in Africa ............................................ 14

iv
Acronyms
AFAP African Fertilizer and Agribusiness Partnership
AfDB African Development Bank
AFFM Africa Fertilizer Financing Mechanism
AGRA Alliance for a Green Revolution in Africa
AU African Union
AUC-DREA African Union Commission’s Department of Rural Economy and Agriculture
BFS Bureau of Food Security, USAID
CAADP Comprehensive Africa Agricultural Development Programme
COMESA Common Market for Eastern and Southern Africa
DAP Diammonium Phosphate
EAC East African Community
ECOWAS Economic Community of West African States
FAO Food and Agriculture Organization of the United Nations
FTF Feed the Future
G-20 Group of Twenty
GDP Gross Domestic Product
ha hectare
ICT Information and Communications Technology
IFDC International Fertilizer Development Center
IFPRI International Food Policy Research Institute
JICA Japan International Cooperation Agency
kg/ha kilograms per hectare
MDG Millennium Development Goal
ME&P Markets, Economics and Policy
MFI Microfinance Institutions
mt metric ton
NEPAD New Partnership for Africa’s Development
NGO Non-Governmental Organization
NPK Nitrogen-Phosphorus-Potassium
NPS Nitrogen-Phosphorus-Sulfur
NTB Non-Tariff Barrier
PPP Public-Private Partnership
REC Regional Economic Community
SADC Southern African Development Community
SSA Sub-Saharan Africa
UDP Urea Deep Placement
UNECA United Nations Economic Commission for Africa
USAID United States Agency for International Development
VAT Value-Added Tax
WAFP West Africa Fertilizer Program
WFS World Food Summit

v
Developing Competitive Fertilizer Markets in Africa: Policy Lessons from FTF Country Assessments
Executive Summary
The 2003 Maputo Declaration to raise agricultural investment and growth followed by the 2006
Abuja Declaration on Fertilizer for an African Green Revolution, and the implementation of the
Comprehensive Africa Agriculture Development Programme (CAADP) have led to increased
focus on strengthening fertilizer markets in SSA in order to raise productivity and incomes for
smallholder farmers. African agriculture faces a number of challenges that require major policy
reforms to deal with food insecurity, soil nutrient depletion, low agricultural productivity,
declining arable land per capita and effects of increased global demand for food, feed, fiber and
fuel resulting from population growth.
Based on extensive analysis of existing research and knowledge from various sources, including
lessons learned from IFDC activities in SSA, this report provides a synopsis of the status of
fertilizer markets, key challenges and potential opportunities and highlights key policy
recommendations needed at the continental, regional and national levels to create competitive
and sustainable fertilizer markets and increase farmers’ access to fertilizers. A recent study
commissioned by USAID and implemented by IFDC in 12 Feed the Future countries in SSA
concludes that in order to meet the agricultural growth targets envisioned in the national strategic
plans, these countries need to more than double their current fertilizer consumption levels1.
Therefore, strengthening fertilizer value chains by tackling existing challenges and putting in
place policies that encourage increased private sector investments will be crucial in meeting
these targets.
The following recommendations touch on four key areas selected for their potential to achieve
significant and sustainable increases in fertilizer use and supply in SSA. It is important to
stimulate farm-level demand for fertilizer by improving crop response through updating
recommendations on fertilizer use and applications as well as strengthening extension and
1 Some of these country fertilizer market assessments can be accessed at http://ifdc.org/research-papers-and-studies/

vi
market information services. Developing and harmonizing fertilizer policy and regulatory
frameworks (including trade policy to establish regional markets) is necessary to reduce costs
and increase demand for fertilizers by expanding markets. Access to credit is a major constraint
for fertilizer value chains, and it is recommended that innovative financing approaches be
established to alleviate this challenge. Finally, public-private sector dialogue for joint action on
fertilizer policy will accelerate policy responsiveness to market needs and encourage private
investments.
1. Allocate budget for a sustainable research and extension program
Goal: Stimulate farm-level demand for fertilizer by improving crop response to fertilizer use
Issue Recommendation (Country or Regional)
Inadequate agronomic research
and extension programs
Develop national soil maps; establish soil testing facilities in
order to generate fertilizer formulations that match with soil
and crop requirements; including use of blending facilities.
Training and extension services
for farmers
Increase number of trained agro-dealers and extension capacity,
including farm demonstrations and trials on benefits of
fertilizer
Fertilizer use efficiency (FUE)
and the environment
Adopt an Integrated Soil Fertility Management (ISFM)
approach. This will vary by location based on soil fertility
conditions, type of crop, agro-climatic zones, availability of
organic inputs, etc. Use fertilizer technologies that have less
environmental footprint; Urea Deep Placement (UDP) is an
ISFM package specific for lowland transplanted rice.
Market information Establish a market information system for farmers

vii
2. Develop and harmonize policy and regulatory frameworks
Goal: Develop and harmonize fertilizer policy and regulatory frameworks (including trade
policy to establish regional markets)
Issue Recommendation (Country or Regional)
Policy and Regulatory
Framework
(Predictable, develop
private sector)
Develop, update and enact fertilizer frameworks at national and regional
levels: Hire national and international experts with requisite experience
Strengthen regulatory enforcement capacity: Human and analytical labs
for quality assurance
Trade Policy
(Establishing and
promoting national
and regional markets)
Reduce delays at border: 24-hour one-stop border posts and single
electronic window; install ICT to link revenue authorities and border
customs agents
Eliminate non-tariff barriers (NTBs): Reduce number of road checks and
weighbridges on routes; remove restrictions on business licensing and
imports including price controls
Eliminate all taxes and tariffs on fertilizers

viii
3. Allocate budget to establish a fund to support innovative fertilizer financing
mechanisms and operationalize the Africa Fertilizer Financing Mechanism (AFFM).
Goal: Establish a fund to support innovative finance activities for the fertilizer value chain
Issue Recommendation (Country or Regional)
National fertilizer financing facilities
for input suppliers
Dedicate part of CAADP agriculture budget commitment
to establish national fertilizer financing fund to support
imports, storage, distribution capacity, etc.
Operationalizing the AFFM at the
AfDB
Countries contribute to support and make the AFFM
operational
4. Public-private dialogue and joint action on fertilizer policy
Goal: Establish an inclusive policy environment and institutions to accelerate policy
responsiveness to market needs and increase private investment
Issue Recommendation (Country or Regional)
Conducive policy and institutional
environment to stimulate and
increase private investment
Support public-private sector platforms on fertilizer
policy, with regular meetings to review challenges and
provide solutions
Subsidy design and implementation:
Limit subsidies to targeted or “smart”
subsidies that are gender friendly
Joint government and private sector design and
implementation of the subsidy program; Private sector
imports and distributes the fertilizer; government
regulates
These recommendations can be implemented in the short-, medium- or long-term depending on
country or regional priorities and the available capacity. Section 5 provides more detailed
recommendations in addition to a tabular summary of the status of fertilizer policies for some
countries and recommendations for reforms.

1
Developing Competitive Fertilizer Markets in Africa: Policy Lessons from FTF Country Assessments
1. Background
Following the Maputo Declaration of 2003, the continental commitment to the agriculture sector
intensified and important progress has been achieved – and lessons learned – in implementing
the Comprehensive Africa Agriculture Development Programme (CAADP). In 2014, the African
Union Commission (AUC) organized a series of meetings during the 10th Anniversary of
CAADP highlighting the importance of agriculture in combating food security and also laying
the strategic actions to raise productivity for the next decade.
Unlike developed countries, where manufacturing and service industries contribute significantly
to their gross domestic product (GDP), the agriculture sector in SSA accounts for over one-third
of GDP and export earnings and employs over 60 percent of the population. Therefore, a number
of stakeholders including international organizations have focused on improving this sector in
order to get these countries out of poverty. The G-20 has already committed $20 billion for
agricultural development and related efforts to reduce world hunger, the bulk of which is
intended for SSA countries. The CAADP framework sets a target of 6 percent annual growth in
agricultural productivity through the allocation of at least 10 percent of national budgets to the
agriculture sector for those countries that sign onto the Compact.
The last decade has seen unprecedented and sustained economic growth in SSA, and a number of
countries are currently enjoying some of the highest economic growth rates in the world. In
recent years, Africa achieved a high growth rate of 5 percent, well above the world average
(United Nations Economic Commission for Africa [UNECA], 2012). However, much of this
growth has been fueled by a boom in the mineral and petroleum industries. The agriculture
sectors have not grown commensurately due to a number of factors, including low use of
improved inputs and technologies, high population growth rates and volatile international
markets that impact profitability at the farm level. Accordingly, SSA is still experiencing high
levels of poverty, food insecurity and malnutrition.

2
The low use of inputs, especially fertilizers, serves as a brake on agricultural growth. The
continent meets just 10 percent of the world average application rate for fertilizers. More
nutrients are being removed through crop harvesting than are added back to the soil through the
use of fertilizers (Henao and Baanante, 1999). Since the 2006 Abuja Declaration on Fertilizer
for an African Green Revolution, some modest progress has been made in policy to support
market development to raise fertilizer consumption through concerted efforts of key
stakeholders. There have been positive developments in the areas of policy and regulations,
private sector provision and distribution of fertilizers, and government interventions to improve
access to fertilizer by poor resource farmers. Nevertheless, current fertilizer policies in SSA are
still not adequately conducive to the establishment of competitive, private sector-led fertilizer
marketing systems to deliver to farmers the fertilizer quantities needed at the right time and place
and at an affordable price. As a result, fertilizer use levels are still lower than the targets.
This paper reports on current policy status in FTF countries, offers lessons and experiences and
provides recommendations to strengthen access to fertilizers by smallholder farmers. The
experiences and lessons learned from policy design and implementation processes can provide
the basis for future policy deliberations and reforms.
The remainder of this paper is organized as follows. Section 2 gives an overview of the
challenges facing the agriculture sector in Africa, potential role of fertilizers in raising
productivity, and the estimated amount of fertilizers required to meet the growth targets in the
national agricultural plans for these countries. Section 3 provides insights into the nature of trade
barriers, infrastructure constraints, and subsidy-related challenges and what is needed to improve
access to fertilizer by smallholder farmers. Section 4 delves into specific supply and demand
issues including cross-cutting constraints and policies needed to build sustainable fertilizer
markets. Section 5 concludes with specific recommendations for particular Feed the Future
countries and four policy areas with goals and suggested actions in support of the African Union
agenda at country and regional level.

3
2. Key Agriculture Challenges in Sub-Saharan Africa
This section provides an overview of why many stakeholders are focused on agriculture and the
potential role fertilizer can play to alleviate challenges facing the sector. The agriculture sector in
sub-Saharan Africa (SSA) accounts for about a third of GDP and for many countries,
60-90 percent of employment, which implies relatively low labor productivity. Therefore,
accelerating growth in agriculture is one way to reduce poverty and hunger including generating
off-farm employment among other approaches.
Unlike the rest of the world where this is decreasing, the number of malnourished people in
Africa is rising and the proportion of undernourished is increasing (FAO, 2013); therefore,
World Food Summit (WFS) and Millennium Development Goals (MDG) targets have not been
met thus far (Figure 1).
Source: FAO (2013).
Figure 1. Trend in Undernourished for Africa Compared to All Developing Countries
All Developing Countries Africa

4
While most of the malnourished are located in Asia, the highest proportion of malnourished
people (relative to total populations in these regions) is in African countries, with women and
children constituting the most vulnerable groups.
Some of the key challenges facing the agriculture sector in Africa are discussed below: soil
nutrient depletion, low agricultural productivity, increasing population and declining arable land
per capita and climate change.
While average nutrient application rates in SSA are barely 11 kg/ha (Figure 2), soil nutrient
depletion for some countries is higher than 50 kg/ha per annum, leading to soil degradation
through leaching and erosion (Henao and Baanante, 1999). Fertilizer application rates per hectare
in SSA are the lowest in the world at an equivalent of 3 percent of Asia’s and 9 percent of North
America’s application rates. The average application rate in North Africa is 120 kg/ha, which is
the highest in the African region.
11
24
55
120
Sub-SaharanAfrica
Africa
South Africa
North Africa
Source: Derived from FAO data.
Figure 2. Fertilizer Nutrient Use by Regions (2012, kg/ha)
Yields for cereal crops in Africa are a small fraction of those in Asia or developed countries and
far less than their potential. Furthermore, these yields have not shown any significant increase

5
over time. Within the continent, there are differences in yields across sub-regions with SSA
having lower and relatively stagnant yields than those for other regions in the world (Figure 3).
0.5
1.0
1.5
2.0
2.5
3.0
3.5
4.0
4.5
1961 1966 1971 1976 1981 1986 1991 1996 2001 2006 2011
mt
/ h
a
Developed Countries
Asia Developing
Latin America
Sub-Saharan Africa
Source: IFDC, using available data from FAO.
Figure 3. World Cereal Yields (mt/ha)
The current low rates of fertilizer application and the corresponding poor yields for SSA act as a
depressing force for future investments in improved technologies and methods, due to the
insufficient returns to labor and land constrained by poor soil conditions, exacerbated by nutrient
depletion.
Declining land per capita coupled with increasing population is posing a challenge to increasing
production in some of these countries. In the past, increased agricultural production in SSA has
partly been a result of expansion in cultivation of available arable land as opposed to increased
yield (as has happened in Asia; Figure 4).

6
Figure 4. Intensification vs. Area Expansion (Asia and SSA)
But over time, agricultural extensification is becoming increasingly difficult, as farm sizes
become smaller and arable land is limited, coupled with increasing population. This implies that
the focus should be on land-augmenting technologies such as mechanization, irrigation and
improved seeds and fertilizers coupled with best management practices. Without land reforms or
a substantial decline in the share of labor engaged in agriculture, African countries will have
difficulties initiating the process of agricultural and structural transformation.
2.1 Consumption and Role of Fertilizers in SSA Agriculture
Fertilizer played an equally important role as seed during the Green Revolution, contributing
more than 30 percent of the yield growth in Asia (Hopper, 1993). Apart from raising land
productivity, use of fertilizers can contribute to increased labor productivity, total farm
production and smallholder incomes, which provide an opportunity to participate and earn off-
farm income.
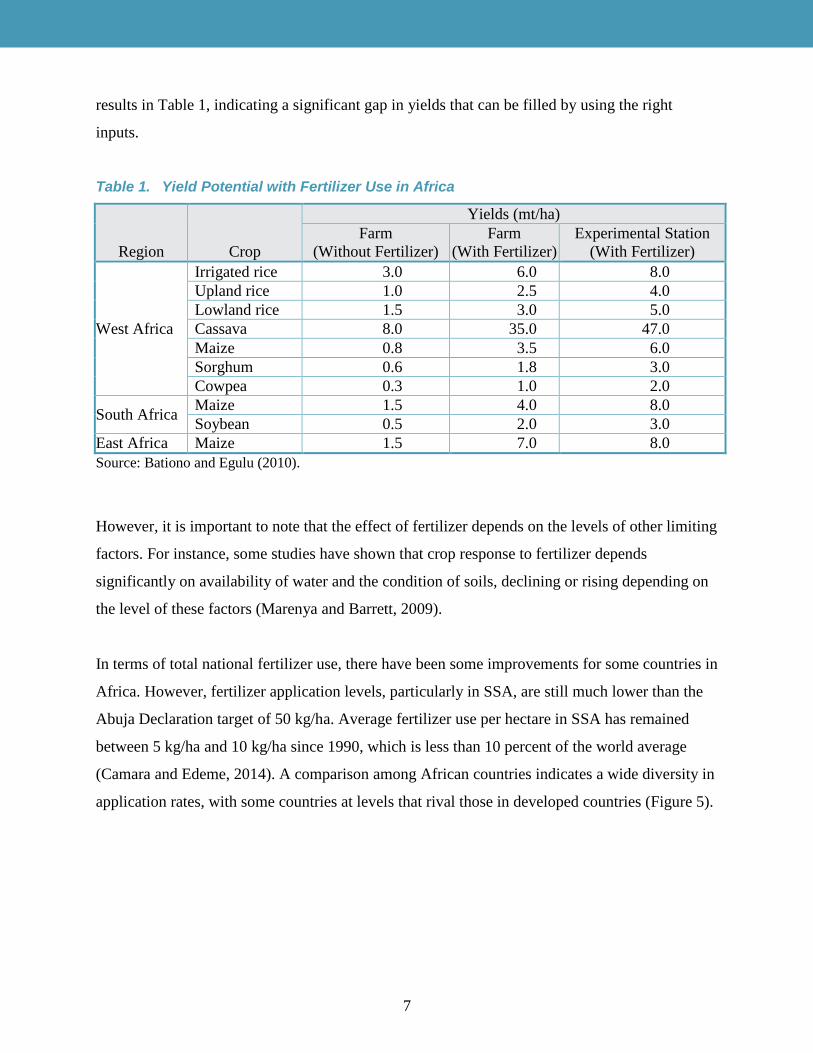
Table 1 illustrates the potential yields associated with fertilizer use on major food crops in
various agro-ecological regions of Africa (Bationo and Egulu, 2010). Other studies agree with the
7
results in Table 1, indicating a significant gap in yields that can be filled by using the right
inputs.
Table 1. Yield Potential with Fertilizer Use in Africa
Region Crop
Yields (mt/ha)
Farm
(Without Fertilizer)
Farm
(With Fertilizer)
Experimental Station
(With Fertilizer)
West Africa
Irrigated rice 3.0 6.0 8.0
Upland rice 1.0 2.5 4.0
Lowland rice 1.5 3.0 5.0
Cassava 8.0 35.0 47.0
Maize 0.8 3.5 6.0
Sorghum 0.6 1.8 3.0
Cowpea 0.3 1.0 2.0
South Africa Maize 1.5 4.0 8.0
Soybean 0.5 2.0 3.0
East Africa Maize 1.5 7.0 8.0
Source: Bationo and Egulu (2010).
However, it is important to note that the effect of fertilizer depends on the levels of other limiting
factors. For instance, some studies have shown that crop response to fertilizer depends
significantly on availability of water and the condition of soils, declining or rising depending on
the level of these factors (Marenya and Barrett, 2009).
In terms of total national fertilizer use, there have been some improvements for some countries in
Africa. However, fertilizer application levels, particularly in SSA, are still much lower than the
Abuja Declaration target of 50 kg/ha. Average fertilizer use per hectare in SSA has remained
between 5 kg/ha and 10 kg/ha since 1990, which is less than 10 percent of the world average
(Camara and Edeme, 2014). A comparison among African countries indicates a wide diversity in
application rates, with some countries at levels that rival those in developed countries (Figure 5).

8
588
309
242
7354 53 49
30 30 29
0
100
200
300
400
500
600
700K
g p
er H
ecta
re
Source: FAO data.
Figure 5. Fertilizer Consumption (Nutrients, NPK kg/ha) for Some African Countries, 2012
The small size of national fertilizer markets in SSA pose a challenge raising unit costs as
fertilizer moves through the supply chain eventually getting to farmers at twice the prices of the
same products in the United States or elsewhere in the global market (Gregory and Bumb, 2006).
Economies-of-scale are possible with the creation of regional markets. In addition, different tax
regimes and non-tariff barriers (NTBs) in some countries hinder robust inter- and intra-country
trade distorting prices and raising costs of business.
2.2 Fertilizer Requirements from 12 FTF Country Market Assessments
The IFDC fertilizer market assessment studies (on which this report is based) estimated the
quantities2 of fertilizer required to meet the agricultural production targets laid out in each
country’s agricultural strategic plans under the CAADP Compact. The table below shows the
current levels against the estimated consumption based on the agricultural growth targets.
2 These are based on the nutrient removal approach, which estimates the amount of nutrients required to achieve
projected crop production levels in the country agricultural development plans. Detailed information on the
approach used can be obtained from the specific country reports at http://ifdc.org/research-papers-and-studies/.

9
Table 2. Estimated Fertilizer to Meet FTF Country Agricultural Growth Targets
Country Current Consumption (mt/yr) Target Consumption (mt/yr) Increase Factor
Ethiopia 550,500 1,200,000 2.2
Ghana 200,000 400,000 2.0
Kenya 488,800 910,000 1.9
Mozambique 51,600 225,000 4.4
Tanzania 263,000 528,000 2.0
Rwanda 35,000 144,000 4.1
Uganda 50,000 310,640 6.2
Malawi 297,000 600,000 2.0
Zambia 250,000 498,000 2.0
Liberia 3,000 28,000 9.3
Senegal 87,000 239,400 2.7
Mali 250,000 550,000 2.2
Note: Since these assessments were conducted between 2012 and 2015, the “current” consumption
numbers may have changed. The above numbers are fertilizer product equivalents, not nutrients.
Source: IFDC Market Assessments conducted 2012-2015.
The results show that these countries need to more than double their current consumption levels
in order to meet strategic growth targets for the agricultural sector. The following sections
provide insights on how these targets (yield and fertilizer use) can be met by tackling the policy
and regulatory frameworks to encourage investments and spur increased adoption of fertilizers.
3. Challenges and Policies Constraining Fertilizer Markets in SSA
This section looks at some challenges and policies that constrain fertilizer markets in SSA,
mostly associated with public goods or government interventions in the form of taxes, tariffs,
subsidy programs, and poor infrastructure. Demand- and supply-side constraints to market
development are also analyzed, including cross-cutting issues touching on financing and gender.
Section 4 concludes with an analysis of the current status of fertilizer policies in some Feed the
Future countries in SSA and possible changes or actions for developing sustainable, inclusive
and competitive fertilizer markets with the capacity to deliver the right type of fertilizers to
smallholder farmers in order to fill the gaps identified in Tables 1 and 2.
Table 3 provides a summary of these challenges requiring specific interventions at the
continental, regional and country level to encourage competitive and sustainable markets and

10
increase access to fertilizers for farmers. These are explained in more detail in the following sub-
sections.
Table 3. Summary of Key Challenges to Market Development in SSA
Policy Challenges
Legal and Regulatory Framework**:
Outdated regulations
Limited physical and human capacity for quality
inspections
Inadequate enforcement of quality standards
Market Restrictions / Interventions:
Barriers to entry
Restrictions on imports
Restrictions on domestic marketing
Allocation of market shares to enterprises at
district/province level
State importation and distribution
Trade Policy:
Tariff (tax, duties on imports)
Non-tariff (police road checks, weighbridges,
permits, delays at borders)
Different standards for fertilizer within region
(EAC, COMESA, SADC)
Low cross-border trade activity
Price Controls:
Pan-regional pricing
Price supports, subsidies
Supply Side:
Manufacturing and blending capacity in Africa
Agro-dealer training
Inadequate port handling facilities – delays and
costs
Transportation bottlenecks – weighbridges,
police checks, axle loads: in-transit costs
Demand Side:
Small size of fertilizer markets (demand) leading
to higher per unit costs
Underdeveloped output markets or poor linkages
to output markets
Outdated fertilizer recommendations that reduce
yield response
Distance traveled to purchase fertilizers
Cross-Cutting:
Finance
Women and Youth Challenges
Note: Topics with ** will be covered in Section 4 below and so will not be covered under this section.
3.1 Import and Custom Procedures and Regulations Relating to Fertilizer Trade
The Abuja resolution on trade aims at encouraging trade within Africa. With regards to inter- and
intra-regional economic community (REC) trade, most fertilizer consumed in Africa is imported
from outside the continent and almost all of the phosphate rock and fertilizers produced in Africa
are exported out of the continent. In general trade among African countries accounts for only
10 percent of their total external trade (UNECA, 2012). With regard to inter-regional trade
within Africa, countries such as Tanzania import fertilizers from manufacturers in Egypt, South
Africa and Tunisia. Cameroon imports from Côte d’Ivoire and Tunisia. Regarding intra-regional
trade, countries in southern Africa, such as Botswana, Lesotho, Namibia and Swaziland, import

11
fertilizers from South Africa; Uganda imports fertilizers from Kenya and South Africa. However,
in many cases, intra-regional imports are from countries outside the continent. For instance,
Burundi, Rwanda and Uganda import their fertilizers from overseas via the ports of Mombasa in
Kenya and Dar es Salaam in Tanzania.
Approximately one-third of countries have import duties and half the countries levy some form
of tax on fertilizers in SSA (Wanzala, 2011). In some countries the tax is on services, materials
and incomes that might indirectly impact on fertilizer costs and hence prices. Kenya levies a
refundable value-added tax (VAT) on services and materials used in relation to handling of
fertilizers during importation. The problem is the time taken to refund this tax, which leads to
additional finance costs to importers. For Uganda, importers are charged withholding tax, which
can be deducted (or not deducted) from taxes when importers eventually do their tax returns and
find that they were over (or under) charged. These two taxes may impact farm-gate prices since
they are implemented at the point of importation and take time to get refunded, incurring costs in
the process. At the time of conducting this assessment in 2012, Zambia had a foreign exchange
policy that required all trade be conducted in Kwachas, the local currency, thus exposing
importers to the risk of currency fluctuations. However, in 2014, facing a rapid devaluation of
the Kwacha, the government scrapped exchange control regulations.
There are barriers to market entry in various countries including restrictions on fertilizer
importation, restrictions on who can sell fertilizers in certain districts within a country and state
involvement in importation and distributions. Trade policies discourage investment by raising the
costs of business through tax and non-tariff regimes that inhibit enterprise development. These
include differential quality standards across countries and regions and restrictions on prices
through price controls or support. These actions restrain free trade domestically and
internationally, which reduces the benefits accruing to smallholders.
The impact of NTBs on fertilizer use is difficult to estimate. There are many inspections or road
stops for checks by police or customs officials along the transport routes from ports to hinterland
destinations (for oceanfront as well as for landlocked countries). Weighbridges meant to
implement axle-load regulations and weights often create logjams and further increase rent-
12
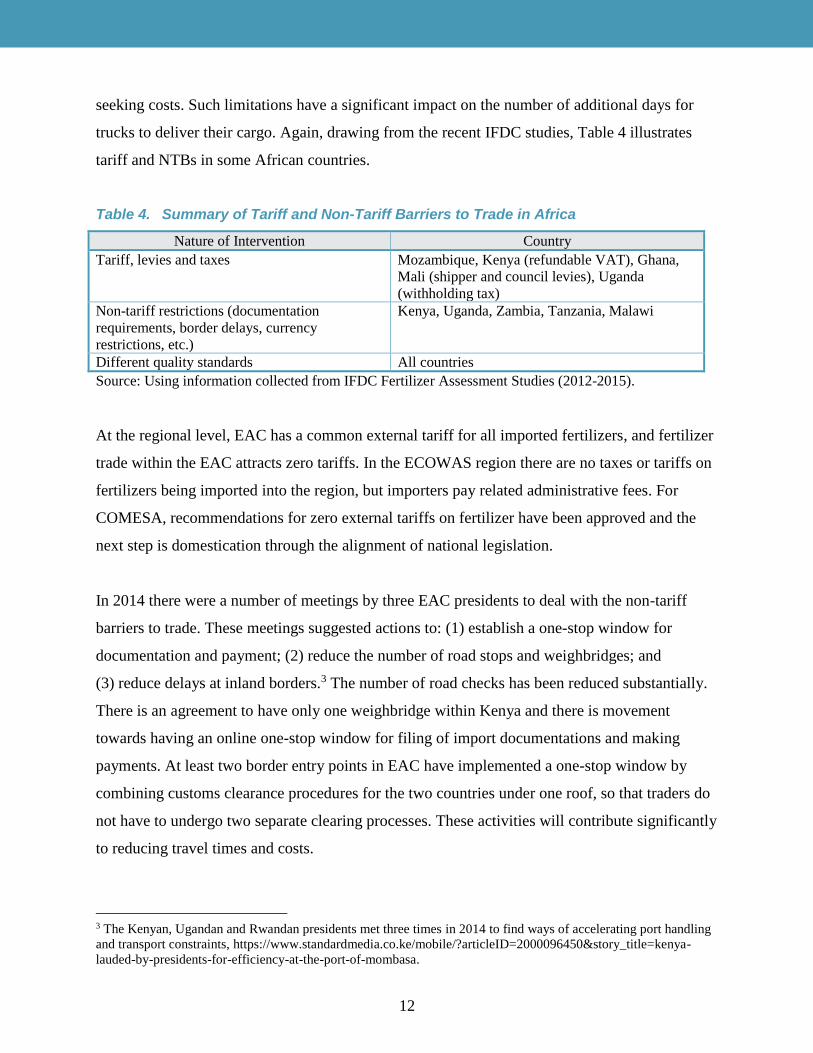
seeking costs. Such limitations have a significant impact on the number of additional days for
trucks to deliver their cargo. Again, drawing from the recent IFDC studies, Table 4 illustrates
tariff and NTBs in some African countries.
Table 4. Summary of Tariff and Non-Tariff Barriers to Trade in Africa
Nature of Intervention Country
Tariff, levies and taxes Mozambique, Kenya (refundable VAT), Ghana,
Mali (shipper and council levies), Uganda
(withholding tax)
Non-tariff restrictions (documentation
requirements, border delays, currency
restrictions, etc.)
Kenya, Uganda, Zambia, Tanzania, Malawi
Different quality standards All countries
Source: Using information collected from IFDC Fertilizer Assessment Studies (2012-2015).
At the regional level, EAC has a common external tariff for all imported fertilizers, and fertilizer
trade within the EAC attracts zero tariffs. In the ECOWAS region there are no taxes or tariffs on
fertilizers being imported into the region, but importers pay related administrative fees. For
COMESA, recommendations for zero external tariffs on fertilizer have been approved and the
next step is domestication through the alignment of national legislation.
In 2014 there were a number of meetings by three EAC presidents to deal with the non-tariff
barriers to trade. These meetings suggested actions to: (1) establish a one-stop window for
documentation and payment; (2) reduce the number of road stops and weighbridges; and
(3) reduce delays at inland borders.3 The number of road checks has been reduced substantially.
There is an agreement to have only one weighbridge within Kenya and there is movement
towards having an online one-stop window for filing of import documentations and making
payments. At least two border entry points in EAC have implemented a one-stop window by
combining customs clearance procedures for the two countries under one roof, so that traders do
not have to undergo two separate clearing processes. These activities will contribute significantly
to reducing travel times and costs.
3 The Kenyan, Ugandan and Rwandan presidents met three times in 2014 to find ways of accelerating port handling
and transport constraints, https://www.standardmedia.co.ke/mobile/?articleID=2000096450&story_title=kenya-
lauded-by-presidents-for-efficiency-at-the-port-of-mombasa.

13
3.2 Investment in Infrastructure Including Ports and Roads
There is inadequate port and transport infrastructure in SSA, which results in high freight rates
and port charges. Limited port capacity results in the use of small vessels (15,000 mt). Ports are
congested due to poorly maintained or an insufficient number of cranes, inefficient bagging
equipment and limited warehousing capacity. The result is significant delays before berthing and
low discharge rates, both of which generate high demurrage costs for importers (Figure 6). As a
result, fertilizer prices ex-port are typically at least $200 higher than the free-on-board prices on
the world market (Wanzala and Groot, 2013).
20000 t
Cargo Ship
Arrives
Ship
Berths
Ship Unloads Transport
to CFS
(storage)
Inland
Transport
(deport or
sell)
7-10 days
10 days @
2000 t / day:
Labor & Equip
10 days
Poor road Trucks, road,
rail
Schematic of Major Operations at Port
Source: Extracted from IFDC’s Kenya Fertilizer Assessment (2012) study4.
Figure 6. Schematic of Major Port Operations
Inland haulage is expensive due to the poor condition of road and rail networks. Although rail
transport is potentially 30 percent cheaper than moving fertilizers by road, it is unreliable due to
railway lines that are not well maintained. The key challenges faced by ports are listed in Table 5
(but are not necessarily applicable to all ports). Consequently, importers and agro-dealers prefer
to use trucks to transport their fertilizers, even though it is more costly due to long distances
between ports and agricultural production areas, poor road conditions, frequent stops for
inspection and inadequate competition among trucking companies.
4 Since the time of the study, clearance at port of Mombasa has improved due to above efforts. This requires another
study to gauge impact of recent efforts to reduce demurrage costs.

14
Table 5. Port and Inland Haulage Constraints in Africa
Ports
Small, shallow, congested
Poor equipment
Slow discharge of cargo
Inadequate storage
Poor management
Inland Haulage
Poor rail and road networks
Inadequate rail loading equipment
Many road inspection stops and
weighbridges
Inland border delays (NTBs)
Source: Using information collected from IFDC FTF Fertilizer Assessment Studies.
Due to this forced reliance on roads, transportation from the time the ship docks until the goods
reach warehouses in major locations in East Africa (i.e., Nairobi, Kigali and Kampala) can
require more than 30 days. Figure 7 compares average times spent by vessels offloading their
cargo and leaving port. A vessel through Mombasa requires an average of 23 days from its
arrival to leaving port. Land transportation is the major post-port cost and is relatively more for
landlocked countries.
0
5
10
15
20
25
Los Angeles Europe Hong Kong & Singapore
Mombasa
Source: The Research on the Cross-Border Transport Infrastructure: Phase 3, Japan International Cooperation
Agency (JICA) (2009).
Figure 7. Average Vessel Dwell Time at Various Ports in Africa

15
3.3 The Nature and Challenges of Fertilizer Subsidies in Africa
About two-thirds of the countries in SSA have fertilizer subsidy programs and approximately
40 percent of the fertilizer consumed is subsidized. Expenditure on subsidies runs into billions of
dollars each year and, on average, subsidies account for 30 percent of national agriculture
budgets (Gilbert, Jayne and Shively, 2011; Wanzala and Groot, 2013; Jayne and Rashid, 2013).
Table 6. Fertilizer Subsidy and Public Agricultural Expenditures in Selected African Countries, 2008-2011
Country Year
Program Cost
(millions
U.S. $)
[A] per MT of program
fertilizer distributed
(U.S. $/MT)
Public expenditure
on agriculture
(million U.S. $)
[A] as a
percentage of
[C]
[A] [B] [C] D
Mali 2011 38.6 890 213 18.1
Burkina Faso 2010 21.7 867 259 8.4
Ghana 2011 111.7 634 374 29.9
Senegal 2010 42.4 785 163 26.1
Nigeria 2010 190.0 719 729 26.0
Kenya 2011 61.1 1,072 318 25.7
Malawi 2011 179.2 1,200 308 58.3
Tanzania 2011 134.1 1,056 291 46.0
Zambia 2011 134.8 1,310 438 39.9
Ethiopia 2011 55.0 130 530 10.4
Source: Jayne and Rashid, 2013.
The motivation behind subsidies cited by governments takes different forms: introduction of
improved technologies to farmers, who will then be incentivized by good returns to purchase
their own fertilizers; provision of other inputs like improved seeds; and encouragement of
fertilizer use in order to raise production nationally and end food insecurity.
These subsidies range from non-targeted/universal with complete government control of all
aspects of the subsidy program to targeted programs with importation and distribution
exclusively carried out by the private sector. Input vouchers are the most commonly used
mechanism to deliver targeted fertilizer subsidies. Subsidy programs in Africa can be divided
into four broad categories (Table 7).

16
Table 7. Four Categories of Subsidy Programs in Africa
Government Distribution Private Sector Distribution
Non-targeted subsidy Government importation and
distribution (e.g., Burkina Faso,
Kenya)
Private sector importation and
distribution (e.g., Senegal)
Targeted subsidy Private sector importation,
government distribution
(Malawi, Zambia)
Private sector importation and
distribution (Ghana, Kenya,
Tanzania, Rwanda)
Source: Wanzala and Groot, 2013.5
3.3.1 Non-Targeted Subsidy with Government Importation and Distribution
The subsidy is not targeted to specific crops or types of beneficiaries and therefore all farmers
(large, medium and small) willing to pay the subsidized price can access the fertilizer on a first-
come, first-served basis. Importation of the fertilizer for the subsidy program is by the
government or by the private sector on behalf of the government, based on the estimated national
requirement and the available budget. The government or private sector delivers the fertilizer to
warehouses in rural areas owned by the Ministry of Agriculture or a government parastatal.
3.3.2 Non-Targeted Subsidy with Private Sector Importation and Distribution
Private companies import the fertilizer for the subsidy program based on the government’s stated
requirements and deliver through the market channels involving distributors and retailers at full
market price. Farmers buy the fertilizer from retailers at the subsidized price, and retailers submit
the requisite documentation to the government for reimbursement. No vouchers are necessary in
this case but retailers or agro-dealers need to show documentation of sales volumes.
3.3.3 Targeted Subsidy with Importation and Distribution by Private Sector
Private companies import fertilizers based on their own market demand assessment including
information from the government on the amount of fertilizer to be distributed to selected farmers
based on vouchers issued to beneficiaries. Importers deliver the fertilizer to the regions and
distributors and retailers purchase it at market price. Retailers sell fertilizer at the subsidized
price to farmer beneficiaries with vouchers and keep these vouchers to submit to the importers or
a participating bank for payment of the value of the voucher. The importer or bank submits an
5 This categorization of subsidy programs and accompanying narrative is taken from Wanzala and Groot (2013) and
Wanzala, Fuentes and Mkumbwa (2013).
17
invoice for the value of the voucher to the government for reimbursement. These vouchers are
distributed ahead of time by district officers and extension agents, based on a list of target
beneficiaries generated at the district and village level.
3.3.4 Targeted Subsidy with Importation by Private Sector and Distribution by Government
The private sector imports the fertilizer on behalf of the government and sells it to the
government at an agreed price. The government then distributes the fertilizer using its own
networks, typically via the Ministry of Agriculture or a government parastatal. The fertilizer is
sold at subsidized prices from the government rural warehouses to farmers in exchange for
vouchers. The vouchers will have been previously printed by the Ministry of Agriculture and
distributed to eligible beneficiaries who have been selected by using criteria developed by
district officers, the local community and village committees.
Some countries have two types of subsidies running alongside each other. For example Kenya
has two parallel subsidy programs, targeted and universal. The targeted subsidy is implemented
through the private sector while the universal subsidy is implemented by a state agency using its
distribution networks.
Though some subsidy programs have created an uncertain environment and displaced the private
sector, there are examples of countries in Africa where a conducive policy environment has
encouraged private investment and engagement in the fertilizer market.
Box 1. Case Study, Kenya: Privatization Leading to Lower Margins and Reduced
Distance to Retailers
A combination of the liberalization of input and maize markets and public investments in support
of smallholder agriculture led to tangible private investments in fertilizer retailing and maize
marketing in Kenya during the period 1990-2007 (Ariga and Jayne, 2009). There was significant
growth in fertilizer use and productivity resulting in a 34 percent increase in smallholder
application per hectare of maize and 18 percent increase in maize yields. National consumption
increased from 250,000 mt in 1990 to 400,000 mt of fertilizer products in 2007. The increased
competition led to reduction in domestic marketing margins and distance travelled by farmers to
agro-dealers to purchase fertilizer. Good public policy and provision of supportive services
played a key role in this.

18
Aggregate data on fertilizer consumption trends in some countries have shown sharp declines
following agriculture sector reforms leading to abrupt government withdrawal before the private
sector was ready to take over the activities that were previously undertaken by state. No
consistent effort was made to nurture the private sector through improved technical and business
knowledge including access to finance.
There are disadvantages emanating from design of programs that create barriers to market entry.
In Rwanda, the government recently replaced the system of government importation of fertilizers
and distribution by the private sector with a new system in which the private sector imports and
distributes fertilizers. In Rwanda, importers/distributors and the government negotiate and fix
retail ceiling prices together.
Box 2. Case Study, Rwanda: A Step Toward Private Sector Importation and Distribution
Rwanda has made a lot of progress in the last five years toward private sector importation and
distribution from a hitherto state-controlled subsidy system where the state imported and the
private sector distributed under a bidding system that assigned distributors certain districts of the
country. The state has now withdrawn and allowed a few private players to participate in both
importation and distribution. However, there are joint public-private discussions to set the ceiling
for retail prices. The impact of these changes remains to be seen considering that it has been
difficult to get farmers to pay the subsidized price and the private sector faces financing
challenges. But as the Kenya case study shows, it takes some time for impacts to be discernible
as players figure their way to get cheaper financing and build networks and farmers recognize
the benefits of using fertilizer and are willing to pay to access it.
The implementation of subsidy programs has faced many challenges including the disruption to
private sector investments, which does not augur well for sustainable systems, as state funding
for subsidies is not guaranteed. By their nature, non-targeted subsidies are available to farmers
who would normally purchase fertilizers at market price, thus reducing the customer base for the
private sector by reducing the amount of effective demand for commercial fertilizers. Subsidized
fertilizer is often delivered late, whether via government channels or by the private sector, due to
delays in budgetary approval and tendering. Consequently, farmers apply the fertilizer late,
which reduces the yield benefits and discourages farmers from investing in fertilizers the next
season, even at subsidized prices. In addition, the process of voucher redemption is too
cumbersome. This is typically the case where farmers have to track down extension agents and
19
district officials to obtain vouchers. In addition to creating high transaction costs, this system
also creates opportunities for rent-seeking. Further, retailers may refuse to accept the voucher if
they will have difficulty redeeming it.
3.4 Supply-Side Constraints
On the supply side, the key areas constraining market development are: low manufacturing
capacity on the continent which relies mostly on imports, poor capacity of agro-dealers to run a
business and also to impart knowledge to farmers, easing of port operation delays to reduce costs
and minimizing bottlenecks from port to the farm-gate, especially the number of road checks and
weighbridges that provide opportunities for rent-seeking in addition to raising direct costs of
transport; some of these have been discussed under Section 3.1 and 3.2 above.
The Abuja resolution on increasing fertilizer production has seen some progress in Africa over
the past two decades. There are a number of investments in fertilizer production (manufacturing
and blending) in Africa that are either in the pipeline or already underway. Fertilizer production
in Africa increased from 4.9 million mt of nutrients in 1990 to 7.4 million mt in 2013, mostly in
Egypt, Morocco, South Africa and Tunisia which account for over 90 percent of Africa’s
fertilizer production (Wanzala and Groot, 2013). There are feasibility studies being undertaken in
several counties in SSA by international investors. Nigeria is currently the only urea producer in
SSA. With regard to fertilizer blending, almost half of the 15 ECOWAS member states have
fertilizer bulk blending plants (Camara and Edeme, 2014) and also in COMESA several states
have bulk blending plants (Kenya, Malawi, Zambia, Zimbabwe). In Tanzania, the Minjingu
Phosphate Fertilizer Manufacturing Company is now granulating nitrogen-phosphorus-sulfur
(NPS) micronutrient-enriched formulation that can be used as a basal dressing and is cheaper
than diammonium phosphate (DAP), and is aiming to serve the regional market. Ethiopia has
also established a number of blending plants (Camara and Edeme, 2014). In Mozambique,
international investors are keen on opportunities for urea production based on proven offshore
gas reserves, and a Brazilian mining company has conducted a study to estimate phosphate

20
reserves. Other explorations for various fertilizer nutrient deposits are ongoing in a number of
countries, including for potash in Ethiopia, Ghana and others.6
Agro-dealer training and recruitment has several benefits, including (1) increasing competition,
which reduces prices, and (2) reducing the distance from farm to purchase point as a result of
competition. Due to relatively low demand in most of these areas, competition is stifled and
incentives for businesses to engage in the fertilizer sector are diminished. However, for the
supply side to work effectively, the demand side has to be engaged, which requires a two-
pronged approach.
3.5 Demand-Side Constraints
Effective demand by farmers can act as a magnet to attract increased supply. The small fertilizer
markets in these rural markets are reflected in the high fertilizer prices, which deter further
purchases. African smallholders consume relatively less fertilizer compared to other countries for
a number of reasons: (1) poor linkages to output markets and therefore reduced demand for
inputs because the farmers cannot sell their surplus output and receive the purchasing power to
access improved inputs; (2) poor information on market prices for outputs and inputs; (3) long
distances to purchasing points, which raises the transaction cost; (4) the poor state of rural feeder
roads; (5) outdated fertilizer recommendations, which implies low productivity, low profits and
hence low demand for fertilizers; (6) poor knowledge about correct fertilizer use due to non-
existent or inadequate extension services; and (7) lack of information on the benefits accruing
from using fertilizer.
Farmer access to fertilizers can be accelerated by farm demonstrations and fertilizer trials
accompanied by radio and other media dissemination of relevant data on fertilizer use, prices,
etc. There may be a need to provide funding to ministries to implement these activities including
extension advice to raise awareness on the benefits of using fertilizer and market information. To
complement awareness efforts, it is also important to link farmers to markets and provide finance
services to the rural sector through microfinance institutions (MFIs).
6 A comprehensive assessment of fertilizer raw material resources in 12 FTF countries can be accessed in the IFDC
report, Fertilizer Country Assessment Studies for Sub-Saharan Africa: Fertilizer Raw Material Resource Assessment
(IFDC, 2014)

21
Though there are no definitive studies to validate this, targeted subsidies can increase demand
from poor farmers who otherwise are excluded from the market since they do not have the
purchasing power to buy fertilizer. Subsidies can also be used to demonstrate the benefits of
fertilizer use to farmers who are unfamiliar with fertilizer and how to use it correctly to
maximize their agronomic and economic returns.
Outdated recommendations are a problem due to lack of access to soil maps and tests. If an
analysis was conducted on the losses accruing from using the wrong fertilizers on soils whose
contents are unknown and crops whose nutrient needs are not aligned to the types of fertilizers
used by smallholder farmers across Africa, losses would likely amount to billions of dollars.
These losses are both from the investments in fertilizers themselves and the soil nutrient
depletion that could have been prevented if the correct fertilizers were applied. Fertilizer
recommendations should vary by location and crop, but currently fertilizer recommendations in
SSA are sometimes uniform throughout the country or across different crops. Research is needed
to identify differences in soils and the micronutrient requirements in each location. Similarly, the
nutrient requirements of each crop are different and need to be taken into account in developing
fertilizer recommendations. Ethiopia has tackled this problem by doing soil mapping
accompanied by identification of nutrient deficiencies accompanied by investments in blending
facilities to respond to the need for targeted products.
3.6 Incorporating Women and Youth in Value Chains
It is well documented that women are the majority of the breadwinners in most African
smallholder farm households, accounting for more than 60 percent of the workforce. However,
they have lower productivity (less yields) due to more limited access to resources (land, credit
and other inputs) compared to their male counterparts (Anríquez, 2010). Clearly, addressing
gender inequity and putting assets, inputs and other technologies into women’s hands will have
huge implications for food security, equity and poverty reduction. Key actions required to
empower women in this regard are:
Improve access: to services, markets and income for their produce, land and other income-
generating assets.

22
Education is an important aspect of empowering women: most women are disadvantaged
in terms of education opportunities. Typically, some cultures educate boys over girls. A
deliberate policy to target women and provide training to establish basic literacy and promote
skills development can reduce this gap.
There are information gaps between men and women. Extension services are usually
received by men, since women are usually engaged in farm activities or are not actively
requested to participate. Therefore, unless there is an appropriate location and time, women
may not attend extension training. Where culture does not allow women and men to be
trained together, women extension agents may be needed. Alternatively, there should be
women-only meetings where male dominance may not have negative effects.
Family planning efforts will give women the choice of balancing their family needs with
other activities. High birth rates reduce the capacity of women to participate in productive
ventures because of the demands on their time imposed by a large family. This is particularly
important in rural areas where women tend to be less educated and informed compared to the
urban population.
Putting women in positions of leadership can provide young women and girls with role models.
However, their limited education can create a hurdle to the attainment of such positions. There
should be policies to target qualified women for parliamentary seats and other key leadership
positions. Rwanda has proactively allocated several parliamentary seats to women, an example
that is being emulated by other countries, including Kenya.
Similarly, these strategies need to include activities that have a high likelihood of attracting
youth back to the agriculture sector, by helping them experience farming as an enjoyable,
lucrative way to make a living.
3.7 Finance/Investment in Value Chain Activities
Importers, distributors and retailers face financing challenges involving letters of credit, high
interest rates, inadequate storage capacity, and stiff collateral requirements, which may act as a
barrier to entry. There are well-documented risks associated with agriculture production (price,
weather, policy) that constrain investments. Since the signing of the Abuja Declaration, some

23
governments and donors have launched initiatives to reduce the risk to financial institutions of
lending to importers and agro-dealers. Risk-sharing arrangements can reduce the risk of a
particular individual or organization bearing the full brunt of a bad outcome. These initiatives
include the Alliance for a Green Revolution in Africa (AGRA)/Standard Bank credit guarantee
scheme and the AFAP model, which provides credit guarantees or, in limited instances, matching
investment grants and technical training. Currently, there are few such innovative approaches to
deal with this challenge and improve availability of finance at every level of the fertilizer supply
chain including at the farm level. It may be necessary to introduce legislation to improve access
to foreign exchange and financing (including foreign direct investment) and introduce innovative
financing along the value chain.
4. Conclusions and Recommendations
The overall policy environment in a number of SSA countries is not conducive for private sector
investment as there are no clear and dependable strategies and the policy and regulatory
frameworks are not up-to-date mostly due to inadequate capacity for designing and
implementation coupled with lack of political goodwill in some cases. Sub-section 4.1 describes
the current status of fertilizer policies in some SSA countries and recommends possible changes
or actions for developing sustainable, inclusive and competitive fertilizer markets with the
capacity to deliver the right type of fertilizers to smallholder farmers in order to meet the
potential for crop yields and fertilizer use (Tables 1 and 2). Sub-section 4.2 takes a broader look
at what key areas need more efforts to support countries and the Africa Union to develop and or
improve fertilizer markets.
4.1 Status of Fertilizer Policy Frameworks and Recommended Actions for Some Countries
About one-third of African countries have formal fertilizer policy and regulatory frameworks to
guide the fertilizer sector, while the rest govern their sectors by administrative decree. However,
many of these formal policies and regulations are outdated (enacted in the 1970s and 1980s) and
often are not specific to fertilizers but cover a wide range of inputs and foodstuffs under the same
law. While some have been updated since 2006 (as is the case of Uganda, for example), they

24
have not yet been signed into law and even then they often lack some key elements needed to
encourage increased investments in the fertilizer markets. Moreover, even with the current
regulations, the capacity for enforcement is weak due to poor inspection capacity and inadequate
laboratory equipment for testing and enforcement. Table 8 summarizes the status of fertilizer
policy and regulatory frameworks for some countries in SSA and suggested actions to improve
on the status quo.
Table 8. Status of Fertilizer Policy Frameworks and Suggested Actions for Some Countries
Country Status of Policy Framework
Rwanda Fertilizer policy drafted with support of agriculture stakeholder working group but not
yet approved by parliament.
Significant progress being made in privatizing fertilizer market.
There is increased competition but retail price ceilings set by government and private
sector.
Subsidy: rate at 30% of retail price; planning to adopt nutrient-based approach.
Suggested Actions: Further reforms to increase private sector involvement. More policy analysis and advocacy required to support these efforts. Improve ministry’s policy analysis
capacity
Kenya Fertilizers and Animal Foodstuffs (Amendment) Act 2015 was signed or approved in
October 2015 by President; labs and inspection capacity in place and soil map
completed.
Political system recently devolved from central to county government.
Two parallel subsidy programs in place (targeted and general) with ad-hoc state
intervention.
There is a risk of intervening with county-specific subsidies that may crowd-out the
private sector.
Suggested Actions: Fertilizer trade reforms needed to allow for quick registration of new products. Harmonization of fertilizer policies across COMESA and elimination of tariff and
NTBs. Capacity building at county level on fertilizer policy.
Mozambique Draft fertilizer policy awaiting parliamentary approval; labs and inspection capacity
inadequate.
Small fertilizer market (low adoption, at 5%); most fertilizer imports through
Mozambique are destined for neighboring countries.
Fertilizer market is private sector-driven.
Some subsidy vouchers program run by FAO-EU in some parts of country.
Suggested Actions: Sensitization of farmers on use of fertilizer and soil maps/tests to allow
for scaling up use of fertilizers.
Uganda Draft policy awaiting parliamentary approval.
Like Mozambique; nascent fertilizer use, low demand; labs and inspection capacity
inadequate.
Planning to introduce fertilizer subsidy for the first time.
Suggested Actions: Similar to Mozambique (above) plus assistance to design and implement
“smart” subsidy based on best practices.

25
Country Status of Policy Framework
Malawi No specific “fertilizer” policy (some strategy in place); outdated quality regulations in
place; ad-hoc public directives provide guidelines to fertilizer market; labs and
inspection capacity inadequate.
State-run input and output agencies monopolize distribution of inputs and procurement
of maize, deterring private investment.
Smallholder subsidy program constituted large part of national budget.
IFPRI and MSU involved in a number of research activities in Malawi.
Suggested Actions: There is room for partnerships across organizations (IFPRI, MSU,
IFDC, FAO, others) to assist government develop sustainable agricultural policy and also assistance to design and implement “smart” subsidy based on best practices.
Zambia No fertilizer policy, outdated and weak regulations in existence; labs and inspection
capacity inadequate.
Ad-hoc government directives including on exchange rate regimes that raises risks to
exporters/importers.
AGRA funding review of quality control, upgrading labs and training inspectors.
Suggested Actions: Partnerships to encourage dialogue with policymakers. Regional policy
harmonization is crucial as Zambia, Malawi and others rely on fertilizer imports through Mozambique (and through SA and Tanzania, too).
Tanzania The Fertilizer Act (2009) and Fertilizer Regulations (2010) are in place to govern
fertilizer markets. These are not updated sufficiently to deal with quality issues in the
country; labs and inspection capacity inadequate.
Active private sector in place.
Have subsidy program that is of concern due to budgetary pressures.
Soil testing services expensive and unreliable.
Suggested Actions: Need to reform import and quality control procedures as relates to new fertilizer products. Technical assistance in designing “smart” subsidy.
Nigeria Dysfunctional laws and regulations, no clear roles for monitoring and regulations;
outdated frameworks, frequent changes in management and directives at federal and
state levels; labs and inspection capacity inadequate to deal with adulteration etc.
Nigeria has taken a different route from ECOWAS’s approved fertilizer quality
regulations and set its own regulatory framework; a draft Fertilizer Bill (2014) has not
yet passed into law by the National Assembly
The Growth Enhancement Support (GES) program (2012-2015), under which an
aggressive subsidy agenda was introduced under the Agricultural Transformation
Agenda has not been renewed under the new administration. Subsidy program piloted in
some states under electronic TAP system.
Nigeria is also a producer of some fertilizers.
A number of institutions are supporting Nigeria’s fertilizer quality regulatory efforts
including: AGRA, IFDC, USAID, ECOWAS
Suggested Actions: Technical support to i) implement regulatory framework once law is passed ii) assess the performance of the GES/TAP pilot subsidy program and iii) policy
changes with ministry of agriculture.

26
Country Status of Policy Framework
Ghana Fertilizer policy in place.
The ECOWAS fertilizer regulation published in the national gazette.
Quality regulations drafted but labs and inspection capacity inadequate, adulteration of
fertilizer occuring.
A multi-organizational mission provided technical support on soil fertility in 2015
(MSU/IFPRI/IFDC/IITA/USAID-APSP).
Current subsidy faces challenges-late payment to suppliers and late delivery of subsidy
to farmers; State seeking to improve current subsidy model.
Suggested Actions: Technical support in implementation of quality regulations (WAFP,
USAID-APSP), policy dialogue and design of “smart” fertilizer subsidy.
Ethiopia Mostly government-driven fertilizer sector.
No private sector as government is involved in market and support services.
Soil maps completed, blending introduced in some regions.
Suggested Actions: Policy dialogue to encourage private investment (this is a long-term
strategy) and technical support to improve efficiency in current market system.
Burkina Faso,
Mali, Côte
d’Ivoire,
Senegal,
Benin, Liberia
No formal fertilizer policy, just some strategies to promote fertilizers.
ECOWAS regulations published in national gazette but not yet adopted.
Some legal framework consistent with ECOWAS rules drafted for enactment.
Suggested Actions: Baseline assessment of fertilizer quality including sensitization and
“domestication” of ECOWAS regulations and training of inspectors; assistance from WAFP and AGRA already in place.
Source: IFDC Fertilizer Assessment Studies 2012-2015 and other sources.
The current country fertilizer markets in SSA are characterized by outdated policies and
restrictive regulations. A consequence of this is the: (1) delays in validation and registration of
new improved fertilizer products imported into some countries due to rigidities in existing
regulations; (2) constriction of inter-country trade as neighboring countries have different quality
standards that have not been harmonized; and therefore (3) limits the set of products available
and also the extent of the market, which leads to higher fertilizer prices resulting from smaller
costly markets.
To deal with these challenges, a number of regional blocks are working towards harmonizing
policy frameworks across member states. In 2012 the Economic Community of West African
States (ECOWAS) ratified harmonized fertilizer quality regulations for its members, thus
eliminating quality restrictions to cross-border trade. However, most ECOWAS states do not
have the requisite domestic capacity in terms of labs and inspection to quickly implement the
regional regulations. ECOWAS and development partners including IFDC are working with the
relevant stakeholders in the private and public sectors to identify solutions to domestication of
the regional frameworks. There are efforts being made to develop regional frameworks for the

27
East African Community (EAC) and the Common Market for Eastern and Southern Africa
(COMESA).
4.2 Road Map in Support of African Union
This section concludes with the way forward on priority areas that require continued intervention
from AU, national governments, development partners and other stakeholders. It provides clear
implementable recommendations with specific goals, policy proposals and action plans that offer
opportunities for these stakeholders to strengthen access to fertilizers by smallholders.
Implementing such recommendations will require political commitment and continued dialogue
between technical experts and stakeholders, including policymakers.
This report has focused substantially on smallholders who make up the majority of SSA –
farmers owning less than 2 hectares (ha) of land. However, it is crucial to keep reassessing
approaches and experimenting with alternative models that support “medium” scale farmers who
may have the capacity to make the big leap and pull the economy along. Also, closing the gender
gap could increase agricultural output in the developing world and reduce the number of
undernourished people (Anríquez, 2010).
Though there has been some progress with the Abuja resolutions, it is clear that there are policies
and policy-related areas that require attention in order to improve the performance of fertilizer
markets in Africa. These areas have been detailed in this report, including some case studies that
show some progress through the adoption of good practices in policy design and implementation.
This section will zero in on four areas that need to be prioritized because of their potential to
achieve significant and sustainable increases in fertilizer use and supply in Africa. For each area
the following will be provided: an explanation for why this is a priority area; the major goals
associated with it; and the key actions required to deliver these goals. Implementing these
policies will require political commitment, expert technical and legal support, and strong
communication to stakeholders in each country’s public and private sector.
The road map is comprised of four action areas.

28
4.2.1 Policy Action Area 1: Allocate More of the National Budget to Agronomic Research and Extension
The single most important constraint to increased agricultural productivity in Africa is the
mismatch between the nutrient needs of the soils and crops and the fertilizers that are being used
by the majority of farmers. This is an area that has been overlooked by researchers and
policymakers but is probably the most important area for raising production significantly through
increasing fertilizer use efficiency and response rates. The increase in productivity and
profitability will stimulate increased demand by smallholders and at the same time raise national
agricultural production.
Well-meaning governments are pushing for increased fertilizer use across the continent with
insufficient knowledge of the soil conditions and crop nutrient requirements. This inherent
contradiction has resulted in inefficiencies in the form of the high cost of using wrong or
inappropriate fertilizers and the accompanying low response from crops. Identifying soil needs
and gaps by agro-ecological zone and/or crop and the specific fertilizer recommendations and
formulations to meet that gap and getting that information to private dealers, extension agents
and farmers are important in raising profitability. Policy Action Area 1 consists of the following
goals and actions (Table 9).

29
Goal: Stimulate farm-level demand for fertilizer S by improving crop response to fertilizer use.
Table 9. Summary of Action Area 1: Goals and Actions to Establish Sustainable Research and Extension Systems
Issue
Recommendations
(Through Country or Regional Efforts)
Short
Term
1-2 Years
Medium
Term
3-5 Years
Long
Term
>5 Years
Inadequate agronomic research and
extension programs
Develop national soil maps, recommendations by location,
soils, and crop types
X X X
Establish at least one soil testing facility X X
Establish blending facilities
Increase number of agro-dealers trained in technical and
business knowledge
X X
Increase number of trained extension officers X X
Increase number of fertilizer demonstrations and trials X X
Fertilizer use efficiency(FUE) and the
environment
Adopt an Integrated Soil Fertility Management (ISFM)
approach. This will vary by location based on soil fertility
conditions, type of crop, agro-climatic zones, availability of
organic inputs, etc. Use fertilizer technologies that have less
environmental footprint.
X X
Market Information
Establish an effective operational system providing
information about input and output market conditions to
farmers
X
Fertilizer use efficiency (FUE) depends on other complementary inputs and services; availability of information on BMPs, extension
services, organic inputs, water use efficiency (harvesting, efficient irrigation), soil structure, and improved planting materials
Other measures that should accompany efforts to improve soil fertility include addressing credit problems and land rights as well as
improving and extending rural infrastructure, marketing and distribution networks.

30
4.2.2 Policy Action Area 2: Develop and Harmonize Policy and Regulatory Frameworks
Most governments in SSA govern the fertilizer sector either through formal legislation or by
administrative decisions. However, the formal legislation is typically outdated and needs to be
modernized. For those countries that have updated legislation, it still lacks elements that are
important for encouragement of investment in the fertilizer industry and has weak enforcement
capacity particularly at the point of sale where adulteration is most likely to take place. Countries
tend to have a list of approved fertilizer products, which limits the set of fertilizer products
available to farmers, and, moreover, the list of approved products differs across countries, so the
introduction of new products into a country is delayed or can even be denied altogether.
A significant number of countries still have taxes and duties on fertilizers or on
services/materials used with fertilizers (e.g., bags) and delayed refunds on VAT. Non-tariff
barriers (road checks, weighbridges, border delays and currency restrictions) add to farm-gate
prices. Easing these impediments will contribute to incentives for the private sector to invest in
manufacturing and/or procuring for regional (as opposed to country) markets.
Countries need to develop modern, rationalized fertilizer policy and regulatory frameworks, and
these need to be harmonized at the regional level. The approach should be that taken by
ECOWAS, where the RECs develop a regional regulatory framework, which is then endorsed
and adopted by member states to suit individual needs while conforming to regional
requirements. This is more efficient than members developing individual frameworks, which
then need to be harmonized.
Policy Action Area 2 consists of the following goal, actions and targets (Table 10).

31
Goal: Develop and harmonize fertilizer policy and regulatory frameworks (including trade policy to establish regional markets).
Table 10. Area 2: Actions and Targets to Develop and Harmonize Policy and Regulatory Frameworks
Issue
Recommendations
(Through Country or Regional Efforts)
Short
Term
1-2
Years
Medium
Term
3-5 Years
Long
Term
>5
Years
Policy and
Regulatory
Framework
(Predictable, reliable
environment)
Develop, update and enact fertilizer policy and regulations at two levels:
National: Countries to develop/modernize fertilizer policy and supporting regulations and
enact them into law; countries should adopt REC harmonized policy if present.
X X
REC: Design regional regulatory architecture to which all members in RECs will adhere.
The design of these regional frameworks should proceed irrespective and independent of
national frameworks. Hire national and international experts with wide experience.
X X
Strengthen regulatory enforcement capacity:
Human X X
Analytical labs X X
Approve ingredients not the product (or blend) X X
Trade Policy:
(Establish and
promote national and
regional markets)
Reduce delays at border:
One-stop border posts (24-hr) X X
Single electronic windows (24-hr) and link revenue authority with customs X X
Eliminate NTBs:
Reduce number of road checks and weighbridges on transit cargo X X
Remove restrictions on import participation X
Ease licensing procedures for businesses and import tenders X X
No restricted entry to markets, pan-regional pricing and price controls X X
Eliminate tariffs and taxes:
Zero/eliminate all taxes and tariffs on fertilizer (e.g., ECOWAS signed 2012) X X
Remove withholding, VAT, etc. X

32
Most importantly, governments must carefully balance their roles of facilitators and actors in
market development. Governments have an important role to play in input quality control, input
and output market information systems, tax reforms and regional cooperation where markets are
too small to attract private investments. When these services are missing, the private sector cannot
grow to its potential. However, it is sometimes difficult to design or reform public policy due to
divergent interests or the political economy and therefore efforts need to be made to obtain
consensus among key players.
4.2.3 Policy Action Area 3: Allocate Budget to a Fund that Supports Innovative Fertilizer Financing Mechanisms
The government should allocate part of the CAADP budget commitment to establish a fund that
will finance activities aimed at: (1) increasing the availability of fertilizer supply all along the
value chain and (2) providing a “pull factor” that will increase demand through output market
incentives. It is important to include the private sector and donors in such financing arrangements
not only to spread the risks but also build consensus on priority areas that need support.
Policy Action Area 3 consists of the following goals, actions and targets (Table 11).
Goal: Establish a fund to support innovative finance activities for the fertilizer value chain
Table 11. Summary of Action Area 3: Goals and Actions to Establish a Fund to Support Innovative Financing Activities for the Fertilizer Value Chain
Issue
Recommendations
(Through Country or Regional Efforts)
Short
Term
1-2 Years
Medium
Term
3-5 Years
Long
Term
>5 Years
National fertilizer
financing facilities
for input suppliers
and farmers
Dedicate part of CAADP budget commitment
for agriculture to establish national fertilizer
financing facilities for input suppliers.
Learn from other models & partnerships: One
Acre Fund in Rwanda, AGRA and Standard
Bank “loan Guarantee fund” (Tanzania,
Mozambique), AFAP Agribusiness
Partnership Contracts (APCs)
X X
Operationalize the
AFFM at the AfDB
Countries to contribute at least $500,000
annually to the AFFM toward meeting the
target of $10 million
X X

33
4.2.4 Policy Action Area 4: Public-Private Dialogue and Joint Action on Fertilizer Policy
The facilitation of public-private engagement is critically important to a sound policy
environment for the fertilizer market. The significance of PPPs and private-public dialogue has
been emphasized throughout this paper and clearly stakeholder inclusiveness will be of critical
importance for the success of these actions. There should be regular and structured public-private
dialogue and consultations on policy reforms and new policy and implementation in order to
draft regulatory language and to establish a joint understanding of appropriate public and private
roles in the fertilizer sector. The outcome should be a policy environment where the role of the
public sector is transparent and is designed to strengthen private sector investment and
engagement where government involvement in the fertilizer space enhances rather than reduces
competition.
The key guiding principle should be the following: government facilitates, private sector
executes, development partners help catalyze. To make this a reality, it will be critical to
strengthen the capacity of public and private sector vis-à-vis executing their own roles and
responsibilities toward the development of competitive and sustainable fertilizer markets and
understanding and appreciating the value addition from each party. A key area that will require
attention in this regard is the design and implementation of subsidies. Subsidy programs should
be designed and managed as PPPs. They should be implemented in a manner that manages
government involvement in the fertilizer value chain so as to limit government competition with
the private sector. All private sector actors should be free to participate in the programs. This
would mean moving away from government tenders for importation and toward vouchers
redeemable through any licensed dealer to maximize competition and private sector incentives
that lower costs to the farmer.
Policy Action Area 4 consists of the following goals, actions and targets (Table 12).

34
Goal: Establish an inclusive policy environment and system of institutions that will accelerate policy responsiveness to market needs,
stimulate and increase private investment
Table 12. Summary of Action Area 4: Goals and Actions to Establish Public-Private Dialogue and Joint Action on Policy
Issue Recommendations
(Through Country or Regional Efforts)
Short
Term
1-2 Years
Medium
Term
3-5 Years
Long
Term
>5 Years
Conducive policy and
institutional environment
to stimulate and increase
private investment
Regular platform meetings, government and private sector to:
Review and clarify current and intended changes in policy,
government discuss with private sector and private sector share
concerns on impact of policies on their activities
X X X
Subsidy design and
implementation:
Limit subsidies to targeted
or “smart” subsidies that
are gender friendly
Joint government and private sector design and implementation of
the subsidy program
Apply PPP approach to subsidy: Private sector imports and
distributes the fertilizer; government regulates the sector; both
disseminate information to farmers
X X X
Subsidies to include the following:
Target resource-poor farmers who would not otherwise purchase
fertilizer including women
Use vouchers redeemable from agro-dealers
Free entry to all importers; allow for private sector
development – as part of government EXIT strategy
Conduct periodic Cost-Benefit Analysis of programs
X X X

35
It has been demonstrated throughout the world that the use of improved technologies increases
when the environment is conducive for the private sector to invest in markets. Dialogue among
farmers’ organizations, private sector associations and the public sector becomes an
indispensable element for market development in situations where there is a transition from
public to more private sector participation.
However, because of the market-distorting nature of subsidies, countries should also consider
indirect support to farmers through increased access to and affordability of soil mapping and
testing facilities. Where direct fertilizer subsidies seem indispensable (for example, to re-
establish a country’s agriculture after a war or natural disaster), they should be distributed
through a voucher or electronic system that does not distort the market. Subsidies can also be
useful tools in introducing farmers to fertilizer use in the early stages of agricultural development
and for smallholders on marginal land. Subsidies need to be sustainable by including private
sector participation, using a “smart” approach: allowing all private actors to participate, not just a
few, and promoting input subsidy packages (fertilizer, seed, extension, finance), not just fertilizer
alone. It is also necessary to take into account potential alternative uses of subsidy monies that
are cognizant of other investment options.

36
References
Ariga, J.M., and T.S. Jayne. 2009. “Private Sector Responses to Public Investments and Policy
Reforms: The Case of Fertilizer and Maize Market Development in Kenya, 2020 Vision
Initiative,” IFPRI Discussion Paper 00921.
Anríquez, G. 2010. Demystifying the Agricultural Feminization Myth and the Gender Burden.
Background Paper for the State of Agriculture Report 2010-11: Women in Agriculture:
Closing the gender gap for development, Food and Agriculture Organization of the United
Nations (FAO), Rome.
Bationo, A., and B. Egulu. 2010. “Status of the Implementation of the Abuja Declaration: From
Fertilizers to Integrated Soil Fertility Management to End Hunger in Africa.”
Camara, O.M., and J. Edeme. 2014. “Making Regional Markets Work for Smallholder Farmers
in Africa,” IFDC/AUC-DREA.
FAO. 2012. FAOSTAT Database. <http://faostat.fao.org>.
FAO. 2013. “The State of Food Insecurity in the World: The Multiple Dimensions of Food
Security,” Food and Agriculture Organization of the United Nations, Rome, 2013.
Gregory, D.I., and B. Bumb. 2006. “Factors Affecting Supply of Fertilizer in Sub-Saharan
Africa.”
Henao, J., and C.A. Baanante. 1999. “An Evaluation of Strategies to Use Indigenous and
Imported Sources of Phosphorus to Improve Soil Fertility and Land Productivity in Mali,”
IFDC, Muscle Shoals, Alabama.
Hopper, D. 1993. “Indian Agriculture and Fertilizer: An Outsider’s Observations. New Delhi,”
Keynote address to the Fertiliser Association of India (FAI) seminar on Emerging
Scenarios in Fertilizer and Agriculture: Global Dimensions.
IFDC. 2012a. Tanzania Fertilizer Assessment, in Support of the African Fertilizer and
Agribusiness Partnership, International Fertilizer Development Center, Muscle Shoals,
Alabama.
IFDC. 2012b. Kenya Fertilizer Assessment, in Support of the African Fertilizer and Agribusiness
Partnership, International Fertilizer Development Center, Muscle Shoals, Alabama.

37
IFDC. 2012c. Mozambique Fertilizer Assessment, in Support of the African Fertilizer and
Agribusiness Partnership, International Fertilizer Development Center, Muscle Shoals,
Alabama.
IFDC. 2012d. Ethiopia Fertilizer Assessment, in Support of the African Fertilizer and
Agribusiness Partnership, International Fertilizer Development Center, Muscle Shoals,
Alabama.
IFDC. 2013. Developing Sustainable Agriculture in Africa through Competitive Fertilizer
Markets; Policy and Non-Policy Options. A report presented at the Technical Convening
of 57 experts in seed and fertilizer policy in Addis, Ethiopia, December 2013
IFDC. 2014. Fertilizer Country Assessment Studies for Sub-Saharan Africa: Fertilizer Raw
Material Resource Assessment, in Support of the African Fertilizer and Agribusiness
Partnership.
IFDC. 2014. Developing Sustainable Agriculture in Africa through Competitive Fertilizer
Markets: Status since Abuja and Next Steps. A report presented at the 2014 CAADP
Anniversary, Durban
JICA. 2009. “The Research on the Cross‐Border Transport Infrastructure: Phase 3,” Japan
International Cooperation Agency.
Marenya, P.P., and C.B. Barrett. 2009. “State-Conditional Fertilizer Yield Response on Western
Kenyan Farms,” American Journal of Agricultural Economics.
United Nations Economic Commission for Africa. 2012. “Overview of Economic and Social
Conditions in Africa in 2012,” Thirty-second meeting of the Committee of Experts,
Abidjan, Côte d’Ivoire, March 21-24, 2013.
United Nations Economic Commission for Africa. 2012. “Overview of Economic and Social
Conditions in Africa in 2012,” Eighth Session of the Committee on Trade, Regional
Cooperation and Integration, Addis Ababa, Ethiopia, February 6-8, 2013.
Wanzala, M. 2011. Seventh Progress Report January 2010-December 2010: Implementation of
the Abuja Declaration on Fertilizer for an African Green Revolution, Prepared by the
Policy Alignment and Program Design Directorate, NEPAD Planning and Coordinating
Agency, June 2011.

38
Wanzala-Mlobela, M., and R. Groot. 2013. “Fertilizer Market Development in Sub-Saharan
Africa,” Paper presented to the International Fertilizer Society (IFS) at a Conference in
Windsor, United Kingdom, May 24, 2013.
Wanzala-Mlobela, M., P. Fuentes and S. Mkumbwa. 2013 “Practices and Policy Options for the
Improved Design and Implementation of Fertilizer Subsidy Programs in Sub-Saharan
Africa. A NEPAD Agency Policy Study,” A joint publication by the NEPAD Planning and
Coordinating Agency, the United Nations Food and Agriculture Organization and the
International Fertilizer Development Center.

39
www.feedthefuture.gov